feb 20, 2015 hw check – recessions in u.s. history grades are posted. let me know of any errors. i...
TRANSCRIPT

Feb 20, 2015
HW Check – Recessions in U.S. History
Grades are posted. Let me know of any errors. I submit grades next Mon.
Assembly seating: far right facing the stage, rows B-E
Tonight’s HW
1. Aggregate Supply and Demand Practice

Recessions in U.S. History
Which recession is the most severe? Why? Explain.
Similarities? Oil -- 1990-1991, 1981-1982, 1973-1975 Speculative Bubbles - 2007-2009 (housing
bubble), 2001 (dot-com bubble), The Great Depression (stock bubble)
High interest rates/Fed's monetary policy - 2001,
1990-1991, 1981-1982, The Great Depression Differences?
Stagflation - 1973-1975, 1981-1982

Unit 2:Economic Fluctuations
and Fiscal Policy
3

Aggregate Supply and Demand Model
The AS-AD model helps us understand economic fluctuations.
Aggregate = added all together; combining all prices and all quantities.
Aggregate Demand – total consumption by entire population for all goods and services
Aggregate Supply –total output (total production of all goods and services).
Real GDP
0
AD
SRAS
Price Level LRAS

Aggregate Demand

Aggregate Demand is all the goods and services (real GDP) that buyers are willing
and able to purchase at different price levels.
The demand for everything by everyone in the US.
Inverse relationship between price level and Real GDP. If the price level:•Increases (Inflation), then real GDP demanded falls.•Decreases (deflation), the real GDP demanded increases.
What is Aggregate Demand?

Aggregate Demand Curve
Price Level
Real domestic output (GDPR)
AD
7
AD is the demand by consumers, businesses, government, and foreign
countries
Changes in price
level cause a move along the
curve
= C + I + G + Xn
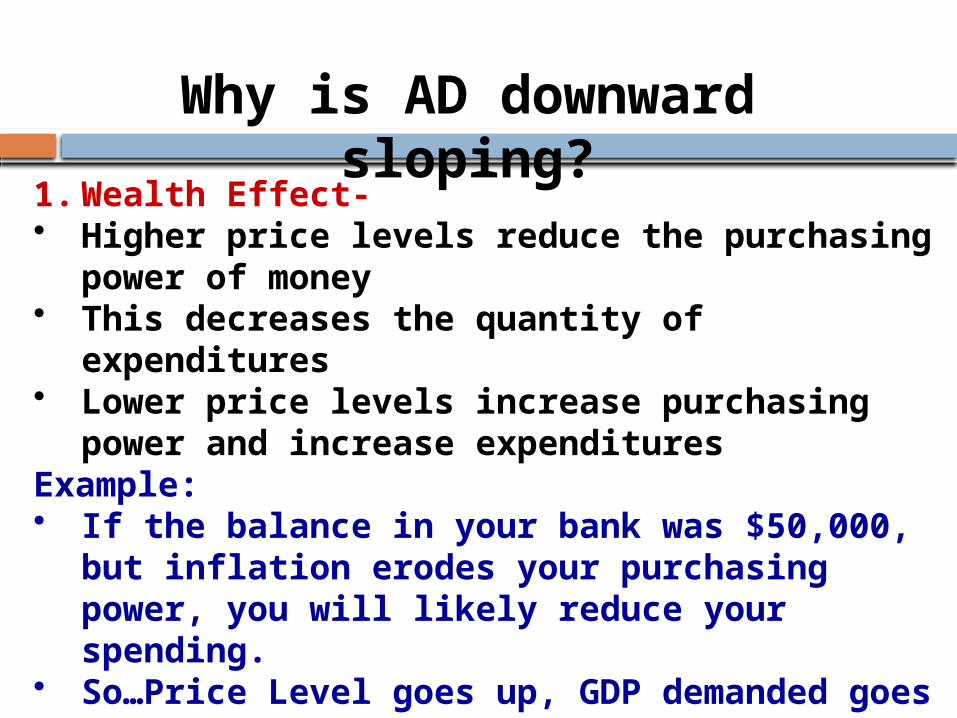
Why is AD downward sloping?
1. Wealth Effect-• Higher price levels reduce the purchasing
power of money• This decreases the quantity of
expenditures• Lower price levels increase purchasing
power and increase expendituresExample: • If the balance in your bank was $50,000,
but inflation erodes your purchasing power, you will likely reduce your spending.
• So…Price Level goes up, GDP demanded goes down.

2. Interest-Rate Effect• When the price level increases, lenders
need to charge higher interest rates to get a REAL return on their loans.
• Higher interest rates discourage consumer spending and business investment. WHY?
• Example: An increase in prices leads to an increase in the interest rate from 5% to 25%. You are less likely to take out loans to expand your business.
• Result…Price Level goes up, GDP demanded goes down (and Vice Versa).
Why is AD downward sloping?

3. Net Export Effect• When U.S. price level rises, foreign buyers
purchase fewer U.S. goods and Americans buy more foreign goods
• Exports fall and imports rise causing real GDP demanded to fall. (XN Decreases)
• Example: If prices triple in the US, Canada will no longer buy US goods causing quantity demanded of US products to fall.
• Again, Price Level goes up, GDP demanded goes down (and Vice Versa).
10
Why is AD downward sloping?
Determinants/Shifters of Aggregate Demand GDP = C + I + G + Xn

Shifts in Aggregate DemandPrice Level
Real domestic output (GDPR)
AD
12
An increase in spending will shift
AD right, and decrease in spending
shifts it left
= C + I + G + Xn
AD1
AD2

Shifters of Aggregate Demand
1. Change in Consumer Spending Consumer Wealth (Boom in the stock
market…)Consumer Expectations (People fear a
recession…)Interest Rate (Increase/decrease cost of
borrowing…)Taxes (Decrease in income taxes…)
2. Change in Investment SpendingInterest Rate (Increase/decrease cost of
borrowing…)Future Business Expectations
(Optimistic…)Business Taxes (Higher corporate taxes
means…)
13
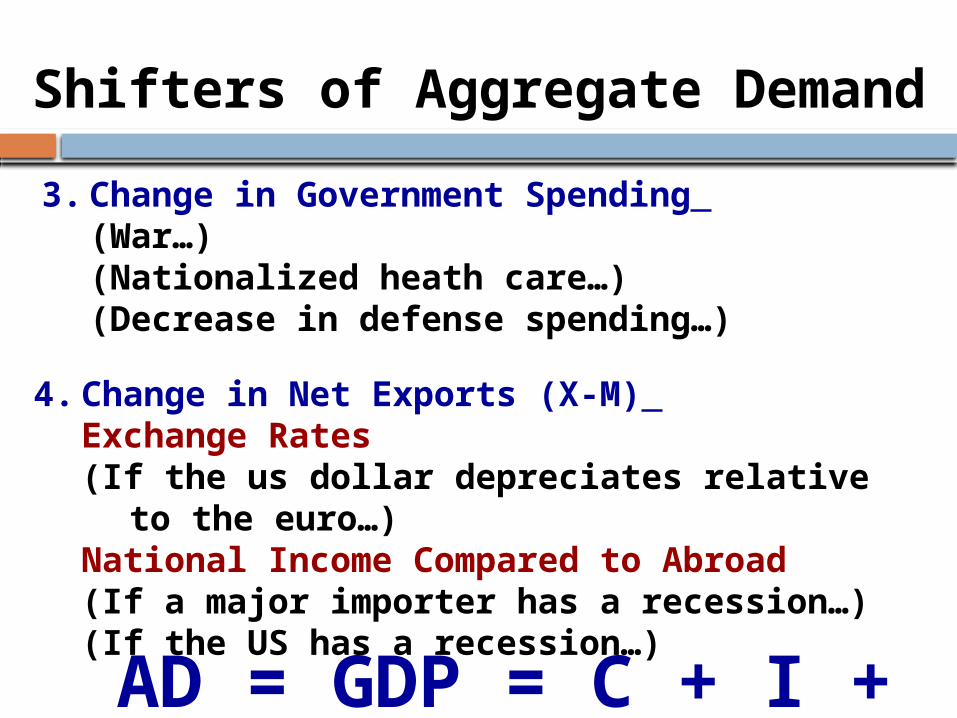
Shifters of Aggregate Demand
3. Change in Government Spending (War…)(Nationalized heath care…)(Decrease in defense spending…)
4. Change in Net Exports (X-M) Exchange Rates(If the us dollar depreciates relative to
the euro…) National Income Compared to Abroad(If a major importer has a recession…)(If the US has a recession…)
AD = GDP = C + I + G + Xn
Aggregate Demand
Price Level
Real GDP 0
AD
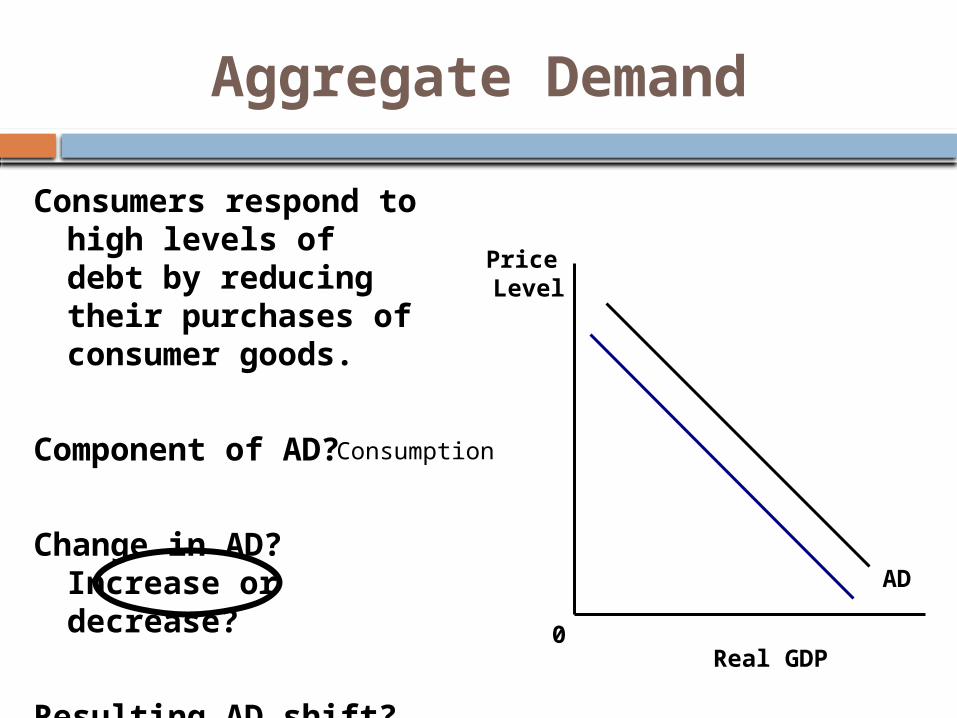
Consumers respond to high levels of debt by reducing their purchases of consumer goods.
Component of AD?
Change in AD? Increase or decrease?
Resulting AD shift?
Consumption

How does this cartoon relate to Aggregate Demand?

How does this cartoon relate to Aggregate Demand?

Aggregate Supply18

What is Aggregate Supply?
Aggregate Supply is the amount of goods and services (real GDP) that firms will produce in
an economy at different price levels. The supply for everything by all firms.
AS depends on the quantity of labor and capital and the level of technology.
Aggregate Supply differentiates between short run and long-run and has two different curves.Short-run Aggregate Supply
•Wages and Resource Prices will not increase as price levels increase.
Long-run Aggregate Supply•Wages and Resource Prices will increase as price levels increase.

Refresher…
In the short run, at least one input is fixed.
The long run is a period of time long enough for firms to change any of their inputs, thus all costs are variable.

Short-Run Aggregate Supply
In the short run, wages and resource prices will NOT increase (“sticky”) as price levels increase.
Example: • If a firm currently makes 100 units that are
sold for $1 each. The only cost is $80 of labor. How much is profit?
• Profit = $100 - $80 = $20What happens in the SHORT-RUN if price level doubles?
• Now 100 units sell for $2, TR=$200. How much is profit?
• Profit = $120
With higher profits, the firm has the incentive to increase production.

AS is upward sloping bc
In the short run, many costs that producers face are fixed. The largest fixed cost tends to be wages paid to workers. Wages are often determined by contracts and even when they are not, employers are slow to increase or decrease them in response to economic conditions. When the price level rises, the production costs do not rise by the same proportion as the rise in the price of the unit so profits tend to rise in the short run. Higher profits incentivize producers to increase output.

Aggregate Supply Curve
Price Level
Real domestic output (GDPR)
AS
23
AS is the production of all the firms in the economy

Long-Run Aggregate Supply(potential Real GDP)
In the long run, wages and resource prices WILL increase as price levels increase.
Same Example: • The firm has TR of $100 an uses $80 of labor. • Profit = $20.
What happens in the LONG-RUN if price level doubles?
• Now TR=$200• In the LONG RUN workers demand higher wages to match prices. So labor costs double to $160
• Profit = $40, but REAL profit is unchanged.If REAL profit doesn’t change
the firm has no incentive to increase output. Output is determined by the resources that
exist in the economy full employment
Long run Aggregate Supply
Price level
GDPR
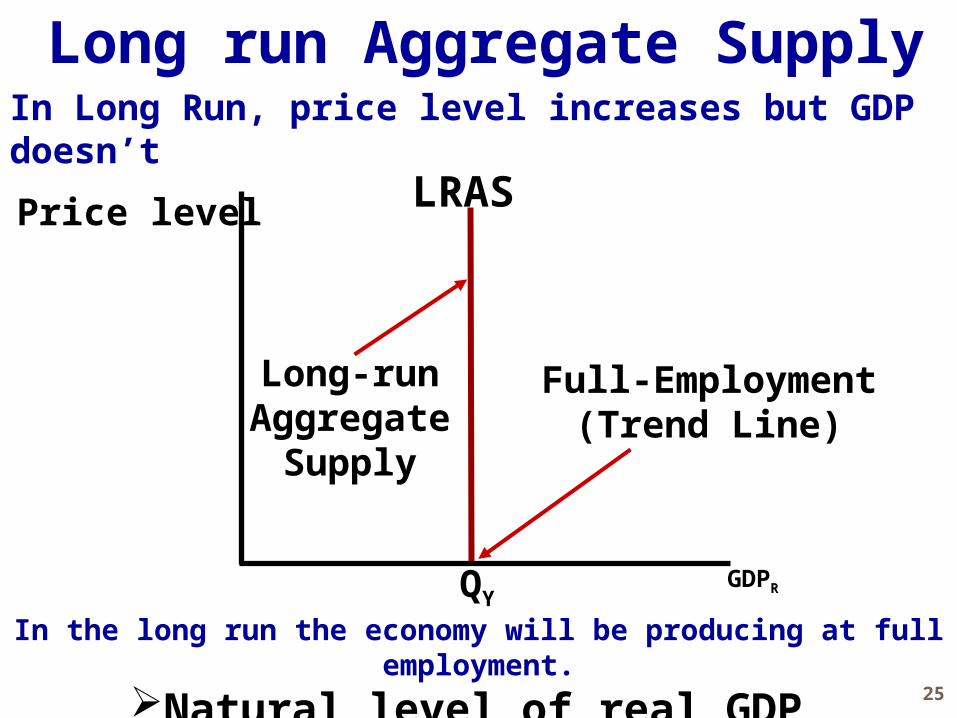
In Long Run, price level increases but GDP doesn’t
LRAS
Long-runAggregate
Supply
QY
Full-Employment(Trend Line)
In the long run the economy will be producing at full employment.
Natural level of real GDP 25

Shifts in Aggregate Supply
Price Level
Real domestic output (GDPR)
AS
26
An increase or decrease in national production can shift the curve right or left
AS1
AS2
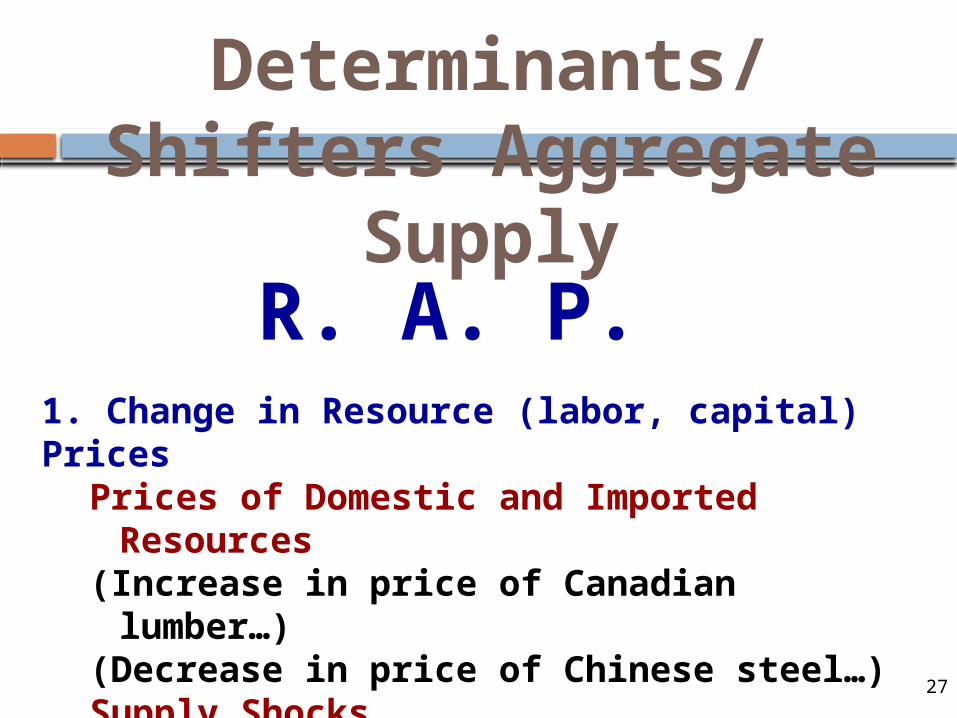
1. Change in Resource (labor, capital) Prices
Prices of Domestic and Imported Resources
(Increase in price of Canadian lumber…)(Decrease in price of Chinese steel…)Supply Shocks(Negative Supply shock…)(Positive Supply shock…)
27
Determinants/ Shifters Aggregate
SupplyR. A. P.

Shifters of Aggregate Supply
3. Change in ProductivityTechnology (Computer virus that destroy half the
computers…)Human Capital
2. Change in Actions of the Government (NOT Government Spending)
Taxes on Producers (Lower corporate taxes…)Subsidies for Domestic Producers (Lower subsidies for domestic farmers…)Government Regulations (EPA inspections required to operate a farm…)

Aggregate Supply
Price Level
Real GDP 0
AS
Unions are more effective so that wage rates increase.
Determinant of AS?
Input costs or productivity?
Change in AS? Increase or decrease?
Resulting AS curve?

What causes Business Cycles?
Partner Discussion
Using the info from the Recession in U.S History handout, answer the following:
1. What factors might cause spending (AD) in the economy to change?
2. What factors would increase or decrease production (AS)?

Putting AD and AS together to get
Equilibrium Price Level and Output
31
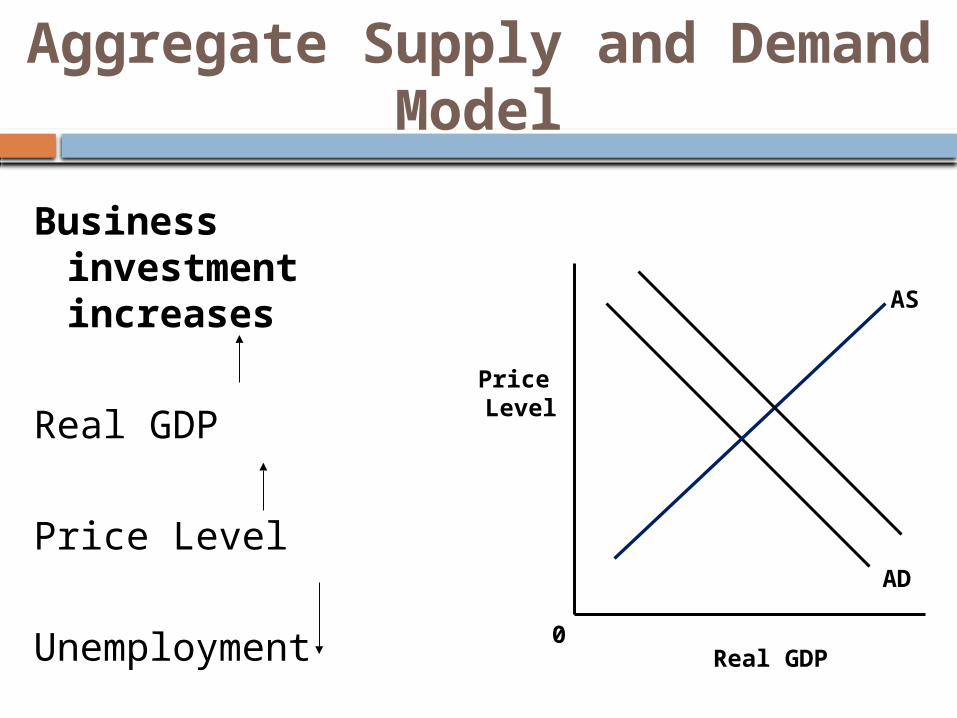
Aggregate Supply and Demand Model
Price Level
Real GDP 0
AD
AS
Business investment increases
Real GDP
Price Level
Unemployment

Shifters of Aggregate Demand
Change in Consumer Spending
Change in Investment Spending
Change in Government Spending
Net EXport Spending
AD = C + I + G + X
Shifters of Aggregate SupplyAS = R + A + P
Change in Resource Prices
Change in Actions of the Government
Change in Productivity (Investment)33

Inflationary and Recessionary Gaps
34

Price Level
35
AD
AS
Example: Assume the government increases spending. What happens to PL and Output?
GDPR
LRAS
QY
AD1
PLe
PL1
Q1
PL and Q will Increase

Price Level
36
AS
Inflationary Gap
GDPR
LRAS
QY
AD1
PL1
Q1
Output is high and unemployment is less than NRU
Actual GDP above
potential GDP

Price Level
37
AD
AS
GDPRQY
PLe
PL1
Q1
LRAS AS1
StagflationStagnate
Economy + Inflation
Example: Assume the price of oil increases drastically. What happens to PL and Output?

Price Level
38
AD
GDPRQY
PL1
Q1
LRAS AS1
Recessionary Gap Output low and unemployment is more than NRU
Actual GDP below
potential GDP

Short Run and Long Run
39
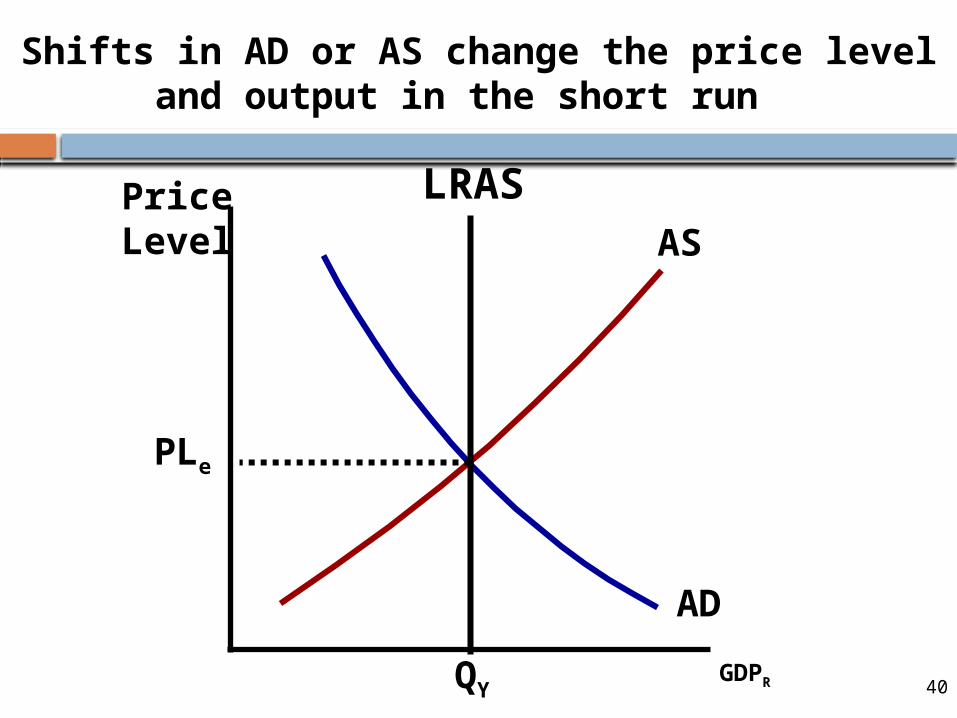
Price Level
40
AD
AS
Shifts in AD or AS change the price level and output in the short run
GDPRQY
PLe
LRAS

Price Level
41
AD
AS
Example: Assume consumers increase spending. What happens to PL and
Output?
GDPR
LRAS
QY
AD1
PLe
PL1
Q1
Price Level
42
AD
AS
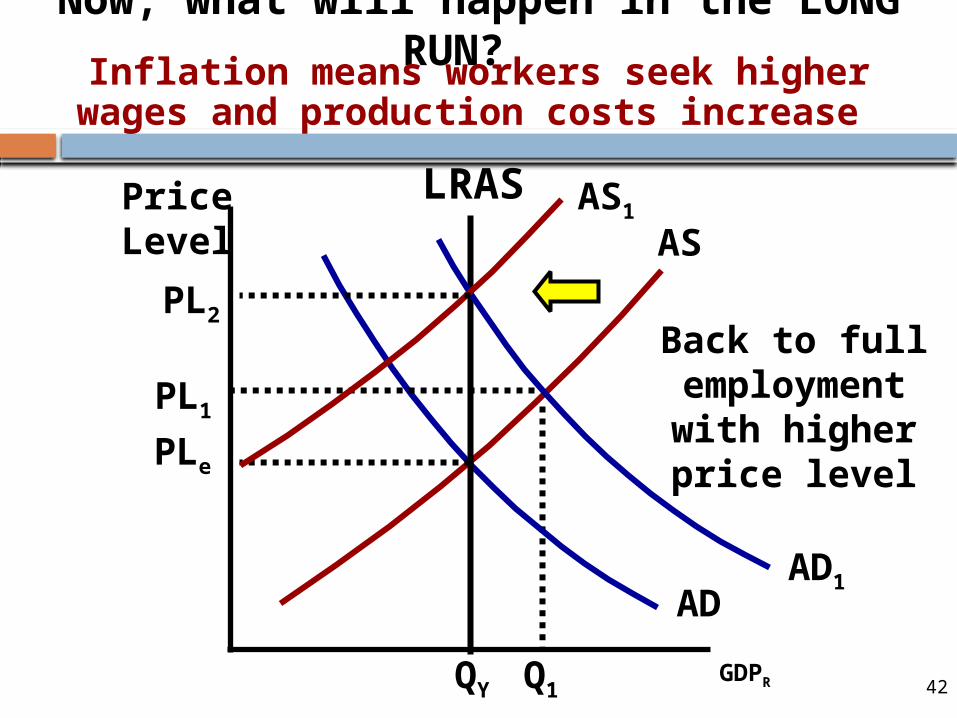
Now, what will happen in the LONG RUN?
GDPRQY
AD1
PLe
PL1
Q1
LRAS
Inflation means workers seek higher wages and production costs increase
AS1
PL2
Back to full employment with higher price level

Price Level
43
AD
AS
Example: Consumer expectations fall and consumer spending plummets. What happens to PL and Output
in the Short Run and Long Run?
GDPR
LRAS
QY
ADAD1
PL1
Q1
AS1
PL2
PLe
AS increases as workers accept lower wages and
production costs fall

Positive economic growth results from an increase in productive resources, such as labor and capital. With more resources, it is possible to produce more final goods and services, and hence, the natural level of real GDP increases. Positive economic growth is therefore represented by a shift to the right of the LAS curve. Similarly,negative economic growth decreases the natural level of real GDP, causing the LAScurve to shift to the left.

Homework
2008 Recession reading packet. You need to answer the questions at the end of each reading.
1. Taking Out a Mortgage – Prime vs. Subprime
2. Nicole Bradury, Robo-Signer Victim 3. Rise and Fall of Bubbles

Federal Funds Rates
May 17, 2013 rate: 0.15%


Discussion Qs
What should the government do to address the 2008 financial crisis?
Should the US government bail out the banking/financial/insurance industry?

Bailout Spending (as of 5/23/13) 929 Recipients Total disbursement = $606 billion Total returned = $364 billion Total revenues from dividends, interest,
and other fees = $116 billion
Total net to date = $-126 billion
http://projects.propublica.org/bailout/list

Bailout Tracker
http://money.cnn.com/news/storysupplement/economy/bailouttracker/
http://projects.propublica.org/bailout/list
http://money.cnn.com/news/storysupplement/economy/aig/index.html
Recovery Act Spending
http://www.recovery.gov/Pages/default.aspx
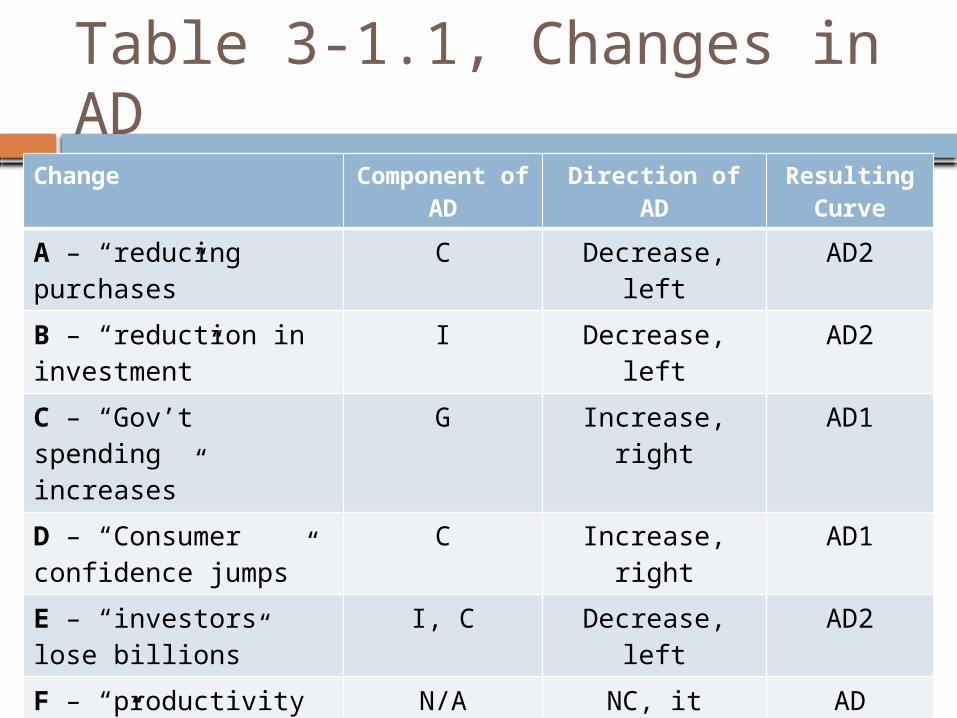
Table 3-1.1, Changes in ADChange Component
of ADDirection of
ADResulting
Curve
A – “reducing purchases”
C Decrease, left AD2
B – “reduction in investment”
I Decrease, left AD2
C – “Gov’t spending increases”
G Increase, right AD1
D – “Consumer confidence jumps”
C Increase, right AD1
E – “investors lose billions”
I, C Decrease, left AD2
F – “productivity rises”
N/A NC, it affects AS
AD
G – “trade war that reduces exports by more than it reduces imports”
Xn Decrease, left AD2

Table 3-1.1, Changes in ASChange Determinant of
ASChange in AS Resulting
Curve
A – “wage rates increase”
Input Costs Decrease, left AS1
B – “increase oil prices”
Input Costs Decrease, left AS1
C – “labor productivity increases”
Productivity Increase, right AS2
D – “gas discovery decreases energy prices”
Input Costs Increase, right AS2
E – “new efficiency” Productivity Increase, right AS2
F – “Gov’t spending increases”
N/A NC (affects AD)
AS
G – “save and invest” N/A NC AS
H - “Low birth rate decrease the LF”
Input Costs NC (until the future)
AS
I – “increased skills” Productivity Increase, right AS2

Shift in
AD/AS
Shift
Effect on Price
Level
Effect on Real
GDP
1. Business investment increases AD right increase increase
2. Gov’t increases spending AD Right
Increase Increase
3. Oil discovery causes decrease in price
AS Right
Decrease
Increase
4. Consumer spending increases AD Right
Increase Increase
5. Production costs increase AS Left Increase Decrease
6. New tech and better education increase productivity.
AS Right
Decrease
Increase
7. Consumer confidence increases AD Right
Increase Increase
8. Net exports decrease AD Left Decrease
Decrease
9. “Economic boom in Japan and Europe”
AD Right
Increase Increase
10. “reduce taxes and increase transfer payments”
AD Right
Increase Increase
11. “highest corn and wheat yields” AS Right
Decrease
Increase
12. “defense spending was increased” AD Right
Increase Increase
13. “cuts SS by 10% and fin-aid by 20%”
AD Left Decrease
Decrease
14. “Begin to buy…to replace failing models’
AD Right
Increase Increase
Changes in SRAS and AD

Price Level
Real GDP 0
AD
AS
Draw AD-AS models for each of the recessions.
Recessions in U.S. History

Causes of the 2008 Financial Crisis
2001 Recession
Fed lowers interest rates
Low interest rates make it cheaper to buy a home
INCREASES DEMAND FOR HOMES
Subprime loans made home buying more accessible to more individuals
INCREASES DEMAND FOR HOMES
1996-2006, average home prices more than
doubles
Investment banks SECURIZATION Mortgage-backed Securities (CDOs)

2008 Financial Crisis
The Crisis of Credit Visualized
http://crisisofcredit.com/
1. Why did America experience a housing boom?
2. How did investment bankers make so much money?
3. How would you assign blame (mortgage lenders, mortgage borrowers, the Federal Reserve?) for the housing market collapse and financial crisis that followed? Why?
Any questions?

NBER: Effects of the Financial Crisis and Great Recession on American Households
We find that the effects of the recession are widespread: between November 2008 and April 2010 about 39 percent of households had either been unemployed, had negative equity in their house or had been in arrears in their house payments. Reductions in spending were common especially following unemployment. On average expectations about stock market prices and housing prices are pessimistic, particularly long-run expectations. Among workers, expectations about becoming unemployed have recovered somewhat from their low point in May 2009 but still remain high. Overall the data suggest that households are not optimistic about their economic futures.
- Sept, 2010
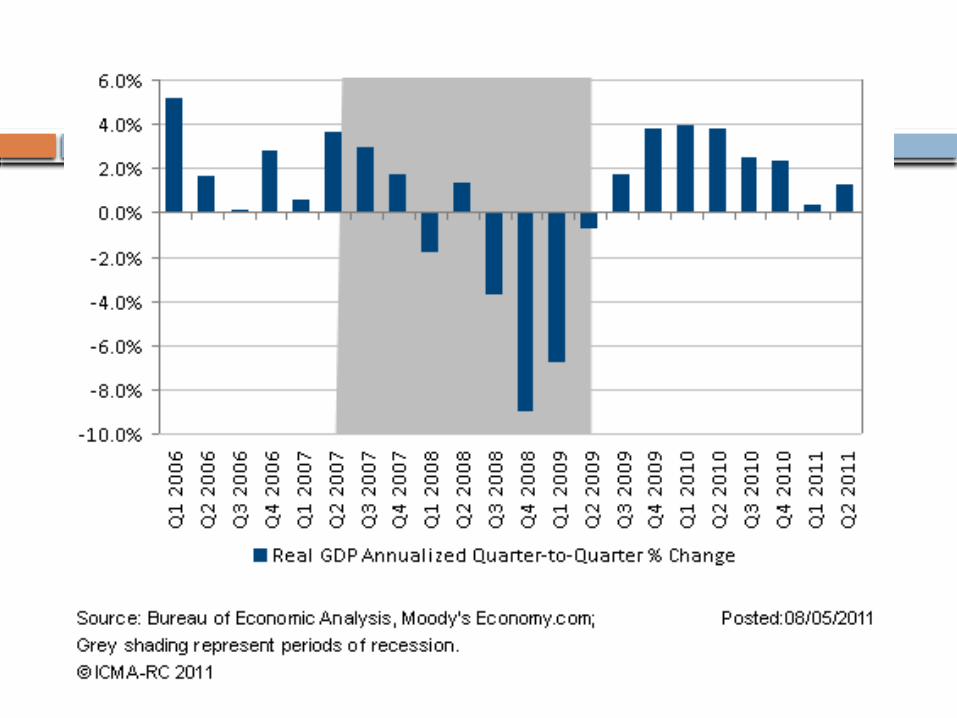
2008 Financial Crisis Dec, 2007- June 2009 Peak to trough – 18 months


https://www.youtube.com/watch?v=LH-HVcIlHGc&list=UUOBwTuxW6hWHiR0Bw9pppIQ
https://www.youtube.com/watch?v=zaYCsn3QoQM

Circular Flow and GDP Practice KEY
b. $800 million (C+I+G+X-M or
wages+dividends+interest+rent)
c. Disposable income = $670
d. Household savings = $270
e. no, gov’t had to borrow $70 million
f. $290m (borrowing) = $290 (household savings & foreign
lending)
g. $800m (goes into product market) = $800m (goes into
factor market)
h. $800m (goes into factor market) = $800 (household
income)

#2
a. Included - investment spending
b. Not included – house was built in
2001 – used and no realtor = no
income.
c. Included – gov’t spending
d. Included – exports
e. Not included – non-market
transaction
f. Included - investment
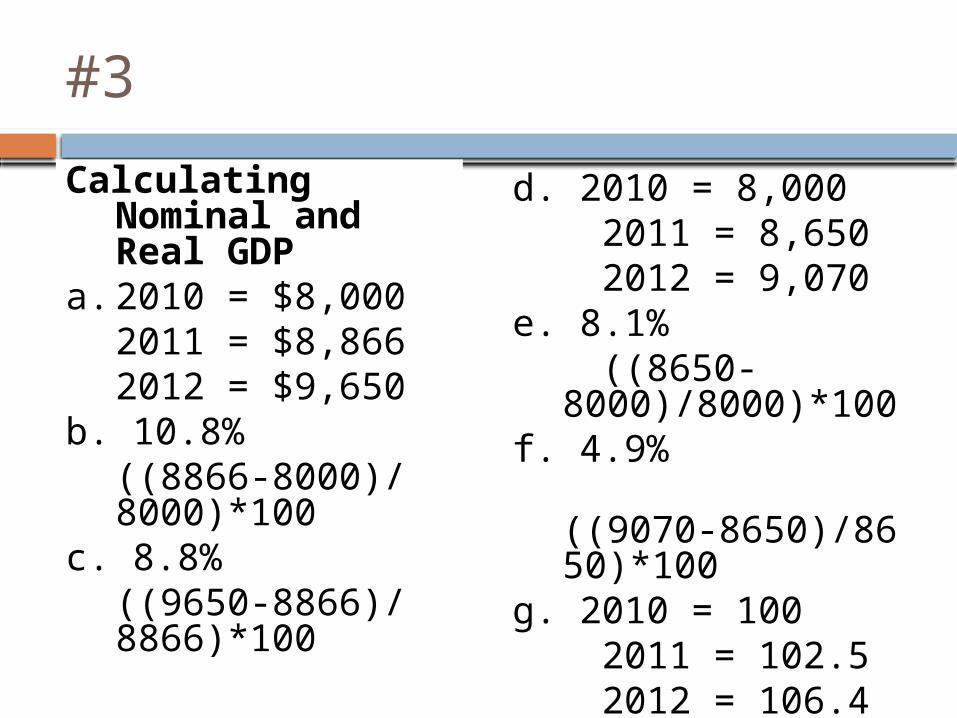
#3
Calculating Nominal and Real GDP
a. 2010 = $8,0002011 = $8,8662012 = $9,650
b. 10.8%((8866-8000)/8000)*100
c. 8.8% ((9650-8866)/8866)*100
d. 2010 = 8,000 2011 = 8,650 2012 = 9,070e. 8.1%
((8650-8000)/8000)*100
f. 4.9%
((9070-8650)/8650)*100
g. 2010 = 100 2011 = 102.5 2012 = 106.4