features the curb-cut effect -...
TRANSCRIPT
Stanford Social Innovation Review www.ssir.org
Email: [email protected]
Features
The Curb-Cut Effect By Angela Glover Blackwell
Stanford Social Innovation Review Winter 2017
Copyright 2016 by Leland Stanford Jr. University All Rights Reserved
28 Stanford Social Innovation Review / Winter 2017
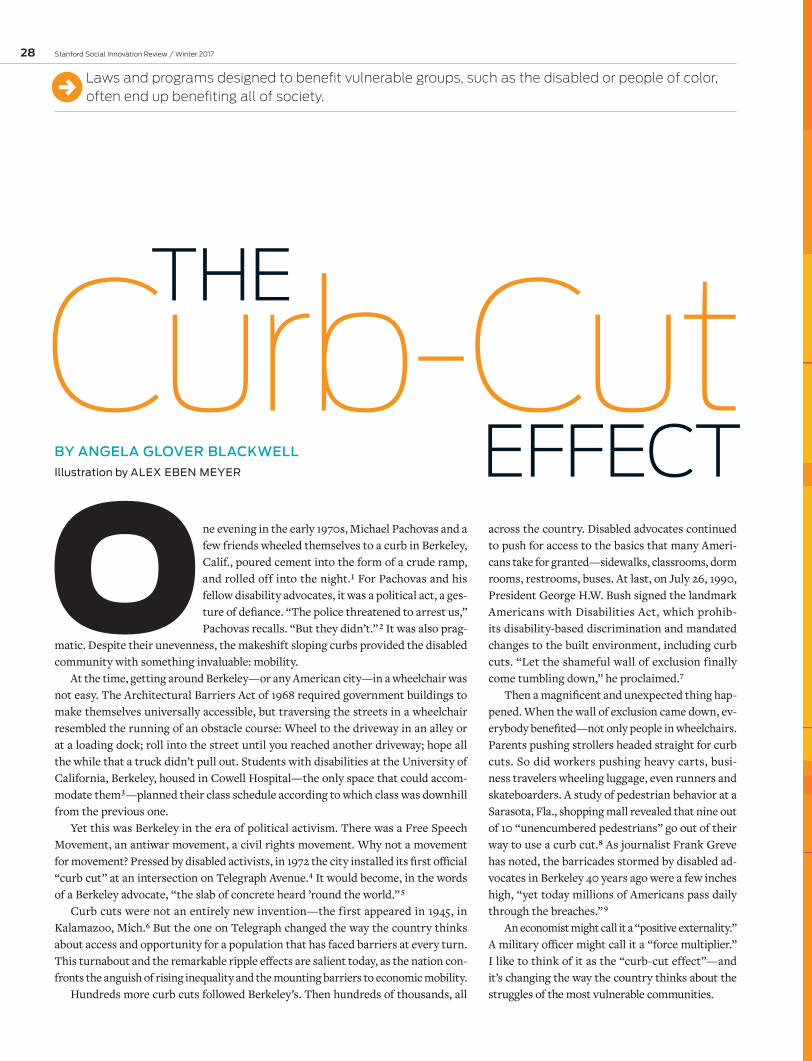
O ne evening in the early 1970s, Michael Pachovas and a few friends wheeled themselves to a curb in Berkeley, Calif., poured cement into the form of a crude ramp, and rolled off into the night.1 For Pachovas and his fellow disability advocates, it was a political act, a ges-ture of defiance. “The police threatened to arrest us,” Pachovas recalls. “But they didn’t.” 2 It was also prag-
matic. Despite their unevenness, the makeshift sloping curbs provided the disabled community with something invaluable: mobility.
At the time, getting around Berkeley—or any American city—in a wheelchair was not easy. The Architectural Barriers Act of 1968 required government buildings to make themselves universally accessible, but traversing the streets in a wheelchair resembled the running of an obstacle course: Wheel to the driveway in an alley or at a loading dock; roll into the street until you reached another driveway; hope all the while that a truck didn’t pull out. Students with disabilities at the University of California, Berkeley, housed in Cowell Hospital—the only space that could accom-modate them3—planned their class schedule according to which class was downhill from the previous one.
Yet this was Berkeley in the era of political activism. There was a Free Speech Movement, an antiwar movement, a civil rights movement. Why not a movement for movement? Pressed by disabled activists, in 1972 the city installed its first official “curb cut” at an intersection on Telegraph Avenue.4 It would become, in the words of a Berkeley advocate, “the slab of concrete heard ’round the world.” 5
Curb cuts were not an entirely new invention—the first appeared in 1945, in Kalamazoo, Mich.6 But the one on Telegraph changed the way the country thinks about access and opportunity for a population that has faced barriers at every turn. This turnabout and the remarkable ripple effects are salient today, as the nation con-fronts the anguish of rising inequality and the mounting barriers to economic mobility.
Hundreds more curb cuts followed Berkeley’s. Then hundreds of thousands, all
Laws and programs designed to benefit vulnerable groups, such as the disabled or people of color, often end up benefiting all of society.
across the country. Disabled advocates continued to push for access to the basics that many Ameri-cans take for granted—sidewalks, classrooms, dorm rooms, restrooms, buses. At last, on July 26, 1990, President George H.W. Bush signed the landmark Americans with Disabilities Act, which prohib-its disability-based discrimination and mandated changes to the built environment, including curb cuts. “Let the shameful wall of exclusion finally come tumbling down,” he proclaimed.7
Then a magnificent and unexpected thing hap-pened. When the wall of exclusion came down, ev-erybody benefited—not only people in wheelchairs. Parents pushing strollers headed straight for curb cuts. So did workers pushing heavy carts, busi-ness travelers wheeling luggage, even runners and skateboarders. A study of pedestrian behavior at a Sarasota, Fla., shopping mall revealed that nine out of 10 “unencumbered pedestrians” go out of their way to use a curb cut.8 As journalist Frank Greve has noted, the barricades stormed by disabled ad-vocates in Berkeley 40 years ago were a few inches high, “yet today millions of Americans pass daily through the breaches.” 9
An economist might call it a “positive externality.” A military officer might call it a “force multiplier.” I like to think of it as the “curb-cut effect”—and it’s changing the way the country thinks about the struggles of the most vulnerable communities.
Curb-Cut The
effecTBy AngelA glover BlAckwellIllustration by Alex eben Meyer
,

30 Stanford Social Innovation Review / Winter 2017
AngelA glover BlAckwell is the CEO of PolicyLink. She was previously a senior vice president at the Rockefeller Foundation and a partner at the public interest law firm Public Advocates. She is also the coauthor of Uncommon Common Ground: Race and America’s Future, Norton, 2010.
Access, OppOrtunity, And the new demOgrAphics
There’s an ingrained societal suspicion that intentionally supporting one group hurts another. That equity is a zero sum game. In fact, when the nation targets support where it is needed most—when we create the circumstances that allow those who have been left behind to participate and contribute fully—everyone wins. The corollary is also true: When we ignore the challenges faced by the most vulner-able among us, those challenges, magnified many times over, become a drag on economic growth, prosperity, and national well-being.
This has become painfully evident as inequality has reached toxic levels in the United States. Since 1979, the income of workers in the top 10 percent has grown nearly 15 percent.10 For workers in the bot-tom 10 percent, incomes have fallen more than 11 percent.11 The top 25 hedge fund managers earn more than all kindergarten teachers in America put together.12 Only 9 out of 100 children born to parents in the bottom fifth of the income distribution can expect to rise above their circumstances, the cornerstone of the American Dream.13
A wave of recent publicity has focused attention on the toll that these trends are taking on white America. In a paper published in November 2015 in the Proceedings of the National Academy of Sciences, Princeton University economists Anne Case and Angus Deaton revealed that the death rate for middle-aged whites without a col-lege education jumped more than 20 percent from 1999 to 2013,14 a staggering increase attributable largely to drug- and alcohol-related deaths and suicides. Case and Deaton see the spikes in addiction and suicide as a response to financial insecurity and economic despair. They write: “After the productivity slowdown in the early 1970s, and with widening income inequality, many in the baby boom gen-eration are the first to find, in midlife, that they will not be better off than were their parents.”
While commentators debate the extent to which economic shock is driving white mortality, one thing is indisputable: Eco-nomic distress is deepest and the inequities are widest in commu-nities of color. In 149 of the country’s 150 largest metro areas, the percentage of college-educated whites exceeds the percentage of African-Americans and Latinos with college degrees.15 The national unemployment rates for blacks and Latinos are 9.5 percent and 6.5 percent, respectively, compared with 4.5 percent for whites.16 One in four black and Latino Americans live in poverty, more than twice the rate for whites.17 People of color lag well behind whites on just about every measure of well-being, including health, homeowner-ship, wealth, and (Case and Deaton notwithstanding) longevity.
The point is not to argue about who is suffering more, but to identify the best solutions to remedy these inequities. And here, another number should command attention: 2044. That is the year in which people of color are expected to become a majority of the US population.18 The nation—80 percent white in 1980, 63 percent white today19—is already well on its way. Since 2012, the majority of babies born in the United States have been children of color.20 By the end of the decade, the majority of Americans under age 18 will be people of color.21
These demographic shifts matter to every American. Not because there is something frightening about a nation where whites are no longer the majority. Rather, it is because the costs of society failing people of color are climbing as the population grows—and because the benefits of strategies that expand opportunity for people of
color would extend to all. Knock down walls of exclusion and build accessible pathways to success, and everyone gains.
The curb-cut effect applies to America’s new demographic pro-file in two important ways. First, curb-cut thinking is animated by the idea of equity. This should not be confused with the formal legal equality conferred by landmark laws such as the Civil Rights Act. Equality gives everyone the right to ride on the bus. Equity ensures that there are curb cuts so people in wheelchairs can get to the bus stop and lifts so they can get on the bus, and ensures that there are bus lines where people need them so they can get to wherever they need to go. Equity means promoting just and fair inclusion through-out society and creating the conditions in which everyone can par-ticipate, prosper, and reach his or her full potential.
Second, the curb-cut effect illustrates the outsize benefits that accrue to everyone from policies and investments designed to achieve equity. The country must choose: Will we make these investments? Will we make sure that everyone has access to the essentials for liv-ing productive lives—things like jobs and reliable transportation? Or will we neglect entire communities and waste the talents and potential of tens of millions of people?
There’s really no choice. Continuing to write off poor people and people of color is not an option. Not when the American Dream is nearly unattainable for all low-income people, regardless of their eth-nicity. Not when age-old health disparities between whites and people of color are narrowing because whites are sicker than they used to be and more are dying younger. Not when popular fury is growing over an economic system in which a single American family (the Waltons) has more wealth than 41 percent of Americans combined.22
Policymakers tend to overlook the ways in which focusing on one group might help all groups and strengthen the whole nation. Cut into the curb, and we create a path forward for everyone.
curb-cut effects, frOm streets tO schOOls tO the sky
Once you know what you’re looking for, the curb-cut effect is on display all around. It happened when seat belt legislation, adopted initially to protect young children, led 49 states to adopt seat belt laws that have saved an estimated 317,000 lives—children and adults—since 1975.23 It happened when affirmative action was created to open the doors of higher education to black people—and ended up emboldening vast numbers of white women, and other racial and ethnic groups, to push for greater access as well. It happened when fed-up flight attendants spearheaded a national fight to end smok-ing on planes, setting in motion a decades-long public-health cam-paign that has largely banished smoking from public spaces and cut tobacco consumption in half since the 1960s.24
And it happened, spectacularly, with another improvement to America’s streets: bike lanes. After years of enduring injuries and fatalities, beleaguered bicyclists—backed by environmental advo-cates—have pressured a number of cities to install protected bike
Stanford Social Innovation Review / Winter 2017 31
Claremont McKenna College, Marlboro College, and the State Uni-versity of New York at Binghamton. In 1944, the United States was home to 58 two-year community colleges. By 1947, there were 358.40
The results of the bill, however, could have been even better. The GI Bill included black veterans in the deal but let local governments decide how to allocate the money. All too predictably, black GIs received much, much less generous subsidies.41 The bill that opened doors of opportunity to so many people who had previously been left out effectively barred entry for too many others.
Despite its shortcomings, the GI Bill demonstrates the trans-formative effects of smart, targeted investments. The beneficiaries did not just rejoin society; they remade it. The second pillar of the GI Bill, low-interest home loans, boosted homeownership from 44 percent before the war to 60 percent by the mid-1950s.42 (Here, again, black GIs were largely excluded.) This, in turn, spurred the tremendous growth of the suburbs and buoyed an already-booming economy. All told, historians estimate that for every $1 invested in returning World War II veterans, the country recouped $8.43 But the true benefits are incalculable.
creAting A prOsperOus future
Many years ago, trying to get across Los Angeles to a job interview in Watts, I budgeted an hour and a half to take the five buses from my house to my destination. Two and a half hours later—well af-ter my interview would have ended—I got off bus number four and turned around, defeated.
Frustration like this—to say nothing of lost opportunity— reflects a reality still common to people of color living in low-income neighborhoods. Connections to jobs, schools, hospitals, and grocery stores, and often to each other, are few and far between. One in five African-Americans—and 12 percent of Latinos—live in households
without access to a car.44 Two-thirds of the roads on Native American reservations are un-paved.45 Half of the people who use public transit are people of color, yet far too many cannot get where they need to go.46
In Chicago, four out of five residents cannot reach their jobs in 90 minutes or less using public transit.47
“Transportation touches every aspect of where we live, work, play, and go to school, as well as the physical and natural world,” writes author and scholar Robert Bullard, often described as the father of the environmental justice movement.48 “Transportation also plays a pivotal role in shaping human interaction, economic mobility, and sustainability.”
If the United States can get equitable infrastructure right, the benefits will ripple far and wide. Transportation investments, par-ticularly public transit projects, create many jobs and contracting opportunities building and maintaining infrastructure. With the right policies in place, those investments can do the double work of building the physical infrastructure that connects residents of underserved neighborhoods to economic opportunities while also delivering jobs and business opportunities to those residents.
Over the next five years, the country could generate more than one million transit-related jobs if the 20 largest cities in America merely
lanes. As of 2014, New York City had added roughly 30 miles of these lanes.25 My hometown of Oakland is installing a similar amount.26
The verdict? In city after city, despite a “bike-lash” of critics who warn of more congestion and less parking, we’ve seen that—like a bicycle wheel—what goes around comes around. From 2000 to 2013, the risk of serious injury dropped 75 percent for New York City cyclists 27—and pedestrians, a much larger group and not the intended target of the bike lanes, are 40 percent less likely to be in-jured.28 In a 2011 survey of Chicago drivers, half believed that they noticed improved driving behavior on a street with bike lanes.29
In addition to creating safer and saner streets, bike lanes add tremendous economic value to a neighborhood. One stretch of Ninth Avenue in Manhattan saw retail sales rise nearly 50 percent after bike paths were installed, compared with a 3 percent rise borough-wide.30 Rents along the Times Square bike paths grew 71 percent in 2010, the largest increase in the city, as people flocked to pedestrian- and bike-friendly neighborhoods.31 A single block in Indianapolis saw the value of its property jump nearly 150 percent after adding bike lanes.32
Then there are the benefits to public health and the environment. A study of the San Francisco Bay Area found that a slight increase in walking and biking each day can reduce the prevalence of diabetes and cardiovascular disease by 14 percent,33 while decreasing green-house gas emissions by 14 percent as well.34 If just 5 percent of New York City commuters began biking to work, the CO2 emissions saved would be equal to planting a forest 1.3 times the size of Manhattan.35
the mAking Of A middle clAss
The most illuminating example of the curb-cut effect is the Service-man’s Readjustment Act of 1944, more commonly known as the GI Bill. It’s no overstatement to say that the legislation created the white
American middle class. The sponsors of the bill, initially scrawled by an American Legion lobbyist on a piece of hotel stationery, didn’t expect to do more than provide job training to some World War II veterans looking to reintegrate into society.36 Supporters of the legislation predicted that just a few hundred thousand of the 16 million returning veterans would use it to go to college. Even that was too much for educators like Robert Hutchins, the president of the University of Chicago, who direfully predicted that campuses would be turned into “hobo jungles.” 37
To the surprise of nearly everyone, nearly eight million veterans went to college on the GI bill,38 and contrary to Hutchins’ warning, they earned better grades, on average, than their civilian classmates. Journalist Edward Humes has catalogued their ranks to include 14 future Nobel Prize winners, three Supreme Court justices, three presidents, a dozen senators, 22,000 dentists, 67,000 doctors, 91,000 scientists, 238,000 teachers, and 450,000 engineers, along with nu-merous lawyers, nurses, businessmen, artists, actors, writers, and pilots.39 New campuses sprang up to handle the influx, including
The moST IllumInaTIng example of The cuRb-cuT effecT IS ... The gI bIll. IT'S no oveRSTaTemenT To Say ThaT The legISlaTIon cReaTed The WhITe ameRIcan mIddle claSS.
32
shifted half of their transportation budget from funding highways to funding transit.49 No new spending, just shifting our priorities.
Businesses would benefit, too. A Harvard Business School sur-vey of business leaders’ priorities found that more and better pub-lic transportation was at the top of their wish list,50 and it’s easy to see why. Better transportation leads to less absenteeism, and it gives businesses a larger pool of candidates to choose from to fill the available jobs.51 In a 2013 study, urban planning scholar Daniel Chatman of the University of California, Berkeley, and Robert Noland of Rutgers University calculated that when metro areas added even just a few bus or rail seats—four for every 1,000 residents—this increased the number of employees working in the central city by 320 per square mile, nearly a 20 percent increase on average.52 Similarly, the researchers found that expanding public transit 10 percent boosted the city’s total economic output between 1 and 2 percent. Chatman and Noland estimate that the “hidden economic value” of public transit was $45 million in the average metro area, with a range between $1.5 million and nearly $2 billion depending on the size of the region.
The ripples don’t end there. When people have access to public transit, they can more easily attend good schools and take advantage of higher education, which creates a more prepared workforce for the region. They can more readily get to health clinics and hospitals, allowing for greater preventive care and lower health care costs. Evidence also suggests that public transit leads to a decrease in crime. Simply put, better transit means better access to opportunity. Indeed, the pioneering Stanford University economist Raj Chetty has identified the top 10 cities for upward economic mobility. Five of them—New York, San Francisco, Boston, Washington, D.C., and Seattle—are also in the top 10 for physical mobility.53
To maximize benefits like these, metropolitan regions around the country are rethinking their transportation strategies and in-vestments. The neighboring cities of Minneapolis and St. Paul offer a glimpse of how this is playing out. People of color—more than a quarter of whom are poor—have long been concentrated in disin-vested neighborhoods and cut off from opportunity.54 Initial plans for a new Green Line light-rail corridor overlooked these neigh-borhoods—reminding me of Bullard’s observation, “Follow the transportation dollars and one can tell who is important and who is not.” 55 But local activists worked with the federal government, city government, and others to rewrite the old rules.56 Now, when the city evaluates the viability of a transportation project, plan-ners assign points based on whether the proposed road or rail will enhance racial equity.57 In other words, equity—not just safety or usage statistics, the traditional metrics for transportation consid-erations—has become central to transportation decisions.
The Green Line is a model of inclusive growth. People of color have made up nearly a fifth of the work hours on the project.58 Women- and minority-owned small businesses have earned nearly 20 percent of construction contracts, worth $115 million.59 The light rail now stops in previously neglected neighborhoods, connecting those residents to the more robust job markets in downtown Minneapolis and St. Paul.
The nation can apply curb-cut thinking far beyond transportation infrastructure, to strengthen the entire economy. The misshapen way in which the economy has grown is a problem not only for those at the bottom. As everyone from the OECD 60 to the International
Monetary Fund 61 has concluded, widening inequality leads to de-clining economic growth. When a country fails to include a large number of people in its economy—when it restricts the circle of op-portunity—the economy is weakened and the whole nation suffers.
There’s no mystery about how to decrease inequality and in-crease economic growth. The answer is not easy credit or subprime mortgages or the privatization and parceling off of the social safety net. The antidote to inequality is equity. That means growing good jobs and improving the pay and quality of low-wage jobs. It means building human capabilities by upgrading the education and skills of today’s workforce, and tomorrow’s. It means eliminating barri-ers to economic inclusion and civic participation—for example, by revamping a criminal justice system that has trapped seven million people, the vast majority of them black and brown.62 And it means expanding opportunity by investing in the most distressed places in America, and in the people who live there.
If the chasm between the gleaming skyscrapers of Manhattan and the barrios of East Los Angeles is holding the entire country back and limiting American economic potential, just think what closing that chasm with well-chosen policies would do. In 2012, blacks, Latinos, and Asian businesses grew more than three times faster than white-owned businesses 63—so imagine the entrepreneurial energy waiting to be unleashed if the country strengthens programs to boost business owners of color. Imagine the impact of connecting poor people and young people of color to high-growth industries like technology. The term “equity” in a corporate context is currently defined as a mere tally of assets and liabilities. But with racially diverse companies 35 percent more likely to outperform their peers,64 imagine the rewards to be reaped if equity came to mean so much more.
Shrinking the racial gap in the US economy—simply employing and paying workers of color at the same rates as white workers—would boost the total GDP of America’s 150 largest metro areas by nearly a quarter.65 New York City metro would add 31 percent—$409 billion—to its GDP. Miami’s GDP would grow 41 percent, adding nearly $113 billion. In Brownsville, Texas, GDP stands to grow 131 percent. In total, building a racially equitable economy would add $2.1 trillion to America’s annual GDP.
The curb-cut effect underscores the foundational belief that we are one nation, that we rise or fall together. Without equity, there can be neither progress nor prosperity. Despite years of politicians insisting otherwise, the laws of economic gravity have always run in reverse. Opportunity doesn’t trickle down; it cascades out and up.
The initiatives described here are not handouts or giveaways; they are investments in the broader well-being of society. They are highly efficient. They are not a sweeping takeover by the federal govern-ment. In fact, many—if not most—rely on policies implemented at the state and local levels.
This is not a liberal or a conservative issue. It is not strictly a ques-tion of morality or efficiency. All of us—Democrats and Republicans, businesses and nonprofit organizations, city dwellers and suburban-ites alike—have an interest in developing targeted, achievable reforms that yield real results and make noticeable differences in the lives of our most vulnerable. The inescapable conclusion is that it is right and smart to let hard-working Americans see more of the benefits of their hard work. It is right and smart to give more Americans, indeed all Americans, the chance to contribute to this country. It is right and
Stanford Social Innovation Review / Winter 2017
Stanford Social Innovation Review / Winter 2017 33
smart to build a future in which every American, regardless of skin color or economic quintile, can participate and prosper. What is called for is nothing less than a return to the notion of a common good.
Half a century ago, Dr. Martin Luther King Jr. prophetically wrote from a Birmingham, Ala., jail cell, “We are caught in an inescapable network of mutuality, tied in a single garment of destiny. Whatever affects one directly, affects all indirectly.” 66 Outside that building today, a plaque commemorates its most famous inmate. Along the sidewalk, at regular intervals, are curb cuts. n
notes
31 “The Re-Design of Broadway Moving All Modes,” New York City Department of Transportation, July 2010.
32 Jessica Majors and Sue Burow, “Assessment of the Impact of the Indianapolis Cul-tural Trail: A Legacy of Gene and Marilyn Glick,” Indiana University Public Policy Institute, March 2015.
33 Neil Maizlish, James Woodcock, Sean Co, Bart Ostro et al., “Health Cobenefits and Transportation-Related Reductions in Greenhouse Gas Emissions in the San Fran-cisco Bay Area,” American Journal of Public Health, vol. 103, no. 4, 2013, pp. 703-709.
34 Ibid.
35 “Environmental Statistics,” Statistics Library, People for Bikes.
36 Meredith Hindley, “How the GI Bill Became Law in Spite of Some Veterans’ Groups,” Humanities, vol. 35, no. 4, 2014.
37 Thalia Assuras, “How the GI Bill Changed America,” CBS News, June 22, 2008.
38 Claudio Sanchez, “How the Cost of College Went From Affordable to Sky-High,” National Public Radio, March 18, 2014.
39 Edward Humes, Over Here: How the GI Bill Transformed the American Dream, San Diego, Harcourt, 2006.
40 William Celis III, “50 Years Later, the Value of the G.I. Bill Is Questioned,” The New York Times, June 22, 1994.
41 Chuck Leddy, “A critical look at the GI Bill’s impact,” The Boston Globe, September 10, 2009.
42 Ibid.
43 Jared Lyon, “The GI Bill’s Impact on the Past, Present and Future,” Institute for Veterans and Military Families, Syracuse University, June 21, 2013.
44 Elaine Murakami and Liang Long, “Vehicle Availability and Mode to Work by Race and Hispanic Origin,” Census Transportation Planning Products, US Department of Transportation, October 20, 2015.
45 Demographics, About Tribes, National Congress of American Indians.
46 Mike Maciag, “Public Transportation’s Demographic Divide, Governing, February 24, 2014.
47 Adie Tomer, Elizabeth Kneebone, Robert Puentes, and Alan Berube, “Missed Oppor-tunity: Transit and Jobs in Metropolitan America,” Metropolitan Policy Program, Brookings Institution, May 2011.
48 Robert D. Bullard, “Addressing Urban Transportation Equity in the United States,” Fordham Urban Law Journal, vol. 31, no. 5, 2003, pp. 1183-1209.
49 Todd Swanstrom, Will Winter, and Laura Wiedlocher, “More Transit Equals More Jobs,” Transportation Equity Network.
50 Michael E. Porter and Jan W. Rivkin, “An Economy Doing Half Its Job,” Harvard Business School Survey on U.S. Competitiveness, September 2014.
51 Eric Jaffe, “Public Transit Is Worth Way More to a City Than You Might Think,” CityLab, August 14, 2013.
52 Daniel G. Chatman and Robert B. Noland, “Transit Service, Physical Agglomeration and Productivity in US Metropolitan Areas,” Urban Studies, vol. 51, no. 5, 2014, pp. 917-937.
53 “2016 City and Neighborhood Rating,” Walk Score.
54 “Choice, Place and Opportunity: An Equity Assessment of the Twin Cities Region,” Metropolitan Council, 2014.
55 Robert D. Bullard, Growing Smarter: Achieving Livable Communities, Environmental Justice, and Regional Equity, Cambridge, Mass., The MIT Press, 2007.
56 John McCarron, “Building Equity By the Tracks,” Next City, August 30, 2013.
57 Rachel Dovey, “Transportation Funding Change Aims for Equality in Twin Cities,” Next City, September 24, 2014.
58 “Central Corridor Green Line DBE and Workforce Story,” Metropolitan Council, June 2014.
59 “Council Meets Contracting Goals for Green Line Construction,” Metropolitan Council, July 17, 2014.
60 “Inequality hurts economic growth, finds OECD research,” OECD, September 12, 2014.
61 Era Dabla-Norris, Kalpana Kochhar, Nujin Suphaphiphat, Frantisek Ricka, and Evridiki Tsounta, “Causes and Consequences of Income Inequality: A Global Perspective,” International Monetary Fund, June 15, 2015.
62 Lauren E. Glaze, Danielle Kaeble, “Correctional Populations in the United States, 2013,” Bureau of Justice Statistics, US Department of Justice, December 19, 2014.
63 Vanessa Cardenas and Sarah Treuhaft, eds., All-In Nation: An America That Works for All, Center for American Progress and PolicyLink, 2013.
64 Vivian Hunt, Dennis Layton, and Sara Prince, “Why Diversity Matters,” McKinsey Insights, January 2015.
65 Sarah Treuhaft, Justin Scoggins, and Jennifer Tran, “The Equity Solution: Racial Inclusion Is Key to Growing a Strong Economy,” PolicyLink and USC Program for Environmental and Regional Equity, October 22, 2014.
66 Martin Luther King Jr., “Letter from a Birmingham Jail [King, Jr.],” African Studies Center, University of Pennsylvania, April 16, 1963.
1 “Builders and Sustainers of the Independent Living Movement in Berkeley: Volume IV,” Disability Rights and Independent Living Movement Oral History Series, University of California.
2 Frank Greve, “Curb ramps liberate Americans with disabilities—and everyone else,” McClatchy Newspapers, January 31, 2007.
3 Ibid.
4 Ibid.
5 Steven E. Brown, “The Curb Ramps of Kalamazoo: Discovering Our Unrecorded History,” Disability Studies Quarterly, vol. 13, no. 3, 1999, pp. 203-205.
6 Ibid.
7 “Remarks of President George Bush at the Signing of the Americans with Disabilities Act,” EEOC History: 35th Anniversary: 1965-2000, US Equal Employment Opportu-nity Commission.
8 Greve, “Curb Ramps.”
9 Ibid.
10 “Data Summaries,” National Equity Atlas, PolicyLink and the USC Program for Environmental and Regional Equity.
11 Ibid.
12 Phillip Bump, “The 25 top hedge fund managers earn more than all kindergarten teachers combined,” The Washington Post, May 10, 2016.
13 Raj Chetty, Nathaniel Hendren, Patrick Kline, Emmanuel Saez, and Nicholas Turner, “Is the United States Still a Land of Opportunity?” American Economic Review: Papers & Proceedings, vol. 104, no. 5, 2014, pp. 141-147.
14 Anne Case and Angus Deaton, “Rising morbidity and mortality in midlife among white non-Hispanic Americans in the 21st century,” Proceedings of the National Acad-emy of Sciences of the United States of America, vol. 112, no. 49, 2015, pp. 15078-15083.
15 Ronald Brownstein and Janie Boschma, “Education Gaps Pose Looming Crisis for U.S. Economy,” National Journal, May 20, 2015.
16 “Labor Force Statistics from the Current Population Survey,” Bureau of Labor Statistics, US Department of Labor.
17 “Poverty Rate by Race/Ethnicity,” State Health Facts, The Henry J. Kaiser Family Foundation.
18 Sandra L. Colby and Jennifer M. Ortman, “Projections of the Size and Composition of the U.S. Population: 2014 to 2060,” US Census Bureau, March 2015.
19 Frank Bass, “White Share of U.S. Population Drops to Historic Low,” Bloomberg News, June 12, 2013.
20 “Most Children Younger Than Age 1 are Minorities,” U.S. Census Bureau, May 17, 2012.
21 Colby and Ortman, “Projections of the Size.”
22 Josh Bivens, “Inequality, exhibit A: Walmart and the wealth of American families,” Economic Policy Institute, July 17, 2012.
23 “Policy Impact: Seat Belts,” Centers for Disease Control and Prevention, January 2011.
24 Poncie Rutsch, “Will Vaping Reignite the Battle Over Smoking On Airplanes?” National Public Radio, February 24, 2015. “Trends in Current Cigarette Smoking Among High School Students and Adults, United States, 1965-2014,” Centers for Disease Control and Prevention.
25 “Protected Bicycle Lanes in NYC,” New York City Department of Transportation, September 2014.
26 Will Kane, “Oakland racing to meet demand for bike lanes,” San Francisco Chronicle, April 27, 2014.
27 “Protected Bicycle Lanes in NYC.”
28 “Sustainable Streets: 2013 and Beyond,” New York City Department of Transporta-tion, 2013.
29 “Initial Findings: Kinzie Street Protected Bike Lane,” Chicago Department of Transportation, September 21, 2011.
30 “The Economic Benefits of Sustainable Streets,” New York City Department of Transportation.