feasibility study of air catcher for natural …eprints.uthm.edu.my/7525/1/ali_raheem_sarhan.pdf ·...
TRANSCRIPT

FEASIBILITY STUDY OF AIR CATCHER FOR NATURAL VENTILATION
APPLICATION
ALI RAHEEM SARHAN
A thesis submitted in fulfillment of the requirements for the award of the degree of
Master of Mechanical Engineering
Faculty of Mechanical and Manufacturing Engineering
Universiti Tun Hussein Onn Malaysia
July 2015
v
ABSTRACT
Ventilation is the process of supplying fresh air and removing stale air Natural
ventilation is an effective method to save energy required to condition building and to
improve indoor air quality It is widely recognized as contributing in low energy
building design In present work five types of low Reynolds number airfoils were used
to design air catchers with three angles of attack and four different diameters
SolidWorks was used to build the geometries and Computational Fluid Dynamics (CFD)
was used to simulate the buoyancy driven natural ventilation Mesh dependency test has
been done for three sizes of mesh and result was validated by comparing the numerical
result with experimental result for NACA2415 airfoil Sixty cases were studied by
considering five types of airfoils air catchers three angles of attack ( 0deg 10deg and 20 deg)
with four diameters ( 075Cax 1Cax 25Cax and 3Cax ) for each type by using CFX
ANSYS with k-ε turbulence model All the configurations show improvement on the
effective mass flow rate Nominal and effective mass flow rates and improvement factor
were calculated for each case It is observed that the improving factor increased with
angle of attack and decreased with diameter The results showed that the best
improvement factor was found at S1223 air catcher with 1125 mm diameter and 20deg
angle of attack Therefore the air catcher is feasible for the natural ventilation
application
vi
ABSTRAK
mesh telah dijalankan bagi aerofoil NACA2415 dan keputusan ujian berangka tersebut
dibuktikan dengan membuat perbandingan bersama keputusan eksperimen Enam puluh
jenis konfigurasi yang terdiri daripada lima jenis aerofoil tiga perbezaan sudut
kecondongan 0deg 10deg 20deg dan empat jenis diameter 075Cax 10Cax 25Cax 3Cax telah
diuji mengunakan ANSYS CFX dengan mengaplikasikan model turbulen k-ε Nominal
kadar aliran jisim dan faktor peningkatan telah dikira bagi setiap konfigurasi Semua
jenis konfigurasi menunjukkan peningkatan bagi setiap kadar aliran jisim Faktor
peningkatan menunjukkan penambahbaikan apabila sudut kecendorongan meningkat
manakala faktor peningkatan menurun apabila diameter meningkat Keputusan
menunjukkan bahawa perangkap angin S1223 dengan diameter 1125mm dan sudut
kecendorongan 20deg mempunyai faktor peningkatan terbaik Oleh itu ciri-ciri tersebut
sesuai untuk diaplikasikan dalam perangkap angin sebagai pengudaraan semula jadi
Pengalihan udara atau pengudaraan adalah satu proses membekalkan udara yang tidak
tercemar dan segar bagi menggantikan udara yang tidak segar Pengudaraan semula jadi
merupakan satu proses yang menjimatkan tenaga di samping dapat membaik pulih
kualiti udara di dalam bangunan Selain itu pengudaraan semula jadi hanya sesuai
diaplikasikan pada bangunan yang menghasilkan tenaga yang rendah Dalam kajian ini
lima jenis aerofoil daripada nombor Reynolds yang rendah telah digunakan bagi
membentuk perangkap angin Perbezaan beberapa pemboleh ubah seperti diameter dan
sudut kecondongan aerofoil juga telah ditetapkan SolidWorks telah digunakan bagi
mencipta perangkap angin manakala Computational Fluid Dynamics digunakan untuk
mengendalikan simulasi pengudaraan Sebelum simulasi diteruskan ujian pergantungan
vii
CONTENTS
DECLARATION ii
DEDICATION iii
ACKNWLEDGMENT iv
ABSTRACT v
ABSTRAK vi
CONTENTS vii
LIST OF FIGURES xi
LIST OF TABLES xiv
LIST OF SYMBLOS AND ABBREAVIATION xv
CHAPTER 1 INTRODUCTION 1
11 Background 1
12 Problem Statement 2
13 Significant of Study 2
14 Objectives of Study 3
15 Scope of Study 4
CHAPTER 2 LITERATURE REVIEW 6
21 Introduction 6
viii
22 Indoor Air Quality 7
23 Indoor Thermal Environment 7
231 Air Temperature 9
232 Relative Humidity 9
233 Air Speed 9
234 Mean Radiant Temperature 9
235 The Operative Temperature 10
236 Metabolic Rate 11
237 Clothing Insulation 12
24 Fresh Air Requirement 12
25 Natural Ventilation 14
251 Wind Driven Natural Ventilation 14
252 Buoyancy Driven Natural Ventilation 17
2521 Calculation of Buoyancy Driven Natural Ventilation 19
253 Combination of Buoyancy and Wind 20
254 Examples of Naturally Ventilated Buildings 21
26 Wind Lens 22
261 Air Catcher 23
262 Airfoil 25
27 Related Studies 26
271 Related Studies about Buoyancy Driven Natural Ventilation 27
ix
272 Related Studies about Airfoils 30
CHAPTER 3 RESEARCH METHODOLOGY 32
31 Introduction 32
32 SoildWorks 33
33 Computational Fluid Dynamics 33
34 CFD Modeling Process 34
35 Physical Model 36
36 Computational Domain 38
37 Flow Chart 43
CHAPTER 4 RESULTS AND DISCUSSION 45
41 Introduction 45
42 Mesh Dependency Test and Result Validation 46
43 Airfoil Baselines 47
44 Results and Discussion 50
441 Effect of Angle of Attack 50
4411 Effect of Angle of Attack on Velocity 50
4412 Effect of Angle of Attack on Pressure 51
4413 Effect of Angle of Attack on Improvement Fact 52
442 Effect of Diameter 54
4421 Effect of Diameter on Velocity 54
4422 Effect of Diameter on Pressure 55
x
4423 Effect of Diameter on Improvement Factor 55
443 Comparison of Air Catchers 59
CHAPTER 5 CONCLUSION AND RECOMMENDATIONS 63
51 Conclusion 63
52 Recommendations 64
REFERENCES 65
APPENDICES 69
APPENDIX A Figures 70
APPENDIX B Tables 78
xi
LIST OF FIGURES
11 Five airfoils at angle of attack α=0deg 4
12 Examples of the airfoil at different angles of attack 5
21 Negative and positive pressure due to wind 15
22 Pressure differences created by wind on the building 15
23 Single ndash sided ventilation 16
24 Cross ventilation 17
25 Buoyancy (stack) ventilation 18
26 Wind catchers in Yazd City 21
27 BRE Office Building Facades with Stacks 22
28 Building interior 22
29 The wind lens concept 23
210 Wind lens turbines 23
211 Air catcher 24
212 Bernoulli effect 24
213 Typical airfoil 25
214 Pressure distributions over an airfoil 25
215 Typical airfoil geometry 26
31 Air catcher inlet 36
xii
32 Diameter of the air catcher 37
33 Cross section of the air catcher 38
34 Computational domain for NACA2415 airfoil 39
35 Inlet and outlet of NACA2415 39
36 Zoomed mesh 40
37 Geometry of NACA2415 air catcher at α= 0deg D= 075 Cax 40
38 Medium size mesh of the air catcher 41
39 Inlet and outlet for air catcher 41
310 Velocity contour for NACA2415 air catcher air at α=0deg D=075 Cax 42
311 Pressure contour for NACA2415 air catcher at α=0deg D=075 Cax 42
312 Flow Chart 44
41 Mesh dependency test 46
42 Cp distribution along chord length 48
43 A comparison of Cp at the upper surfaces 49
44 A comparison of Cp at the lower surfaces 49
45 Effect of angle of attack on velocity for NACA2415 at D=075 Cax 51
46 Effect of angle of attack on pressure for NACA2415 at D=075 Cax 52
47 Effect of angle of attack on improvement factor 53
48 Effect of diameter on velocity for NACA2415 at α= 0deg 54
49 Effect of diameter on pressure for NACA2415 at α = 0deg 55
410 Effect of diameter on improvement factor for NACA2415 at α = 0deg 56
xiii
411 Effect of angle of attack and diameter on velocity for NACA2415 case 57
412 Effect of angle of attack and diameter on pressure for NACA2415 cases 58
413 Velocity comparison for all air catchers at D=075 cax and α = 20deg 60
414 Pressure comparison for all air catchers at D=075cax and α= 0deg 60
415 A comparison of improvement factors for all air catchers 61
416 A comparison of velocity for all air catchers at D=075 cax 62
A1 Pressure contour of Bergey BW3 air catcher 70
A2 Velocity contour of Bergey BW3 air catcher 71
A3 Pressure contour of MA409 air catcher 72
A4 Velocity contour of MA409 air catcher 73
A5 Pressure contour for S1223 air catcher 74
A6 Velocity contour for S1223 air catcher 75
A7 Pressure contour for S7055 air catcher 76
A8 Velocity contour for S1223 air catcher 77
xiv
LIST OF TABLES
21 Metabolic Rates according to ISO 7730 11
22 Fresh air ventilation requirement 13
23 Guideline on Minimum Ventilation Rates 13
41 Effect of angle of attack and diameter for NACA2415 cases 59
B1 Mass flow rate and improvement factor of Bergey BW3 air catcher 78
B2 Mass flow rate and improvement factor of MA409 air catcher 79
B3 Mass flow rate and improvement factor of S1223 air catcher 80
B4 Mass flow rate and improvement factor of S7055 air catcher 81
xv
LIST OF SYMBOLS AND ABBREAVIATION
A Area
Cax Chord Axial Length
CD Discharge Coefficient
Clo Clothing Insulation
Cp Pressure Coefficient
D Diameter
g Gravitational Acceleration
Gr Grashof Number
H Height
HVAC Heating Ventilation and Air and Air Conditioning
L Litter
MRT Mean Radiant Temperature
meff Effective Mass Flow Rate
mnom Nominal Mass Flow Rate
Nu Nusslet Number
P Pressure
Pr Prandtl Number
Q Mass Flow Rate
xvi
Re Reynolds Number
T Temperature
Top Operative Temperature
U Wind Speed
V Air Velocity
Greek Symbols
α Angle of Attack
ρ Air Density
μ Dynamic Viscosity
1
CHAPTER 1
INTRODUCTION
11 Background
Ventilation is the process by which clean air (normally outdoor air) is intentionally
provided to a space and a stale air is removed Fresh air is necessary in buildings to
provide oxygen for respiration to alleviate odors and to increase thermal comfort There
are two categories of ventilation mechanical ventilation and natural ventilation Typical
examples of mechanical ventilation are fans and HVAC units In a well insulated
building such systems can provide full control of heating cooling and humidity This
method can be both energy ndash intensive and have high maintenance costs as well as
yielding poor air quality for occupants in poorly designed andor maintained systems
On the other hand examples of natural ventilation involved building openings like
windows and doors
2
According to the World Business Council for Sustainable Development
(WBCSD) buildings account for up to 40 of the worldrsquos energy use [1] Breaking
down the energy consumption of buildings reveals that Heating Ventilation and Air
Conditioning (HVAC) systems account for up to 60 of domestic buildings energy
consumption [2] This represents a significant opportunity for reducing the buildings
energy consumption and carbon footprint
Natural ventilation application may play a key role in buildings energy
associated with achieving good indoor air quality (IAQ) to the interior spaces In
addition naturally ventilated buildings also have lower capital and lower operational
costs In general there are two types of natural ventilation wind driven and buoyancy
driven natural ventilation
12 Problem Statement
In urban area where most of the occupied building are surrounded by dense buildings or
in the climate where no wind blowing there will be a poor airflow for wind driven
natural ventilation In this case buoyancy driven ventilation is preferred However
buoyancy driven natural ventilation is not effective because it relies on buoyancy forces
which are naturally weak what will result a poor air circulation so focus should be paid
to enhance the performance of buoyancy driven natural ventilation The present study
focuses on the feasibility study of a novel design known as air catcher with the aim to
enhance the flow driven by buoyancy in natural ventilation
3
13 Significant of Study
About 40 of the total energy consumption is used for air conditioning and mechanical
ventilation of buildings Natural ventilation plays an important role in reducing the
operational and maintenance costs of buildings because it does not require any amount
of energy The importance of this study comes from studying the feasibility of air
catcher in enhancing the air circulation and to propose the optimum geometry helping in
improving the buoyancy driven natural ventilation in case of poor outdoor wind
blowing
14 Objectives of Study
The present study will be aligned based on several objectives as
(a) To study the flow phenomenon through different airfoil shapes at low Reynolds
number
(b) To determine the effect of air catcher geometrical parameters on the flow
phenomena and
(c) To propose optimum geometrical parameters set of the air catcher for natural
ventilation application
4
15 Scope of Study
(a) The study will make use of the commercial Computational Fluid Dynamics
software ANSYS CFX to provide information on feasibility of the air catcher
(b) Five different low Reynolds number airfoil shapes will be considered and
(c) Four different values of the diameter D (075Cax1 Cax 25Cax and 3Cax) and
three angles of attack α (0deg10deg20deg) will be considered for each airfoil
Figure 11 Five airfoils at angle of attack α=0deg
Bergey BW3 MA 409
S1223
S7055
NACA 2415
5
Figure 12 Examples of the airfoil at different angles of attack
α = 20deg
α = 10deg α = 0deg
6
CHAPTER 2
LITERATURE REVIEW
21 Introduction
In this chapter important parameters in ventilation system will be explained Initially
discussion on the indoor air quality will be made followed by details on natural
ventilation types of natural ventilation the mechanism and driving forces of each type
In addition details about the air catcher and airfoils will be discussed and related to
studies of natural ventilation and airfoils
7
22 Indoor Air Quality
American Society of Heating Refrigeration and Air Conditioning Engineers in
ASHRAE Standard 62 ndash 1999 Ventilation for Acceptable Indoor Air Quality has
defined the acceptable indoor air quality (IAQ) as ldquoair in which there are no known
contaminants at harmful concentrations as determined by cognizant authorities and with
which a substantial majority (80 or more) of the people exposed do not express
dissatisfactionrdquo [3]
The overall quality of indoor air is influenced by thermal acceptability and air
contaminants The factors affecting thermal acceptability include temperature relative
humidity and air movement as these physical parameters could affect peoplersquos
perception of the IAQ Air contaminants include an enormous range of substances and
biological organisms generated by the building materials human activities office
equipment and also activities outside the building from the outdoor environment The
common air contaminants include airborne particles volatile organic compounds
tobacco smoke asbestos formaldehyde radon combustion gases ozone micro ndash
organisms respiratory products and body odors [4]
23 Indoor Thermal Environment
Thermal comfort is defined in ISO 7730 as ldquothat condition of mind which expresses
satisfaction with the thermal environmentrdquo Dissatisfaction may be caused by warm or
cool discomfort of the body as a whole But thermal dissatisfaction may also be caused
by an unwanted cooling or heating of one particular part of the body Local discomfort
may also be caused by an abnormal high vertical temperature difference between head
and ankles by too warm or cool a floor or by too high a radiant temperature asymmetry
8
Thermal neutrality is the first comfort condition It means that a person feels
neither too warm nor too cold When the skin temperature falls below 34 degC the cold
sensors of the human body begin to send impulses to the brain If the temperature
continues to fall the impulses increase in number The number of impulses is also a
function of how quickly the skin temperature falls the faster temperature drop the
greater the number of impulses being sent Similarly the heat sensors in the skin send
impulses to the brain when the temperature exceeds 37degC and the number of impulses
increased with temperature increases the number of impulses increase It is believed that
it is the signals from these two sensor systems that form the basis for human body
evaluation of the thermal environment
Due to individual differences it is impossible to specify a thermal environment
that will satisfy everybody There will always be a percentage of dissatisfied occupants
But it is possible to specify environment predicted to be acceptable by a certain
percentage of the occupants
Thermal comfort is affected by the thermal interaction between the body and
surrounding environment There are six primary factors that affect this thermal
interaction
(a) Air temperature
(b) Relative Humidity
(c) Air speed
(d) Mean radiant temperature (MRT)
(e) The operative temperature
(f) Metabolic rate
(g) Clothing insulation
The first four factors define the conditions of the surrounding environment while
the latter two factors represent ldquopersonalrdquo variables that can vary between people
exposed to the same environmental conditions [5]
9
231 Air Temperature
It is one of the basic IAQ measurements that have a direct impact on perceived comfort
According to ASHRAE Standard 55 the recommended air temperature that is perceived
as comfortable is ranges from 228 degC to 261degC in the summer and 20degC to 236 in the
winter [6]
232 Relative Humidity
Too little humidity in a space may create static build-up and people will sense that their
skin feel dry Too much humidity will make people feel sticky According to ASHRAE
Standard 55 indoor humidity levels should be maintained between 30 and 65 for
optimum comfort
233 Air Speed
One of the first checks in a comfort study is making sure that sufficient air is moving in
a space Air movement can affect human comfort level in that too fast air is perceived as
drafty or chilly and too slow may create a sensation of stuffiness
234 Mean Radiant Temperature Tmrt
The amount of radiant exchange between a person and the surrounding will be effective
on comfort Cold walls or windows may cause a person to feel cold on certain sensitive
10
parts of the body (suck as back of neck knee and ankle) even though the surrounding air
may be at a comfortable level Likewise warm surfaces such as stove or fire places may
cause a person to feel warmer than the surrounding air temperature would indicate This
phenomenon is known as ldquolocal cooling or local heatingrdquo
The basic index to describe the radiative condition in an environment is the mean
radiant temperature the mean temperature of individual exposed surfaces in the
environment The mean radiant temperature is commonly measured using a Vernonrsquos
Globe Thermometer which consists of a hollow sphere 6 inches in diameter flat back
paint coated and a thermocouple or thermometer bulb at its surrounding The
equilibrium temperature was assumed by the globe (globe temperature) result from a
balance in the convective and radiative heat exchange between the globe and its
surroundings The mean radiant temperature is estimated by combining the globe
temperature air temperature and velocity
1198791198981199031199054 = 119879119892
minus4 + 11986211988112 (119879119892 minus 119879119886 ) (21)
where 119879119898119903119905 Mean radiant temperature K
119879119892 Globe temperature
119879119886 Ambient air temperature K
119862 0247 x 109
119881 Air speed ms
235 The Operative Temperature Top
The operative temperature is the average of the mean radiant temperature and ambient
air temperature weighted by their respective practical applications it is the mean of the
radiant and dry bulb temperature and is sometimes referred to as the adjusted dry bulb
temperature It is the uniform temperature of an imaginary enclosure with which and
11
individual exchanges the same heat by radiation and convection as in the actual
environment The effective and operative temperatures are used in defining comfort
condition in ASHRAE Comfort Zone
119879119900119901 = 119879119886 + 119879119898119903119905
2 (22)
236 Metabolic Rate
Human activity levels can be expressed in term Metabolic Rate and measured in (met)
units Table 21 presents probable metabolic rates for various typical activities by ISO
7730
Table 21 Metabolic Rates according to ISO 7730
Activity Metabolic Rates
Wm2 met
Reclining
Seated relaxed
Sedentary activity (office dwelling school laboratory)
Standing light activity (shopping laboratory light industry)
Standing medium activity (shop assistant domestic work
machine work)
Walking on the level
1 kmh
2 kmh
3 kmh
46
58
70
93
116
110
140
16
08
1
12
16
2
19
24
28
12
ASHRAE standard 55- 1992 assumed an average adult effective surface area for
heat transfer of 196 ft2 And as 1 met = 184 BTU(hrft
2) therefore will dissipate
approximately 360 BTUhr (106 W) when functioning in a quite seated manner
237 Clothing Insulation
The other personal variable that affects comfort is the type and amount of clothing that a
person is wearing Clothing insulation is usually described as a single equivalent
uniform layer over the whole body Its insulating value is expressed in term (clo) units
1 clo = 0155 m2degCW A heavy two ndash piece business suit with accessories has an
insulation value of about 1 clo whereas a pair of shorts has about 005 clo
24 Fresh Air Requirement
One of the most important factors in delivering comfort is freshness of the conditioned
air If the same air were circulated over and over again it would become staled and make
the occupants very uncomfortable ASHRAE Standard 62 ndash 1999 specified that the
minimum fresh air supplied to each person in a building should be at least 15 cfm (8 ls)
of fresh air Table 22 shows the amount of fresh air to be supplied based on the type of
space and level of activity
13
Table 22 Fresh air ventilation requirement (ASHRAE 1999)
Application cfm per person ls per person
Dining room 20 10
Hotel room 30 per room 15 per room
Offices conference room 20 10
Public smoking lunge 60 30
Auditorium 15 8
School classroom 15 8
Hospital room 25 13
Table 23 Guideline on Minimum Ventilation Rates [7]
Air space per person
(m3)
Fresh air supply per person (Ls)
Minimum No smoking Smoking
3 113 17 226
6 71 107 142
9 52 78 104
12 4 6 8
14
25 Natural Ventilation
Natural ventilation relies on pressure differences to move fresh air through buildings
Pressure differences can be caused by wind or the buoyancy effect created by
temperature differences or a combination of these two [8] The flow of air through a
building depends on the following factors
(a) The temperature difference between the air inside and outside the building
(b) The difference in height between the air inlet and the exhaust vents
(c) Convection currents rising from heat sources (eg people computers lighting)
(d) The rate at which heat is produced or released inside the building
(e) The size position and construction of the building
(f) Wind speed and direction
251 Wind Driven Natural Ventilation
Wind can blow air through openings in the wall on the windward side of the building
and suck air out of openings on the leeward side and the roof Wind causes a positive
pressure on the windward side and a negative pressure on the leeward side of buildings
To equalize pressure fresh air will enter any windward opening and be exhausted from
any leeward opening (Figures 21 and 22)
15
Figure 21 Negative and positive pressure due to wind
Figure 22 Pressure differences created by wind on the building
The pressure created by the wind on the building is calculated by multiplying a non-
dimensional pressure coefficient (119862119875) with the dynamic pressure
Stale Air Out (Micro Climate) Fresh Air In
+ Windward
(Macro Climate) - Leeward
16
119875119908119894119899119889 = 1198621198751
2 120588119890 119880119903119890119891
2 (23)
where 119875119908119894119899119889 wind induced pressure [Pa]
119862119875 pressure coefficient [-]
120588119890 is the outdoor air density [kgm3]
1198801199031198901198912 is the wind speed at a reference height [ms]
The 119862119875 coefficient is determined by the shape of the building the wind direction and the
surrounding terrain
The pressure difference between the inside and the outside of the building can be
calculated as
∆119875119908119894119899119889 = 1198621198751
2 120588119890 119880119903119890119891
2 minus 119875119894 (24)
where 119875119894 is the pressure inside the building [Pa]
There are two types of wind driven natural ventilation single ndash sided ventilation and
cross ndash ventilation [9] In a single ndash sided ventilation opening(s) isare only installed on
one side of the chamber Fresh air enters and exhaust air exits on the same side (Figure
23) sometimes through the same single opening Turbulence often plays an important
role in single ndash sided ventilated enclosure
Figure 23 Single ndash sided ventilation
17
For cross ventilation air moves from the windward faccedilade through opening on
two sides of the enclosed space (Figure 24) There is a simple rule of thumb stating that
cross ventilation can perform well in the width of the enclosed space is less than five
times the ceiling height
Figure 24 Cross ventilation
252 Buoyancy Driven Natural Ventilation
Since many studies have shown that wind effect is far dominant than temperature
buoyancy (stack effect) in inducing air flow [10] the application of natural wind driven
ventilation is always the preferred choice by the architects and building designers to
generate indoor air movement and improve their building thermal environment
However nowadays in the conditions of warmer climate and denser built environment
or in building surrounded by thick trees the conventional concept of wind driven
ventilation does not always successfully apply The main solution could lie on providing
effective outlet area at the top of the building and use a stack ventilation strategy to
induce vertical air movement In buoyancy driven natural ventilation the pressure
difference created by different densities in the warm and cold air inside and outside a
building and in different zones inside the same building The exchange of air will
happen through one or more opening in the roof or outer wall (Figure 25) In addition
18
this type of natural ventilation could be done in single ndash sided and cross ndash ventilation
designs
Figure 25 Buoyancy (stack) ventilation
2521 Calculation of Buoyancy Driven Natural Ventilation
Natural ventilation by thermal buoyancy is the air exchange between two or more zones
with different densities due to different temperatures Ventilation by air exchange
implies openings between the zones and the opening arrangement can either be separate
openings in different levels or it can be a single large vertical or horizontal opening The
temperature differences can occur due to heating one or more of the zones
The external and internal pressure distribution can be described as below [11]
119875 = 1198750 minus 1205880 119892 119867 (25)
where 119875 the external or internal pressure [Pa]
1198750 the pressure at a reference level (floor) [Pa]
1205880 the external or internal air density at a reference level [kgm3]
119892 the gravitational acceleration [ms2]
19
119867 the height above the reference level [m]
Thus the buoyancy ndash induced pressure difference∆119875 across an opening at height H can
be calculated as following where expressions (i) for internal and (e) for external
∆119875 = 1198751198900 minus 1198751198940 minus (120588119890 minus120588119894) 119892 119867 (26)
At the neutral plane (119867 = 1198670) where ∆119875 = 0 expression (26) becomes
1198751198900 minus 1198751198940 = (120588119890 minus120588119894) 119892 1198670 (27)
From the Equation of state it can be found that
120588119890 minus120588119894
120588119894 cong
119879119894 minus119879119890
119879119890
and
120588119890 minus120588119894
120588119890 cong
119879119894 minus119879119890
119879119894 (28)
And Eq (27) can therefore be rewritten to
1198751198900 minus 1198751198940 = 119875119894 119892 1198670 119879119894 minus 119879119890
119879119890 (29)
Likewise the pressure in the height H1 where ΔPne0 can be found as
∆119875119867=1198671 = 1198751198900 minus 120588119894 119892 1198671Ti minusTe
Te (210)
If equation (29) is inserted into equation (210) the pressure difference in H1 can be
expressed only from the internal and external temperatures the gravitational acceleration
and the density of air Positive values of the pressure difference in equation (210) (H1
below the neutral plan) shows that the pressure outside the building is higher than inside
∆119875119867=1198671 = 120588119894 119892 1198670Ti minus Te
Te minus 120588119894 119892 1198671
Ti minus Te
Te
= 120588119894 119892 (1198670 minus 1198671) Ti minusTe
Te (211)
20
From Eq (211) it is seen that the pressure difference is increased with increasing height
difference and increasing temperature difference
From the pressure difference the airflow can be found
119876 = 119862119863 119860 radic2|∆119875|
120588 (212)
where 119862119863 is the discharge coefficient and in the area between 06 and 075
253 Combination of Buoyancy and Wind
When both mechanisms are operating they both create pressure differences across the
building Depending upon actual conditions the pressure created across any aperture
will may be additive or opposite The flow rate and direction through and aperture will
depend upon the sum of pressures cross the aperture Calculation of the combined
effects is complex even for a simple building but calculating the flow rate for each
mechanism separately and taking the larger Figure may make a reasonable
approximation of the total ventilation rate
Most often the pressure in natural ventilation will be created as a combination of
thermal buoyancy and wind The total pressure across an opening is found as a
summation of the pressure created by buoyancy and wind
∆119875 = ∆119875119908119894119899119889 + ∆119875119887119906119900119910119886119899119888119910 (213)
21
254 Examples of Naturally Ventilated Buildings
Natural ventilation has been the dominant way to ventilate residencies since the ancient
times Successful example can be traced in the wind catchers in the architecture of the
Middle East Pakistan and India which exhibit the impact of the traditional Persian
architecture on these regions (Figure 26) Wind catcher is placed and oriented in the
wind direction and it has two opening in opposite directions Air moves in from one
opening circulating down and then go out form the opposite opening
Figure 26 Wind catchers in Yazd City
There is a trend for more buildings to incorporate natural ventilation as a scheme
for cooling and ventilating part of or a whole building Some of these buildings
emphasize design characteristics making them stand out in a typical streetscape while
others lean toward a more traditional building faccedilade Both strategies work and
examples of each are presented here for comparison Most naturally ventilated buildings
are located in Europe and the examples here are from the United Kingdom and the
Netherlands [12]
Of the examples one in particular accentuates the design characteristics on the
faccedilade of the building the home of the British Research Establishment (BRE) This
building incorporates stack vents into the ventilation scheme and makes them
22
pronounced in the architecture of the building The BRE designed by Fielden Clegg
and built in 1997 is well known for its low energy usage and efficient design It
combines the use of thermal mass cross ventilation and stacks to passively cool the
building The buildingrsquos stacks not only are a prominent feature in its faccedilade but also
assist in driving buoyancy and stack driven air flow They are constructed of glass
block shown in Figure 27 creating a greenhouse effect that warms up air within the
shaft which as it rises draws in cooler air through other openings on the faccedilade The
occupants have control over the lights and window openings as shown in Figure 28
Figure 27 BRE Office Building Facades with Stacks Figure 28 Building interior
26 Wind Lens
Wind lens is a diffuser shroud equipped with a brim The concept of wind lens
technology is that if local wind speed can be accelerated by capturing and concentrating
the wind with some mechanism there will be a hope for utilizing the wind power in a
more efficient way [13] This is because a low pressure region due to a strong vortex
formation behind the broad brim draws more mass flow to the diffuser (Figures 29
210)
23
Figure 29 The wind lens concept
Figure 210 Wind lens turbines
261 Air Catcher
Air catcher is the proposed geometry that will be used in present study to enhance the
buoyancy driven natural ventilation (Figure 211) Air catcher is an airfoil shaped cross
sectional area design to be used in this study by using five different airfoils to study the
hydrodynamics over these airfoils at different angels of attack The principal of air
24
catcher is similar to aerodynamics of an airplane wing As a result of the airflow pattern
over the wing decelerated and accelerated zones are developed The flow induced
positive pressure below and negative pressure above the wing in what is called the
Bernoulli Effect (Figure 212)
Figure 211 Air catcher
Figure 212 Bernoulli effect
65
REFERENCES
[1] Continental Automated Building Association (2009) Transforming the market
Energy efficiency in buildings World Business Council for Sustainable
Development
[2] Energy Efficiency and Renewable Energy US Department of Energy
httpwww1eereenergygovbuildingscommercialhvachtmlLast accessed on
October302014
[3] ASHRAE 62-1999 Ventilation for Acceptable Indoor Air Quality USA1999
[4] ISO 7730 1994 Moderate Thermal Environments Geneve 1994
[5] Himdan EE(2010)Air Freshness Requirement of Selected Groups of
Occupants Comparison between Malaysian and Arab Subject MSc Thesis
Universiti Tun Hussein Onn Malaysia
[6] ASHRAE Standard 55- 1992 Thermal Environmental Conditions for Human
Occupancy USA1992
[7] DouglasJF Gasiorek JM and Swaffield(1996)Fluid Mechanics3rd
edition
Longman Singapore
[8] Larsen T S(2006)Natural Ventilation Driven by Wind and Temperature
Difference PhD thesis Aalborg University Denmark
[9] Pong C O(2010)Computational Fluid Dynamics Simulations on the Natural
Ventilation Behaviour within a Building Cluster Master thesis The University
of Hong Kong
66
[10] PapadakisGMermierMMenesesJBoulardT(1996)Measurement and
Analysis of Air Exchange Rates in a Green House with Continuous Roof and
Side openings Journal of Agricultural Engineering and Resources1996 (36)pp
219-228
[11] Li Zhigang(2014)Characteristic of Buoyancy Driven Natural Ventilation
Through Horizontal Openings PhD thesis Aalborg University Denmark
[12] Walker C E (2006)Methodology for the Evaluation of Natural Ventilation in
Buildings Using a Reduced-Scale Air Model PhD Thesis Massachusetts
Institute of Technology USA
[13] OhyaY KarasudaniT and ZhangX A Shrouded Wind Turbine Generating
High Output Power with Wind Lens Technology Retrieved on October282014
from httpwwwontario-seaorg Storage27 1850 pdf
[14] Stern FMuste M HouserD Wilson M and GoshS Measurement of
Pressure Distribution and Forces Acting on an Airfoil Retrieved on October
26 2014 from www userengineeringuiowaedu~cfdpdfs57-020airfoildoc
[15] Aerodynamic Background Retrieved on November 252014 form
httpscoursescitcornelledu mae5070 AeroBackgroundpdf
[16] Jiang Y Chen Q(2003) Buoyancy-Driven Single-Sided Natural Ventilation
in Building with Large Openings International Journal of Heat and Mass
Transfer 46(6) pp 973-988
[17] Bansal NK Mathur Rajesh Bhandari MS(1993) Solar Chimney for
Enhanced Stack Ventilation Center for energy Studies Indian Institute of
Technology Delhi India
[18] Li R Pitts A LiY(2007) Buoyancy ndash Driven Natural Ventilation of a
Room with Large OpeningUniversity of Sheffield Sheffield UK
67
[19] Liping W AnguiL(2006)A Numerical Study of Trombe Wall for Enhancing
Stack Ventilation in Buildings PLEA 2006 The 3rd
Conference on Passive and
Low Energy Architecture Geneva Switzerland
[20] Hussain S Oosthuizen P H(2013)Numerical Investigations of Buoyancy ndash
Driven Natural Ventilation in a Simple Three ndash Storey Atrium Building Queenrsquos
University Canada
[21] Lee H K Strand R K(2009) Enhancement of Natural Ventilation in
Buildings Using a Thermal Chimney Energy and Buildings (41) pp 615-612
[22] Brown WG(1962)Natural Convection Through Rectangular in Partitions-2
Horizontal Partitions IntJ Heat Mass Transfer Vol5
[23] Blomqvsit C SandbergM(2002)A Note on Air Movements through
Horizontal Opening in buildings Roomventrsquo2002
[24] AbdWahabI Ismail L H(2011)Natural Ventilation Approach in Designing
a Tropical House Universiti Tun Hussein Onn Malaysia
[25] Zhou Y Alam MD Mahbub YangHXGuo H Wood DH(2011)
Fluid Forces on a Very Low Reynolds Number Airfoil and their Prediction
International Journal of Fluid and Heat Flow (32) pp329-339
[26] Gerakopulos Ryan Boutilier Michael SH Yarusevych S(2010)
Aerodynamic Characterization of a NACA 0018 Airfoil at Low Reynolds
Number 40th Fluid Dynamics Conference and Exhibit 28 June ndash 1 July
2010Chicago Illinois
[27] MateescuD Abdo M(2010)Analysis of Flows Past Airfoils at Very Low
Reynolds Numbers McGill University Montreal Quebec Canada
[28] Genc MS KarasuI AcikelHH(2012)An Experimental Study on
Aerodynamics of NACA 2415 airfoil at low Reynolds Numbers Experimental
Thermal and Fluid Science (39) pp 252-264
68
[29] BrbasonM ReiterS(2010)About the Choice of Turbulence Model in
Building Physics Simulation 7th International conference of indoor air quality
ventilation and energy conservation in buildings Syracuse New York

1
CHAPTER 1
INTRODUCTION
11 Background
Ventilation is the process by which clean air (normally outdoor air) is intentionally
provided to a space and a stale air is removed Fresh air is necessary in buildings to
provide oxygen for respiration to alleviate odors and to increase thermal comfort There
are two categories of ventilation mechanical ventilation and natural ventilation Typical
examples of mechanical ventilation are fans and HVAC units In a well insulated
building such systems can provide full control of heating cooling and humidity This
method can be both energy ndash intensive and have high maintenance costs as well as
yielding poor air quality for occupants in poorly designed andor maintained systems
On the other hand examples of natural ventilation involved building openings like
windows and doors
2
According to the World Business Council for Sustainable Development
(WBCSD) buildings account for up to 40 of the worldrsquos energy use [1] Breaking
down the energy consumption of buildings reveals that Heating Ventilation and Air
Conditioning (HVAC) systems account for up to 60 of domestic buildings energy
consumption [2] This represents a significant opportunity for reducing the buildings
energy consumption and carbon footprint
Natural ventilation application may play a key role in buildings energy
associated with achieving good indoor air quality (IAQ) to the interior spaces In
addition naturally ventilated buildings also have lower capital and lower operational
costs In general there are two types of natural ventilation wind driven and buoyancy
driven natural ventilation
12 Problem Statement
In urban area where most of the occupied building are surrounded by dense buildings or
in the climate where no wind blowing there will be a poor airflow for wind driven
natural ventilation In this case buoyancy driven ventilation is preferred However
buoyancy driven natural ventilation is not effective because it relies on buoyancy forces
which are naturally weak what will result a poor air circulation so focus should be paid
to enhance the performance of buoyancy driven natural ventilation The present study
focuses on the feasibility study of a novel design known as air catcher with the aim to
enhance the flow driven by buoyancy in natural ventilation
3
13 Significant of Study
About 40 of the total energy consumption is used for air conditioning and mechanical
ventilation of buildings Natural ventilation plays an important role in reducing the
operational and maintenance costs of buildings because it does not require any amount
of energy The importance of this study comes from studying the feasibility of air
catcher in enhancing the air circulation and to propose the optimum geometry helping in
improving the buoyancy driven natural ventilation in case of poor outdoor wind
blowing
14 Objectives of Study
The present study will be aligned based on several objectives as
(a) To study the flow phenomenon through different airfoil shapes at low Reynolds
number
(b) To determine the effect of air catcher geometrical parameters on the flow
phenomena and
(c) To propose optimum geometrical parameters set of the air catcher for natural
ventilation application
4
15 Scope of Study
(a) The study will make use of the commercial Computational Fluid Dynamics
software ANSYS CFX to provide information on feasibility of the air catcher
(b) Five different low Reynolds number airfoil shapes will be considered and
(c) Four different values of the diameter D (075Cax1 Cax 25Cax and 3Cax) and
three angles of attack α (0deg10deg20deg) will be considered for each airfoil
Figure 11 Five airfoils at angle of attack α=0deg
Bergey BW3 MA 409
S1223
S7055
NACA 2415
5
Figure 12 Examples of the airfoil at different angles of attack
α = 20deg
α = 10deg α = 0deg
6
CHAPTER 2
LITERATURE REVIEW
21 Introduction
In this chapter important parameters in ventilation system will be explained Initially
discussion on the indoor air quality will be made followed by details on natural
ventilation types of natural ventilation the mechanism and driving forces of each type
In addition details about the air catcher and airfoils will be discussed and related to
studies of natural ventilation and airfoils
7
22 Indoor Air Quality
American Society of Heating Refrigeration and Air Conditioning Engineers in
ASHRAE Standard 62 ndash 1999 Ventilation for Acceptable Indoor Air Quality has
defined the acceptable indoor air quality (IAQ) as ldquoair in which there are no known
contaminants at harmful concentrations as determined by cognizant authorities and with
which a substantial majority (80 or more) of the people exposed do not express
dissatisfactionrdquo [3]
The overall quality of indoor air is influenced by thermal acceptability and air
contaminants The factors affecting thermal acceptability include temperature relative
humidity and air movement as these physical parameters could affect peoplersquos
perception of the IAQ Air contaminants include an enormous range of substances and
biological organisms generated by the building materials human activities office
equipment and also activities outside the building from the outdoor environment The
common air contaminants include airborne particles volatile organic compounds
tobacco smoke asbestos formaldehyde radon combustion gases ozone micro ndash
organisms respiratory products and body odors [4]
23 Indoor Thermal Environment
Thermal comfort is defined in ISO 7730 as ldquothat condition of mind which expresses
satisfaction with the thermal environmentrdquo Dissatisfaction may be caused by warm or
cool discomfort of the body as a whole But thermal dissatisfaction may also be caused
by an unwanted cooling or heating of one particular part of the body Local discomfort
may also be caused by an abnormal high vertical temperature difference between head
and ankles by too warm or cool a floor or by too high a radiant temperature asymmetry
8
Thermal neutrality is the first comfort condition It means that a person feels
neither too warm nor too cold When the skin temperature falls below 34 degC the cold
sensors of the human body begin to send impulses to the brain If the temperature
continues to fall the impulses increase in number The number of impulses is also a
function of how quickly the skin temperature falls the faster temperature drop the
greater the number of impulses being sent Similarly the heat sensors in the skin send
impulses to the brain when the temperature exceeds 37degC and the number of impulses
increased with temperature increases the number of impulses increase It is believed that
it is the signals from these two sensor systems that form the basis for human body
evaluation of the thermal environment
Due to individual differences it is impossible to specify a thermal environment
that will satisfy everybody There will always be a percentage of dissatisfied occupants
But it is possible to specify environment predicted to be acceptable by a certain
percentage of the occupants
Thermal comfort is affected by the thermal interaction between the body and
surrounding environment There are six primary factors that affect this thermal
interaction
(a) Air temperature
(b) Relative Humidity
(c) Air speed
(d) Mean radiant temperature (MRT)
(e) The operative temperature
(f) Metabolic rate
(g) Clothing insulation
The first four factors define the conditions of the surrounding environment while
the latter two factors represent ldquopersonalrdquo variables that can vary between people
exposed to the same environmental conditions [5]
9
231 Air Temperature
It is one of the basic IAQ measurements that have a direct impact on perceived comfort
According to ASHRAE Standard 55 the recommended air temperature that is perceived
as comfortable is ranges from 228 degC to 261degC in the summer and 20degC to 236 in the
winter [6]
232 Relative Humidity
Too little humidity in a space may create static build-up and people will sense that their
skin feel dry Too much humidity will make people feel sticky According to ASHRAE
Standard 55 indoor humidity levels should be maintained between 30 and 65 for
optimum comfort
233 Air Speed
One of the first checks in a comfort study is making sure that sufficient air is moving in
a space Air movement can affect human comfort level in that too fast air is perceived as
drafty or chilly and too slow may create a sensation of stuffiness
234 Mean Radiant Temperature Tmrt
The amount of radiant exchange between a person and the surrounding will be effective
on comfort Cold walls or windows may cause a person to feel cold on certain sensitive
10
parts of the body (suck as back of neck knee and ankle) even though the surrounding air
may be at a comfortable level Likewise warm surfaces such as stove or fire places may
cause a person to feel warmer than the surrounding air temperature would indicate This
phenomenon is known as ldquolocal cooling or local heatingrdquo
The basic index to describe the radiative condition in an environment is the mean
radiant temperature the mean temperature of individual exposed surfaces in the
environment The mean radiant temperature is commonly measured using a Vernonrsquos
Globe Thermometer which consists of a hollow sphere 6 inches in diameter flat back
paint coated and a thermocouple or thermometer bulb at its surrounding The
equilibrium temperature was assumed by the globe (globe temperature) result from a
balance in the convective and radiative heat exchange between the globe and its
surroundings The mean radiant temperature is estimated by combining the globe
temperature air temperature and velocity
1198791198981199031199054 = 119879119892
minus4 + 11986211988112 (119879119892 minus 119879119886 ) (21)
where 119879119898119903119905 Mean radiant temperature K
119879119892 Globe temperature
119879119886 Ambient air temperature K
119862 0247 x 109
119881 Air speed ms
235 The Operative Temperature Top
The operative temperature is the average of the mean radiant temperature and ambient
air temperature weighted by their respective practical applications it is the mean of the
radiant and dry bulb temperature and is sometimes referred to as the adjusted dry bulb
temperature It is the uniform temperature of an imaginary enclosure with which and
11
individual exchanges the same heat by radiation and convection as in the actual
environment The effective and operative temperatures are used in defining comfort
condition in ASHRAE Comfort Zone
119879119900119901 = 119879119886 + 119879119898119903119905
2 (22)
236 Metabolic Rate
Human activity levels can be expressed in term Metabolic Rate and measured in (met)
units Table 21 presents probable metabolic rates for various typical activities by ISO
7730
Table 21 Metabolic Rates according to ISO 7730
Activity Metabolic Rates
Wm2 met
Reclining
Seated relaxed
Sedentary activity (office dwelling school laboratory)
Standing light activity (shopping laboratory light industry)
Standing medium activity (shop assistant domestic work
machine work)
Walking on the level
1 kmh
2 kmh
3 kmh
46
58
70
93
116
110
140
16
08
1
12
16
2
19
24
28
12
ASHRAE standard 55- 1992 assumed an average adult effective surface area for
heat transfer of 196 ft2 And as 1 met = 184 BTU(hrft
2) therefore will dissipate
approximately 360 BTUhr (106 W) when functioning in a quite seated manner
237 Clothing Insulation
The other personal variable that affects comfort is the type and amount of clothing that a
person is wearing Clothing insulation is usually described as a single equivalent
uniform layer over the whole body Its insulating value is expressed in term (clo) units
1 clo = 0155 m2degCW A heavy two ndash piece business suit with accessories has an
insulation value of about 1 clo whereas a pair of shorts has about 005 clo
24 Fresh Air Requirement
One of the most important factors in delivering comfort is freshness of the conditioned
air If the same air were circulated over and over again it would become staled and make
the occupants very uncomfortable ASHRAE Standard 62 ndash 1999 specified that the
minimum fresh air supplied to each person in a building should be at least 15 cfm (8 ls)
of fresh air Table 22 shows the amount of fresh air to be supplied based on the type of
space and level of activity
13
Table 22 Fresh air ventilation requirement (ASHRAE 1999)
Application cfm per person ls per person
Dining room 20 10
Hotel room 30 per room 15 per room
Offices conference room 20 10
Public smoking lunge 60 30
Auditorium 15 8
School classroom 15 8
Hospital room 25 13
Table 23 Guideline on Minimum Ventilation Rates [7]
Air space per person
(m3)
Fresh air supply per person (Ls)
Minimum No smoking Smoking
3 113 17 226
6 71 107 142
9 52 78 104
12 4 6 8
14
25 Natural Ventilation
Natural ventilation relies on pressure differences to move fresh air through buildings
Pressure differences can be caused by wind or the buoyancy effect created by
temperature differences or a combination of these two [8] The flow of air through a
building depends on the following factors
(a) The temperature difference between the air inside and outside the building
(b) The difference in height between the air inlet and the exhaust vents
(c) Convection currents rising from heat sources (eg people computers lighting)
(d) The rate at which heat is produced or released inside the building
(e) The size position and construction of the building
(f) Wind speed and direction
251 Wind Driven Natural Ventilation
Wind can blow air through openings in the wall on the windward side of the building
and suck air out of openings on the leeward side and the roof Wind causes a positive
pressure on the windward side and a negative pressure on the leeward side of buildings
To equalize pressure fresh air will enter any windward opening and be exhausted from
any leeward opening (Figures 21 and 22)
15
Figure 21 Negative and positive pressure due to wind
Figure 22 Pressure differences created by wind on the building
The pressure created by the wind on the building is calculated by multiplying a non-
dimensional pressure coefficient (119862119875) with the dynamic pressure
Stale Air Out (Micro Climate) Fresh Air In
+ Windward
(Macro Climate) - Leeward
16
119875119908119894119899119889 = 1198621198751
2 120588119890 119880119903119890119891
2 (23)
where 119875119908119894119899119889 wind induced pressure [Pa]
119862119875 pressure coefficient [-]
120588119890 is the outdoor air density [kgm3]
1198801199031198901198912 is the wind speed at a reference height [ms]
The 119862119875 coefficient is determined by the shape of the building the wind direction and the
surrounding terrain
The pressure difference between the inside and the outside of the building can be
calculated as
∆119875119908119894119899119889 = 1198621198751
2 120588119890 119880119903119890119891
2 minus 119875119894 (24)
where 119875119894 is the pressure inside the building [Pa]
There are two types of wind driven natural ventilation single ndash sided ventilation and
cross ndash ventilation [9] In a single ndash sided ventilation opening(s) isare only installed on
one side of the chamber Fresh air enters and exhaust air exits on the same side (Figure
23) sometimes through the same single opening Turbulence often plays an important
role in single ndash sided ventilated enclosure
Figure 23 Single ndash sided ventilation
17
For cross ventilation air moves from the windward faccedilade through opening on
two sides of the enclosed space (Figure 24) There is a simple rule of thumb stating that
cross ventilation can perform well in the width of the enclosed space is less than five
times the ceiling height
Figure 24 Cross ventilation
252 Buoyancy Driven Natural Ventilation
Since many studies have shown that wind effect is far dominant than temperature
buoyancy (stack effect) in inducing air flow [10] the application of natural wind driven
ventilation is always the preferred choice by the architects and building designers to
generate indoor air movement and improve their building thermal environment
However nowadays in the conditions of warmer climate and denser built environment
or in building surrounded by thick trees the conventional concept of wind driven
ventilation does not always successfully apply The main solution could lie on providing
effective outlet area at the top of the building and use a stack ventilation strategy to
induce vertical air movement In buoyancy driven natural ventilation the pressure
difference created by different densities in the warm and cold air inside and outside a
building and in different zones inside the same building The exchange of air will
happen through one or more opening in the roof or outer wall (Figure 25) In addition
18
this type of natural ventilation could be done in single ndash sided and cross ndash ventilation
designs
Figure 25 Buoyancy (stack) ventilation
2521 Calculation of Buoyancy Driven Natural Ventilation
Natural ventilation by thermal buoyancy is the air exchange between two or more zones
with different densities due to different temperatures Ventilation by air exchange
implies openings between the zones and the opening arrangement can either be separate
openings in different levels or it can be a single large vertical or horizontal opening The
temperature differences can occur due to heating one or more of the zones
The external and internal pressure distribution can be described as below [11]
119875 = 1198750 minus 1205880 119892 119867 (25)
where 119875 the external or internal pressure [Pa]
1198750 the pressure at a reference level (floor) [Pa]
1205880 the external or internal air density at a reference level [kgm3]
119892 the gravitational acceleration [ms2]
19
119867 the height above the reference level [m]
Thus the buoyancy ndash induced pressure difference∆119875 across an opening at height H can
be calculated as following where expressions (i) for internal and (e) for external
∆119875 = 1198751198900 minus 1198751198940 minus (120588119890 minus120588119894) 119892 119867 (26)
At the neutral plane (119867 = 1198670) where ∆119875 = 0 expression (26) becomes
1198751198900 minus 1198751198940 = (120588119890 minus120588119894) 119892 1198670 (27)
From the Equation of state it can be found that
120588119890 minus120588119894
120588119894 cong
119879119894 minus119879119890
119879119890
and
120588119890 minus120588119894
120588119890 cong
119879119894 minus119879119890
119879119894 (28)
And Eq (27) can therefore be rewritten to
1198751198900 minus 1198751198940 = 119875119894 119892 1198670 119879119894 minus 119879119890
119879119890 (29)
Likewise the pressure in the height H1 where ΔPne0 can be found as
∆119875119867=1198671 = 1198751198900 minus 120588119894 119892 1198671Ti minusTe
Te (210)
If equation (29) is inserted into equation (210) the pressure difference in H1 can be
expressed only from the internal and external temperatures the gravitational acceleration
and the density of air Positive values of the pressure difference in equation (210) (H1
below the neutral plan) shows that the pressure outside the building is higher than inside
∆119875119867=1198671 = 120588119894 119892 1198670Ti minus Te
Te minus 120588119894 119892 1198671
Ti minus Te
Te
= 120588119894 119892 (1198670 minus 1198671) Ti minusTe
Te (211)
20
From Eq (211) it is seen that the pressure difference is increased with increasing height
difference and increasing temperature difference
From the pressure difference the airflow can be found
119876 = 119862119863 119860 radic2|∆119875|
120588 (212)
where 119862119863 is the discharge coefficient and in the area between 06 and 075
253 Combination of Buoyancy and Wind
When both mechanisms are operating they both create pressure differences across the
building Depending upon actual conditions the pressure created across any aperture
will may be additive or opposite The flow rate and direction through and aperture will
depend upon the sum of pressures cross the aperture Calculation of the combined
effects is complex even for a simple building but calculating the flow rate for each
mechanism separately and taking the larger Figure may make a reasonable
approximation of the total ventilation rate
Most often the pressure in natural ventilation will be created as a combination of
thermal buoyancy and wind The total pressure across an opening is found as a
summation of the pressure created by buoyancy and wind
∆119875 = ∆119875119908119894119899119889 + ∆119875119887119906119900119910119886119899119888119910 (213)
21
254 Examples of Naturally Ventilated Buildings
Natural ventilation has been the dominant way to ventilate residencies since the ancient
times Successful example can be traced in the wind catchers in the architecture of the
Middle East Pakistan and India which exhibit the impact of the traditional Persian
architecture on these regions (Figure 26) Wind catcher is placed and oriented in the
wind direction and it has two opening in opposite directions Air moves in from one
opening circulating down and then go out form the opposite opening
Figure 26 Wind catchers in Yazd City
There is a trend for more buildings to incorporate natural ventilation as a scheme
for cooling and ventilating part of or a whole building Some of these buildings
emphasize design characteristics making them stand out in a typical streetscape while
others lean toward a more traditional building faccedilade Both strategies work and
examples of each are presented here for comparison Most naturally ventilated buildings
are located in Europe and the examples here are from the United Kingdom and the
Netherlands [12]
Of the examples one in particular accentuates the design characteristics on the
faccedilade of the building the home of the British Research Establishment (BRE) This
building incorporates stack vents into the ventilation scheme and makes them
22
pronounced in the architecture of the building The BRE designed by Fielden Clegg
and built in 1997 is well known for its low energy usage and efficient design It
combines the use of thermal mass cross ventilation and stacks to passively cool the
building The buildingrsquos stacks not only are a prominent feature in its faccedilade but also
assist in driving buoyancy and stack driven air flow They are constructed of glass
block shown in Figure 27 creating a greenhouse effect that warms up air within the
shaft which as it rises draws in cooler air through other openings on the faccedilade The
occupants have control over the lights and window openings as shown in Figure 28
Figure 27 BRE Office Building Facades with Stacks Figure 28 Building interior
26 Wind Lens
Wind lens is a diffuser shroud equipped with a brim The concept of wind lens
technology is that if local wind speed can be accelerated by capturing and concentrating
the wind with some mechanism there will be a hope for utilizing the wind power in a
more efficient way [13] This is because a low pressure region due to a strong vortex
formation behind the broad brim draws more mass flow to the diffuser (Figures 29
210)
23
Figure 29 The wind lens concept
Figure 210 Wind lens turbines
261 Air Catcher
Air catcher is the proposed geometry that will be used in present study to enhance the
buoyancy driven natural ventilation (Figure 211) Air catcher is an airfoil shaped cross
sectional area design to be used in this study by using five different airfoils to study the
hydrodynamics over these airfoils at different angels of attack The principal of air
24
catcher is similar to aerodynamics of an airplane wing As a result of the airflow pattern
over the wing decelerated and accelerated zones are developed The flow induced
positive pressure below and negative pressure above the wing in what is called the
Bernoulli Effect (Figure 212)
Figure 211 Air catcher
Figure 212 Bernoulli effect
65
REFERENCES
[1] Continental Automated Building Association (2009) Transforming the market
Energy efficiency in buildings World Business Council for Sustainable
Development
[2] Energy Efficiency and Renewable Energy US Department of Energy
httpwww1eereenergygovbuildingscommercialhvachtmlLast accessed on
October302014
[3] ASHRAE 62-1999 Ventilation for Acceptable Indoor Air Quality USA1999
[4] ISO 7730 1994 Moderate Thermal Environments Geneve 1994
[5] Himdan EE(2010)Air Freshness Requirement of Selected Groups of
Occupants Comparison between Malaysian and Arab Subject MSc Thesis
Universiti Tun Hussein Onn Malaysia
[6] ASHRAE Standard 55- 1992 Thermal Environmental Conditions for Human
Occupancy USA1992
[7] DouglasJF Gasiorek JM and Swaffield(1996)Fluid Mechanics3rd
edition
Longman Singapore
[8] Larsen T S(2006)Natural Ventilation Driven by Wind and Temperature
Difference PhD thesis Aalborg University Denmark
[9] Pong C O(2010)Computational Fluid Dynamics Simulations on the Natural
Ventilation Behaviour within a Building Cluster Master thesis The University
of Hong Kong
66
[10] PapadakisGMermierMMenesesJBoulardT(1996)Measurement and
Analysis of Air Exchange Rates in a Green House with Continuous Roof and
Side openings Journal of Agricultural Engineering and Resources1996 (36)pp
219-228
[11] Li Zhigang(2014)Characteristic of Buoyancy Driven Natural Ventilation
Through Horizontal Openings PhD thesis Aalborg University Denmark
[12] Walker C E (2006)Methodology for the Evaluation of Natural Ventilation in
Buildings Using a Reduced-Scale Air Model PhD Thesis Massachusetts
Institute of Technology USA
[13] OhyaY KarasudaniT and ZhangX A Shrouded Wind Turbine Generating
High Output Power with Wind Lens Technology Retrieved on October282014
from httpwwwontario-seaorg Storage27 1850 pdf
[14] Stern FMuste M HouserD Wilson M and GoshS Measurement of
Pressure Distribution and Forces Acting on an Airfoil Retrieved on October
26 2014 from www userengineeringuiowaedu~cfdpdfs57-020airfoildoc
[15] Aerodynamic Background Retrieved on November 252014 form
httpscoursescitcornelledu mae5070 AeroBackgroundpdf
[16] Jiang Y Chen Q(2003) Buoyancy-Driven Single-Sided Natural Ventilation
in Building with Large Openings International Journal of Heat and Mass
Transfer 46(6) pp 973-988
[17] Bansal NK Mathur Rajesh Bhandari MS(1993) Solar Chimney for
Enhanced Stack Ventilation Center for energy Studies Indian Institute of
Technology Delhi India
[18] Li R Pitts A LiY(2007) Buoyancy ndash Driven Natural Ventilation of a
Room with Large OpeningUniversity of Sheffield Sheffield UK
67
[19] Liping W AnguiL(2006)A Numerical Study of Trombe Wall for Enhancing
Stack Ventilation in Buildings PLEA 2006 The 3rd
Conference on Passive and
Low Energy Architecture Geneva Switzerland
[20] Hussain S Oosthuizen P H(2013)Numerical Investigations of Buoyancy ndash
Driven Natural Ventilation in a Simple Three ndash Storey Atrium Building Queenrsquos
University Canada
[21] Lee H K Strand R K(2009) Enhancement of Natural Ventilation in
Buildings Using a Thermal Chimney Energy and Buildings (41) pp 615-612
[22] Brown WG(1962)Natural Convection Through Rectangular in Partitions-2
Horizontal Partitions IntJ Heat Mass Transfer Vol5
[23] Blomqvsit C SandbergM(2002)A Note on Air Movements through
Horizontal Opening in buildings Roomventrsquo2002
[24] AbdWahabI Ismail L H(2011)Natural Ventilation Approach in Designing
a Tropical House Universiti Tun Hussein Onn Malaysia
[25] Zhou Y Alam MD Mahbub YangHXGuo H Wood DH(2011)
Fluid Forces on a Very Low Reynolds Number Airfoil and their Prediction
International Journal of Fluid and Heat Flow (32) pp329-339
[26] Gerakopulos Ryan Boutilier Michael SH Yarusevych S(2010)
Aerodynamic Characterization of a NACA 0018 Airfoil at Low Reynolds
Number 40th Fluid Dynamics Conference and Exhibit 28 June ndash 1 July
2010Chicago Illinois
[27] MateescuD Abdo M(2010)Analysis of Flows Past Airfoils at Very Low
Reynolds Numbers McGill University Montreal Quebec Canada
[28] Genc MS KarasuI AcikelHH(2012)An Experimental Study on
Aerodynamics of NACA 2415 airfoil at low Reynolds Numbers Experimental
Thermal and Fluid Science (39) pp 252-264
68
[29] BrbasonM ReiterS(2010)About the Choice of Turbulence Model in
Building Physics Simulation 7th International conference of indoor air quality
ventilation and energy conservation in buildings Syracuse New York

2
According to the World Business Council for Sustainable Development
(WBCSD) buildings account for up to 40 of the worldrsquos energy use [1] Breaking
down the energy consumption of buildings reveals that Heating Ventilation and Air
Conditioning (HVAC) systems account for up to 60 of domestic buildings energy
consumption [2] This represents a significant opportunity for reducing the buildings
energy consumption and carbon footprint
Natural ventilation application may play a key role in buildings energy
associated with achieving good indoor air quality (IAQ) to the interior spaces In
addition naturally ventilated buildings also have lower capital and lower operational
costs In general there are two types of natural ventilation wind driven and buoyancy
driven natural ventilation
12 Problem Statement
In urban area where most of the occupied building are surrounded by dense buildings or
in the climate where no wind blowing there will be a poor airflow for wind driven
natural ventilation In this case buoyancy driven ventilation is preferred However
buoyancy driven natural ventilation is not effective because it relies on buoyancy forces
which are naturally weak what will result a poor air circulation so focus should be paid
to enhance the performance of buoyancy driven natural ventilation The present study
focuses on the feasibility study of a novel design known as air catcher with the aim to
enhance the flow driven by buoyancy in natural ventilation
3
13 Significant of Study
About 40 of the total energy consumption is used for air conditioning and mechanical
ventilation of buildings Natural ventilation plays an important role in reducing the
operational and maintenance costs of buildings because it does not require any amount
of energy The importance of this study comes from studying the feasibility of air
catcher in enhancing the air circulation and to propose the optimum geometry helping in
improving the buoyancy driven natural ventilation in case of poor outdoor wind
blowing
14 Objectives of Study
The present study will be aligned based on several objectives as
(a) To study the flow phenomenon through different airfoil shapes at low Reynolds
number
(b) To determine the effect of air catcher geometrical parameters on the flow
phenomena and
(c) To propose optimum geometrical parameters set of the air catcher for natural
ventilation application
4
15 Scope of Study
(a) The study will make use of the commercial Computational Fluid Dynamics
software ANSYS CFX to provide information on feasibility of the air catcher
(b) Five different low Reynolds number airfoil shapes will be considered and
(c) Four different values of the diameter D (075Cax1 Cax 25Cax and 3Cax) and
three angles of attack α (0deg10deg20deg) will be considered for each airfoil
Figure 11 Five airfoils at angle of attack α=0deg
Bergey BW3 MA 409
S1223
S7055
NACA 2415
5
Figure 12 Examples of the airfoil at different angles of attack
α = 20deg
α = 10deg α = 0deg
6
CHAPTER 2
LITERATURE REVIEW
21 Introduction
In this chapter important parameters in ventilation system will be explained Initially
discussion on the indoor air quality will be made followed by details on natural
ventilation types of natural ventilation the mechanism and driving forces of each type
In addition details about the air catcher and airfoils will be discussed and related to
studies of natural ventilation and airfoils
7
22 Indoor Air Quality
American Society of Heating Refrigeration and Air Conditioning Engineers in
ASHRAE Standard 62 ndash 1999 Ventilation for Acceptable Indoor Air Quality has
defined the acceptable indoor air quality (IAQ) as ldquoair in which there are no known
contaminants at harmful concentrations as determined by cognizant authorities and with
which a substantial majority (80 or more) of the people exposed do not express
dissatisfactionrdquo [3]
The overall quality of indoor air is influenced by thermal acceptability and air
contaminants The factors affecting thermal acceptability include temperature relative
humidity and air movement as these physical parameters could affect peoplersquos
perception of the IAQ Air contaminants include an enormous range of substances and
biological organisms generated by the building materials human activities office
equipment and also activities outside the building from the outdoor environment The
common air contaminants include airborne particles volatile organic compounds
tobacco smoke asbestos formaldehyde radon combustion gases ozone micro ndash
organisms respiratory products and body odors [4]
23 Indoor Thermal Environment
Thermal comfort is defined in ISO 7730 as ldquothat condition of mind which expresses
satisfaction with the thermal environmentrdquo Dissatisfaction may be caused by warm or
cool discomfort of the body as a whole But thermal dissatisfaction may also be caused
by an unwanted cooling or heating of one particular part of the body Local discomfort
may also be caused by an abnormal high vertical temperature difference between head
and ankles by too warm or cool a floor or by too high a radiant temperature asymmetry
8
Thermal neutrality is the first comfort condition It means that a person feels
neither too warm nor too cold When the skin temperature falls below 34 degC the cold
sensors of the human body begin to send impulses to the brain If the temperature
continues to fall the impulses increase in number The number of impulses is also a
function of how quickly the skin temperature falls the faster temperature drop the
greater the number of impulses being sent Similarly the heat sensors in the skin send
impulses to the brain when the temperature exceeds 37degC and the number of impulses
increased with temperature increases the number of impulses increase It is believed that
it is the signals from these two sensor systems that form the basis for human body
evaluation of the thermal environment
Due to individual differences it is impossible to specify a thermal environment
that will satisfy everybody There will always be a percentage of dissatisfied occupants
But it is possible to specify environment predicted to be acceptable by a certain
percentage of the occupants
Thermal comfort is affected by the thermal interaction between the body and
surrounding environment There are six primary factors that affect this thermal
interaction
(a) Air temperature
(b) Relative Humidity
(c) Air speed
(d) Mean radiant temperature (MRT)
(e) The operative temperature
(f) Metabolic rate
(g) Clothing insulation
The first four factors define the conditions of the surrounding environment while
the latter two factors represent ldquopersonalrdquo variables that can vary between people
exposed to the same environmental conditions [5]
9
231 Air Temperature
It is one of the basic IAQ measurements that have a direct impact on perceived comfort
According to ASHRAE Standard 55 the recommended air temperature that is perceived
as comfortable is ranges from 228 degC to 261degC in the summer and 20degC to 236 in the
winter [6]
232 Relative Humidity
Too little humidity in a space may create static build-up and people will sense that their
skin feel dry Too much humidity will make people feel sticky According to ASHRAE
Standard 55 indoor humidity levels should be maintained between 30 and 65 for
optimum comfort
233 Air Speed
One of the first checks in a comfort study is making sure that sufficient air is moving in
a space Air movement can affect human comfort level in that too fast air is perceived as
drafty or chilly and too slow may create a sensation of stuffiness
234 Mean Radiant Temperature Tmrt
The amount of radiant exchange between a person and the surrounding will be effective
on comfort Cold walls or windows may cause a person to feel cold on certain sensitive
10
parts of the body (suck as back of neck knee and ankle) even though the surrounding air
may be at a comfortable level Likewise warm surfaces such as stove or fire places may
cause a person to feel warmer than the surrounding air temperature would indicate This
phenomenon is known as ldquolocal cooling or local heatingrdquo
The basic index to describe the radiative condition in an environment is the mean
radiant temperature the mean temperature of individual exposed surfaces in the
environment The mean radiant temperature is commonly measured using a Vernonrsquos
Globe Thermometer which consists of a hollow sphere 6 inches in diameter flat back
paint coated and a thermocouple or thermometer bulb at its surrounding The
equilibrium temperature was assumed by the globe (globe temperature) result from a
balance in the convective and radiative heat exchange between the globe and its
surroundings The mean radiant temperature is estimated by combining the globe
temperature air temperature and velocity
1198791198981199031199054 = 119879119892
minus4 + 11986211988112 (119879119892 minus 119879119886 ) (21)
where 119879119898119903119905 Mean radiant temperature K
119879119892 Globe temperature
119879119886 Ambient air temperature K
119862 0247 x 109
119881 Air speed ms
235 The Operative Temperature Top
The operative temperature is the average of the mean radiant temperature and ambient
air temperature weighted by their respective practical applications it is the mean of the
radiant and dry bulb temperature and is sometimes referred to as the adjusted dry bulb
temperature It is the uniform temperature of an imaginary enclosure with which and
11
individual exchanges the same heat by radiation and convection as in the actual
environment The effective and operative temperatures are used in defining comfort
condition in ASHRAE Comfort Zone
119879119900119901 = 119879119886 + 119879119898119903119905
2 (22)
236 Metabolic Rate
Human activity levels can be expressed in term Metabolic Rate and measured in (met)
units Table 21 presents probable metabolic rates for various typical activities by ISO
7730
Table 21 Metabolic Rates according to ISO 7730
Activity Metabolic Rates
Wm2 met
Reclining
Seated relaxed
Sedentary activity (office dwelling school laboratory)
Standing light activity (shopping laboratory light industry)
Standing medium activity (shop assistant domestic work
machine work)
Walking on the level
1 kmh
2 kmh
3 kmh
46
58
70
93
116
110
140
16
08
1
12
16
2
19
24
28
12
ASHRAE standard 55- 1992 assumed an average adult effective surface area for
heat transfer of 196 ft2 And as 1 met = 184 BTU(hrft
2) therefore will dissipate
approximately 360 BTUhr (106 W) when functioning in a quite seated manner
237 Clothing Insulation
The other personal variable that affects comfort is the type and amount of clothing that a
person is wearing Clothing insulation is usually described as a single equivalent
uniform layer over the whole body Its insulating value is expressed in term (clo) units
1 clo = 0155 m2degCW A heavy two ndash piece business suit with accessories has an
insulation value of about 1 clo whereas a pair of shorts has about 005 clo
24 Fresh Air Requirement
One of the most important factors in delivering comfort is freshness of the conditioned
air If the same air were circulated over and over again it would become staled and make
the occupants very uncomfortable ASHRAE Standard 62 ndash 1999 specified that the
minimum fresh air supplied to each person in a building should be at least 15 cfm (8 ls)
of fresh air Table 22 shows the amount of fresh air to be supplied based on the type of
space and level of activity
13
Table 22 Fresh air ventilation requirement (ASHRAE 1999)
Application cfm per person ls per person
Dining room 20 10
Hotel room 30 per room 15 per room
Offices conference room 20 10
Public smoking lunge 60 30
Auditorium 15 8
School classroom 15 8
Hospital room 25 13
Table 23 Guideline on Minimum Ventilation Rates [7]
Air space per person
(m3)
Fresh air supply per person (Ls)
Minimum No smoking Smoking
3 113 17 226
6 71 107 142
9 52 78 104
12 4 6 8
14
25 Natural Ventilation
Natural ventilation relies on pressure differences to move fresh air through buildings
Pressure differences can be caused by wind or the buoyancy effect created by
temperature differences or a combination of these two [8] The flow of air through a
building depends on the following factors
(a) The temperature difference between the air inside and outside the building
(b) The difference in height between the air inlet and the exhaust vents
(c) Convection currents rising from heat sources (eg people computers lighting)
(d) The rate at which heat is produced or released inside the building
(e) The size position and construction of the building
(f) Wind speed and direction
251 Wind Driven Natural Ventilation
Wind can blow air through openings in the wall on the windward side of the building
and suck air out of openings on the leeward side and the roof Wind causes a positive
pressure on the windward side and a negative pressure on the leeward side of buildings
To equalize pressure fresh air will enter any windward opening and be exhausted from
any leeward opening (Figures 21 and 22)
15
Figure 21 Negative and positive pressure due to wind
Figure 22 Pressure differences created by wind on the building
The pressure created by the wind on the building is calculated by multiplying a non-
dimensional pressure coefficient (119862119875) with the dynamic pressure
Stale Air Out (Micro Climate) Fresh Air In
+ Windward
(Macro Climate) - Leeward
16
119875119908119894119899119889 = 1198621198751
2 120588119890 119880119903119890119891
2 (23)
where 119875119908119894119899119889 wind induced pressure [Pa]
119862119875 pressure coefficient [-]
120588119890 is the outdoor air density [kgm3]
1198801199031198901198912 is the wind speed at a reference height [ms]
The 119862119875 coefficient is determined by the shape of the building the wind direction and the
surrounding terrain
The pressure difference between the inside and the outside of the building can be
calculated as
∆119875119908119894119899119889 = 1198621198751
2 120588119890 119880119903119890119891
2 minus 119875119894 (24)
where 119875119894 is the pressure inside the building [Pa]
There are two types of wind driven natural ventilation single ndash sided ventilation and
cross ndash ventilation [9] In a single ndash sided ventilation opening(s) isare only installed on
one side of the chamber Fresh air enters and exhaust air exits on the same side (Figure
23) sometimes through the same single opening Turbulence often plays an important
role in single ndash sided ventilated enclosure
Figure 23 Single ndash sided ventilation
17
For cross ventilation air moves from the windward faccedilade through opening on
two sides of the enclosed space (Figure 24) There is a simple rule of thumb stating that
cross ventilation can perform well in the width of the enclosed space is less than five
times the ceiling height
Figure 24 Cross ventilation
252 Buoyancy Driven Natural Ventilation
Since many studies have shown that wind effect is far dominant than temperature
buoyancy (stack effect) in inducing air flow [10] the application of natural wind driven
ventilation is always the preferred choice by the architects and building designers to
generate indoor air movement and improve their building thermal environment
However nowadays in the conditions of warmer climate and denser built environment
or in building surrounded by thick trees the conventional concept of wind driven
ventilation does not always successfully apply The main solution could lie on providing
effective outlet area at the top of the building and use a stack ventilation strategy to
induce vertical air movement In buoyancy driven natural ventilation the pressure
difference created by different densities in the warm and cold air inside and outside a
building and in different zones inside the same building The exchange of air will
happen through one or more opening in the roof or outer wall (Figure 25) In addition
18
this type of natural ventilation could be done in single ndash sided and cross ndash ventilation
designs
Figure 25 Buoyancy (stack) ventilation
2521 Calculation of Buoyancy Driven Natural Ventilation
Natural ventilation by thermal buoyancy is the air exchange between two or more zones
with different densities due to different temperatures Ventilation by air exchange
implies openings between the zones and the opening arrangement can either be separate
openings in different levels or it can be a single large vertical or horizontal opening The
temperature differences can occur due to heating one or more of the zones
The external and internal pressure distribution can be described as below [11]
119875 = 1198750 minus 1205880 119892 119867 (25)
where 119875 the external or internal pressure [Pa]
1198750 the pressure at a reference level (floor) [Pa]
1205880 the external or internal air density at a reference level [kgm3]
119892 the gravitational acceleration [ms2]
19
119867 the height above the reference level [m]
Thus the buoyancy ndash induced pressure difference∆119875 across an opening at height H can
be calculated as following where expressions (i) for internal and (e) for external
∆119875 = 1198751198900 minus 1198751198940 minus (120588119890 minus120588119894) 119892 119867 (26)
At the neutral plane (119867 = 1198670) where ∆119875 = 0 expression (26) becomes
1198751198900 minus 1198751198940 = (120588119890 minus120588119894) 119892 1198670 (27)
From the Equation of state it can be found that
120588119890 minus120588119894
120588119894 cong
119879119894 minus119879119890
119879119890
and
120588119890 minus120588119894
120588119890 cong
119879119894 minus119879119890
119879119894 (28)
And Eq (27) can therefore be rewritten to
1198751198900 minus 1198751198940 = 119875119894 119892 1198670 119879119894 minus 119879119890
119879119890 (29)
Likewise the pressure in the height H1 where ΔPne0 can be found as
∆119875119867=1198671 = 1198751198900 minus 120588119894 119892 1198671Ti minusTe
Te (210)
If equation (29) is inserted into equation (210) the pressure difference in H1 can be
expressed only from the internal and external temperatures the gravitational acceleration
and the density of air Positive values of the pressure difference in equation (210) (H1
below the neutral plan) shows that the pressure outside the building is higher than inside
∆119875119867=1198671 = 120588119894 119892 1198670Ti minus Te
Te minus 120588119894 119892 1198671
Ti minus Te
Te
= 120588119894 119892 (1198670 minus 1198671) Ti minusTe
Te (211)
20
From Eq (211) it is seen that the pressure difference is increased with increasing height
difference and increasing temperature difference
From the pressure difference the airflow can be found
119876 = 119862119863 119860 radic2|∆119875|
120588 (212)
where 119862119863 is the discharge coefficient and in the area between 06 and 075
253 Combination of Buoyancy and Wind
When both mechanisms are operating they both create pressure differences across the
building Depending upon actual conditions the pressure created across any aperture
will may be additive or opposite The flow rate and direction through and aperture will
depend upon the sum of pressures cross the aperture Calculation of the combined
effects is complex even for a simple building but calculating the flow rate for each
mechanism separately and taking the larger Figure may make a reasonable
approximation of the total ventilation rate
Most often the pressure in natural ventilation will be created as a combination of
thermal buoyancy and wind The total pressure across an opening is found as a
summation of the pressure created by buoyancy and wind
∆119875 = ∆119875119908119894119899119889 + ∆119875119887119906119900119910119886119899119888119910 (213)
21
254 Examples of Naturally Ventilated Buildings
Natural ventilation has been the dominant way to ventilate residencies since the ancient
times Successful example can be traced in the wind catchers in the architecture of the
Middle East Pakistan and India which exhibit the impact of the traditional Persian
architecture on these regions (Figure 26) Wind catcher is placed and oriented in the
wind direction and it has two opening in opposite directions Air moves in from one
opening circulating down and then go out form the opposite opening
Figure 26 Wind catchers in Yazd City
There is a trend for more buildings to incorporate natural ventilation as a scheme
for cooling and ventilating part of or a whole building Some of these buildings
emphasize design characteristics making them stand out in a typical streetscape while
others lean toward a more traditional building faccedilade Both strategies work and
examples of each are presented here for comparison Most naturally ventilated buildings
are located in Europe and the examples here are from the United Kingdom and the
Netherlands [12]
Of the examples one in particular accentuates the design characteristics on the
faccedilade of the building the home of the British Research Establishment (BRE) This
building incorporates stack vents into the ventilation scheme and makes them
22
pronounced in the architecture of the building The BRE designed by Fielden Clegg
and built in 1997 is well known for its low energy usage and efficient design It
combines the use of thermal mass cross ventilation and stacks to passively cool the
building The buildingrsquos stacks not only are a prominent feature in its faccedilade but also
assist in driving buoyancy and stack driven air flow They are constructed of glass
block shown in Figure 27 creating a greenhouse effect that warms up air within the
shaft which as it rises draws in cooler air through other openings on the faccedilade The
occupants have control over the lights and window openings as shown in Figure 28
Figure 27 BRE Office Building Facades with Stacks Figure 28 Building interior
26 Wind Lens
Wind lens is a diffuser shroud equipped with a brim The concept of wind lens
technology is that if local wind speed can be accelerated by capturing and concentrating
the wind with some mechanism there will be a hope for utilizing the wind power in a
more efficient way [13] This is because a low pressure region due to a strong vortex
formation behind the broad brim draws more mass flow to the diffuser (Figures 29
210)
23
Figure 29 The wind lens concept
Figure 210 Wind lens turbines
261 Air Catcher
Air catcher is the proposed geometry that will be used in present study to enhance the
buoyancy driven natural ventilation (Figure 211) Air catcher is an airfoil shaped cross
sectional area design to be used in this study by using five different airfoils to study the
hydrodynamics over these airfoils at different angels of attack The principal of air
24
catcher is similar to aerodynamics of an airplane wing As a result of the airflow pattern
over the wing decelerated and accelerated zones are developed The flow induced
positive pressure below and negative pressure above the wing in what is called the
Bernoulli Effect (Figure 212)
Figure 211 Air catcher
Figure 212 Bernoulli effect
65
REFERENCES
[1] Continental Automated Building Association (2009) Transforming the market
Energy efficiency in buildings World Business Council for Sustainable
Development
[2] Energy Efficiency and Renewable Energy US Department of Energy
httpwww1eereenergygovbuildingscommercialhvachtmlLast accessed on
October302014
[3] ASHRAE 62-1999 Ventilation for Acceptable Indoor Air Quality USA1999
[4] ISO 7730 1994 Moderate Thermal Environments Geneve 1994
[5] Himdan EE(2010)Air Freshness Requirement of Selected Groups of
Occupants Comparison between Malaysian and Arab Subject MSc Thesis
Universiti Tun Hussein Onn Malaysia
[6] ASHRAE Standard 55- 1992 Thermal Environmental Conditions for Human
Occupancy USA1992
[7] DouglasJF Gasiorek JM and Swaffield(1996)Fluid Mechanics3rd
edition
Longman Singapore
[8] Larsen T S(2006)Natural Ventilation Driven by Wind and Temperature
Difference PhD thesis Aalborg University Denmark
[9] Pong C O(2010)Computational Fluid Dynamics Simulations on the Natural
Ventilation Behaviour within a Building Cluster Master thesis The University
of Hong Kong
66
[10] PapadakisGMermierMMenesesJBoulardT(1996)Measurement and
Analysis of Air Exchange Rates in a Green House with Continuous Roof and
Side openings Journal of Agricultural Engineering and Resources1996 (36)pp
219-228
[11] Li Zhigang(2014)Characteristic of Buoyancy Driven Natural Ventilation
Through Horizontal Openings PhD thesis Aalborg University Denmark
[12] Walker C E (2006)Methodology for the Evaluation of Natural Ventilation in
Buildings Using a Reduced-Scale Air Model PhD Thesis Massachusetts
Institute of Technology USA
[13] OhyaY KarasudaniT and ZhangX A Shrouded Wind Turbine Generating
High Output Power with Wind Lens Technology Retrieved on October282014
from httpwwwontario-seaorg Storage27 1850 pdf
[14] Stern FMuste M HouserD Wilson M and GoshS Measurement of
Pressure Distribution and Forces Acting on an Airfoil Retrieved on October
26 2014 from www userengineeringuiowaedu~cfdpdfs57-020airfoildoc
[15] Aerodynamic Background Retrieved on November 252014 form
httpscoursescitcornelledu mae5070 AeroBackgroundpdf
[16] Jiang Y Chen Q(2003) Buoyancy-Driven Single-Sided Natural Ventilation
in Building with Large Openings International Journal of Heat and Mass
Transfer 46(6) pp 973-988
[17] Bansal NK Mathur Rajesh Bhandari MS(1993) Solar Chimney for
Enhanced Stack Ventilation Center for energy Studies Indian Institute of
Technology Delhi India
[18] Li R Pitts A LiY(2007) Buoyancy ndash Driven Natural Ventilation of a
Room with Large OpeningUniversity of Sheffield Sheffield UK
67
[19] Liping W AnguiL(2006)A Numerical Study of Trombe Wall for Enhancing
Stack Ventilation in Buildings PLEA 2006 The 3rd
Conference on Passive and
Low Energy Architecture Geneva Switzerland
[20] Hussain S Oosthuizen P H(2013)Numerical Investigations of Buoyancy ndash
Driven Natural Ventilation in a Simple Three ndash Storey Atrium Building Queenrsquos
University Canada
[21] Lee H K Strand R K(2009) Enhancement of Natural Ventilation in
Buildings Using a Thermal Chimney Energy and Buildings (41) pp 615-612
[22] Brown WG(1962)Natural Convection Through Rectangular in Partitions-2
Horizontal Partitions IntJ Heat Mass Transfer Vol5
[23] Blomqvsit C SandbergM(2002)A Note on Air Movements through
Horizontal Opening in buildings Roomventrsquo2002
[24] AbdWahabI Ismail L H(2011)Natural Ventilation Approach in Designing
a Tropical House Universiti Tun Hussein Onn Malaysia
[25] Zhou Y Alam MD Mahbub YangHXGuo H Wood DH(2011)
Fluid Forces on a Very Low Reynolds Number Airfoil and their Prediction
International Journal of Fluid and Heat Flow (32) pp329-339
[26] Gerakopulos Ryan Boutilier Michael SH Yarusevych S(2010)
Aerodynamic Characterization of a NACA 0018 Airfoil at Low Reynolds
Number 40th Fluid Dynamics Conference and Exhibit 28 June ndash 1 July
2010Chicago Illinois
[27] MateescuD Abdo M(2010)Analysis of Flows Past Airfoils at Very Low
Reynolds Numbers McGill University Montreal Quebec Canada
[28] Genc MS KarasuI AcikelHH(2012)An Experimental Study on
Aerodynamics of NACA 2415 airfoil at low Reynolds Numbers Experimental
Thermal and Fluid Science (39) pp 252-264
68
[29] BrbasonM ReiterS(2010)About the Choice of Turbulence Model in
Building Physics Simulation 7th International conference of indoor air quality
ventilation and energy conservation in buildings Syracuse New York
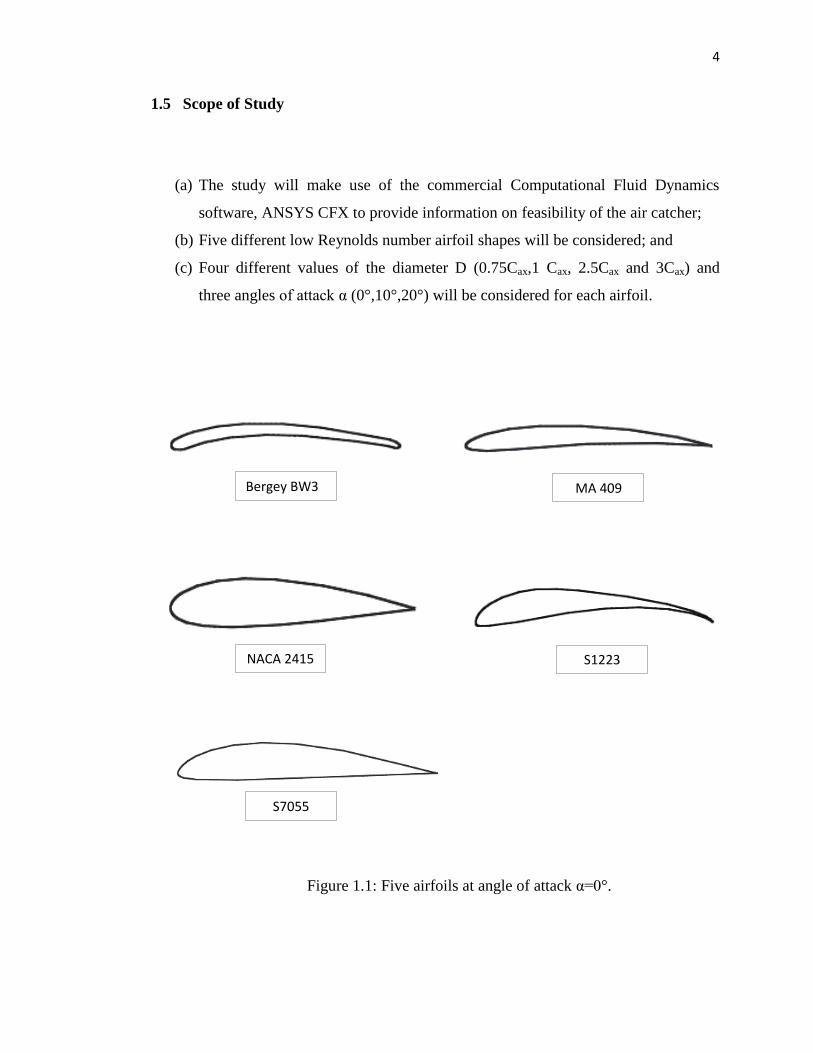
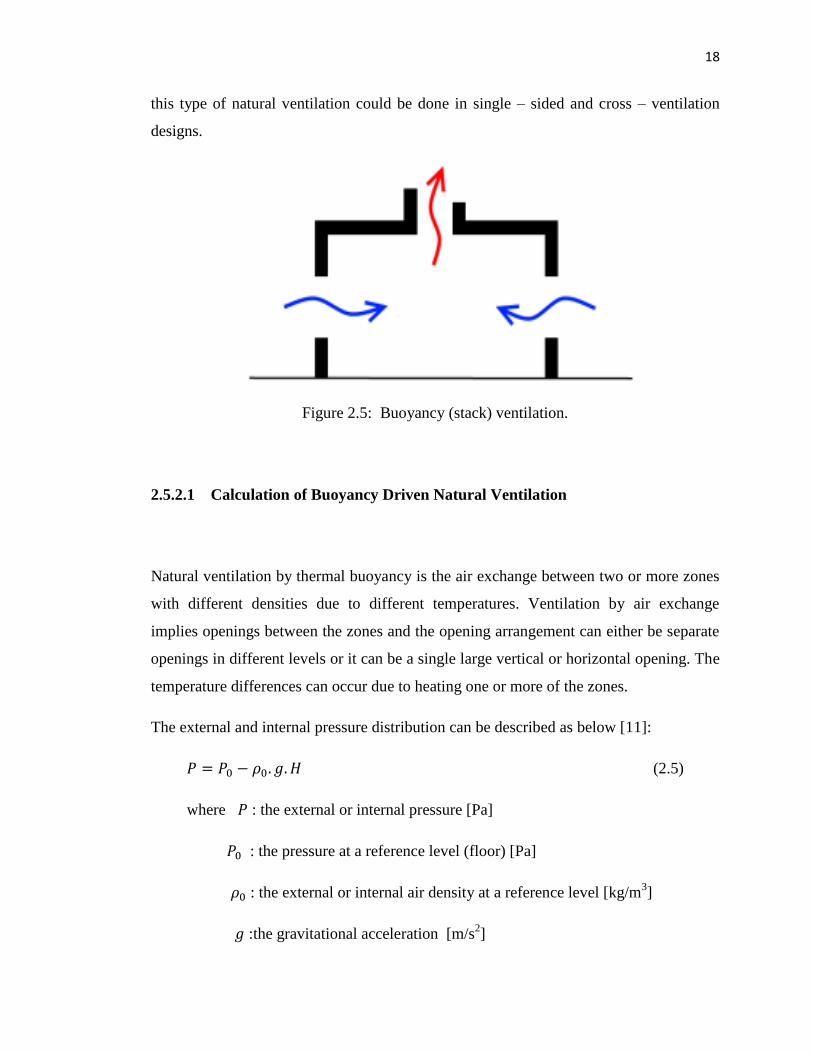

68
[29] BrbasonM ReiterS(2010)About the Choice of Turbulence Model in
Building Physics Simulation 7th International conference of indoor air quality
ventilation and energy conservation in buildings Syracuse New York