feasibility study - downstreamstrategies.com · feasibility study: poultry litter composting in the...
TRANSCRIPT
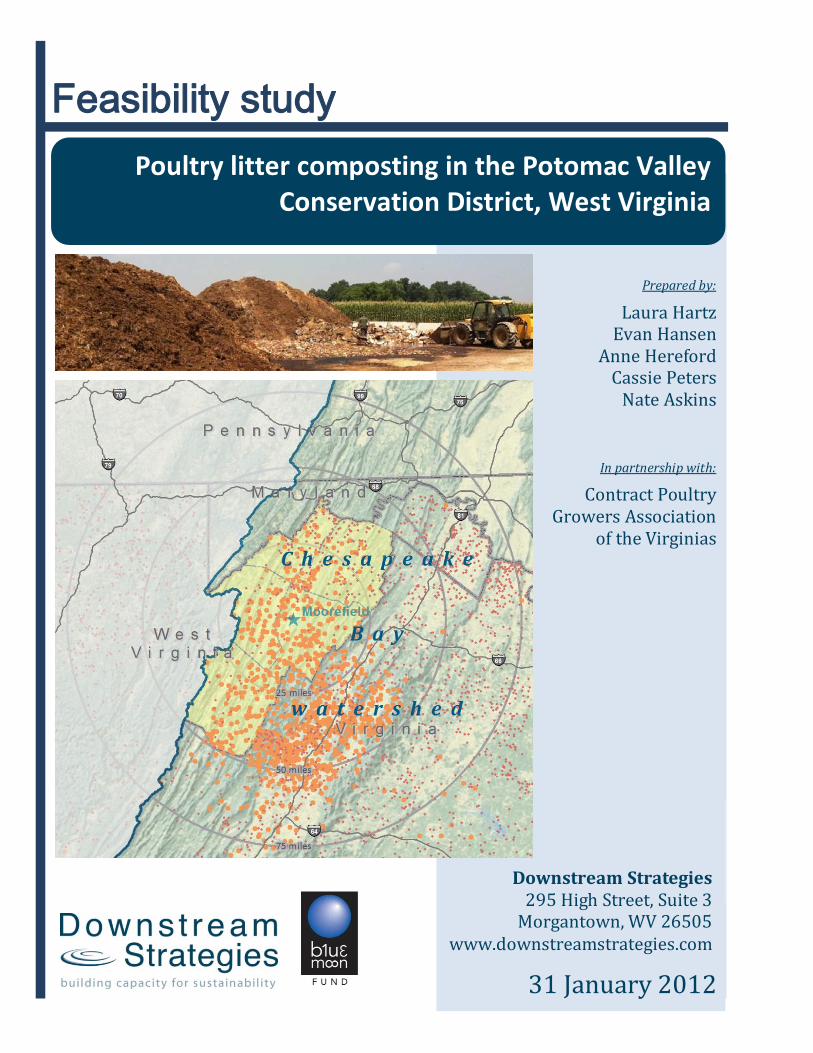
Feasibility study Poultry litter composting in the Potomac Valley
Conservation District, West Virginia
Prepared by:
Laura Hartz Evan Hansen
Anne Hereford Cassie Peters
Nate Askins
In partnership with:
Contract Poultry Growers Association
of the Virginias
31 January 2012
Downstream Strategies 295 High Street, Suite 3
Morgantown, WV 26505 www.downstreamstrategies.com
ii | P a g e
Feasibility study: Poultry litter composting in the Potomac Valley Conservation District, West Virginia Laura Hartz, Evan Hansen, Anne Hereford, Cassie Peters, Nate Askins
ABOUT THE AUTHORS Laura Hartz, M.S., Project Manager, Land Program, Downstream Strategies. Ms. Hartz focuses on issues related to agricultural science and policy, sustainability, and climate change. She is skilled in project management and the synthesis and presentation of scientific research and policy analysis.
Evan Hansen, M.S., President, Downstream Strategies. Mr. Hansen explores resource and environmental problems and solutions in three areas: water, energy, and land. He manages interdisciplinary research teams, performs quantitative and qualitative policy and scientific analyses, provides litigation support and expert testimony, develops computer tools, provides training, and performs field monitoring.
Anne Hereford, M.S., Project Environmental Scientist, Downstream Strategies. Ms. Hereford has authored watershed plans and has a strong background in environmental science. Her diverse experience includes work in geographic information system development, permit research, aqueous geochemical modeling, data analysis, water monitoring, and science education.
Cassie Peters, J.D., Agriculture and Food Policy Manager, Downstream Strategies. Ms. Peters focuses on issues related to sustainable agricultural methods, local food systems, and urban agriculture. She has a legal background with extensive experience analyzing sustainability plans, local food policies, organic production, and agricultural policies.
Nate Askins, B.S., Staff Environmental Analyst, Downstream Strategies. Mr. Askins is experienced in environmental management, visual communications, and information technology. He has a background in environmental protection, environmental microbiology, and sustainable design. He is also experienced in field-based data collection and management.
iii | P a g e
ACKNOWLEDGEMENTS This project was made possible through funding from the Blue Moon Fund; we greatly appreciate their support.
The project advisory team was critical to the success of this project. The project advisory team represents perspectives from non-governmental organizations, farmers, and businesses. Based on their diverse perspectives and histories, they contributed guidance, constructive feedback, and input, enabling a well-balanced and accurate assessment. Their membership includes: Mike Weaver, President, Contract Poultry Growers Association of the Virginias; Loren Martin, General Manager, Terra Gro; Suzy Friedman, Deputy Director of the Working Lands Program, Environmental Defense Fund; Connie Musgrove, Adviser, Chesapeake Bay Funders Network, Agriculture Initiative; and Carla Castagnero, President, Ag Recycle, Inc.
Members of the West Virginia Chapter of the Contract Poultry Growers Association of the Virginias provided invaluable feedback during the design and research process of this feasibility study; we are especially grateful for their contributions to this project.
Many Mid-Atlantic area composting companies provided information with regards to their operations; these companies are listed in the body of the report. We greatly appreciate their candor and assistance.
Three composting companies in particular—Oregon Dairy Organics, Ag Recycle, and Panorama Pay-Dirt—contributed more than the others by providing tours of their facilities, telephone communications, and frequent e-mail correspondence with the authors. This real-world perspective from successful composting companies grounded the report in the realities of composting. We thank them for their invaluable contributions.
We also appreciate the assistance of the following individuals: Joshua Faulkner, Agricultural Engineering Extension Specialist, West Virginia University Extension; Steve Murray, Founder, Panorama Pay-Dirt; Tom Basden, Nutrient Management Extension Specialist, West Virginia University Extension; Carla Hardy, Watershed Program Coordinator for the Moorefield Office, West Virginia Conservation Agency; Patrick Burch, Environmental Resources Specialist, Division of Water and Waste Management, West Virginia Department of Environmental Protection; Mark Hedrick, Nutrient Management Specialist, West Virginia Department of Agriculture; Sudhir Patel, Solid Waste Permitting Supervisor, West Virginia Department of Environmental Protection; Carol Throckmorton, West Virginia Solid Waste Management Board; Brian Fairchild and Casey Ritz, Associate Professors and Extension Poultry Scientists, University of Georgia College of Agriculture and Environmental Sciences; and Alan Collins, Professor and Chair, Agricultural and Resource Economics Program, West Virginia University.
iv | P a g e
TABLE OF CONTENTS EXECUTIVE SUMMARY AND KEY FINDINGS................................................................................................................ VI
1. INTRODUCTION AND BACKGROUND ................................................................................................................... 1
1.1 STUDY AREA ...................................................................................................................................................... 1 1.2 POULTRY PRODUCTION........................................................................................................................................ 2 1.3 COMPOSTING .................................................................................................................................................. 10 1.4 THE CHESAPEAKE BAY TOTAL MAXIMUM DAILY LOAD .............................................................................................. 14 1.5 REGULATORY ENVIRONMENT .............................................................................................................................. 14
2. INDUSTRY RESEARCH .......................................................................................................................................... 16
2.1 COMPOSTING IN THE MID-ATLANTIC REGION ........................................................................................................ 16 2.2 PANORAMA PAY-DIRT ...................................................................................................................................... 17 2.3 AG RECYCLE .................................................................................................................................................... 19 2.4 OREGON DAIRY ORGANICS ................................................................................................................................ 19
3. GEOSPATIAL ANALYSIS ....................................................................................................................................... 23
3.1 POTENTIAL SUPPLY OF COMPOSTING INPUTS .......................................................................................................... 23 3.2 POTENTIAL DEMAND FOR COMPOST PRODUCT ....................................................................................................... 25 3.3 FACILITY SITING CONSIDERATIONS ........................................................................................................................ 26
4. FINANCIAL ANALYSIS .......................................................................................................................................... 27
4.1 REVENUES ...................................................................................................................................................... 27 4.2 EXPENSES ....................................................................................................................................................... 29 4.3 PROFITABILITY ................................................................................................................................................. 31
5. CONCLUSIONS AND RECOMMENDATIONS ........................................................................................................ 35
5.1 CONCLUSIONS ................................................................................................................................................. 35 5.2 RECOMMENDATIONS ........................................................................................................................................ 35
REFERENCES ................................................................................................................................................................ 38
v | P a g e
TABLE OF TABLES Table 1: Annual poultry sales (thousand head) and poultry litter production (tons), 2007 ...................................4 Table 2: Existing composting companies in the Mid-Atlantic region .................................................................... 17 Table 3: Structure of potential operation................................................................................................................ 27
TABLE OF FIGURES Figure 1: Chesapeake Bay watershed and study area ...............................................................................................2 Figure 2: Poultry operations, 2007 .............................................................................................................................3 Figure 3: Survey response, annual poultry little production.....................................................................................6 Figure 4: Survey response, litter sold out of Chesapeake Bay watershed ...............................................................7 Figure 5: Survey response, desired litter price ..........................................................................................................8 Figure 6: Survey response, reasons for not selling more litter .................................................................................8 Figure 7: Survey response, alternative fertilization practices ...................................................................................9 Figure 8: Survey response, desired use of poultry litter ...........................................................................................9 Figure 9: Panorama Pay-Dirt, Earlysville, Virginia ................................................................................................... 18 Figure 10: Oregon Dairy farm, Lancaster County, Pennsylvania............................................................................ 20 Figure 11: Oregon Dairy Organics hoop storage ..................................................................................................... 21 Figure 12: Oregon Dairy Organics temporary stockpile at receiving pad ............................................................. 21 Figure 13: Poultry operations, 2007, close-up ........................................................................................................ 23 Figure 14: Potential sources for compost feedstocks ............................................................................................ 24 Figure 15: Potential compost sales venues and buyers ......................................................................................... 25 Figure 16: Revenues from food waste and finished compost................................................................................ 29 Figure 17: Annual operating expenses .................................................................................................................... 30 Figure 18: Net present values for various scenarios in which poultry litter is sold.............................................. 32 Figure 19: Net present values for various scenarios in which poultry litter is donated ...................................... 33 Figure 20: Decision tree for positive net present value for potential facility ....................................................... 36
ABBREVIATIONS BMP best management practice
CPGA Contract Poultry Growers Association of the Virginias
IRR internal rate of return
NPDES National Pollutant Discharge Elimination System
NPV net present value
TMDL total maximum daily load
US United States
USDA United States Department of Agriculture
USEPA United States Environmental Protection Agency
WIP Watershed Implementation Plan
WVDA West Virginia Department of Agriculture
WVDEP West Virginia Department of Environmental Protection
vi | P a g e
EXECUTIVE SUMMARY AND KEY FINDINGS The health of the Chesapeake Bay—the largest estuary in the United States—is directly tied to activities on land within its watershed, and the over-application of poultry litter on farm fields contributes to excess nutrients in the Bay. This feasibility study evaluates one potential solution: a commercial-scale poultry litter composting facility, which would produce environmental benefits by reducing nutrient loads, and which could also create a revenue stream for farmers.
The study focuses primarily on poultry litter production and a potential composting facility in the Potomac Valley Conservation District in West Virginia. The project team worked closely with three model compost companies—Oregon Dairy Organics, Ag Recycle, and Panorama Pay-Dirt—and the Contract Poultry Growers Association of the Virginias. This expert input, combined with original industry research, a geospatial analysis, and a financial analysis, answer key questions as to the viability of a composting facility.
As discussed in the key findings below, a composting facility in the Potomac Valley Conservation District can be profitable should the right balance be found between the price charged for finished compost, the price per ton paid to growers for their poultry litter, and the amount of grant funding.
Poultry litter is a significant byproduct of modern broiler production.
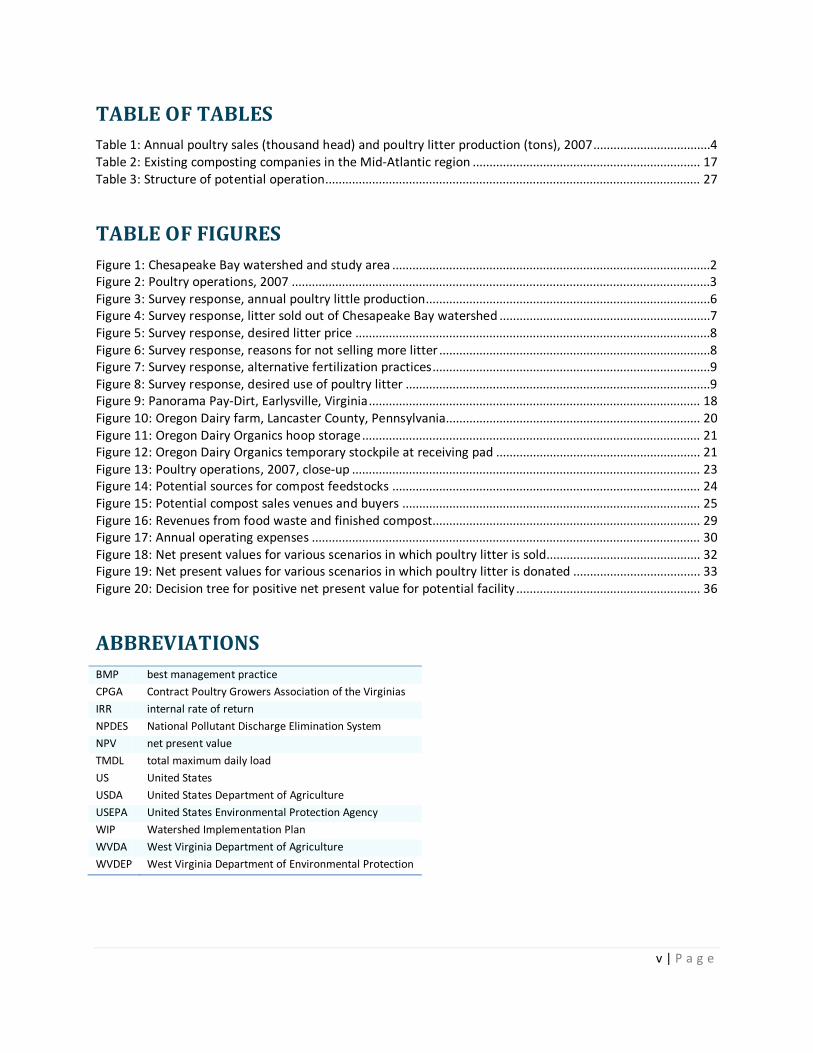
The five West Virginia counties considered in this study—Grant, Hampshire, Hardy, Mineral, and Pendleton—contain 98% of the poultry inventory but only 20% of the poultry farms in the state, meaning that the poultry operations here are larger than elsewhere in the state. The five-county region’s roughly 95 million birds produce approximately 110,500 tons of poultry litter annually.
Figure ES-1: Poultry operations, 2007
vii | P a g e
Diversified business structure contributes to the success of composting operations.
All three model composting operations considered in this study are subsidiaries of larger businesses or closely partnered with other operations. The ability to flexibly shift resources—including labor, equipment, and capital—between their subsidiaries creates cost savings, efficiency, and a security net for the composting operation, which is especially helpful during start-up.
For example, Oregon Dairy Organics is operated by the composting company Terra Gro, which is a subsidiary of Pine View Trucking. Oregon Dairy Organics used equipment and labor from Terra Gro’s other composting site, and benefited from clientele secured by Pine View Trucking. Additionally, Terra Gro’s established credit line enabled low-cost financing for the start-up of Oregon Dairy Organics. There are many other efficiencies gained from the partnership between Pine View Trucking, Terra Gro, and Oregon Dairy.
Ag Recycle shares office space and advertising expenses with a landscaping company that uses its products, and the composting at Panorama Pay-Dirt is just one of the many uses of the farm; others include cross-country trails, summer camp, and other forms of recreation. All of these partnerships exemplify the efficiencies gained from a diversified business structure that is built on connections within and between different companies. While the economics of a poultry litter composting facility determines its long term viability, the economics are determined, in part, by these support structures.
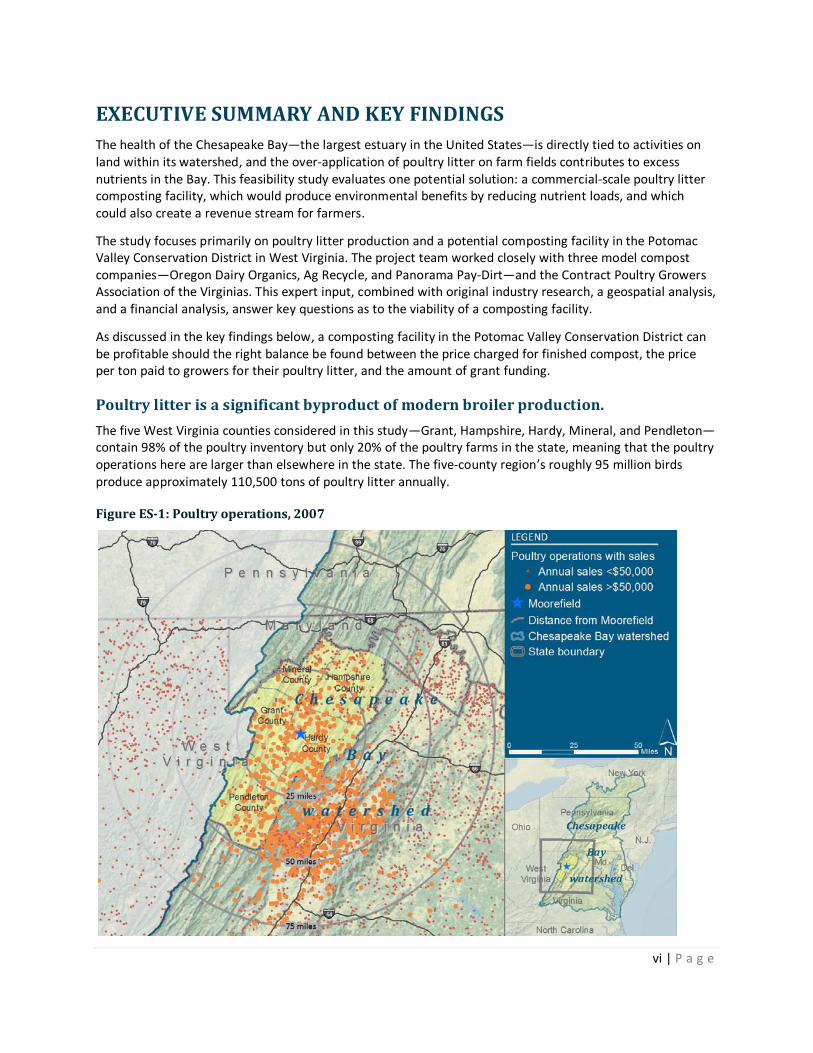
Food waste is an important feedstock.
All three model compost companies incorporate food waste into their feedstock supply because of the high amount of income generated from the food waste tipping fee, which averaged $30 per ton for Oregon Dairy Organics. For our potential poultry litter composting facility, income from food waste would amount to more than $217,500 annually in Years 7 through 20. In addition to providing income, food waste provides compost with essential nutrients, including water and nitrogen. A poultry litter composting facility can enhance profitability by maximizing the amount of food waste used as a feedstock.
Figure ES-2: Incorporating food waste at Oregon Dairy Organics, 2011
viii | P a g e
A composting facility in the Potomac Valley Conservation District can be profitable, so long as the right balance is found between the price charged for finished compost, the price paid to growers for their poultry litter, and the amount of grant funding.
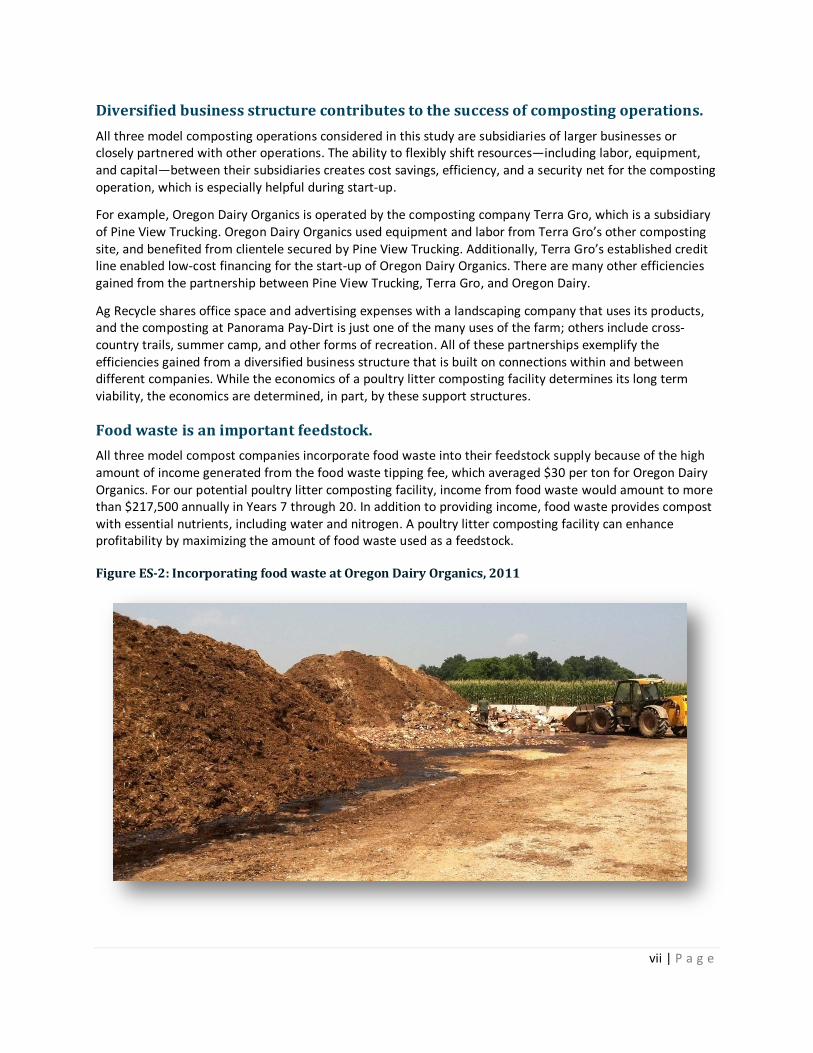
Three factors—the price charged for finished compost, the price per ton paid to growers for their poultry litter, and the amount of grant funding—are the most important determinants of profitability. Based on a pro forma financial analysis, net present values were calculated over a 20-year horizon for different assumptions for these three factors. Projects with positive net present values are projected to be profitable over the long term and should be considered by private investors, while projects with negative net present values are projected to lose money over the long term. The higher the net present value, the more attractive the investment.
Figure ES-3 illustrates the net present values calculated for different combinations of these three factors. The red, blue, and purple lines show net present values if grants were secured that totaled $1.9 million (100% of the required start-up capital), $1 million (approximately half of the required start-up capital), or zero. The solid lines show net present values if finished compost is sold at $12.50 per cubic yard, while the dashed lines show net present values if finished compost is sold at $25.00 per cubic yard.
Each line illustrates how the net present value will vary based on the price paid for poultry litter. The range varies from $0 per ton, as is the case when poultry growers give litter away, to $13 per ton, the going rate for poultry litter in summer 2011.
Figure ES-3: Net present values for various scenarios in which poultry litter is sold
With finished compost sold at $25 per cubic yard, there are many possible combinations of grants and prices paid to growers for their litter that result in positive net present values. Put another way, if the composting facility had to pay the going rate for poultry litter—$13 per ton—the net present value would only be positive with a grant of approximately $1.9 million and a compost price of $25 per cubic yard.
-$5,000,000
-$4,000,000
-$3,000,000
-$2,000,000
-$1,000,000
$0
$1,000,000
$2,000,000
$3,000,000
$4,000,000
$5,000,000
$0 $1 $2 $3 $4 $5 $6 $7 $8 $9 $10 $11 $12 $13
Net
pre
sent
val
ue
Price paid for poultry litter ($/ton)
$1.9 million grant, sell compost at $25.00/cubic yard
$1 million grant, sell compost at $25.00/cubic yard
No grant, sell compost at $25.00/cubic yard
$1.9 million grant, sell compost at $12.50/cubic yard
$1 million grant, sell compost at $12.50/cubic yard
No grant, sell compost at $12.50/cubic yard
ix | P a g e
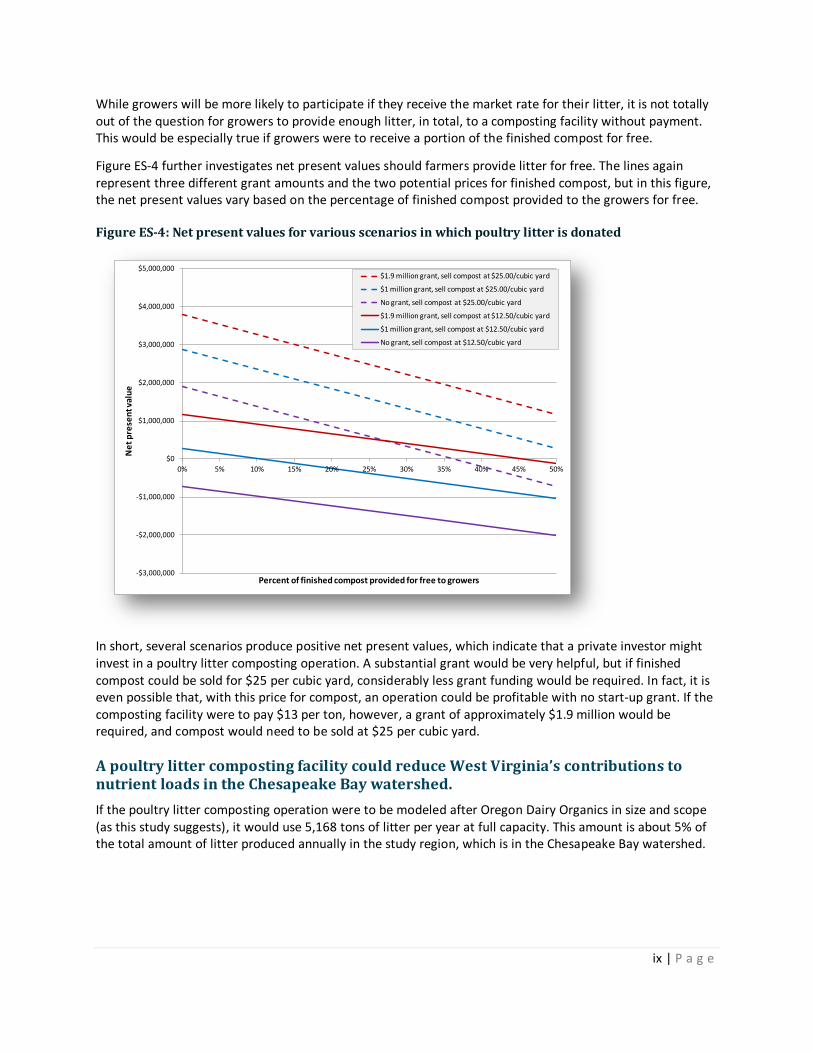
While growers will be more likely to participate if they receive the market rate for their litter, it is not totally out of the question for growers to provide enough litter, in total, to a composting facility without payment. This would be especially true if growers were to receive a portion of the finished compost for free.
Figure ES-4 further investigates net present values should farmers provide litter for free. The lines again represent three different grant amounts and the two potential prices for finished compost, but in this figure, the net present values vary based on the percentage of finished compost provided to the growers for free.
Figure ES-4: Net present values for various scenarios in which poultry litter is donated
In short, several scenarios produce positive net present values, which indicate that a private investor might invest in a poultry litter composting operation. A substantial grant would be very helpful, but if finished compost could be sold for $25 per cubic yard, considerably less grant funding would be required. In fact, it is even possible that, with this price for compost, an operation could be profitable with no start-up grant. If the composting facility were to pay $13 per ton, however, a grant of approximately $1.9 million would be required, and compost would need to be sold at $25 per cubic yard.
A poultry litter composting facility could reduce West Virginia’s contributions to nutrient loads in the Chesapeake Bay watershed.
If the poultry litter composting operation were to be modeled after Oregon Dairy Organics in size and scope (as this study suggests), it would use 5,168 tons of litter per year at full capacity. This amount is about 5% of the total amount of litter produced annually in the study region, which is in the Chesapeake Bay watershed.
-$3,000,000
-$2,000,000
-$1,000,000
$0
$1,000,000
$2,000,000
$3,000,000
$4,000,000
$5,000,000
0% 5% 10% 15% 20% 25% 30% 35% 40% 45% 50%
Net
pre
sent
val
ue
Percent of finished compost provided for free to growers
$1.9 million grant, sell compost at $25.00/cubic yard
$1 million grant, sell compost at $25.00/cubic yard
No grant, sell compost at $25.00/cubic yard
$1.9 million grant, sell compost at $12.50/cubic yard
$1 million grant, sell compost at $12.50/cubic yard
No grant, sell compost at $12.50/cubic yard

x | P a g e
The research points to a fundamental question: Is it possible to get 5,168 tons of poultry litter for free annually?
The financial analysis identifies a range of scenarios that would result in a viable operation, yet the scenario that is eventually implemented will depend on the answer to the question: Will poultry growers participate and be willing to part with their litter, either for free or for some price? A decision tree guides the user through key variables—including the compost price, price of litter, amount of compost returned to poultry growers, and amount of grant funding required—and depicts nine possible outcomes with positive net present values.
Figure ES-5: Decision tree for positive net present value for potential facility
What price can you get for finished
compost?
How much compost do the growers need back?
What price can you get for finished
compost?
How much compost do the growers need back?
How much will the growers require for
poultry litter?
How much will the growers require for
poultry litter?
$1 million
$1.9 million
$0 $1
million $1
million$1.9
million$0
$1 million
$1.9 million
Is it possible to get 5,168 tons of poultry litter for free annually?
YesNo
$12.50 per cubic yard
$12.50 per cubic yard
$25 per cubic yard
$25 per cubic yard
Then, amount of grant funding required:
If $1 per ton
If $4.40 per ton
If $7 per ton
If $10.50 per ton
If $13 per ton
If 10% of total
If 45% of total
If 37% of total
If >50% of total
1 | P a g e
1. INTRODUCTION AND BACKGROUND The health of the Chesapeake Bay—the largest estuary in the United States (US) and one of the world’s most biologically productive estuaries—is directly tied to activities on land within its watershed. Returning the Bay to health is an issue of national importance, given its historical and economic importance, President Barack Obama’s executive order outlining strategies for cleaning it up (The White House, 2009), and an ongoing planning process that recently culminated in the release of a total maximum daily load (TMDL) (USEPA, 2010).
West Virginia’s formal involvement in this process began in 2002, when Governor Bob Wise signed the Chesapeake Bay Program Water Quality Initiative Memorandum of Understanding (State of West Virginia, 2002); the state was then committed to developing goals to reduce nutrient and sediment loads. Since then, West Virginia released several planning documents to refine the actions necessary for reducing pollutant loads from West Virginia to the Bay (West Virginia Tributary Strategy Stakeholders Working Group, 2005; West Virginia WIP Development Team, 2010 and 2012).
A common thread among these plans, however, is that agricultural activities, including the over-application of poultry litter on farm fields, contribute to excess nutrients in the Bay. West Virginia’s Eastern Panhandle is located within the Chesapeake Bay watershed, and the West Virginia portion of the watershed is responsible for 3% of excess nitrogen and 4% of excess phosphorus in the Bay (Parrish, 2011).
A poultry litter composting facility, such as the one investigated in this report, can play a role in reducing West Virginia’s pollutant discharges to the Bay by creating compost, a value-added product that is more stable and consistent than fresh litter (Walker, undated). Because of renewed interest in the concept of creating a value added product like compost for nutrient load reductions in watersheds, this study evaluates the viability of a poultry litter composting facility through industry research, geospatial analysis, and financial analysis.
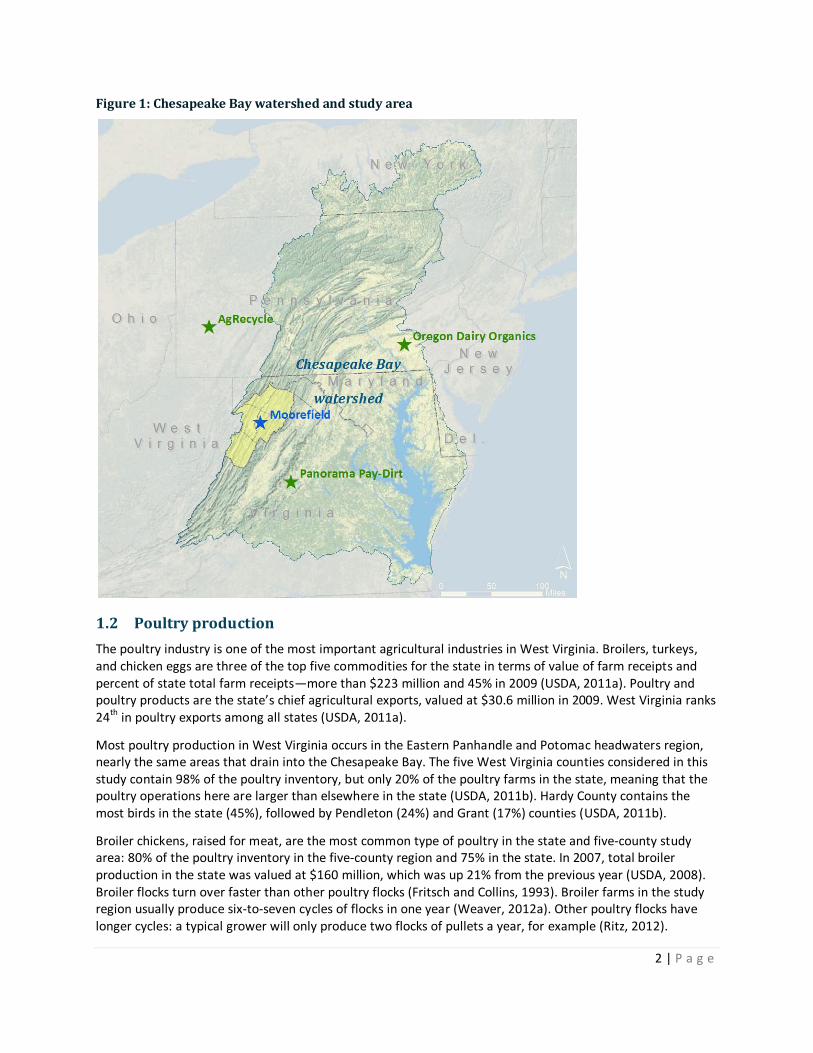
1.1 Study area
Approximately 2.2 million acres—including all or part of eight counties and about 14% of total land area—in West Virginia lie in the Chesapeake Bay watershed. This study focuses on the five-county region that includes Grant, Hampshire, Hardy, Mineral, and Pendleton counties, which is also known as the Potomac Valley Conservation District (Figure 1). This region has extremely high poultry (and poultry litter) production, and centers on the town of Moorefield, West Virginia, which is a possible location for the composting facility (see Section 3.3). Although this study focuses on five counties in West Virginia, sustainable ways of dealing with poultry litter remain an issue of great importance for the entire region, and this feasibility study could serve as a model for solving poultry litter problems in other states as well.
2 | P a g e
Figure 1: Chesapeake Bay watershed and study area
1.2 Poultry production
The poultry industry is one of the most important agricultural industries in West Virginia. Broilers, turkeys, and chicken eggs are three of the top five commodities for the state in terms of value of farm receipts and percent of state total farm receipts—more than $223 million and 45% in 2009 (USDA, 2011a). Poultry and poultry products are the state’s chief agricultural exports, valued at $30.6 million in 2009. West Virginia ranks 24th in poultry exports among all states (USDA, 2011a).
Most poultry production in West Virginia occurs in the Eastern Panhandle and Potomac headwaters region, nearly the same areas that drain into the Chesapeake Bay. The five West Virginia counties considered in this study contain 98% of the poultry inventory, but only 20% of the poultry farms in the state, meaning that the poultry operations here are larger than elsewhere in the state (USDA, 2011b). Hardy County contains the most birds in the state (45%), followed by Pendleton (24%) and Grant (17%) counties (USDA, 2011b).
Broiler chickens, raised for meat, are the most common type of poultry in the state and five-county study area: 80% of the poultry inventory in the five-county region and 75% in the state. In 2007, total broiler production in the state was valued at $160 million, which was up 21% from the previous year (USDA, 2008). Broiler flocks turn over faster than other poultry flocks (Fritsch and Collins, 1993). Broiler farms in the study region usually produce six-to-seven cycles of flocks in one year (Weaver, 2012a). Other poultry flocks have longer cycles: a typical grower will only produce two flocks of pullets a year, for example (Ritz, 2012).
3 | P a g e
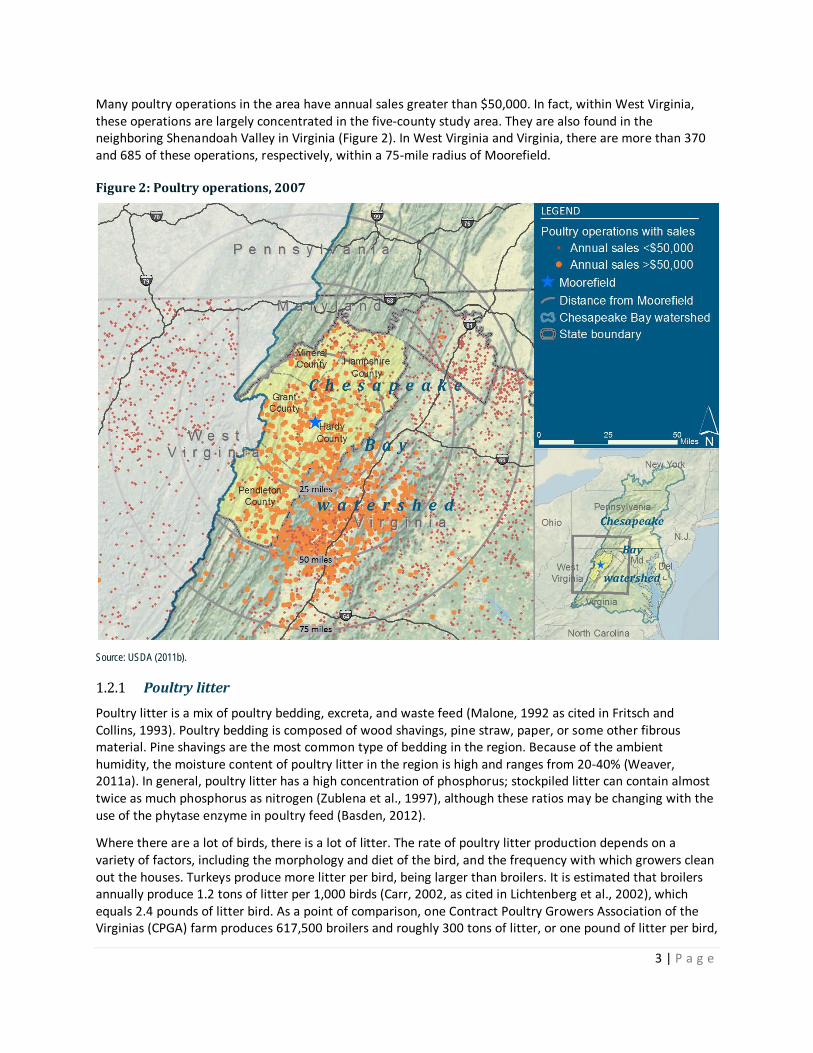
Many poultry operations in the area have annual sales greater than $50,000. In fact, within West Virginia, these operations are largely concentrated in the five-county study area. They are also found in the neighboring Shenandoah Valley in Virginia (Figure 2). In West Virginia and Virginia, there are more than 370 and 685 of these operations, respectively, within a 75-mile radius of Moorefield.
Figure 2: Poultry operations, 2007
Source: USDA (2011b).
1.2.1 Poultry litter
Poultry litter is a mix of poultry bedding, excreta, and waste feed (Malone, 1992 as cited in Fritsch and Collins, 1993). Poultry bedding is composed of wood shavings, pine straw, paper, or some other fibrous material. Pine shavings are the most common type of bedding in the region. Because of the ambient humidity, the moisture content of poultry litter in the region is high and ranges from 20-40% (Weaver, 2011a). In general, poultry litter has a high concentration of phosphorus; stockpiled litter can contain almost twice as much phosphorus as nitrogen (Zublena et al., 1997), although these ratios may be changing with the use of the phytase enzyme in poultry feed (Basden, 2012).
Where there are a lot of birds, there is a lot of litter. The rate of poultry litter production depends on a variety of factors, including the morphology and diet of the bird, and the frequency with which growers clean out the houses. Turkeys produce more litter per bird, being larger than broilers. It is estimated that broilers annually produce 1.2 tons of litter per 1,000 birds (Carr, 2002, as cited in Lichtenberg et al., 2002), which equals 2.4 pounds of litter bird. As a point of comparison, one Contract Poultry Growers Association of the Virginias (CPGA) farm produces 617,500 broilers and roughly 300 tons of litter, or one pound of litter per bird,
4 | P a g e
annually (Weaver, 2012b). Three hundred tons of litter per year is typical for growers in the region (Weaver, 2012b).
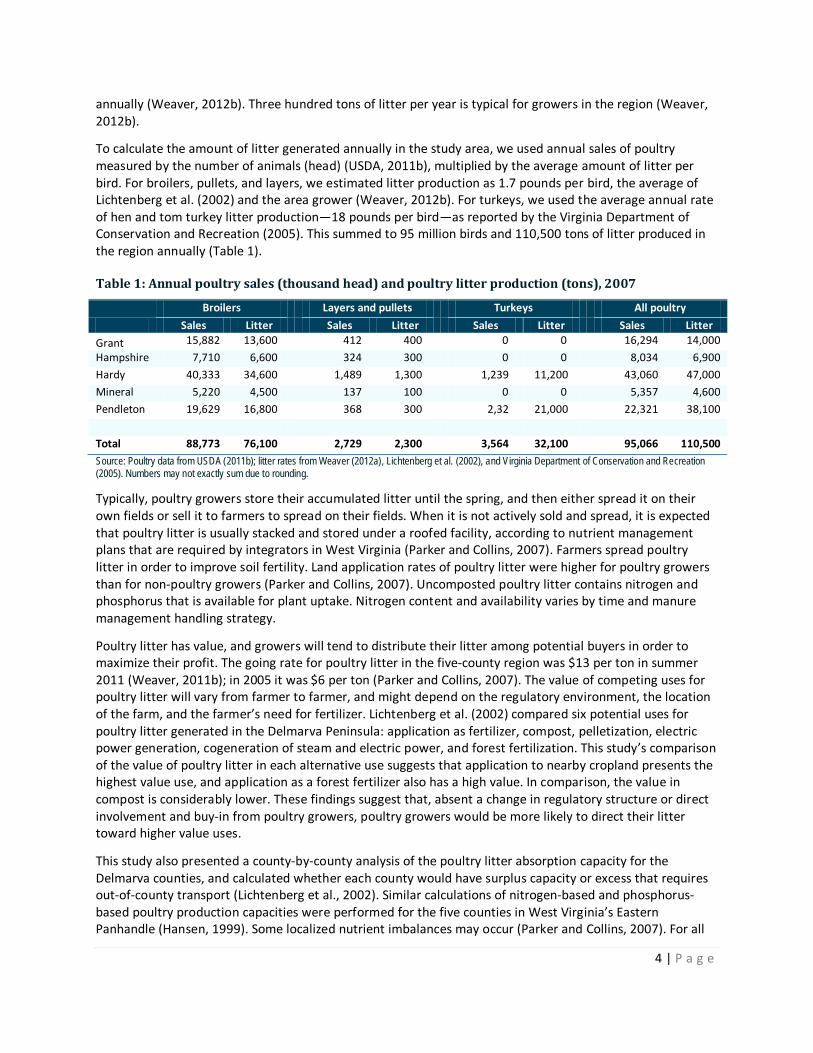
To calculate the amount of litter generated annually in the study area, we used annual sales of poultry measured by the number of animals (head) (USDA, 2011b), multiplied by the average amount of litter per bird. For broilers, pullets, and layers, we estimated litter production as 1.7 pounds per bird, the average of Lichtenberg et al. (2002) and the area grower (Weaver, 2012b). For turkeys, we used the average annual rate of hen and tom turkey litter production—18 pounds per bird—as reported by the Virginia Department of Conservation and Recreation (2005). This summed to 95 million birds and 110,500 tons of litter produced in the region annually (Table 1).
Table 1: Annual poultry sales (thousand head) and poultry litter production (tons), 2007
Broilers Layers and pullets Turkeys All poultry
Sales Litter Sales Litter Sales Litter Sales Litter
Grant 15,882 13,600 412 400 0 0 16,294 14,000
Hampshire 7,710 6,600 324 300 0 0 8,034 6,900
Hardy 40,333 34,600 1,489 1,300 1,239 11,200 43,060 47,000
Mineral 5,220 4,500 137 100 0 0 5,357 4,600
Pendleton 19,629 16,800 368 300 2,32 21,000 22,321 38,100
Total 88,773 76,100 2,729 2,300 3,564 32,100 95,066 110,500
Source: Poultry data from USDA (2011b); litter rates from Weaver (2012a), Lichtenberg et al. (2002), and Virginia Department of Conservation and Recreation (2005). Numbers may not exactly sum due to rounding.
Typically, poultry growers store their accumulated litter until the spring, and then either spread it on their own fields or sell it to farmers to spread on their fields. When it is not actively sold and spread, it is expected that poultry litter is usually stacked and stored under a roofed facility, according to nutrient management plans that are required by integrators in West Virginia (Parker and Collins, 2007). Farmers spread poultry litter in order to improve soil fertility. Land application rates of poultry litter were higher for poultry growers than for non-poultry growers (Parker and Collins, 2007). Uncomposted poultry litter contains nitrogen and phosphorus that is available for plant uptake. Nitrogen content and availability varies by time and manure management handling strategy.
Poultry litter has value, and growers will tend to distribute their litter among potential buyers in order to maximize their profit. The going rate for poultry litter in the five-county region was $13 per ton in summer 2011 (Weaver, 2011b); in 2005 it was $6 per ton (Parker and Collins, 2007). The value of competing uses for poultry litter will vary from farmer to farmer, and might depend on the regulatory environment, the location of the farm, and the farmer’s need for fertilizer. Lichtenberg et al. (2002) compared six potential uses for poultry litter generated in the Delmarva Peninsula: application as fertilizer, compost, pelletization, electric power generation, cogeneration of steam and electric power, and forest fertilization. This study’s comparison of the value of poultry litter in each alternative use suggests that application to nearby cropland presents the highest value use, and application as a forest fertilizer also has a high value. In comparison, the value in compost is considerably lower. These findings suggest that, absent a change in regulatory structure or direct involvement and buy-in from poultry growers, poultry growers would be more likely to direct their litter toward higher value uses.
This study also presented a county-by-county analysis of the poultry litter absorption capacity for the Delmarva counties, and calculated whether each county would have surplus capacity or excess that requires out-of-county transport (Lichtenberg et al., 2002). Similar calculations of nitrogen-based and phosphorus-based poultry production capacities were performed for the five counties in West Virginia’s Eastern Panhandle (Hansen, 1999). Some localized nutrient imbalances may occur (Parker and Collins, 2007). For all
5 | P a g e
of the counties in the study region, manure phosphorus exceeded crop phosphorus, indicating a nutrient imbalance (Mid-Atlantic Water Program, 2007). Maryland, West Virginia, and Virginia have used subsidy programs to make litter transport more attractive, seeking to address these imbalances and move poultry litter out of the watershed (Parker and Collins, 2007). A litter composting facility presents a possible alternative to the transfer of litter.
1.2.2 Contract Poultry Growers Association of the Virginias
CPGA is an association of farmers who operate poultry barns, also called poultry houses, in eastern West Virginia and western Virginia. CPGA is unique among poultry growers associations in that it does not allow members of the poultry industry into its membership. Currently, CPGA has more than150 members and anticipates doubling in membership in the next year because of its bulk buying deal on propane gas, which growers require to heat their poultry houses (Weaver, 2011b).1
1.2.3 Potomac Valley Conservation District Poultry Growers
The Potomac Valley Conservation District embodies the same five-county region as this study (Figure 2) and may have overlapping membership with CPGA. In September and October 2011, West Virginia University Extension staff performed an electronic survey at four Chesapeake Bay TMDL Farm Feedback Night meetings in the Potomac Valley Conservation District counties (Faulkner et al., 2011). While other agriculture and conservation professionals and elected officials were in attendance at those meetings, only farmers were asked to anonymously respond to survey questions. The survey was preceded by education on non-point source pollution, best management practices (BMPs), general information about the TMDL, and information about available cost-share and technical assistance programs.
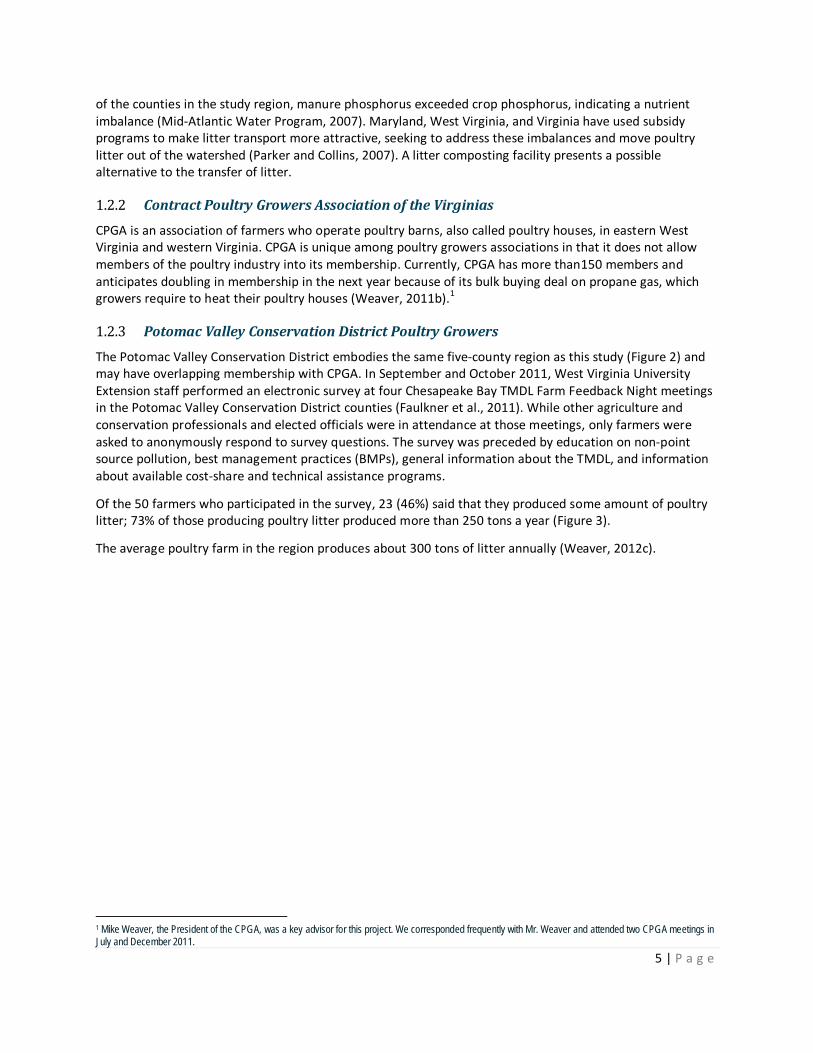
Of the 50 farmers who participated in the survey, 23 (46%) said that they produced some amount of poultry litter; 73% of those producing poultry litter produced more than 250 tons a year (Figure 3).
The average poultry farm in the region produces about 300 tons of litter annually (Weaver, 2012c).
1 Mike Weaver, the President of the CPGA, was a key advisor for this project. We corresponded frequently with Mr. Weaver and attended two CPGA meetings in July and December 2011.
6 | P a g e
Figure 3: Survey response, annual poultry little production
The next question asked: How much litter do you sell out of the Chesapeake Bay watershed? Responses were evenly split between those who do not sell any litter (10 responses), those who do not sell litter out of the area (11 responses), and those who sell one-quarter or more of their litter out of the watershed (9 responses) (Figure 4). No respondents sell more than two-thirds of their litter outside of the watershed.
In a willingness-to-pay study of farmers in Hardy and Pendleton Counties in 2007, a high rate of litter transport was reported (Parker and Collins, 2007). Of the farmers that sold their litter, 73% of the litter stayed in their own county; despite high rates of transport, litter did not move outside the Chesapeake Bay watershed (Parker and Collins, 2007).
Anecdotally, these findings concur with CPGA members’ observations that the poultry litter market is highly variable (Weaver, 2011b).
0
5
10
15
20
25
0 1-250 250-500 501-750 750-1,000 1,000
Num
ber o
f res
pond
ents
(n=5
0)
How many tons of poultry litter do you produce annually?

7 | P a g e
Figure 4: Survey response, litter sold out of Chesapeake Bay watershed
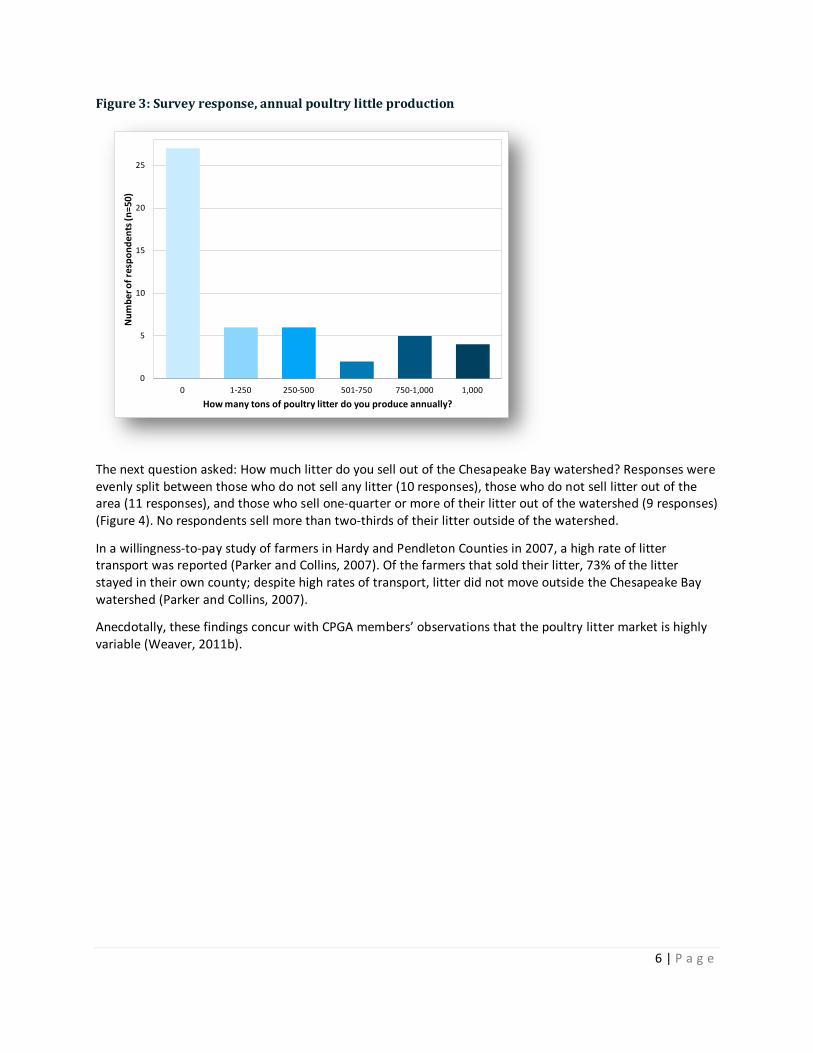
Equally variable, survey responses were mixed on the price per ton of litter that is required for them to begin selling it (Figure 5). Only one respondent was willing to accept between $1 and $5 per ton for his litter; most respondents (17 or 70%) desired greater than $11 per ton.
As a point of comparison, Fibrowatt was offering growers in the Shenandoah Valley $5 per ton (Weaver, 2011c) and the market price for poultry litter in summer 2011 was $13 per ton (Weaver, 2011b).2
The litter buyers’ perspectives show great variability as well. In the same willingness-to-pay study, farmers in Pendleton County were willing to pay $12 to $15 per ton for litter, which was far above the 2005 market price of $6 per ton. Farmers in Hardy County—the highest poultry producing county in the region—were willing to pay only $6 per ton for litter, the 2005 market price (Parker and Collins, 2007).
2 The company Fibrowatt has proposed a poultry litter-to-energy plant in the Shenandoah Valley. Citizens in the town of Harrisonburg, Virginia have formed a Shenandoah Valley Poultry Litter-to-Energy Watershed & Air Advisory Group, the purpose of which is to determine the net environmental impact of a poultry litter-to-energy project in the Shenandoah Valley, including proposed nutrient load reductions, waste byproduct handling options, costs of alternatives for nutrient reduction, effects of emission deposition in the Chesapeake Bay, and effects of air emissions on the Shenandoah National Park (Virginia Department of Environmental Quality, 2011).
0
2
4
6
8
10
12
I do not sell any of my
litter
None, all litter stays in
area
One-quarter One-third One-half Two-thirds More than two-thirds
Num
ber o
f res
pond
ents
(n=3
0)
How much litter do you sell out of the Chesapeake Bay Watershed?
8 | P a g e
Figure 5: Survey response, desired litter price
When asked about reasons for not selling more poultry litter, no respondents feared that they would not receive a fair price (Figure 6). Instead, many (13 respondents) did not sell their litter because they wanted to use it on their land.
Figure 6: Survey response, reasons for not selling more litter
Twenty-eight people responded to the question: If you sold litter that was part of your farm fertilization program, how did you then fertilize your land? Eight respondents replied that they did not add commercial fertilizer, and 10 responded that they never sold litter that they needed for fertilizer (Figure 7).
0
1
2
3
4
5
6
$1 - $5 $6 - $10 $11 - $15 $16 - $20 $21 - $25 Over $25
Num
ber o
f res
pond
ents
(n=2
4)
If you do not currently sell litter, what price per ton would you need to receive in order to begin to sell it?
0
2
4
6
8
10
12
14
Lack of loading area
Will not receive fair
price
Needed for on-farm
fertilization
No interested
buyers
Lack of time to deal with transactions
I currently sell all my
litter
Other
Num
ber o
f res
pond
ents
(n=2
8)
What is the primary reason you do not currently sell more poultry litter?

9 | P a g e
Figure 7: Survey response, alternative fertilization practices
When asked about the desired use of their excess poultry litter, few growers were interested in giving it away (two respondents) or using it as an energy source to heat their poultry barns (two respondents). Many (11 respondents) were interested in personally marketing excess poultry litter in the area, and some (7 respondents) were interested in seeing the litter baled or composted through a cooperative for sale outside of the watershed (Figure 8).
Figure 8: Survey response, desired use of poultry litter
0
2
4
6
8
10
12
No additional commercial
fertilizer
Recommended rate of
commercial N-P-K
Lower than recommended
rate of commercial
nitrogen only
Higher than recommended
rate of commercial
nitrogen only
I have never sold litter I needed for
fertilizer
Num
ber o
f res
pond
ents
(n=2
8)
If you sold litter that was part of your farm fertility program, how did you then fertilize your land?
0
2
4
6
8
10
12
Used as energy source on-farm to heat
houses
Given to my neighbor Baled or composted and then marketed through a grower
cooperative to farmers outside the watershed
Personally marketed to area farmers
Num
ber o
f res
pond
ents
(n=2
4)
If you had poultry litter that was produced on-farm but was no longer needed as a fertilizer, how would you like to see that used?

10 | P a g e
Although this survey has a small sample size (less than 30 responses for each question), several conclusions appear from these data:
• Poultry litter is a seller’s market—that is, there is enough demand for poultry litter that poultry growers can selectively choose (and refuse) prices.
• Poultry growers first use litter on their own farm, and then sell it, meaning that the perceived cost of fertilizer replacements exceeds the potential revenue from the sale of poultry litter. This trend persists as fertilizer prices continue to increase.
• Despite a subsidized litter transport program, most poultry litter stays on the farm on which it was generated or within the Chesapeake Bay watershed.
1.3 Composting
The composting process requires time and oxygen, which can be supplied by turning the compost or adding bulky material like wood chips. The compost cycle at Oregon Dairy Organics requires 12 weeks to make finished compost, which is then cured for a time before sale. The more a composter handles the compost, the more expense is incurred, either via labor or wear on equipment (Castagnero, 2011a). Composting agricultural feedstocks as means of reducing material size, stabilizing nutrients, and creating a value-added soil amendment is not a new process.
Commercial-scale composting can be achieved with a variety of methods, depending on the volume of feedstocks used and desired characteristics of the finished product. Static piles are used to compost up to 5,000 cubic yards of feedstock; the primary piece of equipment for that method is a large farm tractor with a loader (Murray, 2012). Between 5,000 and 10,000 cubic yards of feedstocks can still be managed in static piles but may require an articulated loader for greater efficiency (Murray, 2012). If the volume of feedstocks is greater than 10,000 cubic yards, it is best to use windrows, which are long piles of feedstocks that are turned with a straddle turner to promote air exchange for aerobic composting. This arrangement would require a front-end loader. A facility that processes 50,000 cubic yards would need an additional tractor that is able to pull a compost straddle turner (depicted in Figure 9). If composting greater than 100,000 cubic yards of feedstocks, a self-propelled commercial-scale straddle turner would be required (Murray, 2011a). Straddle turners produce better compost products because they enable the pile to heat from the inside out (Castagnero, 2011a).
Most compost facilities also use a screen to filter out large particles. High-end markets, like golf courses and specialty turf growers, require a product that is screened to less than a quarter inch (Castagnero, 2011a). The screening process can be completed with either a trammel or vibrating bed.
Additionally, a compost facility requires some source of water to add to the windrows, unless there is an adequate amount of food waste, which can provide substantial amounts of water (Castagnero, 2011a).
The income stream from the sale of compost varies widely according to the season and surrounding demographics (Murray, 2011b).

11 | P a g e
1.3.1 Composting poultry litter
Composting poultry litter is attractive, because the composting process creates a more stable and consistent material than fresh litter (Walker, undated). Composted poultry litter is also attractive because it has the potential to be sold at higher prices than uncomposted poultry litter.
Poultry litter composting in the Potomac Valley Conservation District is not a new topic. The Potomac Valley Conservation District operates a demonstration poultry litter composting project for educational purposes (Hardy, 2011). Borderline, LLC operated a poultry composting operation in Paw Paw, West Virginia that has failed, purportedly due to marketing issues (Hardy, 2011). One hundred and fifty miles south of Moorefield, Triple C Farms composts poultry litter—primarily from turkeys—and is the only other known poultry litter composting operation in the state.
Fritsch and Collins (1993) evaluated the economic viability of a poultry litter composting facility at the pending expansion of a poultry processing plant in Moorefield. They found that, in order for a private investor to be interested and if compost were given away for free, poultry growers would have to pay tipping fees to the composting facility to accept litter; even if compost were sold for $8 per ton, poultry growers could only receive a maximum of $3 per ton of litter. They went on to conclude that land application and using litter as a cattle feed supplement could be viable alternative disposal methods.
Additionally, the West Virginia Watershed Implementation Plan (WIP) provides additional context:
Since the 1990s, [the Natural Resources Conservation Service] and the [West Virginia Conservation Agency] have worked together to implement a successful litter value added and litter transfer program for the Potomac Valley and Eastern Panhandle. A variety of approaches have been promoted with variable successes. The Potomac Valley Conservation District established and operated a litter composting demonstration site to demonstrate composting methods and the uniformity of the final product as a method to reduce nitrogen content, bacteria and viruses, and to stabilize the P content of the end product. Additionally demonstrated was the value of creating consistent physical properties of the compost, an important consideration for uniform, calibrated spreading on land as a soil amendment. The success of any litter transfer program is directly influenced by the continuously fluctuating commercial fertilizer market and equally so the cost of fuel and transportation. Government programs lack the flexibility to rapidly adjust to outside market
What is a “tipping fee”?
Tipping fees are paid by suppliers to get rid of their waste products. Many composting companies depend on the income generated by tipping fees paid to them by those wishing to dispose of food waste, for example. Tipping fees are sometimes referred to as disposal fees.
In contrast to paying a tipping fee, poultry growers are commonly paid for the litter; individuals purchase it for fertilizer on fields, for example.
The viability of a composting facility depends to a large degree on whether it will purchase poultry litter, the litter will be free, or growers will pay a tipping fee.
Purchase of poultry litter ($0) Payment of tipping fee

12 | P a g e
forces. Additionally, supply of and demand for litter fluctuations, depending on the season, add an additional variable to manage within the context of a government program (West Virginia WIP Development Team, 2010, p. 80).
Although many other types of composting operations were surveyed during the industry research phase of this project, composting poultry litter differs in that poultry growers are usually paid for their manure. The price of poultry litter varies depending on the demand for poultry litter and the fluctuation of fertilizer prices. When fertilizer prices are high, poultry litter prices are also high, as some farmers substitute litter for fertilizer and vice versa. At the time of this writing, poultry growers in the Eastern Panhandle of West Virginia can get $13 per ton for delivered litter. The unique economic considerations of composting poultry litter are considered in Section 4.
13 | P a g e
Peak phosphorus?
Phosphorus, nitrogen, and potassium are the three key nutrients upon which commercial agriculture depends. Plants require an adequate supply of phosphorus for seed formation and root development as well as for the maturing of crops (Soil Association, 2010). Since the advent of the Green Revolution, which developed technologies to intensify agricultural production and increase crop yields, the demand for phosphorus has steadily increased. This demand has been met through the mining of phosphate-bearing rock. However, phosphate-bearing rock is a non-renewable resource and there are indications that the world supply is dwindling (Elser and White, 2010).
Without a replacement source for phosphorus, a shortage of phosphate-bearing rock will significantly threaten global food security: “Without fertilization from phosphorus it has been estimated that wheat yields could fall from nine tonnes a hectare in 2000 to four tonnes a hectare in 2100” (Soil Association, 2010).
Recent studies indicate that the world is approaching peak phosphorus, the point in time when the supply of phosphate rock reserves will culminate. Current predictions indicate that peak phosphorus may be reached within the next 30 years and the global supply may be depleted within 50-100 years (Cordell et al., 2009). While we have not yet reached peak phosphorus, the quality of many existing phosphate-bearing rock mines are already degraded. This degradation results in the need for more intensive extraction methods and lower-quality phosphate-bearing rock (Elser and White, 2010).
Over the past five years, the price for phosphate rock has become extremely volatile. While the price had been relatively stable for many years, a severe price spike occurred in 2008. Following this spike, the price dropped sharply, but remained significantly higher than it had been in past decades. Since 2009, the price has steadily increased. Today, the price is more than four times its price in 2006 (Butler, 2009).
In addition to rising phosphate rock prices and potential food shortages, peak phosphorus may also lead to resource wars. Today, 90% of the world’s phosphorus is mined in just five countries—the US, China, Morocco, Jordan, and South Africa. While the US was once an exporter of phosphorus, current US demand exceeds supply.
Poultry litter is a source of phosphorus. Most farms in the Chesapeake Bay watershed that spread poultry litter are using the litter for its nitrogen content, as the phosphorus needs are already satiated from historic applications. As the world’s supply of phosphate-bearing rock dwindles, poultry litter may increase in value, especially for areas of the world that import substantial amounts of phosphorus.
14 | P a g e
1.4 The Chesapeake Bay total maximum daily load
The Chesapeake Bay TMDL (USEPA, 2010) is the most influential driver for finding new solutions to minimize pollution from the use of poultry litter in the Chesapeake Bay watershed. While it does not generally impose regulatory requirements on farms, the TMDL provides a roadmap for returning the Bay to health by limiting the amounts of nutrients and sediment in the Potomac and other rivers that drain to the bay.3
Recently, West Virginia created a WIP to help guide the efforts to identify and implement pollutant reduction strategies (West Virginia WIP Development Team, 2010). A new draft plan was recently released (West Virginia WIP Development Team, 2012).
While West Virginia’s plan targets many sources of pollution for action—including wastewater treatment plants, developed land, and forestry—agriculture is an important sector and poultry litter is an important source of nutrients. The plan describes various poultry-related programs that help reduce nutrient discharges, including alternative uses of poultry litter and poultry litter transfer. The plan also describes a past effort by the Potomac Valley Conservation District, which operated a litter composting demonstration site (West Virginia WIP Development Team, 2010).
1.5 Regulatory environment
Under the West Virginia Solid Waste Management Act, it is unlawful for any person to operate a solid waste facility unless such person has obtained a permit from the West Virginia Department of Environmental Protection (WVDEP).4 According to the State’s Solid Waste Management Rule, “’Solid Waste’ means any . . . solid, liquid, semisolid or contained liquid or gaseous material resulting from industrial, commercial, mining, or agricultural operations”5 and a “Solid Waste Facility” includes commercial composting facilities.6 The Solid Waste Management Rule would appear to apply to a commercial poultry litter composting facility; however, there is some ambiguity about whether WVDEP would regulate such a facility. According to a permitting supervisor at WVDEP’s Division of Water and Waste Management, WVDEP does not issue permits for poultry litter composting facilities (Patel, 2011). It is possible that regulation of a large-scale, commercial poultry litter composting facility has not yet been considered by WVDEP. While the State’s Municipal Solid Waste Management Rules do contain specific rules for yard waste composting and yard waste composting facilities,7
At the time of this writing, WVDEP and the West Virginia Department of Agriculture (WVDA) are in the process of formalizing an agreement that exempts qualifying on-farm composting operations from WVDEP regulation of solid waste. While the agreement has yet to be memorialized, it is currently recognized by both WVDEP and WVDA (Hedrick, 2012). Under the agreement, on-farm composting facilities covering less than five acres and composting less than 12,000 tons annually are not required to obtain a solid waste permit from WVDEP. Composting operations that qualify for this exemption are required to follow “Location Standards for Siting Non-Residential Composting Activities”
there are currently no specific rules for the composting of agricultural waste, including poultry litter.
8
3 While the TMDL does not impose regulatory requirements on non-point sources of pollution, it is possible that the TMDL process may help build momentum for state or federal requirements related to nutrient management. If so, then there may be additional incentives for poultry growers to find outlets for litter that contains nutrients over and above those required on their own fields.
and “Operational Requirements for Commercial Yard Waste Composting Facilities and Non-Residential Composting Activities.” It remains to be seen how the State would
4 W.Va. Code § 22-15-10(b) (2011). 5 W.Va. Code R. § 33-1-2.119 (2010). 6 W.Va. Code R. § 33-1-2.123) (2010). Commercial composting facilities do not include composting facilities “owned and operated by a person for the sole purpose of composting waste created by that person or such persons on a cost sharing or non-profit basis and shall not include land upon which finished or matured compost is applied for use as a soil amendment or conditioner.” (W. Va. Code R. § 33-1-2.32). 7 W.Va. Code R. § 33-3 (2001). 8 W.Va. Code R. §333-3.3 (2001).
15 | P a g e
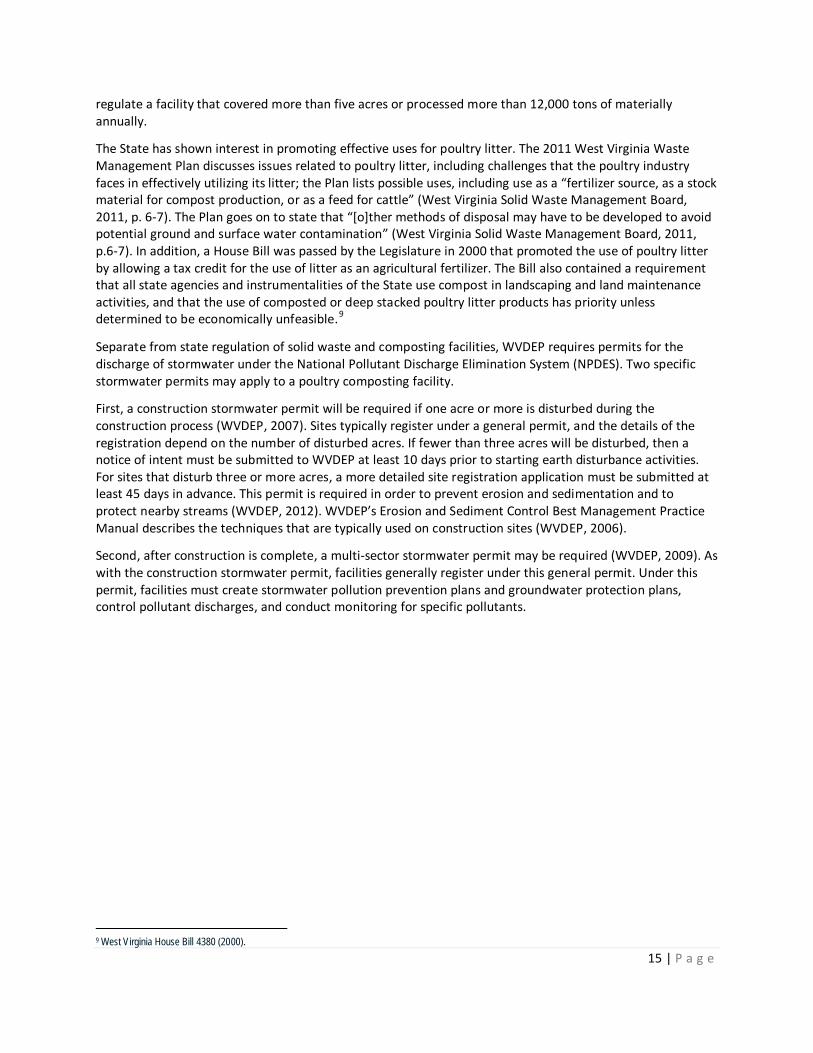
regulate a facility that covered more than five acres or processed more than 12,000 tons of materially annually.
The State has shown interest in promoting effective uses for poultry litter. The 2011 West Virginia Waste Management Plan discusses issues related to poultry litter, including challenges that the poultry industry faces in effectively utilizing its litter; the Plan lists possible uses, including use as a “fertilizer source, as a stock material for compost production, or as a feed for cattle” (West Virginia Solid Waste Management Board, 2011, p. 6-7). The Plan goes on to state that “[o]ther methods of disposal may have to be developed to avoid potential ground and surface water contamination” (West Virginia Solid Waste Management Board, 2011, p.6-7). In addition, a House Bill was passed by the Legislature in 2000 that promoted the use of poultry litter by allowing a tax credit for the use of litter as an agricultural fertilizer. The Bill also contained a requirement that all state agencies and instrumentalities of the State use compost in landscaping and land maintenance activities, and that the use of composted or deep stacked poultry litter products has priority unless determined to be economically unfeasible.9
Separate from state regulation of solid waste and composting facilities, WVDEP requires permits for the discharge of stormwater under the National Pollutant Discharge Elimination System (NPDES). Two specific stormwater permits may apply to a poultry composting facility.
First, a construction stormwater permit will be required if one acre or more is disturbed during the construction process (WVDEP, 2007). Sites typically register under a general permit, and the details of the registration depend on the number of disturbed acres. If fewer than three acres will be disturbed, then a notice of intent must be submitted to WVDEP at least 10 days prior to starting earth disturbance activities. For sites that disturb three or more acres, a more detailed site registration application must be submitted at least 45 days in advance. This permit is required in order to prevent erosion and sedimentation and to protect nearby streams (WVDEP, 2012). WVDEP’s Erosion and Sediment Control Best Management Practice Manual describes the techniques that are typically used on construction sites (WVDEP, 2006).
Second, after construction is complete, a multi-sector stormwater permit may be required (WVDEP, 2009). As with the construction stormwater permit, facilities generally register under this general permit. Under this permit, facilities must create stormwater pollution prevention plans and groundwater protection plans, control pollutant discharges, and conduct monitoring for specific pollutants.
9 West Virginia House Bill 4380 (2000).

16 | P a g e
2. INDUSTRY RESEARCH In order to identify ideal characteristics, designs, and operating procedures of composting operations, the research team contacted multiple composters in the Mid-Atlantic region and asked them a series of questions related to their operations. Through this primary research, the authors selected three companies with distinct business structures to serve as models for the potential poultry litter composting facility. In addition to interviewing their proprietors, the authors toured each of these three composting companies. The results of the general compost company research and model company research follow.
2.1 Composting in the Mid-Atlantic region
There are currently 435 composting companies listed in a national composting database (Biocycle, 2012). According to the Mid-Atlantic Composting Directory, 29 composting companies exist in Virginia, compared to two in West Virginia: the City of Clarksburg and Triple C Farms in Lewisburg. No composting facility currently exists in the study area.
In order to evaluate typical composting operations, employees or owners of composting companies listed on the Mid-Atlantic Composting Directory (Virginia Cooperative Extension, 2011) and Biocycle’s (2012) composting directory were interviewed regarding the attributes of their operations such as product pricing and marketing, feedstock composition, production method, and capacity. This brief survey was conducted in June and July 2011 via telephone. The scope of the research was limited to West Virginia and the nearby states of Delaware, Maryland, North Carolina, Ohio, and Pennsylvania. The authors primarily focused on poultry litter composters, but included other composters as well.
In this survey, fifteen composters were surveyed, six of which were located in Virginia. The primary results of the survey are listed in Table 2. Nine of the operations composted poultry litter; other feedstocks included cow manure, municipal green waste, yard waste, egg shells, wood chips and other wood residues, food waste, and other content. Of those operations disclosing their feedstock composition, the majority of poultry litter composters mixed poultry litter with a carbon source such as wood residue, but in varying proportions. Poultry litter ratios ranged from 45% to 95%. Horse manure was also a popular feedstock.
Marketing and product trends across these companies also varied. Homeowners were the most popular target market, with 58% of operations reporting them as clients. Of those who disclosed the information—seven companies—production capacity ranged from 10,500 to 160,000 cubic yards per year with an average production capacity of approximately 40,000 cubic yards per year. Most sold bulk compost as their primary product, but other products included bulk mushroom compost, compost sold at retail volumes, bulk topsoil blends, and bulk turf grass blends. The average price was $25 per cubic yard, excluding the price of Hy-Tech Mushroom Compost, Inc., which appeared to be an outlier (Table 2). Only one of the fifteen surveyed composters had obtained organic certification.
17 | P a g e
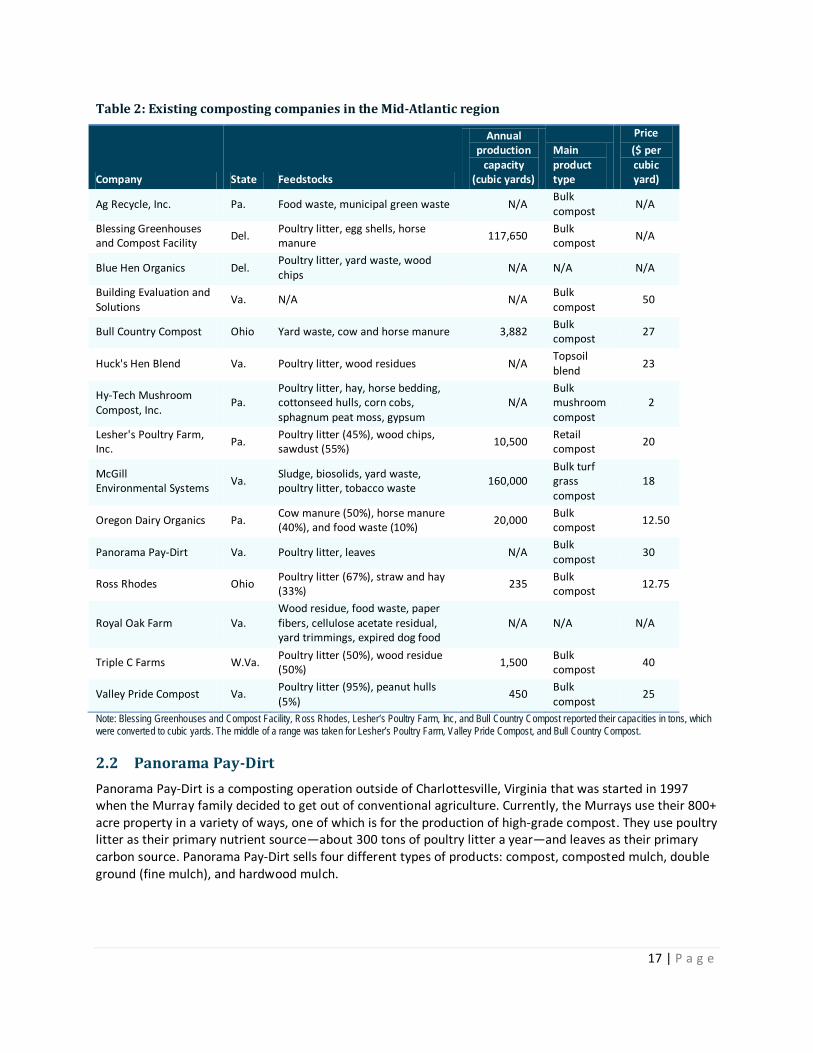
Table 2: Existing composting companies in the Mid-Atlantic region
Company State Feedstocks
Annual production
capacity (cubic yards)
Main product type
Price
($ per cubic yard)
Ag Recycle, Inc. Pa. Food waste, municipal green waste N/A Bulk compost
N/A
Blessing Greenhouses and Compost Facility
Del. Poultry litter, egg shells, horse manure
117,650 Bulk compost
N/A
Blue Hen Organics Del. Poultry litter, yard waste, wood chips
N/A N/A N/A
Building Evaluation and Solutions
Va. N/A N/A Bulk compost
50
Bull Country Compost Ohio Yard waste, cow and horse manure 3,882 Bulk compost
27
Huck's Hen Blend Va. Poultry litter, wood residues N/A Topsoil blend
23
Hy-Tech Mushroom Compost, Inc.
Pa. Poultry litter, hay, horse bedding, cottonseed hulls, corn cobs, sphagnum peat moss, gypsum
N/A Bulk mushroom compost
2
Lesher's Poultry Farm, Inc.
Pa. Poultry litter (45%), wood chips, sawdust (55%)
10,500 Retail compost
20
McGill Environmental Systems
Va. Sludge, biosolids, yard waste, poultry litter, tobacco waste
160,000 Bulk turf grass compost
18
Oregon Dairy Organics Pa. Cow manure (50%), horse manure (40%), and food waste (10%)
20,000 Bulk compost
12.50
Panorama Pay-Dirt Va. Poultry litter, leaves N/A Bulk compost
30
Ross Rhodes Ohio Poultry litter (67%), straw and hay (33%)
235 Bulk compost
12.75
Royal Oak Farm Va. Wood residue, food waste, paper fibers, cellulose acetate residual, yard trimmings, expired dog food
N/A N/A N/A
Triple C Farms W.Va. Poultry litter (50%), wood residue (50%)
1,500 Bulk compost
40
Valley Pride Compost Va. Poultry litter (95%), peanut hulls (5%)
450 Bulk compost
25
Note: Blessing Greenhouses and Compost Facility, Ross Rhodes, Lesher’s Poultry Farm, Inc, and Bull Country Compost reported their capacities in tons, which were converted to cubic yards. The middle of a range was taken for Lesher’s Poultry Farm, Valley Pride Compost, and Bull Country Compost.
2.2 Panorama Pay-Dirt
Panorama Pay-Dirt is a composting operation outside of Charlottesville, Virginia that was started in 1997 when the Murray family decided to get out of conventional agriculture. Currently, the Murrays use their 800+ acre property in a variety of ways, one of which is for the production of high-grade compost. They use poultry litter as their primary nutrient source—about 300 tons of poultry litter a year—and leaves as their primary carbon source. Panorama Pay-Dirt sells four different types of products: compost, composted mulch, double ground (fine mulch), and hardwood mulch.

18 | P a g e
Figure 9: Panorama Pay-Dirt, Earlysville, Virginia
Tips for successful composting from Panorama Pay-Dirt
• Have an abundant supply of carbon and nitrogen on hand before you start composting. You will only become frustrated with the progress if you are short either of these ingredients.
• Have an abundant supply of water, accessible year round, at your disposal. You are working with life, and all life needs water.
• When starting out, let the temperature probe and your nose be your guide; you don’t need high tech, expensive monitoring equipment.
• If windrows [long rows that are turned] is your method using a pull type turner, invest in a tractor with a creeper gear.
• If static piles is your method, have plenty of bulking material—such as wood chips—on hand to reduce compaction and allow the pile to breath between turning cycles.
• Invest in used equipment until the market justifies an upgrade. • On open land windrowing, site rows on high, well drained areas. • Consider slope when building windrows; material walks downhill when turned. • If things aren't working and they stink, figure it out; [common problems include:] too wet,
too dry, needs oxygen, carbon, or nitrogen. Don't mess with the recipe until you eliminate moisture and oxygen as the problem.
• Relax, compost happens. The process is 80% art and 20% science. The artist creates the recipe. (Murray, 2011c)

19 | P a g e
2.3 Ag Recycle
Ag Recycle is a composting company based in Pittsburgh, Pennsylvania. Ag Recycle uses the following feedstocks: food waste, chipped trees, plant material, compostable products, paper, corrugated cardboard, animal manure (with bedding), and food liquids to make at least five different products, including three-quarter inch, three-eighth inch, one-quarter inch, a compost soil blend, a semi-composted leaf mulch, and specialty products . These compost products are mostly differentiated by the size of their largest particles and/or specific uses. All of Ag Recycle’s compost products are registered soil amendments and are sold by the cubic yard.
According to the President of Ag Recycle, “92% of compost companies fail” due to an insufficient survey of the economics of the operation (Castagnero, 2011b). The composting process results in a huge reduction in volume from feedstocks to finished product. Because of its high water content, for example, food waste composts down to “almost nothing” (Castagnero, 2011a). One of the biggest stumbling blocks that Ag Recycle has experienced is the high amount of legal fees incurred after neighbors to the composting facility disagreed with its location.
A strategy that has enabled Ag Recycle’s success is its forward-thinking business approach. For example, Ag Recycle has made a particular effort to secure appropriately biodegradable plastic bagging for its retail product, set up a composting facility that can break down compostable cutlery and tableware, and formed partnerships with other forward-thinking companies with shared customer-bases like Whole Foods. Additionally, Ag Recycle shares office space and advertising expenses with Eichenlaub, a prominent landscaping company that uses its products.
2.4 Oregon Dairy Organics
In evaluating the feasibility of a poultry litter composting facility, the project team modeled the potential facility after Oregon Dairy Organics. Oregon Dairy Organics is a commercial-scale composting operation based in Lancaster County, Pennsylvania. Oregon Dairy Organics is the result of a unique public-private partnership and composts cow manure, horse manure, and food waste. The project was a collaborative effort between a dairy farm and market, Oregon Dairy; a professional composting company, Terra Gro; a local agricultural consulting firm, Team Ag; and the Working Lands Program at the Environmental Defense Fund.
The diverse project team behind Oregon Dairy Organics was fundamental to its success. All of its players—an environmental organization, funders, an agriculture consulting firm, a composting firm, and the farm family itself—contributed invaluable support and guidance. Specifically, Team Ag and the Environmental Defense Fund’s guidance enhanced the economic sustainability of the project. The farm family’s reputation in the community enhanced public receptivity and support for the project. Terra Gro’s expertise guaranteed the quality of the compost product itself, and ready access to an existing network of potential compost buyers and feedstock suppliers.

20 | P a g e
Figure 10: Oregon Dairy farm, Lancaster County, Pennsylvania
The Oregon Dairy Organics composting facility was set up in 2010 and models Terra Gro’s other composting site, the Peach Bottom facility. When operating at full capacity, the Peach Bottom and Oregon Dairy Organics facilities compost 29,000 cubic yards of feedstocks into 20,000 cubic yards of finished compost product, which is then screened to differentiate into different product types.
The Oregon Dairy Organics facility is comprised of six hoop houses that serve as covered areas on which to process the compost in windrows (Figure 11). The entire composting cycle takes approximately 12 weeks, depending on the season. Finished compost is cured for a time before sale. Most of Oregon Dairy Organics’s compost sales are to its wholesale clients, although some amount of compost is sold at the Oregon Dairy market.

21 | P a g e
Figure 11: Oregon Dairy Organics hoop storage
Figure 12: Oregon Dairy Organics temporary stockpile at receiving pad
The benefits of the Oregon Dairy project are many. The project is forecasted to result in substantial nutrient load reductions in the Chesapeake Bay watershed, both by reducing the over-application of manure and by displacing synthetic soil amendments in the watershed. The project is forecasted to reduce nitrogen loads by
22 | P a g e
149,600 pounds and phosphorus loads by 141,600 pounds annually (Chesapeake Bay Funders Network, 2011).
Equally important, the project adds to the economic vitality of the region. In general, the project is anticipated to be profitable for both Terra Gro and Oregon Dairy. Oregon Dairy Organics was started with a mix of financing from public and private sources summing 60%; Terra Gro fronted the remaining 40% required start-up capital.
Oregon Dairy Organics is an appropriate model for the potential poultry litter composting facility in that it reduces nutrient flow to the area’s streams and rivers, provides economic revenue, and produces a product that is in high demand. The primary difference between Oregon Dairy Organics and the potential poultry litter composting facility are the different feedstocks.
Oregon Dairy Organics uses cow manure, bedpack or horse manure, and food waste. Most dairies store manure on-farm, anaerobically digest it, or send it somewhere to be disposed of, for which they would have to pay a tipping fee. The Oregon Dairy farm of more than 500 cows anaerobically digests cow manure, creating a byproduct of liquid manure slurry, with which Oregon Dairy Organics rehydrates their compost windrows. Additionally, Oregon Dairy Organics takes Oregon Dairy’s “bedpack,” or waste of straw-based bedding and manure. Oregon Dairy Organics also composts horse bedding and manure and food waste, a feedstock that has been incredibly important to the financial viability of the operation because of its high tipping fee (Friedman, 2012).
The potential poultry litter composting facility’s feedstocks are discussed in Section 3.1.
23 | P a g e
3. GEOSPATIAL ANALYSIS
3.1 Potential supply of composting inputs
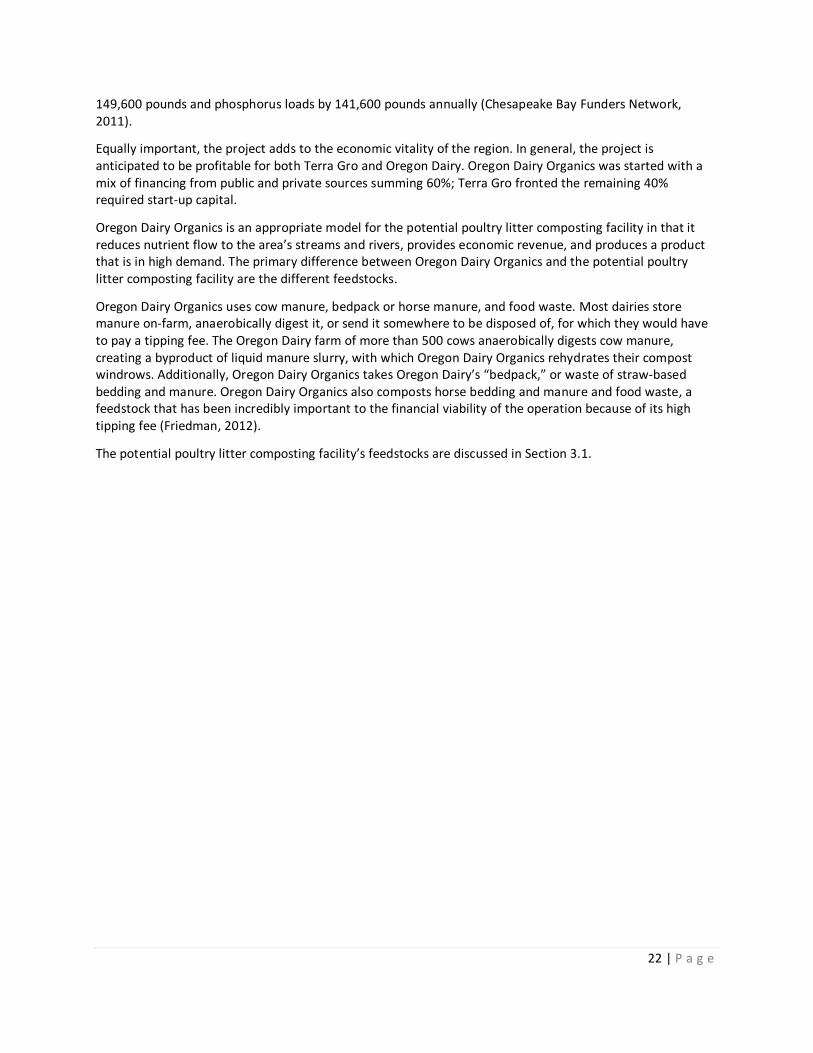
A good compost product requires a balanced mix of nutrients, including nitrogen, carbon, water, and air. One of the primary determining factors of the success of a composting operation is the availability of these inputs, or feedstocks. An abundant supply of feedstocks is required because the volume of the feedstocks diminishes so much during the composting process, due the metabolism of materials and evaporation of water. The key goal of this composting facility would be to use poultry litter as a primary feedstock.
Figure 13: Poultry operations, 2007, close-up
There is an abundant supply—more than 110,500 tons—of poultry litter in the study region (Table 1).These farms are depicted in Figure 13. A composting operation would require feedstocks other than poultry litter to balance out the nutrient profile of the finished product. Some feedstocks, like food waste, provide significant revenue to composting operations in the form of tipping fees.10
In addition to being abundant, feedstocks must be within close proximity to the composting operation, to enhance its economic viability by reducing transportation costs. For example, a good rule of thumb is that any feedstock delivery travel time that is greater than two hours one way is unprofitable, unless the tipping fee of the material is inordinately high (Castagnero, 2011b).
10 As a point of reference, Oregon Dairy Organics receives $30 per ton of food waste that it accepts.
24 | P a g e
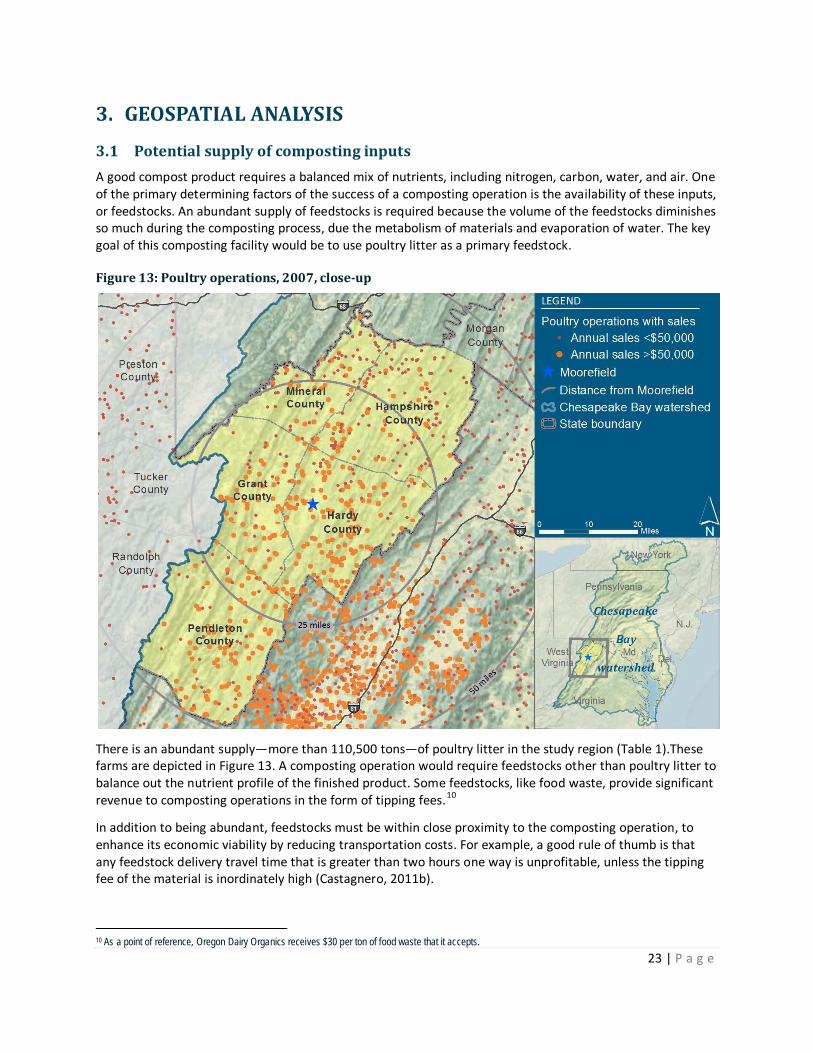
Figure 14: Potential sources for compost feedstocks
Source: USEPA (2011) and Google (2011a).
In order to evaluate the availability and proximity of compost feedstocks in the region, the project team identified potential sources for feedstocks within 75 miles of Moorefield. These potential sources include locations that produce wood chips and logging residues (indicated as “carbon”); a substantial amount of horse or fish manure; or byproducts from food, beverage, and tobacco manufacturing operations.
As Figure 14 shows, there are many possible sources of feedstocks. More than 230 locations under these potential supply categories lie within 75 miles of Moorefield. Food waste, one of the most important feedstocks because of its revenue-generating potential, could be sourced from grocery stores, restaurants, cafeterias, and hospitals, in addition to the food and beverage manufacturing facilities identified in Figure 14. The Pilgrim’s Pride Feed Mill, the poultry processing plant, and the frozen chicken product plant in Moorefield might be especially strategic sources for feedstocks. This feedstock availability research process relied on readily available information and should be refined in the future, once specific plans for a composting operation are in process.
25 | P a g e
3.2 Potential demand for compost product
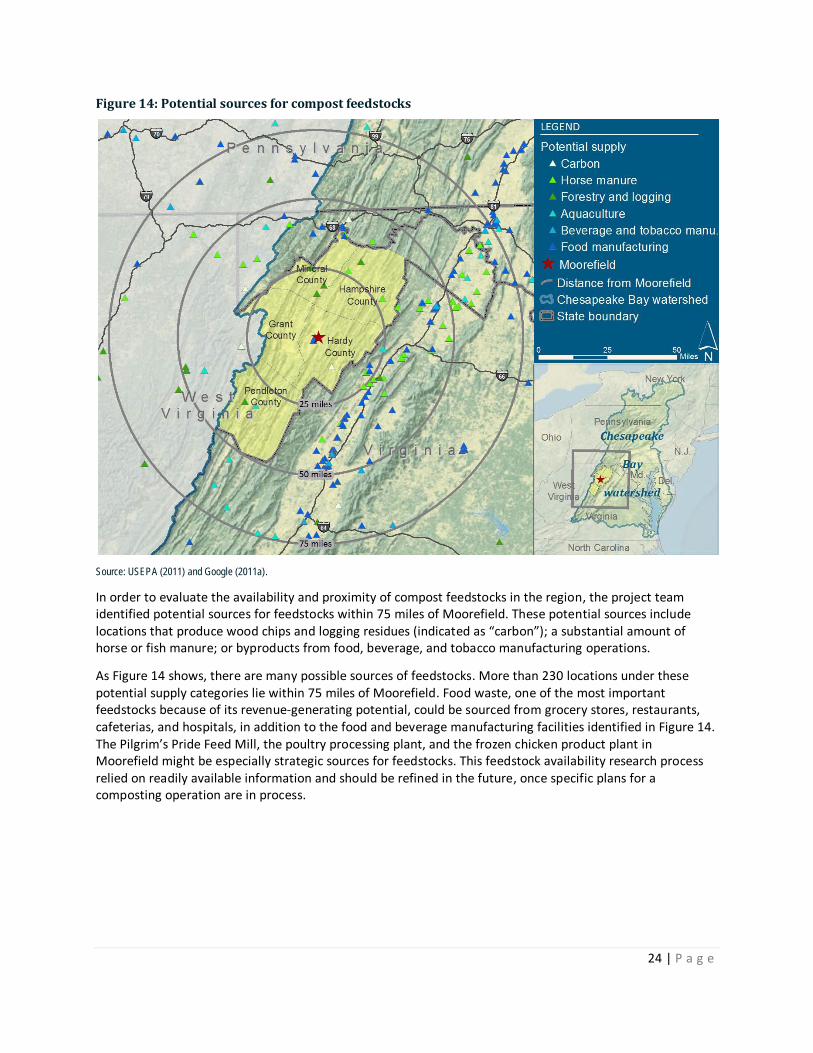
The viability of a composting facility also depends on demand for its finished product. Figure 15 depicts the locations of venues and buyers that might have a high demand for the finished compost product. These locations include turf farms, soil preparation facilities, garden centers, landscaping companies, nurseries, organic farms, and specialty stores; there are about 101 of these locations within 75 miles of Moorefield.11
Figure 15: Potential compost sales venues and buyers
Source: USEPA (2011) and Google (2011b).
The highest prices for compost can be achieved in the retail specialty market, as opposed to in bulk. In 2011, Oregon Dairy Organics sold compost for $12.50 per cubic yard wholesale, which is lower than most other composting companies surveyed (Table 2). Garden centers, landscaping companies, and nurseries can be especially good sales venues, as they sometimes offer the opportunity for both retail and wholesale sales.
Figure 15 excludes vineyards, orchards, land in field crops, abandoned mine land remediation sites, and other locations that could demand significant amounts of compost. This analysis also excludes any segregation of the market based on income level. It has been especially helpful to Panorama Pay-Dirt to be located near clientele with high enough income to be able to afford a high-end compost product (Murray, 2011b).
11 The identification of these locations is not meant to be comprehensive, but rather to identify hotspots of potential compost sales.
26 | P a g e
3.3 Facility siting considerations
In addition to striking some balance between available feedstocks and demand locations, a poultry litter composting operation requires proximity to major highways for ease of transport. An ideal composting location also has either few neighbors or tolerant neighbors; regardless of the cleanliness of any commercial-scale composting facility, it is likely to draw attention. An existing member of CPGA might have a suitable location for a composting facility near Moorefield (Weaver, 2011b).
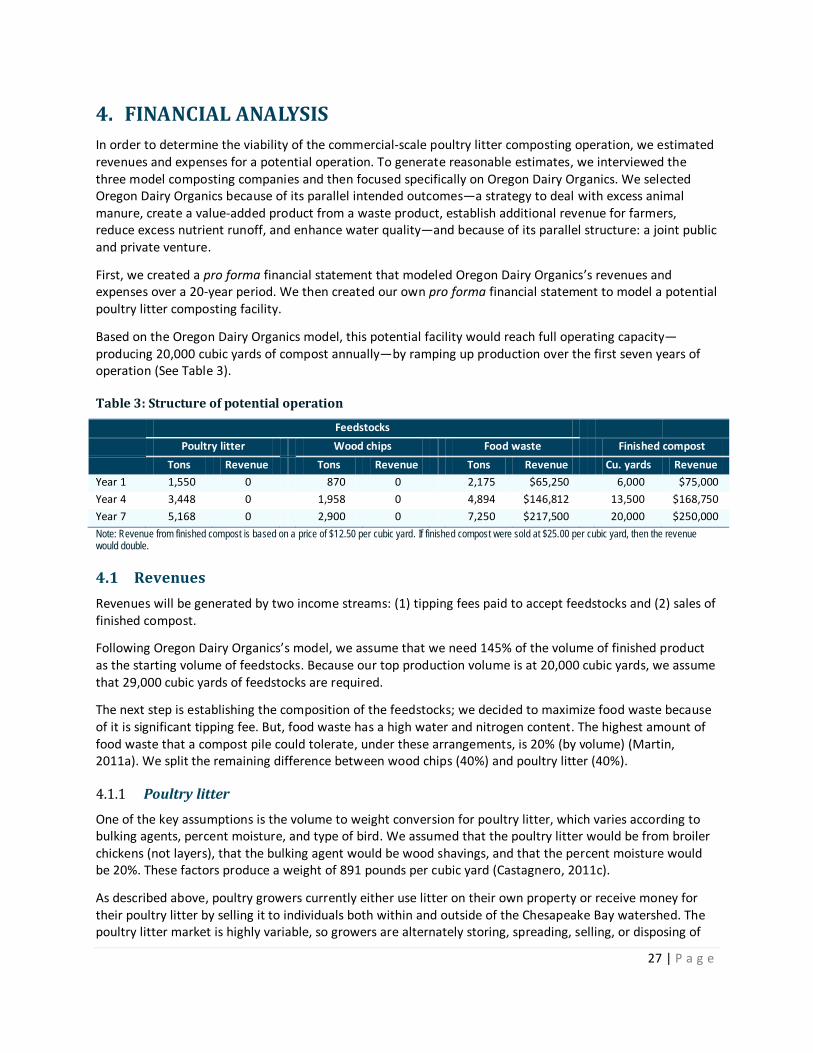
27 | P a g e
4. FINANCIAL ANALYSIS In order to determine the viability of the commercial-scale poultry litter composting operation, we estimated revenues and expenses for a potential operation. To generate reasonable estimates, we interviewed the three model composting companies and then focused specifically on Oregon Dairy Organics. We selected Oregon Dairy Organics because of its parallel intended outcomes—a strategy to deal with excess animal manure, create a value-added product from a waste product, establish additional revenue for farmers, reduce excess nutrient runoff, and enhance water quality—and because of its parallel structure: a joint public and private venture.
First, we created a pro forma financial statement that modeled Oregon Dairy Organics’s revenues and expenses over a 20-year period. We then created our own pro forma financial statement to model a potential poultry litter composting facility.
Based on the Oregon Dairy Organics model, this potential facility would reach full operating capacity—producing 20,000 cubic yards of compost annually—by ramping up production over the first seven years of operation (See Table 3).
Table 3: Structure of potential operation
Feedstocks
Poultry litter Wood chips Food waste Finished compost
Tons Revenue Tons Revenue Tons Revenue Cu. yards Revenue
Year 1 1,550 0 870 0 2,175 $65,250 6,000 $75,000
Year 4 3,448 0 1,958 0 4,894 $146,812 13,500 $168,750
Year 7 5,168 0 2,900 0 7,250 $217,500 20,000 $250,000
Note: Revenue from finished compost is based on a price of $12.50 per cubic yard. If finished compost were sold at $25.00 per cubic yard, then the revenue would double.
4.1 Revenues
Revenues will be generated by two income streams: (1) tipping fees paid to accept feedstocks and (2) sales of finished compost.
Following Oregon Dairy Organics’s model, we assume that we need 145% of the volume of finished product as the starting volume of feedstocks. Because our top production volume is at 20,000 cubic yards, we assume that 29,000 cubic yards of feedstocks are required.
The next step is establishing the composition of the feedstocks; we decided to maximize food waste because of it is significant tipping fee. But, food waste has a high water and nitrogen content. The highest amount of food waste that a compost pile could tolerate, under these arrangements, is 20% (by volume) (Martin, 2011a). We split the remaining difference between wood chips (40%) and poultry litter (40%).
4.1.1 Poultry litter
One of the key assumptions is the volume to weight conversion for poultry litter, which varies according to bulking agents, percent moisture, and type of bird. We assumed that the poultry litter would be from broiler chickens (not layers), that the bulking agent would be wood shavings, and that the percent moisture would be 20%. These factors produce a weight of 891 pounds per cubic yard (Castagnero, 2011c).
As described above, poultry growers currently either use litter on their own property or receive money for their poultry litter by selling it to individuals both within and outside of the Chesapeake Bay watershed. The poultry litter market is highly variable, so growers are alternately storing, spreading, selling, or disposing of

28 | P a g e
their litter. Therefore, we evaluated the economic viability of the poultry litter composting facility if growers were to donate their poultry litter and if growers were paid up to the summer 2011 going price of $13 per ton for their litter. Some poultry growers may be increasingly unwilling to part with their litter because fertilizer prices have been increasing in the recent years (Basden, 2012).
Some CPGA members would be willing to give away poultry litter to a composing facility for free, or for some share of the finished compost product or profits, depending on the state of the poultry market (Weaver, 2011a). Therefore, we also evaluated the economic viability when poultry litter was donated but a portion of the finished compost product was given back to the growers who had donated.
As described above, in our analysis, poultry litter would provide 40% of the 29,000 cubic yards of feedstocks. At the highest level of production (achieved in Year 7), the operation would require 5,168 tons (equivalent to 11,600 cubic yards). Year 1 and Year 4 would require 1,550 and 3,488 tons, respectively (Table 3).
4.1.2 Wood chips
Wood chips are required to balance out the nutrient ratios of the compost and provide structure for aeration (bulky material like wood chips allow more air pockets to aid in aeration of the pile).12
Table 3
Under this analysis, wood chips would provide 40% of the volume of feedstocks. In Year 1, the facility would require 870 tons, in Year 4 it would require 1,958 tons, and in Year 7, 2,900 tons. We assume no purchase and no tipping fee for wood chips ( ), because two of the three model composting companies do not pay for wood chips.13
4.1.3 Food waste
Of the three feedstocks, food waste is the only one providing revenue. Therefore, food waste is a critical component of the feedstock composition. We used a tipping fee of $30 a ton for food waste. Tipping fee revenue from the food waste ramps up to $217,500 in Years 7 through 20, which is a significant percentage of the income stream for the entire project.
While the exact sources of food waste need to be explored, we believe that the primary sources would be grocery stores, food manufacturing plants, and processing facilities.
Food waste would provide 20% of the 29,000 cubic yards of feedstocks. In Year 1, the facility would require 2,175 tons of food waste, in Year 4, 4,894 tons, and in Years 7-20, 7,250 tons. The income from accepting food waste starts at $61,250 in Year 1, grows to $146,813 in Year 4, and levels off at $217,500 in Years 7 through 20.
4.1.4 Finished compost
As mentioned above, we are ramping up to 20,000 cubic yards of finished compost in Year 7. We assume that the sales price would be consistent with Oregon Dairy’s sales price of $12.50 per cubic yard. Using these assumptions, by Year 7, the facility would generate $250,000 per year in revenue from compost sales. If finished compost were sold at $25.00 per cubic yard, then the revenues from compost sales would double. Both prices for finished compost are investigated in this chapter.
4.1.5 Total revenues
Figure 16 illustrates the revenue streams associated with this potential facility. Again, because poultry litter and wood chips are accepted without a tipping fee, total revenues are the sum of the tipping fees collected for food waste and the sales of finished compost. Under this scenario, total revenues ramp up to $467,500 per year at Year 7.
12 These wood chips are distinct from the wood shavings that comprise poultry bedding material. 13 Grant County Mulch may be a possible source for wood chips in the region; possible sources for wood chips merits further research.

29 | P a g e
Figure 16: Revenues from food waste and finished compost
Source: Pro forma financial statement based on assumptions described in this report. Note: Revenue from finished compost is based on a price of $12.50 per cubic yard. If finished compost were sold at $25.00 per cubic yard, then the revenue would double.
4.2 Expenses
There are two broad categories of expenses: (1) annual operating expenses such as personnel and utilities and (2) capital expenditures for equipment, land, and buildings. Any capital expenditures not paid through grants would be financed by some combination of debt or equity.
Each of these expenses may be fixed or variable from year to year and is discussed in more detail in the following sections. Government cost share programs, loan incentives, and taxes may add or detract from the profitability of an operation, but have been substantially excluded from this analysis.14
4.2.1 Operating expenses
Generally, we estimated annual operating expenses to be the same as those incurred by Oregon Dairy Organics’s operations. All operating expenses are variable. Some ramp up over the first seven years, and
14 In preparing the financial analysis, income tax consequences have been omitted. While these consequences may be significant to the project’s bottom line, the impact of income taxes is highly dependent upon the business structure and type of entity that operates the facility, as well as the applicable tax rate—all of which are unknown at this juncture. However, a few points about income tax merit discussion and may inform decisions about entity choice and business structure if this project proceeds. If the facility is operated by a federally recognized tax-exempt entity (i.e., a non-profit), it will not be subject to income tax. If the facility is operated by any other type of entity, in years in which a profit is projected, the facility’s net income would be reduced by the amount of income tax assessed. Depending upon the entity type and business structure, in years in which a loss is projected, a tax benefit may be enjoyed. For example, if this facility is operated by a pass-through entity (such as a partnership, limited liability company, or S corporation), income and losses are passed through to the owners; therefore, tax consequences occur at the individual level rather than at the entity level. In years in which the facility incurs a loss, this loss would be passed through to the owners who could offset income from other activities, thereby enjoying a tax benefit. If the facility is operated by a parent C corporation, the parent corporation can offset other income with the composting facility’s losses, thereby enjoying a tax benefit at the entity level. Finally, if the facility is operated by a C corporation that does not have income from other operations, carryover rules would allow the corporation to offset income from past years or income the corporation may have in future years.
$0
$50
$100
$150
$200
$250
$300
1 2 3 4 5 6 7 8 9 10 11 12 13 14 15 16 17 18 19 20
Rev
enue
(Tho
usan
d $)
Year
Finished compost
Food waste

30 | P a g e
some take other paths (Figure 17). For example, insurance expenses are likely to plateau in Year 4, while personnel expenses are likely to plateau in Year 9 (Martin, 2011b).
One of the most influential factors on variable operating costs is the pattern of equipment purchasing. We assume that the equipment is first purchased in Year 1 and that the lifecycle of the equipment is ten years. Therefore, we assume that it would be necessary to replace all of the equipment in Year 11. This has implications for two annual operating expenditures: the operations and maintenance and the operations and maintenance contingency fund. It has further implications for capital costs, because in addition to the start-up cost, a significant additional capital expenditure is required in Year 11.
While no operating expenses are fixed throughout the entire 20-year period, some operating expenses are fixed after Year 4. These include insurance, property tax, supplies, and advertising and marketing. Other expenses are fixed after Year 3; these include fuel and miscellaneous expenses.
Figure 17: Annual operating expenses
Source: Pro forma financial statement based on assumptions described in this report.
4.2.2 Capital expenses
Capital expenses include those incurred during land acquisition, site preparation, building construction, and composting equipment acquisition (described above). In order to open the facility, we anticipate needing $1.9 million in start-up funding to cover site construction and preparation, a structure, and composting equipment. We assume that any grants received would be applied toward these start-up expenses, and that the balance would be split between debt (80%) and equity (20%).
The first expenditure is the purchase or lease of land on which to build a facility. In this analysis, we assume that the land was donated, as a CPGA member might be willing to contribute land or donate the use of land for the potential facility (Weaver, 2011b).
$0
$20
$40
$60
$80
$100
$120
$140
$160
1 2 3 4 5 6 7 8 9 10 11 12 13 14 15 16 17 18 19 20
Ann
ual o
pera
ting
exp
ense
(Tho
usan
d $)
Year
Personnel
Operations & Maintenance
Fuel
Insurance
Other Expense
Operations & Maintenance Contingency Fund
Property Tax
Utilities
Supplies
Advertising and Marketing

31 | P a g e
In the pro forma, financed capital expenditures show in depreciation and also as debt interest and principal payments. The equity investment shows as depreciation of capital expenses and as an expense in Year 1. We assume that the structure will depreciate over 30 years and that the equipment will depreciate over seven years, both with straight-line depreciation.
4.3 Profitability
We evaluate the profitability of the poultry litter composting facility based on the net present value (NPV) of the project over a 20-year time period. This analysis integrates all of our assumptions about revenues, annual operating expenses, and capital expenses. Positive NPVs indicate that a project’s future revenues exceed its future costs, after accounting for the time value of money.15 Projects with positive NPVs are projected to be profitable over the long term and should be considered by private investors, while projects with negative NPVs are projected to lose money over the long term.16 The higher the NPV, the more attractive the investment. 17
Three factors— the price charged for finished compost, the price per ton paid to growers for their poultry litter, and the amount of grant funding—are the most important determinants of profitability. Other factors also influence the profitability and should be further examined in a later iteration of this project.
Figure 18 illustrates the NPVs calculated for different combinations of these three factors. The red, blue, and purple lines show NPVs if grants were secured that totaled $1.9 million (100% of the required start-up capital), $1 million (approximately half of the required start-up capital), or zero. The solid lines show NPVs if finished compost were sold at $12.50 per cubic yard, while the dashed lines show NPVs if finished compost were sold at $25 per cubic yard. As a point of comparison, Oregon Dairy Organics received almost $2.5 million in grant funding for the start up of its operation and sells its compost for $12.50 per cubic yard. For the existing composting companies in the Mid-Atlantic region surveyed for this project, the average price charged for finished compost was just over $25 per cubic yard (See Table 2).18
Each of the six lines in this figure illustrates how the NPV will vary based on the price paid for poultry litter. The range varies from $0 per ton, as is the case when poultry growers give litter away, to $13 per ton, the going rate for poultry litter in summer 2011 (Weaver, 2011b). Fibrowatt’s proposed price of $5 per ton is near the middle. Also, as further points of comparison, some CPGA members might be willing to provide some of their litter for free to the composting operation (Weaver, 2011a), yet 70% of the growers surveyed in the Potomac Valley Conservation District indicated that would need to receive more than $11 per ton for their litter.
15 For the NPV analysis, we use real dollars and a 5% discount rate. 16 While a positive NPV is an important predictor of the viability of the project over a 20-year horizon, other indicators are important as well. For example, some projects with positive NPVs may have a series of years with negative cash flows that would make it difficult for the operation to survive. While the NPV calculation, in total, indicates that the project is viable over the whole 20-year period, the pattern of predicted cash flows should also be considered. 17 We also calculate the internal rate of return (IRR), which is the discount rate that would produce an NPV of zero. A higher IRR represents a more profitable investment. However, because we calculate a wide range of scenarios (grants from zero to $1.9 million, prices paid for poultry litter from zero to $13/ton, and prices received for compost of $12.50 or $25/cubic yard), only some combinations of these scenarios present realistic IRRs. Given that our NPV calculations provide useful information about this entire range of scenarios, we do not show the IRR results. 18 This average excludes the mushroom compost, which is sold for $2 per ton.
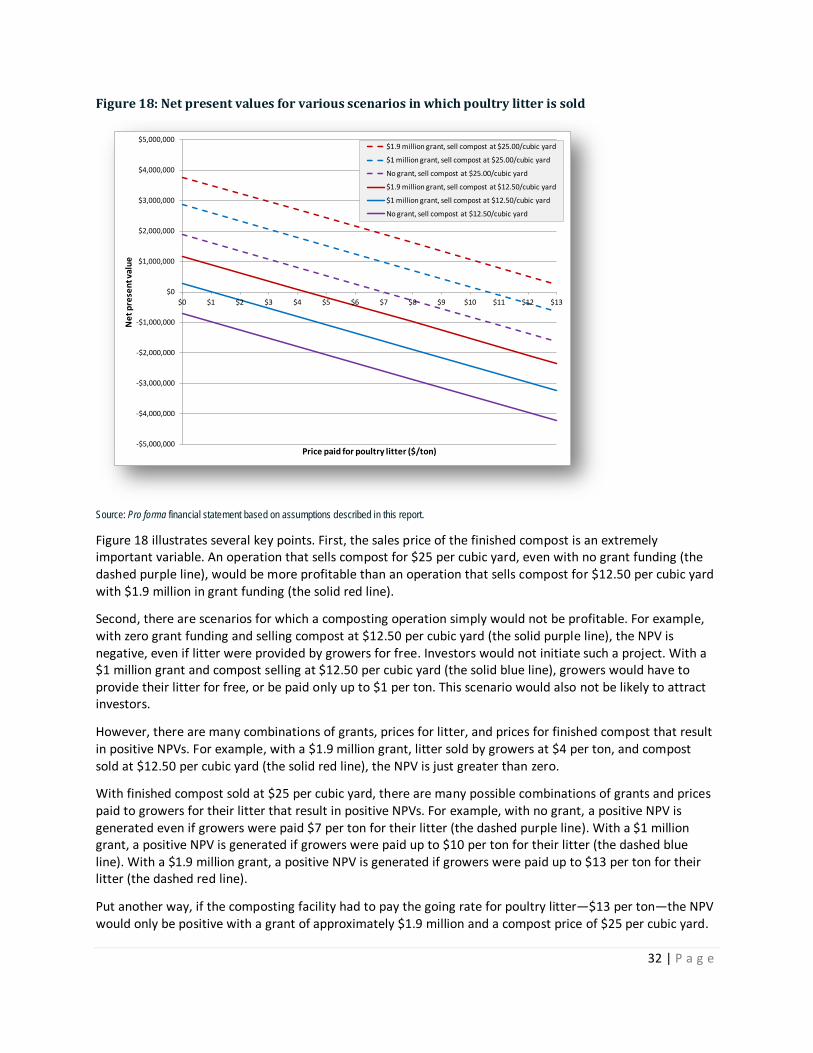
32 | P a g e
Figure 18: Net present values for various scenarios in which poultry litter is sold
Source: Pro forma financial statement based on assumptions described in this report.
Figure 18 illustrates several key points. First, the sales price of the finished compost is an extremely important variable. An operation that sells compost for $25 per cubic yard, even with no grant funding (the dashed purple line), would be more profitable than an operation that sells compost for $12.50 per cubic yard with $1.9 million in grant funding (the solid red line).
Second, there are scenarios for which a composting operation simply would not be profitable. For example, with zero grant funding and selling compost at $12.50 per cubic yard (the solid purple line), the NPV is negative, even if litter were provided by growers for free. Investors would not initiate such a project. With a $1 million grant and compost selling at $12.50 per cubic yard (the solid blue line), growers would have to provide their litter for free, or be paid only up to $1 per ton. This scenario would also not be likely to attract investors.
However, there are many combinations of grants, prices for litter, and prices for finished compost that result in positive NPVs. For example, with a $1.9 million grant, litter sold by growers at $4 per ton, and compost sold at $12.50 per cubic yard (the solid red line), the NPV is just greater than zero.
With finished compost sold at $25 per cubic yard, there are many possible combinations of grants and prices paid to growers for their litter that result in positive NPVs. For example, with no grant, a positive NPV is generated even if growers were paid $7 per ton for their litter (the dashed purple line). With a $1 million grant, a positive NPV is generated if growers were paid up to $10 per ton for their litter (the dashed blue line). With a $1.9 million grant, a positive NPV is generated if growers were paid up to $13 per ton for their litter (the dashed red line).
Put another way, if the composting facility had to pay the going rate for poultry litter—$13 per ton—the NPV would only be positive with a grant of approximately $1.9 million and a compost price of $25 per cubic yard.
-$5,000,000
-$4,000,000
-$3,000,000
-$2,000,000
-$1,000,000
$0
$1,000,000
$2,000,000
$3,000,000
$4,000,000
$5,000,000
$0 $1 $2 $3 $4 $5 $6 $7 $8 $9 $10 $11 $12 $13
Net
pre
sent
val
ue
Price paid for poultry litter ($/ton)
$1.9 million grant, sell compost at $25.00/cubic yard
$1 million grant, sell compost at $25.00/cubic yard
No grant, sell compost at $25.00/cubic yard
$1.9 million grant, sell compost at $12.50/cubic yard
$1 million grant, sell compost at $12.50/cubic yard
No grant, sell compost at $12.50/cubic yard
33 | P a g e
While growers will be more likely to participate if they receive the market rate for their litter, it is not totally out of the question for growers to provide enough litter, in total, to a composting facility without payment. This would be especially true if growers were to receive a portion of the finished compost for free. Members of the CPGA may be interested in receiving finished compost in exchange for litter (Weaver, 2011a). For example, the poultry litter inputs required for a facility of this scale is equivalent to 86 growers providing 60 tons of litter per grower, or 5,168 tons. This amount is equivalent to 11,600 cubic yards of poultry litter.19
Figure 19
These 86 growers represent only 15% of all the poultry growers in the five-county region (USDA, 2011b), and is about half of CPGA’s current membership.
further investigates NPVs should farmers provide litter for free. The lines again represent three different grant amounts and the two potential prices for finished compost, but in this figure, the NPVs vary based on the percentage of finished compost provided to the growers for free.
If finished compost were sold at $12.50 per cubic yard, then without a grant, the NPV is never positive (the solid purple line). With a $1 million or $1.9 million grant, however, the facility could afford to return about 10% or 45% of finished compost to the growers who donated their litter.
If finished compost were sold at $25 per cubic yard, then the results change dramatically. Even without a grant, about 35% of finished compost could be returned to growers, while maintaining a positive NPV (the dashed purple line). With a $1 million or $1.9 million grant, even more compost could be returned to growers (the dashed blue and red lines, respectively).
Figure 19: Net present values for various scenarios in which poultry litter is donated
Source: Pro forma financial statement based on assumptions described in this report. Note: For these scenarios, poultry litter is provided by growers to the composting facility for free.
19 This assumes that the facility ramps up to full production (20,000 cubic yards of product) over seven years. In Year 1, the facility would need 1,550 tons of litter, which could be provided by 26 growers. In Year 4, it would require 3,488 tons, which could be provided by 58 growers.
-$3,000,000
-$2,000,000
-$1,000,000
$0
$1,000,000
$2,000,000
$3,000,000
$4,000,000
$5,000,000
0% 5% 10% 15% 20% 25% 30% 35% 40% 45% 50%
Net
pre
sent
val
ue
Percent of finished compost provided for free to growers
$1.9 million grant, sell compost at $25.00/cubic yard
$1 million grant, sell compost at $25.00/cubic yard
No grant, sell compost at $25.00/cubic yard
$1.9 million grant, sell compost at $12.50/cubic yard
$1 million grant, sell compost at $12.50/cubic yard
No grant, sell compost at $12.50/cubic yard
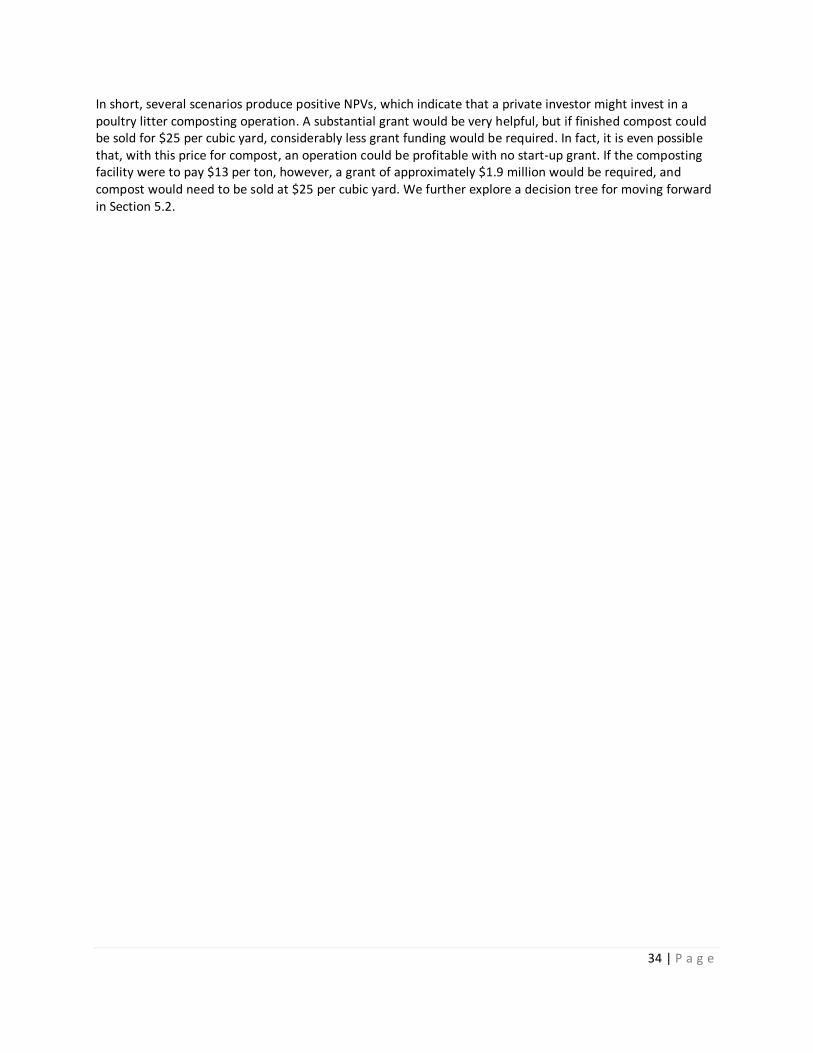
34 | P a g e
In short, several scenarios produce positive NPVs, which indicate that a private investor might invest in a poultry litter composting operation. A substantial grant would be very helpful, but if finished compost could be sold for $25 per cubic yard, considerably less grant funding would be required. In fact, it is even possible that, with this price for compost, an operation could be profitable with no start-up grant. If the composting facility were to pay $13 per ton, however, a grant of approximately $1.9 million would be required, and compost would need to be sold at $25 per cubic yard. We further explore a decision tree for moving forward in Section 5.2.

35 | P a g e
5. CONCLUSIONS AND RECOMMENDATIONS
5.1 Conclusions
This feasibility study evaluates a poultry litter composting facility through industry research, geospatial analysis, and financial analysis. Themes from each of these subsections include:
• There is a substantial amount—more than 110,500 tons—of poultry litter produced annually in the Potomac Valley Conservation District five-county region. This region has 98% of the poultry inventory of the entire state.
• Composting is not a new strategy for dealing with excess animal manure. Other composting companies appear to succeed by diversifying their business structure.
• Adequate and nearby feedstock supplies exist; food waste is a particularly valuable feedstock because of its high tipping fee.
• There are several combinations of grants, compost sales prices, and amounts paid for litter that would result in a composting operation with a positive NPV over a 20-year horizon.
In addition to economic profitability, this facility would have to be evaluated in terms of environmental impact, that is, in reduced nutrient loads in the Chesapeake Bay watershed.
If the poultry litter composting operation were to be modeled after Oregon Dairy Organics in size and scope (as this study suggests), it would use 5,168 tons per year of litter, at most. This amount is less than 5% of the total amount of litter produced annually in the study region. While it would not entirely solve the problem of excess agricultural nutrients draining to the Chesapeake Bay, it may be one of an array of strategies for reducing total nutrient loads, if economic viability requirements are met.
5.2 Recommendations
The financial analysis identifies a range of scenarios that would result in a viable poultry litter composting operation, yet all possible scenarios depend on the answer to the question: Will poultry growers participate and be willing to part with their litter, either for free or for some price? In order to evaluate the implications of the answer of this question on the financial viability of the potential facility, we propose a decision tree (Figure 20). This decision tree guides the user through key variables—including the compost price, price of litter, amount of compost returned to poultry growers, and amount of grant funding required—and depicts nine possible outcomes with positive NPVs.
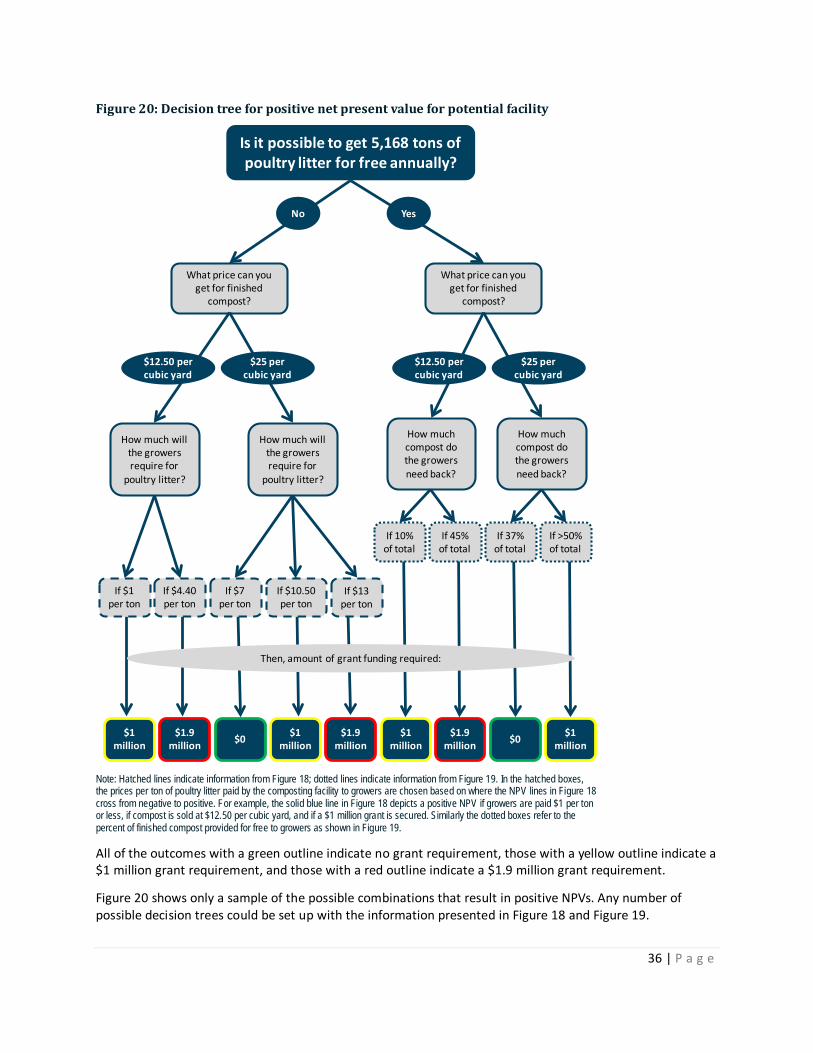
36 | P a g e
Figure 20: Decision tree for positive net present value for potential facility
Note: Hatched lines indicate information from Figure 18; dotted lines indicate information from Figure 19. In the hatched boxes, the prices per ton of poultry litter paid by the composting facility to growers are chosen based on where the NPV lines in Figure 18 cross from negative to positive. For example, the solid blue line in Figure 18 depicts a positive NPV if growers are paid $1 per ton or less, if compost is sold at $12.50 per cubic yard, and if a $1 million grant is secured. Similarly the dotted boxes refer to the percent of finished compost provided for free to growers as shown in Figure 19.
All of the outcomes with a green outline indicate no grant requirement, those with a yellow outline indicate a $1 million grant requirement, and those with a red outline indicate a $1.9 million grant requirement.
Figure 20 shows only a sample of the possible combinations that result in positive NPVs. Any number of possible decision trees could be set up with the information presented in Figure 18 and Figure 19.
What price can you get for finished
compost?
How much compost do the growers need back?
What price can you get for finished
compost?
How much compost do the growers need back?
How much will the growers require for
poultry litter?
How much will the growers require for
poultry litter?
$1 million
$1.9 million
$0 $1
million $1
million$1.9
million$0
$1 million
$1.9 million
Is it possible to get 5,168 tons of poultry litter for free annually?
YesNo
$12.50 per cubic yard
$12.50 per cubic yard
$25 per cubic yard
$25 per cubic yard
Then, amount of grant funding required:
If $1 per ton
If $4.40 per ton
If $7 per ton
If $10.50 per ton
If $13 per ton
If 10% of total
If 45% of total
If 37% of total
If >50% of total

37 | P a g e
Moving forward with this potential facility would require an answer to the fundamental question on poultry litter availability. After definitively answering this critical-path question, we recommend investing resources in answering these questions:
1. Does an adequate compost product market exist in the region, and what price per cubic yard can be charged?
2. Do poultry growers prefer to sell their litter, donate it, or provide it in return for some amount of finished compost for their poultry litter?
3. What potential sources of grant funding can amount to $1 million to $2 million?
There are other questions that greatly influence the viability of this project but are not depicted in the decision tree; these include: the availability of feedstocks—especially food waste20
Decisions will also have to be made regarding the specific location and potential project partners within existing composting, trucking, or agricultural operations. By developing a composting subsidiary within an existing business structure, the composting facility would gain efficiencies on par with those experienced by the successful composting companies described in this study.
—the structure of the organization operating the facility, and the degree to which composted poultry litter would enhance water quality in the Chesapeake Bay watershed.
Many future questions remain; answering these questions will be required before a final decision can be made. However, this study has clarified that a poultry litter composting operation can be viable, should poultry growers agree to provide litter, should a sufficient compost price be achievable, and should sufficient grant funding be secured.
20 Specifically, this project would require up to 7,250 tons of food waste annually at an appropriate tipping fee and up to 2,900 tons of free wood chips annually.
38 | P a g e
REFERENCES Basden T. 2012. Extension Specialist, Nutrient Management, West Virginia University Extension Service. Email correspondence with Author Hartz 26. Jan 2012.
Biocycle, 2012. Find a composter.com. Available here: http://www.findacomposter.com/listing/location/united-states
Butler RA. 2011. Phosphate rock price chart. Accessed 2 Dec. Available here: http://www.mongabay.com/images/commodities/charts/phosphate_rock.html.
Castagnero, C. 2011a. President of Ag Recycle, Inc. In-person conversation with Author Hartz. 19 Jul 2011.
__________ . 2011b. President of Ag Recycle, Inc. In-person conversation with Author Hartz. 6 Jul 2011.
__________ . 2011c. President of Ag Recycle, Inc. Telephone conversation with Author Hartz. 15 Nov 2011.
Chesapeake Bay Funders Network, 2011. “Reducing Nutrients through Farm-Based Composting”: Context, steps, and insights that will other communities replicate the successful project in Manheim Township, Lancaster, Pa.
Cordell D, Drangert J, White S. 2009. The story of phosphorus: Global food security and food for thought. Global Environmental Change. Vol. 92, Issue 2. P. 292-305
Elser J, White S. 2010. Peak Phosphorus. Foreign Policy. April 20, 2011. Accessed Dec 2, 2011. Available here: http://www.foreignpolicy.com/articles/2010/04/20/peak_phosphorus?page=0,0.
Faulkner JW, Basden T, Steele T, Seymour J, Huffman S, Workman D, Leather G. 2011. Chesapeake Bay TMDL Farmer Feedback Nights, Sep 19-26, 2011. West Virginia University Extension Service. Mineral, Grant, Hardy, Hampshire, and Pendleton Counties, W.Va.
Friedman S. 2012. Deputy Director, Working Lands Program, Environmental Defense Fund. Email correspondence with Author Hartz. 19 Jan 2012.
Fritsch DA, Collins AR. 1993. The economic feasibility of poultry litter composting facilities in eastern West Virginia. Agricultural and Resource Economics Review. Oct.
Google. 2011a. Searches on Google Earth and Google Maps for “food manufacturing,” “horse,” “logging,” “wood chips,” and etc. Conducted by Authors Hartz and Hereford. Nov 2011.
__________ . 2011b. Searches on Google Earth and Google Maps for “landscaping,” “nursery,” “garden,” “garden center”, “farm” and etc. Conducted by Authors Hartz and Hereford. Nov 2011.
Hansen E. 1999. Poultry Litter in the Potomac Headwaters: How Can We Reach a Long-term Balance? Downstream Strategies. Submitted to Potomac Headwaters Resource Alliance. In partnership with West Virginia Rivers Coalition. Feb.
Hardy C. 2011. Watershed Program Coordinator, Moorefield Office, West Virginia Conservation Agency. Telephone conversation with Author Hartz. 17 Mar 2011.
Hedrick M. 2012. Nutrient Management Specialist, West Virginia Department of Agriculture. Telephone conversation with Author Peters. 5 Jan 2012.
Lichtenberg E, Parker D, Lynch L. 2002. Economic value of poultry litter supplies in alternative uses. University of Maryland, Center for Agricultural and Natural Resource Policy. Policy Analysis Report No. 02-02.
Martin L. 2011a. General Manager, Terra Gro. Email correspondence with Authors Hartz. 2 Dec 2011.

39 | P a g e
__________ . 2011b. General Manager, Terra Gro. Telephone conversation with Authors Hartz and Hansen. 11 Nov 2011.
Mid-Atlantic Water Program. 2007. West Virginia County-Level Historical Trends. Manure phosphorus with crop phosphorus. US Department of Agriculture and Cooperative State Research, Education, and Extension Services. http://www.mawaterquality.agecon.vt.edu/WV/P_county_trends/WVcty_ManureP_vs_CropP_2007.php
Murray S. 2012. Founder of Panorama Pay-Dirt. Email correspondence with Author Hartz. 24 Jan 2012.
__________ . 2011a. Founder of Panorama Pay-Dirt. Telephone conversation with Author Hartz. 14 Sep 2011
__________ . 2011b. Founder of Panorama Pay-Dirt. In-person conversation with Author Hartz. 28 Jun 2011.
__________ . 2011c. Founder of Panorama Pay-Dirt. Email correspondence with Author Hartz. 12 Dec 2011.
Parker D, Collins A. 2007. Poultry litter management in two Mid-Atlantic States. Selected paper prepared for presentation at the Northeast Agricultural Economics Association 2007 Annual Meeting, Rehoboth Beach, Delaware Jun 10-12, 2007.
Parrish R. 2011. Senior Attorney, Southern Environmental Law Center. Presentation 24 Oct 2011 “Chesapeake Bay TMDL: Legal Issues and Local Implications.”
Patel S. 2011. Solid Waste Permitting Supervisor, West Virginia Department of Environmental Protection. Telephone conversation with Author Peters. 7 Dec 2011.
Ritz C. 2012. Associate Professor and Poultry Extension Specialist, University of Georgia College of Agricultural and Environmental Sciences. Email correspondence with Author Hartz. 20 Jan 2012.
Soil Association. 2010. A rock and a hard place: Peak phosphorus and the threat to our food security. Accessed 2 Dec 2011. Available here: www.soilassociation.org/LinkClick.aspx?fileticket=eeGPQJORrkw%3D.
United States Department of Agriculture (USDA). 2008. National Agricultural Statistics Service. West Virginia Annual Statistics Bulletin Number 39. http://www.nass.usda.gov/Statistics_by_State/West_Virginia/Publications/Annual_Statistical_Bulletin/index.asp
__________ . 20011a. Economic Research Service. State fact sheets: West Virginia. 2007 Census of Agriculture. Accessed Dec 2011. Available here: http://www.ers.usda.gov/StateFacts/WV.htm#FC
__________ . 20011b. National Agricultural Statistics Service. 2007 Census of Agriculture. Quick Stats 2.0 Beta. Queries performed by Authors Hereford and Hartz.
United States Environmental Protection Agency (USEPA). 2010. Chesapeake Bay Total Maximum Daily Load for Nitrogen, Phosphorus, and Sediment. Region 3. Dec 29. http://www.epa.gov/reg3wapd/tmdl/ChesapeakeBay/tmdlexec.html.
__________ . 2011. Facility Registry System. Query performed Nov 11 for NAICS beginning 113, 311, 312, 1125, and 115111. http://www.epa.gov/enviro/html/fii/fii_query_java.html
Virginia Cooperative Extension. 2011. Mid-Atlantic Composting Directory. http://pubs.ext.vt.edu/452/452-230/452-230.html
Virginia Department of Conservation and Recreation. 2005. Virginia Nutrient Management Standards and Criteria. Division of Soil and Water Conservation.
Virginia Department of Environmental Quality. 2011. Shenandoah Valley Poultry Litter to Energy Watershed & Air Advisory Group. 28 Mar 2011 Meeting summary. Harrisonburg, VA. Available here:
40 | P a g e
http://townhall.virginia.gov/L/GetFile.cfm?File=E:\townhall\docroot\\meeting\53\16139\Minutes_DEQ_16139_v1.pdf
Walker F. Undated. On-farm composting of poultry litter. The University of Tennessee, Agricultural Extension Service. P&SS Info: 319. https://utextension.tennessee.edu/publications/Documents/Info%20319.pdf
Weaver M. 20112a. President of the Contract Poultry Growers Association of the Virginias. Telephone conversation with Author Hartz. 12 Jan 2012.
__________ . 2012b. President of the Contract Poultry Growers Association of the Virginias. Email correspondence with Author Hartz. 18 Jan 2012.
__________ . 2012c. President of the Contract Poultry Growers Association of the Virginias. Telephone conversation with Author Hartz. 19 Jan 2012.
__________ . 2011a. President of the Contract Poultry Growers Association of the Virginias. Email correspondence with Author Hartz. 16 Nov 2011.
__________ . 2011b. President of the Contract Poultry Growers Association of the Virginias. Telephone conversation with Author Hartz. 16 Aug 2011.
__________ . 2011c. President of the Contract Poultry Growers Association of the Virginias. Telephone conversation with Author Hartz. 8 Feb 2011.
West Virginia Department of Environmental Protection (WVDEP). 2012. Construction Stormwater General Permit. http://www.dep.wv.gov/WWE/Programs/stormwater/csw/Pages/home.aspx. Accessed Jan 7.
__________ . 2009. NPDES Water Pollution Control Permit WV0111457, Stormwater Associated with Industrial Activity. http://www.dep.wv.gov/WWE/Programs/stormwater/multisector/Documents/2009%20MultiSector%20Stormwater%20General%20Permit.pdf. Issued Apr 1.
__________ . 2007. NPDES Water Pollution Control Permit WV0115924, Stormwater Associated with Construction Activities. http://www.dep.wv.gov/WWE/Programs/stormwater/csw/Documents/2007%20Construction%20Stormwater%20General%20Permit.pdf. Issued Nov 5.
__________ . 2006. West Virginia Erosion and Sediment Control Best Management Practice Manual. https://apps.dep.wv.gov/dwwm/stormwater/BMP/index.html
West Virginia Solid Waste Management Board. 2011. FY 2011 Solid Waste Management Plan. http://www.state.wv.us/swmb/RMDP/Index.htm#Solid_Waste_Management_Plan
West Virginia, State of. 2002. Memorandum of Understanding regarding cooperative efforts for the protection of the Chesapeake Bay and its rivers. Signed by Govern Bob Wise. Among the State of Delaware, District of Columbia, State of Maryland, State of New York, Commonwealth of Pennsylvania, Commonwealth of Virginia, state of Virginia, and United States Environmental Protection Agency.
West Virginia Tributary Strategy Stakeholders Working Group. 2005. West Virginia’s Potomac Tributary Strategy. In cooperation with the West Virginia Department of Environmental Protection, West Virginia Conservation Agency, and West Virginia Department of Agriculture. Nov 7.
West Virginia WIP Development Team. 2012. West Virginia’s Chesapeake Bay TMDL Phase II Draft Watershed Implementation Plan. In cooperation with the West Virginia Department of Environmental Protection, West Virginia Conservation Agency, and West Virginia Department of Agriculture. Jan 18.
41 | P a g e
__________ . 2010. West Virginia’s Chesapeake Bay TMDL Watershed Implementation Plan. In cooperation with the West Virginia Department of Environmental Protection, West Virginia Conservation Agency, and West Virginia Department of Agriculture. Nov 29.
The White House. 2009. Executive Order, Chesapeake Bay Protection and Restoration. Office of the Press Secretary. May 12.
Zublena JP, Barker JC, Carter TA. 1997. Soil Facts: Poultry manure as a fertilizer source. North Carolina Cooperative Extension Service. http://www.soil.ncsu.edu/publications/Soilfacts/AG-439-05/