fdi promotion: why and how? beata smarzynska javorcik university of oxford...
TRANSCRIPT


Is FDI really good for growth?
“One dollar of FDI is worth no more (and no less) than a dollar of any kind of investment” (D. Rodrik)
Yet, 59 out of 108 countries surveyed in the World Bank’s census of investment promotion agencies offered FDI incentives in 2004
Outline1. Why should we expect FDI to stimulate
growth in host countries?
2. Evidence on knowledge transfer to FDI recipients
3. Effect of FDI on other firms within the industry
4. Effect of FDI on firms in the supplying industries
5. Is FDI promotion effective?
6. Does IPI quality matter?

Technology transfer through FDI => economic growth
MNCs are responsible for most of the world’s R&D
700 multinational corporations accounted for 46% of the world’s total R&D expenditure and 69% of the world’s business R&D in 2002 (UNCTAD 2005)
R&D budgets of large multinationals may exceed R&D spending of some countries

R&D budgets of some MNCs exceed R&D spending of transition countries (2003)
0
1000
2000
3000
4000
5000
6000
7000
8000
CIS new EU memberstates
Ford Motor Pfizer DaimlerChrysler Siemens
mill
ion
s o
f U
S d
olla
rs
CIS figure includes: Russia, Armenia, Azerbaijan, Belarus, Georgia, Kazakhstan, Kyrgyzstan, Moldova, Tajikistan, Ukraine, Uzbekistan.New EU member states figure includes: Czech Rep, Estonia, Hungary, Latvia, Lithuania, Poland, Slovak Rep, Slovenia.

Outline1. Why should we expect FDI to stimulate
growth in host countries?
2. Evidence on knowledge transfer to FDI recipients
3. Effect of FDI on other firms within the industry
4. Effect of FDI on firms in the supplying industries
5. Is FDI promotion effective?
6. Does IPI quality matter?

Effect of FDI on recipient firms
Key question: Is the superior performance of foreign affiliates due to some intrinsic advantage of foreign ownership or are foreign investors simply good at picking acquisition targets?

Arnold and Javorcik (2009)
Examine this question using plant-level information on 400 new FDI recipients in Indonesia (1983-2001)
Compare the differences in the paths of development between FDI recipients and the control group
Control group: plants with similar observable characteristics before a foreign acquisition, operating in the same industry/year
1/n 1 to n[(ProductivityFDI recipient, post-FDI - ProductivityFDI recipient, pre-
FDI)
- (Productivitycontrol, post-FDI - Productivitycontrol, pre-FDI)]

Foreign ownership improves performance
Total factor productivity (in logs)
Pre-acquisitionYear
Acquisitionyear
One year later
Two years later
FDI recipients 0.864 1.079 1.142 1.215
Control group 0.867 0.976 1.022 1.083
Difference 0.106*** 0.122*** 0.135***(0.034) (0.045) (0.051)

Foreign ownership improves performance
While best performers tend to receive FDI, foreign ownership also leads to increased productivity
FDI recipients exhibit a 13.5% higher productivity growth by the end of the 3rd year under foreign ownership

Foreign ownership improves performance
Labor productivity (in logs)
Pre-acquisitionYear
Acquisitionyear
One year later
Two years later
FDI recipients 4.28 4.50 4.60 4.62
Control group 4.20 4.14 4.06 4.05
Difference 0.280*** 0.459*** 0.489***
(0.072) (0.074) (0.088)

FDI induces rapid changes(d) Employment
5.40
5.60
5.80
6.00
t-1 t0 t+1 t+2
(e) Average wage
7.607.808.008.208.408.608.809.00
t-1 t0 t+1 t+2
(c) Output
10.0010.2010.4010.6010.8011.0011.2011.40
t-1 t0 t+1 t+2

FDI leads to higher investment
(f) Investment
2.00
2.50
3.00
3.50
4.00
4.50
5.00
t-1 t0 t+1 t+2
(g) Investment in machinery
2.00
2.50
3.00
3.50
4.00
4.50
t-1 t0 t+1 t+2

FDI facilitates integration into global markets
(h) Export share
15
20
25
30
35
t-1 t0 t+1 t+2
(i) Import input share
15
20
25
30
35
40
45
t-1 t0 t+1 t+2
Outline1. Why should we expect FDI to stimulate
growth in host countries?
2. Evidence on knowledge transfer to FDI recipients
3. Effect of FDI on other firms within the industry
4. Effect of FDI on firms in the supplying industries
5. Is FDI promotion effective?
6. Does IPI quality matter?

FDI affects domestic firms through multiple channels (Czech Rep.)
0
10
20
30
40
50
60
Incr
ease
dco
mpe
titio
n
Loss
of m
arke
tsh
are
Loss
of
empl
oyee
s
Wor
sene
dac
cess
to c
redi
t
Info
rmat
ion
abou
t new
tech
nolo
gies
Info
rmat
ion
abou
t mar
ketin
gte
chni
ques
Hire
d fo
rmer
MN
C e
mpl
oyee
s
% o
f res
pond
ents

Competitors and non-competitors as sources of knowledge
From multinationals in the same sector which are % of Czech firms reporting competitors non-competitors learning about new technologies 26% 22% learning about new marketing techniques 12% 11%
benefiting from knowledge of employees trained by multinationals
5% 2%

Relative magnitudes of the effects differ by country
29
24
15
0
10
20
30
40
50
60
Incr
ease
dco
mpe
titio
n
Loss
of m
arke
tsh
are
Loss
of
empl
oyee
s
Wor
sene
d ac
cess
to c
redi
t
Info
rmat
ion
abou
tne
w te
chno
logi
es
Info
rmat
ion
abou
tm
arke
ting
tech
niqu
es
Hire
d fo
rmer
MN
Cem
ploy
ees
% o
f re
sp
on
de
nts
Czech Rep.
Latvia

Outline1. Why should we expect FDI to stimulate
growth in host countries?
2. Evidence on knowledge transfer to FDI recipients
3. Effect of FDI on other firms within the industry
4. Effect of FDI on firms in the supplying industries
5. Is FDI promotion effective?
6. Does IPI quality matter?

Effect of FDI on firms in the supplying industries While MNCs have an incentive to prevent
leakage of knowledge to their competitors, they may want to promote knowledge transfer to local suppliers
FDI boosts productivity in the supplying industries
Evidence from Lithuania (Javorcik 2004) Evidence from Indonesia (Gertler and Blalock
2007)

MNCs’ requirements vis a vis potential suppliers
0%
5%
10%
15%
20%
25%
30%
35%
40%
45%
50%
Improvequality
assurance
Acquire ISO9000
Improvetimeliness of
deliveries
Use newtechnology
Purchasenew
equipment
Improve theproduct
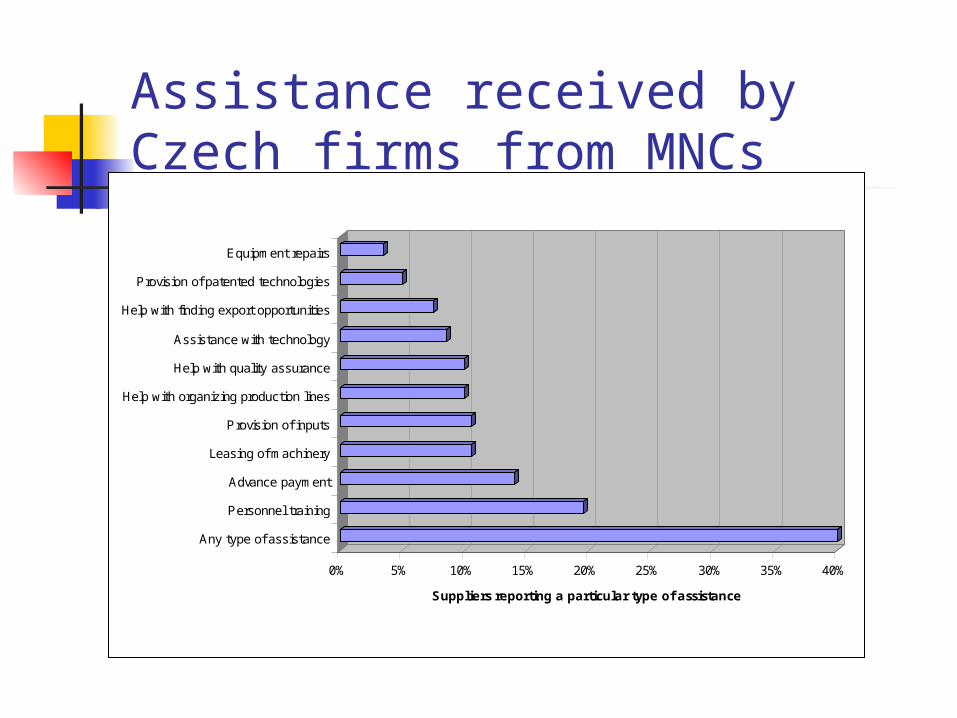
Assistance received by Czech firms from MNCs
0% 5% 10% 15% 20% 25% 30% 35% 40%
Suppliers reporting a particular type of assistance
Any type of assistance
Personnel training
Advance payment
Leasing of machinery
Provision of inputs
Help with organizing production lines
Help with quality assurance
Assistance with technology
Help with finding export opportunities
Provision of patented technologies
Equipment repairs

MNC suppliers Different from other firms: larger, with higher
capital-labor ratio, paying higher wages and more productive
High productivity firms are more likely to become suppliers
Suppliers learn from their relationships with MNCs
Javorcik and Spatareanu (2009)

Outline1. Why should we expect FDI to stimulate
growth in host countries?
2. Evidence on knowledge transfer to FDI recipients
3. Effect of FDI on other firms within the industry
4. Effect of FDI on firms in the supplying industries
5. Is FDI promotion effective?
6. Does IPI quality matter?
Why do investment promotion? Knowledge externalities as justification for
policy intervention
Information asymmetries between host countries and potential foreign investors are significant obstacles to investment flows across international borders
What can aspiring FDI destinations do to reduce such barriers?
Is investment promotion the answer?

Almost all countries are engaged in FDI promotion
0
20
40
60
80
100
120
1980 1982 1984 1986 1988 1990 1992 1994 1996 1998 2000 2002 2004
no
. o
f IP
As
IPAs in developing countries
IPAs in developed countries

Harding and Javorcik (2011)
Conducted a Census of IPIs on behalf of the World Bank
Point of departure Sector targeting considered best practice in investment promotion
Information on sector targeting Standardized list of targeted sectors with dates when the policy was in place
Data on FDI from the U.S. by country, sector and year (124 countries, 15 sectors, 1990-2004)
Did FDI inflows to targeted sectors increase during targeting?
(relative to non-targeted sectors)

Which sectors are targeted?
No. of countries targeting in 2004
0
5
10
15
20
25
30
35
40
45
50
Info
rma
tio
n
Oth
er
ind
us
trie
s
Fo
od
Ma
ch
ine
ry
Ele
ctr
ica
l e
qu
ipm
en
t
Fin
an
cia
l in
sti
tuti
on
s e
x.
De
p.
Ins
t.
De
po
sit
ory
in
sti
tuti
on
s
Pro
fes
sio
na
l a
nd
sc
i. s
erv
.
Ch
em
ica
ls a
nd
alli
ed
pro
du
cts
Pri
ma
ry f
ab
ric
ate
d m
eta
ls
Pe
tro
leu
m a
nd
min
era
ls
Tra
ns
po
rt e
qu
ipm
en
t
Uti
litie
s
Wh
ole
sa
le t
rad
e
Developed countries
Developing countries

Estimation results
Investment promotion generates higher FDI flows to developing countries and emerging markets:
Targeting increases FDI by 155%
Additional $17 mn dollars of FDI
Investment promotion is more effective in countries…
where information asymmetries are large
with burdensome bureaucratic procedures
IP: an inexpensive way of overcoming information asymmetries
Crude back-of-the-envelope cost-benefit exercises: Costs
$90,000 spent on average per sector targeted
Benefits Additional $17 mn of FDI in typical sector
=> $1 spent on investment promotion => $189 of FDI
Additional 1,159 jobs in foreign affiliates
=> cost of $78 per job created

Outline1. Why should we expect FDI to stimulate
growth in host countries?
2. Evidence on knowledge transfer to FDI recipients
3. Effect of FDI on other firms within the industry
4. Effect of FDI on firms in the supplying industries
5. Is FDI promotion effective?
6. Does IPI quality matter?

Measuring IPI qualityGlobal Investment Promotion Benchmarking (GIPB) assesses two aspects of IPIs:
Web site quality: content, architecture, design and promotional effectiveness relevant, clear and credible information presented in an
attractive and user-friendly way
Mystery shopper: handling of direct project inquiries from investor competence and responsiveness of the agency’s staff timeliness, quality and credibility of informational content

Quality of IPIs varies widely across countries
90% or above
80-89% 70-79% 60-69% 50-59% 40-49% 30-39% 20-29% 1-19% 0%0
20
40
60
80
100
120
Web site Inquiry handling

GIPB 2006-2012 scores by region

Unconditional scatter plot: ln FDI flows and IPI quality
AGO
ALB
ARG
ARM
ATG
AUSAUT
AZE
BDI
BENBFA
BGD
BGR
BHR
BHSBIH
BLR
BLZ
BOL
BRA
BRB
BRN
BTN
BWA
CAN
CHE
CHL
CHN
CMR
COG
COL
CPV
CRI
CYP
CZE
DEU
DJI
DMA
DNK
DOMDZA
ECU
EGY
ERI
ESP
EST
ETH
FIN
FJI
FRA
GAB
GBR
GEOGHA
GIN
GMB
GNB
GRC
GRD
GTM
GUY
HKG
HND
HRV
HTI
HUN
IDN
IND
IRL
IRN
IRQ
ISL
ISR
ITA
JAM
JOR
JPNKAZ
KENKGZ
KHM
KNA
KOR
KSV
KWT
LAO
LBN
LBR
LBY
LCA
LKA
LSO
LTU
LUX
LVA
MAR
MDA
MDGMDV
MEX
MKD
MLI
MNE
MNGMOZ
MUS
MWI
MYS
NAM
NER
NGA
NIC
NLD
NPL
NZL
OMN
PAK
PAN
PER
PHL
PNG
POL
PRT
PRY
ROM
RUS
RWA
SAU
SDN
SEN
SGP
SLBSLE
SLV
SRBSVK
SVN
SWE
SWZ
SYC
SYR
TGO
THA
TJK
TON
TTOTUN
TUR
TZA UGA
UKR
URY
USA
VCT
VEN
VNM
VUTWBG
WSM
YEM
ZAF
ZMB
1520
25F
DI
inflo
w (
in lo
gs)
0 20 40 60 80IPI quality
All countriesFDI inflow and IPI quality

Unconditional scatter plot: ln FDI flows and Inquiry handling quality
AGO
ALB
ARG
ARM
ATG
AUSAUT
AZE
BDI
BENBFA
BGD
BGR
BHR
BHSBIH
BLR
BLZ
BOL
BRA
BRB
BRN
BTN
BWA
CAN
CHE
CHL
CHN
CMR
COG
COL
CPV
CRI
CYP
CZE
DEU
DJI
DMA
DNK
DOMDZA
ECU
EGY
ERI
ESP
EST
ETH
FIN
FJI
FRA
GAB
GBR
GEO GHA
GIN
GMB
GNB
GRC
GRD
GTM
GUY
HKG
HND
HRV
HTI
HUN
IDN
IND
IRL
IRN
IRQ
ISL
ISR
ITA
JAM
JOR
JPNKAZ
KENKGZ
KHM
KNA
KOR
KSV
KWT
LAO
LBN
LBR
LBY
LCA
LKA
LSO
LTU
LUX
LVA
MAR
MDA
MDGMDV
MEX
MKD
MLI
MNE
MNGMOZ
MUS
MWI
MYS
NAM
NER
NGA
NIC
NLD
NPL
NZL
OMN
PAK
PAN
PER
PHL
PNG
POL
PRT
PRY
ROM
RUS
RWA
SAU
SDN
SEN
SGP
SLBSLE
SLV
SRBSVK
SVN
SWE
SWZ
SYC
SYR
TGO
THA
TJK
TON
TTOTUN
TUR
TZA UGA
UKR
URY
USA
VCT
VEN
VNM
VUTWBG
WSM
YEM
ZAF
ZMB
1520
25F
DI
inflo
w (
in lo
gs)
0 20 40 60 80Inquiry handling quality
All countriesFDI inflow and Inquiry handling quality

Unconditional scatter plot: ln FDI flows and Website quality
AGO
ALB
ARG
ARM
ATG
AUSAUT
AZE
BDI
BENBFA
BGD
BGR
BHR
BHSBIH
BLR
BLZ
BOL
BRA
BRB
BRN
BTN
BWA
CAN
CHE
CHL
CHN
CMR
COG
COL
CPV
CRI
CYP
CZE
DEU
DJI
DMA
DNK
DOMDZA
ECU
EGY
ERI
ESP
EST
ETH
FIN
FJI
FRA
GAB
GBR
GEOGHA
GIN
GMB
GNB
GRC
GRD
GTM
GUY
HKG
HND
HRV
HTI
HUN
IDN
IND
IRL
IRN
IRQ
ISL
ISR
ITA
JAM
JOR
JPNKAZ
KENKGZ
KHM
KNA
KOR
KSV
KWT
LAO
LBN
LBR
LBY
LCA
LKA
LSO
LTU
LUX
LVA
MAR
MDA
MDGMDV
MEX
MKD
MLI
MNE
MNGMOZ
MUS
MWI
MYS
NAM
NER
NGA
NIC
NLD
NPL
NZL
OMN
PAK
PAN
PER
PHL
PNG
POL
PRT
PRY
ROM
RUS
RWA
SAU
SDN
SEN
SGP
SLBSLE
SLV
SRBSVK
SVN
SWE
SWZ
SYC
SYR
TGO
THA
TJK
TON
TTOTUN
TUR
TZAUGA
UKR
URY
USA
VCT
VEN
VNM
VUTWBG
WSM
YEM
ZAF
ZMB
1520
25F
DI
inflo
w (
in lo
gs)
0 20 40 60 80 100Website quality
All countriesFDI inflow and Website quality

Does IPI quality matter?Empirical approach
Cross section analysis, 156 countries: Average IPI quality (GIPB06, GIPB09 and GIPB12) Average FDI inflows from all countries 2000-10 (IFS)
Controlling for: GDP per capita GDP growth Population size Inflation Political stability in host country

Findings
A one unit increase in the GIPB score associated with a 1.5% increase in FDI inflows
Going from Sub-Saharan Africa to Latin America in GIPB performance => 35-40% more FDI
(Harding and Javorcik 2013)

Results are robust to…
1. Focusing on developing countries only
2. Controlling for various aspects of the business climate
3. Using sector-specific information
4. Instrumenting for the quality of IPIs

Policy conclusions Evidence on knowledge externalities associated with FDI provides
justification for public support of IPIs
Successful investment promotion requires Professionalism, competence, effort and commitment to customer
service Up-to-date, attractive and user-friendly web site Providing relevant and useful information in the site selection
process makes a difference
The GIPB initiative and results: valuable guiding-tool for IPIs The GIPB criteria specify what high quality of inquiry handling and Web
sites mean Its assessment process can provides useful feedback on areas in need of
improvement

Thank you

ReferencesArnold, Jens and Beata S. Javorcik (2009). Gifted Kids or Pushy Parents? Foreign Acquisitions
and Firm Performance in Indonesia. Journal of International Economics 79(1)
Blalock, Garrick and Paul J. Gertler (2008). “Welfare Gains from Foreign Direct Investment through Technology Transfer to Local Suppliers” Journal of International Economics 74(2): 402-421
Harding, Torfinn and Beata Javorcik (2011). “Roll out the Red Carpet and They Will Come: Investment Promotion and FDI Inflows” Economic Journal 121(557)
Harding, Torfinn and Beata Javorcik (2013). “Investment Promotion and FDI Inflows: Quality Matters” CESifo Economic Studies forthcoming
Javorcik, Beata (2004). Does Foreign Direct Investment Increase the Productivity of Domestic Firms? In Search of Spillovers through Backward Linkages. American Economic Review 94(3): 605-627
Javorcik, Beata and Mariana Spatareanu (2009)."Tough Love: Do Czech Suppliers Learn from Their Relationships with Multinationals?“ Scandinavian Journal of Economics 111(4)
UNCTAD (2005). World Investment Report: Transnational Corporations and the Internalization of R&D. New York and Geneva: United Nations