fault interpretation and reservoir characterization of the
TRANSCRIPT
Scholars' Mine Scholars' Mine
Masters Theses Student Theses and Dissertations
Fall 2015
Fault interpretation and reservoir characterization of the Farewell Fault interpretation and reservoir characterization of the Farewell
Formation within Kerry Field, Taranaki Basin, New Zealand Formation within Kerry Field, Taranaki Basin, New Zealand
Waleed Deefallah M Alotaby
Follow this and additional works at: https://scholarsmine.mst.edu/masters_theses
Part of the Geophysics and Seismology Commons
Department: Department:
Recommended Citation Recommended Citation Alotaby, Waleed Deefallah M, "Fault interpretation and reservoir characterization of the Farewell Formation within Kerry Field, Taranaki Basin, New Zealand" (2015). Masters Theses. 7458. https://scholarsmine.mst.edu/masters_theses/7458
This thesis is brought to you by Scholars' Mine, a service of the Missouri S&T Library and Learning Resources. This work is protected by U. S. Copyright Law. Unauthorized use including reproduction for redistribution requires the permission of the copyright holder. For more information, please contact [email protected].
i
FAULT INTERPRETATION AND RESERVOIR CHARACTERIZATION OF THE
FAREWELL FORMATION WITHIN KERRY FIELD, TARANAKI BASIN, NEW
ZEALAND
By
WALEED DEEFALLAH M ALOTABY
A THESIS
Presented to the Faculty of the Graduate School of the
MISSOURI UNIVERSITY OF SCIENCE AND TECHNOLOGY
In Partial Fulfillment of the Requirements for the Degree
MASTER OF SCIENCE
IN
GEOLOGY AND GEOPHYSICS
2015
Approved by
Dr. Kelly Liu
Dr. Stephen Gao
Dr. Neil Anderson

ii
2015
Waleed Deefallah M Alotaby
All Rights Reserved
iii
ABSTRACT
The Kerry Field, located in the southern offshore Taranaki Basin, is a large liquid-
rich gas accumulation with a thin (20 m) oil rim. The field was discovered by the New
Zealand Oil & Gas in 1986 (well Kupe South-1). The gas and oil are trapped within a 9.2
km2 fault-dependent three-way dip closure in the Paleocene Farewell Formation reservoir.
Pressure, volume, and temperature (PVT) data indicate that the gas and oil columns in the
field are in equilibrium with one another and are saturated at current reservoir conditions.
The Farewell Formation is the uppermost formation of the Kapuni Group and is
producing gas and oil in the Kerry Field. The Farewell Formation is one of the oldest
reservoirs in the Taranaki Basin. The Kupe South-1 well penetrates two sequence
boundaries. One is an unconformity beneath the Late Miocene Urenui Formation, and the
other is beneath the Oligocene Otaraoa Formation, which appears to be in fault contact
with the Paleocene Farewell Formation. The Farewell Formation was deposited in the
fluvio-deltaic environment, and consists primarily of sandstone, interbedded with
carbonaceous mudstone. The thickness of the formation ranges from 261 to 382 m.
A time structure map, depth map, isochron map, edge detection map, and coherence
map were produced to identify the structures, especially the faults the study area. A
correlation across three wells along 19,089 m was generated to support the interpretation
the maps. Several faults are mapped that display seismic attributes. The water-oil contact
was found at a depth of 3,300 m. The density of the Farewell Formation ranges between
2.2 and 2.6 g/𝒄𝒎𝟑. The average porosity of the Farewell Formation ranges between 20 -24
present. The prospective areas for oil production are located in the north and the south-
west parts of the formation.

iv
ACKNOWLEDGMENTS
This thesis would not become reality without help and support of many individuals.
First I would like to thank Allah and the words are not enough. I would like to express my
gratitude toward my great parents and my lovely brothers. I am highly indebted to my
advisor Dr. Kelly Liu for her guidance, her knowledge, and her expertise in this study. Also
I would like to spread my deep appreciation and respect to my committee members Dr.
Stephen Gao and Dr. Neil Anderson. I would like to thank Mr. Essa Elbileikia for his
encouragement and providing help when it needed.
v
TABLE OF CONTENTS
Page
ABSTRACT ....................................................................................................................... iii
ACKNOWLEDGMENTS ................................................................................................. iv
LIST OF ILLUSTRATIONS ........................................................................................... viii
LIST OF TABLES .............................................................................................................. x
SECTION
1. INTRODUCTION ...................................................................................................... 1
1.1. OVERVIEW OF THE STUDY AREA .............................................................. 1
1.2. OBJECTIVES OF THE STUDY ........................................................................ 4
2. GEOLOGICAL SETTING ......................................................................................... 5
2.1. REGIONAL GEOLOGY .................................................................................... 5
2.1.1. Geological Setting and Tectonic History ................................................. 5
2.1.2. Stratigraphy of the Taranaki Basin ........................................................... 6
2.1.3. Farewell Formation ................................................................................ 10
2.1.4. Depositional Environment of the Farewell Formation ………....………...10
2.2. PETROLEUM SYSTEM OF THE TARANAKI BASIN …………...……….11
2.2.1. Source Rock and Seal ……………………………..……………………...11
2.2.2. Reservoir and Traps …...…………………………….………….………...12
3. DATA AND METHODS ......................................................................................... 14
3.1. THREE DIMENSSIONAL SEISMIC DATA .................................................. 14
3.1.1. Survey Program ...................................................................................... 14
3.1.2. Data Acquisition Parameters………………..……….………………….16

vi
3.1.2.1. Energy source………….……….……………………………….16
3.1.2.2. Streamers………………..………….………………….…..…….17
3.1.2.3. Recording………………………………...……………………..17
3.2. WELL LOG DATA ………………………………………….……………..18
3.3. INTERPRETATION WORKSTATION AND METHODOLOGY ….……19
4. SEISMIC INTERPRETATION………………………………………………………21
4.1. GENERATING SYNTHIC SEISMOGRAMS…...….……………………..21
4.2. WELL-TO-SEISMIC CALIBRATION……………………………….……22
4.3. HORIZON PICKING AND INTERPRETATION………………………….23
4.3.1. Volumetric Visualization ……………………...…...….………….28
4.3.2. Time Structure and Depth Maps …….…………….…..………….29
4.3.3. Isopach Map …………...……………………………...…….….…29
4.4. FAULT INTERPRETATION BY SEISMIC ATTRIBUTE……………..…33
4.4.1. Local Structure Azimuth ……………………….………………....33
4.4.2. Dip Angle Map…….…………..…………………...……………..34
4.4.3.Coherence Map………….…………………………………………35
4.4.4. Variance Map ……………………………...………..…….……...36
4.4.5. Edge Detection Map ……………………….……..………..……..37
5. WELL LOGGING CORRELATION …………………….…………………………..39
6. RESERVOIR CHARACTERIZATION…………...…………...……………………..40
6.1. PETROPHYSICAL ANALYSIS…………………………………………41
6.2. WATER SATURATION………...………………………………………..43
6.3. FACIES MODELING ……………..……………………………………..43

vii
6.4. POROSITY MODELING ……………………………………………….….45
6.5. NET-TO-GROSS RATIO…………………………………………………...47
6.6. ACOUSTIC IMPEDANCE MAP…………………………………...……...49
6.7. ROOT-MEAN SQUARE AMPLITUDE……………………………...……49
7. CONCLUSIONS........................................................................................................... 52
BIBLIOGRAPHY ............................................................................................................. 54
VITA ................................................................................................................................. 57

viii
LIST OF ILLUSTRATIONS
Page
Figure 1.1. Location of the study area ………………………………………………..…..2
Figure 1.2. Regional structural elements of the Taranaki Basin………………………..…3
Figure 2.1. NW-SE cross section of the Taranaki Basin…………………………….……7
Figure 2.2. Regional stratigraphy of the Taranaki Basin……………………………….…9
Figure 2.3. The depositional environment of the Farewell Formation...……….………..11
Figure 2.4. The petroleum system in the Taranaki Basin ………..……………………...13
Figure 3.1. Location of the 3D seismic survey in the Kerry Field …...……………….…14
Figure 3.2. Basemap of the Kerry Field ……….……..……………………………….…15
Figure 4.1. The extracted wavelet…………………………………………………….….21
Figure 4.2. A synthetic seismogram for Well Kupe South-1 within the study area……..22
Figure 4.3. A synthetic seismogram display on the vertical seismic section Inline
684………………….………………………………………………………..24
Figure 4.4. A Synthetic seismogram on vertical seismic section, crossline 378………...25
Figure 4.5. Inline 560 shown the top and base of the Farewell Formation and a minor
fault…………………………………………………………………………26
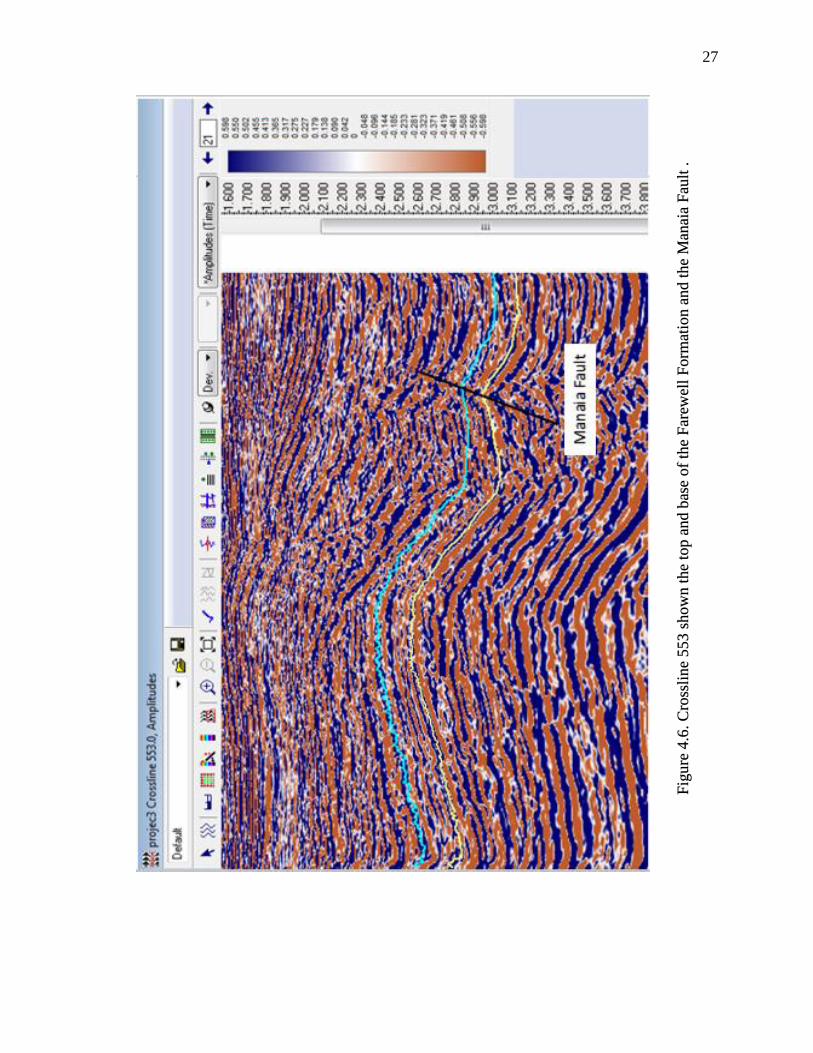
Figure 4.6. Crossline 553 Shown the top and base of the Farewell Formation and the
Manaia fault………… ……………………………………………………...27
Figure 4.7. Three-dimensional volume display showing both the top and the base of
the Farewell Formation with vertical sections line 673, the Kupe South
Fault, and minor faults…………..…………………..……..……………….28
Figure 4.8. Three-dimensional volume of the top of the Farewell Formation display
with vertical sections crossline 398, showing the Manaia Fault in
VuPAK………………………………….……………………………..……29
Figure 4.9. Time structure map of the top Farewell Formation, showing the high
structure trends from the south east to the north west………………………30

ix
Figure 4.10. Depth map of the top of the Farewell Formation, showing the high
structure trends from the south east to the north west that are caused by
major faults………………………………………………………………...31
Figure 4.11. Isopach map between the top and the base of the Farewell Formation…….32
Figure 4.12. Local structure azimuth map showing variation in the dip direction in the
Farewell Formation…………………………………………………………33
Figure 4.13. Dip angle map showing the differences between of fractures that occurred
in the faults………………………………………………………………….34
Figure 4.14. Coherence map, showing the major and minor faults in the Farewell
Formation………………………...………………………………………...35
Figure 4.15. The variance of the Farewell Formation at a depth of 2,900 m, major
faults are marked…………………………………………………...……….36
Figure 4.16. Edge detection map showing the major and minor faults in the Farewell
Formation…………………………………………………………………...38
Figure 5.1. The distribution of the Farewell Formation and the Kupe South Fault……...39
Figure 6.1. Logs showing the signtures of GR, DRHO, RESD, and DTC in the
Farewell Formation from well South Kupe-1……………………………….40
Figure 6.2. Crossplot of the bulk density and neutron porosity logs.…..………….…….42
Figure 6.3. Crossplot of bulk density and gamma ray logs……………………………...42
Figure 6.4. Two-dimensional facies modeling of the Farewell Formation.……..….……44
Figure 6.5. The facies and structure of the Farewell Formation…………………………45
Figure 6.6. The distrubution of porosity in the Farewell Formation at a depth of
2,900 m…………………………...………………………………………....46
Figure 6.7 Three-dimensional display of the porosity of the Farewell Formation……....47
Figure 6.8. The net-to-gross ratio throughout the Farewell Formation….……………....48
Figure 6.9. The acoustic impedance at 2900 m. Several bright spots are marked……….50
Figure 6.10. The Root-Mean-Square (RMS) amplitude of the Farewell Formation.
Two suggested prospect areas are marked by yellow ovals……...………..51
x
LIST OF TABLES
Page
Table 3.1. Survey information about the 3D seismic data……………………………….16
Table 3.2. Energy source parameters…………………………………………………….16
Table 3.3. Streamer parameters………………………………………………………….17
Table 3.4. Recording information………………………………………………………..17
Table 3.5. Well data in the study area……………………………………………………18
Table 6.1. The presenting of the lithology through the Farewell…………………...……44

1
1. INTRODUCTION
1.1. OVERVIEW OF THE STUDY AREA
The Kerry Field, also known as Kupe Field, is located offshore south-eastern
Taranaki Basin, New Zealand. Geographically, it located beneath shelf to deep marine
waters west of New Zealand’s North Island (Figure 1.1). The Kerry Field is located at the
southern end of the Manaia Anticline (Figure 1.2), where it is cross-cut by a series of NW-
SE striking normal faults. The largest of these faults, the Main Kupe South Fault defines
the southern side of the Kerry Field (Schmidt and Robinson, 1990). This area is
characterized by a simple basement platform overlain by up to 11000 m of a sedimentary
section.
This study is based mainly on a set of three dimensional data and on well logs from
three wells within an area of 410 𝐾𝑚2. The sail lines were shot in 002/182°- strike
directions while each sail line contained four streamers with 3800 m long.
The Kerry Field has many drilled wells, and it has structures and stratigraphic
features, which are on different depositional groups of the study area. One of the interesting
formation is in Pakawau group and called the Farewell Formation.
The Farewell Formation is the basal formation of the Pakawau Group, and it is the
uppermost formation of the Pakawau Group as described by Suggate, 1956. The Farewell
Formation is producing gas and oil in the Kerry Field. The sediments of this formation
deposited during the Paleocene age is one of the oldest reservoirs in the Taranaki Basin
(Schmidt and Robinson, 1990).

2
Figure 1.1. Location of the study area (Thrasher and Cahill, 1990; Uruski et al., 2002).

3
Figure 1.2. Regional structural elements of the Taranaki Basin (Constantine, 2008).

4
Two sequence boundaries were penetrated. One unconformity is located beneath
the Late Miocene Urenui Formation, and the other one beneath the Oligocene Otaraoa
Formation, which appears to be in fault contact with the Paleocene Farewell Formation.
The Farewell Formation consists mostly sandstone, and interbedded with carbonaceous
mudstone. The range of the thickness of the Farewell Formation is between 261 m and 382
m. The fluvio-deltaic environment is the depositional system that formed the Farewell
Formation.
The Kerry 3D marine survey was conducted along 98 sail lines. Each individual line
was comprised of 4 streamers with 3800 m along. Both Kingdom (Version 8.8) and Petrel
software 2012 (64-bit) were used for seismic data interpretation, well log analysis, and
reservoir characterization.
1.2. OBJECTIVES OF THE STUDY
The purpose of the study is aimed at understanding the geological setting of the
Kerry Field and depositional environment of the Farewell Formation; Identifying faults
and possible prospects through horizon interpretation and seismic attributes; Carrying out
well log analysis to infer the reservoir characterization and how it affects hydrocarbon
distribution in the Farewell Formation; and Identifying prospects within the Farewell
Formation.
5
2. GEOLOGICAL SETTING
2.1 REGIONAL GEOLOGY
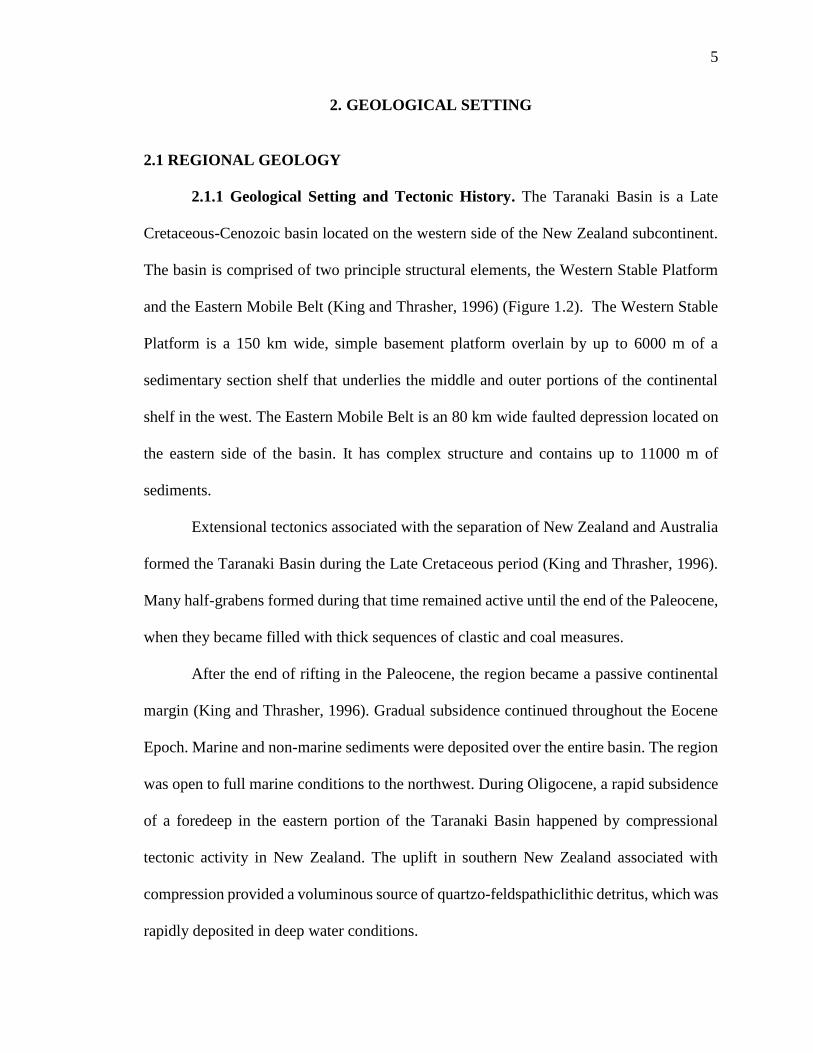
2.1.1 Geological Setting and Tectonic History. The Taranaki Basin is a Late
Cretaceous-Cenozoic basin located on the western side of the New Zealand subcontinent.
The basin is comprised of two principle structural elements, the Western Stable Platform
and the Eastern Mobile Belt (King and Thrasher, 1996) (Figure 1.2). The Western Stable
Platform is a 150 km wide, simple basement platform overlain by up to 6000 m of a
sedimentary section shelf that underlies the middle and outer portions of the continental
shelf in the west. The Eastern Mobile Belt is an 80 km wide faulted depression located on
the eastern side of the basin. It has complex structure and contains up to 11000 m of
sediments.
Extensional tectonics associated with the separation of New Zealand and Australia
formed the Taranaki Basin during the Late Cretaceous period (King and Thrasher, 1996).
Many half-grabens formed during that time remained active until the end of the Paleocene,
when they became filled with thick sequences of clastic and coal measures.
After the end of rifting in the Paleocene, the region became a passive continental
margin (King and Thrasher, 1996). Gradual subsidence continued throughout the Eocene
Epoch. Marine and non-marine sediments were deposited over the entire basin. The region
was open to full marine conditions to the northwest. During Oligocene, a rapid subsidence
of a foredeep in the eastern portion of the Taranaki Basin happened by compressional
tectonic activity in New Zealand. The uplift in southern New Zealand associated with
compression provided a voluminous source of quartzo-feldspathiclithic detritus, which was
rapidly deposited in deep water conditions.

6
Compressional shrinkage terminated towards the end of the Miocene, and it was
replaced by an episode of extensional-wrenching associated with back-arc spreading
during the Pleistocene Epoch (King and Thrasher, 1996). This resulted in renewed
subsidence in the Eastern Mobile Belt and continued rapid clastic sedimentation in deep
water conditions. The western boundary fault of the Eastern Mobile Belt and the Cape
Egmont Fault Zone was formed during this time (Figure 1.2). The Western Platform to the
west however, was largely unaffected by both this extensional-wrench episode and the
succeeding compressional phase.
The Manaia Trend is a paleo-high that was formed by westerly directed
compression and inversion east of the Manaia Fault during the mid-Oligocene to late
Miocene Epoch (Schmidt and Robinson, 1990). The uplift during Pleistocene to the south
created a strong northerly plunge on the anticline. The Kerry Field is located at the southern
end of the Manaia Anticline, where it is cross-cut by a series of NW-SE striking normal
faults. The largest fault of these faults is the Kupe South Fault, which defines the southern
side of the Kerry Field (Figure 2.1).
2.1.2 Stratigraphy of the Taranaki Basin. The stratigraphy of the Taranaki
Basin is illustrated in Figure 2.2. The Taranaki Basin contains a complex and highly
variable suite of sediments due to its mobile history (King and Thrasher, 1996). During the
Cretaceous to Eocene rift and sag phases, thick sequences of fluvial sands and coal
measures were deposited in the southern part of the Eastern Mobile Belt e.g.
7
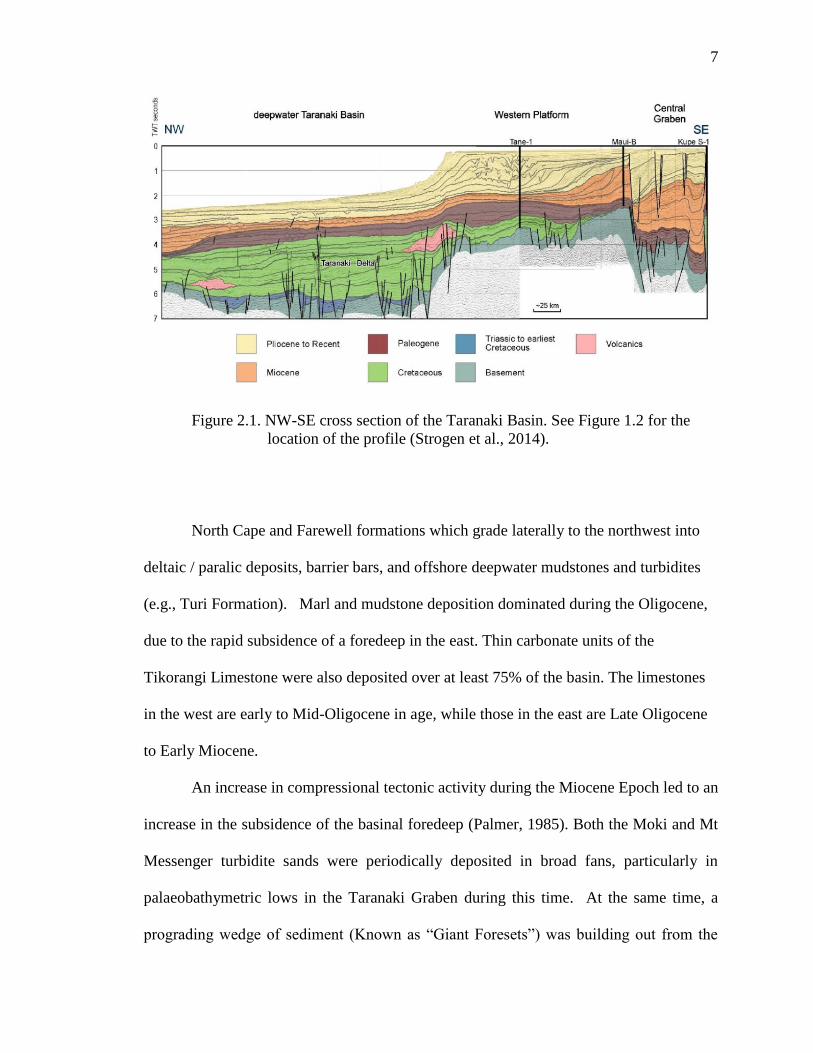
Figure 2.1. NW-SE cross section of the Taranaki Basin. See Figure 1.2 for the
location of the profile (Strogen et al., 2014).
North Cape and Farewell formations which grade laterally to the northwest into
deltaic / paralic deposits, barrier bars, and offshore deepwater mudstones and turbidites
(e.g., Turi Formation). Marl and mudstone deposition dominated during the Oligocene,
due to the rapid subsidence of a foredeep in the east. Thin carbonate units of the
Tikorangi Limestone were also deposited over at least 75% of the basin. The limestones
in the west are early to Mid-Oligocene in age, while those in the east are Late Oligocene
to Early Miocene.
An increase in compressional tectonic activity during the Miocene Epoch led to an
increase in the subsidence of the basinal foredeep (Palmer, 1985). Both the Moki and Mt
Messenger turbidite sands were periodically deposited in broad fans, particularly in
palaeobathymetric lows in the Taranaki Graben during this time. At the same time, a
prograding wedge of sediment (Known as “Giant Foresets”) was building out from the

8
southeast, gradually infilling the basin from that direction. Although renewed subsidence
in the Early Pliocene produced localized bathyal conditions, the basin had become
substantially filled by prograding shelf / slope mudstone and siltstone units by the late
Pliocene. The basin experienced a short phase of uplift and extensional faulting during the
Pleistocene.
The Cretaceous-Eocene fluvio-deltaic sequence is considered to be the primary
source of petroleum discovered in the Taranaki Basin (King and Thrasher, 1996). In south,
it contains a significant thickness of organically rich shales and coals that are both oil and
gas prone. Fluvio-deltaic facies are also known to be present in the northern part of the
basin, although such sediments in the north are of the Cretaceous age rather than Early
Tertiary. Evidence suggests a more sapropelic oil source exists in the northern portions of
the Taranaki Basin (Figure 2.2).
A number of potential reservoir units are present in the Taranaki Basin, with oil and
gas having been discovered in at least 10 different stratigraphic units to date (Anthony et
al., 2005). Most of those reservoirs were developed in facies-controlled units of restricted
lateral extent. All but one are clastic - the exception being the Oligocene Tikorangi
Limestone. Which has developed fracture porosity adjacent to the thrust-faulted eastern
margin of the basin.
Stratigraphy of interest area in the Kerry Field was at the Kupe South-1 well. From
Paleocene to Late Pliocene, two sequence boundaries were penetrated by Well Kupe South-
1 in Kerry Field. One is an unconformity beneath the Late Miocene Urenui Formation, and
one is beneath the Oligocene Otaraoa Formation, which appears to be in fault contact with

9
the Paleocene Farewell Formation. This study was focused on the Paleocene Farewell
Formation (Figure 2.2).
Figure 2.2. Regional stratigraphy of the Taranaki Basin (Hart, 2001).
10
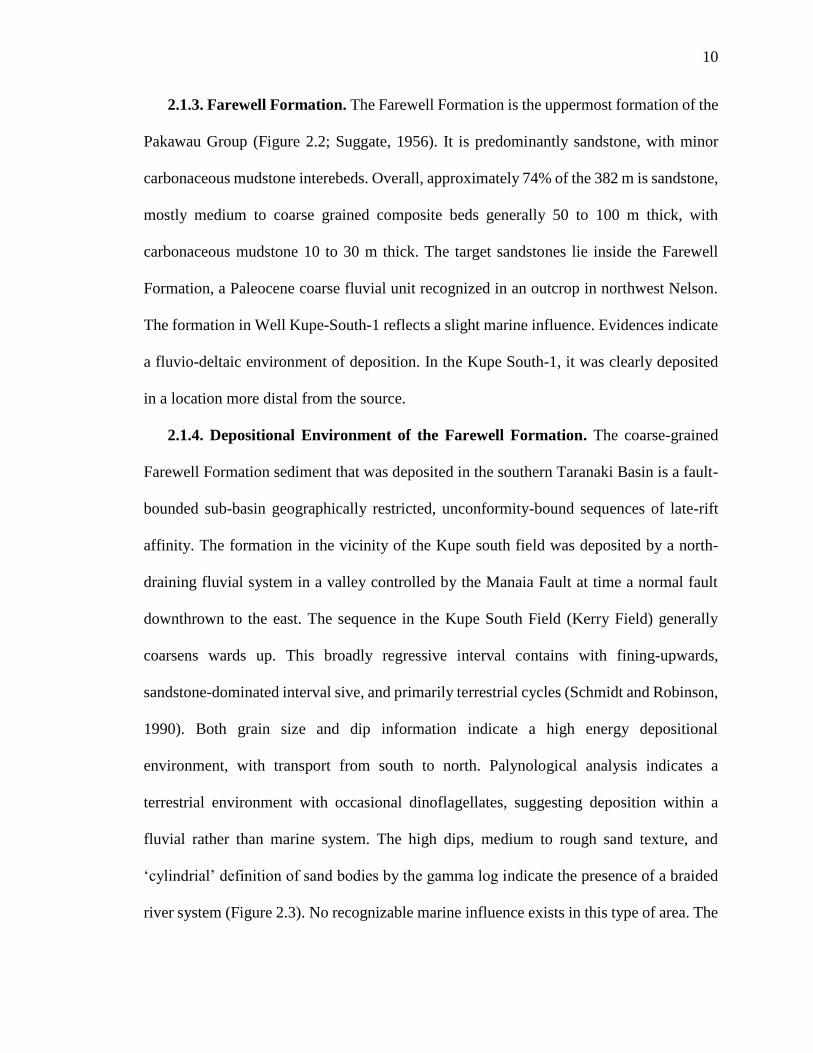
2.1.3. Farewell Formation. The Farewell Formation is the uppermost formation of the
Pakawau Group (Figure 2.2; Suggate, 1956). It is predominantly sandstone, with minor
carbonaceous mudstone interebeds. Overall, approximately 74% of the 382 m is sandstone,
mostly medium to coarse grained composite beds generally 50 to 100 m thick, with
carbonaceous mudstone 10 to 30 m thick. The target sandstones lie inside the Farewell
Formation, a Paleocene coarse fluvial unit recognized in an outcrop in northwest Nelson.
The formation in Well Kupe-South-1 reflects a slight marine influence. Evidences indicate
a fluvio-deltaic environment of deposition. In the Kupe South-1, it was clearly deposited
in a location more distal from the source.
2.1.4. Depositional Environment of the Farewell Formation. The coarse-grained
Farewell Formation sediment that was deposited in the southern Taranaki Basin is a fault-
bounded sub-basin geographically restricted, unconformity-bound sequences of late-rift
affinity. The formation in the vicinity of the Kupe south field was deposited by a north-
draining fluvial system in a valley controlled by the Manaia Fault at time a normal fault
downthrown to the east. The sequence in the Kupe South Field (Kerry Field) generally
coarsens wards up. This broadly regressive interval contains with fining-upwards,
sandstone-dominated interval sive, and primarily terrestrial cycles (Schmidt and Robinson,
1990). Both grain size and dip information indicate a high energy depositional
environment, with transport from south to north. Palynological analysis indicates a
terrestrial environment with occasional dinoflagellates, suggesting deposition within a
fluvial rather than marine system. The high dips, medium to rough sand texture, and
‘cylindrial’ definition of sand bodies by the gamma log indicate the presence of a braided
river system (Figure 2.3). No recognizable marine influence exists in this type of area. The
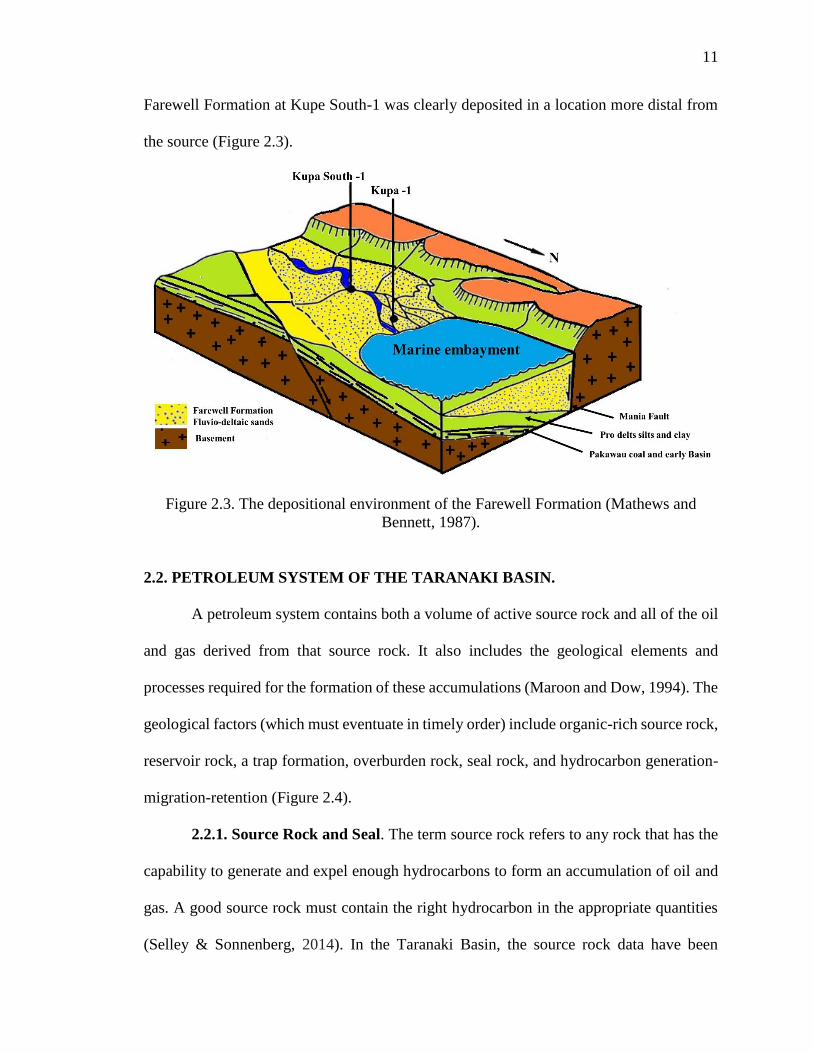
11
Farewell Formation at Kupe South-1 was clearly deposited in a location more distal from
the source (Figure 2.3).
Figure 2.3. The depositional environment of the Farewell Formation (Mathews and
Bennett, 1987).
2.2. PETROLEUM SYSTEM OF THE TARANAKI BASIN.
A petroleum system contains both a volume of active source rock and all of the oil
and gas derived from that source rock. It also includes the geological elements and
processes required for the formation of these accumulations (Maroon and Dow, 1994). The
geological factors (which must eventuate in timely order) include organic-rich source rock,
reservoir rock, a trap formation, overburden rock, seal rock, and hydrocarbon generation-
migration-retention (Figure 2.4).
2.2.1. Source Rock and Seal. The term source rock refers to any rock that has the
capability to generate and expel enough hydrocarbons to form an accumulation of oil and
gas. A good source rock must contain the right hydrocarbon in the appropriate quantities
(Selley & Sonnenberg, 2014). In the Taranaki Basin, the source rock data have been
12
obtained from most exploration wells (Cook, 1987). Hydrogen richness and maturity
constraints, coals from the Late Cretaceous Pakawau Group. And the Paleogene Kapuni
Group based on organic content are generally considered the most likely petroleum source
rocks (Thompson, 1982; Cook, 1987; Johnston et al., 1990; Thrasher, 1992b). The
Taranaki Basin coals and carbonaceous mudstones have an average TOC content of
approximately 10% and Hydrogen Index (HI) values over 150 mg HC/g. Interms of the
seal, mudstones are widespread in the Taranaki Basin, and form topseals or internal seals
to all hydrocarbon-bearing clastic reservoir.
2.2.2. Reservoir and Traps. Most known petrolum reservoirs are deposited along
the Paleocene shoreline and in the coastal plain sandstone in the Farewell Formation.
Younger reservoir rocks include Oligocene foredeep turbidites, earliest Miocene foredeep
limestone, Miocene slope and submarine fan sandstone, Miocene volcaniclastics, and
Pliocene self sandstone. The oldest reservoir sequence in the Taranaki Basin is in the
Paleocene Farewell Formation (Schmidt & Robinson, 1990). This fluvial sandstone unit in
the Kupe South Field has porosities exceeding 20%.

13
Figure 2.4. The petroleum system in the Taranaki Basin (King and Thrasher, 1996).
Th- Tangahoe; Ma -Matemateaonga; Ur –Urenui; Mm -Mt Messenger; Mk –Mohakatino;
Mo –Moki;Mg –Manganui; Ti -Taimana; Ot -Otaraoa; Tu-Turi; Mc –Mckee;
Mh –Mangaheuea;Tu –Turi(Omata); Ka -Kaimiro; Fa – Farewell;

14
3. DATA AND METHOD
3.1 THREE DIMENSIONAL SEISMIC DATA
A 410 km² area of the Kerry 3D marine in Taranaki Basin, New- Zealand was
examined during this study. The study area has 286 inline, 734 crossline, and bin spacing
50 (Figures 3.1 and 3.2.)
Figure 3.1. Location of the 3D seismic survey in the Kerry Field.
15
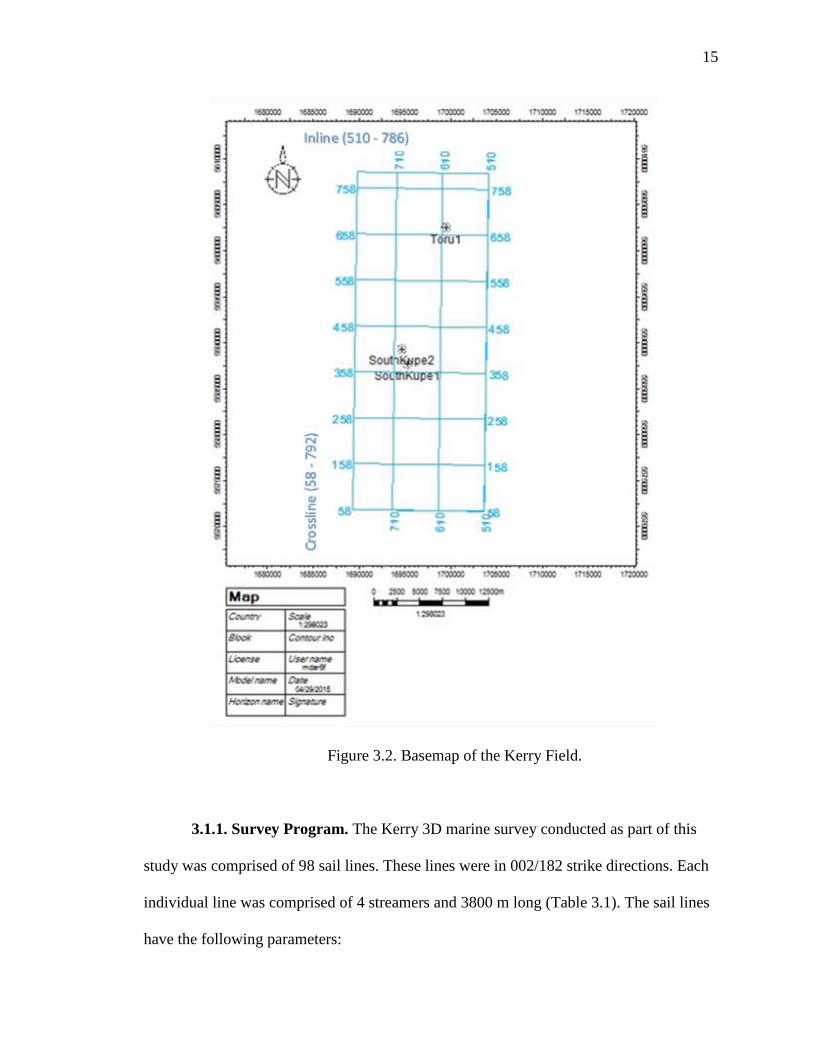
Figure 3.2. Basemap of the Kerry Field.
3.1.1. Survey Program. The Kerry 3D marine survey conducted as part of this
study was comprised of 98 sail lines. These lines were in 002/182 strike directions. Each
individual line was comprised of 4 streamers and 3800 m long (Table 3.1). The sail lines
have the following parameters:

16
Table 3.1. Survey information about the 3D seismic data.
Survey Kerry 3D Marine
Location Taranaki Basin- New Zealand
Survey carried out by GECO-PRAKLA
Nominal Staking Fold 51
3.1.2. Data Acquisition Parameters.
3.1.2.1. Energy source. Table 3.2. shows the parameters of the energy source.
Table 3.2. Energy source parameters.
Array Type Bolt air gun array
Total Volume 3397 cubic inch per source
Air Pressure 2000 Psi
Shooting Mode Flip-flop
Gun Depth 7.0 m
Shot Point Interval between Alternate
Guns
18.75 m
Center Source Separation 37.5 m

17
3.1.2.2. Streamers. Table 3.3. shows the types of streamers and its parameters.
Table 3.3. Streamer parameters.
Type of Streamers HSSL/Nessie 2, Digital
Hydrophones per Group 24
Number of Streamers 4
Number of Groups per Streamer 304
Recording Channels (system A) 608 (2×304)
Recording Channels (system B) 608 (2×304)
Group Interval 12.5 m
Group Length 16.15 m
Streamer Depth 7.0 m
Streamer Length 3800 m
Streamer Separation 100 m
Near Offset 180 – 220 m
3.1.2.3 Recording. The recording information of the seismic survey displayed in
Table 3.4.
Table 3.4. Recording information.
Recording System 2×GDR-1000 SW. 3.52
Tape Format SEG-D 8015
Filters Low cut-3 Hz /18 dB
High cut-180 Hz / 70 dB
Record Length 5000 ms
Sample Interval 2 ms
18
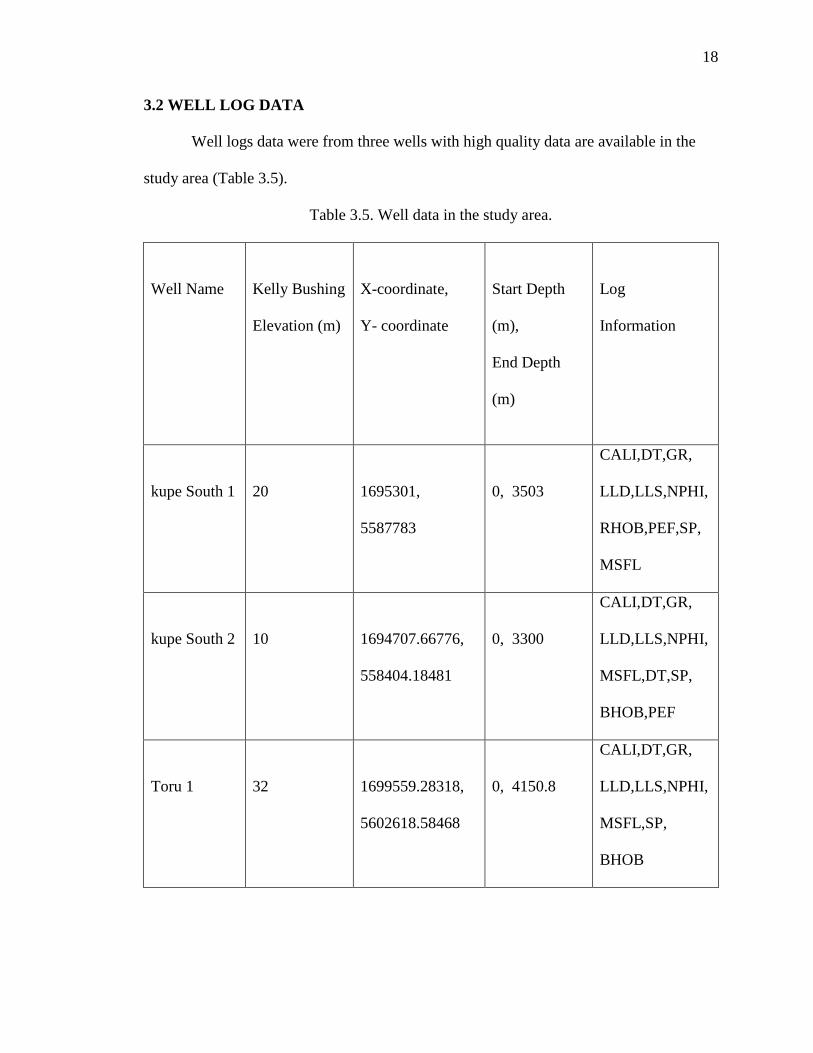
3.2 WELL LOG DATA
Well logs data were from three wells with high quality data are available in the
study area (Table 3.5).
Table 3.5. Well data in the study area.
Well Name
Kelly Bushing
Elevation (m)
X-coordinate,
Y- coordinate
Start Depth
(m),
End Depth
(m)
Log
Information
kupe South 1
20
1695301,
5587783
0, 3503
CALI,DT,GR,
LLD,LLS,NPHI,
RHOB,PEF,SP,
MSFL
kupe South 2
10
1694707.66776,
558404.18481
0, 3300
CALI,DT,GR,
LLD,LLS,NPHI,
MSFL,DT,SP,
BHOB,PEF
Toru 1
32
1699559.28318,
5602618.58468
0, 4150.8
CALI,DT,GR,
LLD,LLS,NPHI,
MSFL,SP,
BHOB

19
3.3. INTERPRETATION WORKSTATION AND METHODOLOGY
Both Kingdom (Version 8.8) and Petrel software 2012 (64-bit), windows- based
three-dimensional interactive system, were used for seismic data interpretation and well
log analysis. The workstations allow the user to work with any of its interpretation
packages to generate more detailed and convincing results. The package used here included
2d/3dPAK. EarthPAK, LogPAK. SynPAK, and VuPAK. The 2d/3dPAK was used
extensively during interpretation. This package allows the user to interpret the horizon and
fault and also generate structural maps.
EarthPAK and LogPAK were used for well log analysis and interpretation. These
packages allow users to display geologic cross-sections in both time and depth. They also
allows users to create grids and contours. The EarthPAK can be used in conjunction with
the LogPAK for petrophysical analysis andcreate a work flow for cross plot analysis.
The SynPAK was used to generate synthetic seismograms, which tied the traces
from the seismic data for accurate horizon interpretation.
The VuPAK was used to display the horizon and seismic traces in three-
dimensions. The package helps users visualize the seismic volume in three-dimension and
thus to detect geological features, thereby greatly enhancing the interpretation results.
The following procedure was used for seismic data interpretation.
1- The seismic data were checked to ensure that they are correctly loaded into the
interpretation workstation.
2- The well log data set was uploaded. Once the formation tops were loaded, they were
converted from a depth domain to a time domain.

20
3- Synthetic seismograms were generated using a combination of gamma rays,
resistivity, and density logs from the well bores, they were displayed on the seismic
trace to match the seismic trace with synthetic trace for horizon interpretation after
adjustment.
4- The horizons were selected and interpreted. Both manual and auto-tracking were
used to trace the horizons, structure, isochron, velocity, and fault maps were
generated for interpretation.
5- The well log and reservoir analyses were conducted to determine the variation in
lithology within the reservoir.
6- The horizons were correlated with the well log analysis to see if the interpretation
were consistent with the seismic data.

21
4. SEISMIC INTERPRETATION
4.1. GENERATING SYNTHETIC SEISMOGRAMS
Synthetic seismogram is created by using song log, density log, and seismic
wavelet. A combination of the resistivity, density, and gamma ray logs was used to
convolve with a seismic wavelet to create synthetic seismogram. Figure 4.1 shows the
extracted wavelet with zero phase.
Figure 4.1. The extracted wavelet.
Time-depth (TD) charts were created from velocity data and used as shared TD
charts, which are applied to wells to generate synthetic seismograms. The synthetic
seismogram was then compared with a trace extracted from the three-dimensional seismic

22
data that were within a radius of 1000 feet of the borehole's location. This seismogram,
along with the synthetic seismogram, and the formation tops, are illustrated in Figure 4.2.
Figure 4.2. A synthetic seismogram for Well Kupe South-1 within the study area.
4.2. WELL-TO-SEISMIC CALIBRATION
The synthetic seismogram was stretched and squeezed until a match was obtained
with the extracted trace from the wells (Figure 4.3). It was then displayed on the vertical

23
seismic section and used to tie the formation tops on the synthetic seismogram to the
formation tops on the vertical seismic section. A synthetic seismogram on a vertical seismic
section is illustrated in Figure 4.3.
4.3. HORIZON PICKING AND INTERPRETATION
Each horizon was selected according to its ties with the synthetic seismogram on
the seismic section. The continuity of the horizon's peak amplitude was traced for
interpretation. The continuous reflection pattern was defined as a depositional surface
associated with a specific event. Two horizons, the top Farewell and the base Farewell
Formation, were selected, traced, and interpreted. The top Farewell Formation at a depth
of approximately 3121 m MD is indicated in brown color. This formation is relatively
continuous. Faults were found in the formation.
The base Farewell Formation at a depth of about 3503 m MD is indicated by the
yellow color, and it has similar trend to the top Farewell Formation since they are related
to one formation (Figure 4.3.) The auto-tracking mode was used to select and trace the
horizons. The manual picking mode was occasionally employed when reflection
discontinuities seemed to exist within the seismic horizons. Major faults were observed
within the top and base Farewell Formations (Figures 4.3, 4.4, 4.5, and 4.6).

24
Fig
ure
4.3
. A
synth
etic
sei
smogra
m d
ispla
yed
on t
he
ver
tica
l se
ism
ic s
ecti
on,
Inli
ne
684.

25
Fig
ure
4.4
. A
Synth
etic
sei
smogra
m o
n v
erti
cal
seis
mic
sec
tion, cr
oss
line
378.

26
Fig
ure
4.5
. In
line
560 s
how
n t
he
top a
nd b
ase
of
the
Far
ewel
l F
orm
atio
n a
nd a
min
or
fault
.
27
Fig
ure
4.6
. C
ross
line
553
show
n t
he
top a
nd b
ase
of
the
Far
ewel
l F
orm
atio
n a
nd t
he
Man
aia
Fau
lt .
28
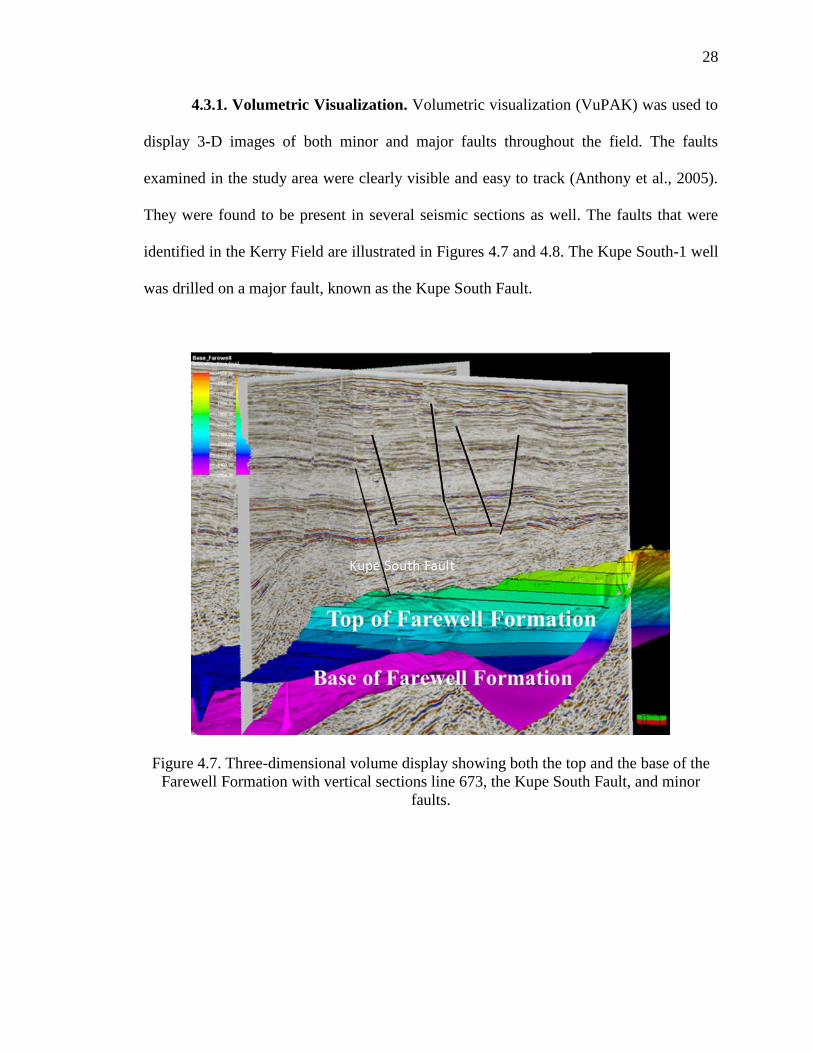
4.3.1. Volumetric Visualization. Volumetric visualization (VuPAK) was used to
display 3-D images of both minor and major faults throughout the field. The faults
examined in the study area were clearly visible and easy to track (Anthony et al., 2005).
They were found to be present in several seismic sections as well. The faults that were
identified in the Kerry Field are illustrated in Figures 4.7 and 4.8. The Kupe South-1 well
was drilled on a major fault, known as the Kupe South Fault.
Figure 4.7. Three-dimensional volume display showing both the top and the base of the
Farewell Formation with vertical sections line 673, the Kupe South Fault, and minor
faults.

29
Figure 4.8. Three-dimensional volume of the top of the Farewell Formation display
with vertical sections crossline 398, showing the Manaia Fault in VuPAK.
4.3.2 Time Structure and Depth Maps. Structure maps tend to reveal geological
structures that can be a target for an exploration. Analysis of the contoured time structure
map for the Farewell Formation indicates that the time structure at the top of this horizon
exhibits a moderate to high structure trends from southern east to the West that is caused
by effect major fault (South Kupe Fault). In northern and western side in the Farewell
Formation, the time structure at top of this formation has low structure. Several minor faults
exist in the eastern portion of the area (Figure 4.9). The depth map has the same trend as
the time structure map (Figure 4.10).
4.3.3 Isopach Map. Thickness maps represent the thickness variation and thickness
trends and one these maps called Isopach map. The isopach map shows the spatial variation
of thickness. The map indicates that the thickness from the top to the base of the Farewell

30
Formation extends from 180 to 400 m, with the variation and deposition of this area being
controlled by the major faults (Figure 4.11).
Figure 4.9. Time structure map of the top Farewell Formation, showing the high structure
trends from the south east to the north west.

31
Figure 4.10. Depth map of the top of the Farewell Formation, showing the high structure
trends from the south east to the north west that are caused by major faults.

32
Figure 4.11. Isopach map between the top and the base of the Farewell Formation.
33
4.4. FAULT INTERPRETATION BY SEISMIC ATTRIBUTE
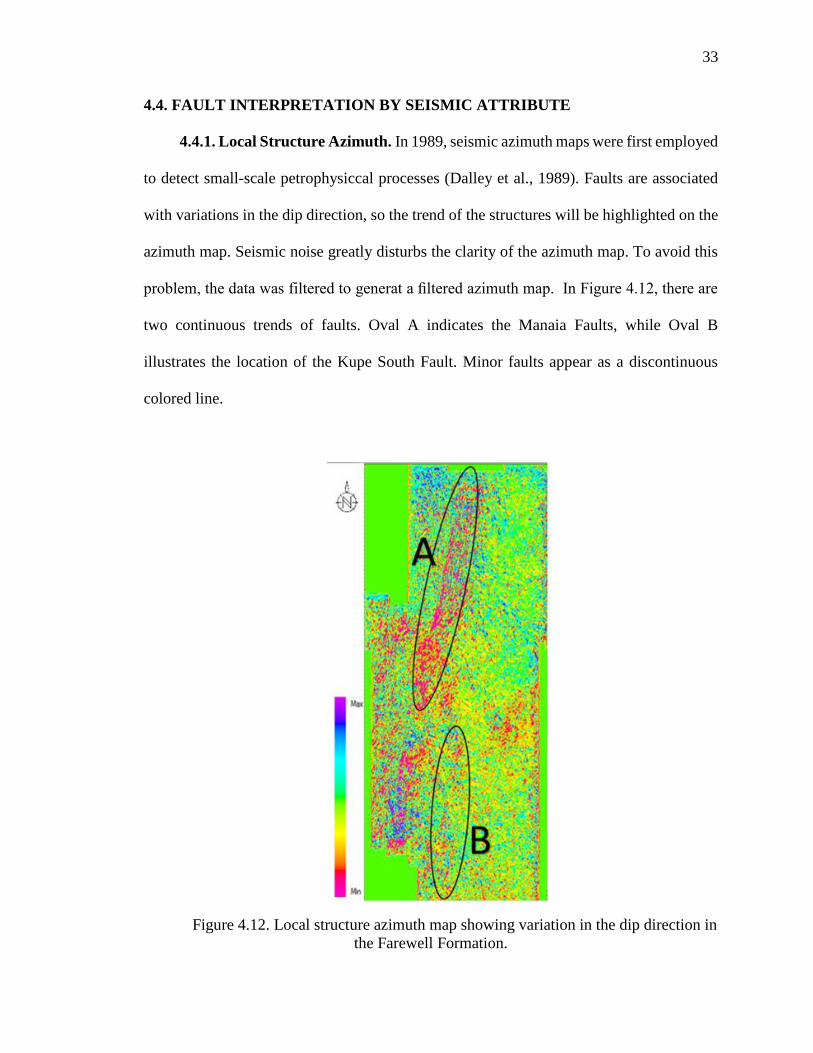
4.4.1. Local Structure Azimuth. In 1989, seismic azimuth maps were first employed
to detect small-scale petrophysiccal processes (Dalley et al., 1989). Faults are associated
with variations in the dip direction, so the trend of the structures will be highlighted on the
azimuth map. Seismic noise greatly disturbs the clarity of the azimuth map. To avoid this
problem, the data was filtered to generat a filtered azimuth map. In Figure 4.12, there are
two continuous trends of faults. Oval A indicates the Manaia Faults, while Oval B
illustrates the location of the Kupe South Fault. Minor faults appear as a discontinuous
colored line.
Figure 4.12. Local structure azimuth map showing variation in the dip direction in
the Farewell Formation.

34
4.4.2. Dip Angle Map. The dip angle map clearly presents the location of major
and minor faults. Since the Kerry Field has several major and minor faults, the dip angle
map was generated to illuminate these faults. A fault will be indicated by a difference in
the angles of the dip of the interpreted horizon, presented resolution is sufficiently high to
resolve the offset. The red Oval in Figure 4.13 outline the Kupe South Fault, which is the
located in the southern part of Kerry Field. The yellow oval marks the Manaia Fault, which
crosses the Kerry Field from north to southwest.
Figure 4.13. Dip angle map showing the differences between of fractures that occurred in
the faults.

35
4.4.3 Coherence Map. The coherence map gives a distinct image for buried deltas,
faults, river channels, reefs, and dewatering features (Chopra, Satinder, and Marfurt, 2007).
A coherence map was used to interpret the faults in the study area. The faults were
identified as either continuities or discontinuities. The Kupe South Fault is shown as a
general S-N trending pattern on the coherence map. The Manaia Fault treds north to south
west. Some minor faults are visible in the eastern part (Figure 4.14.).
Figure 4.14. Coherence map, showing the major and minor faults in the Farewell
Formation.
36
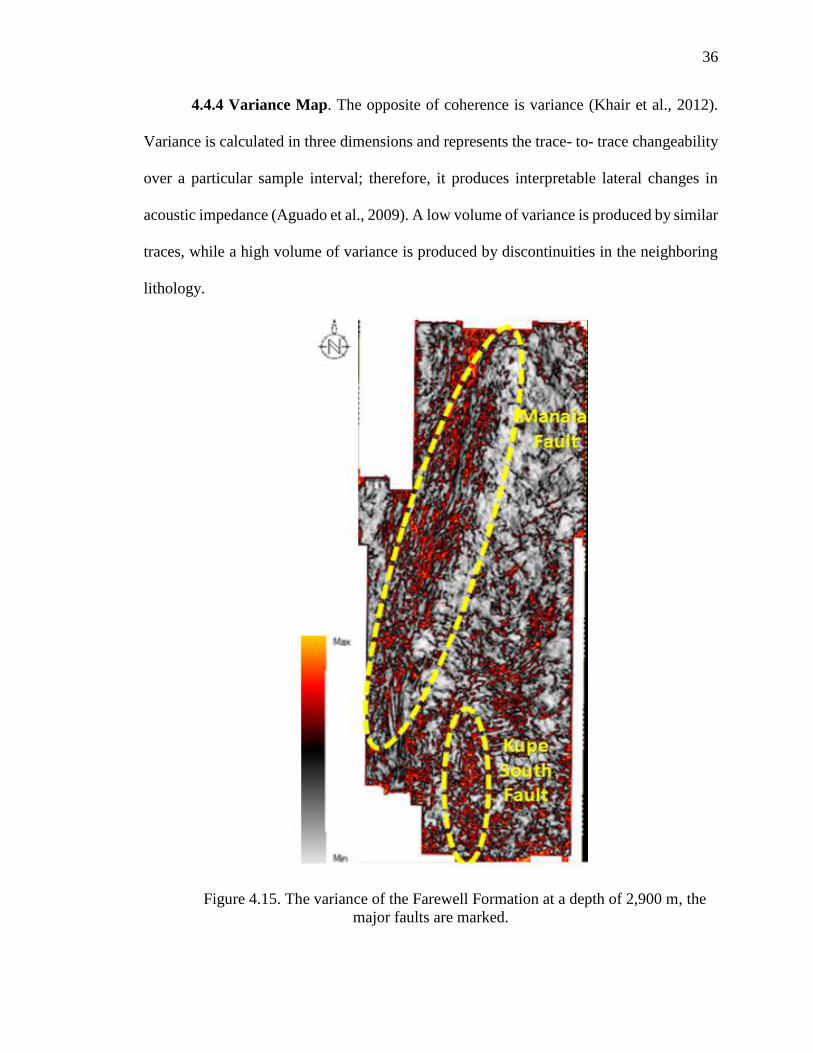
4.4.4 Variance Map. The opposite of coherence is variance (Khair et al., 2012).
Variance is calculated in three dimensions and represents the trace- to- trace changeability
over a particular sample interval; therefore, it produces interpretable lateral changes in
acoustic impedance (Aguado et al., 2009). A low volume of variance is produced by similar
traces, while a high volume of variance is produced by discontinuities in the neighboring
lithology.
Figure 4.15. The variance of the Farewell Formation at a depth of 2,900 m, the
major faults are marked.

37
The discontinuities in the neighboring lithology are affected by faults and fractures
that are produced from trace- to- trace variability. This attribute is useful in determining
the edge detection (Aguado et al., 2009). The variance for the Kerry Field at a depth of
2,900 m shows the discontinuities from the north to southwest that indicate the Manaia
Fault (Figure 4.15).
Another discontinuity cuts from south to north. The southern part of the Kerry Field
shows another discontinuity, indicating another major fault, Kupe South Fault, which runs
from south to north. Both faults are indicated by yellow ovals in Figure 4.15.
4.4.5 Edge Detection Map. Edge detection is a technique that compares the
differences in adjacent seismic traces to measure the differences in the subsurface structure
such as faults (Luo et al., 1996). Edge detection maps readily identify many faults and
detect even small displacements of about 10 m. Figure 4.16., shaded gradually from red to
blue, with the red indicating the displacement zone and the blue indicating the area without
any faults. The ovals are marked the major faults across the Farwell formation in
Kerry filed Figure 4.16. The faults are quite clear, and the red linear features indicate the
presence of a general trending pattern (Figure 4.16). Several minor faults are appeared as
discontinued lines of red color.

38
Figure 4.16. Edge detection map showing the major and minor faults in the Farewell
Formation.

39
5. WELL LOGGING CORRELATION
One of the best techniques for determining the subsurface structure is the well log
correlation technique. In the study area, multiple well logs were available to analyze the
Farewell Formation (Paleocene) to identify its lithology and the properties between wells.
This well correlation was along 19,089 m and crossed three wells: e, Tour-1, kupe South-
1 and, Kupe South-4. Gamma Ray (GR), DT, and SP are the three type of logs used to
determine distribution of the Farwell Formation (sandstone) with a thickness of
approximately about 261 to 382 m. Well logs suggest that the Farewell Formation increases
in thinker from north to south. At kupe South-1, logs show that the Kupe South Fault has
a throw about 100 m, 70 msec. The Farewell Formation is covered by the Late Oligocene
Otara Formation, which is composed of mudstone and siltstone (Figure 5.1.).
Figure 5.1. The distribution of the Farewell Formation and the Kupe South Fault.
40
6-RESERVOIR CHARACTERIZATION
Reservoir characterization (RC) is a process for quantitatively assigning reservoir
and fluid properties while recognizing geologic uncertainties in spatial variability
(Mohaghegh et al., 1996). Reservoir characterization uses all the data provided to
recognize the geometry and the allocation of the physical parameters and properties of the
reservoir.
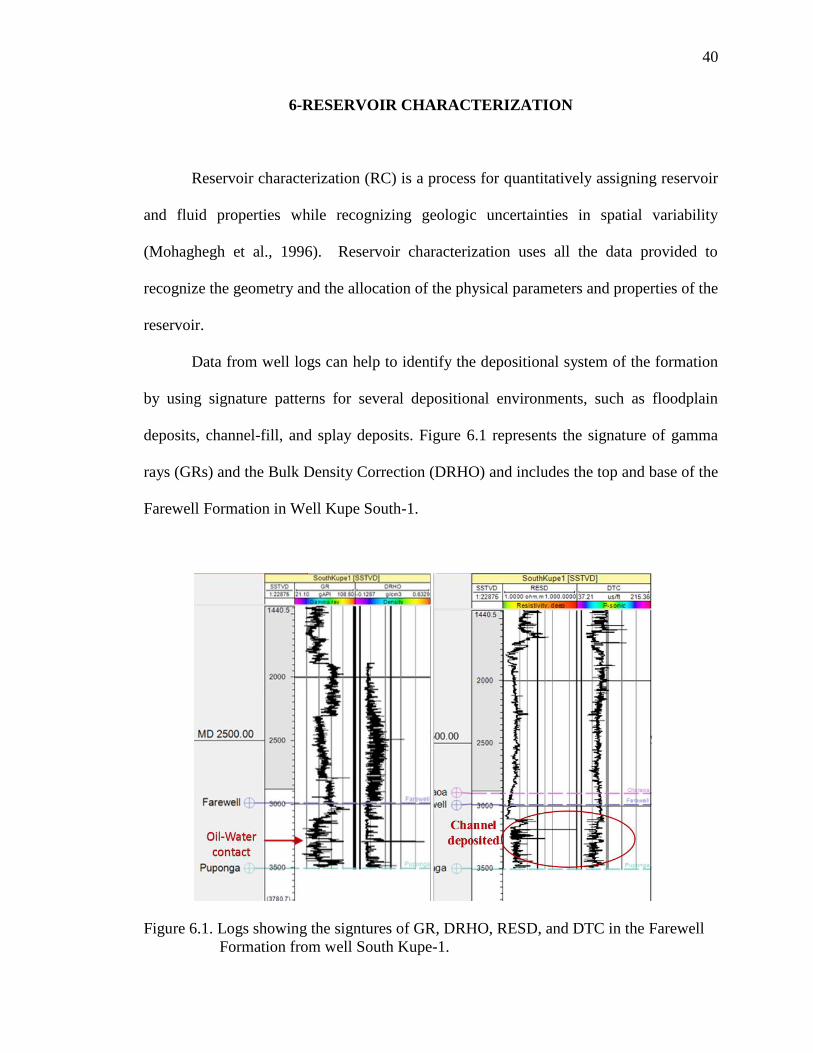
Data from well logs can help to identify the depositional system of the formation
by using signature patterns for several depositional environments, such as floodplain
deposits, channel-fill, and splay deposits. Figure 6.1 represents the signature of gamma
rays (GRs) and the Bulk Density Correction (DRHO) and includes the top and base of the
Farewell Formation in Well Kupe South-1.
Figure 6.1. Logs showing the signtures of GR, DRHO, RESD, and DTC in the Farewell
Formation from well South Kupe-1.

41
GR and DRHO signatures in the Farewell Formation, were compared to patterns
that geologists mapped to identify the formation’s depositional system of the formation.
Based on these patterns, it was determined that the Farewell Formation is a river
depositional system that was formed during the Paleocene and the earlier Eocene. The
signatures of GRs and DRHO through the Kupe South-1 showed evidence of a sudden
change in depth at 3,300 m, displayed in Figure 6.1 by a red arrow. According to the
hydrocarbon and water properties, the sudden change should indicate an oil water contact.
6.1. PETROPHYSICAL ANALYSIS
Knowledge of petrophysics is necessary to measure and predict of the reservoir
quality. Petrophysics is the study of rock properties, such as the porosity and permeability
of reservoir rocks. The most critical rock properties are porosity and permeability because
they affect the quantity and transmission of fluid.
Crossplot analyses of bulk density logs, neutron porosity logs, and the crossplot of
gamma ray and density logs were used to determine the lithology of the Farewell Formation
as shown in Figures 6.2 and 6.3.
The relationship between the bulk density logs and the neutron porosity logs
clarifies the lithology of the Farewell Formation (sandstone), with a density range of 2.2 -
2.6 g/cm3. The average porosity of the Farewell Formation sandstone is about 20 percent.
According to Schmidt and Robinson (1990), the Farewell Formation is fining-upwards,
sandstone-dominated interval, and primarily terrestrial cycles.

42
Figure 6.2. Crossplot of the bulk density and neutron porosity logs.
The crossplot in Figure 6.3 shows the relationship between the bulk density logs
and the gamma ray logs within three zones. Zone A indicates sandstone with a range of
density from 2.2 -2.5 until and with the lowest number of gamma rays while Zone B has
almost the same density as Zone A and the highest number of gamma rays. Zone C has the
lowest density and a relatively high number of gamma rays.
Figure 6.3. Crossplot of bulk density and gamma ray logs.
43
6.2. WATER SATURATION
One of the essential parameters used to determine the oil and gas in place is the
water saturation. Resistivity logs were used to identify the water saturation. The function
of water saturation is resistivity, especially a reservoir that contains oil and/or gas. Oil
and/or gas are non conductors of electricity. The Kupe South-1, Kupe South-2, and Toru-
1, wells from various locations, were chosen as models to identify the water saturation
contained in the Farewell Formation. It was found that the water saturation of the Farewell
Formation ranges from 62 to 74 percent.
6.3. FACIES MODELING.
Facies modeling is a technique that provides the distribution of facies and
hydrocarbon. Several logs were used to generate the crossplots. Then, the crossplots which
integrated with the 3D grid were used to present the vertical and horizontal distribution of
the lithology and fluid that the reservoir included. This technique has been done by using
petrel software, this and provides essential information for to determine well locations and
to estimate the future production from a reservoir.
Figures 6.4 and 6.5 display the distribution in terms of topography of the facies
within the top and base of the Farewell Formation. According to the top of the Farewell
Formation, sand covers the middle of the Kerry Field. Kupe South-1 was drilled in this
area, shown by yellow rectangles. It should be noted that at the base, the sand covered
different areas. The blue rectangles represent the areas that consist of carbonate. Shale is
shown by gray rectangles, and it covers different parts. It was mentioned earlier that the

44
Farewell Formation is interbedded with shale. Table 6.1. present the percentage of the faces
in the Farewell formation in the Kerry Filed.
Table 6.1. The presenting of the lithology through the Farewell.
Figure 6.4. Two-dimensional facies modeling of bottom of the Farewell Formation.

45
Figure 6.5. The facies and structure of the top of Farewell Formation.
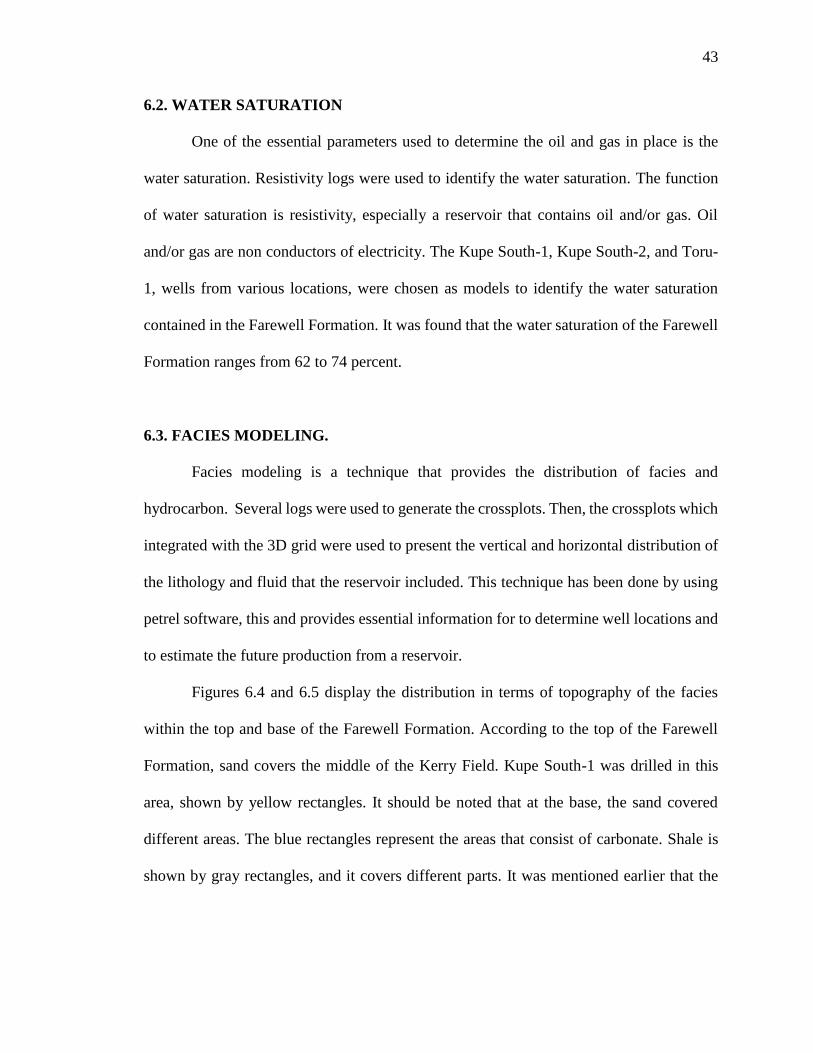
6.4. POROSITY MODELING
One of the most important properties of reservoirs containing oil and gas is their
porosity. Porosity is indicated by sonic logs, but other factors should be taken as important
parameters such as water saturation, which has a high conductivity, and hydrocarbons,
which are normally insulators. The 3D grid has generated then integrated with well log
data such as sonic logs to generate petrophysics modeling such as porosity. Porosity maps
are presented in Figures 6.6 and 6.7. Figure 6.6 shows the distribution of porosity in two
dimensions, and Figure 6.7 presents the porosity in three dimensions. In general, the
porosity of the Farewell Formation is high; therefore it Farewell contains gas, and that is
also a result of the variation in the sedimentary facies. The three-dimensional porosity map
was generated by Petrel software, and it shows the distribution of the porosity in relation
to the structure and distribution of the Farewell Formation.

46
Figure 6.6. The distrubution of porosity in the Farewell Formation at the depth
of 2,900 m.
47
Figure 6.7. Three-dimensional display of the porosity of the Farewell Formation.
6.5. NET-TO-GROSS RATIO
The purpose of the net-to-gross ratio is to present the portion that might contribute
to production within the reservoir rock. This quantitative relation can be calculated by
means that are appropriate to cut-offs on the log curves and applied to the global thickness
of the target formation to induce producible thickness, known as net pay. To generate the
net-gross-ration, the 3D grad was generated and integrated with well log data such as sonic
logs. The determination of the net-to-gross magnitude relation is one aspect of a reservoir
study that is almost always performed. Yet, it is also presumably the least documented and
most subjective stage of a study. An exhaustive review of the published literature revealeds

48
that little information was obtainable on net-to-gross calculation methodologies. This is
probably because no general rules exist. In most cases, the selection of the cut-offs to be
applied is an empirical procedure that is left to the expertise of the petrophysicist or
geoscientist. Figure 6.8 shows that the net-to-gross ratio the Farewell Formation indicated
a satisfactory ratio of hydrocarbon throughout the reservoir.
Figure 6.8. The net-to-gross ratio throughout the Farewell Formation.

49
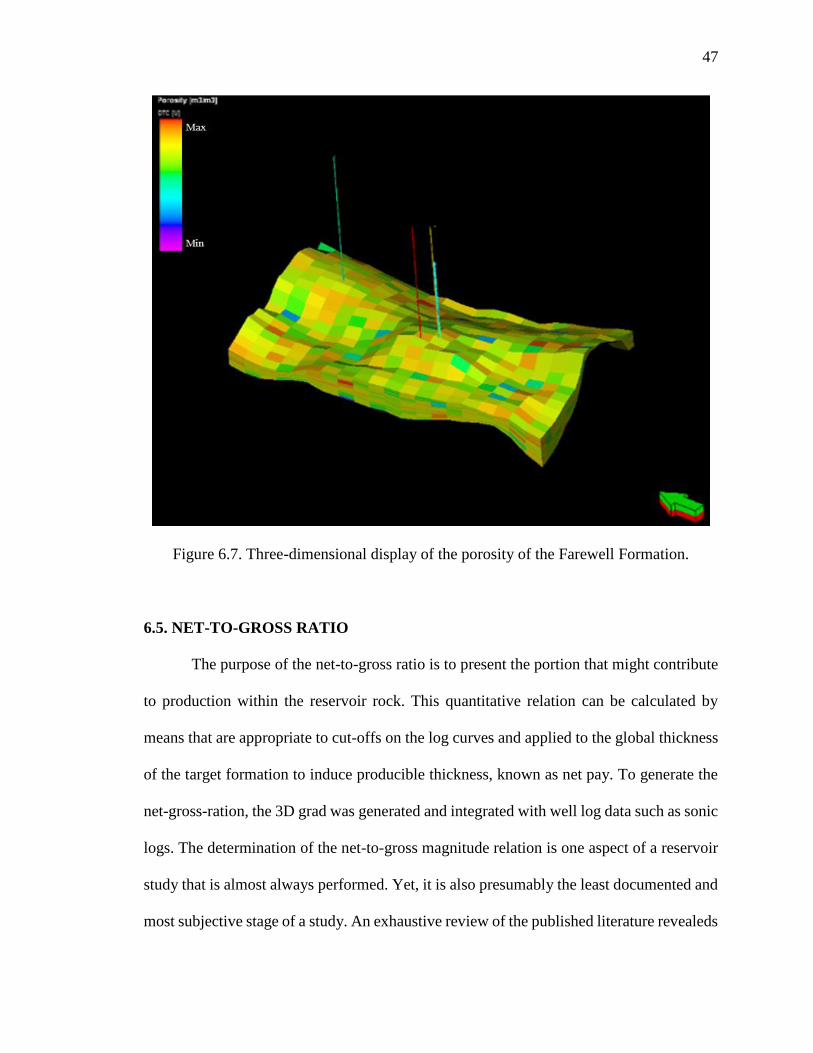
6.6. ACOUSTIC IMPEDANCE MAP
Seismic reflections are generated from interfaces based on changes in the acoustic
properties of the rocks. The most effective physical properties used in analyzing the
acoustic impedance of a rock layer are density and velocity. The disparity within the
acoustic impedance generates the seismic reflection. The impedance contrast results from
the top of the sand reservoir being encased in a different type of rock, such as shale, than
the bottom, so that their polarities lie in opposition to one another. Sand that contains gas,
hydrocarbon, and water affects the acoustic impedance. Acoustic impedance is a time slice
that generated from seismic volume data that has integrated with the 3D grad. Figure 6.9
represents the variation in the acoustic impedance at a depth of 2900 m. Bright yellow
indicates hydrocarbon throughout the Farewell Formation at a 2900 m.
6.7. ROOT-MEAN SQUARE AMPLITUDE
The Root-Mean-Square (RMS) amplitude is a post stack amplitude attribute.
Mathematically, it is calculated by the square root of the added square amplitudes divided
by the amount of samples inside the desired window. It is an attribute that effectively helps
to determine hydrocarbon prospects. In fact, it enhances hydrocarbon bright spots and
might be used as an immediate hydrocarbon indicator (DHI). The RMS amplitude map for
the Farewell Formation bounded by the Otaraoa Formation and the Pakawau Formation is
illustrated in Figure 6.10. The yellow ovals highlight bright spots in the south-west and
north-east Figure 6.10. Based on this map, the two prospect are as suggested marked by
the yellow ovals.
50
Figure 6.9. The acoustic impedance at 2900 m. Several bright spots are marked.

51
Figure 6.10. The Root-Mean-Square (RMS) amplitude of the Farewell Formation.
Two suggested prospect areas are marked by yellow ovals.

52
7. CONCLUSIONS
Three-dimensional seismic data and well logs in the Kerry Field were used to create
seismic interpretation maps, seismic attribute maps, well logs correlation, reservoir
characterization, and pertophysical anaylses. These maps and well correlations helped to
identify the structures, such as the faults and the depositional system of the Farewell
Formation. From this investigation, several main conclusions can be reached.
1- The Farewell Formation is one of the younger reservoirs from the Paleocene period
in the Taranaki Basin, including the Kerry Field.
2- The Farewell Formation consists mostly of sandstone interbedded with
carbonaceous mudstone. The thickness of the Farewell Formation ranges between
261 to 382 m. It was created by a depositional system in a fluvio-deltaic
environment.
3- The seismic interpretation and seismic attribute maps determined the main
features of the Kerry Field such as the major and minor faults.
4- The cross section through the three wells across the field also revealed that the
reservoir facies of the Farewell Formation could be described as channel-fill
deposits.
5- Oil- water contact was at a depth of 3,300 m, as determined by well log data
analysis.
6- The Farewell Formation density was between 2.2 and 2.6 g/𝑐𝑚3, determined by
the crossplot of the bulk density and the neutron porosity logs.
53
7- The average porosity of the Farewell Formation on the kupe South-1 well was
about 20 %, which is a good porosity for the Kerry Field.
8- Prospect areas have been located based on some bright spots associated with
features in the Kerry Field such as faults.
9- The Farewell Formation which played a role as source rock and reservoir rock, in
the Kerry Field, needs to be investigated in more details which in drilling more
wells.
54
BIBLIOGRAPHY
Abul Khair, H., Cooke, D., Backé, G., King, R., Hand, M., Tingay, M., & Holford, S.
(2012). Subsurface mapping of natural fracture networks; a major challenge to be
solved. Case study from the shale intervals in the Cooper Basin, South Australia.
In Workshop on Geothermal Reservoir Engineering (37th: 2012: Stanford,
California).
Anthony, D.P., Gilbert, C.E., Sutherland, G.F., Pidgeon, B.A., Mills, K.L. and Pass, G.P.,
2005. Kupe Central Field Area (CFA) Subsurface development plan, PML 38146,
Offshore Taranaki Basin, New Zealand. Unpublished Origin Energy Resources
report OF0401-PLN-00-A-0008.
Azevedo, L., & Pereira, G. R. (2009). Seismic attributes in hydrocarbon reservoir
characterization (Doctoral dissertation, Tese de Mestrado, Universidade de
Aveiro).
Carter, N., & Lines, L. R. (1999). Fault imaging of Hibernia 3-D seismic data using edge-
detection and coherency measures. CREWES Research Report. University of
Calgary, Calgary, Alberta T2N 1N4 CANADA.
Constantine, A. (2008). Kupe South-8 Well Completion Report. Rep. no. 68. N.p.: Ministry
of Economic Development -Radio Spectrum Management, New Zealand.
Cooper, R. A., & Agterberg, F. P. (2004). The New Zealand geological timescale (Vol.
22). Institute of Geological & Nuclear Sciences Limited.
Chopra, S., & Marfurt, K. (2007). Curvature attribute applications to 3D surface seismic
data. The Leading Edge, 26(4), 404-414.
Chopra, S., & Marfurt, K. J. (2007). Seismic attributes for prospect identification and
reservoir characterization. Society of Exploration Geophysicists. Tulsa, OK U.S.A.
74170-2740.
Cook, R. A. (1987). The geology and geochemistry of the crude oils and source rocks of
western New Zealand, New Zealand Geological Survey, New Zealand.
Cook, R. A., Sutherland, R., & Zhu, H. (1999). Cretaceous-Cenozoic geology and
petroleum systems of the Great South Basin, New Zealand (Vol. 20). Institute of
Geological & Nuclear Sciences.

55
Dalley, R. M., Gevers, E. C. A., STAMPFLI, G., Davies, D. J., Gastaldi, C. N.,
Ruitjenberg, P. A., & Vermeer, G. J. O. (1989). Die and azimuth displays for 3D
seismic interpretation. First Break, 7(3), 86-95.
Fohrmann, M., Reid, E., Hill, M.G., King, P.R., Zhu, H., Bland, K.J. Strogen, D.P.
Roncaglia L. and Scott. G.P.L. 2012. Seismic reflection character, mapping and
tectono-stratigraphic history of the Kupe area (4D Taranaki Project), south-eastern
Taranaki Basin GNS Science Report, 2012/36, 62 p.
Hart, Alan. 2001 Taranaki Main Tectonic Elements, Oil and Gas Accumulation. Oil & Gas
Journal. 6.
Hollis, C. J., Crundwell, M. P., Beu, A. G., Morgans, H. E. G., Crampton, J. S., Raine, J.
I., & Boyes, A. F. (2010). Calibration of the New Zealand Cretaceous-Cenozoic
Timescale to GTS2004.
Johnston, M. R. (1990). Geology of the St Arnaud district, southeast Nelson (sheet N29).
New Zealand Geological Survey.
King, P. R., & Thrasher, G. P. (1996). Cretaceous Cenozoic geology and petroleum
systems of the Taranaki Basin, New Zealand (Vol. 2). Institute of Geological &
Nuclear Sciences.
Magoon, L. B., & Dow, W. G. (1994). The petroleum system. The petroleum system—
From source to trap: AAPG Memoir, 60, 3-24.
Mathews, E.R, & Bennett, D.J. (1987) Kupe South-1 Well Completion Report. Rep. N.p.:
New Zealand Oil & Gas Ltd. New Zealand.
Mohaghegh, S., Ameri, S., & Arefi, R. (1996). Virtual measurement of heterogeneous
formation permeability using geophysical well log responses.Log Analyst, 37(2),
32-39.
Palmer, J. (1985). Pre-Miocene lithostratigraphy of Taranaki Basin, New Zealand. New
Zealand journal of geology and geophysics, 28(2), 197-216.
Schmidt, D. M., Robinson, B., & Jones, D. A. (1990). The tethered spinal cord. Etiology
and clinical manifestations. Orthopaedic review, 19(10), 870-876.
Schmidt, D.S., Robinson, P.H. (1990). The structural setting and depositional history for
the Kupe South Field, Taranaki Basin. In 1989 New Zealand Oil Exploration
Conference proceedings: (PP. 151–172). Ministry of Commerce, Wellington.
Selley, R. C., & Sonnenberg, S. A. (2014). Elements of petroleum geology. Academic
Press.USA.

56
Strogen, D. P., Bland, K. J., Nicol, A., & King, P. R. (2014). Paleogeography of the
Taranaki Basin region during the latest Eocene–Early Miocene and implications for
the ‘total drowning’of Zealandia. New Zealand Journal of Geology and
Geophysics, 57(2), 110-127.
Suggate, R. P. (1959). New Zealand coals, their geological setting and its influence on their
properties: New Zealand Geological Survey Bulletin 134.Institute of Geological
and Nuclear Sciences, Lower Hutt.
Suggate, R. P. (1956). Puponga coalfield. New Zealand journal of science and
technology, 37, 539-559.
Thompson, J. G. (1982). Hydrocarbon source rock analyses of Pakawau Group and Kapuni
Formation sediments, northwest Nelson and offshore South Taranaki, New
Zealand. New Zealand Journal of Geology and Geophysics, 25(2), 141-148
Thrasher, G. P., & Cahill, J. P. (1990). Subsurface maps of the Taranaki Basin region, New
Zealand. NZ Geol. Surv. Rep., 142.
Thrasher, G.P. (1992a). Late Cretaceous geology of Taranaki Basin, New Zealand.
Unpublished PhD thesis, Victoria University of Wellington. Wellington, New
Zealand.
Thrasher, G. P. (1992b). Late Cretaceous source rocks of Taranaki Basin. In Proceedings
of the 1991 New Zealand Oil Exploration Conference, Ministry of Commerce (pp.
147-154).
Tiab, D., & Donaldson, E. C. (2011). Petrophysics: theory and practice of measuring
reservoir rock and fluid transport properties. Gulf professional publishing.
Uruski, C. I., Stagpoole, V., Isaac, M. J., King, P. R., & Maslen, G. (2002). Seismic
Interpretation Report-Astrolabe Survey, Taranaki Basin, New Zealand. Institute of
Geological & Nuclear Sciences confidential client report, 70.

57
VITA
Waleed Deefallah M Alotaby was born in Shaqra City, Saudi Arabia on November
23rd, 1988. He received his bachelor’s degree of Science in Geophysics, from the King
Saud University in September, 2010. In august, 2013 he joined at University of Missouri
for Science and Technology. Waleed is a member of American Geophysics union (AGU),
Society of Exploration Geophysicists (SEG), and The American Association of Petroleum
Geologists (AAPG). Waleed received his Master’s Degree in Geology and Geophysics
from the Missouri University of Science and Technology in December 2015.