fault interpretation of the groningen area supra-zechstein
TRANSCRIPT

Fault Interpretation of the Groningen area supra-Zechstein Overburden
NAM
Thomas Logeman
Date March 2017
Editors Jan van Elk & Dirk Doornhof


General Introduction
Emphasis of geological modelling has traditionally been on the reservoir formations; the Rotliegend
sandstone and also the immediately overlying Zechstein formation (Ref. 1 and 2). However, for the
prediction of ground motion and the determination of the hypocentre of an earthquake, the full rock
column from the reservoir up to the surface and also down below the reservoir is important. In reports
on the models used for Ground Motion Prediction this so-called overburden (rock above the reservoir)
and to a lesser extent the underburden (rock below the reservoir) are discussed (Ref. 3 and 4).
Especially during the workshop on the maximum magnitude earthquake (Ref. 5 and 6), the faults in the
overburden and underburden were discussed. In this report, the faults in the formations above the
Zechstein are presented and discussed.
References
1. Technical Addendum to the Winningsplan Groningen 2013; Subsidence, Induced Earthquakes and
Seismic Hazard Analysis in the Groningen Field, Nederlandse Aardolie Maatschappij BV (Jan van Elk
and Dirk Doornhof, eds), November 2013.
2. Groningen Field Review 2015 Subsurface Dynamic Modelling Report, Burkitov, Ulan, Van Oeveren,
Henk, Valvatne, Per, May 2016.
3. Development of Version 2 GMPEs for Response Spectral Accelerations and Significant Durations for
Induced Earthquakes in the Groningen field, Julian J Bommer, Bernard Dost, Benjamin Edwards,
Pauline P Kruiver, Piet Meijers, Michail Ntinalexis, Barbara Polidoro, Adrian Rodriguez-Marek &
Peter J Stafford, October 2015
4. V4 Ground-motion Model (GMM) for Response Spectral Accelerations, Peak Ground Velocity and
Significant Duration in the Groningen field, Julian Bommer, Bernard Dost, Benjamin Edwards,
Pauline Kruiver, Pier Meijers, Michail Ntinalexis, Adrian Rodriguez-Marek, Elmer Ruigrok, Jesper
Spetzler and Peter Stafford, Independent Consultants, Deltares and KNMI, June 2017 with
Parameter files - V4 Ground-Motion Model (GMM) for Response Spectral Accelerations, Peak
Ground Velocity, and Significant Durations in the Groningen Field, Supplement to V4 GMM, Julian
Bommer and Peter Stafford, Independent Consultants, June 2017
5. Report on Mmax Expert Workshop, Mmax panel chairman Kevin Coppersmith, June 2016
6. Maximum magnitude from induced earthquakes in the Groningen field, Nora Dedontney et.al.,
Exxonmobil Upstream Research Company, July 2016

Title Fault Interpretation of the Groningen area supra-Zechstein
Overburden Date March 2017
Initiator NAM
Autor(s) Thomas Logeman Editors Jan van Elk and Dirk Doornhof
Organisation NAM Organisation NAM
Place in the Study and Data Acquisition Plan
Study Theme: Geological Modelling (Structural Model) Comment: Emphasis of geological modelling has traditionally been on the reservoir formations; the Rotliegend sandstone and also the immediately overlying Zechstein formation. However, for the prediction of ground motion and the determination of the hypocentre of an earthquake, the full rock column from the reservoir up to the surface and also down below the reservoir is important. In reports on the models used for Ground Motion Prediction this so-called overburden (rock above the reservoir) and to a lesser extent the underburden (rock below the reservoir) are discussed. Especially during the workshop on the maximum magnitude earthquake, the faults in the overburden and underburden were discussed. In this report, the faults in the formations above the Zechstein are presented and discussed.
Directliy linked research
(1) Ground Motion Prediction (2) Maximum Magnitude of Earthquakes
Used data Active 3D seismic data Groningen field.
Associated organisation
NAM
Assurance Internal NAM
Fault interpretation of the Groningen area supra-Zechstein Overburden
1
Nederlandse Aardolie Maatschappij B.V.
Shell UPO
Fault interpretation of the Groningen area supra-Zechstein Overburden
Date: June-2017
Issued by: Thomas Logeman NAM-UPO/T/DL
EP number: EP201703226971
Name Ref. Indicator Role Date Signature
Clemens Visser NAM-UPO/T/DGR PG Team lead Groningen
Martin de Keijzer NAM-UPX/E/T Senior exploration Geoscientist, NL and Germany
Remco Romijn NAM-UPO/T/GD GP Team lead, Development

Fault interpretation of the Groningen area supra-Zechstein Overburden
2
1 Executive summary
A comprehensive Groningen field overburden fault interpretation has been carried out to assess the possible
relation between recorded seismic events and overburden faults. This supra-Zechstein overburden fault
interpretation shows that most of the larger fault structures are related to halokinesis of the Zechstein
evaporites. Projecting the outline of the gas-water contact of the Groningen field onto the top Zechstein
horizon shows that the largest salt structures are positioned at the periphery of the Groningen gas field.
Consequently, this is also the area where a relatively high density of faults is found. In the crestal part of the
field, no salt structures of significance are observed and therefore also no associated overburden faults.
Areas with a Zechstein time thickness of less than a 75ms appear to have the highest chance of linkage
between sub_ and supra_Zechstein faulting. Such a limited thickness mainly occurs in the eastern part. Soft-
linked faulting is observed in the southeast and northeast. In the southeast two overburden faults are closely
associated with sub-Zechstein faults. The eastern ‘curved shaped’ fault aligns with a mapped sub-Zechstein
Pre-Saalian reactivated fault. The western N-S orientated fault aligns with a mapped sub-Zechstein post-
Rotliegend fault. Both faults can be traced up into the North Sea formation, but the area where soft-linked
faulting is observed is outside the Groningen gas field closure. In the northeast, two north dipping faults
are associated with thick-skinned faulting, of which the most northern fault shows soft-linked faulting
corresponding to a sub-Zechstein pre-Saalian reactivated fault. These faults extend into upper Triassic -
Jurassic deposits.
By integrating the fault interpretation with isochore maps it becomes clear that the dominant structural
features of the study area were present as of mid-to late Triassic times, and continued to evolve since. The
supra-Zechstein fault orientations align with the main sub-Zechstein fault trends. This is an indication that
reactivation of sub-Zechstein faults controlled the shaping of the Zechstein salt structures and thereby
indirectly also the overburden fault structures. Upper Triassic and Jurassic thickness maps show the
expression of an erosional event in middle-late Jurassic times, in most places eroding down into lower
Triassic deposits. Deposits in the lower Cretaceous are followed by thick deposits in the upper Cretaceous
honouring a NW-SE trend, in which the NW-SE orientated ‘salt-pillow’ grabens show thinner deposits than
the rest of the study area. This is an indication of a salt pulse at this stage. Halokinesis locally continued into
the Paleogene and Neogene, primarily in the eastern part of the study area.
The seismic quality of the upper 300ms make it impossible to give a decisive answer to whether faults extend
to surface. Projecting the fault - upper North Sea horizon intersections onto the present-day elevation map
indicates that these faults have no discernible expression at surface.

Fault interpretation of the Groningen area supra-Zechstein Overburden
3
Contents 1 Executive summary .............................................................................................................................................. 2
2 Introduction .......................................................................................................................................................... 4
3 Objectives, input data and methods .................................................................................................................. 4
3.1 Objectives ..................................................................................................................................................... 4
3.2 Input data ..................................................................................................................................................... 5
3.2.1 Seimic data ............................................................................................................................................... 5
3.2.2 Horizon data............................................................................................................................................ 5
3.3 Methods ........................................................................................................................................................ 6
3.3.1 Seismic interpretation ............................................................................................................................ 6
3.3.2 Fault-horizon intersection maps .......................................................................................................... 6
4 Geological setting ................................................................................................................................................. 6
5 Salt tectonics ......................................................................................................................................................... 8
5.1 The Zechstein group .................................................................................................................................. 8
5.2 Salt structures ............................................................................................................................................... 9
6 New fault map of the supra-Zechstein overburden .....................................................................................12
6.1 The northwest ............................................................................................................................................14
6.2 The north-northeast .................................................................................................................................17
6.3 The center-east ..........................................................................................................................................20
6.4 The southeast .............................................................................................................................................22
6.5 The west-southwest ..................................................................................................................................24
7 Structural evolution of the supra-Zechstein overburden .............................................................................27
7.1 Isochore maps ...........................................................................................................................................27
7.1.1 Lower Triassic .......................................................................................................................................29
7.1.2 Upper Triassic & Jurassic ....................................................................................................................30
7.1.3 Lower & Upper Cretaceous ................................................................................................................31
7.1.4 Paleogene (lower North Sea) and Neogene (upper North Sea) ....................................................32
8 Summary and conclusions ................................................................................................................................34
9 Recommendations for further work ...............................................................................................................35
10 Fault interpretation project ...............................................................................................................................35
11 References ...........................................................................................................................................................36

Fault interpretation of the Groningen area supra-Zechstein Overburden
4
2 Introduction Recent seismic events in the area of the Groningen gas field have triggered renewed interest in the presence
of faults in the Groningen field overburden. It has been suggested that there is a possible relation between
the seismic events and overburden faults. Therefore, a new seismic fault interpretation of the reprocessed
R-3136_Groningen 3D seismic cube has been made focusing on supra-Zechstein formations. A possible
relation between sub- and supra-Zechstein faults has also been investigated. The results are presented in
this report.
3 Objectives, input data and methods
3.1 Objectives The key objectives were:
To generate a supra-Zechstein overburden fault interpretation, with emphasis on faults running
from top Zechstein into the North Sea Group formations.
To assess a possible relation between faults in the overburden and sub-Zechstein faults.
As the study mainly focused on formations and structures above the top Zechstein, all supra-top Zechstein
formations will be regarded as overburden. The study area (Figure 1) is covered by a 50 x 50km seismic
cube that is composed of multiple surveys. Figure 1 displays the top Zechstein horizon with the outline of
the gas-water contact of the Groningen field projected onto it..
Figure 1: TWT map of the top Zechstein horizon, with the outline of the gas-water contact of the Groningen field in green.

Fault interpretation of the Groningen area supra-Zechstein Overburden
5
3.2 Input data
3.2.1 Seimic data For the seismic interpretation the R3136_15UnrPrDMkD_Full_T_Rzn_RMO_Shp_AVC seismic cube was
used. It consists of an area of approximately 2700 km2 of 3D seismic, covered by several (partially
overlapping) surveys, acquired in the early 1990’s (Wervelman, R., 2015) and will be used for 3D seismic
interpretation. The interpretation was conducted in the time domain, with a full-stack seismic cube. Figure
2 shows the same seismic line of the near-stack cube and the full-stack cube. With the focus on mapping
larger faults and less on small subtle faults, quality discrepancies between the near-stack and the full-stack
cube were assessed to be trivial and therefore the full-stack cube was used.
Overall the seismic imaging quality of the supra-Zechstein is considered to be of good quality, except for
the northeastern area where no data is present. The upper ~300ms are assessed to be uninterpretable
because the 500x500m receiver-transmitter grid introduces a dominant acquisition direction as artifacts in
the upper part of the overburden, losing its interference with depth.
Figure 2: Seismic line of the near-stack (upper) and the full-stack (lower) seismic cube.
3.2.2 Horizon data Table 1 contains the horizons used for the interpretation. Figure 3 displays the lithostratigraphic column
and the associated markers.
Horizons Corresponding markers
Base Upper North Sea NU_B

Fault interpretation of the Groningen area supra-Zechstein Overburden
6
Base Lower North Sea NS_B
Base Chalk CK_B
Base Rijnland KN_B
Base Altena AT_B
Top Röt RNRO_T
Top Zechstein ZE_T
Table 1: List of horizons provided and their corresponding markers.
3.3 Methods
3.3.1 Seismic interpretation With the top Zechstein evaporites as the base level of interest, the main Zechstein topographic irregularities
were the initial focus areas. By initially scanning through seismic lines perpendicular to the major salt
structures the major faults of the area were identified. These were mapped through manual picking.
This was followed by assessing the possibility of using volume attributes to better identify faults. Both SOF
semblance and semblance processing was applied on the dataset, followed by both active and passive Petrel
Ants extraction. This showed that the specific data set is not suitable for these attributes, because of the
acquisition artifacts in the upper ~300ms. It was attempted to filter out these artifacts in ant tracking by
setting the stereonet option to filter out between 90 and 70 degrees. The upper 300ms of seismic data can
be considered uninterpretable because of these artifacts.
Horizon/surface attributes proved to be more effective than the mentioned volume attributes. Use was
made of the following attributes:
Horizon/surface probes (sculpting). This is an irregular probe that follows one horizon. The probe
was aligned vertically to the center of the horizons with a thickness of 40ms.
The traditional dip and dip-azimuth attributes.
3.3.2 Fault-horizon intersection maps A workflow was created in Petrel to derive the fault-horizon intersections. This workflow creates clean fault
sticks from the interpreted fault sticks and converts them into a surface. Then it crops the fault surfaces and
smoothens the horizons and faults surfaces. Intersections are then created from the fault surfaces and the
horizons. The output is a set of fault-horizon intersection polygons that can be projected onto horizon and
isochore maps. These maps were used to determine the areas with high fault density and through which
formations the faults were active.
4 Geological setting The study area is located in the NE Netherlands, southern Permian basin and comprises the overburden of
the Groningen high. With a 100 Tcf GIIP the Groningen high contains one of the largest gas reservoirs of
the world (Dijksman, 2009), The Rotliegend sandstones (middle Permian) form the reservoir (A. Sluijk, K.
van Ojik, M. de Keijzer, J. Graaf, J. Steenbrink, 2011). The reservoir is sealed by late Permian Zechstein
evaporites. Triassic to lower-Cretaceous sequences are poorly developed on the Groningen high, reflecting
a structural elevation during this time (van Gent, 2010). Late Cretaceous Chalk, Chalky limestones and
relatively dense limestones form the Chalk group (van Gent, 2010). This stage is associated with regional
tectonic inversion, of which the intensity varied from basin to basin (de Jager, 2003). Inversion of the
Groningen high is thought to be relatively mild (de Keijzer, M., 2008). Above the Chalk interval, sedimentary

Fault interpretation of the Groningen area supra-Zechstein Overburden
7
sequences ranging between 800-1800m of predominantly siliciclastic Paleogene and Neogene deposits make
up the North-Sea super group (van Gent, 2010).
Multi-phase salt movement of the Zechstein evaporites has influenced the younger deposits and tectonics
in the study area. It has resulted in folded structures, thin and thick-skinned faults, uplift and erosion of
younger sediments and syn-tectonic deposits. Figure 3 displays the main tectonic phases and formations.
Figure 3: Geological time scale (Grandstein, 2004) and lithostratigraphic column (van Adrichem Boogaert H. , 1993-1997) showing main tectonic phases.

Fault interpretation of the Groningen area supra-Zechstein Overburden
8
5 Salt tectonics
5.1 The Zechstein group The Zechstein group was deposited in the Southern Permian Basin and consists of five dominantly
evaporitic cycles (Geluk, 2000) (Figure 4). In the study area only the Z1-Z4 cycles are found.
The first evaporitic cycle (Z1) forms an E-W trending anhydrite platform in the central Netherlands (van
Adrichem Boogaert H. , 1983). The study area is located on the slope to basin facies and wells show a 50m
thick layer of anhydrite deposited continuously in the study area. The second (Z2) and third (Z3) cycle
generally contain the thickest halite intervals that respectively reach thicknesses of up to 600m and 300m
(ten Veen, 2012). It should be noted that due to halokinesis salt thicknesses found in the study area are not
representative for the depositional thickness. The Z4 salt is deposited locally in isolated depocentres (ten
Veen, 2012).
Since it is the thickness and presence of mechanically ductile salt that plays a role in halokinesis and
decoupling, the salt should be separated from the rest of the Zechstein group. To get an estimation of the
actual presence and thickness of salt to determine if thick-skinned faults can potentially be present the 50
m Z1 anhydrite is substracted from the Zechstein group.
Figure 4: Zechstein group Z1-Z5 formations. Zechstein facies in the Netherlands, from South to North (Geluk, 2000).

Fault interpretation of the Groningen area supra-Zechstein Overburden
9
5.2 Salt structures It is broadly recognised that most faults in the Northern and Eastern Netherlands supra-Zechstein
formations are related to salt movements (van Gent, 2010). The level of halokinesis seen in the study area
(Fig. 4) is similar to that seen more regionally / a cross the Southern Permian Basin (Fig. 3).
Figure 5: Map showing the distribution of salt diapirs and pillows. The study area is located inside the red rectangle and projected on a map from (Mohr, 2005) of the central part of the Southern Permian Basin.
The study area includes 12 major salt structures (Figure 7). Distinction will be made between salt pillows
and salt diapirs(Figure 6). A positive salt structure produced by thickening of the salt without piercement of
the overburden will be refered to as a salt pillow (van der Es, J.S., 1995). A salt diapir describes a salt feature
where active piercement of the overlying sequence has taken place (van der Es, J.S., 1995). Local salt
structures can be named after their shape: wall or arch.
Figure 6: Conceptual image of the destinguished positive salt structures observed in the study area.

Fault interpretation of the Groningen area supra-Zechstein Overburden
10
Figure 7: A map of the top Zechstein horizon identifying the major salt structures in the study area. Distinction is made between salt pillows and salt diapirs.
The timing of the growth of the salt structures differs from area to area, but periods of accelerated pulses
are known. These are generally associated with times of increased tectonic activity (van der Es, J.S., 1995).
Zechstein salt movement initiated following deposition of the Buntsandstein, during periods of extension
in the middle-late Triassic (early Kimmerian) (van der Es, J.S., 1995). This is followed by an erosional event
in the middle-Jurrassic caused by thermal doming (mid Kimmerian) (van der Es, J.S., 1995). Late Jurrassic
– early Cretaceous rifting (late Kimmerian) devides the area into rapidly subsiding basins and more quiescent
platform areas (van der Es, J.S., 1995). At the end of the late Cretaceous structural inversion affects most
basin areas (van der Es, J.S., 1995). Subsdence is resumed in the Tertiary and the sedimentation of thick
marine and fluvial sediments is interrupted by several erosional events which are believed to be related to
late inversion pulses and eustatic sea level changes (van der Es, J.S., 1995).
In Chaper 7 thickness maps are integrated with the fault interpretation These give an indication wether the
structural features in the study area align with this.
The distribution and orientation of the interpreted overburden faults strongly coincides not only with the
Zechstein salt structures, but also with the main sub Zechstein faults (Figure 25, Figure 26). This indicates
that the formation of overburden faults is evoked by the formation of Zechstein salt structures, which in
turn appears to be initiated by sub-Zechstein fault movement.
Salt movement in an area like the southern Permian basin is controlled by an interplay of several factors
including the weakening of the overburden by active faulting, consequent differential loading induced by
fault controlled accommodation space generation and the buoyant behaviour of salt (van Winden, 2015).
Faults associated with this salt movement can be categorized as follows:
1. Hard-linked faults: faults above and below the salt cover are in direct contact at seismic resolution.
Because the Zechstein group (Figure 4) is not solely made up of halite, but also contains a 50m
thick continuous anhydrite layer at the base (Z1) it can be assumed that when the Zechstein
thickness is less than 50m thick no halite is present and hard linked faults can be present. (referred
to as ‘3’in Figure 8).
2. Soft-linked faults: Faults above and below the salt cover are spatially related, but they are not
connected. This is dependent on the ratio between the basement fault offset and the salt thickness.
A quantitative fault distribution analysis shows that faults are only able to penetrate salt with a

Fault interpretation of the Groningen area supra-Zechstein Overburden
11
depositional thickness of < 300m (ten Veen, 2012). This thickness will be used to give an indication
whether thick-skinned or thin-skinned is likely to be present( refered to as ‘2’ in Figure 8).
3. Non –linked faulting: Faults above and below the salt cover are completely decoupled by thick salt.
(refered to as ‘1’ in Figure 8).
Figure 8: Linking of faults below and above a salt cover (van Winden, 2015). 1) Non-linked fault. 2) Soft-linked fault. 3) Hard-linked fault.
These different types of faults show there is a close relationship between salt thickness and structural style.
The thickness map of the Zechstein (Figure 9) gives an indication of which areas are more prone to have
either hard linked, soft linked or unlinked faults.
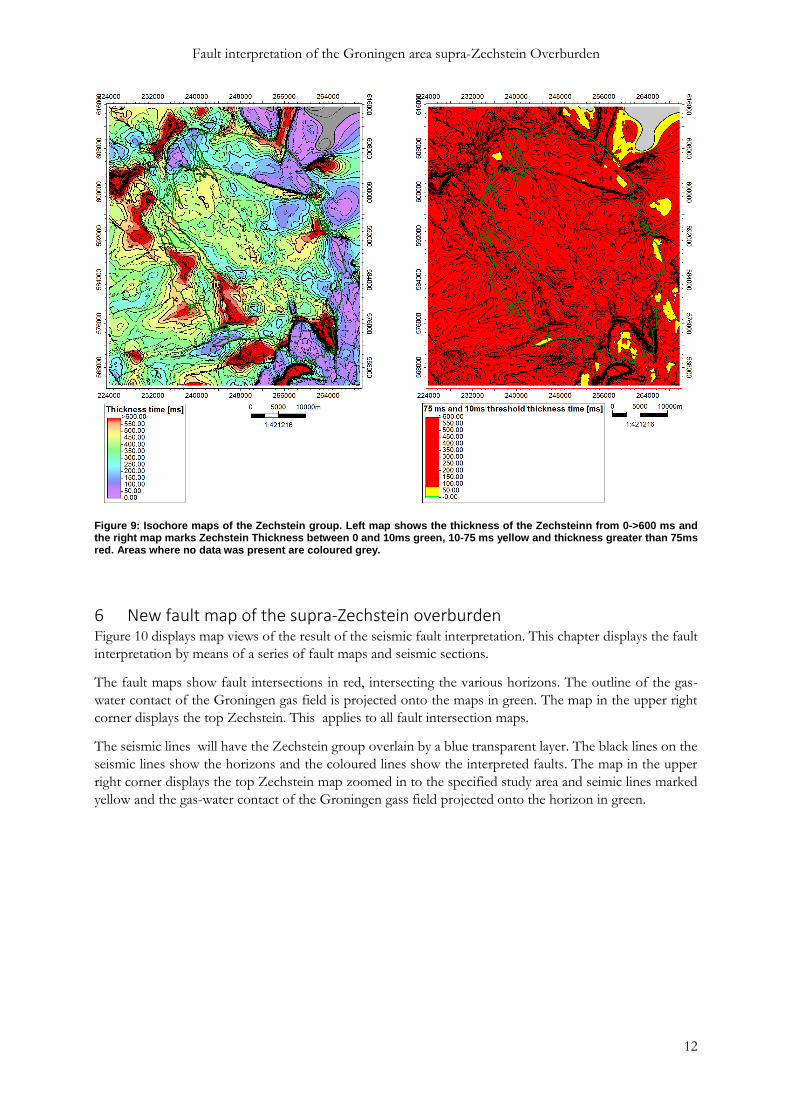
Figure 9 shows two versions of the isochore map of the Zechstein group, with the right map marking all
areas where the thickness is less than 10 ms green and areas with a thickness of less than 75 ms yellow. The
10ms threshold was chosen because a 50m thick anhydrite layer corresponds to approximately 10ms,
assuming a velocity of 5900m/s. The 75ms threshold was distinguished because this corresponds to 300m
of salt at a velocity of 4500m/s and around 50m of anhydrite at 5900 m/s.
Hard linked faults are not expected in the study area as thicknesses of the Zechstein group of less than 10
ms (approximately 50m of anhydrite) is not observed. Zechstein thicknesses less than a 75ms (approximately
300m of salt and 50 m of anhydrite) are mainly found in the eastern part of the study area, and soft linked
faults would be expected there. With the major part of the study having significant salt thickness (area
coloured red in Figure 9), unlinked faults are expected for most of the study area. See Section 6 for further
details on the overburden fault interpretation and relations to the Zechstein.
Fault interpretation of the Groningen area supra-Zechstein Overburden
12
Figure 9: Isochore maps of the Zechstein group. Left map shows the thickness of the Zechsteinn from 0->600 ms and the right map marks Zechstein Thickness between 0 and 10ms green, 10-75 ms yellow and thickness greater than 75ms red. Areas where no data was present are coloured grey.
6 New fault map of the supra-Zechstein overburden Figure 10 displays map views of the result of the seismic fault interpretation. This chapter displays the fault
interpretation by means of a series of fault maps and seismic sections.
The fault maps show fault intersections in red, intersecting the various horizons. The outline of the gas-
water contact of the Groningen gas field is projected onto the maps in green. The map in the upper right
corner displays the top Zechstein. This applies to all fault intersection maps.
The seismic lines will have the Zechstein group overlain by a blue transparent layer. The black lines on the
seismic lines show the horizons and the coloured lines show the interpreted faults. The map in the upper
right corner displays the top Zechstein map zoomed in to the specified study area and seimic lines marked
yellow and the gas-water contact of the Groningen gass field projected onto the horizon in green.

Fault interpretation of the Groningen area supra-Zechstein Overburden
13
Figure 10: Fault intersection maps of the entire study area.

14
To facilitate the Rotliegend reservoir fault interpretation the area was divided into structural domains (SD).
This was done by (Structural Evolution of the Groningen West-Periphery; de Keijzer, M., 2008) on the
Groningen Western Periphery and later applied on the entire Groningen field (Visser, C., 2012).
However, extrapolating these structural domains to the overburden and using them to describe the
overburden fault interpretation is not straightforward because the Zechstein evaporites acted as a
detachment level (Coward, 1995).
Therefore the area is divided and described on the basis of the different salt structure and five different
sub-areas are distinguished (Figure 11):
1. The northwest: Two NE-SW orientated salt diapirs.
2. The north-northeast: One arch-shaped salt diapir and one E-W orientated salt diapir.
3. The center-east: One salt wall diapir and one salt diapirs.
4. The southeast: Two NE-SW orientated salt diapirs.
5. The west-southwest: Four NW-SE orientated salt pillows.
Figure 11: Maps showing the outline of the five areas of interest used to describe the fault interpretation marked in red and projected onto the top Zechstein horizon. Outline of the gas-water contact projected onto the map in green.
6.1 The northwest In the northwest two salt diapirs are present with a SW-NE orientation. The most northern structure runs
from NE-SW and has a collapse graben on top extending from the northern diapir to the southern diapir.
The extensional graben faults run from the top Zechstein into the upper North Sea formation. The major
normal fault dips towards the southeast. The graben terminates in the northeast against a normal fault. This
is shown in cross-section A-‘A of Figure 13. Another collapse graben strikes NW-SE and crosses the major
NE-SW graben. This graben extends into the Cretaceous Chalk formation, but is absent in the North Sea
formations. Cross-section B-‘B in Figure 13 shows the NW-SE trending collapse graben

Fault interpretation of the Groningen area supra-Zechstein Overburden
15
The southern diapir has a collapse graben running of its southern flank and a graben parallel to it that is
associated with a salt pillow south of the diapir (Figure 12). Cross-section D-‘ D in Figure 13 shows both
these collapse grabens. Its orientation is in line with the en echelon shaped fault system and the salt pillows
running NW-SE and south of the diapir.
In this part of the study area, a Zechstein thickness less than a 75ms is only found east of the northern
diapir (Figure 9). Crossline E-‘E in Figure 13 shows that this basin appears to be related to salt depletion
into the adjacent salt diapir. No soft-linked faults are observed in this area, only unlinked faults.

16
Figure 12: Fault intersection maps of the northwestern sub-area.

17
Figure 13: Seismic lines of the northwestern sub-area.
6.2 The north-northeast Salt structures are dominated by a N-S and WNW-ESE structural grain. This is expressed by an arch-shaped
salt diapir and an E-W orientated salt diapir. Cross-section A-‘A in Figure 15 shows that the arch-shaped
salt structure is cut off by a NE-SW running fault in the west and has a NE-SW orientated graben over its
eastern flank. Cross-section B-‘B in Figure 15 shows a mild pop-up structure above the eastern salt diapir
limited to the Chalk and lower North Sea formations. This might be related to inversion in the late
Cretaceous.
Seismic line C-‘C in Figure 15 runs through an area where Zechstein thickness is less than 75 ms. In the
northern part of the section faults are restricted to the Triassic deposits. The green and yellow fault dipping
north align with sub-Zechstein faults and are most likely soft-linked Figure 26 indicates that in this area a
reactivated pre-Saalian fault alings with the soft-linked overburden fault.

18
Figure 14: Fault intersection maps of the north-northeastern sub-area.

19
Figure 15: Seismic lines of the north-northeastern sub-area.

Fault interpretation of the Groningen area supra-Zechstein Overburden
20
Figure 16: Seismic line zoomed in to soft-linked faults (green and yellow fault).
6.3 The center-east This part of the study area covers the center of the Groningen gas field and Figure 17 shows that in this
area there is a low density of faults. This is in line with the absence of major salt structures in the area. The
most pronounced salt structure present is a E-W orientated salt wall diapir that can be extended to the
Mesozoic restricted collapse graben that crosses the NE-SW orientated graben in the northwest of the study
area. No major overburden faults appear to be associated with the salt wall, but some faults are observed
parallel to the salt structure in the Tríassic formation and above the salt wall in the Cretaceous- lower North
Sea. Cross-section B-‘B in Figure 18 shows a seismic line perpendicular to the salt wall and the associated
faults. The salt wall appears to have been most active in the Triassic-Jurrasic period after which these
formations were eroded off. A later pulse that might be related to the late Cretaceous inversion is associated
with some faults around the top Chalk-base North Sea. A study by van Gent (van Gent, 2010) describes
the presence of a large number of minor faults in the Chalk formation that were used for paleostress
reconstruction from seismic data, however these were faults restricted to the Chalk formation and picked
on extra interpreted reflectors in the Chalk. For this study these minor faults are of no relevance.
The second major fault structure is a N-S orientated graben that is associated with a salt diapir. Seismic line
A-‘A of Figure 18 displays this graben and shows how it extend into the upper part of the lower North Sea
formation. The seismic line also shows the relative quiescence in the area crossing the crest of the Groningen
high.
North of the eastern part of the salt wall and east of the diapir, areas with a Zechstein thickness less than
75 ms are observed. The seismic lines of Figure 18 show that these areas show no thick skinned faults. Only
the northern part of seismic line B-‘B shows there is a fault marked yellow that might be a thick skinned
fault. This fault is associated with salt structures north of the salt wall and these are discussed in chapter 6.2.

21
Figure 17: Fault intersection maps of the center-eastern sub-area.

22
Figure 18: Seismic lines of the center-eastern sub-area.
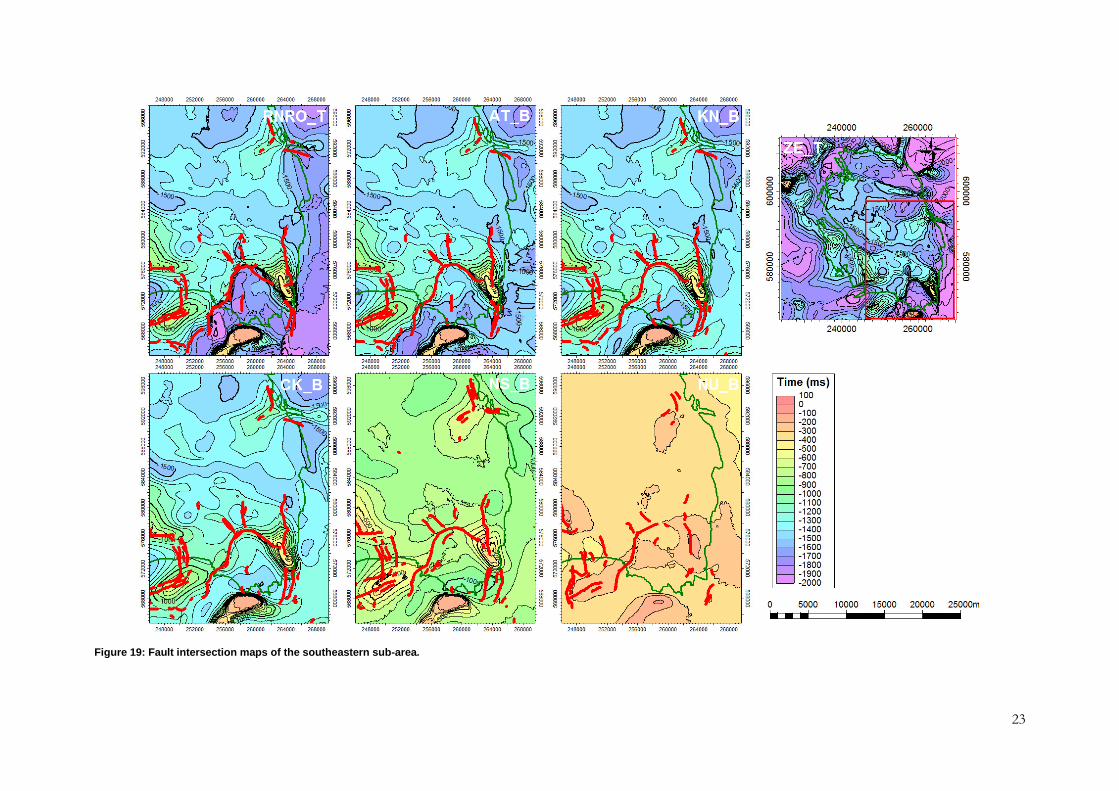
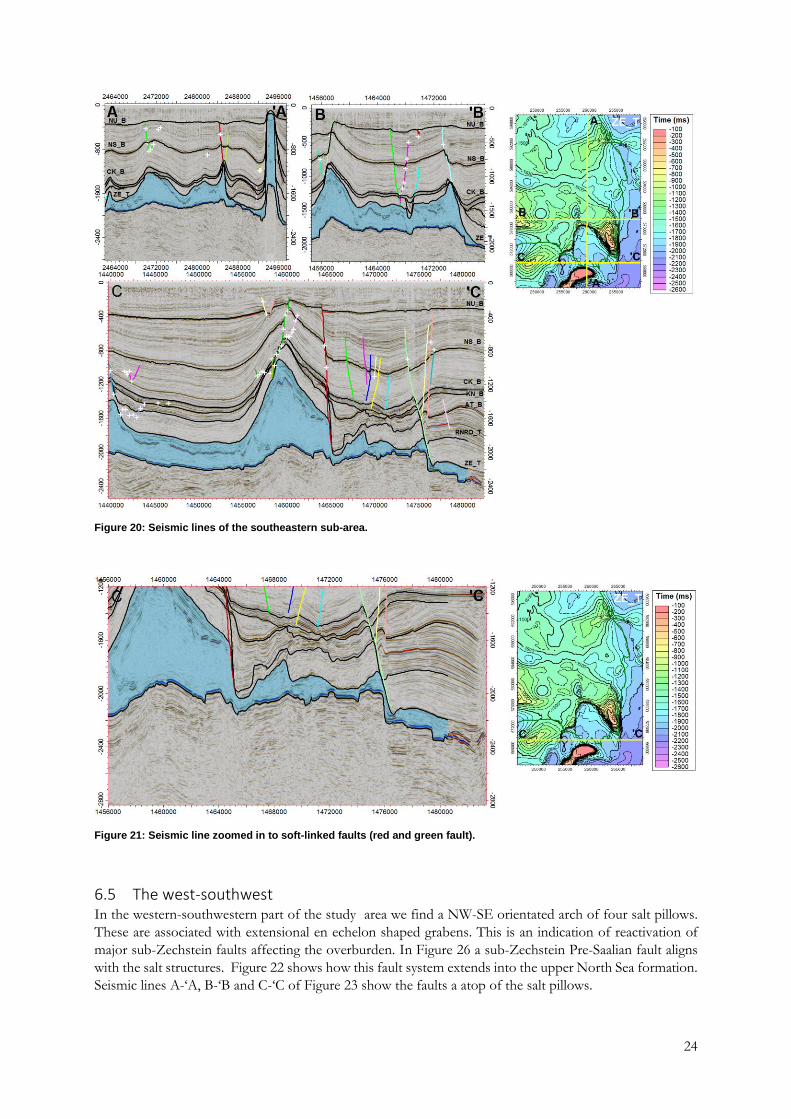
6.4 The southeast This part of the study area is dominated by two salt diapirs and a major curved shaped extensional fault that
runs perpendicular to the NW-SE orientated en echelon shaped grabens northeast of it. Both seismic line
A-‘A and B-‘B of Figure 20 display the fault marked in red. This fault cuts off the salt pillow located west
of it, runs into the eastern salt diapir and extends into the upper North Sea formation (Figure 19).
A second major fault runs N-S and is related to the eastern salt diapir. Seismic line B-‘B in Figure 20 shows
the fault running atop of the diapir. Seimic line C-‘C in Figure 20 shows a fault with a similar orientation
running into the diapir (Figure 19).
The major diapir is present in the southern part of the area. Seismic line A-‘A of Figure 20 shows how the
diapir pierces through its ovellying deposits and almost has expression uptill surface. No major faults are
associated with the diapir, but cross-section C-‘C in Figure 20 shows a high level of minor N-S orientated
faults that are limited to the Chalk and lower North Sea formation north of the diapir.
With two major salt diapirs present in the area, depleting the surrounding Zechstein group, in this part of
the study area there is also an area with a Zechstein thickness of less than a 75 ms. The two major faults
described above and shown on cross-section C-‘C of Figure 20 appear to have a strong relation with sub
Zechstein faults. The most eastern N-S orientated fault marked in light green appears to be correlatable to
a fault sub-Zechstein and thus soft-linked. Figure 26 shows it aligns with a sub-Zechstein Pre-Saalian
reactivated fault. The major fault marked red on cross-section C-‘C also appears to be directly linked to a
sub-Zechstein fault.
23
Figure 19: Fault intersection maps of the southeastern sub-area.
24
Figure 20: Seismic lines of the southeastern sub-area.
Figure 21: Seismic line zoomed in to soft-linked faults (red and green fault).
6.5 The west-southwest In the western-southwestern part of the study area we find a NW-SE orientated arch of four salt pillows.
These are associated with extensional en echelon shaped grabens. This is an indication of reactivation of
major sub-Zechstein faults affecting the overburden. In Figure 26 a sub-Zechstein Pre-Saalian fault aligns
with the salt structures. Figure 22 shows how this fault system extends into the upper North Sea formation.
Seismic lines A-‘A, B-‘B and C-‘C of Figure 23 show the faults a atop of the salt pillows.
Fault interpretation of the Groningen area supra-Zechstein Overburden
25
A second structural component of the this part of the study area is a group of SW-NE orientated collapse
grabens cutting off and running into the NW-SE orientated grabens. These die out in the upper Cretaceous
and are dominantly present in the Triassic formation (Figure 22). The orientation of these faults coincides
with the orientation of post-Rotliegend faults in the Rotliegend formation (Figure 26). Seismic line D-‘D of
Figure 23 crosses the three minor grabens perpendicular and shows their absence in post Jurassic deposits.
Figure 9 indicates that thick-skinned faulting is only likely to be present between the the two most southern
salt pillows as this is the only area where Zechstein thickness is less than a 75ms. Seismic line E-‘E in Figure
23 shows a synclinal structure above the thin Zechstein area, but no thick-skinned faulting related to it.

26
Figure 22: Fault intersection maps of the west-southwest part of the study area.

27
Figure 23: Seismic lines of the west-southwestern sub-area.
7 Structural evolution of the supra-Zechstein overburden
7.1 Isochore maps To better understand how the study area developed structurally, thickness maps are integrated with the fault
interpretation. Figure 24 displays the isochore maps with the Zechstein group in the left corner and the
upper North Sea formation the bottom right corner. These are later displayed with the faults intersecting
the base of the formation in yellow and the faults intersecting the top of the formation in red. The
Groningen gas field is projected onto the maps in green.

28
Figure 24: Isochore maps of the overburden formations and the Zechstein group displayed chronologically from top left to bottom right.

29
7.1.1 Lower Triassic Integrating the lower Triassic thickness map with the faults intersecting its top horizon (top Röt, RNRO_T)
in Figure 25 show that thickness trends are already coinciding with the fault structures at this stage of the
tectonic history. It should be made clear that it is not suggested that all faults shown at this level are Triassic
in age. Faults that correspond to thickness changes are likely to have initiated at this stage, but faults that
are in the middle of thin parts are probably younger in age and only formed when the salt structures really
took off causing larger overburden strains.
The NW-SE oriented en echelon faults in the western part of the study area coincide with thinner lower
Triassic deposits, as for the SW-NE orientated grabens in the southwest, the N-S orientated faults in the
east and WNW-ESE orientated structures in the center-east of the study area. As these faults are associated
with salt tectonics, this indicates that Zechstein salt movement occurred at this stage. With thickness trends
corresponding to sub-Zechstein fault orientations and already displaying all the major structural features of
the interpreted faults, it can be assumed that reactivation of sub-Zechstein faults controlled the location of
the major salt structures and the associated overburden faults. Their presence in the lower Triassic isochore
map shows that already at this stage all major structural features were ‘imprinted’ in the Zechstein and in
the overburden. This is in line with the general consensus that Rotliegend fault patterns are in part derived
from rejuvenation of older deeper-seated faults (de Keijzer, M., 2008). The resemblance between the
overburden fault interpretation and the Rotliegend fault map (Figure 26) is also striking. The reactivation of
some faults may be linked to the Hardegsen phase in which uplift was followed by mild rifting in the early
Triassic (de Keijzer, M., 2008). This event is assumed to have initiated halokinesis in the area (van der Es,
J.S., 1995).
Figure 25: Thickness map of the lower Triassic, with the ZE_T (top Zechstein) used as base and the T_RNRO (top Röt) as top of the section.

Fault interpretation of the Groningen area supra-Zechstein Overburden
30
Figure 26: Rotliegend fault map by de (de Keijzer, M., 2008) made with the objective of delineating the different fault families. Map also shows the Zechstein isochores in bluish purple where >1000m thick.
7.1.2 Upper Triassic & Jurassic The isochore maps displayed in Figure 27 show that the upper Triassic and the Jurassic deposits are strongly
affected by an erosional event. This is related to the uplift of the Groningen high, starting in middle Jurassic
times and with further uplift as a rift shoulder in later Jurassic times (de Keijzer, M., 2008). As a result,
Jurassic deposits are only preserved in the southeast of the study area, associated with the major thick-
skinned fault system orientated SW-NE, and upper Triassic deposits are absent in the center of the
Groningen high.

Fault interpretation of the Groningen area supra-Zechstein Overburden
31
Figure 27: Left: Isochore map of the upper Triassic, with the T_RNRO (top Röt) used as base and th e AT_B (base Altena) as top of the section,. Right: Isochore map of the Jurassic with the AT_B (base Altena) as base and KN_B (base Rijnland) as top of the section.
7.1.3 Lower & Upper Cretaceous The lower Cretaceous thickness map in Figure 28 shows less deposition in the center of the study area.
Thicker deposits are found in the southeast surrounding the major salt diapirs. This indicates salt removal
around the salt structures, creating depositional space.
Late Cretaceous tectonic events were related to regional tectonic inversion associated with multiple key
pulses (de Keijzer, M., 2008). The intensity of the inversion varies per basin and the inversion in the
Lauwerszee through and the Groningen high was mild (de Keijzer, M., 2008) compared to for example the
Broad Fourteens Basin. The overburden deposits mainly exhibit extensional deformation during the upper
Cretaceous (van Gent, 2010). However in the center-eastern part some faults in the upper Cretaceous -
lower North Sea sections are pop-up structures overhead salt structures presumably related to inversion.
A progressing subsidence associated with post-rift cooling and sea level rise resulted in the deposition of
the late Cretaceous chalk (van der Es, J.S., 1995). This is also shown in the upper Cretaceous thickness map
of Figure 28, with depositional thicknesses more than 300ms (~1200m, assuming an average velocity of
4000m/s). The southwest does have a thinner upper Cretaceous deposit, associated with the NW-SE
orientated salt pillows. This is an indication of a salt tectonic pulse at this stage. In the upper Cretaceous
deposits, the SW-NE oriented faults die out vertically.

Fault interpretation of the Groningen area supra-Zechstein Overburden
32
Figure 28: Isochore map of the lower Cretaceous, with the KN_B (base Rijnland) used as base and the CK_B (base Chalk) as top of the section, displayed left. Isochore map of the upper Cretaceous with the CK_B (base Chalk) as base and NS_B (base North Sea) as top of the section.
7.1.4 Paleogene (lower North Sea) and Neogene (upper North Sea) Subsidence resumed in the Paleogene and Neogene resulting in the deposition of a thick sequence of marine
and fluviatile sediments (van der Es, J.S., 1995). The thickness map of the lower North Sea of Figure 29
show how deposits are thick, but still follow the topography of the major salt structures, indicating
continued halokinesis.
The isochore map of the upper North Sea formation shows how deposits are distributed relatively uniform
at this stage, but the collapse grabens related to the NW-SE orientated salt pillows in the east and grabens
related to the salt structures in the northeast of the study area have thicker deposits.
Due to the poor seismic quality of the upper 300ms of the seismic dataset caused by acquisition artifacts it
is not possible to give a decisive answer to whether faults extend to surface. Figure 30 shows the fault
intersections with the base upper North Sea horizon projected on the present-day elevation map. No
obvious correlation is observed, but the Drentse heuvelrug in the southwest does align with the NW-SE
orientated collapse grabens north of it.

Fault interpretation of the Groningen area supra-Zechstein Overburden
33
Figure 29: Isochore map of the lower North Sea, with the NS_B (base North Sea) used as base and the NU_B (base upper North Sea) as top of the section, displayed left. Isochore map of the upper North sea with the NU_B (base Chalk) as base and 0 (with the absence of surface height coordinates 0 was used) as top of the section
Figure 30: Topographical/elevation map (generated by the Actueel Hoogtebestand Nederland) of the Groningen province with the fault intersections of the NU_B horizon projected onto the map in red and the outline of the gas-water contact projected in green. E-W lines are caused by the merging of maps.

Fault interpretation of the Groningen area supra-Zechstein Overburden
34
8 Summary and conclusions The new supra-Zechstein overburden fault interpretation shows that most of the larger fault structures are
related to halokinesis of the Zechstein evaporites. Projecting the outline of the gas-water contact of the
Groningen field onto the top Zechstein horizon shows that the largest salt structures are positioned at the
periphery of the Groningen gas field. Consequently, this is also the area where a high density of faults is
found. Northwest of the field, a NE-SW orientated collapse graben is associated with two salt diapirs.
Moving south along the western boundary of the field, a series of grabens are linked to the presence of four
salt pillows with a NW-SE orientation. The main fault shaping the southern graben extends into the
Groningen field. In the southeast a major ‘arch-shaped’ normal fault crosses the southeastern part of the
field area. Southeast of this fault a N-S orientated fault is developed. Along the eastern boundary of the
Groningen field area, some N-S and E-W oriented faults are associated with salt structures. The
northeastern part of the study area shows a salt wall diapir and an arch-shaped diapir. These have caused
overburden faulting. In addition, E-W orientated faults are found that are not linked to the salt structures.
In the crestal region of the field, no salt structures of significance are observed and therefore also no
associated overburden faults.
To assess a possible relation between sub-and supra-Zechstein faults, areas with a Zechstein time thickness
of less than a 75ms have been closely examined from seismic cross-sections. Such a limited thickness mainly
occurs in the eastern part. Soft-linked faulting is observed in the southeast and northeast. In the southeast
two overburden faults are closely associated with sub-Zechstein faults. The eastern ‘curved shaped’ fault
aligns with a mapped sub-Zechstein Pre-Saalian reactivated fault. The eastern N-S orientated fault aligns
with a mapped sub-Zechstein post-Rotliegend fault. Both faults can be traced up into the North Sea
formation, but the area where soft-linked faulting is observed is outside the Groningen gas field. In the
northeast two north dipping faults are associated with thick-skinned faulting, of which the most northern
fault shows soft-linked faulting corresponding to a sub-Zechstein pre-Saalian reactivated fault. These faults
extend into upper Triassic - Jurassic deposits.
By integrating the fault interpretation with isochore maps it becomes clear that the dominant structural
features of the study area were present as of mid-to late Triassic times, and continued to evolve since. The
supra-Zechstein fault orientations align with the main sub-Zechstein fault trends. This is an indication that
reactivation of sub-Zechstein faults controlled the shaping of the Zechstein salt structures and thereby
indirectly also the overburden fault structures. Upper Triassic and Jurassic thickness maps show the
expression of an erosional event in middle-late Jurassic times, in most places eroding down into lower
Triassic deposits. Deposits in the lower Cretaceous are followed by thick deposits in the upper Cretaceous
honouring a NW-SE trend, in which the NW-SE orientated ‘salt-pillow’ grabens show thinner deposits than
the rest of the study area. This is an indication of a salt pulse at this stage. Halokinesis locally continued into
the Paleogene and Neogene, primarily in the eastern part of the study area.
The seismic quality of the upper 300ms make it impossible to give a decisive answer to whether faults extend
to surface. Projecting the fault - upper North Sea horizon intersections onto the present-day elevation map
indicates that these faults have no discernible expression at surface.
Based on the study the following conclusions are made:
1. Faulting in the overburden above the Groningen field is primarily associated with halokinesis of
Zechstein evaporates.
2. Areas of highest fault density coincide with areas of strongest halokinesis, which are located outside,
or in the peripheral parts of, the Groningen field.
3. Sub-Zechstein and supra-Zechstein faults are generally decoupled, soft-linkage is only observed to
the east of the Groningen field.
4. Some supra-Zechstein faults continue into the Lower North Sea Group, but seem to die out at
shallower depths. However, the seismic quality in the topmost 300 ms of the overburden is not
sufficient to do a proper assessment of the presence of faults. There is no expression of subsurface
faults in the present-day topography in the study area.

Fault interpretation of the Groningen area supra-Zechstein Overburden
35
9
109 Recommendations for further work
Integrate the overburden fault interpretation with recorded seismic events and focal mechanisms.
Convert fault model to depth domain and use RDR tools to further QC the interpretation and
calculate max trow/displacement of the faults. This can help determine the magnitude of the
seismic events the faults could potentially have caused.
Further investigate the relation between specific sub-Zechstein faults and salt
structures/overburden faults and make a proper reconstruction of salt tectonics in the area. In
order to get a better view on which unlinked faults could potentially become soft-linked or which
soft-linked faults could become hard-linked.
1110 Fault interpretation project Software
Petrel 2014 was used for the 3D seismic interpretation and was used to generate horizon, fault-horizon
intersection and isochore maps.
Location
The fault interpretation project is stored in the following location:
\\europe.shell.com\tcs\ams\ui.nam\data\petrel03\epe_land\groningen\nl_groningen\petrel_final\
2016_GFR_Thomas_Logeman_Structural_OverburdenFaultInterpretation_EP201703226971

Fault interpretation of the Groningen area supra-Zechstein Overburden
36
1211 References A. Sluijk, K. van Ojik, M. de Keijzer, J. Graaf, J. Steenbrink. (2011). The Groningen gas field: fifty years of
exploration and gas production from a Permian dryland reservoir. In Grotsch, The Permian
Rotliegend of the Netherlands. Assen: SEPM.
Coward, M. (1995). Salt influenced structures in the Mesozoic-Tertiary, Southern North Sea, Chapter 10.
In M. R. Jackson, Salt tectonics: a global perspective: AAPG Memoir 65 (pp. Chapter 10 229-250).
London, UK: AAPG.
de Jager, J. (2003). Inverted basins in the Netherlands, similarities and differences. In Netherlands Journal of
Geosciences / Geologie en Mijnbouw. (pp. 339-349).
de Keijzer, M. (2008). Structural Evolution of the Groningen West-Periphery. Assen: NAM report nr.
EP200801235837.
Dijksman, N. (2009). "Managing a Giant" 50 years of Groningen Gas. Society of Petroleum Engineers.
Geluk, M. (2000). Late Permian (Zechstein) carbonate facies maps, the Netherlands. Geologie en Mijnbouw /
Netherlands Journal of Geosciences 79, 17-27.
Grandstein, F. (2004). A geological time scale. Cambridge: Cambridge university press.
Mohr, M. (2005). Multiphase salt tectionic evolution in NW Germany: seismic interpretation and retro-
deformation. Int J Earth Sci (Geol Rundsch), 917-940.
ten Veen, J. (2012). Thin-and thick-skinned salt tectonics in the Netherlands; a quantitative approach.
Netherlands Journal of Geosciences - Geologie en Mijnbouw, 91-4.
van Adrichem Boogaert, H. (1983). The development of Zechstein in the Netherlands. In J. Kaasschieter,
Petroleum Geology of the Southeastern North Sea and the Adjacent Onshore Areas (pp. 83-92). The Hague:
Springer Netherlands.
van Adrichem Boogaert, H. (1993-1997). Stratigraphic nomenclature of the Netherlands, revision and update by
RGD and NOGEPA. Geological Survey of the Netherlands ISBN 9072869346.
van der Es, J.S. (1995). Timing and mode of halokinesis in the Southern Central Graben, Netherlands Offshore. Assen:
NAM report No 27905.
van Gent, H. W. (2010). Stress and strain from reflection seismic data. Aachen: Endogene Dynamik RWTH
Aachen University.
van Winden, M. (2015). Salt tectonics in the northern Dutch offshore. Utrecht: EBN, TNO Universiteit Utrecht.
Visser, C. (2012). Groningen Field Review 2012 - Static modeling and hydrocarbon volume determination. Assen:
NAM.
Wervelman, R. (2015). Groningen Pre-SDM -external report-. Assen: Shell UI-Europe Rep nr.
EP201602210428.

37