fatigue analyses · with an increased estimated relative risk of driver fatigue. the data reduction...
TRANSCRIPT

08-F-001
Fatigue AnalysesFrom 16 months of naturalistic commercial motor vehicle driving dataDouglas M. Wiegand • Richard J. Hanowski Rebecca Olson • Whitney Melvin
Submitted: May 31, 2008
3500 Transportation Research Plaza • Blacksburg, Virginia 24061Housed at the Virginia Tech Transportation Institute
Lighting TechnologyFatigue Aging
The National Surface Transportation SafetyCenter for Excellence

ACKNOWLEDGMENTS
The authors of this report would like to acknowledge the support of the stakeholders of the National Surface Transportation Safety Center for Excellence (NSTSCE): Tom Dingus from the Virginia Tech Transportation Institute, Richard Deering from General Motors Corporation, Carl Andersen from the Federal Highway Administration (FHWA), and Gary Allen from the Virginia Department of Transportation and the Virginia Transportation Research Council.
The NSTSCE stakeholders have jointly funded this research for the purpose of developing and disseminating advanced transportation safety techniques and innovations.

i
EXECUTIVE SUMMARY
Under the sponsorship of the National Surface Transportation Safety Center for Excellence, an existing naturalistic data set from the Drowsy Driver Warning System Field Operational Test (DDWS FOT) was expanded and analyzed to gain a greater understanding of the conditions which are associated with fatigue in commercial motor vehicle (CMV) driving. Specifically, this report describes safety-critical events and baseline epochs identified over a period of 16 months of data gathering. Further, two measures of driver fatigue were implemented and odds ratio calculations were performed to determine whether various driving conditions were associated with an increased estimated relative risk of driver fatigue.
The data reduction and analysis process employed a database of classification variables used to compare four basic types of driving events: crashes (including tire strikes as a separate subcategory), near-crashes, crash-relevant conflicts, and baseline (control) epochs. The frequencies of these events in the current data set were as follows:
• Crashes: 14 + 15 tire strikes = 29 total
• Near-crashes: 120
• Crash-relevant conflicts: 1,068
• Total safety-critical events (i.e., the sum of the above): 1,217
• Baseline epochs: 2,053
Many of the analyses for this report involve examining fatigue measures across all of the driving event categories listed above. Specifically, the fatigue ratings/scores were grouped by whether they were above or below fatigue thresholds when making comparisons of various driving conditions. Therefore, the focus of this report is not to describe the estimated relative risk of safety-critical event involvement, per se, but rather to focus on the estimated relative risk of whether experiencing fatigue is more likely given certain driving conditions.
Methods The data gathering from commercial trucks occurred in a naturalistic driving environment during normal operations. The participant sample included two different long-haul operation types (truckload and less-than-truckload) and was intended to be generally representative of the long-haul commercial vehicle driver population.
Forty-six truck tractors operated by three motor carriers were instrumented with data collection equipment. A Data Acquisition System (DAS) was installed in tractors to collect data continuously whenever the instrumented trucks were on and in motion. The DAS consisted of an encased unit housing a computer and external hard drive, dynamic sensors, interface with the existing vehicle network, an “incident box,” and video cameras. Figure 1 shows an example of the encased unit installed under the passenger seat.

ii
Figure 1. Photo. Encased computer and external hard drive installed under the passenger
seat.
Three types of data were collected continuously by the vehicle instrumentation: video, dynamic sensor, and audio. The four video cameras were oriented as follows: (i) forward road scene, (ii) backward from driver's face camera, (iii) rearward from the left side of the tractor, and (iv) rearward from the right side of the tractor. Figure 2 displays the camera views and approximate fields-of-view. Low-level infrared lighting (not visible to the driver) illuminated the vehicle cab so drivers’ faces and hands could be viewed via the camera during nighttime driving. No cameras or other sensors were mounted on trailers. Therefore, there was no recorded view directly behind the truck and trailer, although following vehicles could usually be partially seen in the rearward side view cameras. The limited number of cameras, all tractor-mounted, limited the analysis to primarily those events occurring in front and at the sides of the instrumented vehicle.
Figure 2. Diagram. Camera directions and approximate fields of view.
Behind Vehicle Front of Vehicle Camera 2
Camera 1 Camera 3
Camera 4

iii
As shown in figure 3, the four camera images were multiplexed into a single image. A time-stamp (.mpg frame number) was also included in the .mpg data file but was not displayed on the screen. The frame number was used to time-synchronize the video (in .mpg format) and the truck/performance data (in .dat format).
Figure 3. Photo. Split-screen presentation of the four camera views.
Recorded dynamic data included basic vehicle motion parameters, such as speed, longitudinal acceleration (e.g., indicative of braking levels), and lateral acceleration. Vehicles were also equipped with Global Positioning System (GPS) sensors, lane trackers, and forward-looking radar units. The audio data was from an “incident box” with a push button and microphone for drivers to make verbal comments about traffic incidents. This feature was rarely used by drivers.
There were three primary steps in detecting and classifying safety-critical events: (i) identifying potential events (mostly through the use of an event trigger program), (ii) checking the validity of these triggered events, and (iii) applying a data directory to verified conflict events. To identify events, a software program scanned the dynamic data set to identify notable actions, including hard braking, quick steering maneuvers, and short times-to-collision (close proximity with consideration of both range and range rate). Threshold values of these parameters (or “triggers”) were established to flag events for further review. Events could also be flagged by the driver via the incident button mentioned above. Finally, analysts reviewing the data could fortuitously identify safety-critical events not associated with the above triggers during their general review of the data, but this process was not comprehensive due to the huge size of the data set. Table 1 shows the seven triggers and their event signatures developed for this data.

iv
Table 1. Triggers and trigger values used to identify critical incidents.
Trigger Type Description
Longitudinal Acceleration
(1) Acceleration or deceleration greater than or equal to │0.35g│. Speed greater than or equal to 15 mi/h. (2) Acceleration or deceleration greater than or equal to │0.5g│. Speed less than or equal to 15 mi/h.
Time-to-Collision
(3) A forward time-to-collision value of less than or equal to 1.8 s, coupled with a range of less than or equal to 150 ft, a target speed of greater than or equal to 5 mi/h, a yaw rate of less than or equal to │4°/s│, and an azimuth of less than or equal to │0.8o│. (4) A forward time-to-collision value of less than or equal to 1.8 s, coupled with an acceleration or deceleration greater than or equal to │0.35g│, a forward range of less than or equal to 150 ft, a yaw rate of less than or equal to │4°/s│, and an azimuth of less than or equal to │0.8o│.
Swerve (5) Swerve value of greater than or equal to 3. Speed greater than or equal to 15 mi/h.
Critical Incident Button
(6) Activated by the driver upon pressing a button, located by the driver’s visor, when an incident occurred that he/she deemed critical.
Analyst Identified (7) Event that was identified by a data reductionist viewing video footage; no other trigger listed above identified the event (i.e., Longitudinal Acceleration, Time-to-Collision, etc.).
Events were then reviewed to ensure that they represented actual safety-significant scenarios. Many events meeting the minimum dynamic trigger criteria were not actual crash threat situations. These were termed “non-conflicts.” Those events judged to be true conflicts, and thus to have safety significance, were classified through the use of a detailed data directory. A detailed and comprehensive data directory of 54 variables and data elements was developed for analyzing events in this data set. This included classification variables relating to each overall event, to the instrumented vehicle or V1 (the truck) and driver, and (to a limited extent) the other involved vehicle/driver (V2) or non-motorist. Most of the variables in the data directory were the same as, or similar to, those used in major national crash databases such as the General Estimates System (GES), the Fatality Analysis Reporting System (FARS), and the Large Truck Crash Causation Study (LTCCS). In some cases, data element choices for some variables were revised to capitalize on the principal advantage of naturalistic driving (i.e., the fact the event could be directly observed as opposed to reconstructed after the fact). These coded data represent the principal content of this report.
By their nature, the configuration of the instrumentation and the event detection routines limited the number of other vehicle encroachments toward instrumented vehicles (i.e., V1) that could be captured. For example, a vehicle (V2) rapidly closing toward the rear of V1’s trailer could create a near-crash or other traffic conflict, but this dynamic event would not ordinarily be detected by the instrumented vehicle’s sensors or the subsequent data analysis. The study methodology (i.e., instrumentation suite and associated data analysis procedures) differentially detected

v
instrumented vehicle encroachments toward other vehicles as opposed to other vehicle encroachments toward instrumented vehicles. This differential detection meant that the apportionment of events in the current data set as truck driver-initiated (truck “at fault”) or other driver-initiated (truck “not at fault”) did not represent the universe of such events that occurred in actual driving. However, all events that were detected could be analyzed based on “instant replays” of video data and associated dynamic data recordings of the events. This analysis captured both the observable causal sequences leading to events as well as the conditions and correlates of event occurrence.
Two measures of driver fatigue were employed in this study. The first is a subjective rating whereby trained analysts observed driver faces and behaviors for a 60-second period leading up to each safety-critical event, and for 60 s in baseline epochs. Data analysts coded an Observer Rating of Drowsiness (ORD) on a 100-point scale for each driver using a previously validated methodology. ORD scores ≥ 40 were the criterion for identification of safety-critical events or baseline epochs involving driver drowsiness (Hanowski, Wierwille, Garness, & Dingus, 2000).(1)
The second fatigue measure employed was PERCLOS, which is a mathematically defined proportion of a time interval that the eyes are 80 percent to 100 percent closed (Wierwille, Ellsworth, Wreggit, Fairbanks, and Kirn, 1994)(2). It is a measure of slow eyelid closure not inclusive of eye blinks. PERCLOS is a valid indicator of fatigue which is significantly correlated with lane departures and lapses of attention, and is considered by some in the transportation safety field to be the “gold standard” of drowsiness measures (Knipling, 1998).(3)
This study utilized a manual coding scheme for calculating an estimate of PERCLOS, which is referred to in this report as estimated manual PERCLOS (EMP). Data analysts would locate an event trigger (or a set point of a baseline epoch), and would rewind the video data by 3 min10 s (1900 syncs; data is gathered at 10Hz, so each sync represents 1/10 of a second). Reductionists would then code EMP sync-by-sync. EMP scores ≥ 12 were the criterion for identification of safety-critical events or baseline epochs involving driver fatigue/drowsiness (Wierwille, Hanowski, Olson et al., 2003).(4)
Using the threshold values for the two fatigue measures, a series of odds ratio calculations were performed to compare the estimated relative risk of drivers experiencing fatigue/drowsiness under particular circumstances (e.g., undivided highways) to the estimated relative risk of the event under other circumstances (e.g., divided highways).
Results A total of 3,270 safety-critical events and baseline epochs were coded using a data directory (see appendix A) to describe the various driving parameters and were also scored using two measures of driver fatigue when possible. Below is a summary of the fatigue/drowsiness relevant results from this study.
• Observer Rating of Drowsiness (ORD) Summary: Drivers were above the ORD fatigue threshold (> 40) in 26.4 percent of all the safety-critical events identified in this research. Drivers were above the ORD fatigue threshold in 22.3 percent of the most severe of these safety-critical events (i.e., crashes/near-crashes; n = 112). Odds ratio calculations indicated that the estimated relative risk of being involved in a safety-critical

vi
event, when compared to baseline epochs, was 1.93 times greater (LCL = 1.63; UCL = 2.30) when the ORD rating was below the fatigue threshold (i.e., a rating of less than 40).
• Estimated Manual PERCLOS (EMP) Summary: Drivers were above the EMP fatigue
threshold (> 12 percent) in 9.9 percent of all the safety-critical events identified. Drivers were above the EMP fatigue threshold in 16.5 percent of the most severe of these safety-critical events (i.e., crashes/near-crashes; n = 97). Odds ratio calculations indicated that the estimated relative risk of being involved in a safety-critical event, when compared to baseline epochs, was 1.70 times greater (LCL = 1.30; UCL = 2.23) when the EMP rating was below the fatigue threshold (i.e., a score of less than 12 percent).
• DDWS FOT Condition: The data for this project were leveraged from an on-road evaluation of a DDWS. Drivers were assigned to the experimental group (which received audible warnings when the technology believed they were becoming drowsy) and the control group, (which received no such warning). Perhaps counterintuitively, the odds of a driver in the experimental condition being scored over the fatigue threshold were 1.45 times greater for ORD (LCL = 1.19; UCL = 1.78) and 1.62 times greater for EMP (LCL = 1.17; UCL = 2.25) when compared to control drivers.
• Day of Week: When dividing the week into early week (Monday-Wednesday) and late week (Thursday – Sunday), odds ratio calculations revealed no significant differences for having an ORD (OR= 1.13; LCL = 0.93; UCL = 1.36) or EMP (OR = 1.15; LCL = 0.86; UCL = 1.53) score above/below their respective fatigue thresholds when comparing these conditions.
• Time of Day: Odds ratio calculations revealed no significant differences for having an ORD score (OR = 1.01; LCL = 0.86; UCL = 1.18) or EMP score (OR = 1.0; LCL = 0.79; UCL = 1.27) above/below their respective fatigue thresholds when comparing a.m. versus p.m. driving. There were also no significant differences for drivers having an ORD (OR = 1.13; LCL = 0.92; UCL = 1.39) or EMP score (OR = 1.14; LCL = 0.83; UCL = 1.55) above/below their respective fatigue thresholds when comparing typical circadian rhythm timeframes with non-circadian rhythm timeframes.
• Number of Vehicles Involved: An odds ratio calculation revealed that the odds of a driver having an ORD score of 40 or higher were 1.79 times greater (LCL = 1.31, UCL = 2.44) when a single vehicle was involved. Similarly, the odds of a driver having an EMP score of 12 or higher were 2.43 times greater (LCL = 1.51, UCL = 3.90) when a single vehicle was involved.
• Vehicle 2 Position: There was some discrepancy between the fatigue measures when examining the position of V2 relative to V1 for multiple-vehicle events. An odds ratio calculation revealed that the odds of a driver having an ORD score of 40 or higher were 1.67 times greater (LCL = 1.15, UCL = 2.41) when the Vehicle Position was in front of V1. However, the odds of a driver having an EMP score of 12 or higher were 2.04 times greater (LCL = 1.25, UCL = 3.33) when the Vehicle Position was other than the front of V1.

vii
• Fault: An odds ratio calculation revealed that the odds of a driver having an ORD score of 40 or higher were 2.08 times greater (LCL = 1.39; UCL = 3.13) when Vehicle 1 was at fault. However, an odds ratio calculation showed no significant difference in the odds of a driver having an EMP score being above/below the fatigue threshold when comparing these conditions (OR = 0.63; LCL = 0.37; UCL = 1.06).
• Safety Belt Use: An odds ratio calculation revealed that the odds of a driver having an ORD score of 40 or higher were 1.69 times greater (LCL = 1.35, UCL = 2.11) when the driver was not wearing a safety belt. However, an odds ratio calculation showed no significant difference in the odds of a driver having an EMP score above/below the fatigue threshold when comparing safety belt use (OR = 1.08; LCL = 0.85; UCL = 1.37).
• Vision Obstructions: Comparisons were made between when data reductionists noted any obstruction to the driver’s vision (e.g., glare) and when no obstruction was noted. Odds ratio calculations revealed no significant difference in the odds of ORD scores (OR = 1.44; LCL = 0.89; UCL = 2.31) or EMP scores (OR = 1.33; LCL = 0.63; UCL = 2.78) being above/below their respective fatigue thresholds when comparing these conditions.
• Potential Distractions: Comparisons were made between when data reductionists noted any potential distractions to the driver (e.g., cell phone use) and when no such distractions were noted. Odds ratio calculations revealed no significant difference in the odds of ORD scores (OR = 1.10; LCL = 0.86; UCL = 1.40) or EMP scores (OR = 0.82; LCL = 0.56; UCL = 1.22) being above/below their respective fatigue thresholds when comparing these conditions.
• Light Condition: An odds ratio calculation revealed that the odds of a driver having an ORD score of 40 or higher were 3.89 times greater (LCL = 3.26; UCL = 4.65) when the light condition was dark, as opposed to daylight. Likewise, the odds of a driver having an EMP score of 12 or higher were 2.14 times greater (LCL = 1.67; UCL = 2.76) when the light condition was dark as opposed to daylight. However, when comparisons were made between dark versus dark but lighted conditions, no significant odds ratio differences were found for ORD scores (OR= 1.21; LCL = 0.87; UCL = 1.68) or EMP scores (OR = 1.18; LCL = 0.73; UCL = 1.89) being above/below their respective fatigue thresholds.
• Weather: Odds ratio comparisons revealed no significant differences in fatigue above/below threshold for ORD scores (OR = 1.00; LCL = 0.74; UCL = 1.37) or EMP scores (OR = 1.05; LCL = 0.66; UCL = 1.67) when comparing situations where no adverse weather conditions were present to situations where any adverse weather conditions were present.
• Roadway Surface Conditions: Odds ratio comparisons revealed no significant differences in fatigue above/below threshold for ORD scores (OR = 1.01; LCL = 0.63; UCL = 1.59) or EMP scores (OR = 1.14; LCL = 0.74; UCL = 1.77) when comparing situations where the road surface was dry to those when the surface was other than dry.

viii
• Relation to Junction: Calculations revealed that the odds of a driver having an ORD score of 40 or higher were 7.33 times greater (LCL = 5.66, UCL = 9.49) when the situation was not junction-related compared to intersection/intersection-related. The odds of a driver having an EMP score of 12 or higher were 1.95 times greater (LCL = 1.26; UCL = 3.02) when the situation was not junction-related compared to intersection/intersection-related. No significant differences were found in fatigue scores being above/below threshold for ORD scores (OR = 1.25; LCL = 0.82; UCL = 1.90) or EMP scores (OR = 1.03; LCL = 0.50; UCL = 2.12) when comparing intersection-related events to those occurring on an entrance/exit ramp.
• Trafficway Flow: The odds of a driver having an ORD score of 40 or higher were 1.28 times greater (LCL = 1.04., UCL = 1.58) when the Trafficway Flow was divided compared to undivided. However, an odds ratio calculation revealed no significant difference in the odds of EMP scores (OR = 1.23; LCL = 0.86; UCL = 1.77) being above/below the fatigue threshold when comparing these conditions.
• Number of Travel Lanes: Across all road types, the odds of a driver having an ORD score of 40 or higher were 1.78 times greater (LCL = 1.48, UCL = 2.12) when there were 1-2 lanes compared to 3 or more lanes. Similarly, the odds of a driver having an EMP score of 12 or higher were 1.78 times greater (LCL = 1.37, UCL = 2.33) when there were 1-2 lanes, as compared to 3 or more lanes. When looking at undivided highways only, the odds of a driver having an ORD score of 40 or higher were 1.58 times greater (LCL = 1.02, UCL = 2.45) when there were 1-2 lanes compared to 3 or more lanes. However, there was no significant difference in the odds of a driver having an EMP score above/below the fatigue threshold under these conditions (OR = 0.63; LCL = 0.24; UCL = 1.65). When looking at divided highways and one-way traffic, the odds of a driver having an ORD score of 40 or higher were 1.87 times greater (LCL = 1.54, UCL = 2.28) when there were 1-2 lanes compared to 3 or more lanes. However, the odds of a driver having an EMP score of 12 or higher were 1.83 times greater (LCL = 1.38, UCL = 2.43) when there were 3 or more lanes compared to 1-2 lanes.
• Roadway Alignment: Odds ratio calculations revealed no significant difference in the odds of ORD scores (OR = 1.10; LCL = 0.82; UCL = 1.49) or EMP scores (OR = 0.68; LCL = 0.46; UCL = 1.01) being above/below their respective fatigue thresholds when comparing straight roadway conditions to curved roadway conditions.
• Roadway Profile: The odds of a driver having an ORD score of 40 or higher were 2.66 times greater (LCL = 1.84, UCL = 3.84) when the roadway was level, as compared to graded roadways. However, an odds ratio calculation revealed no significant difference in the odds of EMP scores being above/below the fatigue threshold when comparing these conditions (OR = 0.64; LCL = 0.39; UCL = 1.04).
• Traffic Density: An odds ratio calculation revealed that the odds of a driver having an ORD score of 40 or higher were 2.44 times greater (LCL = 1.73, UCL = 3.43) when the traffic density was in the lower condition (LOS A or B). However, an odds ratio calculation revealed no significant difference in the odds of EMP scores being

ix
above/below the fatigue threshold when comparing these conditions (OR = 1.66; LCL = 0.99; UCL = 2.77).
• Construction Zones: Odds ratio calculations revealed no significant difference in the odds of ORD scores (OR = 1.16; LCL = 0.71; UCL = 1.90) or EMP scores (OR = 2.50; LCL = 0.90; UCL = 6.92) being above their respective fatigue thresholds when comparing construction zone-related driving to non-construction zone-related driving.
• Vehicle Pre-Event Speed: When examining all events and baselines, the odds of a driver having an ORD score of 40 or higher were 1.73 times greater (LCL = 1.47, UCL = 2.05) when the Vehicle Pre-Event Speed was > 55 mi/h when compared to 54 mi/h or less. Similarly, the odds of a driver having an EMP score of 12 or higher were 1.56 times greater (LCL = 1.21, UCL = 2.01) when the Vehicle Pre-Event Speed was > 55 mi/h as compared to 54 mi/h or less. When examining single-vehicle events only, the odds of a driver having an ORD score of 40 or higher were 1.38 times greater (LCL = 1.13, UCL = 1.69), and the odds of having an EMP score of 12 or higher were 1.58 times greater (LCL = 1.19, UCL = 2.08) when the Vehicle Pre-Event Speed was > 55 mi/h. When examining multiple-vehicle events only, the odds of a driver having an ORD score of 40 or higher were 1.43 times greater (LCL = 1.04, UCL = 1.97) when the Vehicle Pre-Event Speed was > 55 mi/h as compared to 54 mi/h or less. However, an odds ratio calculation revealed no significant difference in the odds of EMP scores being above/below the fatigue threshold when comparing these conditions (OR = 1.34; LCL = 0.73; UCL = 2.46).
Discussion The DDWS FOT is the largest CMV naturalistic driving study ever conducted by the United States Department of Transportation. Forty-six trucks were instrumented and 103 CMV drivers participated in this study, resulting in almost 46,000 driving-data hours covering 2.3 million miles traveled. More than one-quarter million data, video, and ASCII text files were gathered (279,600 files total), which represent approximately 12 TB of data from video and dynamic sensor files. Using in-house computer software, VTTI researchers scanned the data to identify and validate triggers indicative of safety-critical events. A total of 1,217 valid safety-critical events were identified (14 crashes, 15 crash: tire-strikes, 120 near-crashes, and 1,068 crash-relevant conflicts). In addition, 2,053 baseline driving epochs were selected and validated for comparison purposes.
The objective of the present study was to utilize this large data set to explore driving conditions associated with driver fatigue. Two independent measures of fatigue were implemented using video data. The ORD measure is a subjective procedure by which data analysts observed drivers’ facial features and behavior for one minute prior to an event trigger (or randomly selected baseline epoch) to rate drowsiness on a scale from 0-100 (with 100 representing “extremely drowsy”). Ratings greater than or equal to 40 were considered indicative of fatigue. EMP is a somewhat more objective measure whereby data analysts manually coded whether the drivers’ eyes were open or 80-100 percent closed (non-inclusive of rapid eye blinks) at 1/10 of a second for three minutes prior to an event trigger (or randomly selected baseline epoch). This manual coding would then be used to produce a percentage of time the eyes were 80-100 percent

x
closed for that time interval. EMP scores of greater than or equal to 12 percent were considered indicative of fatigue.
When examining all of the safety-critical events identified in this study for which ORD could be completed, 26.4 percent of them included an ORD score above the fatigue threshold. Examining the most severe of these safety-critical events (i.e., crashes/near-crashes), 22.3 percent were above the fatigue threshold. These results are comparable to those found in previous naturalistic studies. For example, Dingus et al. (2006) (5) found that fatigue was a contributing factor in 20 percent of 82 crashes and 16 percent of 761 near-crashes captured in the naturalistic “100-Car” study. Also, Hanowski et al. (2000) (1) identified fatigue as a contributing factor in 21 percent of 249 safety-critical incidents identified in a naturalistic study with local/short-haul truck drivers.
When examining all of the safety-critical events identified in this study for which EMP could be completed, 9.9 percent of them included an EMP score above the fatigue threshold. Examining the most severe of these safety-critical events (i.e., crashes/near-crashes), 16.5 percent were above the fatigue threshold. While an EMP value of 12 percent or more was used in the current study as the fatigue threshold based on the findings and recommendations of Wierwille, Hanowski, Olson, et al. (2003) (4), other research involving the evaluation of DDWS technology has used the PERCLOS value of 8 percent to give drivers an initial advisory tone alert warning them they are approaching a full warning at the PERCLOS fatigue threshold of 12 percent (Wierwille, Hanowski, Olson, et al, 2003 (4); Hanowski, Blanco, Nakata, et al., in press(6)). It is interesting that when looking at total safety-critical events in the current study, those with an EMP score of 8 percent or more represented 20.9 percent of these cases. When examining crashes/near-crashes, those with an EMP score of 8 percent or more represented 23.7 percent of these cases. When using this more liberal EMP fatigue threshold of 8 percent or more, the percentage of those above threshold are again comparable to previous research whereby fatigue is identified as a contributing factor in approximately 20 percent of safety-critical events.
Furthermore, when data reductionists gave their impression of contributing factors to safety-critical incidents in this study, 21.4 percent of crashes and 15.8 percent of near-crashes had fatigue/drowsiness listed as a possible contributing factor. These assessments were made independently of the ORD and EMP scores.
The results of the ORD, EMP, and possible contributing factors measures in this study provide further support for the findings that fatigue/drowsiness is associated with a significant proportion of safety-critical events.
The odds of experiencing a safety-critical event, when compared to baseline epochs, were greater when the ORD and EMP scores were below their respective thresholds. This is expected since a majority of the safety-critical incidents occurred while the driver was alert. One possible explanation for this is that drivers were more likely to be involved in a safety-critical event, when compared to baseline, given higher traffic density. An odds ratio calculation revealed that the odds of a driver experiencing a safety-critical event, when compared to baseline epochs, were 7.16 times greater when the traffic density variable was coded between LOS C-F, as opposed to the lower traffic density of LOS A-B. This makes sense since one would assume a greater safety risk when there are more vehicles on the road. In terms of fatigue, it may be the case that as drivers are in conditions where more traffic is present, their level of alertness is higher given the

xi
greater amounts of stimuli. This is supported by the finding that drivers were 2.44 times more likely to have an ORD score above threshold when the traffic density was low (LOS A-B) as opposed to high (LOS C-F). Also, drivers were at greater relative risk for experiencing fatigue when on 1-2 lane roads as opposed to larger roads, which can accommodate more traffic. Finally, when considering safety-critical events, the finding that one has greater odds of having a fatigue score over threshold when only a single vehicle was involved supports this line of reasoning.
Some of the other results of this study indicate that lower levels of stimuli in the driving environment may be associated with greater fatigue. For example, the estimated relative risk of fatigue was greater on level roads, non-junction-related road segments, and roads where a driver could travel at greater speeds. CMV drivers often drive long hours on interstates and highways that provide little or no scenery or other stimuli to help keep the driver alert.
The data for this project were leveraged from an on-road evaluation of a DDWS. Drivers were assigned to the experimental group, which received audible warnings when the technology believed they were becoming drowsy, and the control group, which received no such warning. Perhaps counter-intuitively, the odds of a driver in the experimental condition being scored as over the fatigue threshold were 1.45 times greater for ORD and 1.62 times greater for EMP when compared to control drivers. One possible explanation for this finding involves the concept of risk compensation (Peltzman, 1975).(7) Risk compensation is based on the notion that people are presumed to regulate their behavior to compensate for changes in perceived risk. In other words, since the drivers in the experimental condition knew their level of fatigue was being monitored by a machine that would alert them if they were becoming drowsy, they may have felt more comfortable driving while fatigued given this “safety net”.
Another interesting finding was that odds ratio calculations showed no significant differences for having an ORD or EMP score above the fatigue threshold when comparing a.m. versus p.m. driving. There were also no significant differences for having an ORD or EMP score above the fatigue threshold when comparing typical circadian rhythm timeframes with non-circadian rhythm timeframes. A possible explanation for this finding is that the study sample consisted of professional drivers who condition themselves and prepare to be awake and alert while holding somewhat unusual work schedules (e.g., early morning/late evening driving). So, it is possible that the drivers’ rest and sleep schedules differed so much that any differences in fatigue scores for a.m. versus p.m. or circadian rhythm versus non-circadian rhythm time frames were washed out. However, when considering light conditions, drivers had a greater estimated relative risk of being over the fatigue thresholds for ORD and EMP during dark conditions when compared to daylight conditions.
Future directions for NSTSCE fatigue research are described at the end of this report.


xiii
TABLE OF CONTENTS
LIST OF FIGURES ...................................................................................................................... xv LIST OF TABLES ...................................................................................................................... xvii LIST OF ABBREVIATIONS AND SYMBOLS ...................................................................... xxiii CHAPTER 1. INTRODUCTION ................................................................................................... 1 CHAPTER 2. THE DROWSY DRIVER WARNING SYSTEM FIELD OPERATIONAL TEST
(DDWS FOT)...................................................................................................................... 5 CHAPTER 3. NATIONAL SURFACE TRANSPORTATION SAFETY CENTER FOR
EXCELLENCE ................................................................................................................... 7 Overview of CMV Driver Fatigue Analysis ............................................................................... 7 Summary ..................................................................................................................................... 7
CHAPTER 4. METHODOLOGY .................................................................................................. 9 Participants and Setting .............................................................................................................. 9 Procedures ................................................................................................................................... 9 Data Collection Process ............................................................................................................ 10 Vehicle Network ....................................................................................................................... 14
CHAPTER 5. DATA ANALYSIS AND REDUCTION TOOL SOFTWARE ........................... 17 Data Directory ........................................................................................................................... 17 Running The Event Trigger Program ....................................................................................... 17 Checking The Validity Of The Triggered Events ..................................................................... 18 Applying The Data Directory To The Validated Events .......................................................... 21 Observer Rating Of Drowsiness (ORD) ................................................................................... 22 Ensuring Data Coding Accuracy And High Inter-Rater Reliability ......................................... 24 Summary ................................................................................................................................... 25
CHAPTER 6. RESULTS .............................................................................................................. 27 CHAPTER 7. DISCUSSION ........................................................................................................ 79
Future Directions For NSTSCE Fatigue Research ................................................................... 82 APPENDIX A: DATA CODING DIRECTORY ........................................................................ 83 APPENDIX B: ORD AND EMP DESCRIPTIVE STATISTICS BY INDIVIDUAL DRIVER125 REFERENCES ........................................................................................................................... 131


xv
LIST OF FIGURES
Figure 1. Photo. Encased computer and external hard drive installed under the passenger seat. ... ii Figure 2. Diagram. Camera directions and approximate fields of view. ........................................ ii Figure 3. Photo. Split-screen presentation of the four camera views. ........................................... iii Figure 4. Photo. Encased computer and external hard drive installed under the passenger seat. . 11 Figure 5. Photo. Encased computer and external hard drive installed in the truck's rear storage
compartment. .................................................................................................................... 11 Figure 6. Illustration. Arrangement of the data collection and storage components. ................... 12 Figure 7. Photo. VORAD unit on the front of the truck. .............................................................. 14 Figure 8. Photo. Incident box used in the DDWS FOT. ............................................................... 15 Figure 9. Illustration. Camera directions and approximate fields of view. ................................... 15 Figure 10. Photo. Split-screen presentation of the four camera views. ........................................ 16 Figure 11. Screen shot. Screen shot of a pull-down menu showing the plots that can be viewed
by the analyst to aid in determining the validity of triggered events. ............................... 19 Figure 12. Screen shot. Example of a validated trigger where the LA was of greater magnitude
than the pre-set value of -0.35g......................................................................................... 20 Figure 13. Screen shot. Example of a non-conflict event (with a valid trigger) where the driver’s
swerve (quick steering) was at 3.68 (trigger set to ≥ 3.0). ................................................ 21 Figure 14. Screen shot. ORD rating scale used by data analysts (adapted from Wierwille &
Ellsworth, 1994).(27) .......................................................................................................... 23 Figure 15. Diagram. Diagram of V1 used to indicate the relative position of V2 (percentages
refer to total safety-critical events). .................................................................................. 48 Figure 16. Illustration. Observer Rating of Drowsiness scale. ................................................... 108 Figure 17. Illustration. Relative position of Vehicle 2 to Vehicle 1. .......................................... 116


xvii
LIST OF TABLES
Table 1. Triggers and trigger values used to identify critical incidents. ........................................ iv Table 2. Triggers and trigger values used to identify critical incidents. ....................................... 18 Table 3. Distribution of trigger types. ........................................................................................... 27 Table 4. Safety-critical events where the reductionist chose fatigue/drowsiness as a potential
contributing factor. ............................................................................................................ 29 Table 5. Frequency and percentage of ORD scores. .................................................................... 30 Table 6. ORD scores above and below fatigue threshold for total safety-critical events and
baselines. ........................................................................................................................... 30 Table 7. ORD scores above and below fatigue threshold for crash/near-crash events and
baselines. ........................................................................................................................... 30 Table 8. Frequency and percentage of EMP scores. ..................................................................... 31 Table 9. EMP scores above and below fatigue threshold for total safety-critical events and
baselines. ........................................................................................................................... 31 Table 10. EMP scores above and below fatigue threshold for crash/near-crash events and
baselines. ........................................................................................................................... 32 Table 11. Frequency and percentage of ORD scores above/below fatigue threshold (all events).
........................................................................................................................................... 32 Table 12. Frequency and percentage of EMP scores above/below fatigue threshold (all events).32 Table 13. Frequency and percentage of ORD scores above/below fatigue threshold for single-
vehicle events. ................................................................................................................... 33 Table 14. Frequency and percentage of EMP scores above/below fatigue threshold for single-
vehicle events. ................................................................................................................... 33 Table 15. Frequency and percentage of ORD scores above/below fatigue threshold for multiple-
vehicle events. ................................................................................................................... 34 Table 16. Frequency and percentage of EMP scores above/below fatigue threshold for multiple-
vehicle events. ................................................................................................................... 34 Table 17. Frequency and percentage of ORD scores above and below threshold (DDWS FOT
Control versus Experimental). .......................................................................................... 34 Table 18. Frequency and percentage of EMP scores above and below threshold (DDWS FOT
Control versus Experimental). .......................................................................................... 35 Table 19. Frequency and percentage of Day of Week (all events). .............................................. 35 Table 20. Frequency and percentage of ORD scores above and below threshold (Monday-
Wednesday versus Thursday - Sunday; all events & baselines) ....................................... 36 Table 21. Frequency and percentage of EMP scores above and below threshold (Monday-
Wednesday versus Thursday - Sunday; all events and baselines). ................................... 36 Table 22. Frequency and percentage of Day of Week (single-vehicle events). ........................... 36 Table 23. Frequency and percentage of ORD scores above and below threshold (Monday-
Wednesday versus Thursday - Sunday; single-vehicle events). ....................................... 37 Table 24. Frequency and percentage of EMP scores above and below threshold (Monday-
Wednesday versus Thursday - Sunday; single-vehicle events). ....................................... 37 Table 25. Frequency and percentage of Day of Week (multiple-vehicle events). ........................ 37 Table 26. Frequency and percentage of ORD scores above and below threshold (Monday -
Wednesday versus Thursday - Sunday; multiple-vehicle events). ................................... 38 Table 27. Frequency and percentage of EMP scores above and below threshold (Monday-
Wednesday versus Thursday - Sunday; multiple-vehicle events). ................................... 38

xviii
Table 28. Frequency and percentage of Time of Day (all events and baselines). ........................ 39 Table 29. Frequency and percentage of ORD scores above and below threshold (a.m. versus
p.m.; all events and baselines). ......................................................................................... 40 Table 30. Frequency and percentage of EMP scores above and below threshold (a.m. versus
p.m.; all events and baselines). ......................................................................................... 40 Table 31. Frequency and percentage of ORD scores above and below threshold (Circadian
Rhythm versus Non-Circadian Rhythm; all events and baselines). .................................. 40 Table 32. Frequency and percentage of EMP scores above and below threshold (Circadian
Rhythm versus Non-Circadian rhythm; all events and baselines). ................................... 41 Table 33. Frequency and percentage of Time of Day (single-vehicle events). ............................ 42 Table 34. Frequency and percentage of ORD scores above and below threshold (a.m. versus
p.m.; single-vehicle events). ............................................................................................. 43 Table 35. Frequency and percentage of EMP scores above and below threshold (a.m. versus
p.m.; single-vehicle events). ............................................................................................. 43 Table 36. Frequency and percentage of ORD scores above and below threshold (Circadian
Rhythm versus Non-Circadian Rhythm; single-vehicle events and baselines). ............... 43 Table 37. Frequency and percentage of EMP scores above and below threshold (Circadian
Rhythm versus Non-Circadian Rhythm; single-vehicle events and baselines). ............... 43 Table 38. Frequency and percentage of Time of Day (multiple-vehicle events). ......................... 44 Table 39. Frequency and percentage of ORD scores above and below threshold (a.m. versus
p.m.; multiple-vehicle events and baselines). ................................................................... 45 Table 40. Frequency and percentage of EMP scores above and below threshold (a.m. versus
p.m.; multiple-vehicle events and baselines). ................................................................... 45 Table 41. Frequency and percentage of ORD scores above and below threshold (Circadian
Rhythm versus Non-Circadian Rhythm; multiple-vehicle events and baselines). ........... 45 Table 42. Frequency and percentage of EMP scores above and below threshold (Circadian
Rhythm versus Non-Circadian Rhythm; multiple-vehicle events and baselines). ........... 45 Table 43. Frequency and percentage of the number of vehicles involved. ................................... 46 Table 44. Frequency and percentage of ORD scores above and below threshold (single versus
multiple vehicles involved). .............................................................................................. 46 Table 45. Frequency and percentage of EMP scores above and below threshold (single versus
multiple vehicles involved). .............................................................................................. 47 Table 46. Frequency and percentage of vehicle position. ............................................................. 47 Table 47. Frequency and percentage of ORD scores above and below threshold (front of vehicle
versus all other vehicle positions). .................................................................................... 48 Table 48. Frequency and percentage of EMP scores above and below threshold (front of vehicle
versus all other vehicle positions). .................................................................................... 48 Table 49. Frequency and percentage of Driver-At-Fault designations (all events). ..................... 49 Table 50. Frequency and percentage of ORD scores above and below threshold (V1 versus V2
Fault; all events). ............................................................................................................... 49 Table 51. Frequency and percentage of EMP scores above and below threshold (V1 versus V2
Fault; all events). ............................................................................................................... 49 Table 52. Distribution of Driver-At-Fault designations for two or more vehicle events. ............ 50 Table 53. Frequency and percentage of ORD scores above and below threshold (V1 versus V2
Fault; 2+ vehicle events). .................................................................................................. 50

xix
Table 54. Frequency and percentage of EMP scores above and below threshold (V1 versus V2 Fault; 2+ Vehicle events). ................................................................................................. 50
Table 55. Frequency and percentage of safety belt use. ............................................................... 51 Table 56. Frequency and percentage of ORD scores above and below threshold by safety belt
use. .................................................................................................................................... 51 Table 57. Frequency and percentage of EMP scores above and below threshold by safety belt
use. .................................................................................................................................... 51 Table 58. Frequency and percentage of Vision Obscured. ........................................................... 52 Table 59. Frequency and percentage of ORD scores above and below threshold (No Obstruction
versus Any Obstruction to driver’s vision). ...................................................................... 53 Table 60. Frequency and percentage of EMP scores above and below threshold (No Obstruction
versus Any Obstruction to driver’s vision). ...................................................................... 53 Table 61. Frequency and percentage of potential distractions. ..................................................... 54 Table 62. Frequency and percentage of ORD scores above and below threshold (No Distraction
Observed versus Any Distraction). ................................................................................... 56 Table 63. Frequency and percentage of EMP scores above and below threshold (No Distraction
Observed versus Any Distraction). ................................................................................... 56 Table 64. Frequency and percentage of Light Conditions. ........................................................... 57 Table 65. Frequency and percentage of ORD scores above and below threshold (Daylight versus
Dark). ................................................................................................................................ 57 Table 66. Frequency and percentage of EMP scores above and below threshold (Daylight versus
Dark). ................................................................................................................................ 57 Table 67. Frequency and percentage of ORD scores above and below threshold (Dark versus
Dark but Lighted). ............................................................................................................. 58 Table 68. Frequency and percentage of EMP scores above and below threshold (Dark versus
Dark but Lighted). ............................................................................................................. 58 Table 69. Frequency and percentage of weather conditions. ........................................................ 58 Table 70. Frequency and percentage of ORD scores above and below threshold (No Adverse
Weather versus Any Adverse Weather). ........................................................................... 59 Table 71. Frequency and percentage of EMP scores above and below threshold (No Adverse
Weather versus Any Adverse Weather). ........................................................................... 59 Table 72. Frequency and percentage of Roadway Surface conditions. ........................................ 59 Table 73. Frequency and percentage of ORD scores above and below threshold (Dry versus Not
Dry Roadway Surface). ..................................................................................................... 60 Table 74. Frequency and percentage of EMP scores above and below threshold (Dry versus Not
Dry Roadway Surface). ..................................................................................................... 60 Table 75. Frequency and percentage of Relation to Junction. ...................................................... 61 Table 76. Frequency and percentage of ORD scores above and below threshold (Non-Junction
versus Intersection/Intersection-Related). ......................................................................... 61 Table 77. Frequency and percentage of EMP scores above and below threshold (Non-Junction
versus Intersection/Intersection-Related). ......................................................................... 61 Table 78. Frequency and percentage of ORD scores above and below threshold
(Intersection/Intersection-Related versus Entrance/Exit Ramp). ...................................... 62 Table 79. Frequency and percentage of EMP scores above and below threshold
(Intersection/Intersection-Related versus Entrance/Exit Ramp) ....................................... 62 Table 80. Frequency and percentage of Trafficway Flow. ........................................................... 63

xx
Table 81. Frequency and percentage of ORD scores above and below threshold (Not Divided versus Divided Trafficway Flow). .................................................................................... 63
Table 82. Frequency and percentage of EMP scores above and below threshold (Not Divided versus Divided Trafficway Flow). .................................................................................... 63
Table 83. Frequency and percentage of safety-critical events and baselines by Number of Travel Lanes (All Roads). ............................................................................................................ 64
Table 84. Frequency and percentage of ORD scores above and below threshold (1-2 Lanes versus 3 or More Lanes; All Road Types). ....................................................................... 64
Table 85. Frequency and percentage of EMP scores above and below threshold (1-2 Lanes versus 3 or More Lanes; All Road Types). ....................................................................... 64
Table 86. Frequency and percentage of Number of Travel Lanes (undivided highways). ........... 65 Table 87. Frequency and percentage of ORD scores above and below threshold (1-2 Lanes
versus 3 or More Lanes; undivided highways). ................................................................ 65 Table 88. Frequency and percentage of EMP scores above and below threshold (1-2 Lanes
versus 3 or More Lanes; undivided highways). ................................................................ 66 Table 89. Frequency and percentage of Number of Travel Lanes (divided highway and one-way
traffic). .............................................................................................................................. 66 Table 90. Frequency and percentage of ORD scores above and below threshold (1-2 Lanes
versus 3 or More Lanes; divided highway and one-way traffic). ..................................... 67 Table 91. Frequency and percentage of EMP scores above and below threshold (1-2 Lanes
versus 3 or More Lanes; divided highway and one-way traffic). ..................................... 67 Table 92. Frequency and percentage of Roadway Alignment. ..................................................... 67 Table 93. Frequency and percentage of ORD scores above and below threshold (Straight versus
Curved Roadway Alignment). .......................................................................................... 68 Table 94. Frequency and percentage of EMP scores above and below threshold (Straight versus
Curved Roadway Alignment). .......................................................................................... 68 Table 95. Frequency and percentage of Roadway Profiles. .......................................................... 68 Table 96. Frequency and percentage of ORD scores above and below threshold (Level versus
Graded Roadway Profile). ................................................................................................ 69 Table 97. Frequency and percentage of EMP scores above and below threshold (Level versus
Graded Roadway Profile). ................................................................................................ 69 Table 98. Frequency and percentage of Traffic Density. .............................................................. 69 Table 99. Frequency and percentage of ORD scores above and below threshold (LOS A or B
versus LOS C-F Traffic Density). ..................................................................................... 70 Table 100. Frequency and percentage of EMP scores above and below threshold (LOS A or B
versus LOS C-F Traffic Density). ..................................................................................... 70 Table 101. Frequency and percentage of Construction-Zone-Related events. ............................. 70 Table 102. Frequency and percentage of ORD scores above and below threshold (Not
Construction Zone versus Construction Zone-Related). ................................................... 71 Table 103. Frequency and percentage of EMP scores above and below threshold (Not
Construction Zone versus Construction Zone-Related). ................................................... 71 Table 104. Frequency and percentage of Pre-Event Speed (all events). ...................................... 72 Table 105. Frequency and percentage of ORD scores above and below threshold (Below and
Above 55 mi/h; all events & baselines). ........................................................................... 72 Table 106. Frequency and percentage of EMP scores above and below threshold (Below and
Above 55 mi/h; All Events & Baselines). ......................................................................... 72
xxi
Table 107. Frequency and percentage of Pre-Event Speed (single-vehicle events & baselines). 73 Table 108. Frequency and percentage of ORD scores above and below threshold (below and
above 55 mi/h; single-vehicle events & baselines). .......................................................... 73 Table 109. Frequency and percentage of EMP scores above and below threshold (below and
above 55 mi/h; single-vehicle events & baselines). .......................................................... 73 Table 110. Frequency and percentage of Pre-Event Speed (multiple-vehicle events & baselines).
........................................................................................................................................... 74 Table 111. Frequency and percentage of ORD scores above and below threshold (below and
above 55 mi/h; multiple-vehicle events & baselines). ...................................................... 74 Table 112. Frequency and percentage of EMP scores above and below threshold (below and
above 55 mi/h; multiple-vehicle events & baselines). ...................................................... 74 Table 113. Coded pre-crash and causation variables. .................................................................. 90 Table 114. Description of the accident types (Thieriez, Radja, & Toth, 2002).() ........................ 92 Table 115. Description of the incident types. ............................................................................... 94 Table 116. Functional countermeasures and coding rules. ......................................................... 112 Table 117. ORD descriptive statistics by individual driver. ....................................................... 125 Table 118. EMP descriptive statistics by individual driver. ....................................................... 127


xxiii
LIST OF ABBREVIATIONS AND SYMBOLS
CDLIS Commercial Driver’s License Information System
CMV Commercial Motor Vehicle
DART Data Analysis and Reduction Tool
DAS Data Acquisition System
DDWS FOT Drowsy Driver Warning System Field Operational Test
DFM Driver Fatigue Monitor
DOT U.S. Department of Transportation
EMP Estimated Manual PERCLOS
FARS Fatality Analysis Reporting System
FMCSA Federal Motor Carrier Safety Administration
GES General Estimates System
GPS Global Positioning System
HV Heavy Vehicle
LA Longitudinal Acceleration
LCL Lower Confidence Level
LOS Level of Service
LTCCS Large Truck Crash Causation Study
LV Light Vehicle
MCMIS Motor Carrier Management Information System
NHTSA National Highway Traffic Safety Administration
NSTSCE National Surface Transportation Safety Center for Excellence
ORD Observer Rating of Drowsiness
PAR Police Accident Report
PERCLOS A mathematically defined proportion of a time interval that the eyes are 80 percent to 100 percent closed
TTC Time-to-collision
UCL Upper Confidence Level
VTTI Virginia Tech Transportation Institute

xxiv

1
CHAPTER 1. INTRODUCTION
Crashes involving large trucks constitute a significant risk to the driving public as well as a significant occupational risk to truck drivers. According to the National Highway Traffic Safety Administration’s Traffic Safety Facts report (NHTSA, 2007) (8), 385,000 large trucks (weighing over 10,000 lb each) were involved in vehicle crashes in the United States during 2006. Fatalities occurred in 4,732 of these large truck crashes, taking the lives of 4,995 individuals. In addition, a total of 106,000 non-fatal injuries were reported. While there are myriad contributing factors to crashes, research indicates driver fatigue is an important area of focus.
It is important to note that the terms fatigue and drowsiness are often used interchangeably in the literature. However, a distinction between the terms is made at times, and this distinction is evident by comparing the definitions below.
Fatigue is defined as “a state of reduced physical or mental alertness which impairs performance” (Williamson et al., 1996, p. 709).(9) Another definition provided by Dinges (1995; p. 42)(10) is “a neurobiological process directly related to the circadian pacemaker in the brain and to the biological sleep need of the individual”. Dinges further states that fatigue is something all humans experience, noting that it cannot be prevented by any “known characteristics of personality, intelligence, education, training, skill, compensation, motivation, physical size, strength, attractiveness, or professionalism” (1995; p. 42). (10)
Drowsiness is defined as the “inclination to sleep” (Stutts, Wilkins, & Vaughn, 1999)(11) and is also commonly referred to as “sleepiness”. As noted above, fatigue is a reduced state of mental or physical alertness that impairs performance. Fatigue can occur without actually being drowsy; therefore, fatigue and drowsiness are not exactly synonymous. Where fatigue is the result of physical or mental exertion, drowsiness may result from boredom, lack of sleep, hunger, or other factors.
While the authors of this report understand the distinction between the two terms, in this report, “fatigue” and “drowsiness” will be used interchangeably as is often done in the transportation safety literature. However, the meaning of these terms for the purposes of this report is more concurrent with the formal definition of “drowsiness” (i.e., “sleepiness”).
Fatigue is a major area of concern in ground transportation safety. It is a condition which crosses all driving domains (i.e., heavy and light vehicles; commercial and private use), affects all drivers at some point, and is a contributing factor in a significant number of crashes. For example, the National Sleep Foundation’s (2005)(12) “Omnibus Sleep in America Poll” found that 60 percent of those interviewed (N = 1,455) reported driving while drowsy in the past year, while 37 percent admitted to falling asleep at the wheel in the past year. Other studies, both in the U.S. and abroad, have found similar results (Maycock, 1997; McCartt, Ribner, Pack, & Hammer, 1996; Sagberg, 1998).(13,14,15)
Researchers at the Virginia Tech Transportation Institute (VTTI) conducted the “100-Car Study” which recorded naturalistic data on 100 vehicles (241 primary and secondary drivers) over a period of 13 months, covering approximately 2 million vehicle miles of driving behavior (Dingus

2
et al., 2006).(5) Analyses indicated fatigue was a contributing factor in 20 percent of 82 crashes and 16 percent of 761 near-crashes.
While fatigue is prominent for all types of vehicle operators, the nature of commercial motor vehicle (CMV) operations puts these professional drivers at increased risk. CMV operators may drive up to 11 hours continuously before taking a break, often drive at night, and sometimes have irregular and unpredictable work schedules. Much of their mileage is compiled during long trips on Interstate and other divided highways. Because of their greater mileage exposure and other factors, CMV drivers’ risk of being involved in a fatigue-related crash is far greater than that of non-commercial drivers. For example, in a study of 593 randomly selected long-distance truck drivers, 47.1 percent reported having fallen asleep at the wheel of their truck, while 25.4 percent admitted falling asleep at the wheel in the past year (McCartt, Rohrbaugh, Hammer, & Fuller, 2000).(16)
In an investigation of 182 fatal-to-the-driver CMV crashes over a one-year period, researchers at the Transportation Safety Board (1990)(17) determined the most frequently cited probable cause was fatigue (57 crashes or 31 percent). In a naturalistic study of local/short-haul truck drivers, Hanowski et al. (2000)(1) identified fatigue as a contributing factor in 21 percent of 249 critical incidents. These findings suggest driver fatigue is an important area to continue studying, especially among CMV operators.
Understanding the nature of fatigue-related critical safety events requires a systematic approach to evaluate the entire driving situation, including driver characteristics (e.g., age), environmental parameters (e.g., road type, time of day, presence of other vehicles and other drivers’ behavior), vehicle factors (e.g., vibrations); and organizational policies and practices (e.g., hours-of-service regulations). Unfortunately, most fatigue-related studies have investigated the situation post-hoc, or after the fact, which relies heavily on assumptions and (perhaps faulty) memory. Additionally, many past studies investigating the role of fatigue in crashes are limited in the number and type of variables available for analysis (e.g., no objective measures of speed, steering wheel movement, and driver behavior before the crash). A solution to this problem is to conduct naturalistic studies in which objective data on the driver, vehicle, and driving environment are recorded in real time during regular operations.
By conducting naturalistic studies, researchers can view and code critical safety events, including observable aspects of driver errors and other behaviors which lead to the events. This includes unsafe pre-event behaviors such as speeding or tailgating, as well as specific driver errors resulting in incidents.
VTTI specializes in using technology to conduct naturalistic driving studies. Technicians at VTTI equip vehicles with video cameras and other instrumentation to continuously record various performance data, driver behavior, and the driving environment. By obtaining these data, researchers can view crashes and near-crashes and associated variables/behaviors as they occur in real time, thus eliminating the need to rely on the memory of the driver or other assumptions.
This report describes the analysis of 16 months of CMV naturalistic driving data. Specifically, a total of 1,217 safety-critical incidents and 2,053 baseline epochs were identified and coded in

3
terms of the driving parameters (e.g., time of day, road type, assignment of fault, etc.) and the driver’s level of fatigue was measured/rated based on two fatigue scoring methods. This report provides descriptive statistics of each safety-critical event, and the fatigue measurements were used to determine the odds of experiencing fatigue in various conditions. The next two sections of this report describe the database utilized for these analyses, as well as the impetus for the current study.


5
CHAPTER 2. THE DROWSY DRIVER WARNING SYSTEM FIELD OPERATIONAL TEST (DDWS FOT)
Under the sponsorship of NHTSA, VTTI investigated the safety benefits of a drowsy driver warning system (DDWS) for CMV drivers under naturalistic driving conditions (Hanowski et al., in press).(6) The primary objective of the DDWS FOT was to determine the safety benefits and operational capabilities, limitations, and characteristics of a DDWS that monitors drivers’ drowsiness. The evaluation occurred in a naturalistic driving environment in which data were collected from commercial drivers driving trucks in normal operations. The participant sample included two different long-haul operations types (truckload and less-than-truckload) and was intended to be generally representative of the long-haul commercial vehicle truck driver population.
The DDWS FOT yielded approximately 20 terabytes of continuously recorded data, making it the largest known on-road study ever conducted by the U.S. Department of Transportation (DOT). In addition to data directly related to the DDWS, the project collected extensive normative data on driving conditions and safety-critical traffic events. Several reports describing the results of the first 12 months of driving data from the DDWS FOT are available for further information (Hanowski, Blanco, Nakata, et al., 2005; Hickman, Knipling, Olson, et al., 2005).(18,19) Given the large amount of data collected for the DDWS FOT, this database is an excellent resource for data mining and exploring various topics in the realm of CMV driving safety. The stakeholders for the National Surface Transportation Safety Center for Excellence (NSTSCE) recognized the usefulness of this large data set and commissioned the present study involving exploration of various environmental variables and their relation to fatigue.


7
CHAPTER 3. NATIONAL SURFACE TRANSPORTATION SAFETY CENTER FOR EXCELLENCE
The NSTSCE at VTTI was established by the Federal Public Transportation Act of 2005 to develop and disseminate advanced transportation safety techniques and innovations in both rural and urban communities.
The mission of NSTSCE is defined as using state-of-the-art facilities, including the Virginia Smart Road, to develop and test transportation devices and techniques that enhance driver performance, examine advanced roadway delineation and lighting systems, address age-related driving issues, and address fatigued driver issues.
The current report describes the research activities and results of the first year of NSTSCE’s fatigue-related efforts, which involved leveraging data from the aforementioned DDWS FOT study. This present study involved: (i) updating the DDWS FOT database to include an additional four months of naturalistic driving data; (ii) identifying and coding the driving parameters for safety-critical incidents and baseline driving epochs within this previously unanalyzed set of data (and providing descriptive statistics to identify the frequency and percentage of various conditions identified in the data); (iii) performing two independent measures of driver fatigue for each safety-critical event and baseline epoch identified in the entire DDWS FOT database (when possible); and (iv) calculating odds ratio calculations for a variety of driver and environmental variables to gain an understanding of variables associated with fatigue in CMV driving.
OVERVIEW OF CMV DRIVER FATIGUE ANALYSIS
The most fundamental analyses in the current study were descriptions and comparisons of instances where driver fatigue ratings were below versus above their relative thresholds. Descriptions of fatigue-related events and baseline epochs provided information on the characteristics and conditions associated with drowsy driving (e.g., wet versus dry, light versus dark, divided versus undivided highways).
The odds ratio is an estimate of relative risk, which is calculated by comparing the odds of some outcome (e.g., fatigue rating above or below threshold) occurring given the presence of some predictor factor, condition, or classification (e.g., daylight versus dark). It is usually a comparison of the presence of a condition to its absence (e.g., fatigued and non-fatigued). Odds ratios of “1” indicate that the outcome is equally likely to occur given the condition. An odds ratio greater than “1” indicates that the outcome is more likely to occur given the condition. Odds ratios of less than “1” indicate that the outcome is less likely to occur (Pedhazur, 1997).(20) The odds ratio figures presented in this report are accompanied by a lower confidence level (LCL) and upper confidence level (UCL). An odds ratio is considered statistically significant if the confidence level range does not include 1.0.
SUMMARY
This report describes data that were leveraged off of the DDWS FOT during 16 months of naturalistic data gathering. The current NSTSCE report assesses: (i) the descriptive analysis of heavy-vehicle safety events and baseline epochs, and (ii) the odds of driver fatigue given various

8
driving parameters. It should be noted that this report does not represent all variables coded or data collected in the DDWS FOT, but is a specific analysis of the relation of fatigue to various driving parameters.

9
CHAPTER 4. METHODOLOGY
The DDWS FOT Task 1 report (Preliminary Analysis Plan; Hanowski et al., 2004)(21) and Task 2 report (Analysis Specification; Knipling et al., 2004)(22) contain extensive information on the project methodology. The information provided below is intended to provide an overview.
PARTICIPANTS AND SETTING
Drivers from all three fleets participating in this study were volunteers selected based on the following qualifications: (i) a significant proportion of their driving was at night, (ii) they did not wear glasses while driving, (iii) they had a low risk of dropping out or leaving the company, and (iv) they passed vision and hearing tests. These qualifications were important for the original DDWS FOT study because the DDWS device being tested did not work in the daytime or with drivers wearing glasses.
This report includes data from 103 drivers (99 percent male, 1 percent female) who completed the required number of weeks in data collection or withdrew from the study for one reason or another (e.g., terminated from the participating fleet). Each driver had a Class A Commercial driver’s license. The mean age of drivers was 39.95 years old (Range = 24–60 years old). Sixty-seven drivers identified themselves as Caucasian (65.1 percent), 30 African-American (29.1 percent), one Asian-American (1 percent), three Native-American (2.9 percent), and one Hispanic American (1 percent). This sample was relatively diverse and similar to that in an American Trucking Association (2005)(23) sponsored study which reported that 29.1 percent of truck drivers were minorities and 4.6 percent of truck drivers are women. Participants reported driving a CMV for an average of 127.6 months (Range = 16-504 months). Data were collected for a total of 34,230 hours of driving time (Mean hours per driver = 423.6 hours; Range = 14 – 892 hours). It was estimated that drivers drove a total of 2.5 million miles during those hours.
Drivers were employed at one of three fleets across nine different locations. Fleets A and B were line-haul operations, whereby a driver typically returns to the home base once per 24-hour period (five days per week). For example, these drivers may take their truck out in the evening of Day 1, drive to their delivery location, deliver their load, and return to their home base the morning of Day 2. They would leave again the evening of Day 2 and repeat the process to complete their work week. Fleet C was involved in over-the-road truckload operations. For the over-the-road drivers, a typical schedule may include starting on Sunday evening and returning to their home base the following Friday afternoon.
PROCEDURES
On-Road Methods
Data collection was conducted on-the-job while the drivers drove their instrumented trucks on normal business. All drivers were informed that downloading data from the trucks and Actigraph watches was conducted by a researcher (approximately) once per week at the fleet distribution center, whereby VTTI researchers swapped the hard drive (i.e., removed the current hard drive and replaced it with a new hard drive). To help ensure successful data collection, a researcher from VTTI regularly checked the data acquisition system (DAS). This DAS check included a frame of the video to help ensure that the cameras were operating properly. Data

10
collection continued until the driver completed the required number of weeks of data collection (after 10-14 weeks of driving).
When data collection was completed, the driver was thanked for his/her participation, and signed a payment sheet. A check was mailed to the driver a few weeks after completing data collection. Drivers received $20 for completing the screening process, $30 for completing the Informed Consent form, $75 for each week driving an instrumented truck, and an additional $250 for completing the required number of weeks driving an instrumented truck. After payment was complete, the next participant began his/her time in the instrumented truck. This rotation cycle continued until all drivers participated.
DATA COLLECTION PROCESS
There were three forms of data being collected by the DAS: (i) video, (ii) dynamic performance, and (iii) audio. Data were continuously collected at approximately 4 MB/min. Each driver drove for approximately 60 h in a seven-day period. Assuming that all 103 drivers drove for 10-14 weeks, there was the potential for approximately 20 terabytes of data to be collected in the DDWS FOT. This was likely a high estimate, as the trucks and the DAS experienced occasional breakdowns and were not in service for the entire year-long data collection period.
Forty-six trucks were instrumented with the DAS. Each truck was driven by three to five different drivers for 10-14 weeks each. To ensure that enough hard drive space was available aboard the trucks, each truck had a 60 to 100 GB stationary hard drive capable of storing several weeks of data. A separate removable hard drive was also part of the DAS. The data from the stationary hard drive was periodically copied to the removable hard drive. A researcher periodically removed this hard drive (e.g., weekly) and replaced it with a clean removable hard drive.
Data Acquisition System (DAS)
The DAS consisted of a Pentium-based computer that received and stored data from a network of sensors distributed around the vehicle. Data were stored on the system’s external hard drive, which could store several weeks of driving data before it needed to be replaced. The DAS consisted of five major components, including: (i) an encased unit that housed the computer and external hard drive, (ii) dynamic sensors, (iii) a vehicle network, (iv) an incident box, and (v) video cameras. Each component was active when the ignition system of the vehicle was activated. Therefore, the data were collected continuously whenever the truck was on and in motion.
A software program called Loki was developed by VTTI to coordinate the data collection from the different sensor components and to integrate the data into a specific DAS output file called the Truck Performance Data file. The encased unit that housed the computer and external hard drive was installed under the passenger seat or in the truck’s rear cargo department. Figure 4 and figure 5 show examples of the encased unit installed under the passenger seat and in the truck’s rear cargo compartment, respectively. The organization of the DAS components is illustrated in figure 6. More specific details regarding the DAS components are described below.

11
Figure 4. Photo. Encased computer and external hard drive installed under the passenger seat.
Figure 5. Photo. Encased computer and external hard drive installed in the truck's rear storage compartment.

12
Figure 6. Illustration. Arrangement of the data collection and storage components.
13
The DAS (including the video cameras, sensor components, and computer and external hard drive) became active when the ignition system of the vehicle was activated. The system remained active and recorded data as long as the engine was on and the vehicle was in motion. The system shut down in an orderly manner when the ignition was turned off. The system paused if the vehicle ceased motion for 15 min or longer.
There were three main DAS output files: (i) truck dynamic performance data file, (ii) digital video, and (iii) audio. These files were stored on the DAS’s external hard drive. The truck performance file contained the driver input measures (e.g., lateral and longitudinal acceleration, braking, etc.) and the truck measures (e.g., global positioning system [GPS], light level, etc). The digital video file contained the continuous video recorded during the run (a sample frame is shown in Figure 10). The audio file resulted from the driver pressing the Critical Incident Button.
Dynamic Sensors
Global Positioning System (GPS)
A GPS device was included in the DAS and was used primarily for tracking the instrumented vehicles. Data output included measures of latitude, longitude, altitude, horizontal and vertical velocity, heading, and status/strength of satellite acquisition.
Yaw Rate
A yaw rate (gyro) sensor was included in the DAS and provided a measure of steering instability (i.e., jerky steering movements).
X/Y Accelerometer
Accelerometers instrumented in the truck were used to measure longitudinal (x) and lateral (y) accelerations.
Front VORAD
A radar-based VORAD forward object detection unit that provided a measure of range to lead vehicles was installed on the front of the truck (see figure 7). From the range measure, range rate and time-to-collision (TTC) were also derived. The VORAD unit was used for passive data collection and did not display information to the driver.

14
Figure 7. Photo. VORAD unit on the front of the truck.
VEHICLE NETWORK
The Society of Automotive Engineers’ J1587 (SAE, 2002)(24) defines the format of messages and data that are collected by large truck on-board microprocessors. These microprocessors are installed on the vehicle at the truck manufacturing facility. Thus, the vehicle network refers to a from-the-factory on-board data collection system. Depending upon the truck model, year, and manufacturer, there are several data network protocols or standards that are used with heavy vehicles, including those defined by J1708 (SAE, 1993) (25), J1939 (SAE, 2001) (26), and J1587 (SAE, 2002)(24). An interface was developed to access the data from the network and merge it into the DAS data set. Some of the typical measures found on the vehicle network of most trucks include, but are not limited to: vehicle speed, distance since vehicle start-up, ignition signal, throttle position, and brake pressure. In addition to the truck network measures, other driver input measures that were collected with sensors include right and left turn-signal use and headlight status (on/off).
Incident Box
Light Level
The in-cab ambient illumination level was recorded by a light meter.
Incident Pushbutton
When the driver was involved in a critical incident, he/she was instructed to push a red button on the Incident Box (see figure 8). This button opened an audio channel for 20 s. In this time, the driver provided a verbal report of what occurred.
Microphone
A microphone was instrumented in the Incident Box to record the verbal utterances of the driver when the Incident Pushbutton was activated.

15
Figure 8. Photo. Incident box used in the DDWS FOT.
Video Cameras
Digital video cameras are used to continuously record the driver and the driving environment. Four video cameras are multiplexed into a single image. The four camera views are: (i) forward, (ii) driver's face, (iii) rear-facing-left, and (iv) rear-facing-right. The forward and rear-facing camera views provide good coverage of the driving environment. The face view provides coverage of the driver’s face and will allow researchers to conduct eye glance analysis and estimated manual PERCLOS (EMP) assessment. Figure 9 shows the camera direction and approximate fields-of-view for the four cameras.
Figure 9. Illustration. Camera directions and approximate fields of view.
As shown in figure 10, the four camera images were multiplexed into a single image. A time-stamp (.mpg frame number) was also included in the .mpg data file but was not displayed on the
Behind Vehicle Front of Vehicle Camera 2
Camera 1 Camera 3
Camera 4

16
screen. The frame number was used to time-synchronize the video (in .mpg format) and the truck/performance data (in .dat format).
Figure 10. Photo. Split-screen presentation of the four camera views.
The digital video files did not contain continuous audio. However, as noted previously, the driver can press an Incident Pushbutton and record a verbal comment for 30 s. This audio data is recorded together with the video data.

17
CHAPTER 5. DATA ANALYSIS AND REDUCTION TOOL SOFTWARE
VTTI programmers developed a data reduction and analysis program to support analyses of VTTI’s naturalistic data. The following sections provide details of this software, including screen shots of the user interface.
DATA DIRECTORY
As in the analysis of motor vehicle crashes from police accident reports (PARs), the analysis of other safety-significant events begins with the development and adoption of a data directory listing all variables (e.g., weather) and specific data elements for each variable (e.g., clear, rain, snow, fog, etc.). For the analyses presented in this report, all events were coded based on the data directory and, once coded, comparisons were made on variables or data elements in the directory.
A detailed and comprehensive data directory of variables and data elements can be found in appendix A. The data directory included classification variables relating to each overall event, to the subject vehicle (truck) and driver, and (to a limited extent) to the other involved vehicle/driver or non-motorist. Specification of the data directory was critical since it defined and delimited the possible analyses from the data. The data directory presented in this report was the result of discussions with the Federal Motor Carrier Safety Administration (FMCSA, who sponsored the original data collection for the DDWS FOT) and development by VTTI.
There were three primary steps in performing the data reduction/analysis for the events: (i) running the event trigger program, (ii) checking the validity of the triggered events, and (iii) applying the data directory to the validated events. These steps are described in detail below.
RUNNING THE EVENT TRIGGER PROGRAM
The first step in the data reduction process was to identify events of interest, including crashes, near-crashes, and crash-relevant conflicts. Each of these events may or may not have involved an interaction with another vehicle. To find events of interest, VTTI developed a software program (Data Analysis and Reduction Tool: DART) that scanned the data set for notable actions, including hard braking, quick steering maneuvers, short TTCs, and lane deviations. To identify these actions, threshold values (“triggers”) were developed. Table 2 displays the seven triggers and their event signatures.
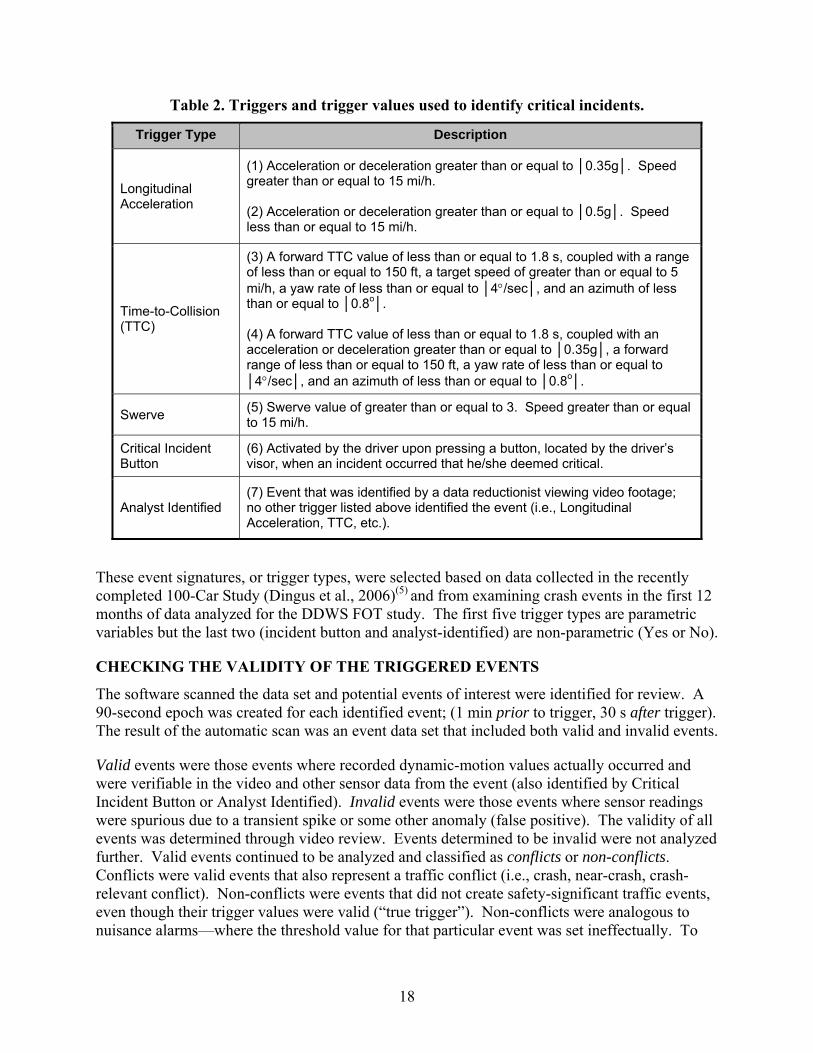
18
Table 2. Triggers and trigger values used to identify critical incidents.
Trigger Type Description
Longitudinal Acceleration
(1) Acceleration or deceleration greater than or equal to │0.35g│. Speed greater than or equal to 15 mi/h. (2) Acceleration or deceleration greater than or equal to │0.5g│. Speed less than or equal to 15 mi/h.
Time-to-Collision (TTC)
(3) A forward TTC value of less than or equal to 1.8 s, coupled with a range of less than or equal to 150 ft, a target speed of greater than or equal to 5 mi/h, a yaw rate of less than or equal to │4°/sec│, and an azimuth of less than or equal to │0.8o│. (4) A forward TTC value of less than or equal to 1.8 s, coupled with an acceleration or deceleration greater than or equal to │0.35g│, a forward range of less than or equal to 150 ft, a yaw rate of less than or equal to │4°/sec│, and an azimuth of less than or equal to │0.8o│.
Swerve (5) Swerve value of greater than or equal to 3. Speed greater than or equal to 15 mi/h.
Critical Incident Button
(6) Activated by the driver upon pressing a button, located by the driver’s visor, when an incident occurred that he/she deemed critical.
Analyst Identified (7) Event that was identified by a data reductionist viewing video footage; no other trigger listed above identified the event (i.e., Longitudinal Acceleration, TTC, etc.).
These event signatures, or trigger types, were selected based on data collected in the recently completed 100-Car Study (Dingus et al., 2006)(5) and from examining crash events in the first 12 months of data analyzed for the DDWS FOT study. The first five trigger types are parametric variables but the last two (incident button and analyst-identified) are non-parametric (Yes or No).
CHECKING THE VALIDITY OF THE TRIGGERED EVENTS
The software scanned the data set and potential events of interest were identified for review. A 90-second epoch was created for each identified event; (1 min prior to trigger, 30 s after trigger). The result of the automatic scan was an event data set that included both valid and invalid events.
Valid events were those events where recorded dynamic-motion values actually occurred and were verifiable in the video and other sensor data from the event (also identified by Critical Incident Button or Analyst Identified). Invalid events were those events where sensor readings were spurious due to a transient spike or some other anomaly (false positive). The validity of all events was determined through video review. Events determined to be invalid were not analyzed further. Valid events continued to be analyzed and classified as conflicts or non-conflicts. Conflicts were valid events that also represent a traffic conflict (i.e., crash, near-crash, crash-relevant conflict). Non-conflicts were events that did not create safety-significant traffic events, even though their trigger values were valid (“true trigger”). Non-conflicts were analogous to nuisance alarms—where the threshold value for that particular event was set ineffectually. To

19
reiterate, in non-conflict events, the sensor reading was correct (e.g., the recorded vehicle acceleration occurred), but no actual traffic conflict occurred. Examples of valid events that were non-conflicts include hard braking by a driver in the absence of a specific crash threat or a high swerve value from a lane change not resulting in any loss-of-control, lane departure, or proximity to other vehicles. While such situations sometimes reflected at-risk driving habits and styles, they did not result in a discernible crash-relevant conflict. To determine the validity of the events, data analysts observed the recorded video and data plots of the various sensor measures associated with each 90-second epoch. The vehicle sensor measures, represented in pull-down menus in the software program, are shown in figure 11.
Figure 11. Screen shot. Screen shot of a pull-down menu showing the plots that can be viewed by the analyst to aid in determining the validity of triggered events.
Please note that the lower the trigger values were set, the more false positive events, non-conflict events, and less severe conflicts (i.e., crash-relevant conflicts) occurred. However, setting lower trigger values resulted in relatively few missed events. The goal was to identify all of the most severe events (crashes and near-crashes) without having an unmanageable number of false positive events, non-conflict events, and low-severity conflict events.
Figure 12 shows an example of a valid trigger for Longitudinal Acceleration (LA). In this example, the Trigger Chart shows the trigger at the same point that the Accel_X plot shows the value reached -0.37g, indicating a sharp deceleration of the vehicle. For this example, the LA trigger was set at ±0.35 so anytime the software detected an LA with a magnitude greater than ±0.35, a trigger was created. Looking closely at the video in the top right quadrant, a vehicle can be seen in front (and to the right) of the subject vehicle. At this point, a tractor trailer has begun

20
to change lanes directly in the lane in front of the instrumented vehicle, and the driver of the instrumented truck brakes to avoid the truck.
Figure 12. Screen shot. Example of a validated trigger where the LA was of greater magnitude than the pre-set value of -0.35g.
Figure 13 shows an example of a non-conflict that had a valid Swerve (quick steering) trigger. During this event, the driver was changing lanes. The Trigger Chart shows that the trigger appeared when the Swerve value reached 3.68 (the value for this trigger was set at ≥ 3.0). After reviewing the video, it was seen that there were no vehicles in front of or to the side of the instrumented vehicle and the driver was simply changing lanes.

21
Figure 13. Screen shot. Example of a non-conflict event (with a valid trigger) where the driver’s swerve (quick steering) was at 3.68 (trigger set to ≥ 3.0).
APPLYING THE DATA DIRECTORY TO THE VALIDATED EVENTS
As mentioned above, an event coding Data Directory was used to reduce and analyze valid events. The software presented the analyst with a series of variables consisting either of a blank space for entry of specific comments (e.g., Element #52, Event Comments) or provided pull-down menus for the analyst to select the most applicable code (i.e., number corresponding to a data element). Different variables had different coding rules. For most variables, only one code might be selected. For a few variables, however, the analyst could select up to four codes that were applicable. For example, analysts could select multiple Potential Distraction Behaviors (Directory Element 39).
The database software automatically coded many of the variables. These automatically-coded variables reflect data recorded from sensors in the subject vehicle; examples include vehicle number, driver subject number, date, and time. Although these variables were coded

22
automatically, they were listed in the Data Directory to provide readers and reviewers with a full picture of the variables that were available to support analyses of the data.
Baseline Epochs
A random sample of 2,053 baseline epochs, each 60 s in length, was selected for data reduction. Data reductionists used the Data Directory and coded a variety of variables from these 2,053 randomly selected baseline driving epochs or brief driving periods. Ordinarily, one random baseline epoch was selected for each driver-week of data collection. Baseline epochs were described using many of the same variables used to describe safety-critical events. In particular, their conditions of occurrence were recorded. In the current analysis, coded data on the 2,053 baseline epochs were combined with 1,217 safety-critical events.
Drowsiness/Fatigue Measures
In addition to coding events using the data directory, two measures were implemented to assess the driver’s level of fatigue based on independent methods. These measures are Observer Rating of Drowsiness (ORD) and EMP, which are described in more detail below.
OBSERVER RATING OF DROWSINESS (ORD)
The procedure for measuring ORD was developed and first used by Wierwille and Ellsworth (1994)(27), who demonstrated that ORD could have good intra- and inter-rater reliability.
Data analysts were instructed to watch the driver’s face and body language for 1 min prior to the event trigger. As described by Wierwille and Ellsworth (1994)(27), signs indicative of drowsiness include rubbing the face or eyes, facial contortions, moving restlessly in the seat, and slow eyelid closures. Data analysts were trained to look for these signs of drowsiness and make a subjective, but specific, assessment of the level of drowsiness. After watching the video data for 1 min prior to an event trigger, data analysts employed a rating scale to record an ORD level (see figure 14). The rating scale used by Wierwille and Ellsworth was printed on paper and analysts in that study marked a point on the horizontal line. In the present study, analysts moved a cursor on a computer monitor to the desired ORD. ORD was recorded using a 100-point continuous rating scale (figure 14) where a number from 0 to 100 was assigned based on the linear position chosen by the analyst. ORD scores of > 40 are considered indicative of fatigue. (1)
It should be noted that for the first 12 months of data collected for this project, ORD was scored by a single individual for the 915 safety-critical events and 1,072 baseline epochs. This individual is considered VTTI’s resident expert at ORD given her level of experience and the perceived accuracy of her ratings. However, the additional four months of data which were added for the current study followed a somewhat different methodology for arriving at ORD scores for the 302 safety-critical events and 981 baseline epochs identified in this additional portion of data. Three trained raters made independent ORD ratings for each event and baseline epoch, and an average of the three scores was then taken as the ORD score. It is believed that averaging across three raters accounts for some of the inter-rater variability that is common with such subjective measures. Descriptive statistics performed on the three raters’ ORD scores showed that they had nearly identical mean ORD ratings across the total number of events/baseline epochs rated (Rater 1 Mean = 38.4, SD = 11.4; Rater 2 Mean = 39.4, SD =12.2; Rater 3 Mean = 39.1, SD = 12.4).

23
Figure 14. Screen shot. ORD rating scale used by data analysts (adapted from Wierwille & Ellsworth, 1994).(27)
00 = Not Drowsy – No signs of being drowsy
25 = Slightly Drowsy – Driver shows minor signs of being drowsy (single yawn, single stretch, droopy eyes for a short period of time); quickly recovers; does not have any apparent impact on vehicle control.
50 = Moderately Drowsy – Driver shows signs of being drowsy (yawns, stretches, moves around in seat, droopy eyes for a slightly longer period of time; minor blinking); takes slightly longer to recover; does not have any apparent impact on vehicle control.
75 = Very Drowsy – Driver shows signs of being drowsy (yawns often, has very heavy/droopy eyes, frequent blinking); duration lasts much longer; does not have any apparent impact on vehicle control.
100 = Extremely Drowsy – Driver shows extreme signs of being drowsy (yawns often, has very heavy/droopy eyes, has trouble keeping eyes open, very frequent blinking); duration lasts much longer; has apparent impact on vehicle control.
EMP
PERCLOS is a mathematically defined proportion of a time interval that the eyes are 80 percent to 100 percent closed (Wierwille et al., 1994).(2) It is a measure of slow eyelid closure not inclusive of eye blinks. While an eye blink is typically a very quick closure and re-opening of the eyes, “slow eye closures” are relatively gradual eye movements where the eyelids droop and close slowly. PERCLOS is a valid indicator of fatigue which is significantly correlated with lane departures and lapses of attention.
This study utilized a manual coding scheme for calculating an estimate of PERCLOS, which is referred to in this report as estimated manual PERCLOS (EMP).

24
From the time of the event trigger (or a set point of a baseline epoch), a trained data reductionist would back up the video data by 3 min 10 s (1900 syncs; data is gathered at 10Hz, so each sync represents 1/10 of a second). Reductionists would then code EMP sync-by-sync using the following operational definitions:
Eyes Open: Eyes are visibly open
Eyes Closed: Eyes are visibly closed or mostly closed (including blinks)
Eyes Not Visible: When the eyes literally cannot be seen (due to obstruction, face out-of-camera view, head turned to monitor mirrors, heavy shadow, etc.)
Rapid eye blinks had to be eliminated from the data when calculating EMP. For the purposes of this analysis, a “blink” was defined as an eye closure of one sync. Anything longer than one sync was considered a slow eye closure and was therefore used in the EMP calculation. Also, if an event had more than 20 percent of the video coded as “Eyes Not Visible”, then an EMP was not performed.
ENSURING DATA CODING ACCURACY AND HIGH INTER-RATER RELIABILITY
To support accurate and consistent coding, a quality control procedure was established for the data coding. A key part of this was the testing of inter-rater reliability among analysts for test cases, with associated refresher training for analysts on difficult or uncertain coding issues. Two “test” events were selected each week and used to assess coding accuracy and inter-rater reliability of the coding. These events included some combination of crashes (if available), near-crashes, and crash-relevant conflicts. Baseline epochs were not used as test events because their codes are a smaller and less problematic subset of the codes for other events. The two “test” events were selected to include a variety of scenarios (e.g., truck-only versus two-vehicle) and potential coding issues (e.g., pre-crash and causation variable coding).
Each of the two test events was coded by three expert analysts (e.g., key project personnel and authors of this report) who came to an agreement on the correct coding for each variable in the Data Directory. Next, each data analyst coded the two events and their codes were compared to those of the expert analysts. The results helped to determine if analysts were correctly coding the events and identified analysts who were making more frequent coding errors. Those analysts received additional training, supervision, and quality control oversight. VTTI used this approach and found that it led to continuous improvement and refinement in the coding rules as well as better quality control of the coding. Analyst judgment always plays a role in the coding of some variables, but the goal is to make all coding guidelines and decision rules as explicit as possible.
These procedures continued throughout the entire data reduction process. Discrepancies in coding by analysts were an indication that either (i) clarifications or revisions were needed in the coding directory or other protocols or (ii) the analyst needed additional training or other corrective guidance regarding coding decisions. Analysts with the highest performance levels were assigned more responsible roles in the study, including quality checking of other analysts. Those with lower performance levels were limited to coding baseline epochs (the easiest coding assignment). Since the coding of some variables is based on analyst judgment (both perception and interpretation of the event), 100 percent agreement and reliability are not realistic goals.
25
Nevertheless, we believe that the system and procedures employed helped to sustain high coding performance levels during the project.
SUMMARY
The data presented below were based on data analysts’ assessments of the video and dynamic sensor data. The data analysts recorded their assessments of the video and dynamic sensor data by using the Data Directory (see appendix A). As described above, the Data Directory contained the list of data variables and elements used to code naturalistic driving events. To a great extent, these variables and data elements were selected to be compatible with major existing crash databases, such as the General Estimates System (GES), the Fatality Analysis Reporting System (FARS), and the Large Truck Crash Causation Study (LTCCS). In addition to established variables from national crash data files, other supplemental variables were included to address particular issues not otherwise addressed. Most of these were also derived from other research sources. For example, a variable on light vehicle - heavy vehicle interaction was from a taxonomy developed by Hanowski, Keisler, and Wierwille (2004).(28)
Like most crash databases, the Data Directory used for this study was organized into several major categories based on whether the variable applied to the whole event or to one of the drivers/vehicles. For consistency, Vehicle 1 (V1) always refers to the naturalistic driving participant (i.e., the instrumented truck); Vehicle 2 (V2) always refers to the other driver/vehicle/non-motorist. Since much more information was available for V1 than for V2, there are many more variables for V1 than for V2.


27
CHAPTER 6. RESULTS
The current data were leveraged from the DDWS FOT and include four additional months of data collected under the same study. The current report describes the full DDWS FOT data collection effort from May 2004 to September 2005. Again, this report does not include all the data collected in the DDWS FOT as that study was primarily conducted to evaluate a DDWS. The current data set included a total of 1,217 safety-critical events and 2,053 baseline epochs. Of the 1,217 safety-critical events in the data set, 29 were crashes (15 of these crashes were tire strikes), 120 were near-crashes, and 1,068 were crash-relevant conflicts. Baseline epochs were brief 60-second time periods that were randomly selected from the recorded data set. Baseline epochs were described using many of the same variables and data elements used to describe and classify crashes, near-crashes, and crash-relevant conflicts. As described above, safety-critical events were identified by one of three methods: (i) when dynamic sensor data surpassed a pre-determined criterion, (ii) when the driver pressed the Critical Incident Button, or (iii) Analyst Identified. Table 3 displays the distribution of trigger types in the data set for crashes, tire strikes, near-crashes, and crash-relevant conflicts.
Table 3. Distribution of trigger types.
Trigger Type: Crashes Crashes: Tire Strike Near-Crashes Crash-Relevant
Conflicts Total Safety-
Critical Events
Critical Incident Button 0 0.0% 0 0.0% 0 0.0% 1 0.09% 1 0.08%
Longitudinal Acceleration 4 28.6% 6 40.0% 51 42.5% 592 55.3% 653 53.7%
Forward Time-to-Collision 0 0.0% 0 0.0% 2 1.7% 172 16.1% 174 14.3%
Swerve 3 21.4% 2 13.3% 45 37.5% 187 17.5% 237 19.5%
Longitudinal Acceleration & Forward Time-to-Collision 0 0.0% 0 0.0% 4 3.3% 58 5.4% 62 5.1%
Longitudinal Acceleration & Swerve 2 14.3% 0 0.0% 10 8.3% 20 1.9% 32 2.6%
Forward Time-to-Collision & Swerve 0 0.0% 0 0.0% 2 1.7% 29 2.7% 31 2.5%
Longitudinal Acceleration & Swerve & Forward Time-to-Collision
0 0.0% 0 0.0% 2 1.7% 5 0.47% 7 0.58%
Analyst Identified 5 35.7% 7 46.7% 4 3.3% 4 0.37% 20 1.6%
Total 14 100.0% 15 100.0% 120 100.0% 1068 100.0% 1217 100.0%
The methodologies employed and analysis of odds ratios will be discussed in greater detail below. To investigate these issues the current study employed a database of classification variables used to compare four basic types of driving events: crashes, near-crashes, crash-relevant conflicts (also termed “incidents”), and baseline (control) epochs. These are defined and discussed below.

28
Crash. Any contact with an object, either moving or fixed, at any speed. Included other vehicles, roadside barriers, objects on or off of the roadway, pedestrians, pedalcyclists, or animals. The current data set included 29 crashes, of which 15 were tire strikes.
Near-Crash. Any circumstance requiring a rapid, evasive maneuver by the subject vehicle, any other vehicle, pedestrian, pedalcyclist, or animal, to avoid a crash. A rapid, evasive maneuver was defined as a steering, braking, accelerating, or any combination of control inputs that approached the limits of the vehicle capabilities. The current data set included 120 near-crashes.
Crash-Relevant Conflict (“Incident”). Any circumstance that required a crash avoidance response on the part of the subject vehicle, any other vehicle, pedestrian, pedalcyclist, or animal that was less severe than a rapid evasive maneuver (as defined above), but greater in severity than a “normal maneuver” to avoid a crash. A crash avoidance response included braking, steering, accelerating, or any combination of control inputs. During the analysis, the criteria were made more stringent to eliminate false alarms and non-conflict events. The current data set included 1,068 crash-relevant conflicts.
In addition to these three event types, the data reduction included a random sample of short driving time periods (called “epochs”) that functioned much as a control group. This set of events was termed “baseline” epochs and are defined as follows:
Baseline Epochs. Brief 60-second time periods randomly selected from the recorded data set. Baseline epochs were described using many of the same variables and data elements used to describe and classify crashes, near-crashes, and incidents. Examples of such variables include ambient weather, roadway type, and driver distractions. The creation of a baseline data set enabled the study to describe and characterize “normal” driving for the study sample and infer the increased or decreased risk associated with various conditions and driver behaviors and comparisons between the control (baseline) data set and the incident data set. The current data set included 2,053 baseline epochs.
Drowsiness/Fatigue
When analyzing video data, data reductionists would first code the driving parameters to describe the driving environment, driver behaviors, etc. This process was completed separately from the ORD and EMP measures. However, when reducing safety-critical events, reductionists would code up to 4 behaviors they believed to be relevant to the occurrence of the event. This reduction question item followed a forced-choice response format, where a list of possible responses was included in a pull-down menu. One of these response options was “Drowsy, sleepy, asleep, fatigued, or other reduced alertness”. Table 4 below shows the number of events in which this behavior/description was chosen as one of the four behaviors.

29
Table 4. Safety-critical events where the reductionist chose fatigue/drowsiness as a potential contributing factor.
Vehicle 1 Behaviors: Crashes (n = 14)
Crash: Tire Strike (n = 15)
Near-Crashes (n = 120)
Crash-Relevant Conflicts (n = 1068)
Total Safety-Critical Events (n = 1217)
Drowsy, sleepy, asleep, fatigued, other reduced alertness
3 21.4% 0 0.0% 19 15.8% 109 10.2% 131 10.8%
Below are descriptive statistics which present an overall picture of the ORD and EMP ratings for this study. It should be noted that, as expected, a portion of events and baseline epochs would not allow for fatigue measurements due to the driver’s eyes and/or facial features being obscured. In general, this was due to the driver wearing sunglasses, poor lighting, or an obstruction such as a CB radio cable. In addition, the EMP calculation required the drivers’ eyes to be visible for at least 80 percent of the calculation period, which resulted in the exclusion of EMP scores for a proportion of the events/baselines. Of the 3,270 safety-critical events and baseline epochs, 582 (17.8 percent) could not be scored for ORD, and 932 (28.5 percent) could not be used to score EMP.
ORD Summary
Appendix B includes a table which shows the descriptive statistics of ORD scores for each driver participant (table 117). This table also includes the number of safety-critical events and baselines analyzed for each driver, and how many of these involved an ORD score > 40, which is the threshold score for indicating drowsiness (Hanowski, Wierwille, Garness, & Dingus, 2000).(1) Again, ORD is rated on a scale from 0-100, with greater ratings indicating greater subjective ratings of drowsiness as coded by data analysts. Overall (n = 2,338) the ORD mean was 34.8 (SD = 16.0), with a range of 1.4 to 96. Table 5 shows the frequency and percentage of ORD ratings per event classification, including baseline epochs. Relative frequency of safety-critical events is also presented, which is the frequency of safety-critical events for a particular condition when all instances of the condition are taken into account [i.e., total safety-critical events / (total safety-critical events + baselines)]. The highest relative frequencies for safety-critical events occurred when the ORD ratings were below 40, which is considered the threshold for indicating drowsiness (i.e., scores equal to or above 40 indicate the driver is experiencing fatigue; Hickman, Knipling, Olson, et al., 2005)(19). The single highest relative frequency for safety-critical events was for ORD scores of 0 - 9.99 (0.58), while the lowest relative frequency was for ORD scores of 90+ (0.17).

30
Table 5. Frequency and percentage of ORD scores.
Pre-Event ORD:
Crashes Crash: Tire Strike
Near-Crashes
Crash-Relevant Conflicts
Total Safety-Critical Events
Baseline Epochs
Relative Freq.
0-9.99 5 35.7% 6 40.0% 11 9.2% 41 3.8% 63 5.2% 45 2.2% 0.58 10-19.99 1 7.1% 2 13.3% 20 16.7% 140 13.1% 163 13.4% 202 9.8% 0.45 20-29.99 3 21.4% 1 6.7% 25 20.8% 213 19.9% 242 19.9% 345 16.8% 0.41 30-39.99 1 7.1% 2 13.3% 16 13.3% 214 20.0% 233 19.1% 434 21.1% 0.35 40-49.99 1 7.1% 1 6.7% 14 11.7% 143 13.4% 159 13.1% 385 18.8% 0.29 50-59.99 0 0.0% 0 0.0% 4 3.3% 43 4.0% 47 3.9% 202 9.8% 0.19 60-69.99 1 7.1% 0 0.0% 4 3.3% 20 1.9% 25 2.1% 71 3.5% 0.26 70-79.99 0 0.0% 0 0.0% 0 0.0% 12 1.1% 12 1.0% 29 1.4% 0.29 80-89.99 0 0.0% 0 0.0% 0 0.0% 7 0.7% 7 0.6% 18 0.9% 0.28
90+ 0 0.0% 0 0.0% 0 0.0% 1 0.1% 1 0.1% 5 0.2% 0.17 Unknown 2 14.3% 3 20.0% 26 21.7% 234 21.9% 265 21.8% 317 15.4% 0.46
Total 14 100.0% 15 100.0% 120 100.0% 1068 100.0% 1217 100.0% 2053 100.0%
Table 6 below shows descriptive statistics for ORD scores above and below the fatigue threshold of 40 for total safety-critical events and baseline epochs. When only taking into account those events where ORD could be scored (n = 952), drivers were above the ORD fatigue threshold in 26.4 percent of all of the safety-critical events identified.
Table 6. ORD scores above and below fatigue threshold for total safety-critical events and baselines.
ORD Total Safety-Critical Events
Baseline Epochs Total
0-39 701 73.6% 1026 59.1% 1727 > 40 251 26.4% 710 40.9% 961 Total 952 100.0% 1736 100.0% 2688
Table 7 shows descriptive statistics for ORD scores above and below the fatigue threshold of 40 for the most severe safety-critical events (i.e., crashes/near-crashes) and baseline epochs. Drivers were above the ORD fatigue threshold in 22.3 percent of the crash/near-crash events where ORD could be scored (n = 112).
Table 7. ORD scores above and below fatigue threshold for crash/near-crash events and baselines.
ORD Crash/Near-Crash Baseline Epochs Total
0-39 87 77.7% 1026 59.1% 1113 > 40 25 22.3% 710 40.9% 735 Total 112 100.0% 1736 100.0% 1848

31
EMP Summary
Appendix B includes a table which shows the descriptive statistics of EMP scores for each driver participant. This table also includes the number of safety-critical events and baselines analyzed for each driver, as well as how many of these involved an EMP score > 12. Again, PERCLOS is a mathematically defined proportion of a time interval that the eyes are 80 percent to 100 percent closed (Wierwille et al., 1994)(2) with greater scores indicating greater fatigue/drowsiness. EMP scores > 12 are considered to be indicative of fatigue (Wierwille, Hanowski, Olson et al., 2003)(4). Overall, the EMP mean was 5.86 percent (SD = .05), with a range of 0 – 30.6 percent.
Table 8 shows the frequency and percentage of EMP ratings per event classification, including baseline epochs and the relative frequency of safety-critical events. No safety-critical event or baseline epoch indicated that the driver’s EMP score was above 30 percent. Of the total instances where EMP scores could be coded, the highest relative frequency occurred for EMP scores of 0 – 3.9 (0.41), which is below the fatigue threshold, while the lowest relative frequency was found for EMP scores of > 12 (0.25).
Table 8. Frequency and percentage of EMP scores.
Pre-Event EMP:
Crashes Crash: Tire Strike
Near-Crashes
Crash-Relevant Conflicts
Total Safety-Critical Events
Baseline Epochs
Relative Freq
0-3.9% 6 66.7% 6 53.3% 47 59.5% 406 57.2% 465 57.5% 668 43.7% 0.41 4-7.9% 1 11.1% 2 13.3% 13 16.5% 158 22.3% 174 21.5% 426 27.8% 0.29 8-11.9% 1 11.1% 0 0.0% 6 7.6% 82 11.5% 89 11.0% 195 12.7% 0.31
>12% 1 11.1% 2 33.3% 13 16.5% 64 9.0% 80 9.9% 241 15.8% 0.25
Total 9 100.0% 10 100.0% 79 100.0% 710 100.0% 808 100.0% 1530 100.0% Table 9 below shows descriptive statistics for EMP scores above and below the fatigue threshold of 12 percent for all of the safety-critical events and baseline epochs. When only taking into account those events where EMP could be scored (n = 808), drivers were above the EMP fatigue threshold in 9.9 percent of total safety-critical events.
Table 9. EMP scores above and below fatigue threshold for total safety-critical events and baselines.
EMP Total Safety Critical Events Baseline Epochs Total
0-3.9 465 57.5% 668 43.7% 1133 4-7.9 174 21.5% 426 27.8% 600
8-11.9 89 11.0% 195 12.7% 284 > 12 80 9.9% 241 15.8% 321 Total 808 100.0% 1530 100.0% 2338

32
Table 10 shows descriptive statistics for EMP scores above and below the fatigue threshold of 12 percent for the most severe safety critical events (i.e., crashes/near-crashes) and baseline epochs. Drivers were above the EMP fatigue threshold in 16.5 percent of the crash/near-crash events where EMP could be scored (n = 97).
Table 10. EMP scores above and below fatigue threshold for crash/near-crash events and baselines.
EMP Crash/Near-Crash Baseline Epochs Total 0-3.9 59 60.8% 668 43.7% 727 4-7.9 15 15.5% 426 27.8% 441
8-11.9 7 7.2% 195 12.7% 202 > 12 16 16.5% 241 15.8% 257 Total 97 100.0% 1530 100.0% 1627
Odds of Safety-Critical Event Involvement Based on Fatigue Score (All Events)
Table 11 and Table 12 show the frequency and percentage of ORD and EMP scores above and below their respective thresholds for total safety-critical events and baseline epochs. Odds ratio calculations indicated that the estimated relative risk of being involved in a safety-critical event, when compared to baseline epochs, was 1.93 times greater (LCL = 1.63; UCL = 2.30) when the ORD rating was below the fatigue threshold (i.e., a rating of less than 40). Similarly, the odds of being involved in a safety-critical event, when compared to baseline epochs, was 1.70 times greater (LCL = 1.30; UCL = 2.23) when the EMP rating was below the fatigue threshold (i.e., a score of less than 12 percent).
Table 11. Frequency and percentage of ORD scores above/below fatigue threshold (all events).
ORD Total Safety-Critical Events Baseline Epochs Total
0-39 701 73.6% 1026 59.1% 1727 > 40 251 26.4% 710 40.9% 961 Total 952 100.0% 1736 100.0% 2688
Table 12. Frequency and percentage of EMP scores above/below fatigue threshold (all events).
Pre-Event EMP:
Total Safety-Critical Events Baseline Epochs Total
0-11.9 728 90.1% 1289 84.2% 2017
> 12 80 9.9% 241 15.8% 321
Total 808 100.0% 1530 100.0% 2338
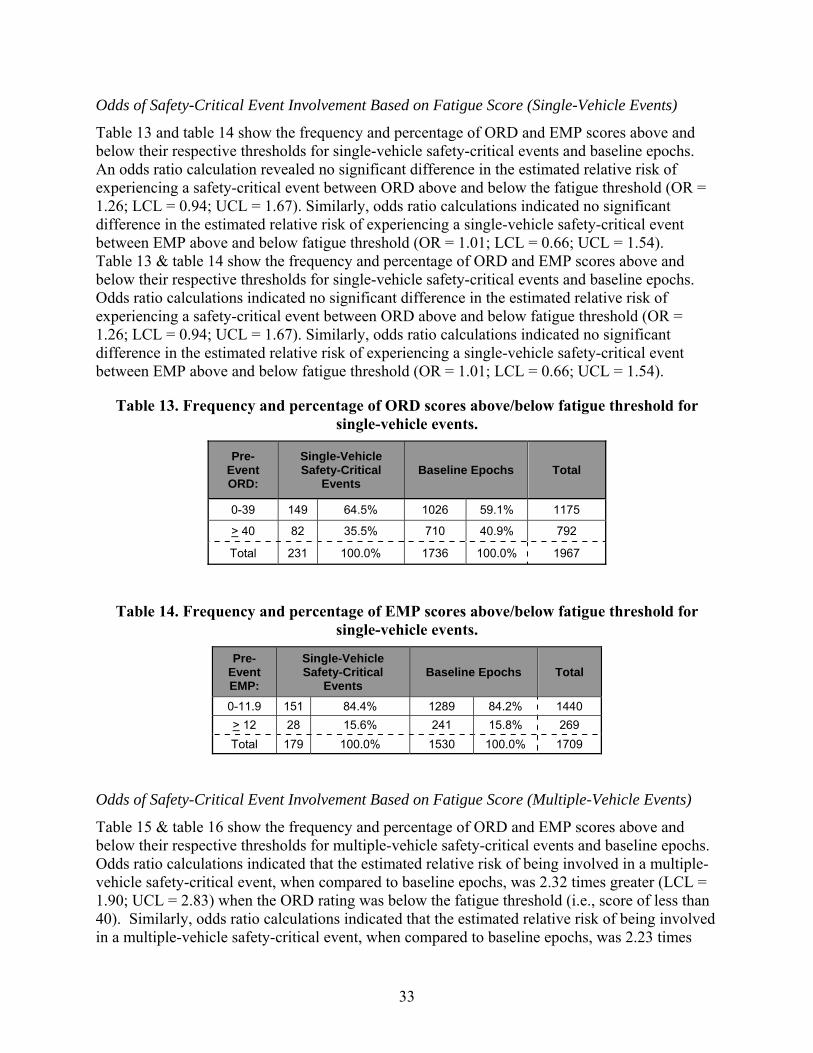
33
Odds of Safety-Critical Event Involvement Based on Fatigue Score (Single-Vehicle Events)
Table 13 and table 14 show the frequency and percentage of ORD and EMP scores above and below their respective thresholds for single-vehicle safety-critical events and baseline epochs. An odds ratio calculation revealed no significant difference in the estimated relative risk of experiencing a safety-critical event between ORD above and below the fatigue threshold (OR = 1.26; LCL = 0.94; UCL = 1.67). Similarly, odds ratio calculations indicated no significant difference in the estimated relative risk of experiencing a single-vehicle safety-critical event between EMP above and below fatigue threshold (OR = 1.01; LCL = 0.66; UCL = 1.54). Table 13 & table 14 show the frequency and percentage of ORD and EMP scores above and below their respective thresholds for single-vehicle safety-critical events and baseline epochs. Odds ratio calculations indicated no significant difference in the estimated relative risk of experiencing a safety-critical event between ORD above and below fatigue threshold (OR = 1.26; LCL = 0.94; UCL = 1.67). Similarly, odds ratio calculations indicated no significant difference in the estimated relative risk of experiencing a single-vehicle safety-critical event between EMP above and below fatigue threshold (OR = 1.01; LCL = 0.66; UCL = 1.54).
Table 13. Frequency and percentage of ORD scores above/below fatigue threshold for single-vehicle events.
Pre-Event ORD:
Single-Vehicle Safety-Critical
Events Baseline Epochs Total
0-39 149 64.5% 1026 59.1% 1175
> 40 82 35.5% 710 40.9% 792
Total 231 100.0% 1736 100.0% 1967
Table 14. Frequency and percentage of EMP scores above/below fatigue threshold for single-vehicle events.
Pre-Event EMP:
Single-Vehicle Safety-Critical
Events Baseline Epochs Total
0-11.9 151 84.4% 1289 84.2% 1440 > 12 28 15.6% 241 15.8% 269 Total 179 100.0% 1530 100.0% 1709
Odds of Safety-Critical Event Involvement Based on Fatigue Score (Multiple-Vehicle Events)
Table 15 & table 16 show the frequency and percentage of ORD and EMP scores above and below their respective thresholds for multiple-vehicle safety-critical events and baseline epochs. Odds ratio calculations indicated that the estimated relative risk of being involved in a multiple-vehicle safety-critical event, when compared to baseline epochs, was 2.32 times greater (LCL = 1.90; UCL = 2.83) when the ORD rating was below the fatigue threshold (i.e., score of less than 40). Similarly, odds ratio calculations indicated that the estimated relative risk of being involved in a multiple-vehicle safety-critical event, when compared to baseline epochs, was 2.23 times

34
greater (LCL = 1.60; UCL = 3.09) when the EMP rating was below the fatigue threshold (i.e., less than 12).
Table 15. Frequency and percentage of ORD scores above/below fatigue threshold for multiple-vehicle events.
Pre-Event ORD:
Multiple-Vehicle Safety-Critical
Events Baseline Epochs Total
0-39 536 77.0% 1026 59.1% 1562
> 40 160 23.0% 710 40.9% 870
Total 696 100.0% 1736 100.0% 2432
Table 16. Frequency and percentage of EMP scores above/below fatigue threshold for
multiple-vehicle events.
Pre-Event EMP:
Multiple-Vehicle Safety-Critical
Events Baseline Epochs Total
0-11.9 560 92.3% 1289 84.2% 1849 > 12 47 7.7% 241 15.8% 288
Total 607 100.0% 1530 100.0% 2137
DDWS FOT Condition
As described above, this report leveraged data from the DDWS FOT, which was conducted to evaluate a DDWS. In the DDWS FOT, there were 79 drivers in the experimental condition. The trucks of these drivers were instrumented with a functional DDWS that would provide an audible warning to the driver when the machine could not detect the eyes for a specified amount of time (thus assuming the driver was fatigued/drowsy). Control drivers (n = 24) received no such warnings. Table 17 & Table 18 show the frequency and percentage of ORD and EMP scores above and below their respective thresholds for the two DDWS FOT conditions. Odds ratio calculations indicated that the estimated relative risk of having an ORD score above the fatigue threshold was 1.45 times greater (LCL = 1.19; UCL = 1.78) for the experimental group. Similarly, the odds of having an EMP score above the fatigue threshold was 1.62 times greater (LCL = 1.17; UCL = 2.25) for the experimental group.
Table 17. Frequency and percentage of ORD scores above and below threshold (DDWS FOT Control versus Experimental).
Condition ORD > 40 ORD < 40 Total Control 167 17.4% 405 23.4% 572 21.3%
Experimental 793 82.6% 1323 76.6% 2116 78.7% Total 960 100.0% 1728 100.0% 2688 100.0%

35
Table 18. Frequency and percentage of EMP scores above and below threshold (DDWS FOT Control versus Experimental).
Condition PERC > 12 PERC < 12 Total Control 47 14.6% 439 21.8% 486 20.8%
Experimental 274 85.4% 1578 78.2% 1852 79.2% Total 321 100.0% 2017 100.0% 2338 100.0%
The sections below present odds ratio comparisons to determine the estimated relative risk of fatigue given certain aspects of the driving environment.
Day of Week (All Events)
Table 19 displays the frequency and percentage of Day of Week per event classification, including baseline epochs and the relative frequency of safety-critical events. It should be noted that there were difficulties with the GPS system in reliably capturing the date/time. As a result, the results below reflect only those events and baselines whereby the date and time were validated.
While relatively few of the safety-critical events occurred on a Sunday, when exposure was accounted for, Sunday had the highest relative frequency of safety-critical events (0.45), followed by Friday (0.41). The lowest relative frequency occurred on Tuesdays (0.31).
Table 19. Frequency and percentage of Day of Week (all events).
Day of Week: Crashes Crash: Tire
Strike Near-
Crashes Crash-
Relevant Conflicts
Total Safety-Critical Events
Baseline Epochs
Relative Freq
Sunday 1 10.0% 1 8.3% 5 5.8% 65 8.7% 72 8.4% 88 5.8% 0.45 Monday 2 20.0% 2 16.7% 12 14.0% 111 14.9% 127 14.9% 238 15.7% 0.35 Tuesday 1 10.0% 1 8.3% 13 15.1% 122 16.4% 137 16.0% 303 19.9% 0.31 Wednesday 1 10.0% 3 25.0% 22 25.6% 136 18.2% 162 19.0% 311 20.5% 0.34 Thursday 2 20.0% 4 33.3% 15 17.4% 127 17.0% 148 17.3% 252 16.6% 0.37 Friday 1 10.0% 1 8.3% 14 16.3% 141 18.9% 157 18.4% 226 14.9% 0.41 Saturday 2 20.0% 0 0.0% 5 5.8% 44 5.9% 51 6.0% 102 6.7% 0.33
Total 10 100.0% 12 100.0% 86 100.0% 746 100.0% 854 100.0% 1520 100.0%
Table 20 & Table 21 display the frequency and percentage of Day of Week (Monday-Wednesday versus Thursday - Sunday) which were above and below the fatigue threshold ORD and EMP scores, respectively, for all events. Odds ratio calculations revealed no significant differences for having an ORD (OR= 1.13; LCL = 0.93; UCL = 1.36) or EMP (OR = 1.15; LCL = 0.86; UCL = 1.53) score above/below their respective fatigue thresholds when comparing these conditions.

36
Table 20. Frequency and percentage of ORD scores above and below threshold (Monday-Wednesday versus Thursday - Sunday; all events & baselines) Day of Week: OR > 40 OR < 40 Total
Mon-Wed 379 55.7% 672 52.8% 1051 53.8% Thurs-Sun 301 44.3% 601 47.2% 902 46.2%
Total 680 100.0% 1273 100.0% 1953 100.0% Table 21. Frequency and percentage of EMP scores above and below threshold (Monday-
Wednesday versus Thursday - Sunday; all events and baselines). Day of Week: PERC > 12 PERC < 12 Total
Mon-Wed 126 58.1% 830 54.6% 956 55.1% Thurs-Sun 91 41.9% 689 45.4% 780 44.9%
Total 217 100.0% 1519 100.0% 1736 100.0%
Day of Week (Single-Vehicle Events)
Table 22 shows the frequency and percentage of Day of Week for single-vehicle events per event classification, including baseline epochs and the relative frequency of safety-critical events. Again, while relatively few of the single-vehicle safety-critical events occurred on a Sunday, this day of the week had the highest relative frequency of safety-critical events (0.15). Tuesday also had a relative frequency of 0.15. Wednesdays and Saturdays represented the lowest relative frequency of safety-critical events, each with a value of 0.10. However, it should be noted that the relative frequencies of single-vehicle events were approximately evenly distributed across days of the week.
Table 22. Frequency and percentage of Day of Week (single-vehicle events).
Day of Week: Crashes Crash: Tire
Strike Near-
Crashes Crash-
Relevant Conflicts
Total Safety-Critical Events
Baseline Epochs
Relative Freq
Sunday 0 0.0% 1 8.3% 2 5.7% 13 8.4% 16 1.4% 88 5.8% 0.15 Monday 2 25.0% 2 16.7% 6 17.1% 25 16.2% 35 2.9% 238 15.7% 0.13 Tuesday 1 12.5% 1 8.3% 9 25.7% 44 28.6% 55 1.9% 303 19.9% 0.15 Wednesday 1 12.5% 3 25.0% 6 17.1% 23 14.9% 33 7.7% 311 20.5% 0.10 Thursday 2 25.0% 4 33.3% 5 14.3% 20 13.0% 31 4.8% 252 16.6% 0.11 Friday 1 12.5% 1 8.3% 5 14.3% 21 13.6% 28 4.3% 226 14.9% 0.11 Saturday 1 12.5% 0 0.0% 2 5.7% 8 5.2% 11 1.4% 102 6.7% 0.10
Total 8 100.0% 12 100.0% 35 100.0% 154 100.0% 209 24.4% 1520 100.0%
Table 23 & table 24 display the frequency and percentage of Day of Week (Monday -Wednesday versus Thursday - Sunday) which were above and below the fatigue threshold ORD and EMP scores, respectively, for single-vehicle events only. Odds ratio calculations revealed no significant differences for having an ORD (OR = 1.15; LCL = 0.92; UCL = 1.44) or EMP (OR = 1.58; LCL = 0.48; UCL = 5.23) score above/below their respective fatigue thresholds when comparing these conditions.

37
Table 23. Frequency and percentage of ORD scores above and below threshold (Monday-Wednesday versus Thursday - Sunday; single-vehicle events). Day of Week: OR > 40 OR < 40 Total
Mon-Wed 327 62.3% 491 59.0% 818 60.3% Thurs-Sun 198 37.7% 341 41.0% 539 39.7%
Total 525 100.0% 832 100.0% 1357 100.0%
Table 24. Frequency and percentage of EMP scores above and below threshold (Monday-Wednesday versus Thursday - Sunday; single-vehicle events). Day of Week: PERC > 12 PERC < 12 Total
Mon-Wed 12 75.0% 74 65.5% 86 66.7% Thurs-Sun 4 25.0% 39 34.5% 43 33.3%
Total 16 100.0% 113 100.0% 129 100.0%
Day of Week (Multiple-Vehicle Events)
Table 25 shows the frequency and percentage of Day of Week for multiple-vehicle events per event classification, including baseline epochs and the relative frequency of safety-critical events. The highest relative frequency for multiple-vehicle safety-critical events occurred on Fridays (0.46), while the lowest relative frequency occurred on Tuesdays (0.21).
Table 25. Frequency and percentage of Day of Week (multiple-vehicle events).
Day of Week: Crashes Crash:
Tire Strike Near-
Crashes Crash-
Relevant Conflicts
Total Safety-Critical Events
Baseline Epochs
Relative Freq
Sunday 1 50.0% 0 0.0% 3 5.9% 52 8.0% 56 7.9% 88 5.8% 0.39 Monday 0 0.0% 0 0.0% 6 11.8% 86 13.2% 92 13.0% 238 15.7% 0.28 Tuesday 0 0.0% 0 0.0% 4 7.8% 78 12.0% 82 11.6% 303 19.9% 0.21 Wednesday 0 0.0% 0 0.0% 16 31.4% 113 17.3% 129 18.3% 311 20.5% 0.29 Thursday 0 0.0% 0 0.0% 10 19.6% 107 16.4% 117 16.6% 252 16.6% 0.32 Friday 0 0.0% 0 0.0% 9 17.6% 180 27.6% 189 26.8% 226 14.9% 0.46 Saturday 1 50.0% 0 0.0% 3 5.9% 36 5.5% 40 5.7% 102 6.7% 0.28
Total 2 100.0% 0 0.0% 51 100.0% 652 100.0% 705 100.0% 1520 100.0%
Table 26 & table 27 display the frequency and percentage of Day of Week (Monday -Wednesday versus Thursday - Sunday) which were above and below the fatigue threshold ORD and EMP scores, respectively, for multiple events only. Odds ratio calculations revealed no significant differences for having an ORD (OR = 1.04; LCL = 0.68; UCL = 1.59) or EMP (OR = 1.03; LCL = 0.49; UCL = 2.16) score above/below their respective fatigue thresholds when comparing these conditions.

38
Table 26. Frequency and percentage of ORD scores above and below threshold (Monday -Wednesday versus Thursday - Sunday; multiple-vehicle events).
Day of Week: OR > 40 OR < 40 Total
Mon-Wed 52 46.8% 181 45.8% 233 46.0% Thurs-Sun 59 53.2% 214 54.2% 273 54.0%
Total 111 100.0% 395 100.0% 506 100.0%
Table 27. Frequency and percentage of EMP scores above and below threshold (Monday-Wednesday versus Thursday - Sunday; multiple-vehicle events).
Day of Week: PERC > 12 PERC < 12 Total
Mon-Weds 14 46.7% 198 45.9% 212 46.0% Thurs-Sun 16 53.3% 233 54.1% 249 54.0%
Total 30 100.0% 431 100.0% 461 100.0%
Time of Day (All Events)
Table 28 shows the frequency and percentage of Time of Day for all safety-critical events per event classification, including baseline epochs and the relative frequency of safety-critical events. Again, the data below only reflect those events/baselines whereby the Time of Day was validated, and do not reflect the entirety of the data obtained for this study.
The highest relative frequency for all safety-critical events occurred between 14:00 – 14:59 (0.58), while the lowest relative frequency occurred between 2:00 – 2:59 (0.10).

39
Table 28. Frequency and percentage of Time of Day (all events and baselines).
Time of Day: Crashes Crash: Tire Strike
Near-Crashes
Crash-Relevant Conflicts
Total Safety-Critical Events
Baseline Epochs
Relative Freq
0:00 – 0:59 1 10.0% 0 0.0% 5 5.8% 13 1.7% 19 2.2% 65 4.3% 0.23
1:00 – 1:59 0 0.0% 0 0.0% 2 2.3% 7 0.9% 9 1.1% 42 2.8% 0.18
2:00 – 2:59 1 10.0% 0 0.0% 1 1.2% 4 0.5% 6 0.7% 54 3.6% 0.10
3:00 – 3:59 1 10.0% 0 0.0% 2 2.3% 5 0.7% 8 0.9% 48 3.2% 0.14
4:00 – 4:59 0 0.0% 0 0.0% 2 2.3% 7 0.9% 9 1.1% 49 3.2% 0.16
5:00 – 5:59 0 0.0% 0 0.0% 2 2.3% 4 0.5% 6 0.7% 24 1.6% 0.20
6:00 – 6:59 0 0.0% 1 8.3% 3 3.5% 20 2.7% 24 2.8% 43 2.8% 0.36
7:00 – 7:59 0 0.0% 0 0.0% 0 0.0% 16 2.1% 16 1.9% 51 3.4% 0.24
8:00 – 8:59 0 0.0% 0 0.0% 1 1.2% 39 5.2% 40 4.7% 54 3.6% 0.43
9:00 – 9:59 0 0.0% 1 8.3% 6 7.0% 43 5.8% 50 5.9% 50 3.3% 0.50
10:00 – 10:59 0 0.0% 0 0.0% 7 8.1% 42 5.6% 49 5.7% 81 5.3% 0.38
11:00 – 11:59 0 0.0% 1 8.3% 4 4.7% 57 7.6% 62 7.3% 84 5.5% 0.42
12:00 – 12:59 0 0.0% 0 0.0% 11 12.8% 59 7.9% 70 8.2% 75 4.9% 0.48
13:00 – 13:59 0 0.0% 1 8.3% 6 7.0% 51 6.8% 58 6.8% 73 4.8% 0.44
14:00 – 14:59 3 30.0% 2 16.7% 11 12.8% 67 9.0% 83 9.7% 60 3.9% 0.58
15:00 – 15:59 0 0.0% 2 16.7% 4 4.7% 58 7.8% 64 7.5% 88 5.8% 0.42
16:00 – 16:59 2 20.0% 0 0.0% 3 3.5% 66 8.8% 71 8.3% 87 5.7% 0.45
17:00 – 17:59 0 0.0% 1 8.3% 4 4.7% 49 6.6% 54 6.3% 71 4.7% 0.43
18:00 – 18:59 2 20.0% 0 0.0% 3 3.5% 33 4.4% 38 4.4% 72 4.7% 0.35
19:00 – 19:59 0 0.0% 1 8.3% 0 0.0% 35 4.7% 36 4.2% 76 5.0% 0.32
20:00 – 20:59 0 0.0% 2 16.7% 3 3.5% 25 3.4% 30 3.5% 71 4.7% 0.30
21:00 – 21:59 0 0.0% 0 0.0% 5 5.8% 20 2.7% 25 2.9% 71 4.7% 0.26
22:00 – 22:59 0 0.0% 0 0.0% 1 1.2% 14 1.9% 15 1.8% 66 4.3% 0.19
23:00 – 23:59 0 0.0% 0 0.0% 0 0.0% 12 1.6% 12 1.4% 65 4.3% 0.16
Total 10 100.0% 12 100.0% 86 100.0% 746 100.0% 854 100.0% 1520 100.0%
Table 29 & table 30 display the frequency and percentage of Time of Day (a.m. versus p.m.) which were above and below the fatigue threshold ORD and EMP scores, respectively, for all events and baselines. Odds ratio calculations revealed no significant differences for having an

40
ORD score (OR = 1.01; LCL = 0.86; UCL = 1.18) or EMP score (OR = 1.0; LCL = 0.79; UCL = 1.27) above/below their respective fatigue thresholds when comparing these conditions.
Table 29. Frequency and percentage of ORD scores above and below threshold (a.m. versus p.m.; all events and baselines).
Time of Day: ORD > 40 ORD < 40 Total
a.m. 423 44.1% 757 43.8% 1180 43.9%
p.m. 537 55.9% 971 56.2% 1508 56.1%
Total 960 100.0% 1728 100.0% 2688 100.0%
Table 30. Frequency and percentage of EMP scores above and below threshold (a.m. versus
p.m.; all events and baselines). Time of
Day: EMP > 12 EMP < 12 Total
a.m. 142 44.2% 890 44.1% 1032 44.1%
p.m. 179 55.8% 1127 55.9% 1306 55.9%
Total 321 100.0% 2017 100.0% 2338 100.0%
The human body functions on a 24-hour circadian rhythm that is driven by light levels in the environment as well as specific physical states such as body temperature, melatonin levels, etc. During a 24-hour period the human body usually experiences two drowsiness-related lows: first during the middle of the night between approximately 12:00 a.m. and 6:00 a.m. and the second in the afternoon between the hours of 2:00 p.m. and 4:00 p.m. (Dingus et al., 2002; Stutts, Wilkins, & Vaughn, 1999; Williamson et al., 1996). (29, 11, 9) Based on this, Table 31 & table 32 display the frequency and percentage of Time of Day (Circadian Rhythm versus Non-Circadian Rhythm) which were above and below the fatigue threshold ORD and EMP scores, respectively, for all events and baselines. Odds ratio calculations revealed no significant differences for having an ORD score (OR = 1.13; LCL = 0.92; UCL = 1.39) or EMP score (OR = 1.14; LCL = 0.83; UCL = 1.55) above/below their respective fatigue thresholds when comparing these conditions.
Table 31. Frequency and percentage of ORD scores above and below threshold (Circadian Rhythm versus Non-Circadian Rhythm; all events and baselines).
Time of Day: ORD > 40 ORD < 40 Total
Circadian Rhythm 197 36.9% 483 34.0% 680 34.8%
Non-Circadian Rhythm 337 63.1% 936 66.0% 1273 65.2%
Total 534 100.0% 1419 100.0% 1953 100.0%

41
Table 32. Frequency and percentage of EMP scores above and below threshold (Circadian Rhythm versus Non-Circadian rhythm; all events and baselines).
Time of Day: EMP > 12 EMP < 12 Total
Circadian Rhythm 64 29.5% 409 26.9% 473 27.2%
Non-Circadian Rhythm 153 70.5% 1110 73.1% 1263 72.8% Total 217 100.0% 1519 100.0% 1736 100.0%
Time of Day (Single-Vehicle Events)
Table 33 shows the frequency and percentage of Time of Day for single-vehicle events per event classification, including baseline epochs and the relative frequency of safety-critical events. The highest relative frequency for single-vehicle safety-critical events occurred between 9:00 – 9:59 and between 12:00 – 12:59 (0.21 for both), while the lowest relative frequency (0.04) occurred between 23:00 – 23:59.

42
Table 33. Frequency and percentage of Time of Day (single-vehicle events).
Time of Day: Crashes Crash: Tire
Strike Near-
Crashes Crash-
Relevant Conflicts
Total Safety-Critical Events
Baseline Epochs
Critical Event
Relative Freq
0:00 – 0:59 1 16.7% 0 0.0% 2 7.4% 7 4.6% 10 5.1% 65 4.3% 0.13
1:00 – 1:59 0 0.0% 0 0.0% 1 3.7% 5 3.3% 6 3.1% 42 2.8% 0.13
2:00 – 2:59 0 0.0% 0 0.0% 0 0.0% 3 2.0% 3 1.5% 54 3.6% 0.05
3:00 – 3:59 0 0.0% 0 0.0% 2 7.4% 3 2.0% 5 2.6% 48 3.2% 0.09 4:00 – 4:59 0 0.0% 0 0.0% 1 3.7% 5 3.3% 6 3.1% 49 3.2% 0.11 5:00 – 5:59 0 0.0% 0 0.0% 1 3.7% 0 0.0% 1 0.5% 24 1.6% 0.04 6:00 – 6:59 0 0.0% 1 8.3% 0 0.0% 3 2.0% 4 2.0% 43 2.8% 0.09 7:00 – 7:59 0 0.0% 0 0.0% 0 0.0% 7 4.6% 7 3.6% 51 3.4% 0.12 8:00 – 8:59 0 0.0% 0 0.0% 0 0.0% 6 4.0% 6 3.1% 54 3.6% 0.10 9:00 – 9:59 0 0.0% 1 8.3% 1 3.7% 11 7.3% 13 6.6% 50 3.3% 0.21 10:00 – 10:59 0 0.0% 0 0.0% 4 14.8% 13 8.6% 17 8.7% 81 5.3% 0.17 11:00 – 11:59 0 0.0% 1 8.3% 2 7.4% 9 6.0% 12 6.1% 84 5.5% 0.13 12:00 – 12:59 0 0.0% 0 0.0% 5 18.5% 15 9.9% 20 10.2% 75 4.9% 0.21 13:00 – 13:59 0 0.0% 1 8.3% 1 3.7% 6 4.0% 8 4.1% 73 4.8% 0.10 14:00 – 14:59 3 50.0% 2 16.7% 3 11.1% 6 4.0% 14 7.1% 60 3.9% 0.19 15:00 – 15:59 0 0.0% 2 16.7% 1 3.7% 8 5.3% 11 5.6% 88 5.8% 0.11 16:00 – 16:59 1 16.7% 0 0.0% 0 0.0% 8 5.3% 9 4.6% 87 5.7% 0.09 17:00 – 17:59 0 0.0% 1 8.3% 0 0.0% 9 6.0% 10 5.1% 71 4.7% 0.12 18:00 – 18:59 1 16.7% 0 0.0% 1 3.7% 4 2.6% 6 3.1% 72 4.7% 0.08 19:00 – 19:59 0 0.0% 1 8.3% 0 0.0% 5 3.3% 6 3.1% 76 5.0% 0.07 20:00 – 20:59 0 0.0% 2 16.7% 1 3.7% 7 4.6% 10 5.1% 71 4.7% 0.12 21:00 – 21:59 0 0.0% 0 0.0% 1 3.7% 4 2.6% 5 2.6% 71 4.7% 0.07 22:00 – 22:59 0 0.0% 0 0.0% 0 0.0% 4 2.6% 4 2.0% 66 4.3% 0.06 23:00 – 23:59 0 0.0% 0 0.0% 0 0.0% 3 2.0% 3 1.5% 65 4.3% 0.04 Total 6 100.0% 12 100.0% 27 100.0% 151 100.0% 196 100.0% 1520 100.0%
Table 34 & table 35 display the frequency and percentage of Time of Day (a.m. versus p.m.) which were above and below the fatigue threshold ORD and EMP scores, respectively, for single-vehicle events only. Odds ratio calculations revealed no significant differences for having an ORD score (OR = 1.46; LCL = 0.74; UCL = 2.86) or EMP score (OR = 0.95; LCL = 0.33; UCL = 2.72) above/below their respective fatigue thresholds when comparing these conditions.

43
Table 34. Frequency and percentage of ORD scores above and below threshold (a.m. versus p.m.; single-vehicle events).
Time of Day: ORD > 40 ORD < 40 Total
a.m. 26 52.0% 46 42.6% 72 45.6% p.m. 24 48.0% 62 57.4% 86 54.4% Total 50 100.0% 108 100.0% 158 100.0%
Table 35. Frequency and percentage of EMP scores above and below threshold (a.m. versus p.m.; single-vehicle events).
Time of Day: EMP > 12 EMP < 12 Total
a.m. 7 43.8% 51 45.1% 58 45.0% p.m. 9 56.3% 62 54.9% 71 55.0% Total 16 100.0% 113 100.0% 129 100.0%
Table 36 & table 37 display the frequency and percentage of Time of Day (Circadian Rhythm versus Non-Circadian Rhythm) which were above and below the fatigue threshold ORD and EMP scores, respectively, for single-vehicle events and baselines. Odds ratio calculations revealed no significant differences for having an ORD score (OR = 1.58; LCL = 0.79; UCL = 3.19) or EMP score (OR = 1.23; LCL = 0.42; UCL = 3.65) above/below their respective fatigue thresholds when comparing these conditions.
Table 36. Frequency and percentage of ORD scores above and below threshold (Circadian Rhythm versus Non-Circadian Rhythm; single-vehicle events and baselines).
Time of Day: ORD > 40 ORD < 40 Total Circadian Rhythm 20 40.0% 32 29.6% 52 32.9%
Non-Circadian Rhythm 30 60.0% 76 70.4% 106 67.1% Total 50 100.0% 108 100.0% 158 100.0%
Table 37. Frequency and percentage of EMP scores above and below threshold (Circadian Rhythm versus Non-Circadian Rhythm; single-vehicle events and baselines).
Time of Day: EMP > 12 EMP < 12 Total Circadian Rhythm 6 37.5% 37 32.7% 43 33.3%
Non-Circadian Rhythm 10 62.5% 76 67.3% 86 66.7% Total 16 100.0% 113 100.0% 129 100.0%
Time of Day (Multiple-Vehicle Events)
Table 38 shows the frequency and percentage of Time of Day for multiple-vehicle events per event classification, including baseline epochs and the relative frequency of safety-critical events. The highest relative frequency for multiple-vehicle safety-critical events occurred between 14:00 – 14:59 (0.49; meaning there were nearly equal numbers of safety-critical events

44
and baseline epochs observed during this timeframe), while the lowest relative frequency occurred between 2:00 – 2:59 (0.02).
Table 38. Frequency and percentage of Time of Day (multiple-vehicle events).
Time of Day: Crashes Crash:
Tire Strike Near-
Crashes Crash-
Relevant Conflicts
Total Safety-Critical Events
Baseline Epochs
Critical Event
Relative Freq
0:00 – 0:59 0 0.0% 0 0.0% 2 3.9% 6 1.0% 8 1.2% 65 4.3% 0.11 1:00 – 1:59 0 0.0% 0 0.0% 0 0.0% 2 0.3% 2 0.3% 42 2.8% 0.05 2:00 – 2:59 0 0.0% 0 0.0% 0 0.0% 1 0.2% 1 0.2% 54 3.6% 0.02 3:00 – 3:59 0 0.0% 0 0.0% 0 0.0% 2 0.3% 2 0.3% 48 3.2% 0.04 4:00 – 4:59 0 0.0% 0 0.0% 0 0.0% 2 0.3% 4 0.6% 49 3.2% 0.08 5:00 – 5:59 0 0.0% 0 0.0% 1 2.0% 4 0.7% 18 2.8% 24 1.6% 0.43 6:00 – 6:59 0 0.0% 0 0.0% 3 5.9% 17 2.9% 12 1.8% 43 2.8% 0.22 7:00 – 7:59 0 0.0% 0 0.0% 0 0.0% 9 1.5% 33 5.1% 51 3.4% 0.39 8:00 – 8:59 0 0.0% 0 0.0% 1 2.0% 33 5.6% 33 5.1% 54 3.6% 0.38 9:00 – 9:59 0 0.0% 0 0.0% 4 7.8% 32 5.4% 33 5.1% 50 3.3% 0.40 10:00 – 10:59 0 0.0% 0 0.0% 3 5.9% 29 4.9% 51 7.8% 81 5.3% 0.39 11:00 – 11:59 0 0.0% 0 0.0% 2 3.9% 48 8.1% 46 7.1% 84 5.5% 0.35 12:00 – 12:59 0 0.0% 0 0.0% 6 11.8% 44 7.4% 50 7.7% 75 4.9% 0.40 13:00 – 13:59 0 0.0% 0 0.0% 5 9.8% 44 7.4% 66 10.1% 73 4.8% 0.47 14:00 – 14:59 0 0.0% 0 0.0% 8 15.7% 61 10.3% 58 8.9% 60 3.9% 0.49 15:00 – 15:59 0 0.0% 0 0.0% 3 5.9% 50 8.4% 61 9.4% 88 5.8% 0.41 16:00 – 16:59 0 0.0% 0 0.0% 3 5.9% 58 9.8% 43 6.6% 87 5.7% 0.33 17:00 – 17:59 0 0.0% 0 0.0% 4 7.8% 40 6.8% 32 4.9% 71 4.7% 0.31 18:00 – 18:59 1 100.0% 0 0.0% 2 3.9% 28 4.7% 33 5.1% 72 4.7% 0.31 19:00 – 19:59 0 0.0% 0 0.0% 0 0.0% 30 5.1% 18 2.8% 76 5.0% 0.19 20:00 – 20:59 0 0.0% 0 0.0% 1 2.0% 18 3.0% 16 2.5% 71 4.7% 0.18 21:00 – 21:59 0 0.0% 0 0.0% 2 3.9% 15 2.5% 12 1.8% 71 4.7% 0.14 22:00 – 22:59 0 0.0% 0 0.0% 1 2.0% 10 1.7% 11 1.7% 66 4.3% 0.14 23:00 – 23:59 0 0.0% 0 0.0% 0 0.0% 9 1.5% 9 1.4% 65 4.3% 0.12 Total 1 100.0% 0 0.0% 51 100.0% 592 100.0% 652 100.0% 1520 100.0%
Table 39 & table 40 display the frequency and percentage of Time of Day (a.m. versus p.m.) which were above and below the fatigue threshold ORD and EMP scores, respectively, for multiple-vehicle events and baselines. Odds ratio calculations revealed no significant differences for having an ORD score (OR = 0.66; LCL = 0.41; UCL = 1.08) or EMP score (OR = 0.41; LCL = 0.16; UCL = 1.11) above/below their respective fatigue thresholds when comparing these conditions.
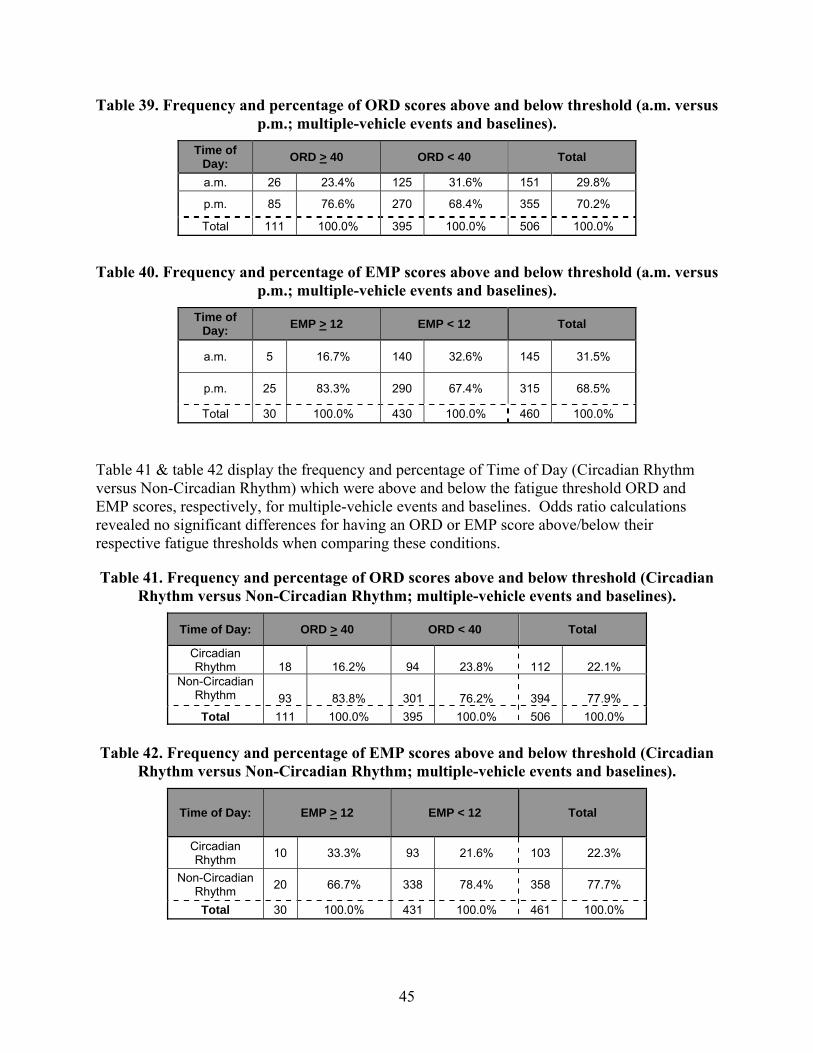
45
Table 39. Frequency and percentage of ORD scores above and below threshold (a.m. versus p.m.; multiple-vehicle events and baselines).
Time of Day: ORD > 40 ORD < 40 Total
a.m. 26 23.4% 125 31.6% 151 29.8%
p.m. 85 76.6% 270 68.4% 355 70.2%
Total 111 100.0% 395 100.0% 506 100.0%
Table 40. Frequency and percentage of EMP scores above and below threshold (a.m. versus p.m.; multiple-vehicle events and baselines).
Time of Day: EMP > 12 EMP < 12 Total
a.m. 5 16.7% 140 32.6% 145 31.5%
p.m. 25 83.3% 290 67.4% 315 68.5%
Total 30 100.0% 430 100.0% 460 100.0%
Table 41 & table 42 display the frequency and percentage of Time of Day (Circadian Rhythm versus Non-Circadian Rhythm) which were above and below the fatigue threshold ORD and EMP scores, respectively, for multiple-vehicle events and baselines. Odds ratio calculations revealed no significant differences for having an ORD or EMP score above/below their respective fatigue thresholds when comparing these conditions.
Table 41. Frequency and percentage of ORD scores above and below threshold (Circadian Rhythm versus Non-Circadian Rhythm; multiple-vehicle events and baselines).
Time of Day: ORD > 40 ORD < 40 Total
Circadian Rhythm 18 16.2% 94 23.8% 112 22.1%
Non-Circadian Rhythm 93 83.8% 301 76.2% 394 77.9% Total 111 100.0% 395 100.0% 506 100.0%
Table 42. Frequency and percentage of EMP scores above and below threshold (Circadian
Rhythm versus Non-Circadian Rhythm; multiple-vehicle events and baselines).
Time of Day: EMP > 12 EMP < 12 Total
Circadian Rhythm 10 33.3% 93 21.6% 103 22.3%
Non-Circadian Rhythm 20 66.7% 338 78.4% 358 77.7%
Total 30 100.0% 431 100.0% 461 100.0%

46
Number of Vehicles Involved
Table 43 displays the frequency and percentage of vehicles involved in crashes, tire strikes, near-crashes, and crash-relevant conflicts in the data set. Most of the safety-critical events involved two vehicles (68.9 percent). A smaller percentage was classified as V1 only (23.4 percent). Most crashes involved V1 only or V1 plus an animal (57.1 percent and 28.6 percent, respectively). All of the tire strike events involved V1 only (100 percent). Most of the near-crashes and crash-relevant conflicts involved two vehicles (53.3 percent and 72.4 percent, respectively) or V1 only (31.7 percent and 21 percent, respectively). While safety-critical events were primarily two-vehicle, note that most crashes and tire strikes involved V1 only.
Table 43. Frequency and percentage of the number of vehicles involved.
Number of Vehicles Involved: Crashes Crashes:
Tire Strike Near-
Crashes Crash-
Relevant Conflicts
Total Safety-Critical Events
1 vehicle (V1) 8 57.1% 15 100.0% 38 31.7% 224 21.0% 285 23.4% 2 vehicles 1 7.1% 0 0.0% 64 53.3% 773 72.4% 838 68.9% 3 vehicles 1 7.1% 0 0.0% 7 5.8% 54 5.1% 62 5.1% 4 vehicles 0 0.0% 0 0.0% 0 0.0% 3 0.3% 3 0.2% Subject vehicle + pedestrian 0 0.0% 0 0.0% 3 2.5% 2 0.2% 5 0.4% Subject vehicle + pedalcyclist 0 0.0% 0 0.0% 0 0.0% 1 0.1% 1 0.1% Subject vehicle + animal 4 28.6% 0 0.0% 8 6.7% 11 1.0% 23 1.9% Other 0 0.0% 0 0.0% 0 0.0% 0 0.0% 0 0.0%
Total 14 100.0% 15 100.0% 120 100.0% 1068 100.0% 1217 100.0%
Table 44 &
table 45 display the frequency and percentage of Number of Vehicles Involved (1 Vehicle versus Multiple Vehicles) which were above and below the fatigue threshold ORD and EMP scores, respectively. The single-vehicle category includes single-vehicle interactions with animals, pedestrians, and pedalcyclists. An odds ratio calculation revealed that the odds of a driver having an ORD score of 40 or higher were 1.79 times greater (LCL = 1.31, UCL = 2.44) when a single vehicle was involved. Similarly, the odds of a driver having an EMP score of 12 or higher were 2.43 times greater (LCL = 1.51, UCL = 3.90) when a single vehicle was involved.
Table 44. Frequency and percentage of ORD scores above and below threshold (single versus multiple vehicles involved).
Number of Vehicles Involved: ORD > 40 ORD < 40 Total
1 vehicle 90 35.9% 167 23.8% 257 27.0% Multiple vehicles 161 64.1% 534 76.2% 695 73.0% Total 251 100.0% 701 100.0% 952 100.0%

47
Table 45. Frequency and percentage of EMP scores above and below threshold (single versus multiple vehicles involved).
Number of Vehicles Involved:
PERC > 12 PERC < 12 Total
1 vehicle 34 42.0% 167 23.0% 201 24.9%
Multiple vehicles 47 58.0% 560 77.0% 607 75.1% Total 81 100.0% 727 100.0% 808 100.0%
Vehicle Position
Table 46 displays the frequency and percentage of Vehicle Positions. The Vehicle Position refers to the position of V2 in relation to V1 (coded during the time in which the event first created the crash risk) when another vehicle was involved. Vehicles in the adjacent left lane to V1 were coded “J”, “I”, “H”, or “G” depending on position. Vehicles in adjacent right lane to V1 were coded “B”, “C”, “D”, or “E” depending on position. Figure 15 shows a diagram of V1 with the corresponding Vehicle Position codes. Not including all the “not applicable” events, the most frequent Vehicle Positions of V2 in the safety-critical events were the front of V1 (coded “A”, 45.9 percent), the passenger-side front quarter panel of V1’s cab (coded “B”, 17.7 percent), and the driver-side front quarter panel of V1’s cab (coded “J”, 15 percent). However, a large percentage of the tire strikes (33.3 percent) occurred on the passenger-side rear quarter panel of V1’s trailer (i.e., the front set of rear tires on the trailer, coded “D”).
Table 46. Frequency and percentage of vehicle position.
Vehicle Position: Crashes Crashes: Tire Strike
Near-Crashes
Crash-Relevant Conflicts
Total Safety-Critical Events
Not applicable (single-vehicle event) 0 0.0% 0 0.0% 10 8.3% 160 15.0% 170 14.0%
A -- Front 7 50.0% 2 13.3% 43 35.8% 507 47.5% 559 45.9% B – Right Side, Front 0 0.0% 0 0.0% 25 20.8% 191 17.9% 216 17.7% C – Right Side 1 7.1% 0 0.0% 2 1.7% 18 1.7% 21 1.7% D – Right Side 0 0.0% 5 33.3% 3 2.5% 8 0.7% 16 1.3% E – Right Side, Rear 1 7.1% 2 13.3% 0 0.0% 4 0.4% 7 0.6% F -- Rear 1 7.1% 0 0.0% 0 0.0% 5 0.5% 6 0.5% G – Left Side, Rear 1 7.1% 1 6.7% 2 1.7% 3 0.3% 7 0.6% H – Left Side 1 7.1% 1 6.7% 8 6.7% 9 0.8% 19 1.6% I – Left Side 0 0.0% 0 0.0% 2 1.7% 10 0.9% 12 1.0% J – Left Side, Front 1 7.1% 4 26.7% 25 20.8% 153 14.3% 183 15.0% K -- Top 1 7.1% 0 0.0% 0 0.0% 0 0.0% 1 0.1%
Total 14 100.0% 15 100.0% 120 100.0% 1068 100.0% 1217 100.0%

48
FRONT
J (15.0%) A (45.9%) B (17.7%)
I (1.0%)
C (1.7%)
H (1.6%) D (1.3%)
G (0.6%) F (0.5%) E (0.6 %)
REAR
Figure 15. Diagram. Diagram of V1 used to indicate the relative position of V2 (percentages refer to total safety-critical events).
Table 47 & table 48 display the frequency and percentage of Vehicle Position (Front versus All Other Positions) which were above and below the fatigue threshold ORD and EMP scores, respectively. An odds ratio calculation revealed that the odds of a driver having an ORD score of 40 or higher were 1.67 times greater (LCL = 1.15, UCL = 2.41) when the Vehicle Position was in front of V1. However, the odds of a driver having an EMP score of 12 or higher were 2.04 times greater (LCL = 1.25, UCL = 3.33) when the Vehicle Position was other than the front of V1.
Table 47. Frequency and percentage of ORD scores above and below threshold (front of vehicle versus all other vehicle positions).
Vehicle Position: ORD > 40 ORD < 40 Total
Front of Vehicle (Position A) 107 66.5% 290 54.3% 397 57.1%
All other positions 54 33.5% 244 45.7% 298 42.9% Total 161 100.0% 534 100.0% 695 100.0%
Table 48. Frequency and percentage of EMP scores above and below threshold (front of vehicle versus all other vehicle positions).
Vehicle Position: EMP > 12 EMP < 12 Total
Front of Vehicle (Position A) 26 32.5% 361 49.6% 387 47.9%
All other positions 54 67.5% 367 50.4% 421 52.1% Total 80 100.0% 728 100.0% 808 100.0%
K
(0.1%)

49
Driver At Fault
Table 49 displays the distribution of Driver “Fault.” Although “fault” has a legal connotation, it is used here to indicate the vehicle/driver that was assigned the Critical Reason. In other words, the critical error precipitating the event was associated with this vehicle and/or driver. Only multi-vehicle events are presented in table 49, all single-vehicle events were excluded. There were a few events in which it was difficult to assign fault to V1 or V2, thus the event was coded as “unknown.” Further, there were some events in which both V1 and V2 were at fault, thus “no fault” was coded. As discussed earlier in the Methodology section of this report, the vehicle-based sensor suite employed in the study is better suited for detecting V1-initiated actions than V2-initiated actions, and thus there is a predominance of V1 at-fault events in this data set. This is especially true for low-severity events. When considering higher severity events, such as crashes and near-crashes, the distribution of assigned fault is split evenly between V1 and V2.
Table 49. Frequency and percentage of Driver-At-Fault designations (all events). Driver At Fault: Crashes Crash: Tire
Strike Near-Crashes Crash-Relevant Conflicts
Total Safety-Critical events
Vehicle 1 7 50.0% 6 40.0% 67 55.8% 836 78.3% 916 75.3% Vehicle 2 5 35.7% 0 0.0% 46 38.3% 208 19.5% 259 21.3% Unknown 0 0.0% 0 0.0% 0 0.0% 3 0.3% 3 0.2% No fault 2 14.3% 9 60.0% 7 5.8% 21 2.0% 39 3.2%
Total 14 100.0% 15 100.0% 120 100.0% 1068 100.0% 1217 100.0%
Table 50 & table 51 display the frequency and percentage of Driver-At-Fault events (Vehicle 1 versus Vehicle 2) which were above and below the fatigue threshold ORD and EMP scores, respectively, for all events. An odds ratio calculation revealed that the odds of a driver having an ORD score of 40 or higher were 2.08 times greater (LCL = 1.39; UCL = 3.13) when Vehicle 1 was at fault. However, an odds ratio calculation showed no significant difference in the odds of a driver having an EMP score above/below the fatigue threshold when comparing these conditions (OR = 0.63; LCL = 0.37; UCL = 1.06).
Table 50. Frequency and percentage of ORD scores above and below threshold (V1 versus V2 Fault; all events).
Fault: ORD > 40 ORD < 40 Total Vehicle 1 212 86.5% 506 75.5% 718 78.5% Vehicle 2 33 13.5% 164 24.5% 197 21.5% Total 245 100.0% 670 100.0% 915 100.0%
Table 51. Frequency and percentage of EMP scores above and below threshold (V1 versus V2 Fault; all events).
Fault: PERC > 12 PERC < 12 Total Vehicle 1 52 69.3% 551 78.3% 603 77.4% Vehicle 2 23 30.7% 153 21.7% 176 22.6% Total 75 100.0% 704 100.0% 779 100.0%

50
Table 52 shows the frequency and percentage of Driver-At-Fault designations for events involving two or more vehicles. A majority (73.1 percent) of these events had fault assigned to V1.
Table 52. Distribution of Driver-At-Fault designations for two or more vehicle events.
Driver At Fault: Crashes Crashes: Tire Strike
Near-Crashes
Crash-Relevant Conflicts
Total Safety-Critical Events
Vehicle 1 1 50.0% 0 0.0% 36 48.6% 625 75.3% 662 73.1% Vehicle 2 1 50.0% 0 0.0% 37 50.0% 197 23.7% 235 25.9% Unknown 0 0.0% 0 0.0% 0 0.0% 2 0.2% 2 0.2% No fault 0 0.0% 0 0.0% 1 1.4% 6 0.7% 7 0.8%
Total 2 100.0% 0 0.0% 74 100.0% 830 100.0% 906 100.0%
Table 53 & table 54 display the frequency and percentage of Driver-At-Fault events which were above and below the fatigue threshold ORD and EMP scores, respectively, for events involving more than two vehicles. An odds ratio calculation revealed that the odds of a driver having an ORD score of 40 or higher were 2.09 times greater (LCL = 1.30, UCL = 3.36) when V1 was at fault. However, the odds of a driver having an EMP score of 12 or higher were 2.29 times greater (LCL = 1.28, UCL = 4.11) when V2 was judged to be at fault.
Table 53. Frequency and percentage of ORD scores above and below threshold (V1 versus V2 Fault; 2+ vehicle events).
Fault: ORD > 40 ORD < 40 Total Vehicle 1 133 84.7% 392 72.6% 525 75.3% Vehicle 2 24 15.3% 148 27.4% 172 24.7% Total 157 100.0% 540 100.0% 697 100.0%
Table 54. Frequency and percentage of EMP scores above and below threshold (V1 versus
V2 Fault; 2+ Vehicle events). Fault: PERC > 12 PERC < 12 Total Vehicle 1 28 54.9% 419 73.6% 447 72.1% Vehicle 2 23 45.1% 150 26.4% 173 27.9% Total 51 100.0% 569 100.0% 620 100.0%
Driver Wearing Safety Belt
Table 55 displays the frequency and percentage of driver safety belt use per event classification, including baseline epochs and the relative frequency of safety-critical events. When safety belt use could be determined, the relative frequencies for safety-critical events were close, with safety belt use at 0.38, and non-use at 0.36.

51
Table 55. Frequency and percentage of safety belt use. Seat Belt Worn:
Crashes Crash: Tire Strike
Near-Crashes
Crash-Relevant Conflicts
Total Safety-Critical Events
Baseline Epochs
Relative Freq
Yes 6 42.9% 4 26.7% 69 57.5% 671 62.8% 750 61.6% 1236 60.2% 0.38 No 8 57.1% 11 73.3% 51 42.5% 395 37.0% 465 38.2% 814 39.6% 0.36 Unknown 0 0.0% 0 0.0% 0 0.0% 2 0.2% 2 0.2% 3 0.1% 0.67
Total 14 100.0% 15 100.0% 120 100.0% 1068 100.0% 1217 100.0% 2053 100.0%
Table 56 & table 57 display the frequency and percentage of Safety Belt Use which were above and below the fatigue threshold ORD and EMP scores, respectively. An odds ratio calculation revealed that the odds of a driver having an ORD score of 40 or higher were 1.69 times greater (LCL = 1.35, UCL = 2.11) when the driver was not wearing a safety belt. However, an odds ratio calculation showed no significant difference in the odds of a driver having an EMP score above/below the fatigue threshold when comparing safety belt use (OR = 1.08; LCL = 0.85; UCL = 1.37).
Table 56. Frequency and percentage of ORD scores above and below threshold by safety belt use.
Seat Belt Worn:
ORD > 40 ORD < 40 Total
Yes 150 28.5% 443 40.2% 593 36.4% No 377 71.5% 660 59.8% 1037 63.6% Total 527 100.0% 1103 100.0% 1630 100.0%
Table 57. Frequency and percentage of EMP scores above and below threshold by safety belt use.
Seat Belt Worn:
PERC > 12 PERC < 12 Total
Yes 193 60.1% 1247 61.9% 1440 61.6% No 128 39.9% 768 38.1% 896 38.4% Total 321 100.0% 2015 100.0% 2336 100.0%
Vision Obstructions
Table 58 shows the frequency and percentage of Vision Obstruction classifications per event classification. The majority of safety-critical events did not involve a visual obstruction. When a visual obstruction was present, it typically involved rain, snow, fog, smoke, sand, dust, or glare.

52
Table 58. Frequency and percentage of Vision Obscured.
Vision Obscured: Crashes Crashes: Tire Strike
Near-Crashes
Crash-Relevant Conflicts
Total Safety-Critical Events
No obstruction 10 71.4% 14 93.3% 111 92.5% 963 90.2% 1098 90.2% Rain, snow, fog, smoke, sand, dust 2 14.3% 0 0.0% 3 2.5% 33 3.1% 38 3.1%
Reflected glare, sunlight, headlights 2 14.3% 0 0.0% 2 1.7% 34 3.2% 38 3.1%
Curve or hill 0 0.0% 1 6.7% 0 0.0% 10 0.9% 11 0.9% Building, billboard, or other design features (includes signs, embankment)
0 0.0% 0 0.0% 0 0.0% 2 0.2% 2 0.2%
Trees, crops, vegetation 0 0.0% 0 0.0% 0 0.0% 6 0.6% 6 0.5% Moving vehicle (including load) 0 0.0% 0 0.0% 1 0.8% 5 0.5% 6 0.5%
Parked vehicle 0 0.0% 0 0.0% 2 1.7% 0 0.0% 2 0.2% Splash or spray of passing vehicle 0 0.0% 0 0.0% 0 0.0% 0 0.0% 0 0.0%
Inadequate defrost or defog system 0 0.0% 0 0.0% 0 0.0% 0 0.0% 0 0.0%
Inadequate lighting system (includes vehicle/object in dark area)
0 0.0% 0 0.0% 0 0.0% 0 0.0% 0 0.0%
Obstruction interior to vehicle 0 0.0% 0 0.0% 0 0.0% 1 0.1% 1 0.1%
Mirrors 0 0.0% 0 0.0% 0 0.0% 0 0.0% 0 0.0% Head restraints 0 0.0% 0 0.0% 0 0.0% 0 0.0% 0 0.0% Broken or improperly cleaned windshield 0 0.0% 0 0.0% 0 0.0% 3 0.3% 3 0.2%
Fog 0 0.0% 0 0.0% 0 0.0% 0 0.0% 0 0.0% Other vehicle or object in blind spot 0 0.0% 0 0.0% 1 0.8% 2 0.2% 3 0.2%
Vision obscured - no details 0 0.0% 0 0.0% 0 0.0% 0 0.0% 0 0.0%
Other 0 0.0% 0 0.0% 0 0.0% 1 0.1% 1 0.1% Unknown whether vision was obstructed 0 0.0% 0 0.0% 0 0.0% 8 0.7% 8 0.7%
Total 14 100.0% 15 100.0% 120 100.0% 1068 100.0% 1217 100.0%
Table 59 & table 60 display the frequency and percentage of Vision Obstruction-related events (No Obstruction versus Any Obstruction) which were above and below the fatigue threshold ORD and EMP scores, respectively. Odds ratio calculations revealed no significant difference in the odds of ORD scores (OR = 1.44; LCL = 0.89; UCL = 2.31) or EMP scores (OR = 1.33; LCL = 0.63; UCL = 2.78) being above/below their respective fatigue thresholds when comparing these conditions.

53
Table 59. Frequency and percentage of ORD scores above and below threshold (No Obstruction versus Any Obstruction to driver’s vision).
Vision Obscured By: ORD > 40 ORD < 40 Total
No obstruction 220 88.7% 643 91.9% 863 91.0% Any obstruction 28 11.3% 57 8.1% 85 9.0% Total 248 100.0% 700 100.0% 948 100.0%
Table 60. Frequency and percentage of EMP scores above and below threshold (No
Obstruction versus Any Obstruction to driver’s vision).
Vision Obscured By: PERC > 12 PERC < 12 Total
No obstruction 70 88.6% 660 91.2% 730 90.9% Any obstruction 9 11.4% 64 8.8% 73 9.1% Total 79 100.0% 724 100.0% 803 100.0%
Potential Distractions (V1 Only)
It should be noted that while the raw frequencies of events and baselines coded for “look at left side mirror/look out left window” were high, the relative frequency for safety-critical events for this variable was rather low (0.34). Table 61 shows the frequency and percentage of Potential Distractions per event classification, including baseline epochs and the relative frequency of safety-critical events. Data reductionists were instructed to code up to four Potential Distractions observed during the 10 s prior to the max/min trigger value or during the final 10 s of the baseline epoch. Potential Distractions were coded regardless of their apparent relevance to the event. If there are more than four Potential Distractions, data reductionists were instructed to select the ones that occurred closest in time to the trigger. As more than one Potential Distraction could be selected and percentages were based on the number of events, the column totals exceed 100 percent.
The variable codes for “look at construction zone signs, barriers, flagperson, etc.” and “look at outside person” had relative frequencies of 1.0 for safety-critical events, followed by “looked but did not see”, which had a relative frequency of 0.97. The variable codes for “dial hands-free phone”, “eat with utensil”, “brush/floss teeth”, and “remove/adjust jewelry” had the lowest relative frequencies of zero. Again, this means that instances were observed during baseline epochs but not for safety-critical events. It should be noted that while the raw frequencies of events and baselines coded for “look at left side mirror/look out left window” were high, the relative frequency for safety-critical events for this variable was rather low (0.34).

54
Table 61. Frequency and percentage of potential distractions.
Potential Distractions: Crashes Crash: Tire
Strike Near-Crashes Crash-Relevant Conflicts
Total Safety-Critical Events
Baseline Epochs
Relative Freq
None observed 1 7.1% 7 50.0% 13 13.3% 148 18.8% 169 18.5% 1905 177.7% 0.08
Looked but did not see 0 0.0% 0 0.0% 3 3.1% 31 3.9% 34 3.7% 1 0.1% 0.97
Interact with or look at other occupant(s)
0 0.0% 0 0.0% 2 2.0% 9 1.1% 11 1.2% 42 3.9% 0.21
Interact with or look at pet in vehicle
0 0.0% 0 0.0% 0 0.0% 0 0.0% 0 0.0% 0 0.0% N/A
Look at/for object in vehicle 0 0.0% 0 0.0% 9 9.2% 68 8.6% 77 8.4% 169 15.8% 0.31
Reach for object in vehicle 2 14.3% 0 0.0% 12 12.2% 93 11.8% 107 11.7% 145 13.5% 0.42
Talk/listen to hand-held phone 0 0.0% 0 0.0% 3 3.1% 27 3.4% 30 3.3% 78 7.3% 0.28
Talk/listen to hands-free phone 0 0.0% 0 0.0% 2 2.0% 26 3.3% 28 3.1% 108 10.1% 0.21
Talk/listen to CB or other device 1 7.1% 0 0.0% 1 1.0% 14 1.8% 16 1.7% 69 6.4% 0.19
Dial hand-held phone 0 0.0% 0 0.0% 1 1.0% 19 2.4% 20 2.2% 9 0.8% 0.69
Dial hands-free phone 0 0.0% 0 0.0% 0 0.0% 0 0.0% 0 0.0% 4 0.4% 0.00
Operate Personal Data Assistant (PDA) (inputting or reading)
0 0.0% 0 0.0% 0 0.0% 0 0.0% 0 0.0% 0 0.0% N/A
Adjust instrument panel (includes climate control, radio, CD)
0 0.0% 0 0.0% 0 0.0% 14 1.8% 14 1.5% 41 3.8% 0.25
Look at left-side mirror/out left-side window
7 50.0% 1 7.1% 52 53.1% 392 49.7% 452 49.4% 876 81.7% 0.34
Look at right-side mirror/out right-side window
5 35.7% 8 57.1% 37 37.8% 271 34.3% 321 35.1% 449 41.9% 0.42
Look in Sleeper Berth 1 7.1% 0 0.0% 0 0.0% 5 0.6% 6 0.7% 4 0.4% 0.60
Shift gears 0 0.0% 2 14.3% 7 7.1% 55 7.0% 64 7.0% 18 1.7% 0.78 Look down (at lap, floor, etc.) 1 7.1% 0 0.0% 24 24.5% 146 18.5% 171 18.7% 358 33.4% 0.32
Use/reach other device 0 0.0% 0 0.0% 2 2.0% 18 2.3% 20 2.2% 15 1.4% 0.57
Appears drowsy, sleepy, asleep, fatigued
3 21.4% 0 0.0% 19 19.4% 145 18.4% 167 18.3% 256 23.9% 0.39
Look at previous crash or highway incident
0 0.0% 0 0.0% 0 0.0% 0 0.0% 0 0.0% 0 0.0% N/A
Look at construction zone signs, barriers, flagperson, etc.
0 0.0% 0 0.0% 0 0.0% 2 0.3% 2 0.2% 0 0.0% 1.00
Look at outside person 0 0.0% 0 0.0% 0 0.0% 3 0.4% 3 0.3% 0 0.0% 1.00
Look at outside animal, object, store, etc.
0 0.0% 0 0.0% 2 2.0% 18 2.3% 20 2.2% 88 8.2% 0.19
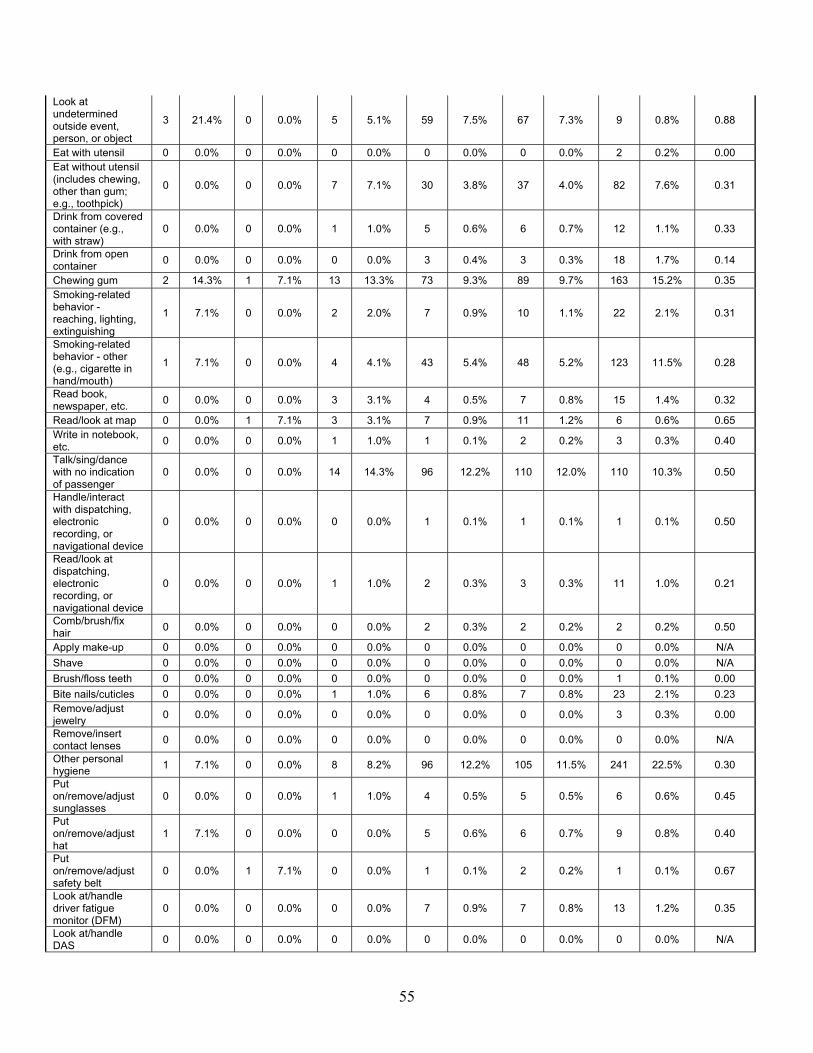
55
Look at undetermined outside event, person, or object
3 21.4% 0 0.0% 5 5.1% 59 7.5% 67 7.3% 9 0.8% 0.88
Eat with utensil 0 0.0% 0 0.0% 0 0.0% 0 0.0% 0 0.0% 2 0.2% 0.00 Eat without utensil (includes chewing, other than gum; e.g., toothpick)
0 0.0% 0 0.0% 7 7.1% 30 3.8% 37 4.0% 82 7.6% 0.31
Drink from covered container (e.g., with straw)
0 0.0% 0 0.0% 1 1.0% 5 0.6% 6 0.7% 12 1.1% 0.33
Drink from open container 0 0.0% 0 0.0% 0 0.0% 3 0.4% 3 0.3% 18 1.7% 0.14
Chewing gum 2 14.3% 1 7.1% 13 13.3% 73 9.3% 89 9.7% 163 15.2% 0.35 Smoking-related behavior - reaching, lighting, extinguishing
1 7.1% 0 0.0% 2 2.0% 7 0.9% 10 1.1% 22 2.1% 0.31
Smoking-related behavior - other (e.g., cigarette in hand/mouth)
1 7.1% 0 0.0% 4 4.1% 43 5.4% 48 5.2% 123 11.5% 0.28
Read book, newspaper, etc. 0 0.0% 0 0.0% 3 3.1% 4 0.5% 7 0.8% 15 1.4% 0.32
Read/look at map 0 0.0% 1 7.1% 3 3.1% 7 0.9% 11 1.2% 6 0.6% 0.65 Write in notebook, etc. 0 0.0% 0 0.0% 1 1.0% 1 0.1% 2 0.2% 3 0.3% 0.40
Talk/sing/dance with no indication of passenger
0 0.0% 0 0.0% 14 14.3% 96 12.2% 110 12.0% 110 10.3% 0.50
Handle/interact with dispatching, electronic recording, or navigational device
0 0.0% 0 0.0% 0 0.0% 1 0.1% 1 0.1% 1 0.1% 0.50
Read/look at dispatching, electronic recording, or navigational device
0 0.0% 0 0.0% 1 1.0% 2 0.3% 3 0.3% 11 1.0% 0.21
Comb/brush/fix hair 0 0.0% 0 0.0% 0 0.0% 2 0.3% 2 0.2% 2 0.2% 0.50
Apply make-up 0 0.0% 0 0.0% 0 0.0% 0 0.0% 0 0.0% 0 0.0% N/A Shave 0 0.0% 0 0.0% 0 0.0% 0 0.0% 0 0.0% 0 0.0% N/A Brush/floss teeth 0 0.0% 0 0.0% 0 0.0% 0 0.0% 0 0.0% 1 0.1% 0.00 Bite nails/cuticles 0 0.0% 0 0.0% 1 1.0% 6 0.8% 7 0.8% 23 2.1% 0.23 Remove/adjust jewelry 0 0.0% 0 0.0% 0 0.0% 0 0.0% 0 0.0% 3 0.3% 0.00
Remove/insert contact lenses 0 0.0% 0 0.0% 0 0.0% 0 0.0% 0 0.0% 0 0.0% N/A
Other personal hygiene 1 7.1% 0 0.0% 8 8.2% 96 12.2% 105 11.5% 241 22.5% 0.30
Put on/remove/adjust sunglasses
0 0.0% 0 0.0% 1 1.0% 4 0.5% 5 0.5% 6 0.6% 0.45
Put on/remove/adjust hat
1 7.1% 0 0.0% 0 0.0% 5 0.6% 6 0.7% 9 0.8% 0.40
Put on/remove/adjust safety belt
0 0.0% 1 7.1% 0 0.0% 1 0.1% 2 0.2% 1 0.1% 0.67
Look at/handle driver fatigue monitor (DFM)
0 0.0% 0 0.0% 0 0.0% 7 0.9% 7 0.8% 13 1.2% 0.35
Look at/handle DAS 0 0.0% 0 0.0% 0 0.0% 0 0.0% 0 0.0% 0 0.0% N/A

56
Other 0 0.0% 0 0.0% 4 4.1% 14 1.8% 18 2.0% 71 6.6% 0.20
Total 30 214.3% 21 150.0% 257 262.2% 1970 249.7% 2278 249.0% 5582 520.7%
Table 62 & table 63 display the frequency and percentage of Potential Distractions (None Observed versus Any Distraction) which were above and below the fatigue threshold ORD and EMP scores, respectively. Odds ratio calculations revealed no significant difference in the odds of ORD scores (OR = 1.10; LCL = 0.86; UCL = 1.40) or EMP scores (OR = 0.82; LCL = 0.56; UCL = 1.22) being above/below their respective fatigue thresholds when comparing these conditions.
Table 62. Frequency and percentage of ORD scores above and below threshold (No Distraction Observed versus Any Distraction).
Potential Distractions: ORD > 40 ORD < 40 Total
None observed 116 12.1% 193 11.2% 309 11.5% Any distraction 843 87.9% 1536 88.8% 2379 88.5%
Total 959 100.0% 1729 100.0% 2688 100.0%
Table 63. Frequency and percentage of EMP scores above and below threshold (No Distraction Observed versus Any Distraction).
Potential Distractions: PERC > 12 PERC < 12 Total
None observed 32 10.0% 239 11.8% 271 11.6% Any distraction 289 90.0% 1778 88.2% 2067 88.4% Total 321 100.0% 2017 100.0% 2338 100.0%
Light Condition
Table 64 displays the frequency and percentage of Light Conditions per event classification, including baseline epochs and the relative frequency of safety-critical events. The highest relative frequency for safety-critical events occurred during daylight conditions (0.45), while the lowest relative frequency was equal during dark and dawn conditions (0.21).

57
Table 64. Frequency and percentage of Light Conditions.
Light Condition: Crashes Crash: Tire
Strike Near-
Crashes Crash-
Relevant Conflicts
Total Safety-Critical Events
Baseline Epochs
Relative Freq
Daylight 10 71.4% 11 73.3% 82 68.3% 828 77.5% 931 76.5% 1139 55.5% 0.45 Dark 3 21.4% 3 20.0% 23 19.2% 165 15.4% 194 15.9% 729 35.5% 0.21 Dark but lighted 1 7.1% 1 6.7% 15 12.5% 50 4.7% 67 5.5% 114 5.6% 0.37
Dawn 0 0.0% 0 0.0% 0 0.0% 8 0.7% 8 0.7% 30 1.5% 0.21
Dusk 0 0.0% 0 0.0% 0 0.0% 17 1.6% 17 1.4% 41 2.0% 0.29 Unknown 0 0.0% 0 0.0% 0 0.0% 0 0.0% 0 0.0% 0 0.0% N/A
Total 14 100.0% 15 100.0% 120 100.0% 1068 100.0% 1217 100.0% 2053 100.0%
Table 65 & table 66 display the frequency and percentage of Light Conditions (Daylight versus Dark) which were above and below the fatigue threshold ORD and EMP scores, respectively. An odds ratio calculation revealed that the odds of a driver having an ORD score of 40 or higher were 3.89 times greater (LCL = 3.26, UCL = 4.65) when the Light Condition was Dark. The odds of a driver having an EMP score of 12 or higher were 2.14 times greater (LCL = 1.67, UCL = 2.76) when the Light Condition was Dark.
Table 65. Frequency and percentage of ORD scores above and below threshold (Daylight versus Dark).
Light Condition: ORD > 40 ORD < 40 Total
Daylight 357 43.0% 1186 74.6% 1543 63.8% Dark 473 57.0% 404 25.4% 877 36.2% Total 830 100.0% 1590 100.0% 2420 100.0%
Table 66. Frequency and percentage of EMP scores above and below threshold (Daylight
versus Dark). Light Condition: PERC > 12 PERC < 12 Total
Daylight 133 46.5% 1191 65.1% 1324 62.6% Dark 153 53.5% 639 34.9% 792 37.4% Total 286 100.0% 1830 100.0% 2116 100.0%
Table 67 & table 68 display the frequency and percentage of Light Conditions (Dark versus Dark but Lighted) which were above and below the fatigue threshold ORD and EMP scores, respectively. Odds ratio calculations revealed no significant difference in the odds of ORD scores (OR= 1.21; LCL = 0.87; UCL = 1.68) or EMP scores (OR = 1.18; LCL = 0.73; UCL = 1.89) being above/below their respective fatigue thresholds when comparing these conditions.

58
Table 67. Frequency and percentage of ORD scores above and below threshold (Dark versus Dark but Lighted).
Light Condition: ORD > 40 ORD < 40 Total
Dark 473 84.8% 404 82.1% 877 83.5% Dark but lighted 85 15.2% 88 17.9% 173 16.5%
Total 558 100.0% 492 100.0% 1050 100.0%
Table 68. Frequency and percentage of EMP scores above and below threshold (Dark versus Dark but Lighted).
Light Condition: PERC > 12 PERC < 12 Total
Dark 153 86.4% 639 84.4% 792 84.8%
Dark but lighted 24 13.6% 118 15.6% 142 15.2%
Total 177 100.0% 757 100.0% 934 100.0%
Weather Condition
Table 69 shows the frequency and percentage of Weather conditions per event classification, including baseline epochs and the relative frequency of safety-critical events. Almost all of the safety-critical events (94.6 percent) occurred when there were no adverse weather conditions. However, when taking exposure into account, the relative frequencies for sleet, snow, and rain and fog conditions were 0.50, meaning an equal number of safety-critical events and baseline epochs were found to occur in these conditions.
Table 69. Frequency and percentage of weather conditions.
Roadway Surface: Crashes Crash: Tire
Strike Near-
Crashes Crash-
Relevant Conflicts
Total Safety-Critical Events
Baseline Epochs
Relative Freq
Dry 11 78.6% 15 100.0% 110 91.7% 991 92.8% 1127 92.6% 1886 91.9% 0.37 Wet 3 21.4% 0 0.0% 10 8.3% 71 6.6% 84 6.9% 160 7.8% 0.34 Snow or slush 0 0.0% 0 0.0% 0 0.0% 4 0.4% 4 0.3% 5 0.2% 0.44
Ice 0 0.0% 0 0.0% 0 0.0% 0 0.0% 0 0.0% 0 0.0% N/A Sand, oil, dirt 0 0.0% 0 0.0% 0 0.0% 1 0.1% 1 0.1% 0 0.0% 1.00
Unknown 0 0.0% 0 0.0% 0 0.0% 1 0.1% 1 0.1% 2 0.1% 0.33
Other 0 0.0% 0 0.0% 0 0.0% 0 0.0% 0 0.0% 0 0.0% N/A Total 14 100.0% 15 100.0% 120 100.0% 1068 100.0% 1217 100.0% 2053 100.0%
Table 70 & table 71 display the frequency and percentage of Weather Conditions (No Adverse Conditions versus Any Adverse Conditions) which were above and below the fatigue threshold ORD and EMP scores, respectively. Odds ratio calculations revealed no significant difference in the odds of ORD scores (OR = 1.00; LCL = 0.74; UCL = 1.37) or EMP scores (OR = 1.05; LCL

59
= 0.66; UCL = 1.67) being above/below their respective fatigue thresholds when comparing these conditions.
Table 70. Frequency and percentage of ORD scores above and below threshold (No Adverse Weather versus Any Adverse Weather).
Weather Conditions: ORD > 40 ORD < 40 Total
No adverse conditions 892 93.0% 1606 93.0% 2498 93.0% Adverse conditions 67 7.0% 121 7.0% 188 7.0% Total 959 100.0% 1727 100.0% 2686 100.0%
Table 71. Frequency and percentage of EMP scores above and below threshold (No Adverse Weather versus Any Adverse Weather).
Weather Conditions: PERC > 12 PERC < 12 Total
No adverse conditions 299 93.1% 1871 92.9% 2170 92.9% Adverse conditions 22 6.9% 144 7.1% 166 7.1% Total 321 100.0% 2015 100.0% 2336 100.0%
Roadway Surface Condition
Table 72 shows the frequency and percentage of Roadway Surface conditions per event classification, including baseline epochs and the relative frequency of safety-critical events. While nearly all the safety-critical events (92.6 percent) and baseline epochs (91.9 percent) occurred when the roadway was dry, the highest relative frequency of safety-critical events occurred when snow/slush was present (0.44). Also, one crash-relevant conflict occurred when sand, oil, or dirt was on the roadway; however, no baseline epochs were observed occurring under these conditions.
Table 72. Frequency and percentage of Roadway Surface conditions.
Roadway Surface: Crashes Crash: Tire
Strike Near-
Crashes Crash-
Relevant Conflicts
Total Safety-Critical Events
Baseline Epochs
Relative Freq
Dry 11 78.6% 15 100.0% 110 91.7% 991 92.8% 1127 92.6% 1886 91.9% 0.37 Wet 3 21.4% 0 0.0% 10 8.3% 71 6.6% 84 6.9% 160 7.8% 0.34 Snow or slush 0 0.0% 0 0.0% 0 0.0% 4 0.4% 4 0.3% 5 0.2% 0.44
Ice 0 0.0% 0 0.0% 0 0.0% 0 0.0% 0 0.0% 0 0.0% N/A Sand, oil, dirt 0 0.0% 0 0.0% 0 0.0% 1 0.1% 1 0.1% 0 0.0% 1.00
Unknown 0 0.0% 0 0.0% 0 0.0% 1 0.1% 1 0.1% 2 0.1% 0.33
Other 0 0.0% 0 0.0% 0 0.0% 0 0.0% 0 0.0% 0 0.0% N/A Total 14 100.0% 15 100.0% 120 100.0% 1068 100.0% 1217 100.0% 2053 100.0%
Table 73 & table 74 display the frequency and percentage of Roadway Surface conditions (Dry versus Not Dry) which were above and below the fatigue threshold ORD and EMP scores,

60
respectively. Odds ratio calculations revealed no significant difference in the odds of ORD scores (OR = 1.01; LCL = 0.63; UCL = 1.59) or EMP scores (OR = 1.14; LCL = 0.74; UCL = 1.77) being above/below their respective fatigue thresholds when comparing these conditions.
Table 73. Frequency and percentage of ORD scores above and below threshold (Dry versus Not Dry Roadway Surface).
Roadway Surface: ORD > 40 ORD < 40 Total
Dry 870 96.8% 1581 96.8% 2451 96.8% Not Dry 29 3.2% 53 3.2% 82 3.2% Total 899 100.0% 1634 100.0% 2533 100.0%
Table 74. Frequency and percentage of EMP scores above and below threshold (Dry versus Not Dry Roadway Surface).
Roadway Surface: PERC > 12 PERC < 12 Total
Dry 295 92.2% 1837 91.2% 2132 91.3% Not Dry 25 7.8% 178 8.8% 203 8.7% Total 320 100.0% 2015 100.0% 2335 100.0%
Relation to Junction
Table 75 shows the frequency and percentage of Relation to Junction per event classification, including baseline epochs and the relative frequency of safety-critical events. While the greatest raw frequencies of events and baselines were found in non-junction road segments, the relative frequency for a safety-critical event was among the lowest for this variable (0.25). The highest relative frequency for safety-critical events occurred in intersection-related conditions (0.95), while the lowest relative frequency was found for parking lot conditions (0.24).

61
Table 75. Frequency and percentage of Relation to Junction.
Relation to Junction: Crashes Crash: Tire
Strike Near-
Crashes Crash-
Relevant Conflicts
Total Safety-Critical Events
Baseline Epochs
Relative Freq
Non-Junction 11 78.6% 2 13.3% 65 54.2% 544 50.9% 622 51.1% 1914 93.2% 0.25
Intersection 0 0.0% 9 60.0% 7 5.8% 66 6.2% 82 6.7% 24 1.2% 0.77
Intersection-related 1 7.1% 3 20.0% 19 15.8% 306 28.7% 329 27.0% 16 0.8% 0.95
Driveway 0 0.0% 0 0.0% 0 0.0% 2 0.2% 2 0.2% 1 0.0% 0.67
Parking lot 2 14.3% 1 6.7% 5 4.2% 2 0.2% 10 0.8% 32 1.6% 0.24
Entrance/exit ramp 0 0.0% 0 0.0% 17 14.2% 130 12.2% 147 12.1% 53 2.6% 0.74
Rail grade crossing 0 0.0% 0 0.0% 0 0.0% 5 0.5% 5 0.4% 1 0.0% 0.83
On a bridge 0 0.0% 0 0.0% 2 1.7% 0 0.0% 2 0.2% 4 0.2% 0.33 Crossover-
related 0 0.0% 0 0.0% 0 0.0% 4 0.4% 4 0.3% 1 0.0% 0.80
Other 0 0.0% 0 0.0% 5 4.2% 9 0.8% 14 1.2% 6 0.3% 0.70 Unknown 0 0.0% 0 0.0% 0 0.0% 0 0.0% 0 0.0% 1 0.0% 0.00
Total 14 100.0% 15 100.0% 120 100.0% 1068 100.0% 1217 100.0% 2053 100.0%
Table 76 & table 77 display the frequency and percentage of Relation to Junction (Non-Junction versus Intersection or Intersection-Related) which were above and below the fatigue threshold ORD and EMP scores, respectively. An odds ratio calculation revealed that the odds of a driver having an ORD score of 40 or higher were 7.33 times greater (LCL = 5.66, UCL = 9.49) when the situation was not junction-related. The odds of a driver having an EMP score of 12 or higher were 1.95 times greater (LCL = 1.26, UCL = 3.02) when the situation was not junction-related.
Table 76. Frequency and percentage of ORD scores above and below threshold (Non-Junction versus Intersection/Intersection-Related).
Relation to Junction: ORD > 40 ORD < 40 Total
Non-Junction 1092 91.2% 349 58.7% 1441 80.4% Intersection or intersection-related 105 8.8% 246 41.3% 351 19.6% Total 1197 100.0% 595 100.0% 1792 100.0%
Table 77. Frequency and percentage of EMP scores above and below threshold (Non-Junction versus Intersection/Intersection-Related).
Relation to Junction: PERC > 12 PERC < 12 Total
Non-Junction 281 92.1% 1582 85.7% 1863 86.6% Intersection or intersection-related 24 7.9% 264 14.3% 288 13.4% Total 305 100.0% 1846 100.0% 2151 100.0%

62
Table 78 & table 79 display the frequency and percentage of Relation to Junction (Intersection or Intersection-Related versus Entrance/Exit Ramp) which were above and below the fatigue threshold ORD and EMP scores, respectively. Odds ratio calculations revealed no significant difference in the odds of ORD scores (OR = 1.25; LCL = 0.82; UCL = 1.90) or EMP scores (OR = 1.03; LCL = 0.50; UCL = 2.12) being above/below their respective fatigue thresholds when comparing these conditions.
Table 78. Frequency and percentage of ORD scores above and below threshold (Intersection/Intersection-Related versus Entrance/Exit Ramp).
Relation to Junction: ORD > 40 ORD < 40 Total
Intersection or intersection-related
105 71.4% 246 66.7% 351 68.0%
Entrance/exit ramp 42 28.6% 123 33.3% 165 32.0%
Total 147 100.0% 369 100.0% 516 100.0%
Table 79. Frequency and percentage of EMP scores above and below threshold (Intersection/Intersection-Related versus Entrance/Exit Ramp)
Relation to Junction: PERC > 12 PERC < 12 Total
Intersection or intersection related
24 66.7% 264 66.0% 288 66.1%
Entrance/exit ramp 12 33.3% 136 34.0% 148 33.9%
Total 36 100.0% 400 100.0% 436 100.0%
Trafficway Flow
Table 80 displays the frequency and percentage of Trafficway Flow per event classification, including baseline epochs and the relative frequency of safety-critical events. Most of the safety-critical events occurred on a divided trafficway (63.4 percent), however, when accounting for exposure, the relative frequency was found to be only 0.30. The highest relative frequency for safety-critical events was found for trafficway flows that were not physically divided, even though the raw frequencies of events and baselines for “not physically divided (center 2-way turn lane)” were quite low.

63
Table 80. Frequency and percentage of Trafficway Flow.
Trafficway Flow: Crashes Crash: Tire
Strike Near-
Crashes Crash-
Relevant Conflicts
Total Safety-Critical Events
Baseline Epochs
Relative Freq
Not physically divided (center 2-way turn lane)
0 0.0% 1 6.7% 3 2.5% 52 4.9% 56 4.6% 29 1.4% 0.66
Not physically divided (2-way trafficway)
5 35.7% 5 33.3% 26 21.7% 299 28.0% 335 27.5% 205 10.0% 0.62
Divided 8 57.1% 4 26.7% 82 68.3% 678 63.5% 772 63.4% 1772 86.3% 0.30 One-way trafficway 1 7.1% 2 13.3% 6 5.0% 37 3.5% 46 3.8% 38 1.9% 0.55
Unknown 0 0.0% 3 20.0% 3 2.5% 2 0.2% 8 0.7% 9 0.4% 0.47 Total 14 100.0% 15 100.0% 120 100.0% 1068 100.0% 1217 100.0% 2053 100.0%
Table 81 & table 82 display the frequency and percentage of Trafficway Flow (Not Physically Divided versus Divided) which were above and below the fatigue threshold ORD and EMP scores, respectively. An odds ratio calculation revealed that the odds of a driver having an ORD score of 40 or higher were 1.28 times greater (LCL = 1.04., UCL = 1.58) when the Trafficway Flow was divided. However, an odds ratio calculation revealed no significant difference in the odds of EMP scores (OR = 1.23; LCL = 0.86; UCL = 1.77) being above/below the fatigue threshold when comparing these conditions.
Table 81. Frequency and percentage of ORD scores above and below threshold (Not Divided versus Divided Trafficway Flow).
Trafficway Flow: ORD > 40 ORD < 40 Total Not physically divided 155 16.7% 342 20.4% 497 19.1%
Divided 774 83.3% 1336 79.6% 2110 80.9% Total 929 100.0% 1678 100.0% 2607 100.0%
Table 82. Frequency and percentage of EMP scores above and below threshold (Not
Divided versus Divided Trafficway Flow). Trafficway Flow: PERC > 12 PERC < 12 Total
Not physically divided
38 12.3% 283 14.7% 321 14.4%
Divided 271 87.7% 1638 85.3% 1909 85.6% Total 309 100.0% 1921 100.0% 2230 100.0%
Number of Travel Lanes (All Roads)
Table 83 shows the frequency and percentage of Number of Travel Lanes for all road types per event classification, including baseline epochs and the relative frequency of safety-critical

64
events. While the raw frequencies were greatest for two-lane roads, the relative frequency of safety-critical events occurring on these road types was fairly low (0.26). Fifteen safety-critical events occurred on roads with six lanes, while no instances of driving on six-lane roads were observed in the baseline epochs (relative frequency of 1.0). The second highest relative frequency of safety-critical events occurred on roads with five lanes (0.72), while the lowest relative frequency occurred on roads with two lanes (0.26).
Table 83. Frequency and percentage of safety-critical events and baselines by Number of Travel Lanes (All Roads).
Travel Lanes: Crashes Crash: Tire
Strike Near-
Crashes Crash-
Relevant Conflicts
Total Safety-Critical Events
Baseline Epochs
Relative Freq
1 12 85.7% 6 40.0% 11 9.2% 34 3.2% 63 5.2% 44 2.1% 0.59 2 1 7.1% 4 26.7% 47 39.2% 458 42.9% 510 41.9% 1443 70.3% 0.26 3 0 0.0% 2 13.3% 29 24.2% 281 26.3% 312 25.6% 363 17.7% 0.46 4 0 0.0% 1 6.7% 20 16.7% 182 17.0% 203 16.7% 153 7.5% 0.57 5 0 0.0% 0 0.0% 6 5.0% 85 8.0% 91 7.5% 36 1.8% 0.72 6 0 0.0% 0 0.0% 0 0.0% 15 1.4% 15 1.2% 0 0.0% 1.00 7+ 0 0.0% 0 0.0% 2 1.7% 7 0.7% 9 0.7% 7 0.3% 0.56 Unknown 1 7.1% 2 13.3% 5 4.2% 6 0.6% 14 1.2% 7 0.3% 0.67
Total 14 100.0% 15 100.0% 120 100.0% 1068 100.0% 1217 100.0% 2053 100.0% Table 84 & table 85 display the frequency and percentage of Number of Travel Lanes (1-2 versus 3 or More) which were above and below the fatigue threshold ORD and EMP scores, respectively. An odds ratio calculation revealed that the odds of a driver having an ORD score of 40 or higher were 1.78 times greater (LCL = 1.48, UCL = 2.12) when there were 1-2 lanes. The odds of a driver having an EMP score of 12 or higher were 1.78 times greater (LCL = 1.37, UCL = 2.33) when there were 1-2 lanes.
Table 84. Frequency and percentage of ORD scores above and below threshold (1-2 Lanes versus 3 or More Lanes; All Road Types).
Travel Lanes: ORD > 40 ORD < 40 Total
1-2 625 71.5% 875 58.6% 1500 63.3% 3 or more 249 28.5% 619 41.4% 868 36.7% Total 874 100.0% 1494 100.0% 2368 100.0%
Table 85. Frequency and percentage of EMP scores above and below threshold (1-2 Lanes
versus 3 or More Lanes; All Road Types). Travel Lanes: PERC > 12 PERC < 12 Total
1-2 237 74.1% 1236 61.6% 1473 63.3% 3 or more 83 25.9% 772 38.4% 855 36.7% Total 320 100.0% 2008 100.0% 2328 100.0%

65
Number of Travel Lanes (Undivided Highway)
Table 86 shows the frequency and percentage of Number of Travel Lanes for undivided highways per event classification, including baseline epochs and the relative frequency of safety-critical events. Seven safety-critical events occurred on undivided highways with six lanes, while no instances of driving on six-lane roads were observed in the baseline epochs (relative frequency of 1.0). The next highest relative frequency for undivided highway safety-critical events occurred on roads with three lanes (0.80). Four baseline epochs were observed on undivided highways with seven or more lanes; however, no safety-critical events occurred under these conditions (relative frequency of zero). The next lowest relative frequency for safety-critical events occurring on undivided highways occurred on single-lane roads (0.08).
Table 86. Frequency and percentage of Number of Travel Lanes (undivided highways).
Travel Lanes: Crashes Crash: Tire
Strike Near-
Crashes Crash-
Relevant Conflicts
Total Safety-Critical Events
Baseline Epochs
Relative Freq
1 0 0.0% 0 0.0% 0 0.0% 1 0.3% 1 0.3% 11 4.7% 0.08
2 4 80.0% 4 44.4% 19 57.6% 212 60.4% 239 60.1% 171 73.1% 0.58 3 0 0.0% 0 0.0% 6 18.2% 55 15.7% 61 15.3% 15 6.4% 0.80
4 0 0.0% 1 11.1% 0 0.0% 31 8.8% 32 8.0% 15 6.4% 0.68
5 0 0.0% 0 0.0% 3 9.1% 43 12.3% 46 11.6% 17 7.3% 0.73 6 0 0.0% 0 0.0% 0 0.0% 7 2.0% 7 1.8% 0 0.0% 1.00 7+ 0 0.0% 0 0.0% 0 0.0% 0 0.0% 0 0.0% 4 1.7% 0.00 Unknown 1 20.0% 4 44.4% 5 15.2% 2 0.6% 12 3.0% 1 0.4% 0.92
Total 5 100.0% 9 100.0% 33 100.0% 351 100.0% 398 100.0% 234 100.0%
Table 87 & table 88 display the frequency and percentage of Number of Travel Lanes (1-2 versus 3 or More) which were above and below the fatigue threshold ORD and EMP scores, respectively, for undivided highways only. An odds ratio calculation revealed that the odds of a driver having an ORD score of 40 or higher were 1.58 times greater (LCL = 1.02, UCL = 2.45) when there were 1-2 lanes. However, there was no significant difference in the odds of a driver having an ORD score above/below the fatigue threshold under these conditions (OR = 0.63; LCL = 0.24; UCL = 1.65).
Table 87. Frequency and percentage of ORD scores above and below threshold (1-2 Lanes versus 3 or More Lanes; undivided highways).
Travel Lanes: ORD > 40 ORD < 40 Total
1-2 118 76.6% 228 67.5% 346 70.3% 3 or more 36 23.4% 110 32.5% 146 29.7% Total 154 100.0% 338 100.0% 492 100.0%

66
Table 88. Frequency and percentage of EMP scores above and below threshold (1-2 Lanes versus 3 or More Lanes; undivided highways).
Travel Lanes: PERC > 12 PERC < 12 Total
1-2 31 83.8% 214 89.2% 245 88.4% 3 or more 6 16.2% 26 10.8% 32 11.6% Total 37 100.0% 240 100.0% 277 100.0%
Number of Travel Lanes (Divided Highway and One-Way Traffic)
Table 89 shows the frequency and percentage of Number of Travel Lanes for divided highways and one-way traffic roads per event classification, including baseline epochs and the relative frequency of safety-critical events. Eight safety-critical events occurred on these roadways with six lanes, while no instances of driving on six-lane roads were observed in the baseline epochs (relative frequency of 1.0). The second highest relative frequency of safety-critical events occurred on roads with seven or more lanes (0.75), while the lowest relative frequency occurred on roads with two lanes (0.19).
Table 89. Frequency and percentage of Number of Travel Lanes (divided highway and one-way traffic).
Travel Lanes: Crashes Crash: Tire
Strike Near-
Crashes Crash-
Relevant Conflicts
Total Safety-Critical Events
Baseline Epochs
Relative Freq
1 0 0.0% 4 66.7% 4 4.6% 33 4.6% 41 5.0% 30 1.6% 0.58 2 8 88.9% 0 0.0% 35 40.2% 246 34.3% 289 35.3% 1272 69.9% 0.19
3 1 11.1% 2 33.3% 23 26.4% 226 31.5% 252 30.8% 348 19.1% 0.42 4 0 0.0% 0 0.0% 20 23.0% 151 21.1% 171 20.9% 138 7.6% 0.55 5 0 0.0% 0 0.0% 3 3.4% 42 5.9% 45 5.5% 19 1.0% 0.70 6 0 0.0% 0 0.0% 0 0.0% 8 1.1% 8 1.0% 0 0.0% 1.00 7+ 0 0.0% 0 0.0% 2 2.3% 7 1.0% 9 1.1% 3 0.2% 0.75 Unknown 0 0.0% 0 0.0% 0 0.0% 4 0.6% 4 0.5% 9 0.5% 0.31
Total 9 100.0% 6 100.0% 87 100.0% 717 100.0% 819 100.0% 1819 100.0% Table 90 & table 91 display the frequency and percentage of Number of Travel Lanes (1-2 versus 3 or More) which were above and below the fatigue threshold ORD and EMP scores, respectively, for divided highways and one-way traffic only. An odds ratio calculation revealed that the odds of a driver having an ORD score of 40 or higher were 1.87 times greater (LCL = 1.54, UCL = 2.28) when there were 1-2 lanes. However, the odds of a driver having an EMP score of 12 or higher were 1.83 times greater (LCL = 1.38, UCL = 2.43) when there were three or more lanes.

67
Table 90. Frequency and percentage of ORD scores above and below threshold (1-2 Lanes versus 3 or More Lanes; divided highway and one-way traffic). Travel Lanes: ORD > 40 ORD < 40 Total
1-2 507 70.4% 647 56.0% 1154 61.5% 3 or more 213 29.6% 509 44.0% 722 38.5% Total 720 100.0% 1156 100.0% 1876 100.0%
Table 91. Frequency and percentage of EMP scores above and below threshold (1-2 Lanes
versus 3 or More Lanes; divided highway and one-way traffic). Travel Lanes: PERC > 12 PERC < 12 Total
1-2 205 73.5% 1012 60.2% 1217 62.1% 3 or more 74 26.5% 668 39.8% 742 37.9% Total 279 100.0% 1680 100.0% 1959 100.0%
Roadway Alignment
Table 92 shows the frequency and percentage of Roadway Alignment per event classification, including baseline epochs and the relative frequency of safety-critical events. Over 90 percent of both safety-critical events and baseline epochs occurred on a straight roadway. However, the highest relative frequency for safety-critical events on these roadways was found for roads curving to the right (0.43).
Table 92. Frequency and percentage of Roadway Alignment.
Roadway Alignment: Crashes Crash: Tire
Strike Near-
Crashes Crash-
Relevant Conflicts
Total Safety-Critical Events
Baseline Epochs
Relative Freq
Straight 12 85.7% 10 66.7% 109 90.8% 982 91.9% 1113 91.5% 1876 91.4% 0.37 Curve right 1 7.1% 3 20.0% 6 5.0% 55 5.1% 65 5.3% 87 4.2% 0.43 Curve left 1 7.1% 1 6.7% 5 4.2% 31 2.9% 38 3.1% 79 3.8% 0.32 Unknown 0 0.0% 1 6.7% 0 0.0% 0 0.0% 1 0.1% 11 0.5% 0.08
Total 14 100.0% 15 100.0% 120 100.0% 1068 100.0% 1217 100.0% 2053 100.0% Table 93 & table 94 display the frequency and percentage of Roadway Alignment (Straight versus Curved) which were above and below the fatigue threshold ORD and EMP scores, respectively. Odds ratio calculations revealed no significant difference in the odds of ORD scores (OR = 1.10; LCL = 0.82; UCL = 1.49) or EMP scores (OR = 0.68; LCL = 0.46; UCL = 1.01) being above/below their respective fatigue thresholds when comparing these conditions.

68
Table 93. Frequency and percentage of ORD scores above and below threshold (Straight versus Curved Roadway Alignment).
Roadway Alignment: ORD > 40 ORD < 40 Total
Straight 913 92.7% 1584 92.0% 2497 92.2% Curved 72 7.3% 138 8.0% 210 7.8% Total 985 100.0% 1722 100.0% 2707 100.0%
Table 94. Frequency and percentage of EMP scores above and below threshold (Straight versus Curved Roadway Alignment).
Roadway Alignment: PERC > 12 PERC < 12 Total
Straight 288 89.7% 1869 92.8% 2157 92.3% Curved 33 10.3% 146 7.2% 179 7.7% Total 321 100.0% 2015 100.0% 2336 100.0%
Roadway Profile
Table 95 displays the frequency and percentage of Roadway Profiles per event classification, including baseline epochs and the relative frequency of safety-critical events. A majority of both safety-critical events and baseline epochs occurred on a level roadway profile when considering raw frequencies (94.2 and 95.6 percent, respectively). However, the highest relative frequency for safety-critical events occurred on roadways with an upward grade (0.57). Sagging roadway profiles were observed in three baseline epochs, however, none of these roadways were observed for safety-critical events (relative frequency of zero). The next lowest relative frequency was found for roads with a downward grade (0.26).
Table 95. Frequency and percentage of Roadway Profiles.
Roadway Profile: Crashes Crash: Tire
Strike Near-
Crashes Crash-
Relevant Conflicts
Total Safety-Critical Events
Baseline Epochs
Relative Freq
Level 14 100.0% 13 86.7% 119 99.2% 1000 93.6% 1146 94.2% 1962 95.6% 0.37 Grade up 0 0.0% 1 6.7% 1 0.8% 53 5.0% 55 4.5% 42 2.0% 0.57 Grade down 0 0.0% 1 6.7% 0 0.0% 15 1.4% 16 1.3% 45 2.2% 0.26 Hillcrest 0 0.0% 0 0.0% 0 0.0% 0 0.0% 0 0.0% 0 0.0% N/A Sag 0 0.0% 0 0.0% 0 0.0% 0 0.0% 0 0.0% 3 0.1% 0.00 Unknown 0 0.0% 0 0.0% 0 0.0% 0 0.0% 0 0.0% 1 0.0% 0.00
Total 14 100.0% 15 100.0% 120 100.0% 1068 100.0% 1217 100.0% 2053 100.0%
Table 96 & table 97 display the frequency and percentage of Roadway Profiles (Level versus Graded) which were above and below the fatigue threshold ORD and EMP scores, respectively. An odds ratio calculation revealed that the odds of a driver having an ORD score of 40 or higher were 2.66 times greater (LCL = 1.84, UCL = 3.84) when the roadway was level. However, an odds ratio calculation revealed no significant difference in the odds of EMP scores being above/below the fatigue threshold when comparing these conditions (OR = 0.64; LCL = 0.39; UCL = 1.04).

69
Table 96. Frequency and percentage of ORD scores above and below threshold (Level versus Graded Roadway Profile).
Roadway Profile: ORD > 40 ORD < 40 Total
Level 924 96.3% 1642 90.6% 2566 92.6% Grade up/down 36 3.8% 170 9.4% 206 7.4% Total 960 100.0% 1812 100.0% 2772 100.0%
Table 97. Frequency and percentage of EMP scores above and below threshold (Level
versus Graded Roadway Profile). Roadway Profile: PERC > 12 PERC < 12 Total
Level 300 93.5% 1928 95.7% 2228 95.4% Grade up/down 21 6.5% 86 4.3% 107 4.6% Total 321 100.0% 2014 100.0% 2335 100.0%
Traffic Density
Table 98 shows the frequency and percentage of Traffic Density per event classification, including baseline epochs and the relative frequency of safety-critical events. The definition for each level of service (LOS) can be viewed in appendix A. The Traffic Density is listed in increasing order from LOS A to LOS F. Four safety-critical events were observed in LOS F conditions, while none were observed in baseline epochs (relative frequency of 1.0). The second highest relative frequency for safety-critical events was found for LOS D (0.82), while the lowest relative frequency was found for LOS A (0.30), despite the fact that the raw frequencies of events and baselines for this code were quite high.
Table 98. Frequency and percentage of Traffic Density.
Traffic Density: Crashes Crash: Tire
Strike Near-
Crashes Crash-
Relevant Conflicts
Total Safety-Critical Events
Baseline Epochs
Relative Freq
LOS A 13 92.9% 10 66.7% 66 55.0% 567 53.1% 656 53.9% 1533 74.7% 0.30 LOS B 1 7.1% 1 6.7% 27 22.5% 306 28.7% 335 27.5% 454 22.1% 0.42 LOS C 0 0.0% 4 26.7% 20 16.7% 132 12.4% 156 12.8% 47 2.3% 0.77 LOS D 0 0.0% 0 0.0% 2 1.7% 43 4.0% 45 3.7% 10 0.5% 0.82 LOS E 0 0.0% 0 0.0% 3 2.5% 17 1.6% 20 1.6% 6 0.3% 0.77 LOS F 0 0.0% 0 0.0% 2 1.7% 2 0.2% 4 0.3% 0 0.0% 1.00 Unknown 0 0.0% 0 0.0% 0 0.0% 1 0.1% 1 0.1% 3 0.1% 0.25
Total 14 100.0% 15 100.0% 120 100.0% 1068 100.0% 1217 100.0% 2053 100.0%
Table 99 & table 100 display the frequency and percentage of Traffic Density (LOS A or B versus LOS C-F) which were above and below the fatigue threshold ORD and EMP scores, respectively. An odds ratio calculation revealed that the odds of a driver having an ORD score of 40 or higher were 2.44 times greater (LCL = 1.73, UCL = 3.43) when the traffic density was in the lower condition (LOS A or B). However, an odds ratio calculation revealed no significant difference in the odds of EMP scores being above/below the fatigue threshold when comparing these conditions (OR = 1.66; LCL = 0.99; UCL = 2.77).

70
Table 99. Frequency and percentage of ORD scores above and below threshold (LOS A or B versus LOS C-F Traffic Density).
Traffic Density: ORD > 40 ORD < 40 Total
LOS A & B 916 95.5% 1548 89.7% 2464 91.8% LOS C-F 43 4.5% 177 10.3% 220 8.2% Total 959 100.0% 1725 100.0% 2684 100.0%
Table 100. Frequency and percentage of EMP scores above and below threshold (LOS A or B versus LOS C-F Traffic Density).
Traffic Density: PERC > 12 PERC < 12 Total
LOS A & B 304 94.7% 1843 91.5% 2147 91.9%
LOS C-F 17 5.3% 171 8.5% 188 8.1% Total 321 100.0% 2014 100.0% 2335 100.0%
Construction Zone-Related
Table 101 shows the frequency and percentage of Construction Zone codes per event classification, including baseline epochs and the relative frequency of safety-critical events. While most of the safety-critical events and baseline epochs occurred in a non-construction zone (93.9 percent and 99.1 percent, respectively), this represented the lowest relative frequency for safety-critical events (0.36). The highest relative frequency was found for construction-zone-related conditions (0.86).
Table 101. Frequency and percentage of Construction-Zone-Related events.
Construction Zone: Crashes Crash: Tire
Strike Near-
Crashes Crash-
Relevant Conflicts
Total Safety-Critical Events
Baseline Epochs
Relative Freq
Not construction zone-related 11 78.6% 14 93.3% 106 88.3% 1012 94.8% 1143 93.9% 2034 99.1% 0.36 Construction zone 3 21.4% 1 6.7% 9 7.5% 41 3.8% 54 4.4% 15 0.7% 0.78 Construction zone -related 0 0.0% 0 0.0% 4 3.3% 14 1.3% 18 1.5% 3 0.1% 0.86
Unknown 0 0.0% 0 0.0% 1 0.8% 1 0.1% 2 0.2% 1 0.0% 0.67 Total 14 100.0% 15 100.0% 120 100.0% 1068 100.0% 1217 100.0% 2053 100.0%
Table 102 & table 103 display the frequency and percentage of Construction Zone Relation (Not Construction Zone-Related versus Construction Zone-Related) which were above and below the fatigue threshold ORD and EMP scores, respectively. Odds ratio calculations revealed no significant difference in the odds of ORD scores (OR = 1.16; LCL = 0.71; UCL = 1.90) or EMP scores (OR = 2.50; LCL = 0.90; UCL = 6.92) being above/below their respective fatigue thresholds when comparing these conditions.

71
Table 102. Frequency and percentage of ORD scores above and below threshold (Not Construction Zone versus Construction Zone-Related).
Construction Zone: ORD > 40 ORD < 40 Total
Not construction zone-related 934 97.5% 1677 97.1% 2611 97.2%
Construction zone or construction zone-related
24 2.5% 50 2.9% 74 2.8%
Total 958 100.0% 1727 100.0% 2685 100.0%
Table 103. Frequency and percentage of EMP scores above and below threshold (Not Construction Zone versus Construction Zone-Related).
Construction Zone: PERC > 12 PERC < 12 Total
Not construction zone-related 315 98.7% 1954 96.9% 2269 97.2%
Construction zone or construction zone-related
4 1.3% 62 3.1% 66 2.8%
Total 319 100.0% 2016 100.0% 2335 100.0%
Pre-Event Speed (All Events)
Table 104 shows the frequency and percentage of Pre-Event Speed for all events per event classification, including baseline epochs and the relative frequency of safety-critical events. The Pre-Event Speed was coded for the period just prior to the occurrence of the safety-critical event and/or just prior to any avoidance maneuver for V1. For example, when braking was involved, the Pre-Event Speed was the speed just prior to the beginning of braking for V1. For baseline epochs, data reductionists coded the speed at the end of the 60-second baseline interval. While the raw frequencies of events and baselines are greatest for the 51-60 mi/h category, this had a somewhat low relative frequency of safety-critical events (0.28). The highest relative frequency of safety-critical events was found for speeds of 31-40 mi/h (0.69), followed closely by speeds of 0-30 mi/h (0.68). The lowest relative frequency occurred when the pre-event speed was 70+ mi/h (0.12), followed closely by pre-event speeds of 61-70 mi/h (0.13).
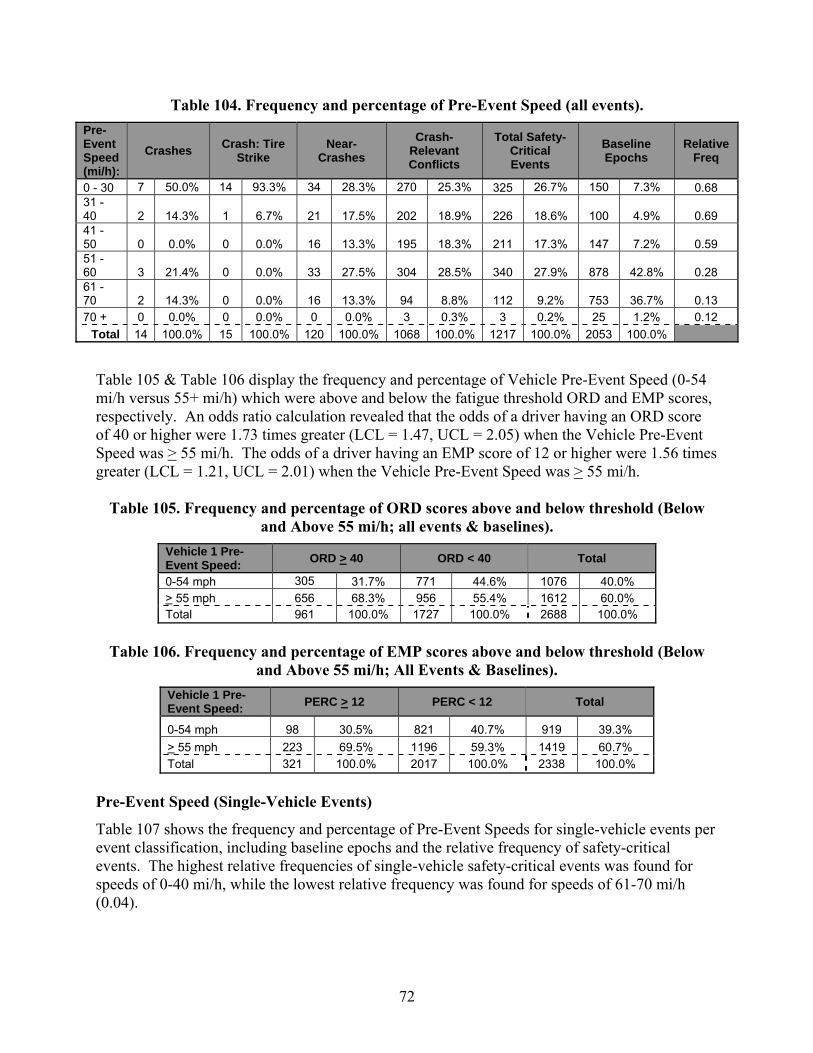
72
Table 104. Frequency and percentage of Pre-Event Speed (all events). Pre-Event Speed (mi/h):
Crashes Crash: Tire Strike
Near-Crashes
Crash-Relevant Conflicts
Total Safety-Critical Events
Baseline Epochs
Relative Freq
0 - 30 7 50.0% 14 93.3% 34 28.3% 270 25.3% 325 26.7% 150 7.3% 0.68 31 - 40 2 14.3% 1 6.7% 21 17.5% 202 18.9% 226 18.6% 100 4.9% 0.69 41 - 50 0 0.0% 0 0.0% 16 13.3% 195 18.3% 211 17.3% 147 7.2% 0.59 51 - 60 3 21.4% 0 0.0% 33 27.5% 304 28.5% 340 27.9% 878 42.8% 0.28 61 - 70 2 14.3% 0 0.0% 16 13.3% 94 8.8% 112 9.2% 753 36.7% 0.13 70 + 0 0.0% 0 0.0% 0 0.0% 3 0.3% 3 0.2% 25 1.2% 0.12
Total 14 100.0% 15 100.0% 120 100.0% 1068 100.0% 1217 100.0% 2053 100.0%
Table 105 & Table 106 display the frequency and percentage of Vehicle Pre-Event Speed (0-54 mi/h versus 55+ mi/h) which were above and below the fatigue threshold ORD and EMP scores, respectively. An odds ratio calculation revealed that the odds of a driver having an ORD score of 40 or higher were 1.73 times greater (LCL = 1.47, UCL = 2.05) when the Vehicle Pre-Event Speed was > 55 mi/h. The odds of a driver having an EMP score of 12 or higher were 1.56 times greater (LCL = 1.21, UCL = 2.01) when the Vehicle Pre-Event Speed was > 55 mi/h.
Table 105. Frequency and percentage of ORD scores above and below threshold (Below and Above 55 mi/h; all events & baselines).
Vehicle 1 Pre-Event Speed: ORD > 40 ORD < 40 Total
0-54 mph 305 31.7% 771 44.6% 1076 40.0% > 55 mph 656 68.3% 956 55.4% 1612 60.0% Total 961 100.0% 1727 100.0% 2688 100.0%
Table 106. Frequency and percentage of EMP scores above and below threshold (Below
and Above 55 mi/h; All Events & Baselines). Vehicle 1 Pre-Event Speed: PERC > 12 PERC < 12 Total
0-54 mph 98 30.5% 821 40.7% 919 39.3% > 55 mph 223 69.5% 1196 59.3% 1419 60.7% Total 321 100.0% 2017 100.0% 2338 100.0%
Pre-Event Speed (Single-Vehicle Events)
Table 107 shows the frequency and percentage of Pre-Event Speeds for single-vehicle events per event classification, including baseline epochs and the relative frequency of safety-critical events. The highest relative frequencies of single-vehicle safety-critical events was found for speeds of 0-40 mi/h, while the lowest relative frequency was found for speeds of 61-70 mi/h (0.04).

73
Table 107. Frequency and percentage of Pre-Event Speed (single-vehicle events & baselines).
Pre-Event Speed (mi/h):
Crashes Crash: Tire Strike
Near-Crashes
Crash-Relevant Conflicts
Total Safety-Critical Events
Baseline Epochs
Relative Freq
0 - 30 6 50.0% 14 93.3% 11 23.9% 46 19.5% 77 24.9% 150 7.3% 0.34 31 - 40 1 8.3% 1 6.7% 6 13.0% 46 19.5% 54 17.5% 100 4.9% 0.35 41 - 50 0 0.0% 0 0.0% 9 19.6% 48 20.3% 57 18.4% 147 7.2% 0.28 51 - 60 3 25.0% 0 0.0% 13 28.3% 73 30.9% 89 28.8% 878 42.8% 0.09 61 - 70 2 16.7% 0 0.0% 7 15.2% 21 8.9% 30 9.7% 753 36.7% 0.04
70 + 0 0.0% 0 0.0% 0 0.0% 2 0.8% 2 0.6% 25 1.2% 0.07 Total 12 100.0% 15 100.0% 46 100.0% 236 100.0% 309 100.0% 2053 100.0%
Table 108 & table 109 display the frequency and percentage of Vehicle Pre-Event Speed (0-54 mi/h versus 55+ mi/h) which were above and below the fatigue threshold ORD and EMP scores, respectively, for single-vehicle events and baselines only. An odds ratio calculation revealed that the odds of a driver having an ORD score of 40 or higher were 1.38 times greater (LCL = 1.13, UCL = 1.69) when the Vehicle Pre-Event Speed was > 55 mi/h. The odds of a driver having an EMP score of 12 or higher were 1.58 times greater (LCL = 1.19, UCL = 2.08) when the Vehicle Pre-Event Speed was > 55 mi/h.
Table 108. Frequency and percentage of ORD scores above and below threshold (below and above 55 mi/h; single-vehicle events & baselines).
Vehicle 1 Pre-Event Speed: OR > 40 OR < 40 Total
0-54 mph 204 25.5% 382 32.1% 586 29.4%
> 55 mph 597 74.5% 809 67.9% 1406 70.6% Total 801 100.0% 1191 100.0% 1992 100.0%
Table 109. Frequency and percentage of EMP scores above and below threshold (below
and above 55 mi/h; single-vehicle events & baselines). Vehicle 1 Pre-Event Speed: PERC > 12 PERC < 12 Total
0-54 mph 83 30.9% 570 87.3% 653 39.6% > 55 mph 186 69.1% 811 81.3% 997 60.4% Total 269 100.0% 1381 168.6% 1650 100.0%
Pre-Event Speed (Multiple-Vehicle Events)
Table 110 shows the frequency and percentage of Pre-Event Speed for multi-vehicle events per event classification, including baseline epochs and the relative frequency of safety-critical events. The highest relative frequencies of multiple-vehicle safety-critical events were found for

74
speeds of 0-40 mi/h, while the lowest relative frequency was found for speeds of 70+ mi/h (0.04).
Table 110. Frequency and percentage of Pre-Event Speed (multiple-vehicle events & baselines).
Pre-Event Speed (mi/h):
Crashes Crash:
Tire Strike
Near-Crashes Crash-
Relevant Conflicts
Total Safety-Critical Events
Baseline Epochs
Relative Freq
0 - 30 1 50.0% 0 0.0% 23 31.1% 225 27.0% 249 27.4% 150 7.3% 0.62 31 - 40 1 50.0% 0 0.0% 15 20.3% 156 18.8% 172 18.9% 100 4.9% 0.63 41 - 50 0 0.0% 0 0.0% 7 9.5% 146 17.5% 153 16.9% 147 7.2% 0.51 51 - 60 0 0.0% 0 0.0% 22 29.7% 231 27.8% 253 27.9% 878 42.8% 0.22 61 - 70 0 0.0% 0 0.0% 7 9.5% 73 8.8% 80 8.8% 753 36.7% 0.10 70 + 0 0.0% 0 0.0% 0 0.0% 1 0.1% 1 0.1% 25 1.2% 0.04
Total 2 100.0% 0 0.0% 74 100.0% 832 100.0% 908 100.0% 2053 100.0%
Table 111 & table 112 display the frequency and percentage of Vehicle Pre-Event Speed (0-54 mi/h versus >55 mi/h) which were above and below the fatigue threshold ORD and EMP scores, respectively, for multiple-vehicle events and baselines only. An odds ratio calculation revealed that the odds of a driver having an ORD score of 40 or higher were 1.43 times greater (LCL = 1.04, UCL = 1.97) when the Vehicle Pre-Event Speed was > 55 mi/h. However, an odds ratio calculation revealed no significant difference in the odds of EMP scores being above the fatigue threshold when comparing these conditions (OR = 1.34; LCL = 0.73; UCL = 2.46).
Table 111. Frequency and percentage of ORD scores above and below threshold (below and above 55 mi/h; multiple-vehicle events & baselines).
Vehicle 1 Pre-Event Speed: OR > 40 OR < 40 Total
0-54 mph 87 37.3% 239 46.1% 326 43.4%
> 55 mph 146 62.7% 280 53.9% 426 56.6% Total 233 100.0% 519 100.0% 752 100.0%
Table 112. Frequency and percentage of EMP scores above and below threshold (below
and above 55 mi/h; multiple-vehicle events & baselines). Vehicle 1 Pre-Event Speed: PERC > 12 PERC < 12 Total
0-54 mph 17 34.0% 260 40.9% 277 40.4%
> 55 mph 33 66.0% 376 59.1% 409 59.6%
Total 50 100.0% 636 100.0% 686 100.0%

75
Summary of Results
Below is a summary of the fatigue/drowsiness relevant results from this study.
• Observer Rating of Drowsiness Summary: Drivers were above the ORD fatigue threshold (> 40) in 26.4 percent of all the safety-critical events identified in this research. Drivers were above the ORD fatigue threshold in 22.3 percent of the most severe of these safety-critical events (i.e., crashes/near-crashes; n = 112). Odds ratio calculations indicated that the estimated relative risk of being involved in a safety-critical event, when compared to baseline epochs, was 1.93 times greater (LCL = 1.63; UCL = 2.30) when the ORD rating was below the fatigue threshold (i.e., a rating of less than 40).
• EMP Summary: Drivers were above the EMP fatigue threshold (> 12 percent) in 9.9
percent of all the safety-critical events identified. Drivers were above the EMP fatigue threshold in 16.5 percent of the most severe of these safety-critical events (i.e., crashes/near-crashes; n = 97). Odds ratio calculations indicated that the estimated relative risk of being involved in a safety-critical event, when compared to baseline epochs, was 1.70 times greater (LCL = 1.30; UCL = 2.23) when the EMP rating was below the fatigue threshold (i.e., a score of less than 12 percent).
• DDWS FOT Condition: The data for this project were leveraged from an on-road evaluation of a DDWS. Drivers were assigned to the experimental group, which received audible warnings when the technology believed they were becoming drowsy, and the control group, which received no such warning. Perhaps counterintuitively, the odds of a driver in the experimental condition being scored over the fatigue threshold were 1.45 times greater for ORD (LCL = 1.19; UCL = 1.78) and 1.62 times greater for EMP (LCL = 1.17; UCL = 2.25) when compared to control drivers.
• Day of Week: When dividing the week into early week (Monday-Wednesday) and late week (Thursday – Sunday), odds ratio calculations revealed no significant differences for having an ORD (OR= 1.13; LCL = 0.93; UCL = 1.36) or EMP (OR = 1.15; LCL = 0.86; UCL = 1.53) score above/below their respective fatigue thresholds when comparing these conditions.
• Time of Day: Odds ratio calculations revealed no significant differences for having an ORD score (OR = 1.01; LCL = 0.86; UCL = 1.18) or EMP score (OR = 1.0; LCL = 0.79; UCL = 1.27) above/below their respective fatigue thresholds when comparing a.m. versus p.m. driving. There were also no significant differences for drivers having an ORD (OR = 1.13; LCL = 0.92; UCL = 1.39) or EMP score (OR = 1.14; LCL = 0.83; UCL = 1.55) above/below their respective fatigue thresholds when comparing typical circadian rhythm timeframes with non-circadian rhythm timeframes.
• Number of Vehicles Involved: An odds ratio calculation revealed that the odds of a driver having an ORD score of 40 or higher were 1.79 times greater (LCL = 1.31, UCL = 2.44) when a single vehicle was involved. Similarly, the odds of a driver having an EMP score of 12 or higher were 2.43 times greater (LCL = 1.51, UCL = 3.90) when a single vehicle was involved.

76
• Vehicle 2 Position: There was some discrepancy between the fatigue measures when examining the position of V2 relative to V1 for multiple-vehicle events. An odds ratio calculation revealed that the odds of a driver having an ORD score of 40 or higher were 1.67 times greater (LCL = 1.15, UCL = 2.41) when the Vehicle Position was in front of V1. However, the odds of a driver having an EMP score of 12 or higher were 2.04 times greater (LCL = 1.25, UCL = 3.33) when the Vehicle Position was other than the front of V1.
• Fault: An odds ratio calculation revealed that the odds of a driver having an ORD score of 40 or higher were 2.08 times greater (LCL = 1.39; UCL = 3.13) when Vehicle 1 was at fault. However, an odds ratio calculation showed no significant difference in the odds of a driver having an EMP score being above/below the fatigue threshold when comparing these conditions (OR = 0.63; LCL = 0.37; UCL = 1.06).
• Safety Belt Use: An odds ratio calculation revealed that the odds of a driver having an ORD score of 40 or higher were 1.69 times greater (LCL = 1.35, UCL = 2.11) when the driver was not wearing a safety belt. However, an odds ratio calculation showed no significant difference in the odds of a driver having an EMP score above/below the fatigue threshold when comparing safety belt use (OR = 1.08; LCL = 0.85; UCL = 1.37).
• Vision Obstructions: Comparisons were made between when data reductionists noted any obstruction to the driver’s vision (e.g., glare) and when no obstruction was noted. Odds ratio calculations revealed no significant difference in the odds of ORD scores (OR = 1.44; LCL = 0.89; UCL = 2.31) or EMP scores (OR = 1.33; LCL = 0.63; UCL = 2.78) being above/below their respective fatigue thresholds when comparing these conditions.
• Potential Distractions: Comparisons were made between when data reductionists noted any potential distractions to the driver (e.g., cell phone use) and when no such distractions were noted. Odds ratio calculations revealed no significant difference in the odds of ORD scores (OR = 1.10; LCL = 0.86; UCL = 1.40) or EMP scores (OR = 0.82; LCL = 0.56; UCL = 1.22) being above/below their respective fatigue thresholds when comparing these conditions.
• Light Condition: An odds ratio calculation revealed that the odds of a driver having an ORD score of 40 or higher were 3.89 times greater (LCL = 3.26; UCL = 4.65) when the light condition was dark, as opposed to daylight. Likewise, the odds of a driver having an EMP score of 12 or higher were 2.14 times greater (LCL = 1.67; UCL = 2.76) when the light condition was dark as opposed to daylight. However, when comparisons were made between dark versus dark but lighted conditions, no significant odds ratio differences were found for ORD scores (OR= 1.21; LCL = 0.87; UCL = 1.68) or EMP scores (OR = 1.18; LCL = 0.73; UCL = 1.89) being above/below their respective fatigue thresholds.
• Weather: Odds ratio comparisons revealed no significant differences in fatigue above/below threshold for ORD scores (OR = 1.00; LCL = 0.74; UCL = 1.37) or EMP scores (OR = 1.05; LCL = 0.66; UCL = 1.67) when comparing situations where no

77
adverse weather conditions were present to situations where any adverse weather conditions were present.
• Roadway Surface Conditions: Odds ratio comparisons revealed no significant differences in fatigue above/below threshold for ORD scores (OR = 1.01; LCL = 0.63; UCL = 1.59) or EMP scores (OR = 1.14; LCL = 0.74; UCL = 1.77) when comparing situations where the road surface was dry to those when the surface was other than dry.
• Relation to Junction: Calculations revealed that the odds of a driver having an ORD score of 40 or higher were 7.33 times greater (LCL = 5.66, UCL = 9.49) when the situation was not junction-related compared to intersection/intersection-related. The odds of a driver having an EMP score of 12 or higher were 1.95 times greater (LCL = 1.26; UCL = 3.02) when the situation was not junction-related compared to intersection/intersection-related. No significant differences were found in fatigue scores being above/below threshold for ORD scores (OR = 1.25; LCL = 0.82; UCL = 1.90) or EMP scores (OR = 1.03; LCL = 0.50; UCL = 2.12) when comparing intersection-related events to those occurring on an entrance/exit ramp.
• Trafficway Flow: The odds of a driver having an ORD score of 40 or higher were 1.28 times greater (LCL = 1.04., UCL = 1.58) when the Trafficway Flow was divided compared to undivided. However, an odds ratio calculation revealed no significant difference in the odds of EMP scores (OR = 1.23; LCL = 0.86; UCL = 1.77) being above/below the fatigue threshold when comparing these conditions.
• Number of Travel Lanes: Across all road types, the odds of a driver having an ORD score of 40 or higher were 1.78 times greater (LCL = 1.48, UCL = 2.12) when there were 1-2 lanes compared to 3 or more lanes. Similarly, the odds of a driver having an EMP score of 12 or higher were 1.78 times greater (LCL = 1.37, UCL = 2.33) when there were 1-2 lanes, as compared to 3 or more lanes. When looking at undivided highways only, the odds of a driver having an ORD score of 40 or higher were 1.58 times greater (LCL = 1.02, UCL = 2.45) when there were 1-2 lanes compared to 3 or more lanes. However, there was no significant difference in the odds of a driver having an EMP score above/below the fatigue threshold under these conditions (OR = 0.63; LCL = 0.24; UCL = 1.65). When looking at divided highways and one-way traffic, the odds of a driver having an ORD score of 40 or higher were 1.87 times greater (LCL = 1.54, UCL = 2.28) when there were 1-2 lanes compared to 3 or more lanes. However, the odds of a driver having an EMP score of 12 or higher were 1.83 times greater (LCL = 1.38, UCL = 2.43) when there were 3 or more lanes compared to 1-2 lanes.
• Roadway Alignment: Odds ratio calculations revealed no significant difference in the odds of ORD scores (OR = 1.10; LCL = 0.82; UCL = 1.49) or EMP scores (OR = 0.68; LCL = 0.46; UCL = 1.01) being above/below their respective fatigue thresholds when comparing straight roadway conditions to curved roadway conditions.
• Roadway Profile: The odds of a driver having an ORD score of 40 or higher were 2.66 times greater (LCL = 1.84, UCL = 3.84) when the roadway was level, as compared to graded roadways. However, an odds ratio calculation revealed no significant difference

78
in the odds of EMP scores being above/below the fatigue threshold when comparing these conditions (OR = 0.64; LCL = 0.39; UCL = 1.04).
• Traffic Density: An odds ratio calculation revealed that the odds of a driver having an ORD score of 40 or higher were 2.44 times greater (LCL = 1.73, UCL = 3.43) when the traffic density was in the lower condition (LOS A or B). However, an odds ratio calculation revealed no significant difference in the odds of EMP scores being above/below the fatigue threshold when comparing these conditions (OR = 1.66; LCL = 0.99; UCL = 2.77).
• Construction Zones: Odds ratio calculations revealed no significant difference in the odds of ORD scores (OR = 1.16; LCL = 0.71; UCL = 1.90) or EMP scores (OR = 2.50; LCL = 0.90; UCL = 6.92) being above their respective fatigue thresholds when comparing construction zone-related driving to non-construction zone-related driving.
• Vehicle Pre-Event Speed: When examining all events and baselines, the odds of a driver having an ORD score of 40 or higher were 1.73 times greater (LCL = 1.47, UCL = 2.05) when the Vehicle Pre-Event Speed was > 55 mi/h when compared to 54 mi/h or less. Similarly, the odds of a driver having an EMP score of 12 or higher were 1.56 times greater (LCL = 1.21, UCL = 2.01) when the Vehicle Pre-Event Speed was > 55 mi/h as compared to 54 mi/h or less. When examining single-vehicle events only, the odds of a driver having an ORD score of 40 or higher were 1.38 times greater (LCL = 1.13, UCL = 1.69), and an EMP score of 12 or higher were 1.58 times greater (LCL = 1.19, UCL = 2.08) when the Vehicle Pre-Event Speed was > 55 mi/h. When examining multiple-vehicle events only, the odds of a driver having an ORD score of 40 or higher were 1.43 times greater (LCL = 1.04, UCL = 1.97) when the Vehicle Pre-Event Speed was > 55 mi/h as compared to 54 mi/h or less. However, an odds ratio calculation revealed no significant difference in the odds of EMP scores being above/below the fatigue threshold when comparing these conditions (OR = 1.34; LCL = 0.73; UCL = 2.46).

79
CHAPTER 7. DISCUSSION
Overview
The DDWS FOT is the largest CMV naturalistic driving study ever conducted by the United States DOT. Forty-six trucks were instrumented and 103 CMV drivers participated in this study, resulting in almost 46,000 driving-data hours covering 2.3 million miles traveled. More than one-quarter million data, video, and ASCII text files were gathered (279,600 files total), which represent approximately 12 TB of data from video and dynamic sensor files. Using in-house computer software, VTTI researchers scanned the data to identify and validate triggers indicative of safety-critical events. A total of 1,217 valid safety-critical events were identified (14 crashes, 15 crash: tire-strikes, 120 near-crashes, and 1,068 crash-relevant conflicts). In addition, 2,053 baseline driving epochs were selected and validated for comparison purposes.
Fatigue Measures
The objective of the present study was to utilize this large data set to explore driving conditions associated with driver fatigue. Two independent measures of fatigue were implemented using video data. The ORD measure is a subjective procedure by which data analysts observed drivers’ facial features and behavior for 1 min prior to an event trigger (or randomly selected baseline epoch) to rate drowsiness on a scale from 0-100, with 100 representing “extremely drowsy”. Ratings greater than or equal to 40 were considered indicative of fatigue.
Of the 2,688 combined safety-critical events and baseline epochs which could be scored for ORD, the mean was 34.8 (SD = 16.0), with a range of 1.4 to 96. The highest relative frequencies for safety-critical events occurred when the ORD ratings were below 40. The single highest relative frequency for safety-critical events was for ORD scores of 0 - 9.99 (0.58), while the lowest relative frequency was for ORD scores of 90+ (0.17).
When examining all of the safety-critical events identified in this study for which ORD could be completed, 26.4 percent of them included an ORD score above the fatigue threshold. Examining the most severe of these safety-critical events (i.e., crashes/near-crashes), 22.3 percent were above the fatigue threshold. These results are comparable to those found in previous naturalistic studies. For example, Dingus et al. (2006)(5) found that fatigue was a contributing factor in 20 percent of 82 crashes and 16 percent of 761 near-crashes captured in the naturalistic “100-Car” study. Also, Hanowski et al. (2000)(1) identified fatigue as a contributing factor in 21 percent of 249 safety-critical incidents identified in a naturalistic study with local/short-haul truck drivers.
EMP is a somewhat more objective measure whereby data analysts manually coded whether the drivers’ eyes were open or 80-100 percent closed (non-inclusive of rapid eye blinks) at 1/10 of a second for 3 min prior to an event trigger (or randomly selected baseline epoch). This manual coding would then be used to produce a percentage of time the eyes were 80-100 percent closed for that time interval. EMP scores of greater than or equal to 12 percent were considered indicative of fatigue.
Of the 2,338 combined safety-critical events and baseline epochs which could be scored for EMP, the mean was 5.86 percent (SD = .05), with a range of 0 – 30.6 percent.
80
The highest relative frequency occurred for EMP scores of 0 – 12.49 (0.36), which is below the fatigue threshold, while the lowest relative frequency was found for EMP scores of 25 percent+ (0.15).
When examining all of the safety-critical events identified in this study for which EMP could be completed, 9.9 percent of them included an EMP score above the fatigue threshold. Examining the most severe of these safety-critical events (i.e., crashes/near-crashes), 16.5 percent were above the fatigue threshold. While an EMP value of 12 percent or more was used in the current study as the fatigue threshold based on the findings and recommendations of Wierwille, Hanowski, Olson, et al. (2003)(4), other research involving the evaluation of DDWS technology has used the PERCLOS value of 8 percent to give drivers an initial advisory tone alert indicating to them that they are approaching a full warning at the PERCLOS fatigue threshold of 12 percent (Wierwille, Hanowski, Olson, et al., 2003(4); Hanowski, Blanco, Nakata, et al., in press(6)). It is interesting that when looking at total safety-critical events in the current study, those with an EMP score of 8 percent or more represented 20.9 percent of these cases. When examining crashes/near-crashes, those with an EMP score of 8 percent or more represented 23.7 percent of these cases. When using this more liberal EMP fatigue threshold of 8 percent or more, the percentage of those above threshold are again comparable to previous research whereby fatigue is identified as a contributing factor in approximately 20 percent of safety-critical events.
Furthermore, when data reductionists gave their impression of contributing factors to safety-critical incidents in this study, 21.4 percent of crashes and 15.8 percent of near-crashes had fatigue/drowsiness listed as a possible contributing factor. These assessments were made independently of the ORD and EMP scores.
The results of the ORD, EMP, and possible contributing factors measures in this study provide further support for the findings that fatigue/drowsiness is associated with a significant proportion of safety-critical events.
ORD versus EMP
Clearly there is a noticeable difference in the fatigue measures. There was much more variability in ORD scores when compared to EMP scores, and the two were weakly correlated (r = .21). As described above, this may be attributable to the fact that the measures are based on different information. Specifically, ORD ratings take into account the physical appearance of the driver (e.g., drooping facial features indicative of drowsiness) and behaviors (e.g., yawning), while EMP is based solely on the percentage of a time interval the eyes were 80-100 percent closed, non-inclusive of blinks. This difference in scope of the two fatigue measures may explain why the descriptive statistics of the two are so different. In addition, due to its nature, the ORD rating procedure is very subjective, while the EMP procedure is fairly objective (note: there was some subjectivity as to whether the eyes were mostly closed or open when manually scoring PERCLOS).
The ORD measure is a relatively simple and efficient means for rating driver drowsiness. Each rating took between 1-2 min to complete, in contrast to EMP, which took approximately 15 min to complete a single rating. One limitation to the ORD procedure, however, is the vagueness of the rating protocol, which was developed using simulated data. Data analysts would read fairly

81
broad descriptions of four quadrants in the 0-100 score range (i.e., slightly, moderately, very, and extremely drowsy) and would use their judgment to assign a rating to a driver once s/he was viewed for 1 min prior to an event or baseline epoch. No training was completed for implementing ORD. Future research should focus on developing a more rigorous measurement and training protocol for use in naturalistic driving studies. By developing, evaluating, and validating an ORD training program and protocol with naturalistic data, rater variability may be reduced, and ORD may become a more rigorous measure of fatigue. Nonetheless, the fatigue ratings completed for the present study are both useful in determining how impaired drivers were, based on two independent methodologies which focus on different aspects of the driver. Data were analyzed for this report for each fatigue measure and, for the most part, the ratings provided similar results.
Odds Ratio Findings
The odds of experiencing a safety-critical event, when compared to baseline epochs, were greater when the ORD and EMP scores were below their respective thresholds. This is expected given the findings that most safety-critical incidents occur when the driver is alert. One possible explanation for this is that drivers were more likely to be involved in a safety-critical event, when compared to baseline, given higher traffic density. An odds ratio calculation revealed that the odds of a driver experiencing a safety-critical event, when compared to baseline epochs, were 7.16 times greater when the traffic density variable was coded between LOS C-F, as opposed to lower traffic density of LOS A-B. This makes sense since one would assume a greater safety risk when there are more vehicles on the road. In terms of fatigue, it may be the case that as drivers are in conditions where more traffic is present, their level of alertness is higher given the greater amounts of stimuli. This is supported by the finding that drivers were 2.44 times more likely to have an ORD score above threshold when the traffic density was low (LOS A-B) as opposed to high (LOS C-F). Also, drivers were at greater relative risk for experiencing fatigue when on 1-2 lane roads as opposed to larger roads which can accommodate more traffic. Finally, when considering safety-critical events, the finding that one has greater odds of having a fatigue score over threshold when only a single vehicle was involved supports this line of reasoning.
Some of the other results of this study indicate that lower levels of stimuli in the driving environment may be associated with greater fatigue. For example, the estimated relative risk of fatigue was greater on level roads, non-junction-related road segments, and roads where a driver could travel at greater speeds. CMV drivers often drive long hours on interstates and highways that provide little or no scenery or other stimuli to help keep the driver alert.
The data for this project were leveraged from an on-road evaluation of a DDWS. Drivers were assigned to the experimental group (which received audible warnings when the technology believed they were becoming drowsy) and the control group (which received no such warning). Perhaps counter-intuitively, the odds of a driver in the experimental condition being scored as over the fatigue threshold were 1.45 times greater for ORD and 1.62 times greater for EMP when compared to control drivers. One possible explanation for this finding involves the concept of risk compensation (Peltzman, 1975).(7) Risk compensation is based on the notion that people are presumed to regulate their behavior to compensate for changes in perceived risk. In other words, since the drivers in the experimental condition knew their level of fatigue was being monitored

82
by a machine that would alert them if they were becoming drowsy, they may have felt more comfortable driving while fatigued given this “safety net”.
Another interesting finding was that odds ratio calculations showed no significant differences for having an ORD or EMP score above the fatigue threshold when comparing a.m. versus p.m. driving. There were also no significant differences for having an ORD or EMP score above the fatigue threshold when comparing typical circadian rhythm time frames with non-circadian rhythm time frames. A possible explanation for this finding is that the study sample consisted of professional drivers who condition themselves and prepare to be awake and alert while holding somewhat unusual work schedules (e.g., early morning/late evening driving). So, it is possible that the drivers’ rest and sleep schedules differed so much that any differences in fatigue scores for a.m. versus p.m. or circadian rhythm versus non-circadian rhythm time frames were washed out. However, when considering light conditions, drivers had a greater estimated relative risk of being over the fatigue thresholds for ORD and EMP during dark conditions when compared to daylight conditions.
FUTURE DIRECTIONS FOR NSTSCE FATIGUE RESEARCH
Development and Evaluation of a Naturalistic ORD
As noted above, the ORD measure is a relatively simple and efficient means for rating driver drowsiness. However, a significant limitation to the ORD procedure is the vagueness of the rating protocol and lack of a systematic training procedure for data analysts. NSTSCE stakeholders have recently funded a study to develop and validate an ORD protocol and training program using naturalistic video data gathered from light and heavy vehicles. The overall objective of this project is to develop a more rigorous measurement and training protocol. If successful, this methodology will not only be the standard for ORD used in VTTI studies investigating fatigue, but can also be published for use by researchers in transportation and other fields.
Health and Fatigue
Another study recently funded by the NSTSCE stakeholders committee will focus on the relation of health and fatigue. A recent analysis of Motor Carrier Management Information System (MCMIS) and Commercial Driver’s License Information System (CDLIS) databases showed a 7 percent increase in the likelihood of experiencing a crash for obese drivers (Lantz, 2007).(30) To further explore this issue, a planning study will be conducted to determine the need and potential effectiveness of a diet and exercise guide program to encourage a healthy lifestyle and reduce fatigue among professional truck drivers.
The results and final reports of the above studies will be available in early 2009.

83
APPENDIX A: DATA CODING DIRECTORY
Event Variables 1. Event Identifier (C-N-I-B)
Comment: Each event will be assigned a file name that is automatically generated by the software.
2. Analyst Identifier (C-N-I-B) Comment: Analysts/data reductionists will be identified by their log-ins.
3. Trigger Type (C-N-I-B)
00 = Not applicable (baseline epoch) 01 = Lateral acceleration 02 = Longitudinal acceleration 03 = CI button 04 = Lane deviation/bust 05 = Normalized lane position 06 = Forward Time-to-Collision 07 = Forward range 08 = Rear TTC 09 = Rear range 10 = Side object detection 11 = Lane change cut-off 12 = Yaw rate (“swerve”) 13 = ACN 14 = RF sensor 15 = Glare event 16 = Air bag Comment: These are taken from the 100-Car Study coding, although a number of 100-Car triggers are not being used in the current study. Total will be somewhat greater than the total event N since some events will have more than one trigger. This variable will be automatically generated by the software.
4. Trigger Quantitative Value (C-N-I) Maximum/minimum value of relevant triggers. For time-to-collision triggers, find the closest point where the two vehicles are still in a path to collision, and enter that number.
5. Event Classification (C-N-I-B)
00 = Invalid trigger. These are events where sensor readings were spurious or otherwise not safety-relevant due to a transient spike or some other anomaly.

84
00a = No video. One or more of the quadrants of video is out/not visible. It is not possible to obtain enough information to determine the event. 01 = Baseline driving epoch (selected randomly). These are one minute time periods that are randomly selected from the recorded data set. Baseline epochs will be described using many of the same variables and data elements used to describe and classify crashes, near-crashes, and incidents. Examples of such variables include ambient weather, roadway type, and driver behaviors. The creation of a baseline data set will enable the study to: (i) describe and characterize “normal” driving for the study sample and (ii) infer the increased or decreased risk associated with various conditions and driver behaviors by comparisons between the control (baseline) data set and the incident and/or near-crash data sets. For example, if 20 percent of incidents but only 10 percent of baseline epochs occurred during rain, one could infer that rain is associated with an increased incident rate and, therefore, increased risk. 02 = Crash. Any contact with an object, either moving or fixed, at any speed in which kinetic energy is measurably transferred or dissipated. Includes other vehicles, roadside barriers, objects on or off of the roadway, pedestrians, pedalcyclists or animals. 03 = Near-Crash (evasive maneuver). Any circumstance requiring a rapid, evasive maneuver by the subject vehicle, or any other vehicle, pedestrian, pedalcyclist, or animal to avoid a crash. A rapid, evasive maneuver is defined as a steering, braking, accelerating, or any combination of control inputs that approaches the limits of the vehicle capabilities. Any event where the driver swerves off of the side of the road, and any part of the truck leaves the pavement, will automatically be coded as a near-crash. 04 = Near-Crash (no evasive maneuver). Any circumstance that results in extraordinarily close proximity of the subject vehicle to any other vehicle, pedestrian, pedalcyclist, animal, or fixed object where, due to apparent unawareness on the part of the driver(s), pedestrians, pedalcyclists or animals, there is no avoidance maneuver or response. Extraordinarily close proximity is defined as a clear case where the absence of an avoidance maneuver or response is inappropriate for the driving circumstances (including speed, sight distance, etc.). Times-to-collision (TTCs) of less than 2.00 s are reviewed to assess whether they qualify as crash-relevant conflicts (or near-crashes); those with TTCs of less than 1.00 s are always coded as crash-relevant conflicts or near-crashes. 05 = Crash-relevant conflict (evasive maneuver). Any circumstance that requires a crash avoidance response on the part of the subject vehicle, any other vehicle, pedestrian, pedalcyclist, or animal that is less severe than a rapid evasive maneuver (as defined above), but greater in severity than a “normal maneuver” to avoid a crash. A crash avoidance response can include braking, steering, accelerating, or any combination of control inputs. A “normal maneuver” for the subject vehicle is defined as a control input that falls within the 99 percent confidence limit for control inputs for the initial study data sample. Examples of potential crash-relevant conflicts include hard braking by a driver because of a specific crash threat, or proximity to other vehicles. Evasive maneuvers resulting in unsafe and/or illegal maneuvers or situations should be included in this category (or as near-crashes if more severe). Longitudinal decelerations of -0.35g or greater are reviewed to assess whether they

85
qualify as crash-relevant conflicts (or near-crashes); those with decelerations of -0.50g or greater are always coded as crash-relevant conflicts or near-crashes. 06 = Crash-relevant conflict (no evasive maneuver). Any circumstance that results in close proximity of the subject vehicle to any other vehicle, pedestrian, pedalcyclist, animal, or fixed object where, due to apparent unawareness on the part of the driver(s), pedestrians, pedalcyclists or animals, there is no avoidance maneuver or response. Extraordinarily close proximity is defined as a clear case where the absence of an avoidance maneuver or response is inappropriate for the driving circumstances (including speed, sight distance, etc.). 07 = Non-conflict. Any incident that has an above-threshold trigger, but which does not result in a crash, near-crash, or crash-relevant conflict as defined above. There is no abrupt evasive maneuver and no signs of any other unsafe condition such as a lane break. Driver errors may be observed, but they do not result in a traffic conflict. Examples include hard braking by a driver in the absence of a specific crash threat, or high lateral acceleration on curves not resulting in any loss-of-control, lane departure, or proximity to other vehicles. Comment: Initial coding step. Invalid triggers and non-conflicts result in no further coding. Identification of two different types of near-crashes (i.e., evasive maneuver and proximity event) permits later disaggregation if desired. Definitions of each type of event are given above.
6. Date (C-N-I-B) Comment: Raw data from vehicle.
7. Day of Week (C-N-I-B)
Comment: Raw data from vehicle. 8. Time (C-N-I-B)
Comment: Raw data from vehicle. For C-N-I events, time of maximum/minimum trigger value is recorded. For Baseline epochs, the end of the 30-second baseline period is recorded. Format: Integer.
9. Vehicles/Non-Motorists Involved (C-N-I) 00 = Not applicable (baseline epoch) 01 = 1 vehicle (Subject vehicle only) 02 = 2 vehicles 03 = 3 vehicles 04 = 4 or more vehicles 05 = Subject vehicle + pedestrian 06 = Subject vehicle + pedalcyclist 07 = Subject vehicle + animal 08 = Other Comment: Events involving the subject vehicle and an object (i.e., struck or potentially struck) are coded 01. For some events (e.g., those involving transient encroachment into an oncoming lane), it will be difficult to decide whether the event should be considered a one-

86
or two-vehicle event. Consider the event a two-vehicle event if the crash resulting from the incident would likely have involved two vehicles, and/or if either driver’s maneuvers were influenced by the presence of the other vehicle (e.g., if DV1 maneuvered to avoid V2). Consider the event a one-vehicle event if the presence of other vehicles presented no immediate threat and had no effect on DV1’s maneuvers or behaviors.
10. Which vehicle is considered to be at fault? (C-N-I) 00 = Not applicable (baseline epoch) 01 = Vehicle 1 (Subject vehicle) 02 = Vehicle 2 (Other vehicle; pedalcyclists, or animal) 09 = Unknown Comment: The “at fault” vehicle is defined as the vehicle with the assigned Critical Reason.
11. Light Condition (C-N-I-B) 01 = Daylight 02 = Dark 03 = Dark but lighted 04 = Dawn 05 = Dusk 09 = Unknown Comment: GES A19.
12. Weather (Atmospheric Condition) (C-N-I-B)
01 = No adverse conditions 02 = Rain 03 = Sleet 04 = Snow 05 = Fog 06 = Rain & fog 07 = Sleet & fog 08 = Other (smog, smoke, sand/dust, crosswind, hail) 09 = Unknown Comment: GES A20.
13. Roadway Surface Condition (C-N-I-B)
01 = Dry 02 = Wet 03 = Snow or slush 04 = Ice 05 = Sand, oil, dirt 08 = Other 09 = Unknown Comment: GES A15.
14. Relation to Junction (C-N-I-B)
00 = Non-Junction

87
01 = Intersection 02 = Intersection-related 03 = Driveway, alley access, etc. 03a = Parking Lot 04 = Entrance/exit ramp 05 = Rail grade crossing 06 = On a bridge 07 = Crossover-related 08 = Other 09 = Unknown Comment: GES variable A09. GES instructions for coding this variable will be reviewed to ensure consistency of coding approach with GES.
15. Construction Zone-Related (C-N-I-B) 00 = Not construction zone-related (or unknown) 01 = Construction zone (occurred in zone) 02 = Construction zone-related (occurred in approach or otherwise related to zone) Comment: Default code is 0. For the purposes of the coding, consider any area with multiple traffic cones, barrels, etc. to be a construction zone.
16. Traffic Density (C-N-I-B) 01 = LOS A: Free flow – Individual users are virtually unaffected by the presence of others in the traffic stream. Freedom to select desired speeds and to maneuver within the traffic stream is extremely high. The general level of comfort and convenience provided to the motorist, passenger, or pedestrian is excellent. 02 = LOS B: Flow with some restrictions – In the range of stable traffic flow, but the presence of other users in the traffic stream begins to be noticeable. Freedom to select desired speeds is relatively unaffected, but there is a slight decline in the freedom to maneuver within the traffic stream from Level-of-Service A, because the presence of others in the traffic stream begins to affect individual behavior. 03 = LOS C: Stable flow, maneuverability and speed are more restricted – In the range of stable traffic flow, but marks the beginning of the range of flow in which the operation of individual uses becomes significantly affected by the interactions with others in the traffic stream. The selection of speed is now affected by the presence of others, and maneuvering within the traffic stream requires substantial vigilance on the part of the user. The general level of comfort and convenience declines noticeably at this level. 04 = LOS D: Unstable flow: temporary restrictions substantially slow driver – Represents high-density, but stable traffic flow. Speed and freedom to maneuver are severely restricted, and the driver or pedestrian experiences a generally poor level of comfort and convenience. Small increases in traffic flow will generally cause operational problems at this level. 05 = LOS E: Flow is unstable; vehicles are unable to pass, temporary stoppages, etc. – Represents operating conditions at or near the capacity level. All speeds are reduced to a

88
low, but relatively uniform value. Freedom to maneuver within the traffic stream is extremely difficult, and it is generally accomplished by forcing a vehicle or pedestrian to “give way” to accommodate such maneuvers. Comfort and convenience levels are extremely poor, and driver or pedestrian frustration is generally high. Operations at this level are usually unstable, because small increases in flow or minor perturbations within the traffic stream will cause breakdowns. 06 = LOS F: Forced traffic flow condition with low speeds and traffic volumes that are below capacity. Queues forming in particular locations – This condition exists whenever the amount of traffic approaching a point exceeds the amount which can traverse the point. Queues form behind such locations. Operations within the queue are characterized by stop-and-go waves, and they are extremely unstable. Vehicles may progress at reasonable speeds for several hundred feet or more, and then be required to stop in a cyclic fashion. Level-of-Service F is used to describe the operating conditions within the queue, as well as the point of the breakdown. It should be noted, however, that in many cases operating conditions of vehicles or pedestrians discharged from the queue may be quite good. Nevertheless, it is the point at which arrival flow exceeds discharge slow which causes the queue to form, and Level-of-Service F is an appropriate designation for such points. 09 = Unknown/unable to determine
Driver/Vehicle 1 Variables Note: Driver/Vehicle 1 (DV-1) is always the study subject driver/vehicle (i.e., the truck or truck driver).
17. Subject Vehicle Number (C-N-I-B)
Format: Integer. Automatically generated. 18. Subject Driver Number (C-N-I-B)
Format: Integer. Automatically generated. 19. Trafficway Flow (C-N-I-B)
00 = Not physically divided (center 2-way left turn lane) 01 = Not physically divided (2-way trafficway) 02 = Divided (median strip or barrier) 03 = One-way trafficway 09 = Unknown Comment: GES variable V A11. Coded in relation to subject vehicle.
20. Number of Travel Lanes (C-N-I-B) 01 = 1 02 = 2 03 = 3 04 = 4 05 = 5

89
06 = 6 07 = 7+ 09 = Unknown Comment: GES V A12. Per GES, if road is divided, only lanes in travel direction are counted. If undivided, all lanes are counted. Coded in relation to subject vehicle. Count all contiguous lanes at the time & location of the incident; e.g., include entrance or exit lanes if contiguous.
21. Truck Pre-Event Speed (C-N-I-B)
Format: integer. Comment: For C-N-I events, coded for the period just prior to the occurrence of the critical event and/or just prior to any avoidance maneuver. For example, when braking is involved, the pre-event speed is the speed just prior to the beginning of braking. For Baseline events, coded for the end of the 30-second baseline interval. Note that roadway “Speed Limit” cannot currently be determined because most speed limit signs are not legible on the videos.
22. Roadway Alignment (C-N-I-B)
01 = Straight 02a = Curve right 02b = Curve left 09 = Unknown Comment: GES V A13, with expansion of curve choices. Coded in relation to subject vehicle.
23. Roadway Profile (C-N-I-B)
01 = Level (or unknown) 02a = Grade up 02b = Grade down 03 = Hillcrest 04 = Sag Comment: GES V A14, with expansion of grade choices. Coded in relation to subject vehicle.
24. Driver Safety Belt Worn? (C-N-I-B) 01 = Yes 02 = No 09 = Unknown Comment: This issue is of current interest to FMCSA and its capture would permit comparisons of driver behavior between drivers wearing and not wearing safety belts. Judged based on whether a shoulder strap is visible; lap belt typically cannot be seen.
25. Does The Driver Cover The Camera/Is The Camera Covered? (C-N-I-B) 00 = Yes 01 = No/not observed 02 = Attempts, but fails

90
26. Alcohol Use (C-N-I-B) 00 = None apparent 01 = Suspected use observed in vehicle without overt effects on driving 02 = Suspected use observed in vehicle with overt effects on driving 03 = Reported by police [applicable only to crashes] 04 = Use not observed or reported, but suspected based on driver behavior. 09 = Unknown Comment: Use indicated only if apparent from event review.
Note: The remaining DV-1 Variables are pre-crash and event causation variables. Table 113 lists these variables, indicates sources, and shows the corresponding variable for DV-2.
Table 113. Coded pre-crash and causation variables.
Variable Name Principal Source(s) (e.g., other
databases/studies)
Subject Vehicle (V1) Variable #
Other Vehicle (V2) Variable
#
Vehicle Pre-Event Movement GES, LTCCS 27 44
“Accident” Type [Scenario Role] GES, LTCCS 28 45
Incident Types Two recent VTTI studies 29 46
Critical Pre-crash Event LTCCS 30 47
Critical Reason for the Critical Event LTCCS 31 48*
Attempted Avoidance Maneuver GES, LTCCS 32 49
Driver Vision Obscured by GES 34
Not coded Average PERCLOS Value (1, 3, 5 minutes) VTTI and other fatigue
research 35-37
Observer Rating of Drowsiness (1 minute) Previous VTTI research 38
Potentially Distracting Driver Behaviors GES 39
Driver Actions/Factors Relating to Event 100-Car Study 40 50*
Applicable Functional Countermeasures Various 41 51
*Abridged due to inability to observe specific Driver 2 behaviors and states. 27. Vehicle Pre-Event Movement (C-N-I-B)
00 = No driver present 01 = Going straight 02 = Decelerating in traffic lane 03 = Accelerating in traffic lane 04 = Starting in traffic lane 05 = Stopped in traffic lane 06 = Passing or overtaking another vehicle

91
07 = Disabled or parked in travel lane 08a = Leaving a parking position, moving forward 08b = Leaving a parking position, backing 09a = Entering a parking position, moving forward 09b = Entering a parking position, backing 10 = Turning right 11 = Turning left 12 = Making a u-turn 13 = Backing up (other than parking) 14 = Negotiating a curve 15 = Changing lanes 16 = Merging 17 = Successful avoidance maneuver to a previous critical event 98 = Other 99 = Unknown Comment: This is LTCCS Variable #4 with expanded choices for 8 and 9. For Baseline epochs, the primary movement of the vehicle during the epoch is coded.
28. “Accident” Type [Scenario Role] (C-N-I) 00 = Not applicable (baseline epoch) Other Codes: See diagram, next page. Comment: LTCCS Variable #10 and GES Variable V23. Since this variable “includes intent,” analysts should project likely scenario roles for incidents where outcomes are not definite. In other words, if the trigger-related event had resulted in a crash, what would the crash scenario be? When specific scenarios cannot be projected, use the “Specifics Unknown” choices (e.g., 5, 10, 16, 33, etc.). Table 114 illustrates the Accident Types. Additional clarifications:
• Drive off road codes (e.g., 01 and 06) are used when a vehicle has crossed, or is projected to cross, a roadside delineation such as a lane edge line (going onto the shoulder or median), curb, or the edge of the pavement. This includes scenarios involving parked vehicles and stationary objects if those objects are outside of the roadway delineation (e.g., on an unpaved shoulder).
• Forward impact codes (e.g., 11, 12) are used when the objects are in the travel lane or when there is no lane edge delineation as described above. Thus, a scenario involving a parked vehicle on the pavement where there is no lane edge delineation is coded 12.
• For left-side lane departures into the oncoming traffic lane, code 64/65 if the lateral encroachment is less than a few feet. Code 50/51 only if the lateral encroachment was sufficient to create a significant risk of a head-on crash.
• Hard braking events at intersections in the absence of a specific crash or crash threat are coded 91 (Intersecting straight paths, specifics unknown).
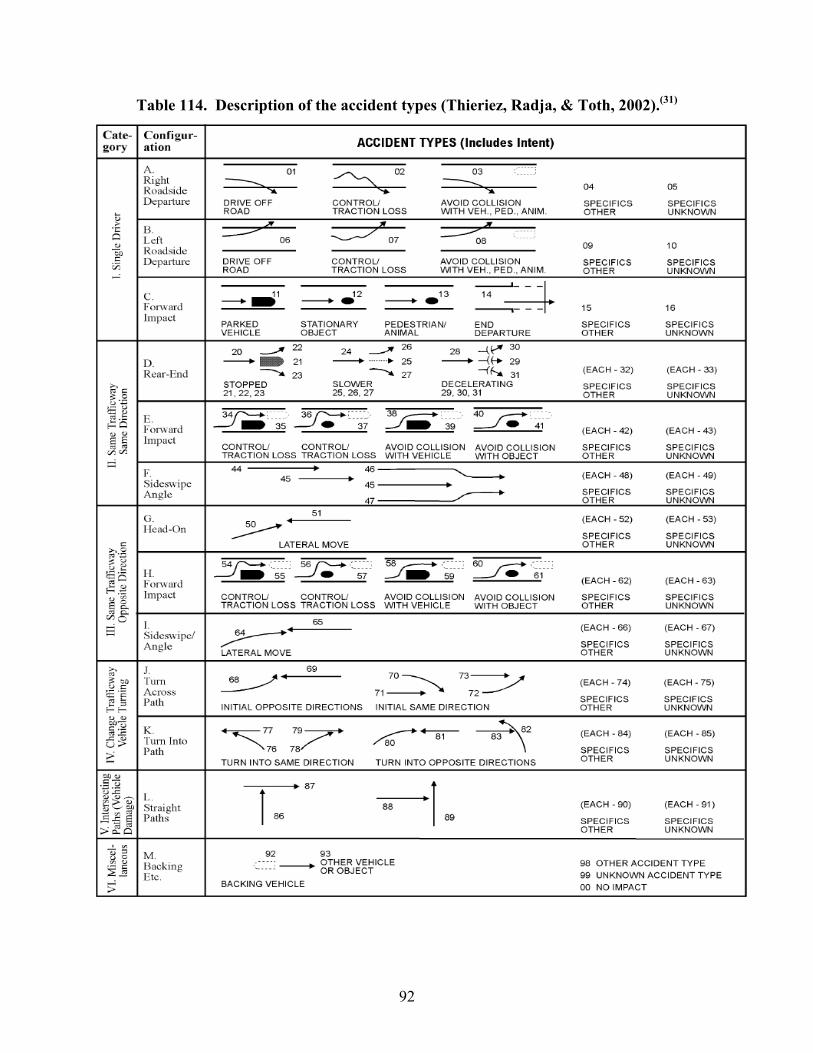
92
Table 114. Description of the accident types (Thieriez, Radja, & Toth, 2002).(31)

93
29. Incident Types (C-N-I) 00 = Not applicable (baseline epoch)
01/02 = Aborted lane change 03/04 = Approaches traffic quickly [not used] 05/06/07/08 = Backing in roadway 09/10 = Clear path for emergency vehicle 11/12 = Conflict between merging and existing traffic 13/14 = Conflict with oncoming traffic 15/16 = Exit then re-entrance onto roadway 17/18 = Following too closely 19/20/21 = Improper lane change 22/23 = Improper passing 24/25 = Improper u-turn 26/27 = Lane change without sufficient gap 28/29 = Lane drift 30/31 = Late braking for stopped/stopping traffic 32/33 = Lateral deviation of through vehicle 34/35 = Left turn without clearance 36/37 = Merge out of turn (before lead vehicle) 38/39/40 = Merge without sufficient gap 41/42 = Obstruction in roadway 43/44 = Proceeding through red traffic signal 45/46 = Roadway entrance without clearance 47/48 = Slow speed 49/50 = Slow upon passing 51/52/53 = Sudden braking in roadway 54/55 = Through traffic does not allow lane change 56/57/58 = Through traffic does not allow merge 59/60 = Turn without sufficient warning 61/62 = Turn/exit from incorrect lane 63/64 = Wide turn into adjacent lane 65 = Conflict with object/animal/pedalcyclist in roadway 66 = Conflict with object/animal/pedalcyclist on side of road 67 = Other single-vehicle event 68/69 = Close proximity to turning vehicle 99 = Unknown Comment: This scenario classification has been used in Hanowski, Keisler, and Wierwille (2004) (28) and Hanowski, Olson, Hickman, and Dingus (2005).(32) Coding this variable will enable comparisons with that study. Diagrams of these scenarios are provided below in Table 115.

94
Table 115. Description of the incident types.
Incident Type Description Illustration
Aborted Lane Change A driver tries to make a lane change into a lane where there is already a vehicle (driver doesn’t see vehicle). The driver has to brake and move back into the original lane.
Approaches Traffic Quickly [not used]
A driver approaches stopped/slowing traffic too quickly and has to brake hard/suddenly to avoid hitting the lead vehicle.
Backing in Roadway A driver backs the vehicle while on a roadway in order to maneuver around an obstacle ahead on the roadway.
Clear Path for Emergency Vehicle
A driver is traveling ahead of an emergency vehicle (e.g., ambulance, fire truck) and has to move to the side of the road to let the emergency vehicle pass.
Stationary
Emergency Vehicle
Obstacle
1 2
3
4
5
6
7
8
9
10

95
Incident Type Description Illustration
Conflict Between Merging and/or Exiting Traffic
Drivers entering and/or exiting a roadway, using a shared weaving section, conflict.
Conflict With Oncoming Traffic A driver is approaching oncoming traffic (e.g., through an intersection) and has to maneuver back into the correct lane to avoid an oncoming vehicle.
Exit Then Re-Entrance Onto Roadway
A driver exits a roadway then crosses a solid white line to re-enter.
Following Too Closely A driver does not allow adequate spacing between their vehicle and the lead vehicle (e.g., tailgating).
Improper Lane Change A driver makes an improper lane change with regard to another vehicle (e.g., does not use blinker, changes lanes behind another vehicle then does not let vehicle change lanes, changes lanes across multiple lanes, etc.)
11 12
13
14
15
16
17
18
19
20

96
Incident Type Description Illustration
Improper Passing A driver passes another vehicle when it is illegal or unsafe (e.g., passing across a double yellow line or without clearance from oncoming traffic).
Improper U-turn A driver makes a u-turn in the middle of the road (over the double yellow line) and blocks traffic in the opposite direction.
Lane Change Without Sufficient Gap
A driver enters an adjacent lane without allowing adequate space between the driver’s vehicle and the vehicle ahead/behind it.
Lane Drift A driver drifts into an adjacent lane without intention to make a lane change.
Late Braking (and/or steering) for Stopped/ Stopping Traffic
A driver fails to slow in advance for stopped or stopping traffic and must brake and/or steer abruptly.
Stationary/ Slowing
Late Braking
22
21
23
24
25
26
27
28 29
30
31

97
Incident Type Description Illustration
Lateral Deviation of Through Vehicle
A driver has substantial lateral deviation of a through vehicle. Vehicle may or may not deviate from the lane.
Left Turn Without Clearance A driver turns left without adequate clearance from either oncoming through traffic or cross traffic from the left. The driver crosses another driver’s path while entering an intersecting roadway.
Merge Out of Turn (Before Lead Vehicle)
A driver merges onto a roadway before the lead vehicle. The lead vehicle must wait for the merged vehicle to pass before it is safe to enter the main highway.
Merge Without Sufficient Gap A driver merges into traffic without a sufficient gap to either the front or back of one or more vehicles.
Obstruction in Roadway A stationary object blocks through traffic, such as traffic that is backed up or an animal in the roadway.
32
33
34
35
36
37
38
39
40
41
42

98
Incident Type Description Illustration
Proceeding Through Red Traffic Signal
A driver fails to respond to a red traffic signal, conflicting with a vehicle proceeding through the intersection legally.
Roadway Entrance Without Clearance
A driver turns onto a roadway without adequate clearance from through traffic.
Slow Speed A driver is traveling at a much slower speed than the rest of the traffic, causing following traffic to pass the slow vehicle to avoid a conflict.
Slow Upon Passing A driver moves in front of another vehicle then slows, causing the second (passed) vehicle to slow as well, or to go around the first vehicle.
Sudden Braking in Roadway A driver is traveling ahead of another vehicle and brakes suddenly and improperly in the roadway for traffic, a traffic light, etc., causing the following vehicle to come close to their vehicle or to also brake suddenly.
Sudden Braking
Slower Speed
43
44
45 46
47
48
49
50
51
52
53

99
Incident Type Description Illustration
Through Traffic Does Not Allow Lane Change
A driver is trying to make a lane change (with the turn signal on) but traffic in the adjacent lane will not allow the lane change to be completed.
Through Traffic Does Not Allow Merge
Through traffic obstructs a driver from entering the roadway.
Turn Without Sufficient Warning
A driver slows and turns without using a turn signal or without using a turn signal in advance.
Turn/Exit From Incorrect Lane A driver turns onto a side road from the incorrect lane (e.g., a driver makes a right turn from the left lane instead of the right lane).
Wide Turn Into Adjacent Lane A vehicle partially enters an adjacent lane when turning. Traffic in the adjacent lane may be moving in the same or opposite direction.
Turn Signal On 54
55
56
57
58
59
60
61
62
63
64

100
Incident Type Description Illustration
Conflict with Object/Animal/ Pedalcyclist in Roadway
A vehicle approaches an object/animal/pedalcyclist in the roadway and either makes contact with it, or performs an evasive maneuver in order to avoid it.
Conflict with Object/Animal/ Pedalcyclist on Side of Roadway
A vehicle approaches an object/animal/pedalcyclist on the side of the road and either makes contact with it, or performs an evasive maneuver in order to avoid it.
Close Proximity to Turning Vehicle
The lead vehicle is making a right/left turn or changing lanes to the right/left, and the following vehicle comes close to the rear of the lead vehicle as it passes.
Other Single-Vehicle Event A vehicle is involved in a single-vehicle event. For example, runs off the side of the road without a threat of hitting a fixed object.
Unable to Determine It is not possible to determine which vehicle is at fault, therefore, it is not possible to assign an incident type to the event.
30. Critical Precrash Event for Vehicle 1 (C-N-I) 00 = Not applicable (baseline epoch) THIS VEHICLE (V1) LOSS OF CONTROL DUE TO: 01 = Blow out or flat tire 02 = Stalled engine 03 = Disabling vehicle failure (e.g., wheel fell off) 04 = Non-disabling vehicle problem (e.g., hood flew up)
99
Object/ Animal
65
Object/ Animal
66
67
68
69

101
05 = Poor road conditions (wet road, puddle, pot hole, ice, etc.) 06 = Traveling too fast for conditions 07 = Jackknife event 08 = Cargo shift 09 = Braking 10 = Steering 18 = Other cause of control loss 19 = Unknown cause of control loss THIS VEHICLE (V1) TRAVELING 20 = Toward or over the lane line on left side of travel lane 21 = Toward or over the lane line on right side of travel lane 22 = Toward or off the edge of the road on the left side 23 = Toward or off the edge of the road on the right side 24 = End departure 25 = Turning left at intersection 26 = Turning right at intersection 27 = Crossing over (passing through) intersection 28 = This vehicle decelerating 29 = Unknown travel direction OTHER MOTOR VEHICLE (V2) IN LANE 50 = Other vehicle stopped 51 = Traveling in same direction with lower steady speed 52 = Traveling in same direction while decelerating 53 = Traveling in same direction with higher speed 54 = Traveling in opposite direction 55 = In crossover 56 = Backing 59 = Unknown travel direction of other motor vehicle in lane OTHER MOTOR VEHICLE (V2) ENCROACHING INTO LANE 60 = From adjacent lane (same direction) – toward or over left lane line 61 = From adjacent lane (same direction) – toward or over right lane line 62 = From opposite direction - toward or over left lane line 63 = From opposite direction - toward or over right lane line 64 = From parking lane 65 = From crossing street, turning into same direction 66 = From crossing street, across path 67 = From crossing street, turning into opposite direction 68 = From crossing street, intended path not known 70 = From driveway, turning into same direction 71 = From driveway, across path 72 = From driveway, turning into opposite direction 73 = From driveway, intended path not known

102
74 = From entrance to limited access highway 78 = Encroachment by other vehicle - details unknown PEDESTRIAN, PEDALCYCLIST, OR OTHER NONMOTORIST 80 = Pedestrian in roadway 81 = Pedestrian approaching roadway 82 = Pedestrian - unknown location 83 = Pedalcyclist or other nonmotorist in roadway 84 = Pedalcyclist or other nonmotorist approaching roadway 85 = Pedalcyclist or other nonmotorist - unknown location OBJECT OR ANIMAL 87 = Animal in roadway 88 = Animal approaching roadway 89 = Animal - unknown location 90 = Object in roadway 91 = Object approaching roadway 92 = Object - unknown location OTHER 93 = This vehicle not involved in first harmful event 98 = Other critical pre-crash event 99 = Unknown Comment: This is LTCCS Variable #5. This variable is coded for both vehicles in a two-vehicle incident. However, the Critical Reason (see below), is coded for only one vehicle. For consistency with the Accident Type variable (28), lane edges between travel lanes and non-travel lanes (e.g., shoulders) are considered road edges; e.g., events involving V1 crossing of these edges are coded 22 or 23. Unlike the Accident Type variable, however, the analyst should code the actual precipitating event and should not project or extrapolate the event. In the above list, note addition of 09 = loss of control due to braking and 10 = steering.
31. DV1 Critical Reason for the Critical Event (C-N-I)
000a = Not applicable (baseline epoch) 000b = Critical reason not coded to this vehicle
DRIVER-RELATED FACTOR Critical Non-Performance Errors 100 = Sleep, that is, actually asleep 101 = Heart attack or other physical impairment of the ability to act 107 = Drowsiness, fatigue, or other reduced alertness (not asleep) 108 = Other critical non-performance 109 = Unknown critical non-performance DRIVER- RELATED FACTOR Recognition Errors

103
110 = Inattention (i.e., daydreaming) 111 = Internal distraction 112 = External distraction 113 = Inadequate surveillance (e.g., failed to look, looked but did not see) 118 = Other recognition error 119 = Unknown recognition error Decision Errors 120 = Too fast for conditions (e.g., for safe vehicle control or to be able to respond to unexpected actions of other road users) 121 = Too slow for traffic stream 122 = Misjudgment of gap or other’s speed 123 = Following too closely to respond to unexpected actions (close proximity for 2 or more seconds) 124 = False assumption of other road user’s actions 125 = Illegal maneuver 125a = Apparently intentional sign/signal violation 125b = Illegal U-turn 125c = Other illegal maneuver 126 = Failure to turn on head lamps 127 = Inadequate evasive action (e.g., braking only not braking and steering; release accelerator only instead of braking) 128a = Aggressive driving behavior: Intimidation: any behavior emitted by a driver while driving that is intended to cause physical or psychological harm to another person. 128b = Aggressive driving behavior: Wanton, neglectful or reckless behavior: excessive risky driving behaviors performed without intent to harm others, such as weaving through traffic, maneuvering without signaling, running red lights, frequent lane changing, and tailgating 138 = Other decision error 139 = Unknown decision error 140 = Apparent recognition or decision error (unknown which) Performance Errors 141 = Panic/Freezing 142 = Overcompensation 143 = Poor directional control, e.g., failing to control vehicle with skill ordinarily expected 148 = Other performance error 149 = Unknown performance error 199 = Type of driver error unknown VEHICLE RELATED FACTOR 200 = Tires/wheels failed 201 = Brakes failed 202 = Steering failed 203 = Cargo shifted 204 = Trailer attachment failed

104
205 = Suspension failed 206 = Lights failed 207 = Vehicle related vision obstructions 208 = Body, doors, hood failed 209 = Jackknifed 298 = Other vehicle failure 299 = Unknown vehicle failure ENVIRONMENT-RELATED FACTOR Highway Related 500 = Signs/signals missing 501 = Signs/signals erroneous/defective 502 = Signs/signals inadequate 503 = View obstructions by roadway design 504 = View obstructed by other vehicles crash circumstance 505 = Road design - roadway geometry (e.g., ramp curvature) 506 = Road design - sight distance 507 = Road design - other 508 = Maintenance problems (potholes, deteriorated road edges, etc.) 509 = Slick roads (low friction road surface due to ice, loose debris, any other cause) 518 = Other highway-related condition Weather-Related 521 = Rain, snow [Note: code loss-of-control as 509] 522 = Fog 523 = Wind gust 528 = Other weather-related condition Other 530 = Glare 531 = Blowing debris 532 = Animal in roadway (no driver error) 533 = Pedestrian or pedalcyclist in roadway (no driver error) 538 = Other sudden change in ambience 999 = Unknown reason for critical event Comment: LTCCS Variable #6 with revisions. “This vehicle” will always be used for the vehicle being coded. Note that vehicle-related factors will rarely be apparent to data reductionists.
32. Vehicle 1 Attempted Avoidance Maneuver (C-N-I)
00 = No driver present 0a = Not applicable (baseline epoch) 01 = No avoidance maneuver 02 = Braking (no lockup or lockup unknown) 03 = Braking (lockup) 04 = Braking (lockup unknown)

105
05 = Releasing brakes 06 = Steered to left 07 = Steered to right 08 = Braked and steered to left 08a = Braked and steered to left (no lockup or lockup unknown) 08b = Braked and steered to left (lockup) 09 = Braked and steered to right 09a = Braked and steered to right (no lockup or lockup unknown) 09b = Braked and steered to right (lockup) 10 = Accelerated 11 = Accelerated and steered to left 12 = Accelerated and steered to right 13 = Released gas pedal without braking 14 = Released gas pedal (without braking) and steered to left 15 = Released gas pedal (without braking) and steered to left 98 = Other actions 99 = Unknown if driver attempted any corrective action Comment: LTCCS Variable #7 and also GES V27, Corrective Action Attempted. “Released gas pedal” elements added because this evasive maneuver by subject drivers is sometimes observed.
33. Relevant Object (C-N-I)
Analyst chooses the most relevant object; i.e., one that was struck in a crash or which constituted a crash threat for near-crashes and crash-relevant conflicts. 00a = Not applicable (baseline epoch) 00b = Not applicable (single vehicle event but no critical object; e.g., shoulder only) 00c = Not applicable (two vehicle event, pedestrian, animal, etc.) 01 = Parked motor vehicle Fixed objects: 02 = Building 03 = Impact attenuator/crash cushion 04 = Bridge structure (e.g., abutment) 05 = Guardrail 06 = Concrete traffic barrier or other longitudinal barrier (e.g., “Jersey Barrier”) 07 = Post, pole, or support (e.g., sign, light) 08 = Culvert or ditch 09 = Curb 10 = Embankment 11 = Fence 12 = Wall 13 = Fire hydrant 14 = Shrubbery or bush 15 = Tree [not overhang – see below] 16 = Boulder 17 = Loading dock

106
18 = Loading equipment (e.g., fork lift, pallets) 19 = Cargo Overhanging objects [code only if struck or potentially struck by top of truck/trailer] 20 = Tree branch 21 = Overhanging part of sign or post 22 = Bridge/overpass 23 = Building 24 = Telephone wires Non-fixed objects: 25 = Vehicle parts, including tire parts 26 = Spilled cargo 27 = Dead animal in roadway 28 = Broken tree limbs or other tree/shrub parts 29 = Trash/debris 30 = Construction barrel 31 = Construction cone 98 = Other 99 = Unknown object hit Comment: Most objects are the same as those used in GES A06, First Harmful Event. Those in italics are not A06 codes.
34. Driver 1 Vision Obscured by (C-N-I) 00 = No obstruction 01 = Rain, snow, fog, smoke, sand, dust 02 = Reflected glare, sunlight, headlights 03 = Curve or hill 04 = Building, billboard, or other design features (includes signs, embankment) 05 = Trees, crops, vegetation 06 = Moving vehicle (including load) 07 = Parked vehicle 08 = Splash or spray of passing vehicle [any other vehicle] 09 = Inadequate defrost or defog system 10 = Inadequate lighting system [includes vehicle/object in dark area] 11 = Obstruction interior to vehicle 12 = Mirrors 13 = Head restraints 14 = Broken or improperly cleaned windshield 15 = Fog 16 = Other vehicle or object in blind spot 50 = Hit & run vehicle 95 = No driver present 96 = Not reported 97 = Vision obscured – no details 98 = Other obstruction

107
99 = Unknown whether vision was obstructed Comment: GES Variable D4. Element 16 added because of relevance to large trucks. Elements 50, 95, and 96 are not applicable.
35. DFM Operating Mode (C-N-I-B) 01 = Auto-Manual 02 = Manual 03 = Auto (if Operating Mode = Auto, DFM is automatically non-operative)
36. DFM Sensitivity Level (C-N-I-B)
01 = Low 02 = Medium 03 = High
Rules to follow when trying to determine if DFM is in standby:
• When speed is below 30 mi/h (48.28 kph) and ambient brightness is above 100 the DFM is in standby
• When the speed is above 35 mi/h (56.32 kph) and ambient brightness is less than 50 the DFM is active
• Ambient brightness (0 = dark; 255 = bright): o Special note: There will be times when the DFM should be functioning according to
the above two rules, but often during dawn and dusk it still does not operate correctly. If it looks light in the video, but the ambient brightness values are within the correct range, you may need to make a judgment call to determine if it is working or not. Please ask if you have any questions.
37. Average PERCLOS over 1 Minute (C-N-I-B)
Comment: Recorded parameter from DFM, averaged over a one-minute period prior to initiating event. Coded when available for time epoch. Format: Percent; 999 = DFM not operative.
38. Average PERCLOS over 3 Minutes (C-N-I-B)
Comment: Recorded parameter from DFM, averaged over a three-minute period prior to initiating event. Coded when available for time epoch. Format: Percent; 999 = DFM not operative.
39. Average PERCLOS over 5 Minutes (C-N-I-B) Comment: Recorded parameter from DFM, averaged over a five-minute period prior to initiating event. Coded when available for time epoch. Format: Percent; 999 = DFM not operative.
40. Observer Rating of Driver Drowsiness (ORD) (C-N-I-B) Note: Analysts will use a 100-point scale to code ORD. The analysts can choose any value (i.e., 35, 62, 87) on the following scale. The five given points are to be used as guidelines.

108
If ORD is 25 or greater, mark “drowsy, sleepy, asleep, fatigued, other reduced alertness” under driver 1 behaviors. 999 = Driver is wearing sunglasses or eyes are otherwise blocked from view
Figure 16. Illustration. Observer Rating of Drowsiness scale.
00 = Not Drowsy – No signs of being drowsy 25 = Slightly Drowsy – Driver shows minor signs of being drowsy (single yawn, single stretch, droopy eyes for a short period of time); quickly recovers; does not have any apparent impact on vehicle control. 50 = Moderately Drowsy – Driver shows signs of being drowsy (yawns, stretches, moves around in seat, droopy eyes for a slightly longer period of time; minor blinking); takes slightly longer to recover; does not have any apparent impact on vehicle control. 75 = Very Drowsy – Driver shows signs of being drowsy (yawns often, has very heavy/droopy eyes, frequent blinking); duration lasts much longer; does not have any apparent impact on vehicle control. 100 = Extremely Drowsy – Driver shows extreme signs of being drowsy (yawns often, has very heavy/droopy eyes, has trouble keeping eyes open, very frequent blinking); duration lasts much longer; has apparent impact on vehicle control.
Comment: An observer rating of drowsiness will be assigned for the 1 minute prior to the event based on review of driver videos. Three, six, and 20-minute ORDs will not be obtained because of the labor required and difficulties in averaging reliably over these periods.
41. Driver 1 Potentially Distracting Driver Behaviors (C-N-I-B) Analyst codes up to four behaviors observed during 10.0 seconds prior to max/min trigger value or during final 10.0 seconds of 30-second baseline epoch. Code observed behaviors
0 Not
Drowsy
50 Moderately
Drowsy
25 Slightly Drowsy
75 Very
Drowsy
100 Extremely
Drowsy

109
regardless of their apparent relevance to the incident. Similar to GES, but significantly modified. If there are more than four, select the ones occurring closest in time to the trigger. 00 = None observed 01 = Looked but did not see [ex: Driver looked in direction of crash threat but apparently did not recognize threat. Not applicable to Baseline Epochs.] 02a = Interact with or look at other occupant(s) 02b = Interact with or look at pet in vehicle 03a = Look at, or for, object in vehicle 03b = Reach for object in vehicle (including hand-held cell phone, hands-free cell phone, PDA, CB microphone/other communications device, or other object). 04a = Talk or listen to hand-held phone 04b = Talk or listen to hands-free phone 04c = Talk or listen to CB microphone or other communications device 05a = Dial hand-held phone 05b = Dial hands-free phone 05c = Operate PDA (inputting or reading) 06 = Adjust instrument panel (including climate control, radio, or cassette/CD) 07a = Look at left-side mirror/out left-side window 07b = Look at right-side mirror/out right-side window 07c = Look back in Sleeper Berth 07d = Shift gears 07e = Looks down (at lap, or at something on the floor) 08 = Use or reach for other devices 09 = Appears drowsy, sleepy, asleep, fatigued 10a = Look at previous crash or highway incident 10b = Look at construction zone signs, barriers, flagperson, etc. 10c = Look at outside person 10d = Look at outside animal, object, store, etc. 10e = Look at undetermined outside event, person, or object. 11a = Eat with utensil 11b = Eat without utensil (includes chewing, other than gum; e.g., toothpick) 11c = Drink from covered container (e.g., with straw) 11d = Drink from open container 11e = Chewing gum 12a = Smoking-related behavior – reaching, lighting, extinguishing 12b = Smoking-related behavior – other (e.g., cigarette in hand or mouth) 13a = Read book, newspaper, etc. 13b = Read or look at map 14 = Talk/sing/”dance” with no indication of passenger 15a = Handle or interact with dispatching, electronic recording, or navigational device 15b = Read or look at dispatching, electronic recording, or navigational device 16a = Comb/brush/fix hair 16b = Apply make-up 16c = Shave 16d = Brush/floss teeth

110
16e = Bite nails/cuticles 16f = Remove/adjust jewelry 16g = Remove/insert contact lenses 16h = Other personal hygiene 17 = Look at or handle Driver Fatigue Monitor (DFM) 18 = Look at or handle Data Acquisition System (DAS) (e.g., in-vehicle camera) 19 = Appears inattentive or lost in thought 20 = Other potentially distracting behavior Comment: Similar to GES Variable D7 (Driver Distracted By), with expansions of many elements to capture direct observations. All observed behaviors or conditions occurring within 10.0 seconds prior to the maximum trigger, without regard to apparent relevance to the conflict. For baseline epochs, coded only for activities occurring within the last ten seconds of the 30-second baseline epoch. Hand-held and hands-free phone data coded separately to permit comparisons.
42. Driver 1 Actions/Factors/Behaviors Relating to Event (C-N-I) Note: Analyst codes up to four factors believed to have relevance to the occurrence of the incident; e.g., as contributing factors. If there are more than four, select the four most important. 00a = Not applicable – baseline epoch 00b = None coded 01 = Apparent excessive speed for conditions or location (regardless of speed limit; does not include tailgating, unless above speed limit) 02 = Drowsy, sleepy, asleep, fatigued, other reduced alertness 03 = Angry 04 = Other emotional state 05 = Inattentive or distracted 06 = Apparent impairment (e.g., drowsy, drunk, distracted) -- specific type unknown 07 = Driving slowly; below speed limit or in relation to other traffic 08 = Illegal passing (i.e., across double line) 09 = Passing on right 10 = Other improper or unsafe passing 11a = Cutting in, too close in front of other vehicle 11b = Cutting in at safe distance but then decelerated, causing conflict 12 = Cutting in, too close behind other vehicle 13 = Making turn from wrong lane (e.g., across lanes) 14 = Did not see other vehicle during lane change or merge 15 = Driving in other vehicle’s blind zone 16 = Aggressive driving, specific, directed menacing actions 17 = Aggressive driving, other; i.e., reckless driving without directed menacing actions 18 = Wrong side of road, not overtaking [includes partial or full drift into oncoming lane] 19 = Following too close 19a = Inadequate evasive action 20 = Failed to signal, or improper signal 21 = Improper turn: wide right turn

111
22 = Improper turn: cut corner on left turn 23 = Other improper turning 24 = Improper backing, did not see 25 = Improper backing, other 26 = Improper start from parked position 27 = Disregarded officer or watchman 28 = Signal violation, apparently did not see signal 29= Signal violation, intentionally ran red light 30 = Signal violation, tried to beat signal change 31 = Stop sign violation, apparently did not see stop sign 32 = Stop sign violation, intentionally ran stop sign at speed 33 = Stop sign violation, “rolling stop” 34 = Other sign (e.g., Yield) violation, apparently did not see sign 35 = Other sign (e.g., Yield) violation, intentionally disregarded 36 = Other sign violation 37 = Non-signed crossing violation (e.g., driveway entering roadway) 38 = Right-of-way error in relation to other vehicle or person, apparent recognition failure (e.g., did not see other vehicle) 39 = Right-of-way error in relation to other vehicle or person, apparent decision failure (i.e., did see other vehicle prior to action but misjudged gap) 40 = Right-of-way error in relation to other vehicle or person, other or unknown cause 41 = Sudden or improper stopping on roadway 42 = Parking in improper or dangerous location; e.g., shoulder of Interstate 43 = Speeding or other unsafe actions in work zone 44 = Failure to dim headlights 45 = Driving without lights or insufficient lights 46 = Avoiding pedestrian 47 = Avoiding other vehicle 48 = Avoiding animal 48a = Avoiding object 49 = Apparent unfamiliarity with roadway 50 = Apparent unfamiliarity with vehicle; e.g., displays and controls 51 = Use of cruise control contributed to late braking (does not imply malfunction of cruise control system) 52 = Excessive braking/deceleration creating potential hazard 53 = Loss of control on slippery road surface 54 = Loss of control on dry (or unknown) surface 55 = Apparent vehicle failure (e.g., brakes) 56 = Other Comment: This variable was used in the 100-Car Naturalistic Driving Study, although some new elements have been added. Also, the coding rule is different; in the 100-Car study, the analyst coded up to three factors for each driver, in descending order of judged importance. In the current study, analysts will code all that apply and in no order of importance. Thus, the data from the two studies are not directly comparable. Note that element 6 is not relevant to Driver 1 since analysts will be able to identify impairment type.

112
43. Applicable Countermeasures for DV1 (C-N-I)
Based on the above variables relating to the event scenario, pre-event actions and states, and event causation, a senior analyst will identify applicable functional countermeasures. For crashes, an applicable DV1 functional countermeasure is one that would likely have prevented the crash, either by preventing the genesis of the unsafe condition or by improving the driver response to the unsafe condition. Near-crashes and crash-relevant conflicts are analyzed “as if” a crash had occurred. Below is a table of functional countermeasures and coding rules for them (table 116). The coding of functional countermeasures is based both on algorithmic determination from previous coded variables and on analyst judgment. In many cases, particular “Accident” Type, Critical Reason, or other causation-related codes algorithmically determine applicable functional countermeasures. Some countermeasure choices, however, are coded based on senior analyst judgment.
Table 116. Functional countermeasures and coding rules.
# Functional Countermeasure Scenario/Driver Error Source(s)
Code DV2? Comments
0a Not applicable (baseline epoch) N/A Yes
0b No countermeasure applicable to this driver/vehicle (no driver error and/or coded to other vehicle only)
N/A Yes
0c
No obvious/plausible countermeasure applicable to this driver/vehicle (e.g., insufficient information, due to random occurrence)
N/A
Yes
0d Not applicable: single vehicle event Veh/Non-Motorists Involved = 01, 05-07 Yes Never coded for V1
1 Increase driver alertness (reduce drowsiness)
CR = 100 or 107 OR Analyst Judgment considering PERCLOS, ORD, Driver Behavior
No
2
Improve commercial driver Hours-of-Service compliance (i.e., reflective of alertness-related incident during HOS violation period)
No Not coded during Phase I; potential for Phase II.
3
Prevent “drift” lane departures (e.g., due to fatigue, inattention, misjudgment of lines)
AT = 01 or 06
Yes
No evidence of intention; e.g., lane change.
4 Improve vehicle control/stability on curves
Trigger Type = 1 AND PEM = 14 AND AT = 02, 07, 46, 47, or 50
Yes Assumes potential rollover or other LOC event; no triggers for V2
5 Improve vehicle control/stability on slippery road surfaces
Road surface = 2-5 AND CPE = 05 Yes
6 Improve vehicle control/stability during braking
CPE = 09 OR Avoidance Maneuver = 3 Yes
7 Improve vehicle control/stability during evasive steering
CPE = 10 OR Avoidance Maneuver = 6-9 with LOC
Yes
8 Increase driver attention to forward visual scene (e.g., eyes on road)
Analyst Judgment, considering potential distractions coded (V39) and CR (e.g., 110-119, 140)
No

113
# Functional Countermeasure Scenario/Driver Error Source(s)
Code DV2? Comments
9
Increase/improve driver use of mirrors or provide better information from mirrors (or from other indirect visibility systems)
AT = 46, 47, 70, 73, 76, 78, or others TBD AND Vision Obscured = 12 or 16 No
10 Improve general driver situation awareness and/or proactive/defensive driving
Analyst judgment No
Not coded if 1 and/or 8 are coded.
12 Reduce road/highway travel speed
CR = 120 OR Driver Behavior = 1, 43
Yes
Includes all road configurations and thus is inclusive of 14-16. However, does not include all speeds above speed limit; must be significant factor
13 Reduce speed on down grades CR = 120 AND Profile = 2b OR Driver B = 1, 43 AND Profile = 2b
No
14 Reduce speed on curves or turns
CR = 120 AND Alignment = 2a, 2b OR Driver B = 1, 43 AND Alignment = 2a, 2b
No
15 Reduce speed at or on exits (including ramps)
CR = 120 AND Profile = 2b OR Driver B = 1, 43 AND Profile = 2b
No
16 Limit top speed to 70 mi/h (except on down grades)
Prevented speed > 70 mi/h; Analyst judgment Evidence: CR = 120; Driver A/F/B = 1
No
17
Increase driver recognition/appreciation of specific highway crash threats: stopped vehicle(s) in lane ahead, traveling in same direction
AT = 11, 20 AND CR = 107-119
Yes
18
Increase driver recognition/appreciation of specific highway crash threats: moving/decelerating vehicle(s) in lane ahead, traveling in same direction
AT = 24, 28 AND CR = 107-119
Yes
19
Increase driver recognition/appreciation of specific highway crash threats: Vehicle in left adjacent lane on highway
AT = 47 AND CR = 107-119 Yes
20
Increase driver recognition/appreciation of specific highway crash threats: Vehicle in right adjacent lane on highway
AT = 46 AND CR = 107-114 Yes
21
Increase driver recognition/appreciation of specific highway crash threats: Vehicle in left adjacent lane during merging maneuver
AT = 47, 78 AND PEM = 16 AND CR = 107-119 Yes
22
Increase driver recognition/appreciation of specific highway crash threats: Vehicle in right adjacent lane during merging maneuver
AT = 46, 76 AND PEM = 16 AND CR = 107-119 Yes
23 Increase driver recognition of crossing or oncoming traffic at intersections
AT = 76, 78, 80, 82-91 AND CR = 107-119 Yes

114
# Functional Countermeasure Scenario/Driver Error Source(s)
Code DV2? Comments
24 Improve driver gap judgment re: crossing or oncoming traffic at intersections
AT = 76, 78, 80, 82-91 AND CR = 122 Yes
25 Improve driver response execution of crossing or turning maneuver at intersections (performance failure)
AT = 76, 78, 80, 82-91 AND CR = 141-199 Yes
26
Improve driver recognition/gap judgment/response execution at intersection, (specific cause not determined)
AT = 76, 78, 80, 82-91 AND CR = 140 or 199 Yes
27
Improve driver compliance with intersection traffic signal (e.g., red light) controls (includes both intentional and unintentional intersection control violations).
Driver A/F/B = 28-30
Yes
28
Improve driver compliance with intersection traffic sign (e.g., stop or yield sign) controls (includes both intentional and unintentional intersection control violations).
Driver A/F/B = 31-33
Yes
29 Increase forward headway during vehicle following
AT = 24, 28 AND CR = 123 Yes
Applies to tailgating scenarios, not rapid closing scenarios.
30 Improve driver night vision in the forward field
Light = 2, 3 AND AT = 1-14, 20, 34, 36, 38, 40 AND Analyst judgment
Yes CM would provide earlier driver recognition of distant object (e.g., pedestrian waling in roadway)
32
Provide warning to prevent rear encroachment or tailgating by other vehicle (i.e., this vehicle is lead vehicle, other vehicle is following)
AT = 21, 22, 23, 25, 26, 27, 29, 30, 31 Yes
Reciprocal relation between 17/18 and 32; i.e., if one vehicle is coded 17 or 18, other vehicle is coded 32.
33 Provide advisory to driver regarding reduced road-tire friction (i.e., associated with slippery roads)
Roadway surface condition = 2-5 AND LOC AND Analyst judgment
No
34 Prevent vehicle mechanical failure (e.g., brakes, steering, tire blowout)
CR = 200-209, 298-299 Yes Likely undercounted in instrumented vehicle studies
35 Other, specify Analyst judgment Yes
When possible, analyst will specify associated pre-crash/causation algorithm and add to list of CMs.
36 Prevent splash and spray from this vehicle affecting other vehicle(s)
AT = 25-26, 35-41, 45-47 AND Analyst judgment AND Roadway surface condition = 2-3
Yes
37 Improve driver recognition/gap judgment relating to oncoming vehicle during passing maneuver
PEM = 06 AND AT = 50 or 64 AND CR = 110-119, 120-122, or 128-140
Yes
38 Prevent animals from crossing roadways
Vehicle/Person 2 Type = 13 or 14 No Applicable to all animal-related
events 39 Navigation system/routing aid Driver A/F/B = 49 No
40 Aid to vertical clearance estimation Object = overhanging object No Used when truck hits or has the potential to hit overhanging object (e.g., tree limb).

115
# Functional Countermeasure Scenario/Driver Error Source(s)
Code DV2? Comments
98
Driver error and/or vehicle failure apparent for this vehicle, but countermeasure(s) to address it unknown.
Vehicle has CR but no other CM specified. Yes
Not coded if other CMs coded.
99 Unknown Yes Not coded if other CMs coded. KEY: AT = Accident Type / CR = Critical Reason / CM = Countermeasure / PEM = Pre-Event Movement CPE = Critical Pre-
Crash Event / A = Actions / B = Behaviors / F = Factors / TBD = To Be Determined / LOC = Loss of Control
Driver/Vehicle 2 Variables 44. Vehicle/Person 2 Type (C-N-I)
00a = Not applicable (baseline epoch) 00b = Not applicable (single vehicle event; includes single vehicle + object) 01 = Automobile 02 = Van (minivan or standard van) 03 = Pickup truck 03a = SUV (includes Jeep) 04 = Bus (transit or motor coach) 05 = School bus 06 = Single-unit straight truck (includes panel truck, U-Haul truck) 07 = Tractor-trailer 08 = Motorcycle or moped 09 = Emergency vehicle (police, fire, EMS = in service) 10 = Vehicle pulling trailer (other than tractor-trailer) 11 = Other vehicle type 12 = Pedestrian 13 = Pedalcyclist 14 = Deer 15 = Other animal 99 = Unknown vehicle type Comment: Highly abridged version of GES V5, Body Type. If “Driver/Vehicle” 2 is a pedestrian, pedalcyclist, animal, or object, most other D/V 1 File variables will be coded “not applicable.”

116
45. Vehicle 2 Position (in Relation to V1) (C-N-I)
00 = Not applicable (baseline epoch) 00a = Not applicable (single vehicle event) K = Top of vehicle
Front
J A B
I
C
H D
G F E
Rear
Figure 17. Illustration. Relative position of Vehicle 2 to Vehicle 1.
Comment: The vehicle in the diagram represents the subject vehicle (V1, the truck). The relative position of Vehicle 2 (in relation to Vehicle 1) is coded for the time in which the Critical Event occurs; i.e., the event creating the crash risk. Vehicles in adjacent left lane are coded J, I, H, or G depending on position. Vehicles in adjacent right lane are coded B, C, D, E depending on position. Baseline epochs will be coded “0.”
46. Vehicle 2 Pre-Event Movement (C-N-I)
00 = No driver present 00a = Not applicable (single vehicle event) 01 = Going straight 02 = Decelerating in traffic lane 03 = Accelerating in traffic lane 04 = Starting in traffic lane 05 = Stopped in traffic lane 06 = Passing or overtaking another vehicle 07 = Disabled or parked in travel lane 08a = Leaving a parking position, moving forward 08b = Leaving a parking position, backing 09a = Entering a parking position, moving forward 09b = Entering a parking position, backing 10 = Turning right 11 = Turning left 12 = Making a u-turn 13 = Backing up (other than parking) 14 = Negotiating a curve 15 = Changing lanes
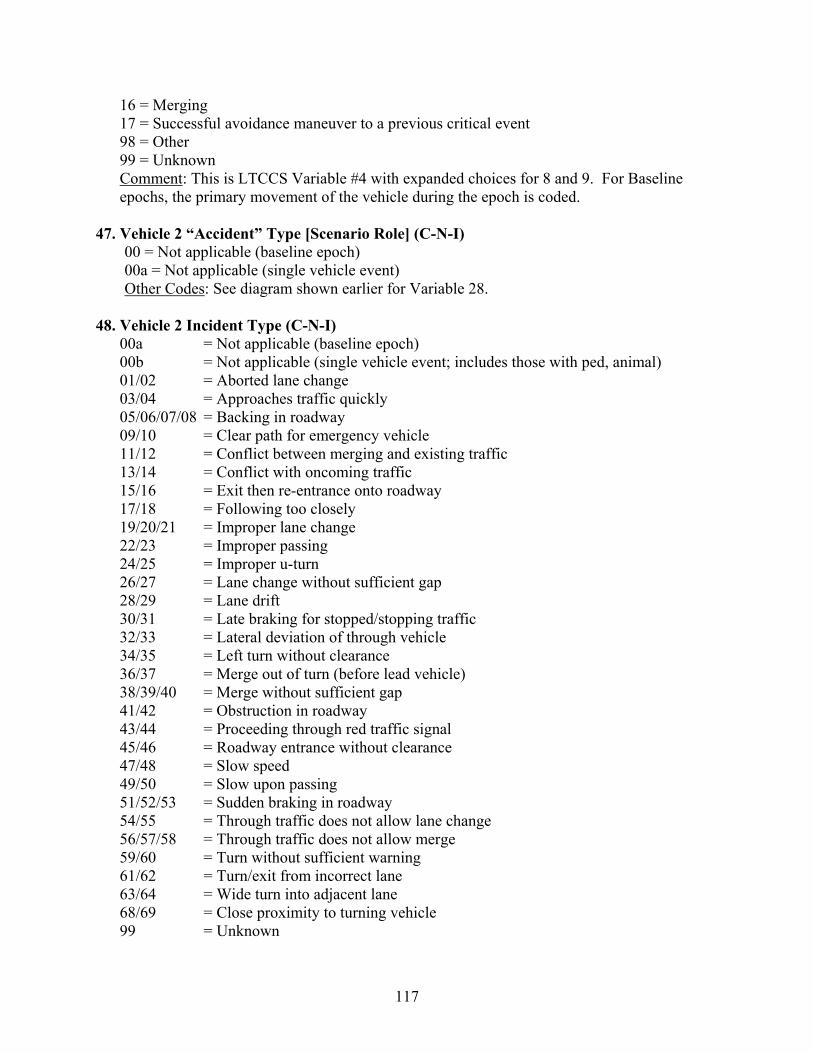
117
16 = Merging 17 = Successful avoidance maneuver to a previous critical event 98 = Other 99 = Unknown Comment: This is LTCCS Variable #4 with expanded choices for 8 and 9. For Baseline epochs, the primary movement of the vehicle during the epoch is coded.
47. Vehicle 2 “Accident” Type [Scenario Role] (C-N-I) 00 = Not applicable (baseline epoch) 00a = Not applicable (single vehicle event) Other Codes: See diagram shown earlier for Variable 28.
48. Vehicle 2 Incident Type (C-N-I)
00a = Not applicable (baseline epoch) 00b = Not applicable (single vehicle event; includes those with ped, animal) 01/02 = Aborted lane change 03/04 = Approaches traffic quickly 05/06/07/08 = Backing in roadway 09/10 = Clear path for emergency vehicle 11/12 = Conflict between merging and existing traffic 13/14 = Conflict with oncoming traffic 15/16 = Exit then re-entrance onto roadway 17/18 = Following too closely 19/20/21 = Improper lane change 22/23 = Improper passing 24/25 = Improper u-turn 26/27 = Lane change without sufficient gap 28/29 = Lane drift 30/31 = Late braking for stopped/stopping traffic 32/33 = Lateral deviation of through vehicle 34/35 = Left turn without clearance 36/37 = Merge out of turn (before lead vehicle) 38/39/40 = Merge without sufficient gap 41/42 = Obstruction in roadway 43/44 = Proceeding through red traffic signal 45/46 = Roadway entrance without clearance 47/48 = Slow speed 49/50 = Slow upon passing 51/52/53 = Sudden braking in roadway 54/55 = Through traffic does not allow lane change 56/57/58 = Through traffic does not allow merge 59/60 = Turn without sufficient warning 61/62 = Turn/exit from incorrect lane 63/64 = Wide turn into adjacent lane 68/69 = Close proximity to turning vehicle 99 = Unknown

118
Comment: This scenario classification has been used in Hanowski, Keisler, and Wierwille (2004) and Hanowski, Olson, Hickman, and Dingus (2005). (28,32) Coding this variable will enable comparisons with that study. See Variable 29 for diagrams of these scenarios.
49. Vehicle 2 Critical Precrash Event (C-N-I) 00 = Not applicable (baseline epoch) 00a = Not applicable (single vehicle event) THIS VEHICLE (V2) LOSS OF CONTROL DUE TO: 01 = Blow out or flat tire 02 = Stalled engine 03 = Disabling vehicle failure (e.g., wheel fell off) 04 = Non-disabling vehicle problem (e.g., hood flew up) 05 = Poor road conditions (wet road, puddle, pot hole, ice, etc.) 06 = Traveling too fast for conditions 07 = Jackknife event 08 = Cargo shift 09 = Braking 10 = Steering 18 = Other cause of control loss 19 = Unknown cause of control loss THIS VEHICLE (V1) TRAVELING 20 = Toward or over the lane line on left side of travel lane 21 = Toward or over the lane line on right side of travel lane 22 = Toward or off the edge of the road on the left side 23 = Toward or off the edge of the road on the right side 24 = End departure 25 = Turning left at intersection 26 = Turning right at intersection 27 = Crossing over (passing through) intersection 28 = This vehicle decelerating 29 = Unknown travel direction OTHER MOTOR VEHICLE (V2) IN LANE 50 = Other vehicle stopped 51 = Traveling in same direction with lower steady speed 52 = Traveling in same direction while decelerating 53 = Traveling in same direction with higher speed 54 = Traveling in opposite direction 55 = In crossover 56 = Backing 59 = Unknown travel direction of other motor vehicle in lane OTHER MOTOR VEHICLE (V2) ENCROACHING INTO LANE 60 = From adjacent lane (same direction) – toward or over left lane line

119
61 = From adjacent lane (same direction) – toward or over right lane line 62 = From opposite direction - toward or over left lane line 63 = From opposite direction - toward or over right lane line 64 = From parking lane 65 = From crossing street, turning into same direction 66 = From crossing street, across path 67 = From crossing street, turning into opposite direction 68 = From crossing street, intended path not known 70 = From driveway, turning into same direction 71 = From driveway, across path 72 = From driveway, turning into opposite direction 73 = From driveway, intended path not known 74 = From entrance to limited access highway 78 = Encroachment by other vehicle - details unknown PEDESTRIAN, PEDALCYCLIST, OR OTHER NONMOTORIST 80 = Pedestrian in roadway 81 = Pedestrian approaching roadway 82 = Pedestrian - unknown location 83 = Pedalcyclist or other nonmotorist in roadway 84 = Pedalcyclist or other nonmotorist approaching roadway 85 = Pedalcyclist or other nonmotorist - unknown location OBJECT OR ANIMAL 87 = Animal in roadway 88 = Animal approaching roadway 89 = Animal - unknown location 90 = Object in roadway 91 = Object approaching roadway 92 = Object - unknown location OTHER 93 = This vehicle not involved in first harmful event 98 = Other critical pre-crash event 99 = Unknown Comment: This is LTCCS Variable #5. Per discussion with Ralph Craft of FMCSA, this variable is coded for both vehicles in a two-vehicle incident. However, the Critical Reason (see below), is coded for only one vehicle. In the above list, note addition of 09 = loss of control due to braking and 10 = steering.
50. DV2 Critical Reason for the Critical Event (C-N-I) 000a = Not applicable (baseline epoch) 000b = Not applicable (single vehicle event) 000c = Critical reason not coded to this vehicle
DRIVER-RELATED FACTOR

120
Critical Non-Performance Errors 100 = Sleep, that is, actually asleep 101 = Heart attack or other physical impairment of the ability to act 107 = Drowsiness, fatigue, or other reduced alertness (not asleep) 108 = Other critical non-performance 109 = Apparent critical non-performance [includes any apparent driver impairment] DRIVER-RELATED FACTOR Recognition Errors 110 = Inattention (i.e., daydreaming) 111 = Internal distraction 112 = External distraction 113 = Inadequate surveillance (e.g., failed to look, looked but did not see) 118 = Other recognition error 119 = Apparent recognition error Decision Errors 120 = Too fast for conditions (e.g., for safe vehicle control or to be able to respond to unexpected actions of other road users) 121 = Too slow for traffic stream 122 = Misjudgment of gap or other’s speed 123 = Following too closely to respond to unexpected actions (close proximity for 2 or more seconds) 124 = False assumption of other road user’s actions 125 = Illegal maneuver 125a = Apparently intentional sign/signal violation 125b = Illegal U-turn 125c = Other illegal maneuver 126 = Failure to turn on head lamps 127 = Inadequate evasive action (e.g., braking only not braking and steering; release accelerator only instead of braking) 128a = Aggressive driving behavior: Intimidation: any behavior emitted by a driver while driving that is intended to cause physical or psychological harm to another person. 128b = Aggressive driving behavior: Wanton, neglectful or reckless behavior: excessive risky driving behaviors performed without intent to harm others, such as weaving through traffic, maneuvering without signaling, running red lights, frequent lane changing, and tailgating 138 = Other decision error 139 = Apparent, unknown decision error 140 = Apparent recognition or decision error (unknown which) Performance Errors 141 = Panic/Freezing 142 = Overcompensation 143 = Poor directional control, e.g., failing to control vehicle with skill ordinarily expected 148 = Other performance error

121
149 = Apparent performance error 199 = Type of driver error unknown VEHICLE-RELATED FACTOR 200 = Tires/wheels failed 201 = Brakes failed 202 = Steering failed 203 = Cargo shifted 204 = Trailer attachment failed 205 = Suspension failed 206 = Lights failed 207 = Vehicle-related vision obstructions 208 = Body, doors, hood failed 209 = Jackknifed 298 = Apparent other vehicle failure 299 = Unknown vehicle failure ENVIRONMENT-RELATED FACTOR Highway Related 500 = Signs/signals missing 501 = Signs/signals erroneous/defective 502 = Signs/signals inadequate 503 = View obstructions by roadway design 504 = View obstructed by other vehicles crash circumstance 505 = Road design - roadway geometry (e.g., ramp curvature) 506 = Road design - sight distance 507 = Road design - other 508 = Maintenance problems (potholes, deteriorated road edges, etc.) 509 = Slick roads (low friction road surface due to ice, loose debris, any other cause) 518 = Other highway-related condition Weather Related 521 = Rain, snow [Note: code loss-of-control as 509] 522 = Fog 523 = Wind gust 528 = Other weather-related condition Other 530 = Glare 531 = Blowing debris 532 = Animal in roadway (no driver error) 538 = Other sudden change in ambience 999 = Unknown reason for critical event Comment: LTCCS Variable #6, with revisions reflecting lack of information about Driver 2. Many Critical Reason elements available for DV1 are not allowed for DV2 because they

122
require observation of pre-crash driver behavior. The remaining elements for DV2 are either maneuvers or conditions visible from outside the vehicle (e.g., most of the decision error choices) or reasonable general inferences (e.g., Codes 109, 119, 139, 140, 149).
51. Attempted Avoidance Maneuver (C-N-I)
00 = No driver present 00a = Not applicable (baseline epoch) 00b = Not applicable (single vehicle event) 01 = No avoidance maneuver 02 = Braking (no lockup or lockup unknown) 03 = Braking (lockup) 04 = Braking (lockup unknown) 05 = Releasing brakes 06 = Steered to left 07 = Steered to right 08 = Braked and steered to left 08a = Braked and steered to left (no lockup or lockup unknown) 08b = Braked and steered to left (lockup) 09 = Braked and steered to right 09a = Braked and steered to right (no lockup or lockup unknown) 09b = Braked and steered to right (lockup) 10 = Accelerated 11 = Accelerated and steered to left 12 = Accelerated and steered to right 98 = Other actions 99 = Unknown if driver attempted any corrective action Comment: LTCCS Variable #7 and also GES V27, Corrective Action Attempted. The “released gas pedal” elements available for DV1 are not available for DV2 since they would not be observable from outside the vehicle.
52. Driver Behavior: Driver 2 Actions/Factors Relating to Event (C-N-I)
Note: Analyst codes up to four factors believed to have relevance to the occurrence of the incident; e.g., as contributing factors. If there are more than four, select the four most important. 00a = Not applicable (baseline epoch) 00b = Not applicable (single vehicle event) 00 = None coded 01 = Apparent excessive speed for conditions or location (regardless of speed limit; does not include tailgating, unless above speed limit) 02 = Drowsy, sleepy, asleep, fatigued, other reduced alertness 03 = Angry 04 = Other emotional state 05 = Alert but inattentive or distracted 06a = Vehicle “drift” or “slow weave” consistent with possible drowsy/distracted driving

123
06b = Erratic steering, weaving, lane break, or other vehicle motion consistent with possible alcohol-impaired driving. 07 = Driving slowly; below speed limit or in relation to other traffic 08 = Illegal passing (i.e., across double line) 09 = Passing on right 10 = Other improper or unsafe passing 11a = Cutting in, too close in front of other vehicle 11b = Cutting in at safe distance but then decelerated, causing conflict 12 = Cutting in, too close behind other vehicle 13 = Making turn from wrong lane (e.g., across lanes) 14 = Did not see other vehicle during lane change or merge 15 = Driving in other vehicle’s blind zone 16 = Aggressive driving, specific, directed menacing actions 17 = Aggressive driving, other; i.e., reckless driving without directed menacing actions 18 = Wrong side of road, not overtaking [includes partial or full drift into oncoming lane] 19 = Following too close 19a = Inadequate evasive action 20 = Failed to signal, or improper signal 21 = Improper turn: wide right turn 22 = Improper turn: cut corner on left turn 23 = Other improper turning 24 = Improper backing, [apparently] did not see 25 = Improper backing, other 26 = Improper start from parked position 27 = Disregarded officer or watchman 28 = Signal violation 29 = Not used 30 = Signal violation, tried to beat signal change 31 = Stop sign violation 32 = Not used 33 = Stop sign violation, “rolling stop” 34 = Other sign (e.g., Yield) violation 35 = Not used 36 = Other sign violation 37 = Non-signed crossing violation (e.g., driveway entering roadway) 38 = Right-of-way error in relation to other vehicle or person 39 = Not used 40 = Not used 41 = Sudden or improper stopping on roadway 42 = Parking in improper or dangerous location; e.g., shoulder of Interstate 43 = Speeding or other unsafe actions in work zone 44 = Failure to dim headlights 45 = Driving without lights or insufficient lights 46 = Avoiding pedestrian 47 = Avoiding other vehicle 48 = Avoiding animal

124
48a = Avoiding object 49 = Apparent unfamiliarity with roadway 50 = Apparent unfamiliarity with vehicle; e.g., displays and controls 51 = Use of cruise control contributed to late braking 52 = Excessive braking/deceleration creating potential hazard 53 = Loss of control on slippery road surface 54 = Loss of control on dry (or unknown) surface 55 = Apparent vehicle failure (e.g., brakes) 56 = Other 57 = Unknown Comment: Parallel variable to #40. Note, however, that a number of element choices relating to specific driver behaviors or impairments are disallowed because these will not be observable for Driver 2. Also, for signal, sign, and right-of-way violations, analysts code the violation but do not attempt to ascertain whether the violation was intention or due to recognition failure. Thus, several elements are not used. As noted under #40, this variable was used in the 100-Car Naturalistic Driving Study, although some new elements have been added. Also, the coding rule is different; in the 100-Car study, the analyst coded up to three factors for each driver, in descending order of judged importance. In the current study, analysts will code all that apply and in no order of importance. Thus, the data from the two studies are not directly comparable.
53. Applicable Functional Countermeasures for DV2 (C-N-I)
Based on the above variables relating to the event scenario, pre-event actions and states, and event causation, a senior analyst will identify applicable functional countermeasures. For crashes, an applicable DV2 functional countermeasure is one that would likely have prevented the crash, either by preventing the genesis of the unsafe condition or by improving the driver response to the unsafe condition. Near-crashes and crash-relevant conflicts are analyzed “as if” a crash had occurred. Variable 41 provides a table of functional countermeasures and shows coding rules for them. The coding of functional countermeasures is based both on algorithmic determination from previous coded variables and on analyst judgment. In many cases, particular “Accident” Type, Critical Reason, or other causation-related codes algorithmically determine applicable functional countermeasures. Some countermeasure choices, however, are coded based on senior analyst judgment. Note that most potential functional countermeasures are coded for DV2, but that some are not due to the fact that little information is available to analysts on the specific Driver 2 behaviors and states.
General
54. Event Comments (C-N-I-B) Comment: This text variable will permit analysts to provide any comments on the event, including information not captured by data variables, assumptions made about the event affecting coding, and coding issues that arose. Ordinarily this will not contain information that is captured by the coded variables.

125
APPENDIX B: ORD AND EMP DESCRIPTIVE STATISTICS BY INDIVIDUAL DRIVER
Table 117. ORD descriptive statistics by individual driver.
Driver ID ORD Range
ORD Mean
ORD Std Dev
Number of Safety Critical
Events
Number of SCEs with ORD > 40
Number of
Baselines
Number of Baselines with
ORD > 40 1 4 - 85 44.4 23.3 3 3 20 10 2 24 - 68 46.6 12.6 7 5 23 13 3 10 - 85 23.1 21.2 8 1 6 1 4 15 - 95 41.4 24.3 10 5 5 2 5 8 - 60 32.5 12.4 7 2 17 5 7 17 - 96 45.3 20.8 14 8 14 8 8 4 - 62.83 33.4 15.2 10 2 11 4 9 8 - 79 28.8 17.1 2 0 26 8
10 15 - 63 31.7 17.1 1 0 5 1 11 9 - 71 34.1 25.4 3 0 6 2 12 5 - 36.23 16.8 13.0 12 0 11 0 13 9 - 72 35.8 17.9 10 4 11 5 14 10.2 - 79 10.2 18.0 13 1 23 11 15 15 - 48 48.0 11.1 6 4 15 4 16 9 - 71 31.7 16.2 45 11 21 8 17 5 - 89 28.5 17.4 32 5 29 5 18 9 - 70 34.9 16.1 13 6 26 8 19 12 - 64 37.4 14.5 18 8 26 9 20 5 - 64.97 35.7 17.6 0 0 20 8 21 13 - 90 50.6 22.9 4 1 18 11 22 21 - 85 49.6 21.9 8 0 23 5 23 7 - 61.93 32.7 13.6 34 3 23 9 24 10 - 70.67 35.1 15.4 23 7 27 8 25 17 - 66.53 47.5 21.6 2 0 6 1 26 5 - 55 27.9 13.2 15 3 24 3 27 5 - 85 35.5 17.4 19 7 24 10 28 3 - 48.6 22.7 13.6 29 2 24 3 29 8 - 79 40.0 17.5 6 0 24 14 30 12 - 76 38.2 19.5 2 1 26 7 31 8 - 52.77 21.5 12.5 18 0 27 3 32 8 - 65 27.2 16.6 25 1 23 9 33 11 - 50 32.5 13.5 16 3 26 5 34 20 - 53.33 37.0 11.0 5 1 9 2 35 3.3 - 47.37 22.3 10.7 2 0 21 1 37 7 - 49 27.9 12.4 0 0 23 5 38 10 - 47 28.5 13.2 1 0 20 6 39 10 - 87 37.2 13.8 57 10 24 13
101 8.5 - 72 35.9 15.1 9 1 24 7 102 2.8 - 59 31.5 16.7 5 0 24 8 103 6.9 - 62.17 28.6 15.3 26 3 20 3 104 6 - 53 30.5 14.8 4 3 24 6 105 8 - 42 18.2 9.8 6 1 6 0 106 6 - 69.77 37.0 20.6 6 1 26 17 107 4 - 48 23.6 12.3 25 2 15 4 108 8 - 80 32.5 19.7 9 2 26 10 109 25.57 - 60 40.8 13.0 0 0 8 5 110 14 - 85 43.1 15.7 47 24 24 13 111 4 - 47.37 25.8 14.0 6 0 23 5 112 6 - 54.9 26.8 11.3 36 2 14 2 113 26 - 48 36.1 8.3 1 0 9 2 114 9 - 86 44.4 23.3 24 10 15 4 115 11 - 49.4 34.3 14.8 2 0 12 4 116 8 - 55 28.5 14.0 8 1 27 7 118 27 - 69 48.5 13.5 2 0 23 11 119 6 - 90 30.0 17.9 22 1 20 4

126
120 18.8 - 58.93 39.2 11.4 18 9 21 12 121 19 - 56 37.4 12.5 6 3 15 6 122 13 - 85 49.9 16.1 2 0 18 15 123 7 - 89 31.8 18.4 19 1 24 10 124 3.8 - 79.03 31.5 18.3 12 0 18 1 125 3 - 67.67 30.7 14.3 33 3 26 11 126 7.1 - 64 39.6 13.1 7 3 23 13 127 1.4 - 61 33.5 16.4 7 0 23 8 128 3 - 70 37.1 14.0 6 2 29 10 129 23 - 51 34.8 8.6 1 1 27 6 130 8 - 56 27.6 16.2 1 0 21 5 131 5.8 - 66.9 35.1 17.3 25 5 23 4 132 18 - 53 35.6 10.4 5 1 23 9 134 30 - 50.77 40.4 14.7 0 0 2 1 135 10 - 75.03 37.4 16.8 4 3 23 7 136 22 - 55.2 37.2 9.2 3 1 26 10 137 20.77 - 59 36.1 9.6 3 1 21 7 138 12 - 71.73 49.9 16.5 3 2 17 14 151 14 - 55.9 34.7 11.9 1 0 24 6 152 10 - 52.4 39.5 10.3 6 0 24 16 153 10 - 49.03 32.9 10.1 12 1 24 7 154 25.5 - 53.6 36.4 9.4 7 1 21 8 201 11 - 48 31.6 10.8 0 0 15 2 202 19 - 65 44.6 12.1 0 0 23 15 203 5.7 - 89 46.9 20.8 16 3 24 7 204 3.9 - 82.23 35.9 12.7 51 9 24 13 205 23.9 - 81 43.2 14.7 20 8 18 8 206 8 - 37.07 25.5 12.2 1 0 8 0 210 26 - 93.57 45.6 18.5 11 1 21 7 212 36.17 - 55 47.4 9.9 0 0 3 2 213 5 - 70 36.4 13.8 16 2 24 12 215 9 - 46 26.6 13.5 6 0 23 2 216 22 - 89 54.2 20.4 6 2 24 14 217 14 - 55 37.9 11.3 2 1 23 9 218 3 - 37.27 18.4 13.7 1 0 5 0 219 11 - 76 30.6 14.1 16 3 23 0 221 2 - 67 29.4 16.4 9 3 21 6 232 23.93 - 44.73 34.4 7.7 4 0 20 5 234 13 - 46 26.9 12.6 3 0 23 3 236 12 - 78 44.7 15.7 4 3 24 13 242 4 - 52.6 31.8 8.4 62 7 21 3 244 22.4 - 51.23 33.6 9.2 8 1 20 3 245 28.93 - 50.5 38.6 5.6 6 1 17 4 246 25.1 - 55.1 37.4 8.2 11 2 23 10 247 26.2 - 48.17 38.2 8.1 9 2 17 4 248 18.47 - 76.83 38.0 13.0 8 1 23 7 249 22.53 - 43 32.9 11.2 26 2 30 13 250 7 - 80 39.8 13.9 49 6 35 16

127
Table 118. EMP descriptive statistics by individual driver.
Driver ID Range Mean Std.
Dev.
Number of
Safety Critical Events
Number of SCEs with EMP > 12
Number of
Baselines
Number of Baselines with
EMP > 12
1 2.50% - 10.39% 6.38% 0.02 3 0 20 0
2 7.90% - 26.66% 17.00% 0.05 7 3 23 15
3 0.78% - 12.95% 3.33% 0.03 8 1 6 0
4 1.47% - 8.86% 4.26% 0.02 10 0 5 0
5 2.98% - 27.24% 14.90% 0.07 7 1 17 6
7 1.53% - 24.56% 13.10% 0.08 14 8 14 3
8 4.00% - 16.08% 8.71% 0.03 10 1 11 1
9 2.62% - 22.49% 7.33% 0.05 2 0 26 3
10 3.32% - 11.26% 6.97% 0.03 1 0 5 0
11 1.13% - 11.14% 5.14% 0.04 3 0 6 0
12 0.78% - 10.19% 3.86% 0.03 12 0 11 0
13 5.83% - 23.61% 11.60% 0.06 10 0 11 3
14 3.80% - 17.20% 7.59% 0.03 13 0 23 3
15 1.11% - 5.00% 2.70% 0.01 6 0 15 0
16 1.14% - 11.62% 5.58% 0.03 45 0 21 0
17 0.33% - 21.13% 2.67% 0.04 32 1 29 0
18 1.17% - 9.91% 3.73% 0.02 13 0 26 0
19 0.85%- 8.39% 2.72% 0.02 18 0 26 0
20 5.15% - 29.11% 16.70% 0.06 0 0 20 14
21 2.39% - 14.39% 6.66% 0.03 4 0 18 2
22 2.44% - 9.84% 4.96% 0.02 8 0 23 0
23 5.36% - 18.46% 9.65% 0.04 34 2 23 1
24 0.00% - 11.11% 1.35% 0.02 23 0 27 0
25 4.42% - 13.28% 9.71% 0.03 2 0 6 1
26 0.23% - 24.46% 9.67% 0.06 15 0 24 7
27 0.33% - 9.96% 3.15% 0.02 19 0 24 0
28 0.85% - 9.68% 2.66% 0.02 29 0 24 0
29 7.74% - 21.03% 14.84% 0.04 6 0 24 14
30 1.06% - 15.17% 5.83% 0.05 2 0 26 3
31 0.54% - 14.84% 6.15% 0.03 18 0 27 3
32 1.59% - 24.30% 13.27% 0.08 25 11 23 13
33 0.78% - 6.34% 3.60% 0.02 16 0 26 0
34 5.91% - 22.28% 12.13% 0.04 5 3 9 4
35 1.91% - 10.04% 4.82% 0.02 2 0 21 0
37 0.11% - 17.42% 8.38% 0.06 0 0 23 5
38 0.44% - 12.52% 5.75% 0.03 1 0 20 1
39 1.84% - 17.70% 8.72% 0.04 57 1 24 7

128
101 0.00% - 2.33% 0.96% 0.01 9 0 24 0
102 0.56% - 27.46% 5.85% 0.07 5 0 24 3
103 1.36% - 13.52% 5.03% 0.03 26 1 20 1
104 1.90% - 23.22% 9.51% 0.06 4 2 24 6
105 4.43% - 9.17% 6.30% 0.01 6 0 6 0
106 2.33% - 14.72% 6.04% 0.03 6 1 26 0
107 0.11% - 3.61% 1.06% 0.01 25 0 15 0
108 2.74% - 13.91% 6.29% 0.02 9 0 26 1
109 2.93% - 6.52% 5.13% 0.01 0 0 8 0
110 0.94% - 26.13% 11.42% 0.06 47 14 24 8
111 1.25% - 18.57% 9.62% 0.05 6 0 23 5
112 0.67% - 22.15% 3.85% 0.04 36 0 14 1
113 0.73% - 2.56% 1.64% 0.01 1 0 9 0
114 1.06% - 12.89% 7.08% 0.03 24 0 15 1
115 0.44% - 8.25% 3.29% 0.03 2 0 12 0 116 1.95% - 13.17% 4.70% 0.02 8 1 27 0 118 4.22% - 17.56% 7.78% 0.04 2 0 23 1 119 0.67% - 7.95% 4.15% 0.02 22 0 20 0 120 0.11% - 4.02% 1.19% 0.01 18 0 21 0 121 1.34% - 17.91% 5.05% 0.04 6 0 15 1 122 2.78% - 19.09% 10.08% 0.05 2 1 18 4 123 0.17% - 9.38% 1.90% 0.02 19 0 24 0 124 0.44% - 13.01% 3.04% 0.03 12 0 18 7 125 2.30% -17.99% 9.37% 0.04 33 4 26 6 126 0.00% - 1.78% 0.46% 0.00 7 0 23 0 127 8.62% - 25.01% 13.80% 0.04 7 3 23 8 128 1.80% - 29.99% 11.44% 0.08 6 2 29 9 129 0.61% - 4.81% 2.04% 0.01 1 0 27 0 130 1.94% - 15.54% 6.67% 0.04 1 0 21 2 131 2.63% - 19.18% 9.92% 0.06 25 0 23 6 132 1.01% - 9.17% 3.50% 0.02 5 0 23 0 134 2.00% - 8.92% 5.46% 0.05 0 0 2 0 135 0.11% - 2.17% 0.71% 0.01 4 0 23 0 136 1.29% - 11.23% 5.68% 0.02 3 0 26 0 137 0.56% - 5.72% 2.13% 0.01 3 0 21 0 138 1.83% - 10.89% 5.62% 0.03 3 0 17 0 151 0.45% - 16.06% 4.83% 0.04 1 0 24 1 152 3.70% - 16.81% 8.13% 0.04 6 0 24 4 153 0.70% - 2.78% 1.42% 0.01 12 0 24 0 154 1.58% - 9.38% 4.60% 0.02 7 0 21 0 201 6.90% - 18.44% 13.40% 0.04 0 0 15 10 202 1.50% - 11.61% 5.26% 0.02 0 0 23 0

129
203 1.40% - 12.74% 5.72% 0.03 16 0 24 1 204 0.44% - 30.58% 3.41% 0.04 51 0 24 1 205 0.54% - 11.11% 4.82% 0.03 20 0 18 0 206 0.00% - 0.89% 0.44% 0.00 1 0 8 0 210 0.00% - 6.72% 1.71% 0.02 11 0 21 0 212 4.02% - 6.32% 5.13% 0.01 0 0 3 0 213 1.69% - 21.40% 11.89% 0.04 16 7 24 10 215 0.89% - 5.48% 2.14% 0.02 6 0 23 0 216 5.68% - 18.95% 9.79% 0.04 6 0 24 3 217 0.72% - 21.06% 5.02% 0.05 2 0 23 3 218 0.88% - 6.22% 3.40% 0.02 1 0 5 0 219 0.17% - 8.89% 1.50% 0.02 16 0 23 0 221 1.21% - 14.72% 6.85% 0.04 9 0 21 3 232 2.69% - 5.87% 4.16% 0.01 4 0 20 0 234 1.71% - 7.55% 3.43% 0.02 3 0 23 0 236 0.00% - 7.44% 1.89% 0.02 4 0 24 0 242 0.00% - 7.00% 1.24% 0.01 62 0 21 0 244 1.03% - 5.57% 2.59% 0.02 8 0 20 0 245 1.44% - 7.09% 3.69% 0.02 6 0 17 0 246 3.36% - 23.63% 12.01% 0.05 11 5 23 5 247 0.11% - 5.39% 1.60% 0.02 9 0 17 0 248 2.12% - 28.80% 9.24% 0.07 8 1 23 3 249 0.17% -13.71% 1.66% 0.02 26 0 30 1 250 1.17% - 26.25% 8.28% 0.05 49 1 35 4

130

131
REFERENCES
(1) Hanowski, R. J., Wierwille, W. W., Garness, S. A., and Dingus, T. A. (September, 2000). Impact of local/short haul operations on driver fatigue, final report. Report No. DOT-MC-00-203. Washington, DC: U.S. Department of Transportation, Federal Motor Carrier Safety Administration.
(2 ) Wierwille, W. W., Ellsworth, L. A., Wreggit, S. S., Fairbanks, R. J., & Kirn, C. L. (1994).
Research on vehicle based driver status performance monitoring: Development, validation, and refinement of algorithms for detection of driver drowsiness. National Highway Traffic Safety Administration, Tech Report DOT HS808 247.
(3 ) Knipling, R. (1998). The technologies, economics, and psychology of commercial motor vehicle driver fatigue management. Paper presented at the ITS America’s Eighth Annual Meeting and Exposition, Detroit, MI.
(4) Wierwille, W. W., Hanowski, R. J., Olson, R. L., Dinges, D. F., Price, N. J., Maislin, G., Powell, J. W. IV, Ecker, A. J., Mallis, M. M., Szuba, M. P., Ayoob, A., Grace, R. & Steinfeld, A. (2003). NHTSA drowsy driver detection and interface project-Final report. Contract No. DTNH22-D- 00-07007, Task Order 1. Blacksburg, VA: Virginia Tech Transportation Institute.
(5) Dingus, T. A., Klauer, S. G., Neale, V. L., Petersen, A., Lee, S. E., Sudweeks, J., Perez, M. A., Hankey, J., Ramsey, D., Gupta, S., Bucher, C., Doerzaph, Z. R., and Jermeland, J. (2006). The 100-car naturalistic driving study; Phase II- Results of the 100-car field experiment. Contract No. DTNH22-00-C-07007 (Task Order No. 06). Blacksburg, VA: Virginia Tech Transportation Institute.
(6) Hanowski, R. J., Blanco, M., Nakata, A., Hickman, J. S., Schaudt, W. A., Fumero, M. C., Olson, R. L., Jermeland, J., Greening, M., Holbrook, G. T., Knipling, R. R., & Madison, P. (in press). The Drowsy Driver Warning System Field Operational Test: Data collection methods final report. Contract No. DTNH22-00-C-07007. Washington, DC: National Highway Traffic Safety Administration.
(7 ) Peltzman, S. (1975). The effects of automobile safety regulation. Journal of Political Economy, 83, 667-726.
(8) National Highway and Transportation Safety Administration. (2007). Traffic Safety Facts 2006. Retrieved December 14, 2007 from http://www-nrd.nhtsa.dot.gov/Pubs/810805.PDF
(9) Williamson, A., Feyer, A. and Friswell, R. (1996). The impact of work practices on fatigue in long distance truck drivers. Accident Analysis and Prevention, 28(6), 709-719.

132
(10) Dinges, D. F. (1995). The performance effects of fatigue. In Proceedings of the Fatigue
Symposium (pp. 41-46). National Transportation Safety Board/NASA Ames Research Center.
(11) Stutts, J.C., Wilkins, J.W. & Vaughn, B.V. (1999). Why do people have drowsy driving
crashes? Input from drivers who just did. AAA Foundation for Traffic Safety. Washington, DC.
(12) National Sleep Foundation. (2005). 2005 Sleep in America Poll Segment Profiles. Retrieved
December 29, 2006 from http://www.sleepfoundation.org/_content/hottopics/Sleep_Segments.pdf
(13) Maycock, G. (1997). Sleepiness and driving: The experience of U.K. car drivers. Accident
Analysis and Prevention 29, 453-462. (14) McCartt, A. T., Ribner, S. A., Pack, A. I., & Hammer, M. C. (1996). The scope and nature
of the drowsy driving problem in New York State. Accident Analysis and Prevention, 28, 511-517.
(15) Sagberg, F. (1998). Many drivers fall asleep at the wheel. Institute of Transport Economics,
Norway: Nordic Road and Transport Research, No. 3, p. 16. (16) McCartt, A. T., Rohrbaugh, J. W., Hammer, M. C., & Fuller, S. Z. (2000). Factors associated
with falling asleep at the wheel among long-distance truck drivers. Accident Analysis and Prevention, 32, 493-504.
(17) Transportation Safety Board (1990). Fatigue, alcohol, other drugs, and medical factors in
fatal-to-the-driver heavy truck crashes. Retrieved November 29, 2006 from http://www.ntsb.gov/publictn/1990/SS9001.htm
(18) Hanowski, R.J., Blanco, M., Nakata, A., Hickman, J.S., Schaudt, W.A., Fumero, M.C.,
Olson, R.L., Jermeland, J., Greening, M., Holbrook, G.T., Knipling, R.R., and Madison, P. (2005). The Drowsy Driver warning System Field Operational Test, Data Collection: Final Report. Blacksburg, VA: Virginia Tech Transportation Institute.
(19) Hickman, J. S., Knipling, R. R., Olson, R. L., Fumero, M. C., Blanco, M., & Hanowski, R. J.
(2005). Heavy vehicle-light vehicle interaction data collection and countermeasure research project: Phase I – Preliminary analysis of data collected in the Drowsy Driver Warning System Field Operational Test. DTNH22-00-C-07007, Task Order #21. Federal Motor Carrier Safety Administration: Washington, DC.
(20) Pedhazur, E. J. (1997). Multiple regression in behavioral research: Explanation and
prediction (3rd ed.). Thompson Learning, Inc: New York, NY. (21) Hanowski, R. J., Knipling, R. R., Hickman, J. S., Schaudt, A. W., Olson, R. L., & Dingus, T.
A. (2004). Phase I- preliminary analysis of data collected in the drowsy driver warning system field operational test: Task 1, preliminary analysis plan. Contract No. DTNH22-00-C-07007 (Task Order No. 21). Blacksburg, VA: Virginia Tech Transportation Institute.

133
(22) Knipling, R. R., Olson, R. L., Hanowski, R. J., Hickman, J. S., & Holbrook, T. G. (2004).
Phase I- preliminary analysis of data collected in the drowsy driver warning system field operational test: Task 2, Analysis Specification Report. Contract No. DTNH22-00-C-07007 (Task Order No. 21). Blacksburg, VA: Virginia Tech Transportation Institute.
(23) American Trucking Association (2005). The U.S. truck driver shortage: Analysis and
forecasts. Retrieved on December 11, 2007 from http://www.gsa.gov/gsa/cm_attachments/GSA_DOCUMENT/ATADriverShortageStudy05_R25-c-d_0Z5RDZ-i34K-pR.pdf
(24) Society of Automotive Engineers, Inc. (2002). SAE J1587- Electronic data interchange
between microcomputer systems in heavy-duty vehicle applications. Warrendale, PA: SAE, Inc.
(25) Society of Automotive Engineers, Inc. (1993). SAE J1708- Serial data communications
between microcomputer systems in heavy-duty vehicle applications. Warrendale, PA: SAE, Inc.
(26) Society of Automotive Engineers, Inc. (2001). SAE HS-J1939- Truck and bus control and
communications network standards manual. Warrendale, PA: SAE, Inc. (27) Wierwille, W. W. & Ellsworth, L. A. (1994). Evaluation of driver drowsiness by trained
observers. Accident Analysis and Prevention, 26(5), 571-581. (28) Hanowski, R. J., Keisler, A. S., & Wierwille, W. W. (May, 2004). Light vehicle-heavy
vehicle interactions: A preliminary assessment using critical incident analysis. Report No. FMCSA-RT-04-004. Washington, DC: Federal Motor Carrier Safety Administration.
(29) Dingus, T., Neale, V., Garness, S., Hanowski, R., Keisler, A., Lee, S., Perez, M., Robinson,
G., Belz, S., Casali, J., Pace-Schott, E., Stickgold, R. & Hobson, J. (2002). Impact of sleeper berth usage on driver fatigue, final project report (contract no. DTFH61-96-C-00068). Washington, DC: Federal Motor Carrier Safety Administration, USDOT.
(30) Lantz, B. (2007). Commercial Driver Risk Factors Study Stage 1 Pilot: Task 1.4
Summary of Phase I Findings. Washington, DC: Federal Motor Carrier Safety Administration, USDOT.
(31) Thieriez, K., Radja, G., and Toth, G. (2002). Large Truck Crash Causation Study Interim
Report (NHTSA Interim Technical Report #DOT HS 809 527). Springfield, VA: National Center for Statistics and Analysis Advanced Research and Analysis.
(32) Hanowski, R. J., Olson, R. L., Hickman, J. S., & Dingus, T. A. (2005). The 100-Car
Naturalistic Driving Study: Analysis of light vehicle/heavy vehicle interactions from the light vehicle driver’s perspective. Contract No.DTNH22-00-C-07007. Blacksburg, VA: Virginia Tech Transportation Institute.