(v-1-2) guidelines for fatigue strength analyses of ship structures
TRANSCRIPT

Rules for Classification and Construction V Analysis Techniques
1 Hull Structural Design Analyses
2 Guidelines for Fatigue Strength Analyses of Ship Structures
Edition 2004

The following Guidelines come into force on August 1st, 2004
Alterations to the preceding Edition are marked by beams at the text margin.
Germanischer Lloyd Aktiengesellschaft
Head Office Vorsetzen 35, 20459 Hamburg, Germany
Phone: +49 40 36149-0 Fax: +49 40 36149-200
www.gl-group.com
"General Terms and Conditions" of the respective latest edition will be applicable (see Rules for Classification and Construction, I - Ship Technology, Part 0 - Classification and Surveys).
Reproduction by printing or photostatic means is only permissible with the consent of Germanischer Lloyd Aktiengesellschaft.
Published by: Germanischer Lloyd Aktiengesellschaft, Hamburg Printed by: Gebrüder Braasch GmbH, Hamburg

Table of Contents
Section 1 General
A. Objective of the Guidelines ........................................................................................................ 1- 1 B. Objective of a Fatigue Strength Analysis ................................................................................... 1- 1 C. Analysis Methods ....................................................................................................................... 1- 1 D. Stress Types ............................................................................................................................... 1- 2
Section 2 Modelling of the Structure
A. General ....................................................................................................................................... 2- 1 B. Calculation Models for Global and Local Nominal Stresses ...................................................... 2- 1 C. Calculation Models for Structural Stresses at Welded Joints ..................................................... 2- 2 D. Calculation Models for Notch Stresses at Plate Edges ............................................................... 2- 3
Section 3 Definition of Load Cases and Calculation of the Stress Spectrum
A. General ....................................................................................................................................... 3- 1 B. Simplified Deterministic Analysis .............................................................................................. 3- 1 C. Spectral Method ......................................................................................................................... 3- 3 D. Simulation of the Stress History ................................................................................................. 3- 3
Section 4 Assessment of the Results
A. General ....................................................................................................................................... 4- 1 B. Assessment of the Fatigue Strength ............................................................................................ 4- 1
V - Part 1 GL 2004
Table of Contents Chapter 2Page 3


Section 1
General
Preamble
The proof of sufficient fatigue strength, i. e. the strength against crack initiation under dynamic loads during operation is useful for judging and reducing the probability of crack imitiation of structural mem-bers during the design stage.
Due to the randomness of the load process, the spreading of material properties and fabrication fac-tors and to effects of ageing, crack initiation cannot be completely excluded during later operation. Therefore among other things perodical surveys are necessary.
A. Objective of the Guidelines
1. These guidelines give further information about the performance of fatigue strength analyses of ship structures in addition to the Construction Rules for Seagoing Ships (references of this kind hereafter are related to Section 20 of Chapter 1, Hull Structures, of the Construction Rules, I – Ship Technology, Part 1 – Seagoing Ships). In view of the great variety of ship structural details, different load effects and available analysis methods, it is necessary to keep these guide-lines relatively general.
2. In accordance with the Construction Rules for Seagoing Ships, it is assumed that the fatigue strength is assessed on the basis of design S-N curves and the Palmgren-Miner's Rule for the consideration of vari-able-amplitude loading. In cases, such as initiated cracks or welds with partial penetration, however, other approaches, e.g. those based on fracture mechan-ics, can be suitable for the assessment. They can re-quire other calculation models and analysis proce-dures.
3. In addition to the information regarding the performance of fatigue strength analyses, which are illustrated by examples, attention should be given to the detail design to aim at a fatigue-resistant structure, an objective which is still of great importance because the complete assessment of all details under considera-tion of all possible load effects is not yet practicable.
B. Objective of a Fatigue Strength Analysis
1. The objective of a fatigue strength analysis is normally:
– the identification of structural areas with high cyclic stresses
– the analysis and assessment of critical structural details
– the determination of structural alternatives
2. The identification of structural areas with high cyclic stresses requires the calculation of stress ranges and mean stresses in the areas under considera-tion for one of the stress types mentioned in D. to-gether with a suitable representation of the results that allows the identification of critical details.
3. The analysis and assessment of critical struc-tural details and the determination of structural alter-natives is normally performed under consideration of the expected stress history as well as the local stress concentration or a corresponding detail category.
C. Analysis Methods
1. Three methods are available for considering the wave loads which dominate the fatigue behaviour of ship structures:
– simplified deterministic method, see 2.
– spectral method, see 3.
– simulation of the stress history, see 4.
All three methods, which differ in their computation effort, will be dealt with in Section 3 in more detail.
2. In the simplified deterministic analysis, se-lected load situations are considered and from this, stress spectra for the whole service life are derived, adopting the assumptions in the Construction Rules for Seagoing Ships for the subsequent strength as-sessment.
3. When applying the spectral method, the structural response to stochastic load processes is calculated in the frequency domain, and the stress
V - Part 1 GL 2004
Section 1 General Chapter 2Page 1–1
C

spectrum for the whole service life is determined with statistical methods for the subsequent fatigue strength assessment.
4. Contrary to the spectral method, the simula-tion of the stress history is performed in the time do-main, making it possible to consider the direct calcula-tion of nonlinear effects during the load and damage process.
5. The selection of the method depends primar-ily on the question as to whether acceptable results can be expected in view of the respective simplifications and assumptions. In the case of the simplified deter-ministic method, which is at present mostly applied for practical reasons, the main question is whether the selected load situations consider sufficiently the rele-vant stresses and whether the shape and number of cycles of the stress spectrum can be estimated with satisfactory accuracy on the basis of experience and/or similar computations. When applying the spectral method, it is necessary to check how far simplifica-tions such as the neglect or approximate consideration of nonlinear effects can be justified. In the case of a simulation of the stress history, the length of simula-tion time which allows extrapolation to the whole service life with sufficient accuracy is of primary interest.
D. Stress Types
1. Depending on the detail considered, the fa-tigue strength analysis is normally based on one of the following three types of stresses:
– nominal stress σn, see 2.
– structural or hot-spot stress σs at the toes of welded joints, see 3.
– notch stress σk at rounded plate edges, see 4.
2. In welded structures, the fatigue strength analysis is normally based on the nominal stress σn in the structural member at the location of the detail considered and an appropriate relation to a classified detail according to the catalogue of details in the Con-struction Rules for Seagoing Ships which also de-scribes the direction of the relevant stress component. The nominal stress is usually calculated from integral load quantities and sectional properties (force or mo-ment per unit area or section modulus, respectively) or
from relatively coarse finite element models. The effective breadth has to be considered. Further guid-ance for the computation of nominal stresses by finite element analysis is contained in Chapter 1 – Guide-lines for Strength Analyses of Ship Structures with the Finite Element Method.
3. Welded structures which cannot be related to a classified detail or where additional stresses occur which are not or not fully considered by the cata-logued detail can be assessed with respect to fatigue at weld toes on the basis of the structural or hot-spot stress σs, which contains the stress increase due to the structural geometry, but not that due to the weld toe. In some cases, structural stress concentration factors Ks can be used for the determination of the structural or hot-spot stress σs,
ss
nK
σ=
σ
which result from parametric investigations. Here, the definition of the nominal stress and the validity ranges of the parametric formulae or diagrams have to be considered. The fatigue strength assessment is per-formed using specific S-N curves or detail categories for structural stresses, as given in the Construction Rules for Seagoing Ships.
4. Free plate edges are usually assessed on the basis of the notch stress σk, which is computed for ideally elastic material behaviour. In some cases, the notch stress can be calculated with the aid of the theo-retical stress concentration factor Kt resulting from parametric investigations:
kt
nK
σ=
σ
Here, the definition of the nominal stress and the va-lidity ranges of the parametric formulae or diagrams have to be considered. The fatigue strength assessment is performed by using specific S-N curves or detail categories for free plate edges.
5. As regards further types of stresses, e.g. the notch stress at weld toes, the elastic-plastic stress and strain in the notch root or the stress intensity at crack tips or sharp notches, reference is made to the con-tinuative technical literature.
Chapter 2 Page 1–2
Section 1 General V - Part 1GL 2004
D

Section 2
Modelling of the Structure
A. General
1. The modelling of the structure has to be per-formed in such a way that, at the detail considered, the type of stress on which the fatigue assessment is to be based can be calculated with sufficient accuracy.
2. Two methods are normally applied in the calculation:
– analytical methods, e.g. based on beam theory, which usually result in nominal stresses
– numerical methods, such as the finite element method, which are particularly well suited for the stress analysis of geometrically complex structures as well as local stress increases
3. In the following special information is given about the modelling of a structure in view of calculat-ing the desired type of stress, see Section 1, D. Further information is contained in Chapter 1 – Guidelines for Strength Analyses of Ship Structures with the Finite Element Method.
B. Calculation Models for Global and Local Nominal Stresses
1. The calculation of nominal stresses is nor-mally performed by using beam models of the ship’s hull girder, of the primary structural members as well as secondary structural members, or by using rela-tively coarse finite element models to represent these structures. The latter method is recommended espe-cially for more complex structures and load cases.
2. It is common to distinguish between global stresses in primary structural members and additional local stresses in secondary structural members (frames, girders, stiffeners), see Fig. 2.1. The latter include bending stresses in stiffeners and plates. In fatigue analyses, the combined effect of both compo-nents is to be taken into account.
3. The extent of the model is primarily deter-mined by the question of whether and how reasonable boundary conditions can be formulated for partial models of the structure. Fig. 2.2 shows a typical over-all model of the ship structure with a relatively coarse mesh. As a result, global nominal stresses are obtained in the primary structural members; these have to be superimposed with local stresses as well as increased stresses due to reduced effective breadths.
�����������������
����������� ��
���������
�
�������������
�
������������ �����������
�
Fig. 2.1 Global Stresses and Local Stresses
V - Part 1 GL 2004
Section 2 Modelling of the Structure Chapter 2Page 2–1
B

Fig. 2.2 Overall model of a ship's structure
4. The resulting nominal stresses can
– be directly assessed in connection with a corre-sponding detail category
– be multiplied by stress concentration factors Kt or Ks to obtain and assess locally increased notch stresses σk or structural (hot-spot) stresses σs (see Section 1, D.3. and Section 1, D.4.)
– serve as boundary conditions for local models of the structural details considered (alternatively, deformations are frequently prescribed at the model boundaries); see also C. and D.
5. If crack initiation from the weld root is as-sessed, it should be noted that the nominal stress has to be related to the cross-sectional area of the weld; see also the description of the respective detail catego-ries in the Construction Rules for Seagoing Ships.
C. Calculation Models for Structural Stresses at Welded Joints
1. Structural or hot-spot stresses are normally calculated by using local models of the ship structure. The extent of the model has to be chosen such that effects due to the boundaries on the structural area considered are sufficiently small and reasonable boundary conditions can be formulated.
2. Basically, it is necessary to distinguish be-tween two types of weld toes at fillet or K-butt welds:
type a) weld toes on plate surfaces, e.g. at trans-verse stiffeners or at the weld around the toe of an attached plate
type b) weld toes at plate edges, e.g. at the termina-tion of a cut edge.
Fig. 2.3 shows both types of weld toes by the example of a welded structure. It should be noted that local plate bending may affect the structural stress, espe-cially with type a).
������
��
��
��
Fig. 2.3 Types of weld toes
3. When applying the finite element method, it is recommended in view of effects due to plate bend-ing that models with plate or shell elements, or alter-natively with solid elements, be used. It should be observed that on the one hand the arrangement and type of elements used have to allow the formation of plate bending, and on the other hand only the linear stress distribution in the plate thickness direction has to be evaluated in accordance with the definition of structural stress (i.e. neglect of the local stress increase due to the weld toe). Fig. 2.4 shows the relationship between different types of stresses at a weld toe of type a) and type b), respectively.
������������������� �
�������������������
���
�������
� �
� �
��
�� ��� ���������
�� !
�
��������"#�$%��������"#��$% &'���(
Fig. 2.4 Types of stress at a weld toe of type a) and type b), respectively
4. Recommended meshes with plate or solid elements are shown by the example in Fig. 2.5.
When using thin plate or shell elements, which have to be arranged in the mid-plane of the structural compo-nents, the welds are usually not modelled. Exceptions are offsets between plates (e.g. doubling plates) or small distances between adjacent welds, where the stiffness of the welds may be considered by inclined plate elements, reinforced plate strips (Fig. 2.6) or by introducing constrained equations (or rigid links) to couple the node displacements and rotations. Gener-
Chapter 2 Page 2–2
Section 2 Modelling of the Structure V - Part 1GL 2004
C
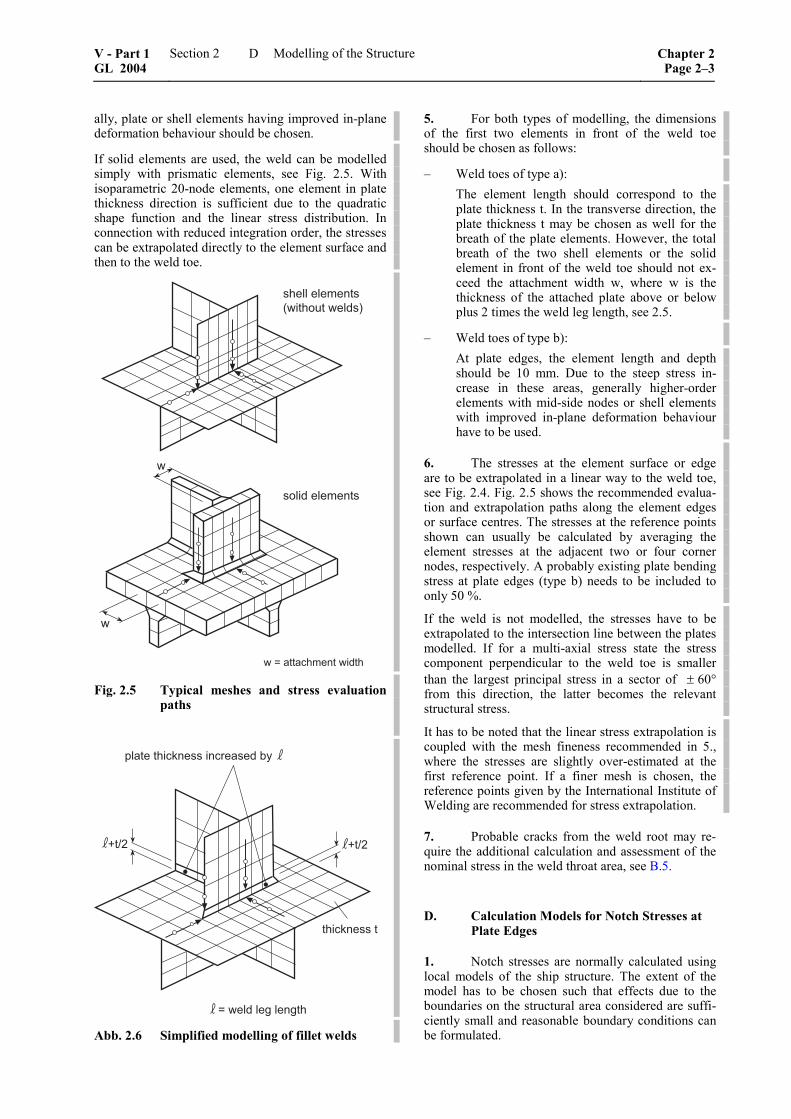
ally, plate or shell elements having improved in-plane deformation behaviour should be chosen.
If solid elements are used, the weld can be modelled simply with prismatic elements, see Fig. 2.5. With isoparametric 20-node elements, one element in plate thickness direction is sufficient due to the quadratic shape function and the linear stress distribution. In connection with reduced integration order, the stresses can be extrapolated directly to the element surface and then to the weld toe.
������� ����������������
�������� ���
��������� ��������
�
�
Fig. 2.5 Typical meshes and stress evaluation paths
����������������
����
��������
������������������������
����
Abb. 2.6 Simplified modelling of fillet welds
5. For both types of modelling, the dimensions of the first two elements in front of the weld toe should be chosen as follows:
– Weld toes of type a): The element length should correspond to the
plate thickness t. In the transverse direction, the plate thickness t may be chosen as well for the breath of the plate elements. However, the total breath of the two shell elements or the solid element in front of the weld toe should not ex-ceed the attachment width w, where w is the thickness of the attached plate above or below plus 2 times the weld leg length, see 2.5.
– Weld toes of type b): At plate edges, the element length and depth
should be 10 mm. Due to the steep stress in-crease in these areas, generally higher-order elements with mid-side nodes or shell elements with improved in-plane deformation behaviour have to be used.
6. The stresses at the element surface or edge are to be extrapolated in a linear way to the weld toe, see Fig. 2.4. Fig. 2.5 shows the recommended evalua-tion and extrapolation paths along the element edges or surface centres. The stresses at the reference points shown can usually be calculated by averaging the element stresses at the adjacent two or four corner nodes, respectively. A probably existing plate bending stress at plate edges (type b) needs to be included to only 50 %.
If the weld is not modelled, the stresses have to be extrapolated to the intersection line between the plates modelled. If for a multi-axial stress state the stress component perpendicular to the weld toe is smaller than the largest principal stress in a sector of ± 60° from this direction, the latter becomes the relevant structural stress.
It has to be noted that the linear stress extrapolation is coupled with the mesh fineness recommended in 5., where the stresses are slightly over-estimated at the first reference point. If a finer mesh is chosen, the reference points given by the International Institute of Welding are recommended for stress extrapolation.
7. Probable cracks from the weld root may re-quire the additional calculation and assessment of the nominal stress in the weld throat area, see B.5.
D. Calculation Models for Notch Stresses at Plate Edges
1. Notch stresses are normally calculated using local models of the ship structure. The extent of the model has to be chosen such that effects due to the boundaries on the structural area considered are suffi-ciently small and reasonable boundary conditions can be formulated.
V - Part 1 GL 2004
Section 2 Modelling of the Structure Chapter 2Page 2–3
D

2. For the calculation of the notch stress σk at plate edges (e.g. edges of cut-outs) assuming ideal-elastic material behaviour, it is mainly the stresses in the mid-plane of the plate that are significant. There-fore, modelling of plate areas with membrane ele-ments is sufficient in most cases, as far as the bending stiffness does not significantly affect the load distribu-tion.
3. In notched areas, the mesh fineness has to be chosen such that the stresses at the plate edge can be determined with sufficient accuracy. This means for example that at least eight elements with linear dis-placement function or five elements with quadratic displacement function should be arranged along the quarter of a circle. The subdivision in radial direction also has to be sufficiently fine in view of the stress gradient. It is recommended that the element lengths in the radial direction be chosen no larger than in the tangential direction. The element arrangement for the stress analysis of a hole in the web of a girder is ex-emplified in Fig. 2.7.
Fig. 2.7 Typical mesh subdivision for the compu-
tation of notch stresses at edges of cut-outs
4. Stiffeners on primary structural members in the vicinity of the analysed notches are normally to be considered in the model. A three-dimensional model is recommended, with a realistic modelling of the termi-nations of the structural members, e.g. sniped stiffener ends.
5. The evaluation of the results can be simpli-fied if truss elements with negligible cross-sectional areas (which do not affect the structural stiffness, but yield directly the edge stress) are arranged at the plate edges.
Chapter 2 Page 2–4
Section 2 Modelling of the Structure V - Part 1GL 2004
D

Section 3
Definition of Load Cases and Calculation of the Stress Spectrum
A. General
1. In the following, further information is given on the three analysis methods mentioned in Section 1, C. Here, only wave-induced loads and loads due to different loading conditions are considered. Other load effects, which may be relevant for certain ship types, can be dealt with analogously.
2. Regarding the consideration of the loading conditions, two approaches are possible, according to the Construction Rules for Seagoing Ships:
– assumption of the loading condition that is most unfavourable for the fatigue strength of the de-tail considered, i.e. with respect to the mean stress and the stress ranges
– assumption of several representative loading conditions which on the one hand are typical for the ship being considered and on the other in-clude different cargo and ballast distributions and also different draughts. Frequently, 4 to 12 loading conditions are sufficient, if they
– cause high hogging and sagging bending moments in the hull girder,
– include the ballast and fully-laden condi-tions, as well as an intermediate condition, if appropriate,
– include cargo distributions which cause high stresses in the bottom and in the bulk-heads.
Regarding consumables, consideration of the condi-tion "50 % consumables" is normally sufficient.
In extensive fatigue strength analyses for different structural areas, various loading conditions normally have to be analysed, because unfavourable conditions can result from different loading conditions for differ-ent details.
B. Simplified Deterministic Analysis
1. In simplified deterministic analyses, unfa-vourable situations in waves are selected for all load-ing conditions, considering the maximum stress range Δσmax and associated mean stress σm.
2. The assumed wave loads and the load combi-nation factors result from the assumptions in the Con-struction Rules for Seagoing Ships. It has to be noted here that the load components (e.g. horizontal bending and torsional moments) have to be superimposed with their proper signs.
3. Generally, load combinations (cf. Fig. 3.1) with
– waves from ahead/astern (max. vertical bending moments in the hull girder, correspondingly in-creased or reduced side and bottom pressure in the forward, midship and aft part of the hull girder), and
– oblique head/stern waves (reduced vertical bending moments in the hull girder, max. hori-zontal bending and torsional moments, max. transverse acceleration or tank pressures, with corresponding opposing pressure from outside)
should be considered. In the latter case, the considera-tion of the upright and heeled ship position might be necessary, depending on the structural detail under consideration. Unfavourable load combination may occur at port or starboard side.
4. After calculating the highest stress range Δσmax and the associated mean stress σm for each loading condition, further characteristics of the stress range spectrum are estimated on the basis of the Con-struction Rules for Seagoing Ships. For wave-induced stresses, usually a straight-line spectrum in semi-logarithmic representation and a total number of load cycles nmax = 5 ⋅ 107 during the service life of about 20 years are assumed, see also I – Ship Technology, Part 1 – Seagoing Ships, Chapter 1 – Hull Structures, Section 20, A.2.4.
V - Part 1 GL 2004
Section 3 Definition of Load Cases and Calculation of the Stress Spectrum Chapter 2Page 3–1
B

�
��
�����
�
����
�
� ��������
�� ����������������������
�� ������������������������
�������������
�������������
� �
� �
� �
!"#
���$�%
!&#
!&#
���$�%
!"#
!"#
���$�%
!&#
!&#
���$�%
!"#
� �$�% � �$�%!"# !&# !&# !"#
!"#
���$�%
!&#
!&#
���$�%
!"#
� �'�% � �(�%!"# !&# !&# !"#���'�% ���(�%!)������*# !)������*#
+����*,
& -��.��� ���������������%��� �/��.����������.����.����0������������������������
& �������!"#�����!&#����� �������������������������������1���.�����������������0�1��/�������)����������������..�����������.����+����)���������������
& ��������������������������/���.������)������0�����������.*��������
Fig. 3.1 Typical Load Situations for the Calculation of the Highest Stress Range
Chapter 2 Page 3–2
Section 3 Definition of Load Cases and Calculation of the Stress Spectrum V - Part 1GL 2004
B

C. Spectral Method
1. When applying the spectral method, the fol-lowing calculation steps are performed for each load-ing condition:
1.1 Calculation of the structural response (stress) in the form of transfer functions (response amplitude operator RAO) for waves of different length. Various angles of encounter are assumed for these waves.
1.2 Calculation of the stress spectrum for all sea states considered and determination of the stress range distribution.
1.3 Establishment of the long-term distribution of the stress ranges, considering the probability of occur-rence of the individual sea states.
Some information on the necessary assumptions are given in the following paragraphs. Further details are given in the continuative technical literature.
2. The wave load cases in the first step (see 1.1) should be calculated with a wave amplitude which lies within the range of the highest damage due to the number of load cycles (approx. 1 m). The ship’s speed is usually assumed to be 2/3 of the service speed if no service profile is specified. The wave lengths should be chosen such that the pressure fluctuations due to shorter waves as well as the roll, heave and pitch reso-nances of the ship are covered, and such that enough values are available to allow for a sufficiently accurate representation of the transfer function between wave amplitude and structural response (normally 15 – 25 wavelengths). The angle of encounter should be varied in steps of 30 degrees, whereby waves running trans-versely to the ship’s course usually require a special consideration. If only angles of encounter from one side of the ship are considered, the results for the corresponding detail on the other ship’s side have to be included in the evaluation. For each wave situation, two cases with a phase difference are considered in order to obtain real and imaginary part of the har-monic load process.
3. In the second step (see 1.2), the stress spectra are calculated for all sea states considered by the long-term statistics, with all loading conditions and angles of encounter, by multiplying the quadratic transfer function with the individual wave spectra. For the wave spectra, a two-parameter standard distribution (e.g. according to Pierson-Moskovitz) can be assumed. The frequency distribution of the stress ranges results approximately from the spectral moments and the assumption of a narrow-banded Gaussian process (Rayleigh distribution of the maxima). A correction for the wide bandedness of the loading process can be performed on the basis of published methods, whilst its neglect generally leads to slightly conservative results.
Relevant nonlinear effects regarding the damage should be considered. This includes the pressure fluc-tuations at the ship's sides close to the still-water line which depend in a nonlinear way on the wave height, due to intermittent wetting of the structural area con-sidered. Reference is made to the continuative techni-cal literature concerning methods to account for this effect.
4. For the long-term statistics of the sea states, the data of the North Atlantic Ocean are usually used; see Table 3.1. The angle of encounter is normally assumed to follow a uniform distribution, if more accurate data is not available. The total service life is usually set to 20 years. From these data, the total dura-tion of the individual sea states is derived for the dif-ferent angles of encounter and loading conditions. From this and from the mean period of the structural response the number of cycles of the associated spec-trum of stress ranges follows. By summation of the partial spectra, the long-term distribution of stress ranges can then be calculated.
5. It is recommended that the long-term distri-bution of stress ranges at the structural detail consid-ered be calculated separately for all different loading conditions, because they are assessed with different mean stresses. For each loading condition, the entire service life of 20 years should be assumed in a first step. In this way, the results can be directly compared and it is possible to assess them for various combina-tions of loading conditions as well as for the most critical loading condition.
D. Simulation of the Stress History
1. Different possibilities exist for the simulation of the stress history, inter alia:
a) Simulation of the stress history on the basis of computed stress range spectra for the individual sea states
b) Simulation of the complete motion and load process for the whole ship structure.
In any case, different sea states and angles of encoun-ter are considered for all loading conditions investi-gated, from which the long-term distribution of stress ranges is evaluated in a similar way as that described in C.4.
2. Method a) is based on calculations of the structural response, as described in C.2. – C.3. in con-nection with the spectral method, so that the prerequi-sites are the same. The advantage of simulation lies in the computation of the course of the stress history, which allows a refined assessment of the damage process, e.g. by considering sequential effects or mate-rial-related nonlinearities in corresponding concepts.
V - Part 1 GL 2004
Section 3 Definition of Load Cases and Calculation of the Stress Spectrum Chapter 2Page 3–3
D

3. In addition to that, method b) permits realistic consideration of nonlinearities in the load process, which may be significant for certain ship types.
4. The loading conditions and sea states consid-ered as well as the simulation time are to be chosen
such that significant statistical evaluations can be made with respect to the entire service life.
5. From the stress history evaluated, the relevant parameters for the assessment (e.g. largest stress range Δσmax, shape of stress spectrum and associated mean stress σm) are to be determined using the rainflow counting method.
Chapter 2 Page 3–4
Section 3 Definition of Load Cases and Calculation of the Stress Spectrum V - Part 1GL 2004
D

Table 3.1 Wave Scatter Diagram for the North Atlantic
����2���� %�
3
�3
��3
��3
4�3
3�3
5�3
6�3
7�3
8�3
%�3
�3
��3
��3
4�3
3�3
5�3
�9:,
�3
%�%
%�%
%�%
%�%
%�%
%�%
%�%
%�%
%�%
%�%
%�%
%�%
%�%
%�%
%�%
%�%
%�% %
��3
%�%
%�%
%�%
%�%
%�%
%�%
%�%
%�%
%�%
%�%
%�%
%�%
%�%
%�%
%�%
%�%
%�% %
��3
��
%�%
%�%
%�%
%�%
%�%
%�%
%�%
%�%
%�%
%�%
%�%
%�%
%�%
%�%
%�%
%�%
4�3
���6
�8�� ���
%��
%�%
%�%
%�%
%�%
%�%
%�%
%�%
%�%
%�%
%�%
%�%
%�%
%�%
53
3�3
753�5
875�%
86�3
�4�8 5�%
�%
%�%
%�%
%�%
%�%
%�%
%�%
%�%
%�%
%�%
%�%
%�%
�%8
5�3
75
�%
4865
�%
� 37
�7
583�3
85�
3 �%
��5 ��%
%�6
%��
%�%
%�%
%�%
%�%
%�%
%�%
%�%
8�7%
6�3
5�4��
66�7
�%
5��%
�%
���5
�3
�34
��
487�4
56�%
3��
3�4 4��
��
%�
%�%
%�%
%�%
%�%
%�%
88�
�
7�3
75��
3358
�6
6448
�3
3563
�%
��77
�3
5%�
�8
58%��
�6%�
86�8
����
%�6 ���
�%
%��
%�
%�%
%�%
�476
8
8�3
�5�8
��63
�6
475%
�4
3%88
�
�736
�3
��6�
�6
�36
�8
384�4
�33�8
% �8
�6�8
��� 4�4
�4
%�4
%�
%�%
�%76
%
%�3 3�5
6%��3
�%55
�%
�7�7
�%
�573
�3
�%%7
��
�57
�5
6%���
�3%�5
38�8
56�3
�5�5 8�8
��3
��
%�4
%�
�78
7
�3 %�6
5%�6
544�3
4
�
�63
��
�5
�%
7�3�8
3�4�8
�85�8
3���
6 �6
� �4
��7 3�%
�7
%�5
%��
5�43
��3 %�
�%�3
5%��
��6�6
433�
45��5
�75�7
�65�6
64�5
88��
3 �3
�4�6
�% 4�5
�7
%�6
%��
�468
��3 %�%
3�
���6
74��
�%�8
3%�8
4%�7
�6
66�5
47��
�6��
4�� 5�7
��
��
%�3
%��
7�6
4�3 %�%
%�7
5��
7��
� �8
4 �%
4���
�5�6
�6�6
6�6
�4 5�4
���
�5
%�6
%��
%�
�46
3�3 %�%
%�
�
��3
5�8
8�6
%�8
%�� 7�4
5�
4�%
��4
��
%�6
%��
%�
%� 55
5�3 %�%
%�%
%��
%�5
��
��
��3
��3
���
�6
��
%�6
%�4
%��
%�
%�
%�% 5
6�3 %�%
%�%
%�%
%�
%��
%�4
%�3
%�5
%�3
%�4
%��
%��
%�
%�
%�%
%�%
%�% �
7�3 %�%
%�%
%�%
%�%
%�%
%�
%�
%�
%�
%�
%�
%�
%�%
%�%
%�%
%�%
%�%
�9:
�%3%
��36
3
��7
%
8 �
7
��7
8
7��7
47%5
�375
�%8 5�5
�73
�4 3 � 7 �
%%%
%%
;����
����
��)�����
��)��.
���
��)�
��������.�
���.
����
���/ �������
��
��$
�������.
��
�����
����
�����
�$
��
).�
���0
�1����
������
���
V - Part 1 GL 2004
Section 3 Definition of Load Cases and Calculation of the Stress Spectrum Chapter 2Page 3–5
D


Section 4
Assessment of the Results
A. General
1. The calculation of stresses and their assess-ment with respect to fatigue strength should be per-formed for as many details as possible, so that critical areas can be identified with certainty and effective counter measures can be taken.
2. An overview of the probable danger of fa-tigue cracking is given by:
– The presentation of maximum stress ranges in the structure analysed, whereby, in the case of nominal stresses, local stress increases or detail categories of the structural details have to be ob-served.
– Existing experience for ships in service which indicates that primarily
– longitudinal structural members in the upper and lower flange of the hull girder due to hull girder bending (except for the ship’s ends),
– longitudinal and transverse structural mem-bers at the ship’s sides due to local pressure fluctuations, and
– structural components in the vicinity of the main propulsion plant and manoeuvring sys-tem
as well as, in general, discontinuities in continuous structural members are prone to fatigue.
The probability of fatigue failure increases if higher-tensile steel is used due to the increased nominal stress as long as no compensation is achieved by an im-proved structural design and/or higher fabrication quality.
B. Assessment of the Fatigue Strength
1. The fatigue strength is assessed either
– on the basis of a damage calculation using Palmgren-Miner's Rule, or
– in the case of standard stress spectra, using the permissible highest stress range Δσp
2. The damage ratio computed using Palmgren-Miner's Rule must generally not exceed the limit value D*:
*i
i
nD D
N⎛ ⎞
= ∑ ≤⎜ ⎟⎝ ⎠
ni = number of stress cycles for the block i of the long-term spectrum, which has to be subdi-vided into at least 20 blocks
Ni = number of endurable stress cycles which results from the design S-N curve of the de-tail considered. The design S-N curve has to be corrected for several factors in accordance with the Construction Rules for Seagoing Ships - with respect to the mean stress, amongst others.
D* = limit value defined in the Construction Rules for Seagoing Ships, see Section 1, A.1.
The design lifetime results from
L 20 years D=
3. If more than one loading condition is ana-lysed, the assessment can be performed in two ways, as long as the damage ratio Dj has been computed for each loading condition j for a service life of 20 years (cf. Section 3, C.5.):
a) Only the most critical loading condition is con-sidered:
( ) *jMax D D≤
b) The damage due to all loading conditions is considered, taking into account their probability of occurrence Pj (Σ Pj = 1),
( ) *j jP D 0,7 D∑ ⋅ ≤
Here, a reduced limit value of the damage ratio is used, because less favourable probabilities of certain loading conditions may occur in reality compared to the assumptions made, and because the additional damage due to the changes between the individual loading conditions is not considered.
V - Part 1 GL 2004
Section 4 Assessment of the Results Chapter 2Page 4–1
B

Alternatively, the additional load cycles due to chang-ing loading condition may be included in the damage calculation, by taking the rainflow counting method into account and making conservative assumptions for the probability of occurrence of the individual loading conditions.
4. For standardized stress spectra, the criterion for the assessment is
max pΔσ ≤ Δσ
Δσmax = highest stress range within the spectrum
Δσp = permissible stress range
The permissible stress range results directly from the Construction Rules for Seagoing Ships, considering the appropriate detail category or design S-N curve, as well as various other factors, such as the mean stress.
5. It is recommended that the results be assessed on the basis of the usage factor U with respect to stress ranges:
max
pU
Δσ=
Δσ
When applying Palmgren-Miner's Rule, Δσp results from the condition that with an equivalent spectrum of stress ranges, i.e. having the same shape and number of load cycles, the limit damage ratio D* according to B.2. is reached. The application of the usage factor has the advantage that - due to the relationship with stresses - direct conclusions can be drawn with respect to the necessary reduction of stresses or a possible increase of the detail category. For example, in case of U = 1,2, the stress has to be reduced by 20 % or the detail category increased by 20 %.
Chapter 2 Page 4–2
Section 4 Assessment of the Results V - Part 1GL 2004
B