fatality analysis reporting system - wsdot.wa.gov · fars fatality analysis reporting system terry...
TRANSCRIPT
FARS
FATALITYANALYSIS
REPORTING SYSTEM
Terry Ponton, FARS AnalystSeptember 28, 2016
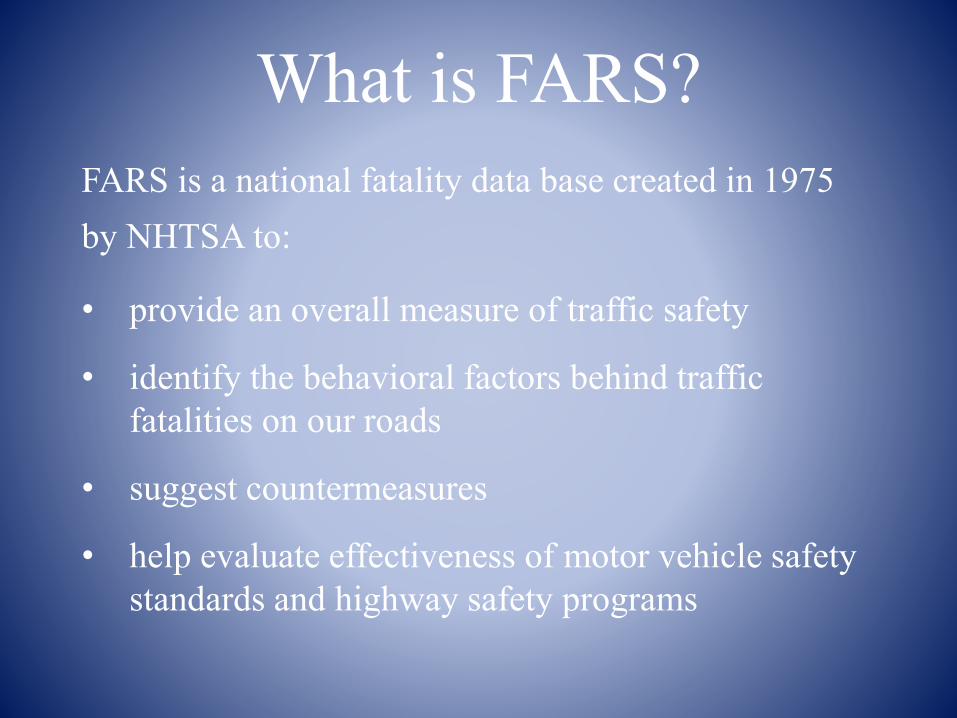
What is FARS?FARS is a national fatality data base created in 1975 by NHTSA to:
• provide an overall measure of traffic safety
• identify the behavioral factors behind traffic fatalities on our roads
• suggest countermeasures
• help evaluate effectiveness of motor vehicle safety standards and highway safety programs

Leading Types of Behavioral Factors Identified
• Impairment
• Speeding
• Unrestrained vehicle occupants
• Motorcyclist without helmets or non-DOT approved helmets
• Distracted driving
• Pedestrian/bicyclist issues
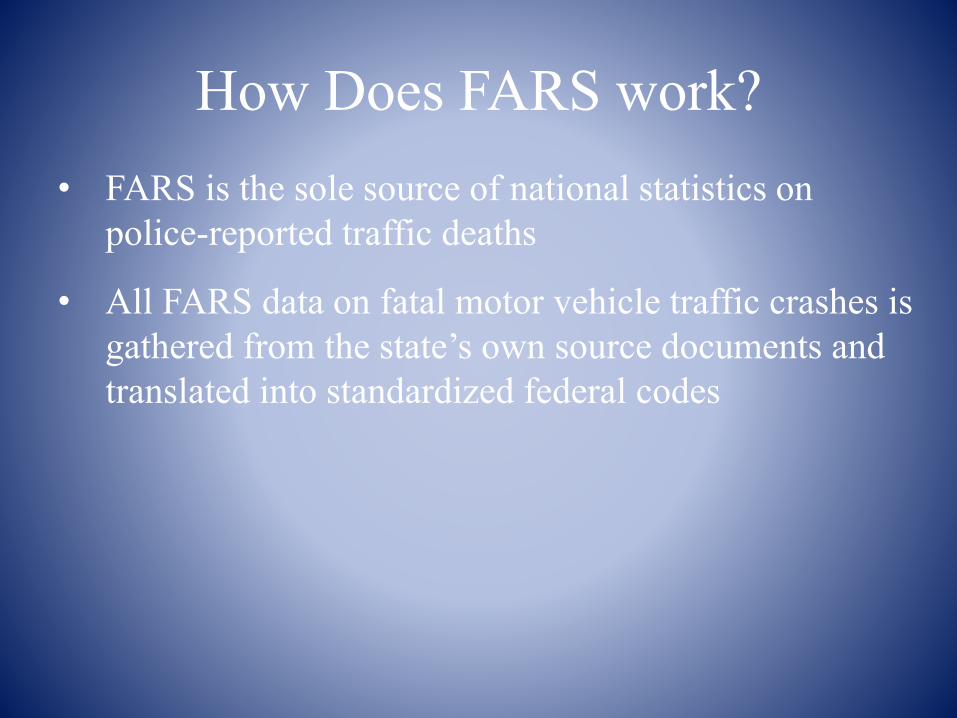
How Does FARS work?• FARS is the sole source of national statistics on
police-reported traffic deaths
• All FARS data on fatal motor vehicle traffic crashes is gathered from the state’s own source documents and translated into standardized federal codes
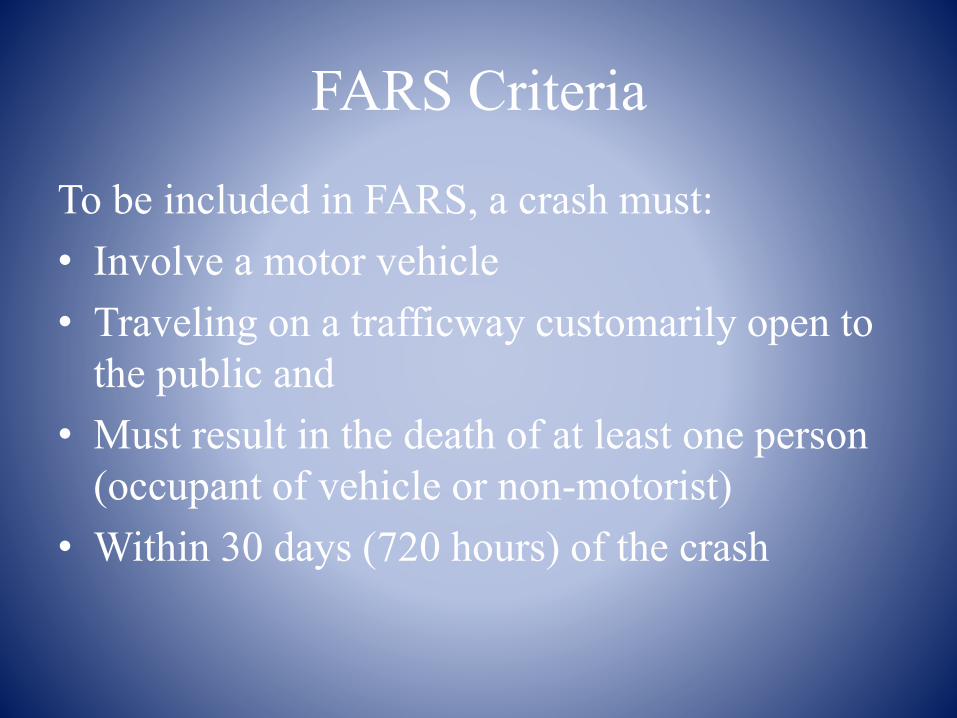
FARS Criteria
To be included in FARS, a crash must:• Involve a motor vehicle• Traveling on a trafficway customarily open to
the public and• Must result in the death of at least one person
(occupant of vehicle or non-motorist) • Within 30 days (720 hours) of the crash
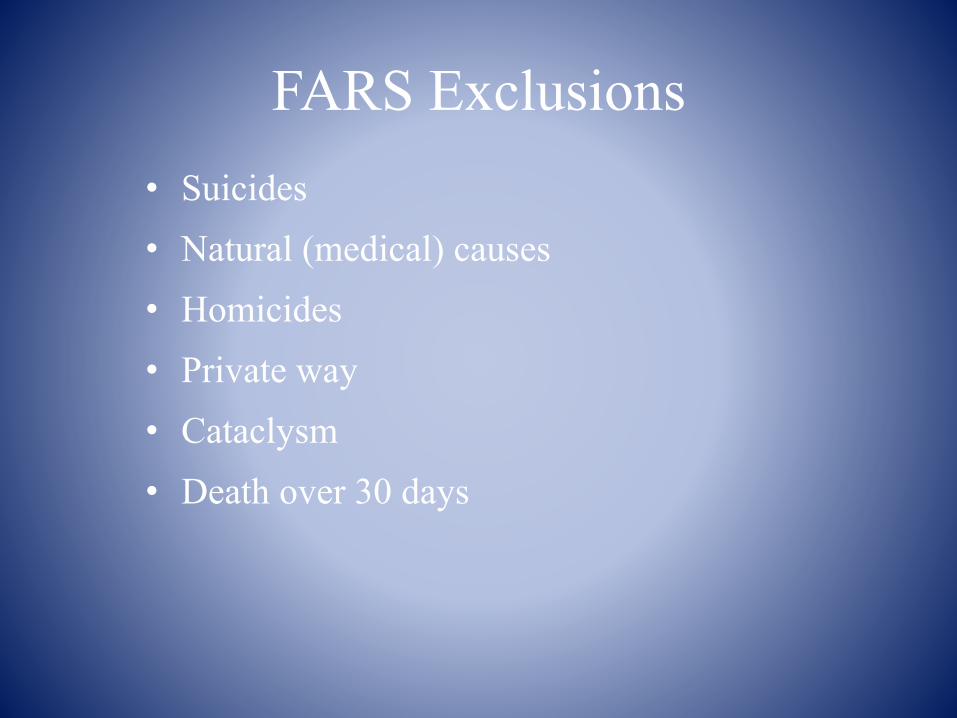
FARS Exclusions• Suicides• Natural (medical) causes• Homicides• Private way• Cataclysm• Death over 30 days
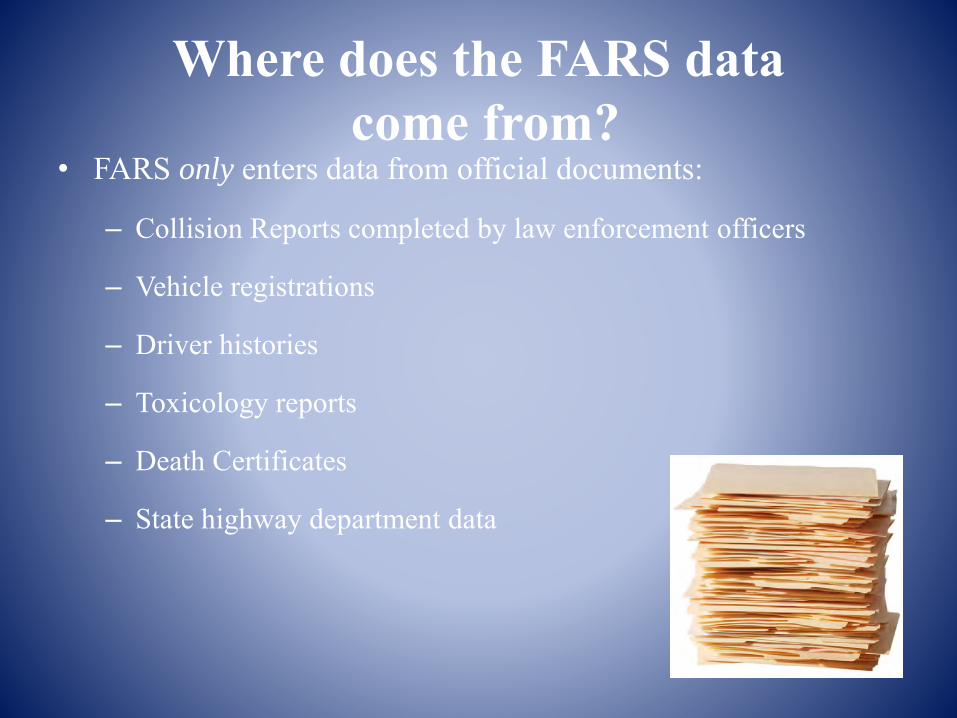
Where does the FARS datacome from?
• FARS only enters data from official documents:
– Collision Reports completed by law enforcement officers
– Vehicle registrations
– Driver histories
– Toxicology reports
– Death Certificates
– State highway department data
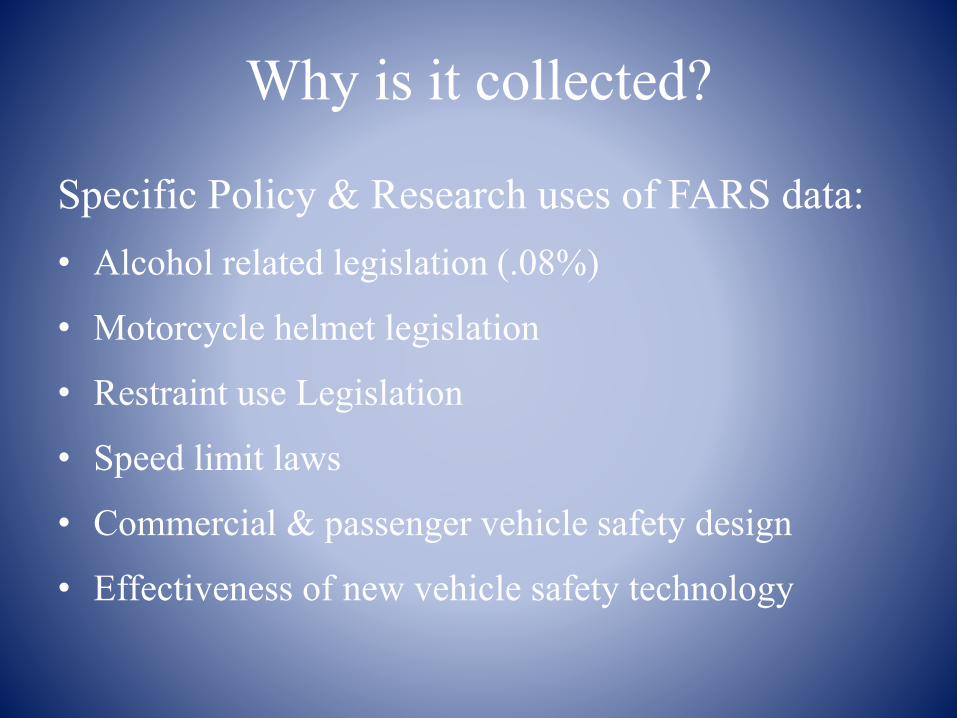
Why is it collected?
Specific Policy & Research uses of FARS data:• Alcohol related legislation (.08%)
• Motorcycle helmet legislation
• Restraint use Legislation
• Speed limit laws
• Commercial & passenger vehicle safety design
• Effectiveness of new vehicle safety technology
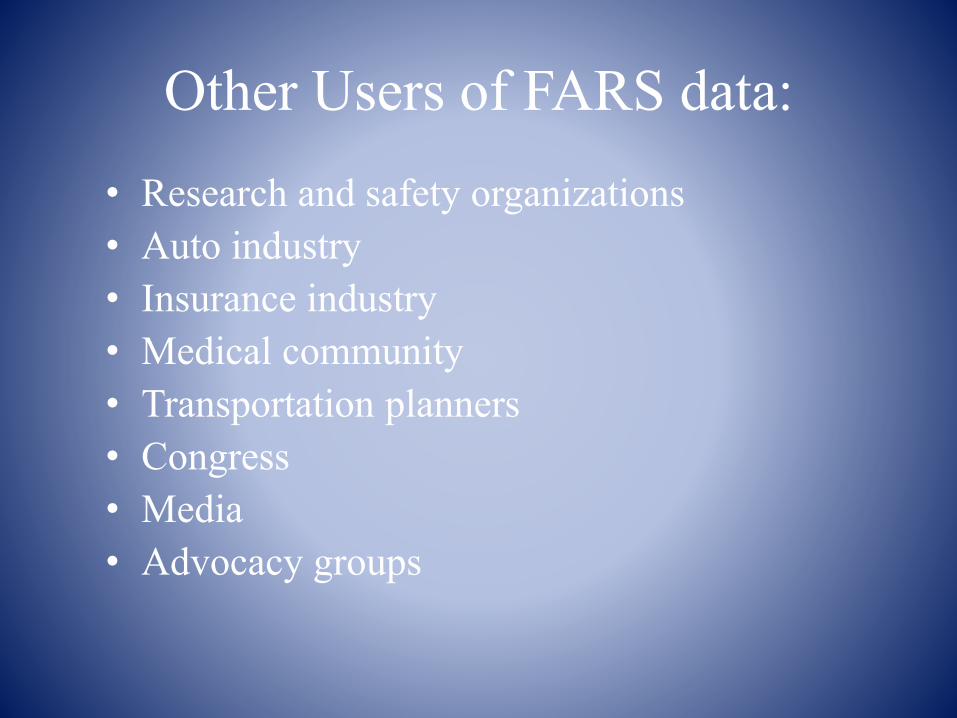
Other Users of FARS data:• Research and safety organizations• Auto industry• Insurance industry• Medical community• Transportation planners• Congress• Media• Advocacy groups
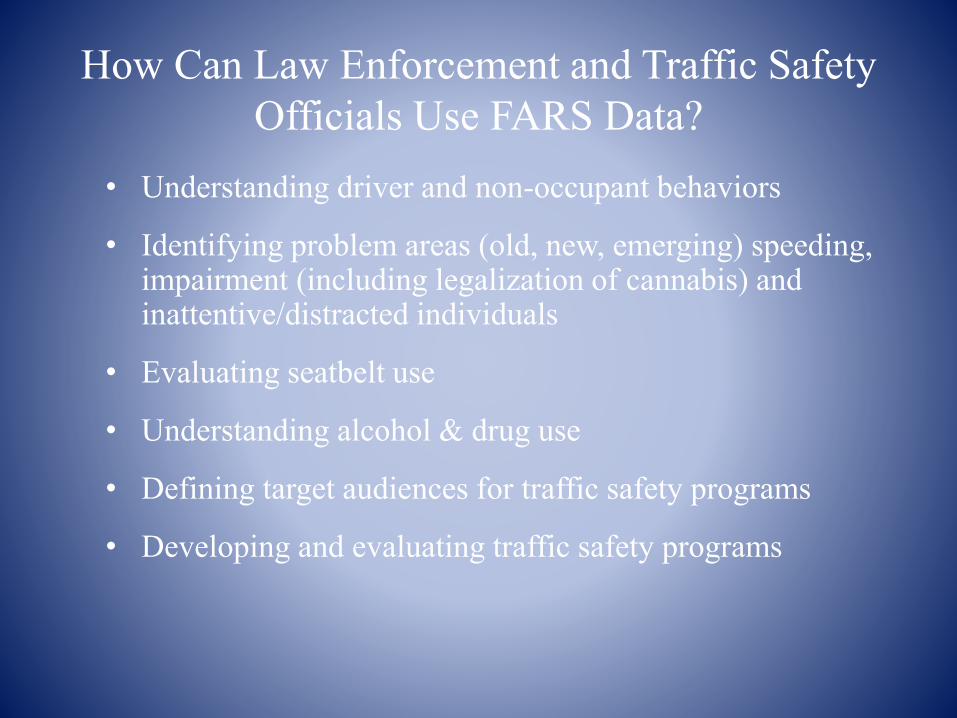
How Can Law Enforcement and Traffic Safety Officials Use FARS Data?
• Understanding driver and non-occupant behaviors
• Identifying problem areas (old, new, emerging) speeding, impairment (including legalization of cannabis) and inattentive/distracted individuals
• Evaluating seatbelt use
• Understanding alcohol & drug use
• Defining target audiences for traffic safety programs
• Developing and evaluating traffic safety programs
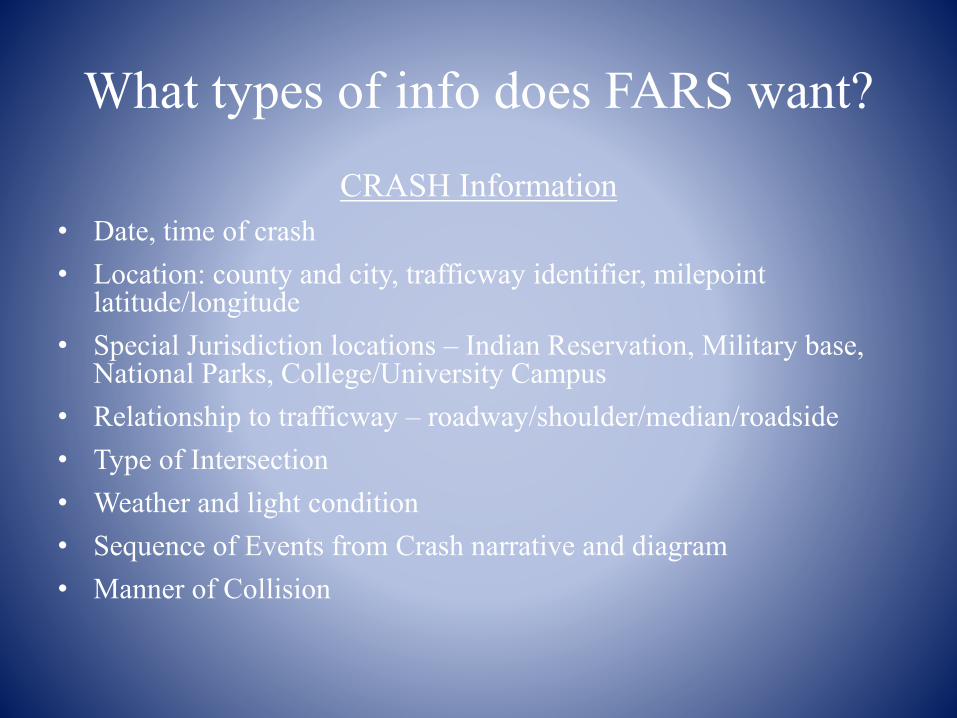
What types of info does FARS want?
CRASH Information• Date, time of crash• Location: county and city, trafficway identifier, milepoint
latitude/longitude• Special Jurisdiction locations – Indian Reservation, Military base,
National Parks, College/University Campus• Relationship to trafficway – roadway/shoulder/median/roadside• Type of Intersection• Weather and light condition• Sequence of Events from Crash narrative and diagram• Manner of Collision
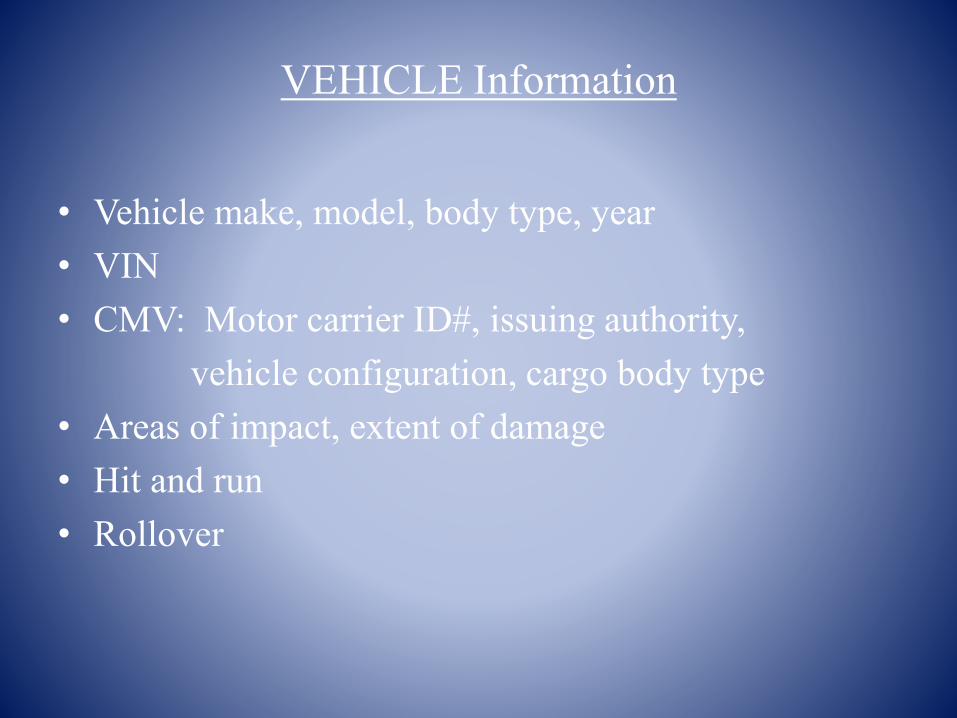
VEHICLE Information
• Vehicle make, model, body type, year• VIN• CMV: Motor carrier ID#, issuing authority,
vehicle configuration, cargo body type• Areas of impact, extent of damage• Hit and run• Rollover
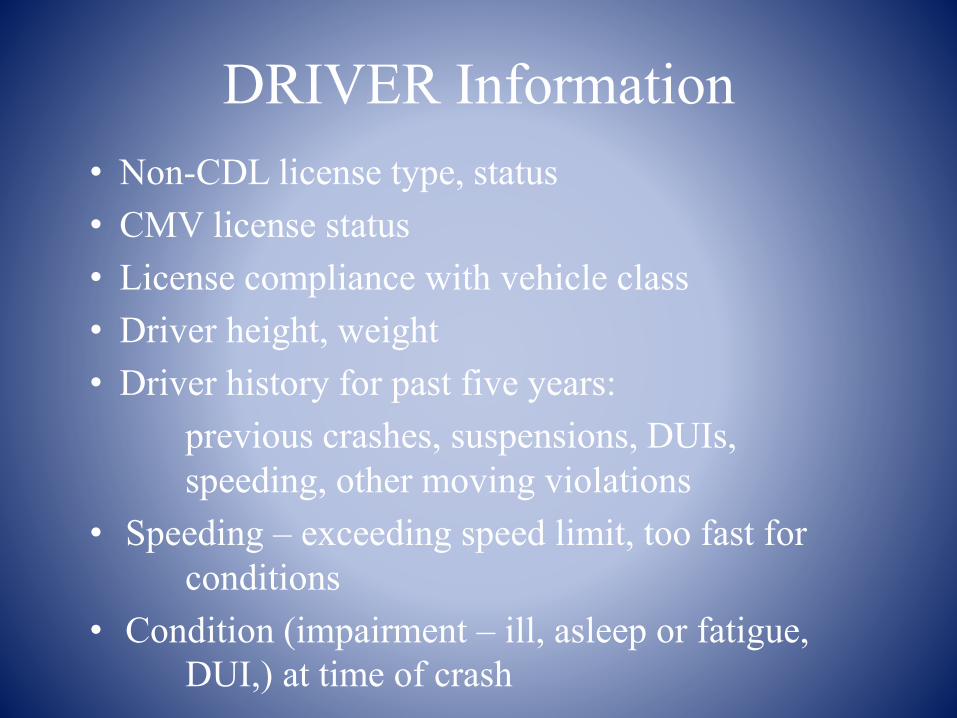
DRIVER Information • Non-CDL license type, status• CMV license status• License compliance with vehicle class• Driver height, weight• Driver history for past five years:
previous crashes, suspensions, DUIs, speeding, other moving violations
• Speeding – exceeding speed limit, too fast for conditions
• Condition (impairment – ill, asleep or fatigue, DUI,) at time of crash
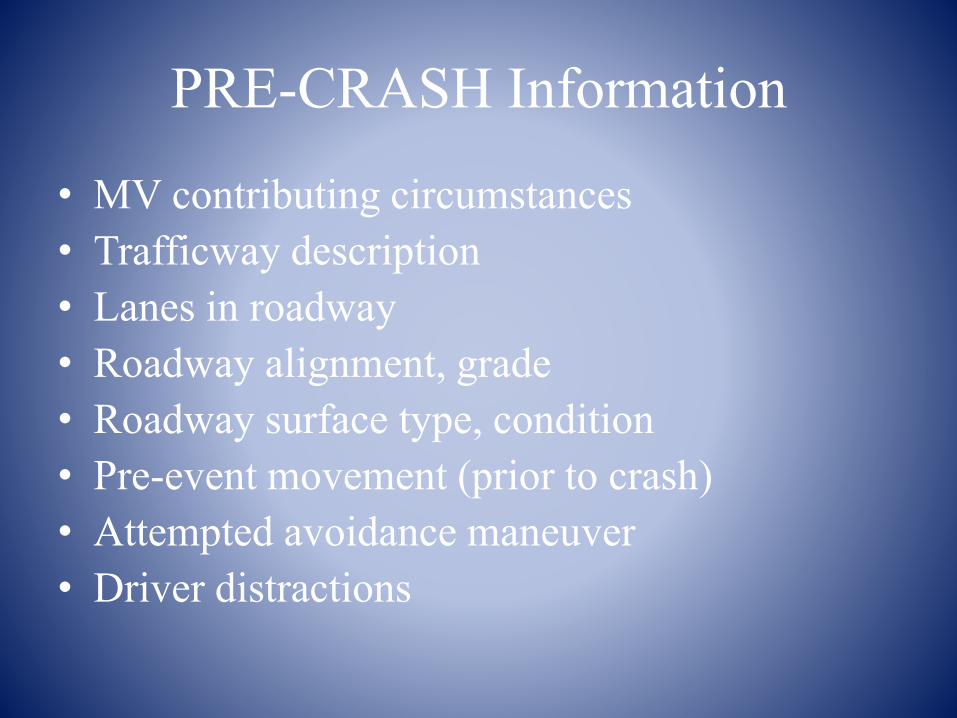
PRE-CRASH Information
• MV contributing circumstances• Trafficway description• Lanes in roadway• Roadway alignment, grade• Roadway surface type, condition• Pre-event movement (prior to crash)• Attempted avoidance maneuver• Driver distractions
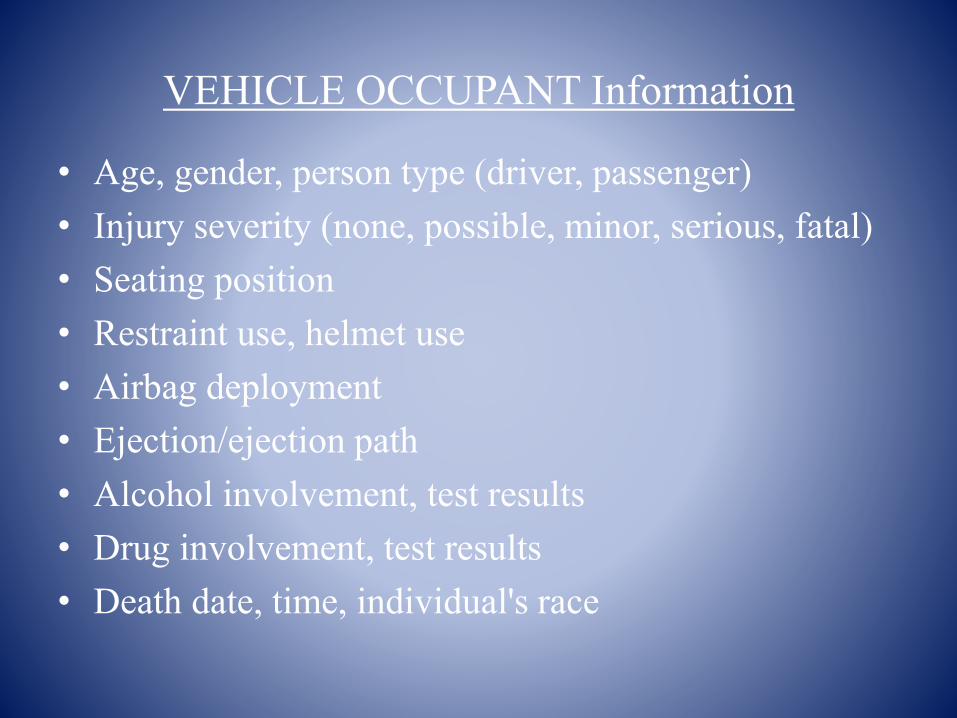
VEHICLE OCCUPANT Information
• Age, gender, person type (driver, passenger)• Injury severity (none, possible, minor, serious, fatal)• Seating position• Restraint use, helmet use• Airbag deployment• Ejection/ejection path• Alcohol involvement, test results• Drug involvement, test results• Death date, time, individual's race
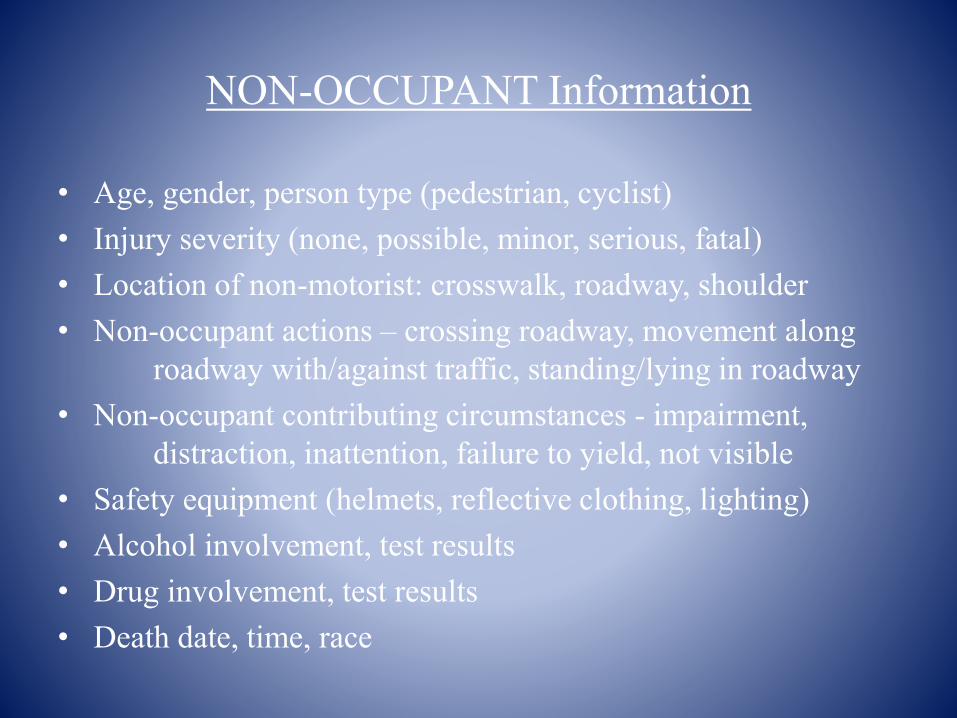
NON-OCCUPANT Information
• Age, gender, person type (pedestrian, cyclist)• Injury severity (none, possible, minor, serious, fatal)• Location of non-motorist: crosswalk, roadway, shoulder• Non-occupant actions – crossing roadway, movement along
roadway with/against traffic, standing/lying in roadway• Non-occupant contributing circumstances - impairment,
distraction, inattention, failure to yield, not visible• Safety equipment (helmets, reflective clothing, lighting)• Alcohol involvement, test results• Drug involvement, test results• Death date, time, race
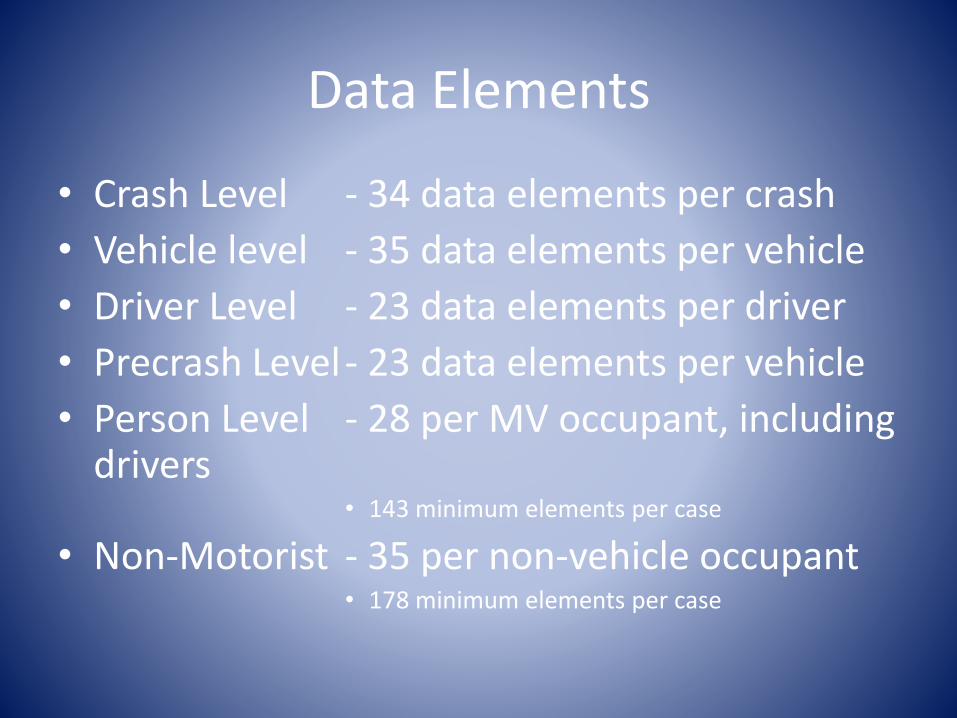
Data Elements
• Crash Level - 34 data elements per crash
• Vehicle level - 35 data elements per vehicle
• Driver Level - 23 data elements per driver
• Precrash Level - 23 data elements per vehicle
• Person Level - 28 per MV occupant, including drivers
• 143 minimum elements per case
• Non-Motorist - 35 per non-vehicle occupant• 178 minimum elements per case
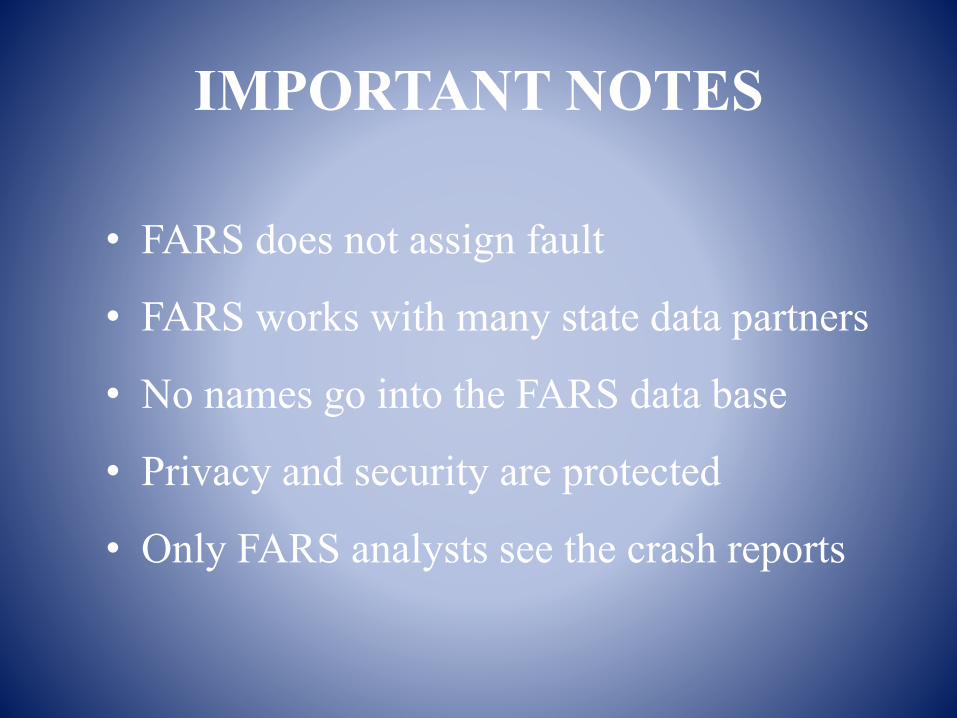
IMPORTANT NOTES
• FARS does not assign fault
• FARS works with many state data partners
• No names go into the FARS data base
• Privacy and security are protected
• Only FARS analysts see the crash reports
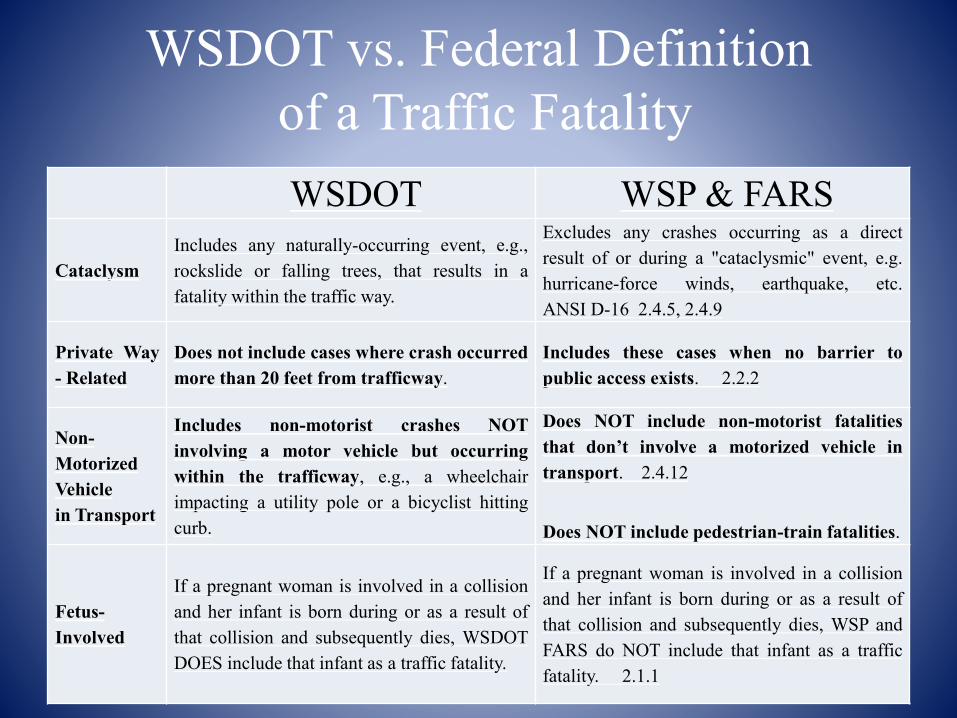
WSDOT vs. Federal Definitionof a Traffic FatalityWSDOT WSP & FARS
CataclysmIncludes any naturally-occurring event, e.g.,rockslide or falling trees, that results in afatality within the traffic way.
Excludes any crashes occurring as a directresult of or during a "cataclysmic" event, e.g.hurricane-force winds, earthquake, etc.ANSI D-16 2.4.5, 2.4.9
Private Way- Related
Does not include cases where crash occurredmore than 20 feet from trafficway.
Includes these cases when no barrier topublic access exists. 2.2.2
Non-MotorizedVehiclein Transport
Includes non-motorist crashes NOTinvolving a motor vehicle but occurringwithin the trafficway, e.g., a wheelchairimpacting a utility pole or a bicyclist hittingcurb.
Does NOT include non-motorist fatalitiesthat don’t involve a motorized vehicle intransport. 2.4.12
Does NOT include pedestrian-train fatalities.
Fetus-Involved
If a pregnant woman is involved in a collisionand her infant is born during or as a result ofthat collision and subsequently dies, WSDOTDOES include that infant as a traffic fatality.
If a pregnant woman is involved in a collisionand her infant is born during or as a result ofthat collision and subsequently dies, WSP andFARS do NOT include that infant as a trafficfatality. 2.1.1
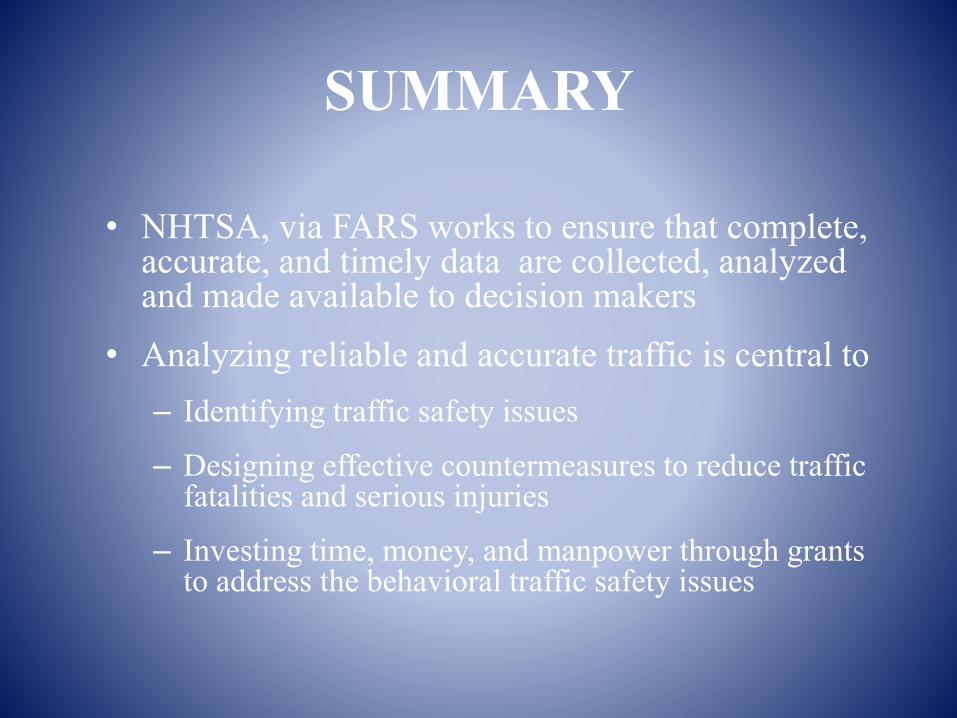
SUMMARY
• NHTSA, via FARS works to ensure that complete, accurate, and timely data are collected, analyzed and made available to decision makers
• Analyzing reliable and accurate traffic is central to– Identifying traffic safety issues
– Designing effective countermeasures to reduce traffic fatalities and serious injuries
– Investing time, money, and manpower through grants to address the behavioral traffic safety issues
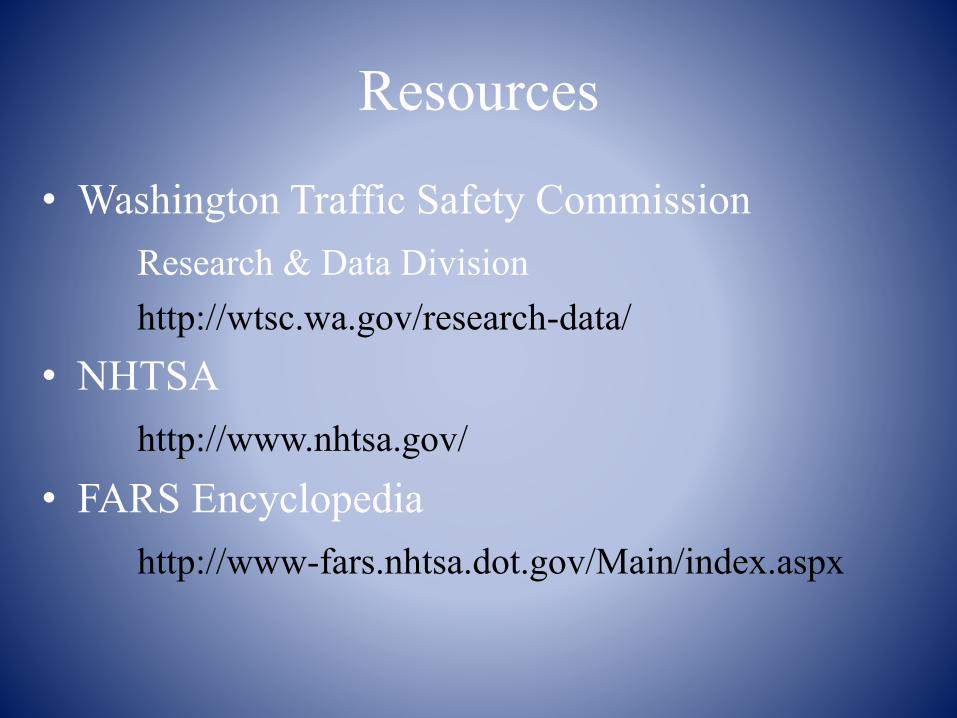
Resources
• Washington Traffic Safety CommissionResearch & Data Divisionhttp://wtsc.wa.gov/research-data/
• NHTSA http://www.nhtsa.gov/
• FARS Encyclopediahttp://www-fars.nhtsa.dot.gov/Main/index.aspx
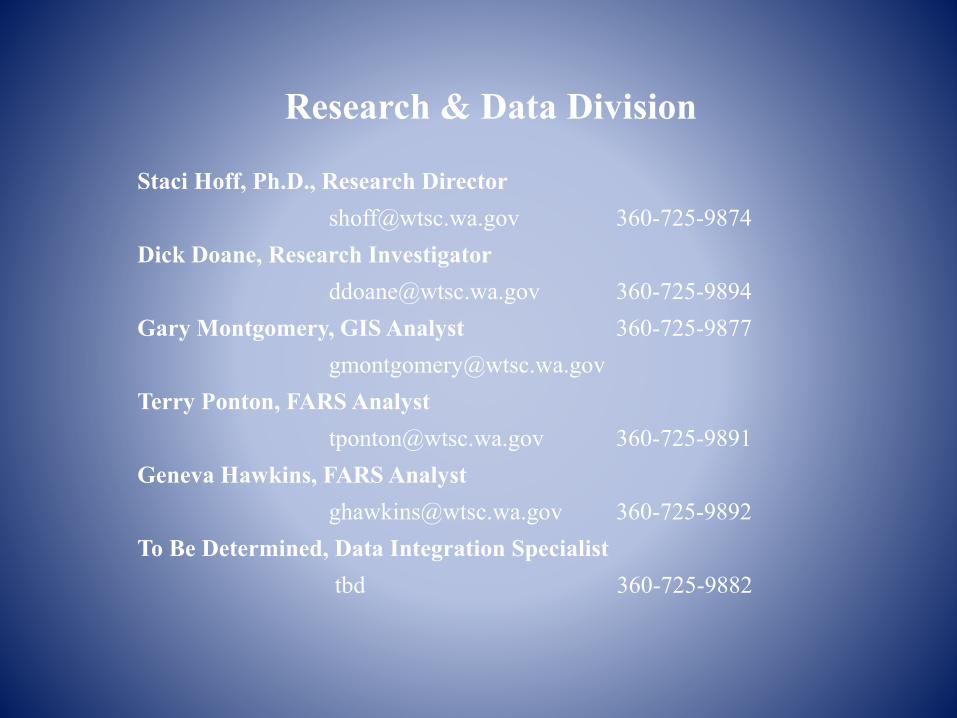
Research & Data Division
Staci Hoff, Ph.D., Research [email protected] 360-725-9874
Dick Doane, Research [email protected] 360-725-9894
Gary Montgomery, GIS Analyst [email protected]
Terry Ponton, FARS [email protected] 360-725-9891
Geneva Hawkins, FARS [email protected] 360-725-9892
To Be Determined, Data Integration Specialisttbd 360-725-9882
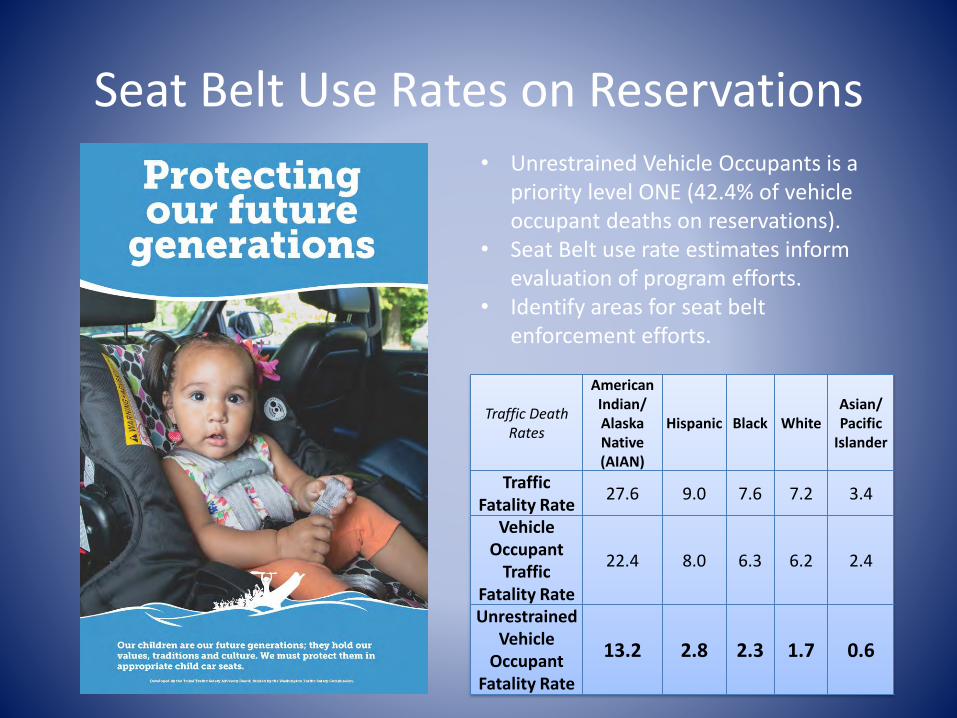
Seat Belt Use Rates on Reservations
Traffic Death Rates
American Indian/ Alaska Native (AIAN)
Hispanic Black WhiteAsian/ Pacific
Islander
Traffic Fatality Rate
27.6 9.0 7.6 7.2 3.4
Vehicle Occupant
Traffic Fatality Rate
22.4 8.0 6.3 6.2 2.4
Unrestrained Vehicle
Occupant Fatality Rate
13.2 2.8 2.3 1.7 0.6
• Unrestrained Vehicle Occupants is a priority level ONE (42.4% of vehicle occupant deaths on reservations).
• Seat Belt use rate estimates inform evaluation of program efforts.
• Identify areas for seat belt enforcement efforts.
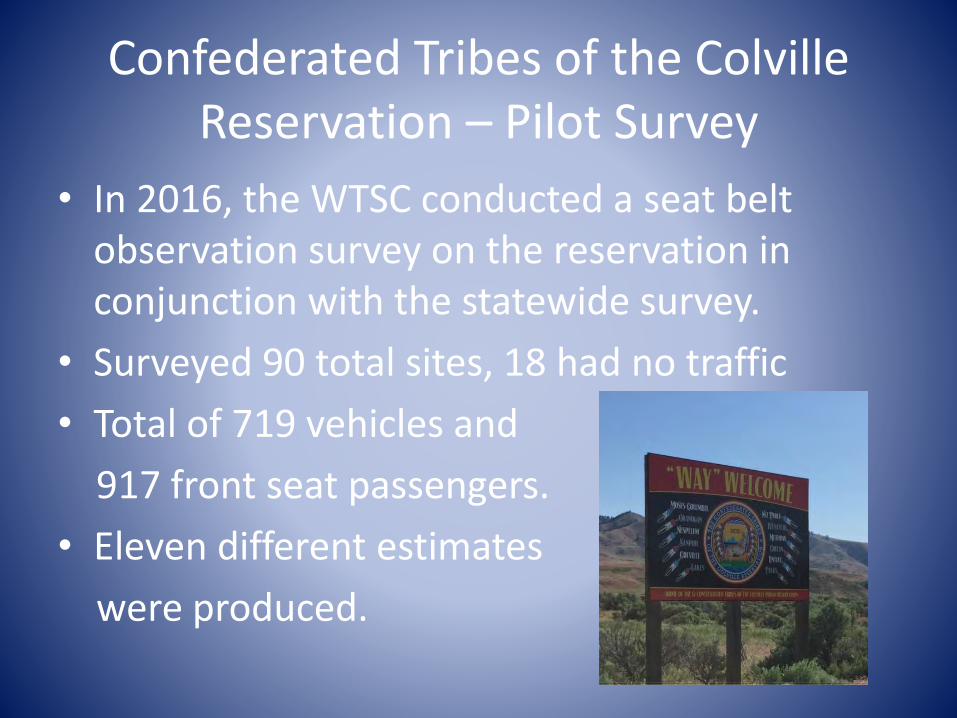
Confederated Tribes of the Colville Reservation – Pilot Survey
• In 2016, the WTSC conducted a seat belt observation survey on the reservation in conjunction with the statewide survey.
• Surveyed 90 total sites, 18 had no traffic
• Total of 719 vehicles and
917 front seat passengers.
• Eleven different estimates
were produced.
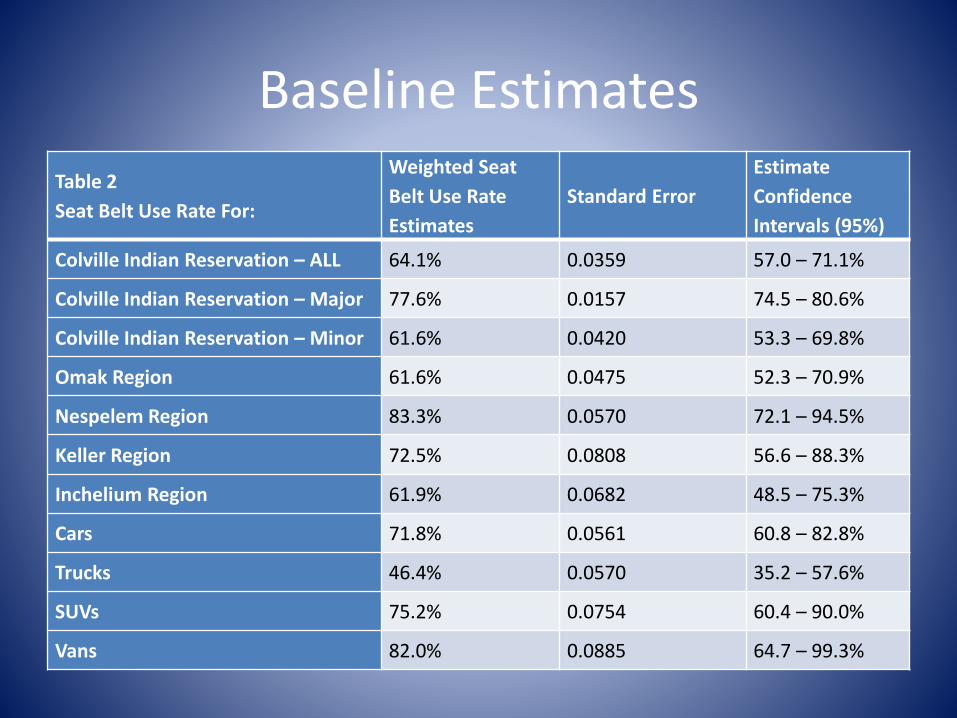
Baseline Estimates
Table 2
Seat Belt Use Rate For:
Weighted Seat
Belt Use Rate
Estimates
Standard Error
Estimate
Confidence
Intervals (95%)
Colville Indian Reservation – ALL 64.1% 0.0359 57.0 – 71.1%
Colville Indian Reservation – Major 77.6% 0.0157 74.5 – 80.6%
Colville Indian Reservation – Minor 61.6% 0.0420 53.3 – 69.8%
Omak Region 61.6% 0.0475 52.3 – 70.9%
Nespelem Region 83.3% 0.0570 72.1 – 94.5%
Keller Region 72.5% 0.0808 56.6 – 88.3%
Inchelium Region 61.9% 0.0682 48.5 – 75.3%
Cars 71.8% 0.0561 60.8 – 82.8%
Trucks 46.4% 0.0570 35.2 – 57.6%
SUVs 75.2% 0.0754 60.4 – 90.0%
Vans 82.0% 0.0885 64.7 – 99.3%
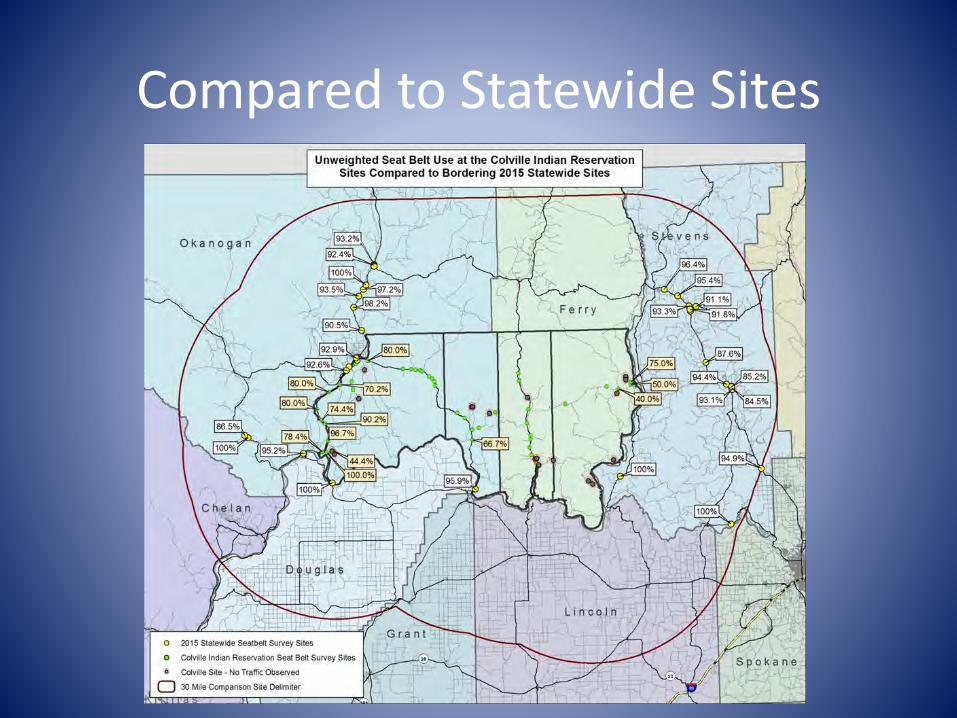
Compared to Statewide Sites
Lessons Learned
• Cleaning the roadway network (possibly exclude some sites)
– We can turn PAPER maps into roadway networks!
• Need tribal representative to accompany site mapping
– Too many no observation sites
– High confidence interval ranges
• Do we need vehicle type estimates?
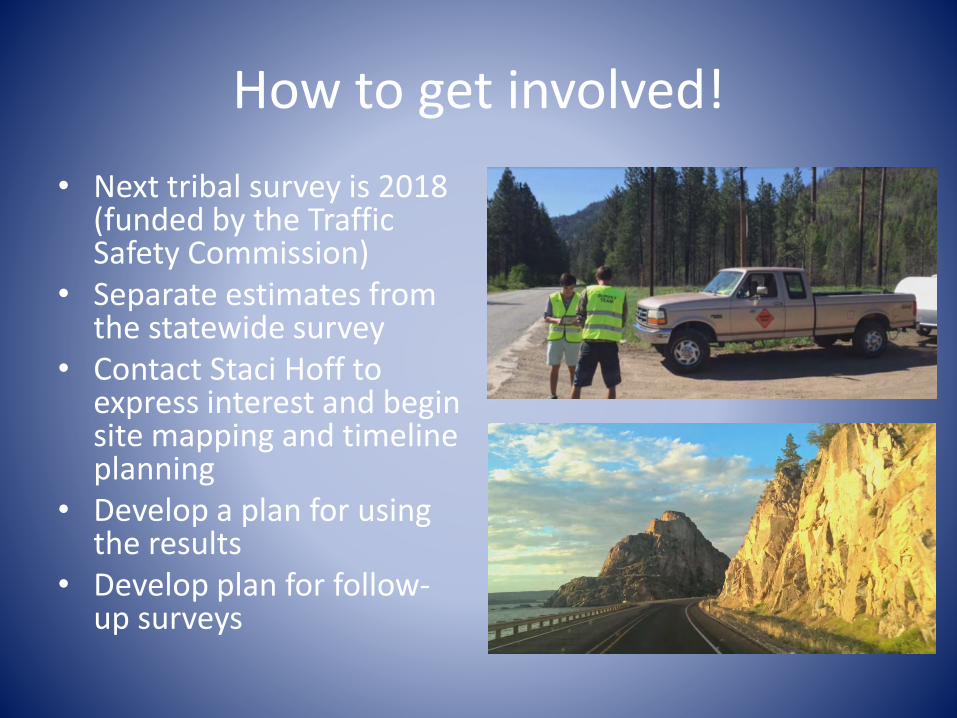
How to get involved!
• Next tribal survey is 2018 (funded by the Traffic Safety Commission)
• Separate estimates from the statewide survey
• Contact Staci Hoff to express interest and begin site mapping and timeline planning
• Develop a plan for using the results
• Develop plan for follow-up surveys