farmington municipal school district no. 5
TRANSCRIPT

Prepared By Bobbi Newland, Chief Financial Officer
STATE OF NEW MEXICO
FARMINGTON MUNICIPAL SCHOOL DISTRICT NO. 5
COMPREHENSIVE ANNUAL FINANCIAL REPORT AND
SUPPLEMENTAL INFORMATION YEAR ENDED JUNE 30, 2019
WITH REPORT OF CERTIFIED PUBLIC ACCOUNTANTS

THIS PAGE INTENTIONALLY LEFT BLANK

i | P a g e
INTRODUCTORY SECTION OF
FARMINGTON MUNICIPAL SCHOOL DISTRICT NO. 5
COMPREHENSIVE ANNUAL FINANCIAL REPORT FISCAL YEAR 2019
JULY 1, 2018 THROUGH JUNE 30, 2019
Our Mission
We will utilize a system of quality data driven instruction to ensure a culture of high performance for all students and staff.
District Goals
Student Achievement Support campus initiatives that create learning environments in which all students within each subgroup can
achieve academic success.
Staff Development Promote/Develop outstanding instructional leadership among administrators and staff through shared best
practices, improved evaluative techniques and an effective mentoring program.
Technology Continue to utilize technology to enhance instructional strategies, improve communication with parents and
community, and assist with student data analysis.
Communication Develop a comprehensive process for communicating with the community, including through school advisory
councils, concerning student achievement, accountability, and district initiatives.

ii | P a g e
THIS PAGE INTENTIONALLY LEFT BLANK

TABLE OF CONTENTS Year Ended June 30, 2019
STATE OF NEW MEXICO INTRODUCTORY SECTION FARMINGTON MUNICIPAL SCHOOL DISTRICT NO. 5 iii | P a g e
INTRODUCTORY SECTION
Title Page iii Table of Contents viii Organization Chart ix Official Roster xi Government Finance Officers Association Award xiii Transmittal Letter
FINANCIAL SECTION
3 Independent Auditors' Report
7 Management’s Discussion and Analysis
BASIC FINANCIAL STATEMENTS:
Government-Wide Financial Statements: 16 Statement of Net Position 18 Statement of Activities
Fund Financial Statements: 19 Balance Sheet – Governmental Funds 21 Reconciliation of the Balance Sheet – All Governmental Funds to the Statement of Net Position
22 Statement of Revenues, Expenditures, and Changes in Fund Balance – Governmental Funds 24 Reconciliation of the Statement of Revenue, Expenditures, and Changes In Fund Balance – All Governmental Funds to the
Statement of Activities
Major Funds: Statement of Revenues, Expenditures, and Changes in Fund Balance – Budget and Actual (Non-GAAP Budgetary Basis): 25 General Fund Special Revenue Funds: Fund # 26 Title I 24101 27 Entitlement IDEA-B 24106
28 Statement of Fiduciary Assets and Liabilities – Agency Funds
29 Notes to the Financial Statements
REQUIRED SUPPLEMENTARY INFORMATION:
Farmington Municipal Schools 65 Schedule of the District’s Proportionate Share of Net Pension Liability 65 Schedule of District’s Contributions 66 Schedule of the District’s Proportionate Share of Net OPEB Liability 66 Schedule of District’s Contributions
New Mexico Virtual Academy 67 Schedule of the District’s Proportionate Share of Net Pension Liability 67 Schedule of District’s Contributions 68 Schedule of the District’s Proportionate Share of Net OPEB Liability 68 Schedule of District’s Contributions
69 Notes to the Required Supplementary Information

TABLE OF CONTENTS Year Ended June 30, 2019
INTRODUCTORY SECTION STATE OF NEW MEXICO iv | P a g e FARMINGTON MUNICIPAL SCHOOL DISTRICT NO. 5
OTHER SUPPLEMENTAL INFORMATION:
Combining and Individual Fund Financial Statements and Schedules:
General Fund: 74 Combining Balance Sheet 75 Combining Statement of Revenues, Expenditures, and Changes in Fund Balance Statement of Revenues, Expenditures, and Changes in Fund Balance – Budget and Actual (Non-GAAP Budgetary Basis): Fund # 76 Operating Fund 11000 77 Transportation Fund 13000 78 Instructional Materials Fund 14000 Major Capital Projects Funds: Statement of Revenues, Expenditures, and Changes in Fund Balance – Budget and Actual (Non-GAAP Budgetary Basis): 80 Bond Building 31100
Major Debt Service Funds: Statement of Revenues, Expenditures, and Changes in Fund Balance – Budget and Actual (Non-GAAP Budgetary Basis): 81 Debt Service 41000
Nonmajor Governmental Funds: 90 Combining Balance Sheet 103 Combining Statement of Revenues, Expenditures, and Changes in Fund Balance Statement of Revenues, Expenditures, and Changes in Fund Balance – Budget and Actual (Non-GAAP Budgetary Basis):
Fund # Nonmajor Special Revenue Funds: 116 Food Service 21000 117 Athletics 22000 118 Activities 23000 119 Javits Gifted & Talented 24102 120 New Mexico Autism 24108 121 Preschool IDEA-B 24109 122 Education of Homeless 24113 123 IDEA-B Private Schools 24115 124 Fresh Fruits and Vegetables 24118 125 21st Century Community Learning Centers 24119 126 Title I - 1003g 24124 127 IDEA-B Student Success 24132 128 Title III English Language 24153 129 Title II Teacher Quality 24154 130 Carl D Perkins - JAG 24171 131 Carl D Perkins 24174 132 Carl D Perkins Secondary 24175 133 Carl D Perkins Secondary Redistribution 24176 134 Carl D Perkins HSTW - Current 24180 135 Carl D Perkins HSTW - PY Unliq. Oblig 24181 136 Carl D Perkins HSTW - Redistribution 24182 137 IDEA-B Stay in School 24188 138 Academic Enrichment 24189 139 Title I Comprehensive Support & Improvement 24190 140 Title I - HS Redesign 24191 141 ARRA - IDEA-B CEIS 24212 142 Johnson O'Malley 25131 143 Impact Aid Special Education 25145 144 Impact Aid Indian Education 25147 145 Title XIX Medicaid 25153 146 Indian Ed Formula Grant 25184

TABLE OF CONTENTS Year Ended June 30, 2019
STATE OF NEW MEXICO INTRODUCTORY SECTION FARMINGTON MUNICIPAL SCHOOL DISTRICT NO. 5 v | P a g e
OTHER SUPPLEMENTAL INFORMATION (cont’d):
147 Mentoring for Safe Schools 25187 148 Native American Program 25248 149 Kellogg Foundation 26121 150 Dual Credit Instructional Materials 27103 151 Libraries GO Bond 2012 27107 152 Reads to Lead 27114 153 Excellence in Teaching 27125 154 Recruitment Support 27128 155 Pre-K Initiative 27149 156 Indian Education Act 27150 157 Breakfast for Elementary Students 27155 158 Libraries GO Bond 2006 27170 159 New Mexico Grown 27183 160 4R Future Individual 27188 161 4R Future Group 27190 162 Youth Conservation Corp 28133 163 Tutoring 28178 164 Westmeath Foundation 29102
Nonmajor Capital Projects Funds: 165 Special Capital Outlay - Local 31300 166 Special Capital Outlay - State 31400 167 State SB-9 Match 31700 168 Capital Improvements SB-9 31701 169 Ed Technology Equipment Act 31900
Nonmajor Debt Service Funds: 170 Ed Tech Debt Service 43000
Capital Assets: 172 Schedule by Source 173 Schedule by Function and Activity 174 Schedule Changes by Function and Activity
State Required Disclosures: Fiduciary Funds: 176 Schedule of Changes in Assets and Liabilities – All Agency Funds
177 Schedule of Pledged Collateral 178 Schedule of Deposit and Investment Accounts 179 Cash Reconciliation

TABLE OF CONTENTS Year Ended June 30, 2019
INTRODUCTORY SECTION STATE OF NEW MEXICO vi | P a g e FARMINGTON MUNICIPAL SCHOOL DISTRICT NO. 5
OTHER SUPPLEMENTAL INFORMATION (cont’d):
Component Unit:
New Mexico Virtual Academy Charter School: 182 Statement of Net Position 183 Statement of Activities
184 Combining Balance Sheet 185 Reconciliation of the Balance Sheet – All Governmental Funds to the Statement of Net Position 186 Combining Statement of Revenues, Expenditures, and Changes in Fund Balance 187
Reconciliation of the Statement of Revenue, Expenditures, and Changes In Fund Balance – All Governmental Funds to the Statement of Activities
Statement of Revenues, Expenditures, and Changes in Fund Balance – Budget and Actual (Non-GAAP Budgetary Basis):
General Funds: 190 Operating Fund 11000 191 Instructional Materials Fund 14000
Special Revenue Funds: 192 Activities 23000 193 Entitlement IDEA-B 24106 194 Libraries GO Bond 2012 27107 Other Supplemental Information: 196 Schedule of Pledged Collateral 197 Cash Reconciliation
STATISTICAL SECTION
Financial Trends: 201 Net Position by Component 202 Expenses, Program Revenues, and Net (Expense)/Revenue 204 General Revenues and Total Change in Net Position 205 Fund Balances of Governmental Funds 206 Changes in Fund Balances of Governmental Funds
Revenue Capacity: 209 Assessed Value and Estimated Actual Value of Taxable Property 210 Computation of Direct and Overlapping General Obligation Millage Rates 212 Computation of Direct And Over Lapping General Obligation Debt 213 Principal Property Taxpayers 214 Property Tax Levies and Collections
Debt Capacity: 215 Outstanding Debt by Type 216 Ratios of General Bonded Debt Outstanding 217 Computation of Legal Debt Margin
Demographic and Economic Information: 218 Demographic and Economic Statistics 219 Principal Employers 220 Full-Time Equivalent District Employees by Function
Operating Information: 221 Operating Statistics 222 School Building Information

TABLE OF CONTENTS Year Ended June 30, 2019
STATE OF NEW MEXICO INTRODUCTORY SECTION FARMINGTON MUNICIPAL SCHOOL DISTRICT NO. 5 vii | P a g e
COMPLIANCE SECTION
227 Report on Internal Control Over Financial Reporting and on Compliance and Other Matters Based on an Audit of Financial Statements Performed In Accordance With Government Auditing Standards
229 Report on Compliance for Each Major Federal Program and Report on Internal Control Over Compliance Required by Uniform Guidance
232 Schedule of Expenditures of Federal Awards
233 Notes to the Schedule of Expenditures of Federal Awards
234 Schedule of Findings and Questioned Costs
244 Summary Schedule of Prior Year Audit Findings
245 Required Disclosure
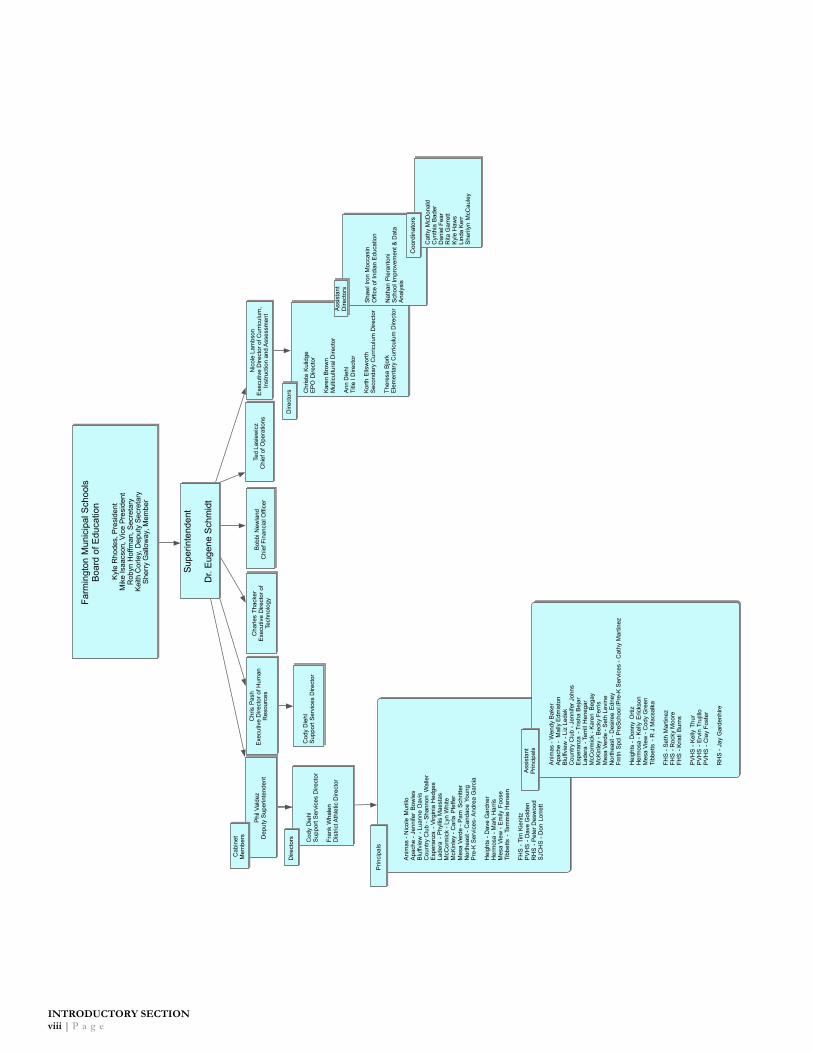
Farm
ingt
on M
unic
ipal
Sch
ools
Boa
rd o
f Edu
catio
n
Kyl
e R
hode
s, P
resi
dent
Mik
eIs
aacs
on, V
ice
Pre
side
ntR
obyn
Hof
fman
, Sec
reta
ryK
eith
Cor
ley,
Dep
uty
Sec
reta
ryS
herr
yG
allo
way
, Mem
ber
Sup
erin
tend
ent
Dr.
Eug
ene
Sch
mid
t
Phi
l Val
dez
Dep
uty
Sup
erin
tend
ent
Bob
biN
ewla
ndC
hief
Fin
anci
al O
ffice
rTe
dLa
siew
icz
Chi
ef o
f Ope
ratio
ns
Chr
isP
ash
Exe
cutiv
e D
irect
or o
f Hum
anR
esou
rces
Cod
y D
iehl
Sup
port
Ser
vice
s D
irect
or
Nic
ole
Lam
bson
Exe
cutiv
e D
irect
or o
f Cur
ricul
um,
Inst
ruct
ion
and
Ass
essm
ent
Chr
ista
Kul
idge
EP
O D
irect
or
Kar
en B
row
nM
ultic
ultu
ral D
irect
or
Ann
Die
hlTi
tle I
Dire
ctor
Kor
thE
llsw
orth
Sec
onda
ry C
urric
ulum
Dire
ctor
Ther
esa
Bjo
rkE
lem
enta
ry C
urric
ulum
Dire
ctor
Cha
rles
Thac
ker
Exe
cutiv
e D
irect
or o
fTe
chno
logy
Dire
ctor
s
Cod
y D
iehl
Sup
port
Ser
vice
s D
irect
or
Fran
kW
hale
nD
istri
ct A
thle
tic D
irect
or
Dire
ctor
s
Ani
mas
- N
icol
eM
urill
oA
pach
e - J
enni
fer
Bow
les
Blu
ffvie
w -
Luan
ne D
avis
Cou
ntry
Clu
b - S
hann
onW
alle
rE
sper
anza
- Vi
rgin
ia H
edge
sLa
dera
- P
hylli
sM
aest
asM
cCor
mic
k - L
yn W
hite
McK
inle
y - C
arla
Pfe
ffer
Mes
a Ve
rde
- Pam
Sch
ritte
rN
orth
east
-C
anda
ce Y
oung
Pre
-K S
ervi
ces-
And
rea
Gar
cia
Hei
ghts
- D
ave
Gar
dner
Her
mos
a - M
ark
Har
risM
esa
View
- E
mily
Foos
eTi
bbet
ts -
Tam
mie
Han
sen
FHS
- Ti
mK
ieni
tzP
VH
S -
Dav
e G
olde
nR
HS
- P
eter
Des
woo
dS
JCH
S -
Don
Lorr
ett
Prin
cipa
ls
Cab
inet
Mem
bers
Ani
mas
- W
endy
Bak
erA
pach
e -
Mal
lyE
dmis
ton
Blu
ffvie
w -
Liz
Lede
kC
ount
ry C
lub
- Jen
nife
r Joh
nsE
sper
anza
- Tr
isha
Bej
arLa
dera
-Te
rrill
Hen
egar
McC
orm
ick
- Kar
enB
egay
McK
inle
y - B
ecky
Fer
risM
esa
Verd
e - S
eth
Levi
neN
orth
east
- D
esire
eE
dney
Fmtn
Spc
lPre
Sch
ool/
Pre
-K S
ervi
ces
- Cat
hy M
artin
ez
Hei
ghts
- D
onny
Orti
zH
erm
osa
- Kel
lyE
ricks
onM
esa
View
- C
ody
Gre
enTi
bbet
ts -
R J
Mac
salk
a
FHS
- S
eth
Mar
tinez
FHS
- R
ocky
Moo
reFH
S -
Kris
ti B
urns
PV
HS
- K
elly
Thur
PV
HS
-E
rvin
Tru
jillo
PV
HS
- C
lay
Fost
er
RH
S - J
ayG
arde
nhire
Ass
ista
ntP
rinci
pals
Sha
wl I
ron
Moc
casi
nO
ffice
of I
ndia
n E
duca
tion
Nat
han
Pie
rant
oni
Sch
ool I
mpr
ovem
ent &
Dat
aA
naly
sis
Ass
ista
ntD
irect
ors
Cat
hy M
cDon
ald
Cyn
thia
Bad
erD
anie
l Fea
rR
ita G
arre
ttK
yle
Haw
sLi
nda
Ker
rS
heril
yn M
cCau
ley
Coo
rdin
ator
s
INTRODUCTORY SECTION viii | P a g e

OFFICIAL ROSTER June 30, 2019
STATE OF NEW MEXICO INTRODUCTORY SECTION FARMINGTON MUNICIPAL SCHOOL DISTRICT NO. 5 ix | P a g e
BOARD OF EDUCATION
Kyle Rhodes President
Stephanie Thompson Deputy Secretary
Robyn Hoffman Vice President
Keith Corley Secretary
Sherry Galloway Member
ADMINISTRATION Eugene Schmidt Superintendent
Bobbi Newland Chief Financial Officer
Laura Warnke Admin Asst. to Chief Financial Officer
Malinda Fowler Comptroller
Denise Stokes AP Specialist
Cyndi Bolen Payroll
Lisa Evans Procurement
AUDIT COMMITTEE Stephanie Thompson Member-FMS Board
Keith Corley Member-FMS Board
Linda Rodgers Member-FMS community
Audra Winters Member-FMS community
Eugene Schmidt Member-FMS
Bobbi Newland Member-FMS
Malinda Fowler Member-FMS
Laura Warnke Member-FMS
Kyle Hunt Member-NMVA
Nikki Sandoval Member-NMVA Board
Kim Hite-Pope Member-NMVA
DeLea Taylor Member-NMVA Board
Kelli Loudermilk Member-NMVA
FINANCE COMMITTEE Sherry Galloway Member
Kyle Rhodes Member
Eugene Schmidt Member-FMS
Bobbi Newland Member-FMS
Malinda Fowler Member-FMS
Laura Warnke Member-FMS
Phil Valdez Member

INTRODUCTORY SECTION x | P a g e
THIS PAGE INTENTIONALLY LEFT BLANK

INTRODUCTORY SECTION xi | P a g e

INTRODUCTORY SECTION xii | P a g e
THIS PAGE INTENTIONALLY LEFT BLANK

xiii | P a g e
November 22, 2019
To the Citizens and Board of Education of Farmington Municipal School District
We are pleased to present to you the comprehensive annual financial report of the Farmington Municipal School District for the fiscal year ended June 30, 2019.
State law requires that all general-purpose local governments publish within six months of the close of each fiscal year a complete set of financial statements presented in conformity with generally accepted accounting principles (GAAP) and audited in accordance with generally auditing standards by a firm of licensed certified public accountants. Pursuant to that requirement, we hereby issue the comprehensive annual financial report of the Farmington Municipal School District for the fiscal year ended June 30, 2019.
This report consists of management’s representations concerning the finances of the Farmington Municipal School District. Consequently, management assumes full responsibility for the completeness and reliability of all of the information presented in this report. To provide a reasonable basis for making these representations, management of the Farmington Municipal School District has established a comprehensive internal control framework that is designed both to protect the government’s assets from loss, theft, or misuse and to compile sufficient reliable information for the preparation of the Farmington Municipal School District’s financial statements in conformity with GAAP. Because the cost of internal controls should not outweigh their benefits, the Farmington Municipal School District’s comprehensive framework of internal controls has been designed to provide reasonable rather than absolute assurance that the financial statements will be free from material misstatement. As management, we assert that, to the best of our knowledge and belief, this financial report is complete and reliable in all material respects.
The Farmington Municipal School District’s financial statements have been audited by Accounting and Financial Solutions, LLC, a firm of licensed certified public accountants. The goal of the independent audit was to provide reasonable assurance that the financial statements of the Farmington Municipal School District for the fiscal year ended June 30, 2019, are free of material misstatement. The independent audit involved examining, on a test basis, evidence supporting the amounts and disclosures in the financial statements; assessing the accounting principles used and significant estimates made by management; and evaluating the overall financial statement presentation. The independent auditor concluded, based upon the audit, that there was a reasonable basis for rendering an unmodified opinion that the Farmington Municipal School District’s financial statements for the fiscal year ended June 30, 2019, are fairly presented in conformity with GAAP. The independent auditor’s report is presented as the first component of the financial section of this report.
The independent audit of the financial statements of the Farmington Municipal School District was part of a broader, federally mandated “Single Audit” designed to meet the special needs of federal grantor agencies. The standards governing Single Audit engagements require the independent auditor to report not only on the fair presentation of the financial statements, but also on the audited government's internal controls and compliance with legal requirements, with special emphasis on internal controls and legal requirements involving the administration of federal awards. These reports are available in the Farmington Municipal School District’s separately issued Single Audit Report.
GAAP require that management provide a narrative introduction, overview, and analysis to accompany the basic financial statements in the form of Management’s Discussion and Analysis (MD&A). This letter of transmittal is designed to complement MD&A and should be read in conjunction with it. The Farmington Municipal School District’s MD&A can be found immediately following the report of the independent auditors.

xiv | P a g e
Profile of the District The District is a political subdivision of the State organized for the purpose of operating and maintaining an educational program for school-age children residing within its boundaries. The Farmington Municipal School District No. 5 is the seventh largest district in the State with an enrollment of 10,963 students. There are 10 elementary schools, 4 middle schools, an alternative senior high school, an early college high school, two senior high schools and two pre-schools within the District. The District’s educational program also includes vocational, technical and occupational training. The District provides education services for the detainees of the County Juvenile Detention Center, which averages approximately 25 students. The District’s powers are subject to regulations promulgated by the New Mexico Secretary of Public Education. The Public Education Department Secretary is the governing authority of the public school systems in New Mexico and has control, management and direction over all public schools. The Governor appoints the Secretary of Public Education. Generally, the powers of the Secretary include determining policy of operations of all public schools; designating courses of instruction for all public schools in the State; adopting regulations for the administration of all public schools; determining qualifications for teachers, counselors, and their assistants; and prescribing minimum educational standards for all public schools. The Secretary of the Public Education Department may order the creation of new school districts or may require consolidation of school districts. The District Board (the “Board”), subject to regulations of the Public Education Department, supervises and controls all public schools and property within the District. The Board employs a superintendent of schools, delegates administrative and supervisory functions to the superintendent, fixes the budget, has the capacity to sue and be sued, contracts, leases, purchases and sells for the District, acquires and disposes of all property, and adopts regulations pertaining to the administration of all powers or duties of the Board. Members serve without compensation for four-year terms of office in non-partisan elections held every two years on the first Tuesday in November. Currently, the District operates and maintains a variety of facilities in meeting its obligations to provide an education program for the school-age children residing within its boundaries. The District operates 20 school sites. The capacity of the school facilities is estimated at 12,000 students (FTE basis). In addition to the school buildings and their contents, the District owns 290 acres of land upon which school buildings and facilities are located, approximately 579 acres of additional vacant property, the District Administration Building, a maintenance shop and custodial center, bus terminal, an Exceptional Program and Bilingual Education building, an instructional materials warehouse and 40 vehicles. The District owns its bus fleet (75). The Farmington Schools, as a whole, is accredited by the State of New Mexico’s Public Education Department. The District is required by State law to submit to the Public Education Department by April 15 of each year, a projected budget for the District for the ensuing fiscal year. If the District fails to submit a budget, the Public Education Department must prepare a projected budget for the District for the ensuing fiscal year. Prior to June 20th of each year, the Board must hold a public hearing to establish the projected budget for the district for the next year. On or before July 1 of each year, the Public Education Department must approve and certify to the District an approved budget for use by the District based upon the estimated budget fixed by the District. No school board, officer or employee of a school district may make expenditure or incur any obligation for the expenditure of public funds unless such expenditure is made in accordance with an operating budget approved by the Public Education Department, but this does not prohibit the transfer of funds between line items within an object of a budget. Approved budgets may not be altered or amended after approval by the Public Education Department except upon request to the Public Education Department by the District. Instances in which such requests will be approved include a change within the budget, which does not increase the total amount of the budget. Additional budget items may also be approved if the District is to receive unanticipated revenues. Finally, if it becomes necessary to increase the District’s budget by more than $1,000 for any reason other than those listed above, the Public Education Department may order a special public hearing to consider the requested increase. Formal budgetary integration is employed as a management control device during the year for the General Fund, Special Revenue Funds, Capital Projects and Debt Service Fund with appropriations lapsing at year-end. Total expenditures of any activity category may not exceed categorical appropriations. To conform to Public Education Department requirements, budgets for all funds of the District are adopted on the cash basis of accounting except for state instructional materials credit, which provides free textbooks from the Public Education Department. Hence, the budgets are not prepared in conformity with generally accepted accounting principles (GAAP) and budgetary comparisons are presented on the (Non-GAAP) basis of accounting.

xv | P a g e
Budget-to-actual comparisons are provided in this report for each individual governmental fund for which an appropriated annual budget has been adopted. For the general fund, this comparison is found on page 26 as part of the basic financial statements for the government funds. For governmental funds, other than the general fund, with appropriated annual budgets, this comparison is presented in the governmental fund subsection of this report, which starts on pages 27, 64 and 104. Factors Affecting Financial Condition The information presented in the financial statements is perhaps best understood when it is considered from the broader perspective of the specific environment within which Farmington Municipal School District operates. Local economy. The Farmington Municipal School District (the “District”) is located in the mineral rich “Four Corners” area in northwestern New Mexico. The economy of the area is dependent upon trade, electric power generation, oil, gas and coal production, government, tourism and agriculture. Retail trade. Farmington is the largest city in the Four Corners area of Colorado, Arizona, Utah and New Mexico. It serves as the retail, distribution and service center for an estimated population of over 260,000 including the Navajo Nation, the largest Indian reservation in the country.
Electrical Generation The economic base of the area was broadened beyond agriculture and oil and gas production in the 1960’s with construction of two coal-fired generating plants, the Four Corners Generating Station and the San Juan Generating Station.
Four corners (“APS”) Company operates Four Corners Power Plant, a five-unit 2,040 megawatt coal-fired plant. Located on the Navajo Nation, 15 miles west of Farmington, employs roughly 434 workers, 82% of whom are Native American. Three of the five units closed in December 2013 as part of a $182 million plan for APS to meet environmental regulations. APS purchased a larger stake in Units 4 and 5 of the Four Corners Power Plant that will remain open and do not need as much investment to meet EPA standards. APS has not been replacing workers at the plant as they quit or retired since 2010 when the plan was first proposed, avoiding layoffs from the closure. APS owned 15% of Units 4 and 5 and bought an additional 48% stake in them from Southern California Edison which could save customers nearly $500 million over the next best alternative. PNM Resources Inc. of New Mexico, Salt River Project, El Paso Electric and Tucson Electric Power also own minority stakes in Units 4 and 5. In 2018, the Navajo Transitional Energy Co. acquired a 7% stake in units 4 and 5 in the power plant from APS as El Paso Electric Co. sold this 7% share to APS in 2016.
The Public Service Company of New Mexico (“PNM”) owns a significant portion of San Juan Generating Station (SJGS), a four-unit, 1,684 megawatt of net accredited generation capacity, coal-fired plant located approximately 15 miles west of Farmington. The company operates SJGS on behalf of itself and four other owners in the West. The plant employs approximately 1,500 full-time employees and is the 7th largest coal-fired generating station in the West. In 2017, Units 2 and 3 were closed as part of a settlement agreement between the State of New Mexico and the U.S. Environmental Protection Agency (EPA). PNM is planning shutting down the remaining coal-burning units in 2022, 20 years before the end of its useful life. The City of Farmington, one of the remaining owners, has indicated interest in retaining its ownership and supporting Enchant Energy and its plans to repurpose the power plant into carbon capture utilization and sequestration (CCUS) facility and as a wholesale power generator.
PNM spokesman said the 2022 closure would align with the expiration of the company’s finance and supply agreements with the owner of the San Juan Coal Mine. The mine was purchased by Westmoreland Coal Co. in early 2016 for $127 million. At the time of the purchase, Westmoreland said in a news release that a PNM-affiliated company had loaned it $125 million to finance the purchase, with the loan maturing in five years. Year 2022 is also when PNM’s partnership agreement for the San Juan plant expires with Tucson Electric Power, the city of Farmington, Los Alamos County and Utah Associated Municipal Power Systems. PNM is the largest stakeholder in the plant, owning 66.4 percent of shares.
The San Juan mine is the only active underground mine in New Mexico. Coal usage is about 6.4 million tons per year. The San Juan Plant meets or exceeds all state and federal regulations for NO2, SO2 and particulate control, and is a zero liquid discharge facility.1

xvi | P a g e
Oil and Gas Production The oil and gas industry has been important to the San Juan County economy since the 1920’s and between the early 1950’s and early 1980’s was its mainstay. Large scale development began in 1951 and continued until 1983 when cheaper foreign crude oil and natural gas supplies dominated the market.
New Mexico oil and natural gas reserves are estimated at over 700 million barrels of oil and over 17 trillion cubic feet of natural gas, according to the New Mexico Energy, Minerals and Natural Resources Division. New Mexico ranks third in crude oil production and fourth in proven oil reserves. In addition, New Mexico is ranked ninth in natural gas production and eighth in natural gas reserves with approximately 68% located in northwestern New Mexico. San Juan County has been ranked second in gas production in New Mexico and third in oil production for the past three years. Exploration for natural gas in coal seams throughout the San Juan Basin has increased potential reserves by as much as 50 trillion cubic feet. The following tables set forth the history of oil and gas production in the County and the State as reported to the State Department of Taxation & Revenue Department by the Oil and Gas Accounting Commission.
Crude Oil
San Juan County New Mexico Calendar Year
Volume (Barrels)
Value (000’s)
Volume (Barrels)
Value (000’s)
2009 1,056,286 48,457 62,353,958 3,333,533 2010 918,284 59,302 58,485,470 4,306,709 2011 2,167,068 80,745 72,649,112 6,309,905 2012 561,651 45,514 83,919,902 7,238,924 2013 1,274,573 107,152 100,986,118 9,176,093 2014 2,367,099 194,924 121,071,928 10,788,344 2015 4,112,885 156,173 148,711,044 6,582,600 2016 3,924,905 131,989 147,090,860 5,762,847 2017 4,728,892 199,529 167,271,496 7,935,246 2018 5,672,284 318,521 251,316,401 13,849,206
Source: New Mexico ONGARD. Natural Gas
San Juan County New Mexico Calendar Year
Volume (Barrels)
Value (000’s)
Volume (Barrels)
Value (000’s)
2009 525,211,631 2,149,341 1,381,753,018 5,727,586 2010 426,402,736 2,297,225 1,155,151,796 6,414,098 2011 454,172,594 2,529,552 1,224,220,012 7,098,629 2012 240,905,680 650,723 528,027,589 1,472,412 2013 386,166,366 1,738,715 1,165,872,601 5,407,090 2014 380,567,113 1,970,285 1,200,327,161 6,267,444 2015 365,471,873 1,024,309 1,181,568,177 3,289,951 2016 342,850,067 899,432 1,185,300,793 3,186,977 2017 330,759,782 1,086,211 1,303,860,366 4,324,880 2018 429,915,040 1,024,661 1,826,519,308 5,240,661
Source: New Mexico ONGARD.
Coal Mining. BHP Billiton previously owned the three large mines producing coal for the Four Corners Power Plant and San Juan Generating Stations and transferred the Navajo Mine to the Navajo Transitional Energy Co. (“NTEC”) which was formed by the Navajo Nation. NTEC currently owns the mine while Bisti Fuels Company, LLC, a subsidiary of North American Coal Corporation operates the mine on behalf of NTEC. The Navajo Mine supplies the Four Corners Plant and the San Juan and LaPlata Mines, each estimated to have useful lives in excess of twenty years, supply the San Juan Plant. On December 30, 2013, the NTEC and Four Corners Plant executed a coal supply agreement from July 2016 through 2031. The Navajo Mine is located approximately 20 miles southwest of Farmington, the LaPlata Mine is 20 miles north of Farmington, within the school district boundaries, and the San Juan mine is northwest. In 2017, coal production in New Mexico was estimated at 13.84 million tons with coal reserves in San Juan county estimated at 80 million recoverable tons. In 2017, New Mexico accounted for almost 2% of all U.S. coal production.

xvii | P a g e
Navajo Indian Irrigation Project The Navajo Indian Irrigation Project (NIIP), representing a joint federal and tribal investment is farmed by the Navajo Agricultural Products Industry (NAPI), an enterprise of the Navajo Nation. Composed of over 110,000 acres, the project is currently 70% complete with approximately 72,000 acres under cultivation and over 38,000 acres still to be developed. NAPI produces high value crops such as potatoes, onions, pinto beans, alfalfa, pumpkin, barley, corn, and wheat. The enterprise also includes a 12,000 head custom feedyard, testing laboratory, fresh pack operation, bean plant, pellet/granary operation, and potato storage facilities. Business ventures contracted with NAPI include production of sod and an orchard (apples, peaches, apricots, and pears) along with an expansion in organic and traditional Navajo crops. Located on the project and just seven miles south of Farmington on Highway 371, is a 300 acre industrial park.
NAPI’s success is dependent on its employment which varies between 300-400 people during a crop season. Ninety-seven percent of the employees are members of the Navajo Nation.
NAPI’s mission is to develop, grow and maintain the resources of the projected 110,000 acres. As a grower, NAPI provides quality products under the “Navajo Pride” label in both regional and in international markets.
Education More than 10,000 students attended the District in school year 2017-18. There are six private and two Bureau of Indian Affairs (“BIA”) contract schools in the District.
San Juan College (the “College”) offers a two-year college program, enabling students to obtain Associate Degrees in Arts or Sciences in addition to occupational degrees and certificate programs. The College was founded in 1956 and has grown dramatically in size and scope since its founding. It is the most affordable post-secondary school in New Mexico. The College recently opened its Energy and Power Schools which will allow students to access careers in the oil and gas industry. It also has similar programs in pre-medicine and education.
Medical San Juan Regional Medical Center (“SJRMC”) is an acute care hospital in the Four Corners region with over 194 licensed beds. It received the Healthgrades Distinguished Hospital Award for Clinical Excellence in 2013 and is ranked among the top 5% in the nation for overall clinical excellence. In addition to this national recognition, SJRMC is one of the only hospitals in New Mexico and the Four Corners region to receive this distinction.
San Juan Regional Medical Center is designated a Level III Trauma Center and provides air ambulance service with a helicopter and a fixed wing aircraft. SJRMC provides a very broad range of medical, surgical and rehabilitation services. In addition to those services, the hospital also provides a Childbirth Center, a nephrology unit, a pediatric unit, an inpatient behavioral health unit, a day surgery center and extensive imaging and lab testing services. In addition, the hospital operates a number of offsite facilities.
Tourism The Four Corners area boasts internationally known tourist attractions including Mesa Verde, Canyon de Chelly, Monument Valley and Lake Powell. Equally worthy attractions within the County include Chaco Cultural National Historical Park (a major Anasazi cultural center during the 12th and 13th centuries), Aztec Ruins National Monument (500 room Indian community ruin with reconstructed Kiva), white water river rafting and nationally renowned trout fishing on the San Juan River just below Navajo Lake. Tourist visits to Aztec Ruins have increased significantly over the years. The Connie Mack Baseball World Championship Tournament is held in Farmington each summer. Navajo rugs, Native American jewelry, paintings and sculpture are available at local trading posts and shops.
Long-term financial planning. The district has a Master Facility Plan that determines the district’s capital improvements for the next five years and the district’s financial planning for future bond elections. Financial planning for the district has been driven by state mandates that result from the school grading reform requiring greater accountability for student success. AWARDS AND ACKNOWLEDGEMENTS Superintendent Dr. Eugene Schmidt recognized the Finance Department for again receiving the Certificate of Achievement for Excellence in Financial Reporting for its comprehensive annual financial report. The District has received this honor every year since 1993.

xviii | P a g e
CURRENT PROJECTS
On February 7, 2017 voters approved issuing $26,000,000 in bonds to fund renovation of McCormick Elementary, Country Club Elementary and numerous improvement projects. Remaining funds from a 2015 bond issue supplement the funding of these projects.
The District will receive Public School Critical Capital Outlay funds to help with the renovation of Country Club Elementary.
INDEPENDENT AUDIT
As required by New Mexico State law, an annual audit of the financial records, books of account and the transactions of all administrative departments of the Farmington Municipal School District No. 5 have been made by an independent auditor. The independent auditor’s opinion as prepared by Accounting and Financial Solutions, LLC is included within the Financial Section of this report. The 2019 audit was an organization-wide single audit under the provisions of the Single Audit Act Amendments of 1996 and related OMB Circular A-133. The auditor’s reports related specifically to the single audit area in the Compliance Section of this report.
CERTIFICATES
The Government Finance Officers Association of the United States and Canada (GFOA) awarded a Certificate of Achievement for Excellence in Financial Reporting to Farmington Municipal Schools for its comprehensive annual financial report for the fiscal year ended June 30, 2018. This was the 26th consecutive year (1993-2018) that the government has achieved this prestigious award. In order to be awarded a Certificate of Achievement, a government must publish an easily readable and efficiently organized comprehensive annual financial report. This report must satisfy both generally accepted accounting principles and applicable legal requirements.
A Certificate of Achievement is valid for a period of one year only. We believe that our current comprehensive annual financial report continues to meet the Certificate of Achievement Program’s requirements and we are submitting it to the GFOA to determine its eligibility for another certificate.
ACKNOWLEDGEMENT
The preparation of the report on a timely basis could not be accomplished without the efficient and dedicated services of the entire staff of the Central Office with special appreciation to the employees working in the business office. We would like to express appreciation to all of the members of the District who assisted in the timely closing of the District’s financial records and the preparation of this report.
We would also like to thank President Kyle Rhodes and members of the Board of Education for their continuing interest and support in conducting the financial affairs of this school district for the 2018-2019 fiscal year, thereby advancing the effort toward excellence in education in the Farmington Municipal School District.
In addition, we express our gratitude to Evan Krist financial advisor and the staffs with RBC Dain Rauscher, whose dedication, understanding and insight are unsurpassed.
Respectfully submitted,
Bobbi Newland Chief Financial Officer

1 | P a g e
FINANCIAL SECTION OF
FARMINGTON MUNICIPAL SCHOOL DISTRICT NO. 5
COMPREHENSIVE ANNUAL FINANCIAL REPORT FISCAL YEAR 2019
JULY 1, 2018 THROUGH JUNE 30, 2019

2 | P a g e
THIS PAGE INTENTIONALLY LEFT BLANK

4801NButlerAve.Ste.8101 Farmington,NM87401
Phone(505)566-1900 Fax(505)566-1911
3 | P a g e
INDEPENDENT AUDITORS' REPORT
Brian S. Colón, Esq., State Auditor and The Board of Education and Audit Committee of Farmington Municipal School District No. 5
Report on the Financial Statements
We have audited the accompanying financial statements of the governmental activities, discretely presented component unit, each major fund, the aggregate remaining fund information, and the budgetary comparisons for the general fund and major special revenue funds of Farmington Municipal School District No. 5, as of and for the year ended June 30, 2019, and the related notes to the financial statements which collectively comprise Farmington Municipal School District No. 5 basic financial statements as listed in the table of contents.
Management’s Responsibility for the Financial Statements
Management is responsible for the preparation and fair presentation of these financial statements in accordance with accounting principles generally accepted in the United States of America; this includes the design, implementation, and maintenance of internal control relevant to the preparation and fair presentation of financial statements that are free from material misstatement, whether due to fraud or error.
Auditor’s Responsibility
Our responsibility is to express opinions on these financial statements based on our audit. We conducted our audit in accordance with auditing standards generally accepted in the United States of America and the standards applicable to financial audits contained in Government Auditing Standards, issued by the Comptroller General of the United States. Those standards require that we plan and perform the audit to obtain reasonable assurance about whether the financial statements are free from material misstatement.
An audit involves performing procedures to obtain audit evidence about the amounts and disclosures in the financial statements. The procedures selected depend on the auditor’s judgment, including the assessment of the risks of material misstatement of the financial statements, whether due to fraud or error. In making those risk assessments, the auditor considers internal control relevant to Farmington Municipal School District No. 5’ preparation and fair presentation of the financial statements in order to design audit procedures that are appropriate in the circumstances, but not for the purpose of expressing an opinion on the effectiveness of the entity’s internal control. Accordingly, we express no such opinion. An audit also includes evaluating the appropriateness of accounting policies used and the reasonableness of significant accounting estimates made by management, as well as evaluating the overall presentation of the financial statements.
We believe that the audit evidence we have obtained is sufficient and appropriate to provide a basis for our audit opinions.
Opinions
In our opinion, the financial statements referred to above present fairly, in all material respects, the respective financial position of the governmental activities, discretely presented component unit, each major fund, and the aggregate remaining fund information of Farmington Municipal School District No. 5, as of June 30, 2019, and the respective changes in financial position thereof and the respective budgetary comparisons for the general fund and major special revenue funds for the year then ended in accordance with accounting principles generally accepted in the United States of America.

4801NButlerAve.Ste.8101 Farmington,NM87401
Phone(505)566-1900 Fax(505)566-1911
4 | P a g e
Brian S. Colón, Esq., State Auditor and The Board of Education and Audit Committee of Farmington Municipal School District No. 5
Other Matters
Required Supplementary Information
Accounting principles generally accepted in the United States of America require that the management’s discussion and analysis on pages 7-13. Accounting principles generally accepted in the United States of America also require that the Schedule of Proportionate Share of the Net Pension Liability and Schedule of Contributions for pensions and OPEB on pages 65-69 be presented to supplement the basic financial statements. Such information, although not a part of the basic financial statements, is required by the Governmental Accounting Standards Board who considers it to be an essential part of financial reporting for placing the basic financial statements in an appropriate operational, economic, or historical context. We have applied certain limited procedures to the required supplementary information in accordance with auditing standards generally accepted in the United States of America, which consisted of inquiries of management about the methods of preparing the information and comparing the information for consistency with management’s responses to our inquiries, the basic financial statements, and other knowledge we obtained during our audit of the basic financial statements. We do not express an opinion or provide any assurance on the information because the limited procedures do not provide us with sufficient evidence to express an opinion or provide any assurance. Our opinion on the basic financial statements is not affected by this missing information.
Other Information
Our audit was conducted for the purpose of forming opinions on the financial statements that collectively comprise the Farmington Municipal School District No. 5’ basic financial statements. The supplemental information such as the budgetary comparisons for the major capital project fund, the combining and individual nonmajor fund financial statements, the budgetary comparisons for non-major special revenue funds, capital projects funds, debt service funds, and the other information, such as the Schedule of Expenditures of Federal Awards, as required by Title 2 U.S. Code of Federal Regulations Part 200, Uniform Administrative Requirements, Cost Principles, and Audit Requirements for Federal Awards and the other schedules required by 2.2.2.NMAC are presented for purposes of additional analysis and are not a required part of the basic financial statements.
The Schedule of Expenditures of Federal Awards and other schedules required by 2.2.2 NMAC are the responsibility of management and were derived from and relate directly to the underlying accounting and other records used to prepare the basic financial statements. Such information has been subjected to the auditing procedures applied in the audit of the basic financial statements and certain additional procedures, including comparing and reconciling such information directly to the underlying accounting and other records used to prepare the basic financial statements or to the basic financial statements themselves, and other additional procedures in accordance with the auditing standards generally accepted in the United States of America. In our opinion, the Schedule of Expenditures and other schedules required by 2.2.2 NMAC are fairly stated, in all material respects, in relation to the basic financial statements as a whole.
Other Reporting Required by Government Auditing Standards
In accordance with Government Auditing Standards, we have also issued our report dated November 6, 2019 on our consideration of the Farmington Municipal School District No. 5' internal control over financial reporting and on our tests of its compliance with certain provisions of laws, regulations, contracts, and grant agreements and other matters. The purpose of that report is to describe the scope of our testing of internal control over financial reporting and compliance and the results of that testing, and not to provide an opinion on internal control over financial reporting or on compliance. That report is an integral part of an audit performed in accordance with Government Auditing Standards in considering Farmington Municipal School District No. 5’ internal control over financial reporting and compliance.
Farmington, New Mexico November 6, 2019

FINANCIAL SECTION
5 | P a g e
MANAGEMENT’S DISCUSSION AND ANALYSIS OF
FARMINGTON MUNICIPAL SCHOOL DISTRICT NO. 5
AS OF AND FOR THE YEAR ENDED
JUNE 30, 2019

FINANCIAL SECTION 6 | P a g e
THIS PAGE INTENTIONALLY LEFT BLANK

STATE OF NEW MEXICO FARMINGTON MUNCIPAL SCHOOL DISTRICT
MANAGEMENT’S DISCUSSION AND ANALYSIS For The Year Ended June 30, 2019
Unaudited
FINANCIAL SECTION 7 | P a g e
As management of the Farmington Municipal School District, we offer readers of Farmington Municipal School District’s financial statements this narrative overview and analysis of the financial activities of the Farmington Municipal School District for the fiscal year ended June 30, 2019. We encourage readers to consider the information presented here in conjunction with additional information that we have furnished in our letter of transmittal, which can be found on pages xiii – xviii. Financial Highlights
The liabilities of the Farmington Municipal School District exceeded assets at the close of the most recent fiscal year by $73,679,642 (net position). Of this amount, $7,772,517. (Unrestricted net position excluding pension liability of $276,632,685 and net pension related deferred inflows / outflows of ($31,785,906) may be used to meet the School District’s ongoing obligations excluding the pension/OPEB liabilities and the investment in capital asset.
As of the close of the current fiscal year, Farmington Municipal School District’s governmental funds reported combined ending
fund balances of $34,070,401, an increase of $621,968. in comparison with the prior year. Approximately 23% of this total amount, $7,962,176 is available for spending at the district’s discretion (unassigned fund balance).
At the end of the current fiscal year, unassigned fund balance for the general fund was $7,962,176 or 9.6% of the total general fund
expenditures.
The Farmington Municipal School District’s total net debt increased by $2,075,000 or 0.99% during the current fiscal year. The district retired $8,925,000 of debt and issued $ 11,000,000 new debt.
On February 7, 2017, a bond election was held for $26,000,000 and passed by 85% of the vote. The bonds will be sold over a four-
year period. The bonds issued to date are $22,100,000 with $3,900,000 remaining.
Overview of Financial Statements This discussion and analysis are intended to serve as an introduction to the Farmington Municipal School District’s basic financial statements. The School District’s basic financial statements comprise three components: 1) government-wide financial statements, 2) fund financial statements, and 3) notes to the financial statements. This report also contains other supplementary information in addition to the basic financial statements themselves. Government-wide financial statements. The government-wide financial statements are designed to provide readers with a broad overview of the Farmington Municipal School District’s finances, in a manner similar to a private-sector business. The statement of net position presents information on all of the Farmington Municipal School District’s assets and liabilities, with the difference between the two reported as net position. Over time, increases or decreases in net assets may serve as a useful indicator of whether the financial position of the Farmington Municipal Schools is improving or deteriorating. The statement of activities presents information showing how Farmington Municipal School District’s net position changed during the most recent fiscal year. All changes in net position are reported as soon as the underlying event giving rise to the change occurs, regardless of the timing of related cash flows. Thus, revenues and expenses are reported in this statement for some items that will only result in cash flows in future fiscal periods. (e.g., uncollected taxes and earned but unused vacation leave, etc.) Both of the government-wide financial statements reflect functions of the Farmington Municipal School District that are principally supported by taxes and intergovernmental revenues (governmental activities). The governmental activities of the Farmington Municipal School District include general government operations, transportation of students and instructional materials allocations. The government-wide financial statements can be found on pages 16 and 17 of this report. Fund financial statements. A fund is a grouping of related accounts that is used to maintain control over resources that have been segregated for specific activities or objectives. Farmington Municipal School District, like other state and local governments, uses fund accounting to ensure and demonstrate compliance with finance-related legal requirements. All of the funds of the Farmington Municipal School District are governmental funds.

STATE OF NEW MEXICO FARMINGTON MUNCIPAL SCHOOL DISTRICT
MANAGEMENT’S DISCUSSION AND ANALYSIS For The Year Ended June 30, 2019
Unaudited
FINANCIAL SECTION 8 | P a g e
Governmental funds. Governmental funds are used to account for essentially the same functions reported as governmental activities in the government-wide financial statements. However, unlike the government-wide financial statements, governmental fund financial statements focus on near-term inflows and outflows of spendable resources, as well as on balances of spendable resources available at the end of the fiscal year. Such information may be useful in evaluating a government’s near-term financing requirements. Because the focus of governmental funds is narrower than that of the government-wide financial statements, it is useful to compare the information presented for governmental activities in the government-wide financial statements. By doing so, readers may better understand the long-term impact of the government’s near-term financing decisions. Both the governmental fund balance sheet and the governmental fund statements of revenues, expenditures, and changes in fund balances provide a reconciliation to facilitate this comparison between governmental funds and governmental activities. Farmington Municipal School District maintains four individual governmental funds. Information is presented separately in the governmental fund balance sheet and in the governmental fund statement of revenues, expenditures, and changes in fund balances for the general fund, special revenue fund, capital projects and the debt service fund, all of which are considered to be major funds. Data from the 59 governmental funds are combined into a single, aggregated presentation. Individual fund data for these non-major governmental funds is provided in the form of combining statements following the notes to the financial statements (page 90). Farmington Municipal School District adopts an annual appropriated budget for each of its funds. Budgetary comparative statements have been provided for these funds to demonstrate compliance with these budgets. The basic governmental fund financial statements can be found on pages 19-27 of this report. Fiduciary funds. Fiduciary funds are used to account for resources held for the benefit of parties outside the government. Fiduciary funds are not reflected in the government-wide financial statements because of the resources of those funds are not available to support the Farmington Municipal Schools’ own programs. The accounting used for fiduciary funds is much like that used for proprietary funds. The basic fiduciary fund financial statements can be found on page 28 of this report. Notes to the financial statements. The notes provide additional information that is essential to a full understanding of the data provided in the government-wide and fund financial statements. The notes to the financial statements can be found on pages 29-69 of this report. Government-wide Financial Analysis As noted earlier, over time, net position may serve as a useful indicator of a government’s financial position. In the case of Farmington Municipal School District, liabilities exceeded assets by $73,679,642 at the close of the most recent fiscal year. A portion of Farmington Municipal School District’s net position is invested in capital assets (e.g., land, buildings, machinery, and equipment), less any related debt used to acquire those assets that is still outstanding. Farmington Municipal School District uses these capital assets to provide educational services; consequently, these assets are not available for future spending. Although Farmington Municipal School District’s investment in its capital assets is reported net of related debt, it should be noted that the resources needed to repay this debt must be provided from other sources, since the capital assets themselves cannot be used to liquidate these liabilities.

STATE OF NEW MEXICO FARMINGTON MUNCIPAL SCHOOL DISTRICT
MANAGEMENT’S DISCUSSION AND ANALYSIS For The Year Ended June 30, 2019
Unaudited
FINANCIAL SECTION 9 | P a g e
Farmington Municipal School District’s Net Position
FY 2019 FY 2018 FY 2019 FY 2018Current and other assets 30,935,577$ 28,580,880$ 30,935,577$ 28,580,880$ Capital assets 236,666,479 234,863,677 236,666,479 234,863,677
Total assets 267,602,056 263,444,557 267,602,056 263,444,557
Deferred outflows of resources 55,487,218 70,609,621 55,487,218 70,609,621
Current Liabilities 4,029,074 1,553,992 4,029,074 1,553,992 Noncurrent liabilities:
Due within one year 8,755,000 8,925,000 8,755,000 8,925,000 Due in more than one year 83,628,320 81,684,181 83,628,320 81,684,181
Aggregate net pension liability 276,632,685 226,657,290 276,632,685 226,657,290 Total liabilities 373,045,079 318,820,463 373,045,079 318,820,463
Deferred inflows of resources 23,723,837 10,687,175 23,723,837 10,687,175
Net position:Net investment in capital assets 143,915,447 138,081,745 143,915,447 138,081,745 Restricted 19,479,173 26,459,742 19,479,173 26,459,742 Unrestricted (237,074,262) (159,994,947) (237,074,262) (159,994,947)
Total net position (73,679,642)$ 4,546,540$ (73,679,642)$ 4,546,540$
Governmental Activities Total
Farmington Municipal School District’s Net Position A large portion of Farmington Municipal School District’s net position (89%) represents resources that are subject to external restrictions on how they may be used. The remaining balance of unrestricted net position, excluding pension liability of $276,632,685 and net pension related deferred inflows/outflows of ($31,785,906), $7,772,517 may be used to meet the district’s ongoing obligations excluding the pension/OPEB liabilities and the investment in capital assets. At the end of the current fiscal year, Farmington Municipal School District has achieved positive balances in the Governmental Activities category of net position. The same situation held true in the prior fiscal year. Farmington Municipal School District’s net position decreased by $26,195,662 during the current fiscal year. Total assets increased slightly primarily due to a decrease in cash from the bond fund and an increase in capital assets caused by the construction of a new high school. Noncurrent liabilities decreased primarily due to the retirement of debt. Governmental activities. Governmental activities increased Farmington Municipal School District’s fund balance by $621,968. Key elements of this decrease are as follows:
• A 4% increase in state equalization revenue as shown in the comparison of grants and contributions not restricted to specific programs.
• A 7% increase in operational expenses for the district boosted spending when compared to the prior year. • A state grant was received for construction of new schools.

STATE OF NEW MEXICO FARMINGTON MUNCIPAL SCHOOL DISTRICT
MANAGEMENT’S DISCUSSION AND ANALYSIS For The Year Ended June 30, 2019
Unaudited
FINANCIAL SECTION 10 | P a g e
Farmington Municipal School District’s Changes in Net Position
FY2019 FY2018 FY2019 FY2018
Revenues:Program Revenues:
Charges for services 2,672,459$ 1,345,846$ 2,672,459$ 1,345,846$ Operating grants & contributions 18,258,821 17,066,458 18,258,821 17,066,458 Capital grants & contributions 1,297,914 6,966,441 1,297,914 6,966,441
General Revenues:Property taxes-general purpose 571,340 558,562 571,340 558,562 Property taxes-capital projects 2,934,916 2,858,482 2,934,916 2,858,482 Property taxes-debt service 10,803,256 10,794,816 10,803,256 10,794,816 Oil & Gas 536,257 510,604 536,257 510,604
Grants and contributions notrestricted to specific progams 79,112,920 75,622,445 79,112,920 75,622,445 Miscellaneous Income 200,182 251,914 200,182 251,914
Total Revenues 116,388,065$ 115,975,568$ 116,388,065$ 115,975,568$
Expenses:Direct instruction 87,053,866$ 85,954,460$ 87,053,866$ 85,954,460$ Support Services:
Students 14,139,258 12,064,587 14,139,258 12,064,587 Instruction - support 1,845,725 1,100,939 1,845,725 1,100,939 General administrative 2,115,811 1,745,705 2,115,811 1,745,705 School administrative 6,414,784 5,887,593 6,414,784 5,887,593 Central services 1,243,222 1,193,888 1,243,222 1,193,888 Operations and maintenance 19,383,839 18,359,469 19,383,839 18,359,469 Student transportation 3,207,815 2,996,001 3,207,815 2,996,001 Other support services - 4,455 - 4,455
Non-instructional services - Food services 4,914,113 4,921,309 4,914,113 4,921,309 Community services 13,602 8,919 13,602 8,919
Interest on long-term obligations 2,251,692 2,207,630 2,251,692 2,207,630 Total Expenses 142,583,727$ 136,444,955$ 142,583,727$ 136,444,955$
Increase/(Decrease) in net position (26,195,662)$ (20,469,387)$ (26,195,662)$ (20,469,387)$
Net position - Beginning (47,483,980)$ 41,187,906$ (47,483,980)$ 41,187,906$ Restatement (68,202,499) Net position - Ending (73,679,642)$ (47,483,980)$ (73,679,642)$ (47,483,980)$
Governmental Activities Total

STATE OF NEW MEXICO FARMINGTON MUNCIPAL SCHOOL DISTRICT
MANAGEMENT’S DISCUSSION AND ANALYSIS For The Year Ended June 30, 2019
Unaudited
FINANCIAL SECTION 11 | P a g e
Financial Analysis of the Government’s Funds As noted earlier, Farmington Municipal School District uses fund accounting to ensure and demonstrate compliance with finance-related legal requirements. Governmental funds. The focus of Farmington Municipal School District’s governmental funds is to provide information on near-term inflows, outflows, and balances of spendable resources. Such information is useful in assessing Farmington Municipal School District’s financing requirements. In particular, unrestricted fund balance may serve as a useful measure of a government’s net resources available for spending at the end of the fiscal year. As of the end of the current fiscal year, Farmington Municipal School District’s governmental funds reported combined ending fund balances of $34,070,401 an increase in comparison with the prior year. Approximately 21% of this total amount ($7,962,176) constitutes unassigned fund balance, which is available for spending at the government’s discretion. The remainder of fund balance is restricted to indicate that it is not available for new spending because it has already been committed 1) to pay debt service ($13,136,488), 2) for capital projects ($9,873,768) and 3) a variety of other restricted purposes ($2,846,647). The general fund is the chief operating fund of Farmington Municipal School District. At the end of the current fiscal year, unassigned fund balance of the general funds was $7,962,176 and total fund balance was $34,070,401. As a measure of the general fund’s liquidity, it may be useful to compare both unassigned fund balance and total fund balance to total fund expenditures. Unassigned represents 9.6% percent of the total general fund expenditures, and the total fund balance represents 41.2% since a very small portion of the general fund balance was restricted at June 30, 2019. The fund balance of Farmington Municipal School District’s general fund increased by $1,116,546 during the current fiscal year. Farmington Municipal Schools District’s board and management recognizes the need for maintaining an adequate operational cash balance to assure sound fiscal management of its financial resources while maintaining the district’s high bond rating and to assure the availability of funds when unexpected financial demands are made on the Farmington Municipal Schools. The revenue increase from the state did materialize to the level forecasted by the state. The district increased expenditures primarily by increasing the number of teachers and support staff throughout the district. The current fiscal year budget reflects an increase in the cash balance to comply with Board policy. The fund balance is expected to increase this next fiscal year as additional SEG money is received from the state. The district’s GO Bonds debt service fund’s total fund balance was $9,830,916 that is restricted for the payment of debt service. This is a net decrease in fund balance of $124,031. The decrease during the current year resulted primarily from increased principal and interest payments. The educational technical debt service fund balance was $3,305,572. The total amount is restricted for the payment of debt service. This is a net decrease in fund balance of $218,453. The decrease is the result of an increase in the amount of principal and interest payments. There was an increase of $1,571,951 in the fund balance of the bond building capital fund resulting in a fund balance of $5,582,035. The increase was the result of $11,000,000 of debt being issued and only $9,563,514 used in the renovation of an elementary school. The special capital outlay fund represents funding received from the New Mexico Public Schools Capital Outlay Council for construction projects that qualify. In 2018-2019 the district received $1,140,290 primarily for the construction of a new high school.

STATE OF NEW MEXICO FARMINGTON MUNCIPAL SCHOOL DISTRICT
MANAGEMENT’S DISCUSSION AND ANALYSIS For The Year Ended June 30, 2019
Unaudited
FINANCIAL SECTION 12 | P a g e
General Fund Budgetary Highlights Differences between the original budgeted revenues and the final amended budgeted revenues resulted in a budget increase of $741,160 which can be briefly summarized as follows:
The difference resulted primarily from a mid-year increase in revenue from the state in state equalization funds of $31.62 per program unit.
Expenditures were increased in an attempt to better utilize the district resources.
Additional cash from 6/30/18 was carried forward and budgeted in 2018-2019.
Capital Asset and Debt Administration
Capital assets. Farmington Municipal School District’s investment in capital assets for its governmental activities as of June 30, 2019 amounts to $230,195,123 (net of accumulated depreciation). This investment in capital assets includes land, construction in progress, buildings, improvements, and machinery and equipment. For the governmental activities, a total of $230,195,123 was determined as the current value of all the capital assets owned by the District. Major capital asset events during the current fiscal year included the following:
Phase I of construction and renovation of an elementary school scheduled to be completed in May 2020. Purchase of a central administration building to consolidate three separate buildings and multiple departments.
Additional information on Farmington Municipal School District’s capital assets can be found in note “III.E” on page 46 of this report.
FY2019 FY2018 FY2019 FY2018Land 4,142,761$ 4,142,761$ 4,142,761$ 4,142,761$ Construction in progress 436,003 72,929,843 436,003 72,929,843 Land improvements 27,515 31,562 27,515 31,562 Buildings and improvements 222,661,268 148,279,563 222,661,268 148,279,563 Machinery and equipment 2,927,576 3,383,682 2,927,576 3,383,682
Total 230,195,123$ 228,767,411$ 230,195,123$ 228,767,411$
TotalGovernment Activities
Long-term debt. As of June 30, 2019, Farmington Municipal School District had total bonded debt outstanding of $89,888,551. The total outstanding debt represents general obligation bonds secured solely by specified revenue sources (i.e., property tax collections).
Total TotalFY 2019 FY 2018
General obligation bonds $89,415,000 $87,340,000
Farmington Municipal School District's Outstanding DebtGeneral Obligation Bonds
Governmental activities

STATE OF NEW MEXICO FARMINGTON MUNCIPAL SCHOOL DISTRICT
MANAGEMENT’S DISCUSSION AND ANALYSIS For The Year Ended June 30, 2019
Unaudited
FINANCIAL SECTION 13 | P a g e
Farmington Municipal School District’s total debt increased by $2,075,000 during the current fiscal year. The district retired $8,925,000 of debt and issued $11,000,000 in new debt. Farmington Municipal School District maintains an AA3 bond rating from Moody’s Investor Service, Inc. State statute limits the amount of general obligation debt a governmental entity may issue to 6% of its total assessed valuation. The current debt limitation for Farmington Municipal School District is $91,498,627 which is significantly in excess of Farmington Municipal School District’s outstanding general obligation debt. More information of Farmington Municipal School District’s debt can be found in note “III.F” of this report on page 47. Economic Factors and Next Year’s Budget Farmington Municipal School District is located in San Juan County. San Juan County, like the rest of New Mexico and the nation, has experienced a declining economy. Due to the economic factors affecting the entire country, and San Juan County have seen a decrease in unemployment and a continued stagnation of the oil and gas economy. The taxes on oil and gas in New Mexico are a vital revenue factor in the state’s budget. 98% of Farmington Municipal Schools’ operating revenue comes from the state and the district does anticipate an increase in funding allocated for schools in FY2020. The board of education is being proactive and considering ways to optimize resources on an opportunistic basis and improve the district’s cash balance in preparation for an increase in revenues. San Juan County’s population shows some decline in past years however Farmington Municipal School’s enrollment remains relatively stable for the current fiscal year. The current enrollment has increased slightly when compared to the same period in the prior year. The projections are that the enrollment will remain relatively flat over the next two to three years pending the impact of the local economy. The charter school that is under the Farmington Municipal Schools opened for the 2012-2013 school year and we have not seen any impact to the district’s enrollment. The charter school under the Farmington Municipal Schools closed on June, 30th 2019 as its charter was not renewed. Any activity subsequent this year end will be minor and only occur to close out the financial obligations of the charter school. Farmington Municipal School District receives approximately 98% of its annual operating budget from the State of New Mexico through the State Equalization Guaranteed Funding. The objectives of the formula are (1) to equalize educational opportunity statewide (by crediting certain local and federal support and then distributing state support in an objective manner) and (2) to retain local autonomy in actual use of funds by allowing funds to be used in local districts at the discretion of local policy making bodies. The basis for the formula is in the number of students enrolled. Weighting factors are assigned to students that receive special services, i.e., special education and bilingual education services as well as other factors based on the training and experience of the teaching staff and the district’s at-risk population. Farmington Municipal School District has appropriated $7,962,176 of its unassigned fund balance for spending in the 2020 fiscal year budget. The $7,962,176 was budgeted primarily into direct classroom instruction to fund additional staff needed to meet the state mandated class sizes while accommodating the slight growth in the elementary student population. Requests for information This financial report is designed to provide a general overview of Farmington Municipal School District’s finances for all those with an interest in the district’s finances. Questions concerning any of the information provided in this report or requests for additional financial information should be addressed to: Chief Financial Officer 3401 E 30th St Suite A Farmington, New Mexico 87402.

FINANCIAL SECTION 14 | P a g e
THIS PAGE INTENTIONALLY LEFT BLANK

FINANCIAL SECTION
15 | P a g e
BASIC FINANCIAL STATEMENTS OF
FARMINGTON MUNICIPAL SCHOOL DISTRICT NO. 5
AS OF AND FOR THE YEAR ENDED
JUNE 30, 2019

STATE OF NEW MEXICO
FARMINGTON MUNICIPAL SCHOOL DISTRICT NO. 5
STATEMENT OF NET POSITIONJune 30, 2019
Governmental Activities
New Mexico Virtual AcademyCharter School
Assets
Cash and cash equivalents 23,642,595$ 404,065$
Receivables:
Delinquent property taxes receivable 818,374 -
Grant 6,032,026 37,541
Due from other governments 191,260 - Due from primary government - 50,549
Parts inventory 174,568 -
Food inventory 76,754 -
Non-current:
Restricted cash 6,471,356 -
Non-depreciable assets 4,578,764 - Depreciable capital assets, net 225,616,359 -
Total Assets 267,602,056 492,155
Deferred Outflows of Resources:
Contributions to pension subsequent to the measurement date 7,851,367 136,667
Difference between expected and actual pension experience 162,371 2,586
Net difference between projected and actual investment earnings on pension plan investments 492,505 7,845
Net change in pension assumptions 45,851,272 730,323
Net change in proportionate share of pension liability - 225,461
Contributions to OPEB subsequent to the measurement date 1,129,703 19,658
Net change in proportionate share of OPEB liability - 6,886 Total Deferred Outflows of Resources 55,487,218$ 1,129,426$
( cont'd; 1 of 2)
FINANCIAL SECTION
16 | P a g e
The notes to the financial statements are an integral part of this statement.

STATE OF NEW MEXICO
FARMINGTON MUNICIPAL SCHOOL DISTRICT NO. 5
STATEMENT OF NET POSITIONJune 30, 2019
Governmental Activities
New Mexico Virtual AcademyCharter School
Liabilities
Accounts payable 1,085,506$ 109,071$
Accrued salaries 1,501,745 -
Accrued interest 917,723 - Due to component unit 50,549 -
Compensated absences 473,551 -
Long-term liabilities other than pensions:
Due within one year 8,755,000 -
Due in more than one year 83,628,320 - Aggregate net pension liability 222,476,100 3,543,617 Aggregate OPEB liability 54,156,585 847,929
Total Liabilities 373,045,079 4,500,617
Deferred Inflows of ResourcesAdvances of federal, state, and local grants 22,525 - Difference between expected and actual pension experience 4,234,078 67,441 Net change in proportionate share of pension liability 4,483,997 - Difference between expected and actual OPEB experience 3,206,417 50,203
Net difference between projected and actual investment earnings on OPEB plan investments 675,854 10,582 Net change in OPEB assumptions 10,110,794 158,305 Net change in proportionate share of OPEB liability 990,172 -
Total Deferred Inflows of Resources 23,723,837 286,531
Net Position
Net investment in capital assets 143,915,447 -
Restricted for:
Special revenue funds 2,846,647 1,965
Capital projects 3,932,026 -
Debt service 12,700,500 - Unrestricted (237,074,262) (3,167,532)
Total Net Position (73,679,642)$ (3,165,567)$
( 2 of 2 )
The notes to the financial statements are an integral part of this statement.FINANCIAL SECTION
17 | P a g e

STATE OF NEW MEXICO
FARMINGTON MUNICIPAL SCHOOL DISTRICT NO. 5
STATEMENT OF ACTIVITIESYear Ended June 30, 2019
Net (Expense) Revenue andProgram Revenues Changes in Net Position
Primary GovernmentCharges for Operating Grants Capital Grants Governmental Component
Functions/Programs Expenses Services and Contributions and Contibutions Activities UnitPrimary government:
Governmental activities:Instruction 87,053,866$ 1,399,107$ 9,874,046$ 590,401$ (75,190,312)$ Support Services - Students 14,139,258 454,190 1,603,739 - (12,081,329) Support Services - Instruction 1,845,725 - 209,351 - (1,636,374) Support Services - General Administration 2,115,811 - 239,985 2,294 (1,873,532) Support Services - School Administration 6,414,784 - 727,594 - (5,687,190) Central Services 1,243,222 - 141,012 - (1,102,210) Operations & Maintenance of Plant 19,383,839 - 2,198,603 705,219 (16,480,017) Student Transportation 3,207,815 - 3,262,948 - 55,133 Food Services 4,914,113 819,162 - - (4,094,951) Community Services 13,602 - 1,543 - (12,059) Bond interest paid 2,251,692 - - - (2,251,692)
Total governmental activities 142,583,727$ 2,672,459$ 18,258,821$ 1,297,914$ (120,354,533)
Componenet units:New Mexico Virtual Academy 3,796,484$ -$ 100,767$ -$ (3,695,717)
General revenues:Taxes:
Property Taxes:General purposes 571,340 - Capital projects 2,934,916 - Debt service 10,803,256 -
Oil and gas 536,257 - Grants and contributions not restricted 79,112,920 3,251,216 Miscellaneous income 200,182 696
Total general revenues 94,158,871 3,251,912
Change in net position (26,195,662) (443,805)
Net position - beginning (47,483,980) (2,721,762) Net position - ending (73,679,642)$ (3,165,567)$
FINANCIAL SECTION
18 | P a g e
The notes to the financial statements are an integral part of this statement.

STATE OF NEW MEXICO
FARMINGTON MUNICIPAL SCHOOL DISTRICT NO. 5
GOVERNMENTAL FUNDSBalance SheetJune 30, 2019
General Title IEntitlement
IDEA-B Bond Building Debt ServiceFund Fund #24101 Fund #24106 Fund #31100 Fund #41000
AssetsCash and cash equivalents 4,221,935$ -$ -$ 455$ 9,646,504$ Receivables:
Property taxes 38,703 - - - 507,610 Grant - 1,707,292 2,084,075 - -
Due from other governments 7,935 - - - 103,603 Due from other funds 5,541,120 - - - - Parts inventory 174,568 - - - - Food inventory - - - - - Restricted:
Cash and cash equivalents - - - 6,103,644 4,131 Total assets 9,984,261$ 1,707,292$ 2,084,075$ 6,104,099$ 10,261,848$
Liabilities, deferred inflows, and fund balanceLiabilities:
Accounts payable 313,202$ 49,959$ -$ 519,064$ -$ Accrued salaries 1,501,745 - - - - Due to other funds - 1,657,333 2,033,526 3,000 - Due to component unit - - 50,549 - -
Total liabilities 1,814,947 1,707,292 2,084,075 522,064 -
Deferred inflows of resources:Advances of federal, state, and local grants - - - - - Delinquent property taxes 32,570 - - - 430,932
Total deferred inflows of resources 32,570 - - - 430,932
Fund balance:Non-spendable:
Inventories 174,568 - - - - Restricted for:
Special revenue funds - - - - - Capital projects funds - - - 5,582,035 - Debt service - - - - 9,830,916
Unassigned 7,962,176 - - - - Total fund balance 8,136,744 - - 5,582,035 9,830,916
Total liabilities, deferred inflows of resources, and fund balance 9,984,261$ 1,707,292$ 2,084,075$ 6,104,099$ 10,261,848$
( cont'd; 1 of 2 )
The notes to the financial statements are an integral part of this statement.FINANCIAL SECTION
19 | P a g e

STATE OF NEW MEXICO
FARMINGTON MUNICIPAL SCHOOL DISTRICT NO. 5
GOVERNMENTAL FUNDSBalance SheetJune 30, 2019
Other Governmental
Total Governmental
Funds FundsAssets
Cash and cash equivalents 9,773,701$ 23,642,595$ Receivables:
Property taxes 272,061 818,374 Grant 2,240,659 6,032,026
Due from other governments 79,722 191,260 Due from other funds - 5,541,120 Parts inventory - 174,568 Food inventory 76,754 76,754 Restricted:
Cash and cash equivalents 363,581 6,471,356 Total assets 12,806,478$ 42,948,053$
Liabilities, deferred inflows, and fund balanceLiabilities:
Accounts payable 203,281$ 1,085,506$ Accrued salaries - 1,501,745 Due to other funds 1,847,261 5,541,120 Due to component unit - 50,549
Total liabilities 2,050,542 8,178,920
Deferred inflows of resources:Advances of federal, state, and local grants 22,525 22,525 Delinquent property taxes 212,705 676,207
Total deferred inflows of resources 235,230 698,732
Fund balance:Non-spendable:
Inventories 76,754 251,322 Restricted for:
Special revenue funds 2,846,647 2,846,647 Capital projects funds 4,291,733 9,873,768 Debt service 3,305,572 13,136,488
Unassigned - 7,962,176 Total fund balance 10,520,706 34,070,401
Total liabilities, deferred inflows of resources, and fund balance 12,806,478$ 42,948,053$
( 2 of 2 )
FINANCIAL SECTION
20 | P a g e
The notes to the financial statements are an integral part of this statement.

STATE OF NEW MEXICO
FARMINGTON MUNICIPAL SCHOOL DISTRICT NO. 5
RECONCILIATION OF THE BALANCE SHEET - ALL GOVERNMENTAL FUNDSTO THE STATEMENT OF NET POSITION
June 30, 2019
Amounts reported for governmental activities in the statement of net position aredifferent because:
Fund balances - total governmental funds 34,070,401$
Capital assets used in governmental activities are not financial resources andtherefore are not reported in the funds.
Capital assets 342,389,741 Accumulated depreciation (112,194,618)
Other assets are not available to pay for current-period expendituresand therefore are deferred in the funds.
Property taxes receivable 676,207
Deferred outflow of resources are not financial resources, and therefore are not reportedin the funds and include:
Contributions to pension subsequent to the measurement date 7,851,367 Difference between expected and actual pension experience 162,371 Net difference between projected and actual investment earnings on pension plan investments 492,505 Net change in pension assumptions 45,851,272 Contributions to OPEB subsequent to the measurement date 1,129,703
Long-term liabilities, including bonds payable, are not due and payable in thecurrent period and therefore are not reported in the funds
Bonds payable (89,415,000) Accrued interest payable (917,723) Accrued vacation payable (473,551) Bond premiums (2,968,320) Net pension liability (222,476,100) Net OPEB liability (54,156,585)
Deferred inflow of resources are not financial resources, and therefore are not reportedin the funds and include:
Difference between expected and actual pension experience (4,234,078) Net change in proportionate share of pension liability (4,483,997) Difference between expected and actual OPEB experience (3,206,417) Net difference between projected and actual investment earnings on OPEB plan investments (675,854) Net change in OPEB assumptions (10,110,794) Net change in proportionate share of OPEB liability (990,172)
Net position of governmental activities (73,679,642)$
The notes to the financial statements are an integral part of this statement.FINANCIAL SECTION
21 | P a g e

STATE OF NEW MEXICO
FARMINGTON MUNICIPAL SCHOOL DISTRICT NO. 5
GOVERNMENTAL FUNDSStatement of Revenues, Expenditures, and Changes in Fund Balance
Year Ended June 30, 2019
General Title IEntitlement
IDEA-B Bond BuildingFund Fund #24101 Fund #24106 Fund #31100
Revenues:Taxes:
Property 572,576$ -$ -$ -$ Oil and gas 26,955 - - -
Intergovernmental - federal grants 120,378 2,275,147 2,879,024 - Intergovernmental - state grants 82,700,804 - - - Contributions - private grants 89,500 - - - Charges for services 85,813 - - - Investment and interest income 23 - - 135,435 Miscellaneous 199,321 - - -
Total revenues 83,795,370 2,275,147 2,879,024 135,435
Expenditures:Current:
Instruction 51,189,793 1,281,073 878,845 - Support services: Students 9,909,386 498,383 1,235,714 - Instruction 1,499,469 - - - General Administration 1,622,429 35,284 42,552 - School Administration 4,889,672 460,407 635,092 - Central Services 1,099,141 - 86,821 - Operation & Maintenance of Plant 9,383,015 - - 3,267,286 Student transportation 2,994,810 - - - Food services operations - - - - Community services 12,258 - - -
Capital outlay 55,096 - - 6,157,728 Debt service:
Principal retirement - - - - Bond interest paid - - - - Bond issuance costs - - - 138,500 Other - - - -
Total expenditures 82,655,069 2,275,147 2,879,024 9,563,514
Excess (deficiency) of revenues over expenditures 1,140,301 - - (9,428,079)
Other financing sources:Sale of bonds - - - 11,000,000 Transfers In - - - - Transfers out (23,755) - - -
Total other financing sources (23,755) - - 11,000,000
Net change in fund balance 1,116,546 - - 1,571,921
Fund balance at beginning of the year 7,020,198 - - 4,010,114 Fund balance at end of the year 8,136,744$ -$ -$ 5,582,035$
( cont'd; 1 of 2 )
FINANCIAL SECTION
22 | P a g e
The notes to the financial statements are an integral part of this statement.

STATE OF NEW MEXICO
FARMINGTON MUNICIPAL SCHOOL DISTRICT NO. 5
GOVERNMENTAL FUNDSStatement of Revenues, Expenditures, and Changes in Fund Balance
Year Ended June 30, 2019
Debt ServiceOther
GovernmentalTotal
GovernmentalFund #41000 Funds Funds
Revenues:Taxes:
Property 7,917,831$ 5,982,015$ 14,472,422$ Oil and gas 200,444 308,858 536,257
Intergovernmental - federal grants - 7,648,016 12,922,565 Intergovernmental - state grants - 2,777,225 85,478,029 Contributions - private grants - 21,937 111,437 Charges for services - 2,586,646 2,672,459 Investment and interest income 1,021 21,145 157,624 Miscellaneous - 861 200,182
Total revenues 8,119,296 19,346,703 116,550,975
Expenditures:Current:
Instruction - 3,656,473 57,006,184 Support services: Students - 1,878,667 13,522,150 Instruction - 140,779 1,640,248 General Administration 78,897 244,304 2,023,466 School Administration - 149,640 6,134,811 Central Services - 3,000 1,188,962 Operation & Maintenance of Plant - 5,747,588 18,397,889 Student transportation - 73,000 3,067,810 Food services operations - 4,699,637 4,699,637 Community services - 750 13,008
Capital outlay - 1,367,556 7,580,380 Debt service:
Principal retirement 5,725,000 3,200,000 8,925,000 Bond interest paid 2,437,987 151,532 2,589,519 Bond issuance costs - - 138,500 Other 1,443 - 1,443
Total expenditures 8,243,327 21,312,926 126,929,007
Excess (deficiency) of revenues over expenditures (124,031) (1,966,223) (10,378,032)
Other financing sources:Sale of bonds - - 11,000,000 Transfers In - 23,755 23,755 Transfers out - - (23,755)
Total other financing sources - 23,755 11,000,000
Net change in fund balance (124,031) (1,942,468) 621,968
Fund balance at beginning of the year 9,954,947 12,463,174 33,448,433 Fund balance at end of the year 9,830,916$ 10,520,706$ 34,070,401$
( 2 of 2 )
The notes to the financial statements are an integral part of this statement.FINANCIAL SECTION
23 | P a g e

STATE OF NEW MEXICO
FARMINGTON MUNICIPAL SCHOOL DISTRICT NO. 5
RECONCILIATION OF THE STATEMENT OF REVENUES, EXPENDITURES,AND CHANGES IN FUND BALANCES ALL GOVERNMENTAL FUNDS
TO THE STATEMENT OF ACTIVITIESYear Ended June 30, 2019
Amounts reported for governmental activities in the statement of activities aredifferent because:
Net change in fund balance - total governmental funds 621,968$
Govermental funds report capital outlays as expenditures. However, in thestatement of activites the cost of those assets is allocated over their estimateduseful lives and reported as depreciation expense. This is the amount by whichcapital oulays exceeded depreciation in the current year
Capital outlay 7,580,380 Depreciation (6,124,790)
Revenues in the statement of activities that do not provide current financial resourcesare not reported as revenues in the funds.
Deferred property taxes at:June 30, 2018 (839,117) June 30, 2019 676,207
The issuance of long-term debt (e.g., bonds) provides current financialresources to governmental funds, while the repayment of the principal of long-termdebt consumes the current financial resources of governmental funds. Neithertransaction, however, has any effect on net position. Also, governmental fundsreport the effect of premiums, discounts, and similar items when debt is first issued,whereas these amounts are deferred and amortized in the statement of activities. Thesedifferences in the treatment of long-term debt and related items consist of:
Current year principal payments 8,925,000 Bonds sold (11,000,000) Deferred gain on bond refunding amortization 76,485 Bond premium amortization 300,861
Some expenses reported in the statement of activities do not require the use of currentfinancial resources and, therefore, are not reported as expenditures in the governmentalfunds.
Compensated absences at:June 30, 2018 348,631 June 30, 2019 (473,551)
Accrued interest at:June 30, 2018 878,204 June 30, 2019 (917,723)
Loss on asset disposal (27,878) Deferred contributions to pension plan 7,851,367 Deferred contributions to OPEB plan 1,129,703 Pension expense (35,502,232) OPEB expense 300,823
Change in net position of governmental activities (26,195,662)$
FINANCIAL SECTION
24 | P a g e
The notes to the financial statements are an integral part of this statement.

STATE OF NEW MEXICO
FARMINGTON MUNICIPAL SCHOOL DISTRICT NO. 5
GENERAL FUNDStatement of Revenues, Expenditures, and
Changes in Fund Balance - Budget and Actual (Non-GAAP Budgetary Basis)
Year Ended June 30, 2019
Variance with Final Budget
Budgeted Amounts Actual Amounts Positive
Original Final (Budgetary Basis) (Negative)Revenues:
Taxes:Property 556,217$ 556,217$ 570,153$ 13,936$ Oil and gas 24,830 24,830 27,914 3,084
Intergovernmental - federal grants 107,363 107,363 120,378 13,015 Intergovernmental - state grants 82,100,109 82,729,199 82,700,804 (28,395) Contributions - private grants 70,250 70,250 89,500 19,250 Charges for services 70,250 70,250 85,813 15,563 Investment and interest income 17 17 23 6 Miscellaneous 124,249 124,249 199,321 75,072
Total revenues 83,053,285 83,682,375 83,793,906 111,531
Expenditures:Current:
Instruction 54,499,002 54,661,569 51,162,893 3,498,676 Support services: Students 9,289,622 10,628,973 9,894,038 734,935 Instruction 1,167,561 1,167,561 1,495,893 (328,332) General Administration 1,446,991 1,631,991 1,622,891 9,100 School Administration 4,950,160 4,950,160 4,889,672 60,488 Central Services 2,235,361 2,235,361 1,091,479 1,143,882 Operation & Maintenance of Plant 10,511,962 11,014,962 9,194,873 1,820,089 Student transportation 3,262,948 3,222,008 3,064,210 157,798 Other Support services 100,078 100,078 - 100,078 Community services 12,410 12,410 12,258 152
Capital outlay 2,227,413 855,413 55,103 800,310 Total expenditures 89,703,508 90,480,486 82,483,310 7,997,176
Excess (deficiency) of revenues over expenditures (6,650,223) (6,798,111) 1,310,596 8,108,707
Other financing uses:Transfers out - - (23,755) (23,755)
Net change in fund balance (6,650,223) (6,798,111) 1,286,841 8,084,952
Beginning cash balance budgeted 6,650,223 6,798,111 - (6,798,111)
Fund balance at beginning of the year - - 7,020,198 7,020,198
Fund balance at end of the year -$ -$ 8,307,039 8,307,039$
RECONCILIATION TO GAAP BASIS:Change in inventory 70,168 Change in property tax receivable (69) Change in due from other governments 298 Change in payables (241,928) Change in deferred property taxes 1,236
Fund balance at end of the year (GAAP basis) 8,136,744$
The notes to the financial statements are an integral part of this statement.FINANCIAL SECTION
25 | P a g e

STATE OF NEW MEXICO
FARMINGTON MUNICIPAL SCHOOL DISTRICT NO. 5
TITLE I FUND - NO. 24101Statement of Revenues, Expenditures, and
Changes in Fund Balance - Budget and Actual (Non-GAAP Budgetary Basis)
Year Ended June 30, 2019
Variance with Final Budget
Budgeted Amounts Actual Amounts Positive
Original Final (Budgetary Basis) (Negative)Revenues:
Intergovernmental - federal grants 2,677,005$ 3,022,033$ 1,362,470$ (1,659,563)$
Expenditures:Current:
Instruction 1,670,225 1,770,656 1,443,392 327,264 Support services: Students 525,837 660,837 448,433 212,404 General Administration 42,155 48,952 35,284 13,668 School Administration 438,788 533,788 460,407 73,381
Capital outlay - 7,800 - 7,800 Total expenditures 2,677,005 3,022,033 2,387,516 634,517
Excess (deficiency) of revenues over expenditures - - (1,025,046) (1,025,046)
Fund balance at beginning of the year - - - -
Fund balance at end of the year -$ -$ (1,025,046) (1,025,046)$
RECONCILIATION TO GAAP BASIS:Change in grant receivable 912,677 Change in payables 112,369
Fund balance at end of the year (GAAP basis) -$
FINANCIAL SECTION
26 | P a g e
The notes to the financial statements are an integral part of this statement.

STATE OF NEW MEXICO
FARMINGTON MUNICIPAL SCHOOL DISTRICT NO. 5
ENTITLEMENT IDEA-B FUND - NO. 24106Statement of Revenues, Expenditures, and
Changes in Fund Balance - Budget and Actual (Non-GAAP Budgetary Basis)
Year Ended June 30, 2019
Variance with Final Budget
Budgeted Amounts Actual Amounts Positive
Original Final (Budgetary Basis) (Negative)Revenues:
Intergovernmental - federal grants -$ 3,646,182$ 1,352,534$ (2,293,648)$
Expenditures:Current:
Instruction - 958,750 878,845 79,905 Support services: Students - 1,929,041 1,235,714 693,327 General Administration - 42,731 42,552 179 School Administration - 616,000 635,424 (19,424) Central Services - 93,660 86,821 6,839
Capital outlay - 6,000 - 6,000 Total expenditures - 3,646,182 2,879,356 766,826
Excess (deficiency) of revenues over expenditures - - (1,526,822) (1,526,822)
Fund balance at beginning of the year - - - -
Fund balance at end of the year -$ -$ (1,526,822) (1,526,822)$
RECONCILIATION TO GAAP BASIS:Change in grant receivable 1,526,489 Change in payables 333
Fund balance at end of the year (GAAP basis) -$
The notes to the financial statements are an integral part of this statement.FINANCIAL SECTION
27 | P a g e

STATE OF NEW MEXICO
FARMINGTON MUNICIPAL SCHOOL DISTRICT NO. 5
AGENCY FUNDSStatement of Fiduciary Assets and Liabilities
June 30, 2019
ASSETS
Pooled cash and investments 978,153$
LIABILITIES
Deposits held for others 978,153$
FINANCIAL SECTION
28 | P a g e
The notes to the financial statements are an integral part of this statement.

NOTES TO THE FINANCIAL STATEMENTS FINANCIAL SECTION JUNE 30, 2019 29 | P a g e
NOTE PAGE I. SUMMARY OF ALL SIGNIFICANT ACCOUNTING POLICIES
A. Reporting Entity 30 1. Blended Component Units 2. Discretely Presented Component Units
B. Implementation of New Accounting Principles 31 C. Government-Wide and Fund Financial Statements 34 D. Measurement Focus, Basis of Accounting, and Financial Statement Presentation 35
1. Major Funds 36 E. Assets, Liabilities, and Net Position or Equity 36
II. STEWARDSHIP, COMPLIANCE, AND ACCOUNTABILITY
A. Budgetary Information 41 B. Budgetary Violations 42 C. Deficit Fund Equity 42
III. DETAILED NOTES ON ALL FUNDS
A. Cash and Temporary Investments 43 B. Receivables 44 C. Inter-Fund Receivables and Payables 45 D. Capital Assets 46 E. Long-Term Debt 47 F. Leases 49
IV. COMPONENT UNIT 49 V. OTHER INFORMATION
A. Risk Management 51 B. Employee Retirement Plan 52 C. Post-Retirement Health Care Benefits 58 D. Contingent Liabilities 64 E. Cash Flows 64 F. Subsequent Events 64

FINANCIAL SECTION NOTES TO THE FINANCIAL STATEMENTS 30 | P a g e JUNE 30, 2019
I. SUMMARY OF ALL SIGNIFICANT ACCOUNTING POLICIES
A. Reporting Entity
Farmington Municipal School District (District) is a special purpose government corporation governed by an elected five-member Board of Education. The Board of Education is the basic level of government, which has oversight responsibility and control over all activities related to the public-school education in the City of Farmington, New Mexico and the surrounding areas. The District is responsible for all activities related to public elementary and secondary school education within its jurisdiction. The District receives funding from local, state, and federal government sources and must comply with the requirements of these funding source entities. The Board of Education is authorized to establish policies and regulations for its own government consistent with the laws of the State of New Mexico and the regulations of the Legislative Finance Committee. The School Board is comprised of five members who are elected for terms of four years. The District operates two preschools, ten elementary, four middle, and four high schools within its boundaries and, in conjunction with the regular educational programs, some of these schools offer special education. One of the high schools operates in conjunction with San Juan College and accepts students from neighboring school districts. In addition, the District provides transportation and school food services for the students.
The District’s student enrollments were as follows:
Generally Accepted Accounting Principles (GAAP) requires that financial statements present the District (primary government) and its component units. A component unit is defined as a legally separate organization for which the elected officials of the primary government are financially accountable or other organizations for which the nature and significance of their relationship with a primary government are such that exclusion would cause the District’s financial statements to be misleading. The District has one component unit that is required to be presented in accordance with Governmental Accounting Standards Board (GASB) Statement No. 14, The Financial Reporting Entity and GASB Statement No. 39, Determining Whether Certain Organizations Are Component Units, an amendment of GASB Statement No. 14, and GASB Statement No. 61, The Financial Reporting Entity: Omnibus – an amendment of GASB Statements No. 14 and No. 34.
1. Blended Component Units
The District does not have any component units reported as blended component units.
2. Discretely Presented Component Units
The District has one component unit reported as a discretely presented component unit. A New Mexico charter school is considered a public school, accredited by the state board of public education and accountable to the school district’s local school board for ensuring compliance with applicable laws, rules and charter provisions. New Mexico Virtual Academy is chartered under Farmington Municipal School District and is the financial responsibility of Farmington Municipal Schools. Since the charter school relies on its charter from the District and a financial burden exists upon closure of the charter school or when the charter school is in need of financial assistance. The component unit does not have a separately issued report.
The summary of significant accounting policies of the District is presented to assist in the understanding of the District’s financial statements. The financial statements and notes are the representation the District’s management who is responsible for their integrity and objectivity. The financial statements of the District conform to GAAP as applied to governmental units. GASB is the accepted standard-setting body for establishing governmental accounting and financial reporting principles. The more significant of the government’s accounting policies are described below.
FISCAL YEAR 40 DAY COUNT 80 DAY COUNT 120 DAY COUNT
2019 11,097 10,989 10,9372018 11,044 10,986 10,930

NOTES TO THE FINANCIAL STATEMENTS FINANCIAL SECTION JUNE 30, 2019 31 | P a g e
I. SUMMARY OF SIGNIFICANT ACCOUNTING POLICIES (cont’d) B. Implementation of New Accounting Principles
During fiscal year 2019, the District adopted the following Governmental Accounting Standards Board (GASB) Statements:
GASB Statement No. 83, Certain Asset Retirement Obligations
This Statement addresses accounting and financial reporting for certain asset retirement obligations (AROs). An ARO is a legally enforceable liability associated with the retirement of a tangible capital asset. A government that has legal obligations to perform future asset retirement activities related to its tangible capital assets should recognize a liability based on the guidance in this Statement.
This Statement establishes criteria for determining the timing and pattern of recognition of a liability and a corresponding deferred outflow of resources for AROs. This Statement requires that recognition occur when the liability is both incurred and reasonably estimable. The determination of when the liability is incurred should be based on the occurrence of external laws, regulations, contracts, or court judgments, together with the occurrence of an internal event that obligates a government to perform asset retirement activities. Laws and regulations may require governments to take specific actions to retire certain tangible capital assets at the end of the useful lives of those capital assets, such as decommissioning nuclear reactors and dismantling and removing sewage treatment plants. Other obligations to retire tangible capital assets may arise from contracts or court judgments. Internal obligating events include the occurrence of contamination, placing into operation a tangible capital asset that is required to be retired, abandoning a tangible capital asset before it is placed into operation, or acquiring a tangible capital asset that has an existing ARO.
This Statement requires the measurement of an ARO to be based on the best estimate of the current value of outlays expected to be incurred. The best estimate should include probability weighting of all potential outcomes, when such information is available or can be obtained at reasonable cost. If probability weighting is not feasible at reasonable cost, the most likely amount should be used. This Statement requires that a deferred outflow of resources associated with an ARO be measured at the amount of the corresponding liability upon initial measurement.
This Statement requires the current value of a government’s AROs to be adjusted for the effects of general inflation or deflation at least annually. In addition, it requires a government to evaluate all relevant factors at least annually to determine whether the effects of one or more of the factors are expected to significantly change the estimated asset retirement outlays. A government should remeasure an ARO only when the result of the evaluation indicates there is a significant change in the estimated outlays. The deferred outflows of resources should be reduced and recognized as outflows of resources (for example, as an expense) in a systematic and rational manner over the estimated useful life of the tangible capital asset.
A government may have a minority share (less than 50 percent) of ownership interest in a jointly owned tangible capital asset in which a nongovernmental entity is the majority owner and reports its ARO in accordance with the guidance of another recognized accounting standards setter. Additionally, a government may have a minority share of ownership interest in a jointly owned tangible capital asset in which no joint owner has a majority ownership, and a nongovernmental joint owner that has operational responsibility for the jointly owned tangible capital asset reports the associated ARO in accordance with the guidance of another recognized accounting standards setter. In both situations, the government’s minority share of an ARO should be reported using the measurement produced by the nongovernmental majority owner or the nongovernmental minority owner that has operational responsibility, without adjustment to conform to the liability measurement and recognition requirements of this Statement.
In some cases, governments are legally required to provide funding or other financial assurance for their performance of asset retirement activities. This Statement requires disclosure of how those funding and assurance requirements are being met by a government, as well as the amount of any assets restricted for payment of the government’s AROs, if not separately displayed in the financial statements. This Statement also requires disclosure of information about the nature of a government’s AROs, the methods and assumptions used for the estimates of the liabilities, and the estimated remaining useful life of the associated tangible capital assets. If an ARO (or portions thereof) has been incurred by a government but is not yet recognized because it is not reasonably estimable, the government is required to disclose that fact and the reasons therefor. This Statement requires similar disclosures for a government’s minority shares of AROs.
The requirements of this Statement are effective for reporting periods beginning after June 15, 2018 (FYE June 30, 2019). Earlier application is encouraged.

FINANCIAL SECTION NOTES TO THE FINANCIAL STATEMENTS 32 | P a g e JUNE 30, 2019
I. SUMMARY OF SIGNIFICANT ACCOUNTING POLICIES (cont’d) B. Implementation of New Accounting Principles (cont’d)
GASB Statement No. 88, Certain Disclosures Related to Debt, including Direct Borrowings and Direct Placements
The primary objective of this Statement is to improve the information that is disclosed in notes to government financial statements related to debt, including direct borrowings and direct placements. It also clarifies which liabilities governments should include when disclosing information related to debt.
This Statement defines debt for purposes of disclosure in notes to financial statements as a liability that arises from a contractual obligation to pay cash (or other assets that may be used in lieu of cash) in one or more payments to settle an amount that is fixed at the date the contractual obligation is established.
Requires that additional essential information related to debt be disclosed in notes to financial statements, including unused lines of credit; assets pledged as collateral for the debt; and terms specified in debt agreements related to significant events of default with finance-related consequences, significant termination events with finance-related consequences, and significant subjective acceleration clauses.
For notes to financial statements related to debt, this Statement also requires that existing and additional information be provided for direct borrowings and direct placements of debt separately from other debt.
The requirements of this Statement are effective for reporting periods beginning after June 15, 2018 (FYE June 30, 2019). Earlier application is encouraged.
Other accounting standards that the District is currently reviewing for applicability and potential impact on the financial statements include:
GASB Statement No. 84, Fiduciary Activities
This Statement supersedes NCGA Statement 1, Governmental Accounting and Financial Reporting Principles, footnote 24; Statement No. 32, Accounting and Financial Reporting for Internal Revenue Code Section 457 Deferred Compensation Plans, paragraph 4; Statement No. 34, Basic Financial Statements—and Management’s Discussion and Analysis—for State and Local Governments, paragraphs 70−73, 110, and 111; Implementation Guide No. 2015-1, Questions 4.14.1, 4.14.2, 6.43.2, 7.7.2, and 7.52.4; and Implemen-1tation Guide No. 2016-1, Implementation Guidance Update—2016, Question 4.26. It also amends NCGA Statement 1, paragraphs 32, 139, 143, and 147; NCGA Statement 5, Accounting and Financial Reporting Principles for Lease Agreements of State and Local Governments, paragraphs 5 and 6; Statement No. 6, Accounting and Financial Reporting for Special Assessments, paragraph 19; Statement No. 10, Accounting and Financial Reporting for Risk Financing and Related Insurance Issues, footnote 12; Statement No. 14, The Financial Reporting Entity, paragraphs 19 and 27; Statement No. 24, Accounting and Financial Reporting for Certain Grants and Other Financial Assistance, paragraph 5; Statement No. 31, Accounting and Financial Reporting for Certain Investments and for External Investment Pools, paragraphs 18 and 22; Statement 34, paragraphs 6, 12, 13, 63, 65, 67, 69, 106−109, 115, 123, 125, 135, 138, 141, and 147, and footnotes 48, 49, and 51; Statement No. 37, Basic Financial Statements—and Management’s Discussion and Analysis—for State and Local Governments: Omnibus, paragraph 3; Statement No. 38, Certain Financial Statement Note Disclosures, paragraphs 6, 14, and 15; Statement No. 40, Deposit and Investment Risk Disclosures, paragraph 5; Statement No. 44, Economic Condition Reporting: The Statistical Section, paragraph 10; Statement No. 54, Fund Balance Reporting and Governmental Fund Type Definitions, paragraphs 30, 33, and 35; Statement No. 61, The Financial Reporting Entity: Omnibus, paragraph 9; Statement No. 62, Codification of Accounting and Financial Reporting Guidance Contained in Pre-November 30, 1989 FASB and AICPA Pronouncements, paragraph 34; Statement No. 67, Financial Reporting for Pension Plans, paragraph 11; Statement No. 72, Fair Value Measurement and Application, paragraph 80; Statement No. 73, Accounting and Financial Reporting for Pensions and Related Assets That Are Not within the Scope of GASB Statement 68, and Amendments to Certain Provisions of GASB Statements 67 and 68, paragraph 116; Statement No. 74, Financial Reporting for Postemployment Benefit Plans Other Than Pension Plans, paragraphs 18 and 59; NCGA Interpretation 6, Notes to the Financial Statements Disclosure, paragraph 5; Technical Bulletin No. 2006-1, Accounting and Financial Reporting by Employers and OPEB Plans for Payments from the Federal Government Pursuant to the Retiree Drug Subsidy Provisions of Medicare Part D, paragraph 8; Implementation Guide 2015-1, Questions 1.4.2, 1.4.8, 2.7.1, 2.7.2, 3.49.1, 3.55.2, 3.58.1, 4.6.2, 4.27.1, 4.28.1, 4.28.11, 4.30.3, 4.62.2, 5.64.3, 5.64.4, 5.113.1, 6.29.3, 6.34.3, 6.34.4, 6.43.5, 6.45.1, 6.45.3, 7.3.5, 7.4.1, 7.51.6, 7.52.2, 7.52.3, 7.52.5−7.52.8, 7.55.5, 7.72.10, 7.77.4, 7.81.1, 7.81.2, 7.84.1, 7.97.1, 7.97.2, 7.97.4, 8.1.2, 8.1.3, and 8.15.4; Implementation

NOTES TO THE FINANCIAL STATEMENTS FINANCIAL SECTION JUNE 30, 2019 33 | P a g e
I. SUMMARY OF SIGNIFICANT ACCOUNTING POLICIES (cont’d) B. Implementation of New Accounting Principles (cont’d)
Guide 2016-1, Questions 4.2, 4.13, 4.27, 4.61−4.63, 5.7, 5.8, 5.16, and 5.24; and 2002 AICPA State and Local Government Auditing and Accounting Guide, paragraph 5.28.
This Statement establishes criteria for identifying fiduciary activities of all state and local governments. The focus of the criteria generally is on (1) whether a government is controlling the assets of the fiduciary activity and (2) the beneficiaries with whom a fiduciary relationship exists. Separate criteria are included to identify fiduciary component units and postemployment benefit arrangements that are fiduciary activities. An activity meeting the criteria should be reported in a fiduciary fund in the basic financial statements. Governments with activities meeting the criteria should present a statement of fiduciary net position and a statement of changes in fiduciary net position. An exception to that requirement is provided for a business-type activity that normally expects to hold custodial assets for three months or less. This Statement describes four fiduciary funds that should be reported, if applicable: (1) pension (and other employee benefit) trust funds, (2) investment trust funds, (3) private-purpose trust funds, and (4) custodial funds. Custodial funds generally should report fiduciary activities that are not held in a trust or equivalent arrangement that meets specific criteria. A fiduciary component unit, when reported in the fiduciary fund financial statements of a primary government, should combine its information with its component units that are fiduciary component units and aggregate that combined information with the primary government’s fiduciary funds. This Statement also provides for recognition of a liability to the beneficiaries in a fiduciary fund when an event has occurred that compels the government to disburse fiduciary resources. Events that compel a government to disburse fiduciary resources occur when a demand for the resources has been made or when no further action, approval, or condition is required to be taken or met by the beneficiary to release the assets.
The requirements of this Statement are effective for reporting periods beginning after December 15, 2018 (FYE June 30, 2020). Earlier application is encouraged. Changes adopted to conform to the provisions of this Statement should be applied retroactively by restating financial statements, if practicable, for all prior periods presented. If restatement for prior periods is not practicable, the cumulative effect, if any, of applying this Statement should be reported as a restatement of beginning net position (or fund balance or fund net position, as applicable) for the earliest period restated. In the first period that this Statement is applied, the notes to the financial statements should disclose the nature of the restatement and its effect. Also, the reason for not restating prior periods presented should be disclosed.
GASB Statement No. 87, Leases
The objective of this Statement is to better meet the information needs of financial statement users by improving accounting and financial reporting for leases by governments. This Statement increases the usefulness of governments’ financial statements by requiring recognition of certain lease assets and liabilities for leases that previously were classified as operating leases and recognized as inflows of resources or outflows of resources based on the payment provisions of the contract. It establishes a single model for lease accounting based on the foundational principle that leases are financings of the right to use an underlying asset. Under this Statement, a lessee is required to recognize a lease liability and an intangible right-to-use lease asset, and a lessor is required to recognize a lease receivable and a deferred inflow of resources, thereby enhancing the relevance and consistency of information about governments’ leasing activities.
Definition of a Lease - A lease is defined as a contract that conveys control of the right to use another entity’s nonfinancial asset (the underlying asset) as specified in the contract for a period of time in an exchange or exchange-like transaction. Examples of nonfinancial assets include buildings, land, vehicles, and equipment. Any contract that meets this definition should be accounted for under the leases guidance, unless specifically excluded in this Statement.
The provisions of this Statement are effective for reporting periods beginning after December 15, 2019 (FYE June 30, 2021).

FINANCIAL SECTION NOTES TO THE FINANCIAL STATEMENTS 34 | P a g e JUNE 30, 2019
I. SUMMARY OF SIGNIFICANT ACCOUNTING POLICIES (cont’d) B. Implementation of New Accounting Principles (cont’d)
GASB Statement No. 89, Accounting for Interest Cost Incurred before the End of a Construction Period
This Statement establishes accounting requirements for interest cost incurred before the end of a construction period. The requirements of this Statement apply to the financial statements of all state and local governments. In financial statements prepared using the economic resources measurement focus, interest cost incurred before the end of a construction period should be recognized as an expense in the period in which the cost is incurred. Such interest cost should not be capitalized as part of the historical cost of a capital asset. In financial statements prepared using the current financial resources measurement focus, interest cost incurred before the end of a construction period should be recognized as an expenditure on a basis consistent with governmental fund accounting principles.
The requirements of this Statement are effective for reporting periods beginning after December 15, 2019 (FYE June 30, 2021). Earlier application is encouraged.
GASB Statement No. 90, Majority Equity Interests an amendment of GASB Statements No. 14 and No. 61
The primary objectives of this Statement are to improve consistency in the measurement and comparability of the financial statement presentation of majority equity interests in legally separate organizations and to improve the relevance of financial statement information for certain component units.
This Statement modifies previous guidance for reporting a government’s majority equity interest in a legally separate organization. This Statement also provides guidance for reporting a component unit if a government acquires a100 percent equity interest in that component unit. The requirements of this Statement apply to the financial statements of all state and local governments.
The requirements of this Statement are effective for reporting periods beginning after December 15, 2018 (FYE June 30, 2020). Earlier application is encouraged.
GASB Statement No. 91, Conduit Debt Obligations
This Statement provides a single method of reporting conduit debt obligations by issuers and eliminate diversity in practice associated with (1) commitments extended by issuers, (2) arrangements associated with conduit debt obligations, and (3) related note disclosures. This Statement achieves those objectives by clarifying the existing definition of a conduit debt obligation; establishing that a conduit debt obligation is not a liability of the issuer; establishing standards for accounting and financial reporting of additional commitments and voluntary commitments extended by issuers and arrangements associated with conduit debt obligations; and improving required note disclosures.
The requirements of this Statement are effective for reporting periods beginning after December 15, 2020 (FYE June 30, 2022). Earlier application is encouraged.
C. Government-Wide and Fund Financial Statements
The government-wide financial statements (i.e., the Statement of Net Position and the Statement of Activities) report information on all of the non-fiduciary activities of the school district. For the most part, the effect of inter-fund activity has been removed from these statements.
The statement of activities demonstrates the degree to which the direct expenses of a given function or segment are offset by program revenues. Direct expenses are those that are clearly identifiable with a specific function or segment. Program revenues include 1) charges to customers or applicants who purchase, use, or directly benefit from goods, services, or privileges provided by a given function or segment and 2) grants and contributions that are restricted to meeting the operational or capital requirements of a particular function or segment. Other items not properly included among program revenues are reported instead as general revenues.
Separate financial statements are provided for governmental funds. Major individual governmental funds are reported as separate columns in the fund financial statements.

NOTES TO THE FINANCIAL STATEMENTS FINANCIAL SECTION JUNE 30, 2019 35 | P a g e
I. SUMMARY OF SIGNIFICANT ACCOUNTING POLICIES (cont’d) D. Measurement Focus, Basis of Accounting, and Financial Statement Presentation
The government-wide financial statements are reported using the economic resources measurement focus and the accrual basis of accounting. Revenues are recorded when earned and expenses are recorded when a liability is incurred, regardless of the timing of related cash flows. Grants and similar items are recognized as revenue as soon as all eligibility requirements imposed by the provider have been met.
Amounts reported as program revenues include 1) charges to customers or applicants for goods, services, or privileges provided, 2) operating grants and contributions, and 3) capital grants and contributions. Internally dedicated resources are reported as general revenues rather than as program revenues.
The District reports all direct expenses by function in the statement of activities. Direct expenses are those that are clearly identifiable with a function. The District does not currently employ indirect cost allocation systems. Depreciation expense is specifically identified by function and is included in the direct expense of each function, except for that portion of depreciation that is identified as unallocated on the statement of activities.
Governmental fund financial statements are reported using the current financial resources measurement focus and the modified accrual basis of accounting. Revenues are recognized as soon as they are both measurable and available. Revenues are considered to be available when they are collectible within the current period or soon enough thereafter to pay liabilities of the current period. For this purpose, the government considers revenues to be available if they are collected within 60 days of the end of the current fiscal period. Revenues received during the year but are applicable to subsequent years are reported as deferred inflows of resources. Expenditures generally are recorded when a liability is incurred, as under accrual accounting. However, debt service expenditures, as well as expenditures related to compensated absences and claims and judgments, are recorded only when payment is due. Expenditures incurred during the year that are for the benefit of subsequent years are reported as deferred outflows of resources.
Interest associated with the current fiscal period are all considered to be susceptible to accrual and so have been recognized as revenues of the current fiscal period. All other revenue items are considered to be measurable and available only when cash is received by the government.
Governmental funds are used to account for the District’s general government activities, including the collection and disbursement of specific or legally restricted monies, the acquisition or construction of capital assets, and the servicing of long-term debt.
General Fund – The general fund is the government’s primary operating fund. It accounts for all financial resources of the general government, except those required to be accounted for in another fund.
Special Revenue Funds are used to account for the proceeds of specific revenue sources – which are legally restricted to expenditures for specified purposes.
Capital Projects Funds are used to account for financial resources to be used for the acquisition or construction of major capital facilities.
Debt Service Funds are used to account for the payment of principal and interest on long-term debt. Debt service revenues are from taxes and other operating revenues, some of which are pledged specifically to repay certain outstanding bond issues.

FINANCIAL SECTION NOTES TO THE FINANCIAL STATEMENTS 36 | P a g e JUNE 30, 2019
I. SUMMARY OF SIGNIFICANT ACCOUNTING POLICIES (cont’d) D. Measurement Focus, Basis of Accounting, and Financial Statement Presentation (cont’d)
GASB Statement No. 34, Basic Financial Statements and Management’s Discussion and Analysis requires the District to present certain governmental funds as major funds. In addition to the General Fund, the District reports the following major governmental funds:
SPECIAL REVENUE FUNDS
Title I (Fund No. 24101) Minimum Balance: None To help local education agencies (LEAs) and schools improve the teaching and learning of children failing, or most at-risk of failing, to meet challenging State academic standards. Funding authorization: Elementary and Secondary Education Act of 1965, Title I, Part A, 20 U.S.C. 6301 et seq.
Entitlement IDEA-B (Fund No. 24106) Minimum Balance: None Program provides grants to states that flow-through to schools, to assist them in providing a free appropriate public education to all children with disabilities. The program is funded by the United States government, under the Individuals with Disabilities Education Act, Part B, Section 611-617, and part D, Section 674 as amended, 20 U.S.C. 1711-1417 and 1420.
CAPITAL PROJECTS FUNDS
Bond Building (Fund No. 31100) Minimum Balance: None This fund provides financing for the construction of buildings, the purchase of equipment, and the acquisition and improvement of land. Funding is provided by the sale of general obligation bonds, which have been approved by the voters of the district.
DEBT SERVICE FUNDS
Debt Service Fund (Fund No. 41000) Minimum Balance: None The debt service fund is used to account for the accumulation of resources for, and the payment of, general long-term debt principal, interest, and related costs.
Additionally, the government reports the following fund types:
Fiduciary Funds are agency funds used to account for financial resources used by the student activity groups for which the District has stewardship
E. Assets, Liabilities, and Net Position or Equity
1. Deposits and investments
The government’s cash and cash equivalents are considered to be cash on hand, demand deposits, and short-term investments with original maturities of three months or less from the date of acquisition.
State statutes authorize the investment of the District’s funds in a wide variety of instruments including certificates of deposit and other similar obligations, state investment pool, and money market accounts. The District is also allowed to invest in United States Government obligations. All funds for the District must follow the above investment policies.
Deposits of funds may be made in interest or non-interest-bearing checking accounts in one or more banks or savings and loan associations within the geographical boundaries of the District. Deposits may be made to the extent that they are insured by an agency of the United States or by collateral deposited as security or by bond given by the financial institution.
The rate of interest in non-demand interest-bearing accounts shall be set by the State Board of Finance, but in no case shall the rate of interest be less than one hundred percent of the asked price on United States treasury bills of the same maturity on the day of deposit.
Excess of funds may be temporarily invested in securities which are issued by the State or by the United States government, or by their departments or agencies, and which are either direct obligations of the State or the United States or are backed by the full faith and credit of those governments.

NOTES TO THE FINANCIAL STATEMENTS FINANCIAL SECTION JUNE 30, 2019 37 | P a g e
I. SUMMARY OF SIGNIFICANT ACCOUNTING POLICIES (cont’d) E. Assets, Liabilities, and Net Position or Equity (cont’d)
2. Receivables and payables
Activity between funds that are representative of lending/borrowing arrangements outstanding at the end of the fiscal year are referred to as either “due from/to other funds” (i.e., the current portion of inter-fund loans) or “advances to/from other funds” (i.e., the non-current portion of inter-fund loans). All other outstanding balances between funds are reported as “due from/to other funds.”
The District’s property taxes are levied each year on the assessed valuation of property located in the School District as of the preceding January 1st. Mill levy rates are set by the State of New Mexico each year for the General Fund, Capital Improvements SB – 9 Fund, Debt Service Fund, and Ed Tech Debt Service. Taxes are payable in two equal installments on November 10th and April 10th following the levy and become delinquent after 30 days.
Under GASB Statement 33, property taxes are impressed non-exchange revenue. Assets from impressed non-exchange transactions are reported when the District has an enforceable legal claim to the asset. The enforceable legal claim date for property taxes is the assessment date. Taxes are payable in two equal installments on November 10 and April 10th following the levy and become delinquent after 30 days. Therefore, the District has recorded a delinquent tax receivable and revenue for taxes received within the sixty days following year-end. A receivable and deferred revenue have been recorded for uncollected delinquent taxes. On the government-wide financial statements, the district has recorded delinquent property taxes receivable and revenue for taxes assessed as of year-end that have not be collected, as prescribed in GASB 34. An allowance for refunds and uncollectible amounts has not been recorded.
3. Inventories
The District’s method of accounting for inventory is the consumption method. Under the consumption approach, governments report inventories they purchase as an asset and defer the recognition of the expenditures until the period in which the inventories are actually consumed. Inventory is valued at cost. In the Transportation Fund, inventory consists of expendable supplies held for maintenance. Inventory in the Food Service Fund consists of U.S.D.A. commodities and other purchased food and non-food supplies. The cost of purchased inventory is recorded as an expenditure at the time individual inventory items are consumed. Commodities consumed during the year are reported as revenues and expenditures; unused commodities are reported as inventories.
4. Capital assets
Capital assets, which include property, plant, and equipment (software), are reported in the applicable governmental-wide financial statements. Beginning July 1, 2005, the threshold for defining Capital assets by the government was raised from $1,000 to assets with an initial, individual cost of more than $5,000 (amount not rounded) and an estimated useful life in excess of two years. Such assets are recorded at historical cost or estimated historical cost if purchased or constructed. Donated capital assets are recorded at acquisition value at the date of donation.
The costs of normal maintenance and repairs that do not add to the value of the asset or materially extend assets lives are not capitalized. Software costs have been included with the cost of computer equipment and are capitalized with that equipment. The District does not develop software for internal use or any other use.
Major outlays for capital assets and improvements are capitalized as projects are constructed. Interest on construction projects has not been capitalized.
Property, plant, and equipment of the primary government are depreciated using the straight-line method over the following estimated useful lives.
ESTIMATED USEFUL LIVESASSETS YEARSBuildings 40 - 50Building improvements 20Land Improvements 10 - 20Vehicles 7Office equipment 5Computer equipment 3 - 5

FINANCIAL SECTION NOTES TO THE FINANCIAL STATEMENTS 38 | P a g e JUNE 30, 2019
I. SUMMARY OF SIGNIFICANT ACCOUNTING POLICIES (cont’d) E. Assets, Liabilities, and Net Position or Equity (cont’d)
5. Compensated absences
It is the District’s policy to permit employees to accumulate 120 days of earned but unused vacation, which will be paid to employees upon retirement from the District’s service. The amount for liability has been reported in the government-wide financial statements.
Accumulated sick leave is not payable upon termination and is recorded as expenditures when it is paid.
6. Long-term obligations
In the government-wide financial statements, long-term debt and other long-term obligations are reported as liabilities in the applicable governmental activities, statement of Net Position. Bond premiums and discounts, as well as issuance costs, are deferred and amortized over the life of the bonds using the effective interest method. Bonds payable are reported net of the applicable bond premium or discounts.
In the fund financial statements, governmental fund types recognize bond premiums and discounts, as well as bond issuance costs, during the current period. The face amount of debt issued is reported as other financing sources. Premiums received on debt issuances are reported as other financing sources while discounts on debt issuances are reported as other financing uses. Issuance costs, whether or not withheld from the actual debt proceeds received, are reported as capital projects expenditures.
7. Pensions
For purposes of measuring the net pension liability, deferred outflows of resources and deferred inflows of resources related to pensions and pension expense, information about the fiduciary net position of the Education Retirement Board (ERB) and additions to/deductions from ERB’s fiduciary net position have been determined on the same basis as they are reported by ERB. For this purpose, benefit payments (including refunds of employee contributions) are recognized when due and payable in accordance with the benefit terms. Investments are reported at fair value.
8. Postemployment Benefits Other Than Pensions (OPEB)
For purposes of measuring the net OPEB liability, deferred outflows of resources and deferred inflows of resources related to OPEB, and OPEB expense, information about the fiduciary net position of the New Mexico Retiree Health Care Fund (RHCA) and additions to/deductions from RHCA’s fiduciary net position have been determined on the same basis as they are reported by RHCA. For this purpose, RHCA recognizes benefit payments when due and payable in accordance with the benefit terms. Investments are reported at fair value, except for money market investments and participating interest-earning investment contracts that have a maturity at the time of purchase of one year or less, which are reported at cost.
9. Deferred Outflows/Inflows of Resources
Both deferred inflows and outflows are reported in the Statement of Net Position but are not recognized in the financial statements as revenues, expenses, and reduction of liabilities or increase in assets until the period(s) to which they relate.
In addition to assets, the District reports a separate section for deferred outflows of resources. This separate financial statement element represents a use of net position/fund balance that applies to future periods and will not be recognized as an expenditure until that time.
The District also reports a separate section for deferred inflows of resources. This separate financial statement element represents an acquisition of net position/fund balance that applies to future periods and so will not be recognized as a revenue until that time. Revenue must be susceptible to accrual (measurable and available to finance expenditures of the current fiscal period) to be recognized. If assets are recognized in connection with a transaction, but those assets are not yet available to finance expenditures of the current fiscal period, then the assets must be offset by a corresponding liability for deferred inflows of resources.

NOTES TO THE FINANCIAL STATEMENTS FINANCIAL SECTION JUNE 30, 2019 39 | P a g e
I. SUMMARY OF SIGNIFICANT ACCOUNTING POLICIES (cont’d) E. Assets, Liabilities, and Net Position or Equity (cont’d)
The District reports deferred outflows of resources for pension-related amounts for the District’s share of the difference between projected and actual earnings, for the District’s share of the difference between contributions to the individual plans and the proportionate share of the contributions, and for changes of assumptions or other inputs.
The District reports deferred inflows of resources for pension-related amounts in the government wide financial statements or the District’s share of the difference between expected and actual experience and for the District’s share of the difference between contributions to the individual plans and the proportionate share of the contributions.
Under the modified accrual basis of accounting, revenue and other fund financial resources are recognized in the period in which they become both measurable and available. Assets recorded in the fund financial statements for which the revenues are not available are reported as a deferred inflow of resources. Deferred inflows of resources are also comprised of property tax and long-term receivables that are unavailable in the fund statements.
10. Fund balance
a. Non-Spendable
The non-spendable fund balance classification includes amounts that cannot be spent because they are either not in spendable form or legally or contractually required to be maintained intact. The "not in spendable form" criterion includes items that are not expected to be converted to cash, for example, inventories and prepaid amounts.
b. Restricted
Fund balance is reported as restricted when constraints placed on the use of resources are either (1) externally imposed by creditors (such as through debt covenants), grantors, contributors, or laws or regulations of other governments or (2) imposed by law through constitutional provisions or enabling legislation.
c. Committed
Amounts that can only be used for specific purposes pursuant to constraints imposed by the formal action of the District’s Board of Education should be reported as committed fund balance. The committed amounts cannot be used for any other purpose unless the District’s Board of Education removes or changes the specified use by taking the same type of action it employed to previously commit those amounts. The District did not have committed fund balances for the year ended June 30, 2019.
d. Assigned
Assigned fund balance includes (a) all remaining amounts, except for negative balances, that are reported in governmental funds, other than the general fund, that are not classified as non-spendable and are neither restricted nor committed and amounts in the general fund that are constrained by the District's intent to be used for specific purposes but are neither restricted nor committed. Intent, and removal of, is expressed by the Board of Education or the Finance Committee. The District did not have assigned fund balances for the year ended June 30, 2019.
e. Unassigned
The remaining fund balance, after all other classifications, within the general fund is reported as unassigned fund balance. This classification represents fund balance that has not been assigned to other funds and that has not been restricted, committed, or assigned to specific purposes within the general fund. In governmental funds other than the general fund, if expenditures incurred for specific purposes exceeded the amounts restricted, committed, or assigned to those purposes, a negative fund balance will be reported as unassigned fund balance.
When committed, assigned, and unassigned resources are available for use, it is the District’s policy to use committed first followed by assigned and unassigned resources as they are needed.

FINANCIAL SECTION NOTES TO THE FINANCIAL STATEMENTS 40 | P a g e JUNE 30, 2019
I. SUMMARY OF SIGNIFICANT ACCOUNTING POLICIES (cont’d) E. Assets, Liabilities, and Net Position or Equity (cont’d)
11. Net Position
Net Position is presented on the Statement of Net Position and may be presented in any of three components.
a. Net investment in capital assets
This component of Net Position consists of capital assets, including restricted capital assets, net of accumulated depreciation and reduced by the outstanding balances of any bonds, mortgages, notes, or other borrowings that are attributable to the acquisition, construction, or improvement of those assets. The portion of the debt attributable to the unspent proceeds is not included in the calculation of invested in capital assets, net of related debt. That portion of the debt is included in restricted for capital projects.
b. Restricted Net Position
Net Position is reported as being restricted when the restriction is either externally imposed by creditors, grantors, contributors, or laws or regulations of other governments or imposed by law through constitutional provisions or enabling legislation. Enabling legislation authorizes the government to assess, levy, charge, or otherwise mandate payment of resources (from external resource providers) and includes a legally enforceable requirement that those resources be used only for the specific purposes stipulated in the legislation.
c. Unrestricted Net Position
Unrestricted Net Position consists of Net Position that does not meet the definition of “net investment in capital assets” or “restricted.”
When both restricted and unrestricted resources are available for use, it is the government’s policy to use restricted resources first, then unrestricted resources as they are needed.
In the governmental environment, Net Position often is designated to indicate that management does not consider them to be available for general operations. In contrast to restricted Net Position, these types of constraints on resources are internal and management can remove or modify them. However, enabling legislation established by the reporting government should not be construed as an internal constraint.
12. Indirect Costs
The District’s General Fund receives indirect cost reimbursements from the various federal programs it administers. These reimbursements are for expenses incurred in performing administrative functions on behalf of the Special Revenue Funds. They are shown as expenditures in the Special Revenue Funds, and as other special federal revenue in the General Fund.
13. Estimates
The preparation of financial statements in conformity with accounting principles generally accepted in the United States of America requires management to make estimates and assumptions that affect certain reported amounts and disclosures. Accordingly, actual results could differ from those estimates.
14. Inter-fund Transactions
Interfund services provided and used are accounted for as revenues and expenditures. Transactions that constitute reimbursements to a fund from expenditures initially made from it that are properly applicable to another fund, are recorded as expenditures in the reimbursing fund and as reductions of expenditures in the fund that is reimbursed. All other inter-fund transactions are reported as transfers. Non-recurring or non-routine permanent transfers of equity are reported as residual equity transfers. All other inter-fund transfers are reported as operating transfers.

NOTES TO THE FINANCIAL STATEMENTS FINANCIAL SECTION JUNE 30, 2019 41 | P a g e
I. SUMMARY OF SIGNIFICANT ACCOUNTING POLICIES (cont’d) E. Assets, Liabilities, and Net Position or Equity (cont’d)
15. Revenues
State Equalization Guarantee: School districts in the State of New Mexico receive a ‘state equalization guarantee distribution’ which is defined as “that amount of money distributed to each school district to ensure that the school district’s operating revenue, including its local and federal revenues as defined (in Chapter 22, Section 825, NMSA 1978) is at least equal to the school district’s “program cost.”
A school district’s program costs are determined through the use of various formulas using ‘program units’ which take into consideration 1) early childhood education; 2) basic education; 3) special education; 4) bilingual-multicultural education, 5) size, etc. Payment is made from the public school fund under the authority of the Director of Public School Finance. The District received $79,001,483 in state equalization guarantee distributions during the year ended June 30, 2019.
Transportation Distribution: School districts in the State of New Mexico received student transportation distributions. The transportation distribution is allocated to each school district in accordance with formulas developed by the State Transportation Director and the Director of Public School Finance. The funds shall be used only for the purpose of making payments to each school district for the to-and-from school transportation costs of students in grades K through twelve attending public school within the school district. The District received $3,262,948 in transportation distributions during the year ended June 30, 2019.
Instructional Materials: The New Mexico Public Education Department (PED) receives federal mineral leasing funds from which it makes annual allocations to the various school districts for the purchase of educational materials. Of each allocation, fifty percent is restricted to the purchase of material listed on the PED ‘Multiple List”, while fifty percent of each allocation is available for purchases directly from vendors or transfer to the fifty percent account for purchase of material from the “Multiple List”. Districts are allowed to carry forward unused textbook funds from year to year. The District received $370,113 in instructional materials distributions during the year ended June 30, 2019.
16. Tax Abatements
Governmental Accounting Standards Board Statement No. 77 requires the District to disclose information on certain tax abatement agreements effecting the District. A tax abatement is created when a government enters into an agreement with an individual or entity in which the government promises to forgo tax revenues and the individual or entity promises to subsequently take a specific action that contributes to economic development or otherwise benefits the government or its citizens. Accordingly, the District did not have any tax abatements effecting the District during the year ended June 30, 2019.
II. STEWARDSHIP, COMPLIANCE, AND ACCOUNTABILITY
A. Budgetary Information
Budgets for the General, Special Revenue, Capital Projects, and Debt Service Funds are prepared by management and are approved by the local Board of Education and the Public School Budget and Planning Unit of the Department of Education. Auxiliary student activity accounts are not budgeted.
These budgets are prepared on the Non-GAAP cash basis, excluding encumbrances, and secure appropriation of funds for only one year. Carryover funds must be re-appropriated in the budget of the subsequent fiscal year. The budget process in the State of New Mexico requires that the beginning cash balance be appropriated in the budget of the subsequent fiscal year. Such appropriated balance is legally restricted and is therefore presented as a reserved portion of fund balance.
Actual expenditures may not exceed the budget at the function level, i.e., each budgeted expenditure must be within budgeted amounts. Budgets may be amended in two ways. If a budget transfer is necessary within a major category called a ‘series’, this may be accomplished with only local Board of Education approval. If a transfer between ‘series’ or a budget increase is required, approval must also be obtained from Public School Finance Division.

FINANCIAL SECTION NOTES TO THE FINANCIAL STATEMENTS 42 | P a g e JUNE 30, 2019
II. STEWARDSHIP, COMPLIANCE, AND ACCOUNTABILITY (cont’d) A. Budgetary Information (cont’d)
The budgetary information presented in these financial statements has been amended in accordance with the above procedures.
The District follows these procedures in establishing the budgetary data reflected in the financial statements:
1. In April or May, the superintendent submits to the Board of Education a proposed operating budget of the fiscal year commencing the following July. The operating budget includes proposed expenditures and the means of financing them, and has approval by the Department of Education.
2. In May or June, the budget is approved by the Board of Education.
3. The school board meeting, while not intended for the general public, is open for the general public unless a closed meeting has been called for.
4. The superintendent is authorized to transfer budgeted amounts between departments within any fund; however, any revisions that alter the total expenditures of any fund must be approved by the school board and the State of New Mexico Department of Education.
5. Formal budgetary integration is employed as a management control device during the year for the General Fund, Special Revenue Funds, Debt Service Funds and Capital Projects Funds.
6. Budgets for the General, Special Revenue, Capital Projects, and Debt Service Funds are adopted on a basis not consistent with generally accepted accounting principles (GAAP). Encumbrances are treated the same way for GAAP purposes and for Budget purposes.
The Board of Education may approve amendments to the appropriated budget, which are required when a change is made affecting budgeted ending fund balance. The appropriated budget for the year ended June 30, 2019 was properly amended by the Board through the year. New Mexico state law prohibits a Governmental Agency to exceed an individual line item. These amendments resulted in the following changes:
B. Budgetary Violations
The District did not have any budgetary violations during the year ended June 30, 2019.
C. Deficit Fund Equity
The District did not have any deficit fund balances as of June 30, 2019.
ORIGINAL FINALMajor Funds:
General Funds 89,703,508$ 90,480,486$ Special Revenue Funds:
Title I 2,677,005 3,022,033 Entitlement IDEA-B - 3,646,182
Capital Projects Funds:Bond Building 6,367,955 17,367,955
Debt Service Funds:Debt Service 15,983,496 15,983,496
Nonmajor Funds:Special Revenue Funds 9,121,871 15,014,428 Capital Projects Funds 9,244,135 12,281,588 Debt Service Fund 5,779,700 5,779,700 , ,
Total Budget 138,877,670$ 163,575,868$

NOTES TO THE FINANCIAL STATEMENTS FINANCIAL SECTION JUNE 30, 2019 43 | P a g e
III. DETAILED NOTES ON ALL FUNDS
A. Cash and Temporary Investments
At June 30, 2019, the carrying amount of the District’s deposits was $31,092,064 and the bank balance was $34,013,889 with the difference consisting of outstanding checks.
Of the total cash and cash equivalents balance, $512,243 was covered by federal depository insurance and $27,055,684 was covered by collateral held in joint safekeeping by a third party.
Custodial Credit Risk Custodial credit risk is the risk that in the event of a bank failure, the District’s deposits may not be returned to it. New Mexico State Statutes require collateral pledged for deposits in excess of the federal deposit insurance to be delivered, or a joint safekeeping receipt be issued, to the District for at least one half of the amount on deposit with the institution. The District does not have a deposit policy for custodial credit risk, other than these following state statutes as put forth in the Public Money Act (Section 6-10-1 to 6-10-63, NMSA 1978). The statement listed below will meet the State of New Mexico Office of the State Auditor’s requirement in reporting the uninsured portion of the deposits. As of June 30, 2019, $6,445,962 of the District’s bank deposits was exposed to custodial risk as follows:
AMOUNTFinancial institution (FDIC):
Wells Fargo 26,122,765$ Citizens 1,407,525 Bank of the Southwest 12,243
State agencies:New Mexico Finance Authority 6,471,356
Cash on hand 40 Less:
Agency cash (978,153) Restricted Cash (6,471,356) Net reconciling items (2,921,825)
Total cash and equivalents 23,642,595$
INSURED UNDER INSURED TOTALBank deposits:
Uninsured and uncollateralized 6,445,962$ -$ 6,445,962$ Uninsured and collateral held by pledging
bank's trust dept not in the District's name 27,055,684 - 27,055,684 Total uninsured 33,501,646 - 33,501,646
Insured (FDIC) 512,243 - 512,243 Total deposits 34,013,889$ -$ 34,013,889$
State of New Mexico collateral requirement:50% of uninsured public fund bank deposits 16,750,824$ -$ 16,750,824$ Pledged security 27,055,684 - 27,055,684
Over collateralization 10,304,860$ -$ 10,304,860$

FINANCIAL SECTION NOTES TO THE FINANCIAL STATEMENTS 44 | P a g e JUNE 30, 2019
III. DETAILED NOTES ON ALL FUNDS (cont’d)
A. Cash and Temporary Investments (cont’d)
The collateral pledged is listed on Schedule of Pledged Collateral in the Other Supplemental Information section of this report. The types of collateral allowed are limited to direct obligations of the United States Government and all bonds issued by any agency, district, or political subdivision of the State of New Mexico. According to the Federal Deposit Insurance Authority, public unit deposits are funds owned by the District. Time deposits, savings deposits and interest bearing “Now” accounts of a public unit in an institution in the same state will be insured up to $250,000 in aggregate and separate from the $250,000 coverage for public unit demand deposits at the same institution.
B. Receivables
Receivables as of June 30, 2019 for the government’s individual major funds and non-major funds in the aggregate, including the following:
An allowance for doubtful accounts has not been established. All receivables are expected to be collectible.
Governmental funds reported deferred revenue in connection with receivables for revenues that are not considered to be available to liquidate liabilities of the current period. Governmental funds also defer revenue recognition in connection with resources that have been received, but not yet earned. At the end of the current fiscal year, the various components of deferred revenue and unearned revenue reported in the governmental funds were as follows:
Property Taxes Grants Governments FundsMajor Funds:
General Funds 38,703$ -$ 7,935$ 5,541,120$ Title I - 1,707,292 - - Entitlement IDEA-B - 2,084,075 - - Bond Building - - - - Debt Service 507,610 - 103,603 -
Other Governmental Funds 272,061 2,240,659 79,722 - Total 818,374$ 6,032,026$ 191,260$ 5,541,120$
RECEIVABLES DUE FROM OTHER
UNAVAILABLE UNEARNEDGrant drawdowns prior to meeting all eligibility requirements
Other Governmental Funds -$ 22,525$ Delinquent property taxes
General Fund 32,570 - Debt Service 430,932 - Other Governmental Funds 212,705 -
Total deferred/unearned revenue for governmental funds 676,207$ 22,525$

NOTES TO THE FINANCIAL STATEMENTS FINANCIAL SECTION JUNE 30, 2019 45 | P a g e
III. DETAILED NOTES ON ALL FUNDS (cont’d)
C. Inter-Fund Receivables and Payable
The inter-fund receivables and payables at June 30, 2019 were:
The inter-fund loans were made for the purposes of cash shortfalls within the individual funds. The loans are expected to be repaid within the next fiscal year.
RECEIVABLES PAYABLESMajor Funds:
General Funds 5,541,120$ -$ Title I - 1,657,333 Entitlement IDEA-B - 2,033,526 Bond Building - 3,000
Other Governmental FundsFood Service - 102,886 Preschool IDEA-B - 23,753 IDEA-B Private Schools - 6,341 21st Century Community Learning Centers - 134,630 Title I - 1003g - 153,619 IDEA-B Student Success - 19,204 Title III English Language - 24,055 Title II Teacher Quality - 407,659 Carl D Perkins - JAG - 52,647 Carl D Perkins - 29,274 Carl D Perkins Secondary Redistribution - 11,479 Carl D Perkins HSTW - Current - 590 Carl D Perkins HSTW - PY Unliq. Oblig - 3,834 Carl D Perkins HSTW - Redistribution - 8,794 IDEA-B Stay in School - 215,256 Academic Enrichment - 69,778 Title I Comprehensive Support & Improvement - 8,841 Title I - HS Redesign - 44,516 Johnson O'Malley - 104,645 Indian Ed Formula Grant - 9,107 Native American Program - 5,299 Dual Credit Instructional Materials - 17,246 Libraries GO Bond 2012 - 7,176 Reads to Lead - 65,142 Pre-K Initiative - 292,985 Indian Education Act - 17,460 Breakfast for Elementary Students - 11,045
Total 5,541,120$ 5,541,120$

FINANCIAL SECTION NOTES TO THE FINANCIAL STATEMENTS 46 | P a g e JUNE 30, 2019
III. DETAILED NOTES ON ALL FUNDS (cont’d)
D. Interfund Transfers
The inter-fund transfers during the year ended June 30, 2019 were:
The transfers were to clear funds that are no longer being used and were approved by the New Mexico Public Education Department.
E. Capital Assets
Capital asset activity for the year ended June 30, 2019 was as follows:
TRANSFER IN TRANSFER OUTMajor Funds:
General Funds -$ 23,755$ Other Governmental Funds
Title II Teacher Quality 23,755 - 4R Future Individual - 164,166 4R Future Group 164,166 -
Total 187,921$ 187,921$
BEGINNING INCREASES DECREASES ENDING
Governmental activities:Capital assets not being depreciated:
Land 4,142,761$ -$ -$ 4,142,761$ Construction in progress 72,929,843 (72,493,840) - 436,003
Total capital assets not being depreciated 77,072,604 (72,493,840) - 4,578,764
Capital assets being depreciated:Land improvements 4,448,663 - - 4,448,663 Buildings and improvements 241,930,237 79,774,881 (582,097) 321,123,021 Furniture, fixtures, and equipment 12,087,308 299,339 (147,354) 12,239,293
Total capital assets being depreciated 258,466,208 80,074,220 (729,451) 337,810,977
Less accumulated depreciation for:Land improvements (4,417,101) (4,047) - (4,421,148) Buildings and improvements (93,650,674) (5,366,872) 555,793 (98,461,753) Furniture, fixtures, and equipment (8,703,626) (753,871) 145,780 (9,311,717)
Total accumulated depreciation (106,771,401) (6,124,790) 701,573 (112,194,618)
Total capital assets being depreciated, net 151,694,807 73,949,430 (27,878) 225,616,359
Total capital assets, net 228,767,411$ 1,455,590$ (27,878)$ 230,195,123$

NOTES TO THE FINANCIAL STATEMENTS FINANCIAL SECTION JUNE 30, 2019 47 | P a g e
III. DETAILED NOTES ON ALL FUNDS (cont’d)
E. Capital Assets (cont’d)
Depreciation has been allocated to the functions by the following amounts:
Construction commitments
The District is involved in long-term construction projects as part of their master plan for upgrading the district buildings. The amount in the capital projects funds designated for subsequent years expenditures are committed for funding these projects. Interest on construction projects is not capitalized.
F. Long-Term Debt
General Obligation Bonds
The District issues general obligation bonds to provide funds for the acquisition and construction of major capital facilities. Bonds are direct obligations and pledge the full faith and credit of the District. The bonds will be paid from taxes levied against property owners living within the School District boundaries. The details of the bonds and notes as of June 30, 2019 are as follows:
AMOUNTInstruction 44,643$ Support Services - Students 2,390 Support Services - Instruction 759 Support Services - General Administration 27,742 Support Services - School Administration 4,217 Operations & Maintenance of Plant 79,748 Student Transportation 408,729 Food Services 49,751 Capital Outlay 5,506,811
Total Depreciation Expense 6,124,790$
ORIGINAL INTEREST CURRENTBOND ISSUES AMOUNT RATES BALANCE PORTION
Series 03/16/11 12,500,000$ 2.00% to 4.00% 5,450,000$ 1,000,000$ Series 05/16/12 14,000,000 2.00% to 4.00% 5,750,000 950,000 Series 06/03/14 23,500,000 2.00% to 3.00% 17,990,000 900,000 Series 06/03/14 3,530,000 2.00% to 2.00% - - Series 05/16/14 6,500,000 0.53% to 1.47% - - Series 03/01/16 35,000,000 3.00% to 5.00% 28,530,000 950,000 Series 05/20/16 6,700,000 1.06% to 1.34% 3,425,000 1,600,000 Series 09/15/17 7,100,000 1.16% to 3.14% 6,450,000 225,000 Series 09/15/17 2,370,000 0.86% to 1.19% 1,820,000 530,000 Series 05/04/18 5,000,000 1.62% to 2.54% 5,000,000 1,250,000 Series 06/15/18 4,000,000 1.76% to 3.27% 4,000,000 1,350,000 Series 11/06/18 11,000,000 2.14% to 3.41% 11,000,000 -
Total 131,200,000$ 89,415,000$ 8,755,000$

FINANCIAL SECTION NOTES TO THE FINANCIAL STATEMENTS 48 | P a g e JUNE 30, 2019
III. DETAILED NOTES ON ALL FUNDS (cont’d)
F. Long-Term Debt (cont’d)
Annual debt service requirements to maturity for general obligation bonds are as follows:
Balances shown for bonds and notes do not include unamortized premiums or deferred amounts on refinancing.
Changes in long term debt – During the year ended June 30, 2019 the following changes occurred in liabilities reported in the general obligation bonds account group:
The liability of compensated absences is liquidated with resources from the general fund and several special revenue funds. The liquidation of bonds payable is done with resources from the debt service fund.
YEAR ENDING TOTALJUNE 30, PRINCIPAL INTEREST REQUIREMENTS
2020 8,755,000$ 2,668,925$ 11,423,925$ 2021 8,185,000 2,537,374 10,722,374 2022 6,695,000 2,276,156 8,971,156 2023 5,975,000 2,085,477 8,060,477 2024 5,275,000 1,905,928 7,180,928
2025 - 2029 28,035,000 6,778,471 34,813,471 2030 - 2034 26,495,000 2,101,208 28,596,208
Total 89,415,000$ 20,353,540$ 109,768,540$
BALANCEBonds payable 89,415,000$ Less: current maturities (8,755,000) Unamortized:
Bond premiums 2,968,320 Total non-current bonds 83,628,320$
DUE WITHINBALANCE ADDITIONS RETIREMENTS BALANCE ONE YEAR
Compensated absences:Compensated vacation 348,631$ 510,660$ 385,740$ 473,551$ 473,551$
Bonds payableOriginal Amount Issue
12,500,000$ 03/16/11 6,150,000 - 700,000 5,450,000 1,000,000 14,000,000 05/16/12 6,700,000 - 950,000 5,750,000 950,000 23,500,000 06/03/14 18,790,000 - 800,000 17,990,000 900,000 3,530,000 06/03/14 875,000 - 875,000 - - 6,500,000 05/16/14 1,400,000 - 1,400,000 - -
35,000,000 03/01/16 29,730,000 - 1,200,000 28,530,000 950,000 6,700,000 05/20/16 5,225,000 - 1,800,000 3,425,000 1,600,000 7,100,000 09/15/17 7,100,000 - 650,000 6,450,000 225,000 2,370,000 09/15/17 2,370,000 - 550,000 1,820,000 530,000 5,000,000 05/04/18 5,000,000 - - 5,000,000 1,250,000 4,000,000 06/15/18 4,000,000 - - 4,000,000 1,350,000
11,000,000 11/06/18 - 11,000,000 - 11,000,000 - Total Bonds payable 87,340,000 11,000,000 8,925,000 89,415,000 8,755,000
87,688,631$ 11,510,660$ 9,310,740$ 89,888,551$ 9,228,551$
BEGINNING ENDING

NOTES TO THE FINANCIAL STATEMENTS FINANCIAL SECTION JUNE 30, 2019 49 | P a g e
III. DETAILED NOTES ON ALL FUNDS (cont’d)
F. Long-Term Debt (cont’d)
New Debt
The District issued Series 2018A General Obligation Bonds in the amount of $11,000,000 on November 30, 2018. The District made the first interest payment on March 1, 2019 and will make the first principal payment on September 1, 2021. The bond series will mature on September 1, 2033 with interest rates of 2.14% to 3.41%. The District was at 97.53% bonding capacity after the issuance of GO Series 2018A.
G. Leases
The District leases office equipment various 60-month non-cancellable operating lease. The lease was executed during the years ended June 30, 2017 and June 30, 2019 with monthly payments totaling $11,860. At the end of the lease period the equipment will be traded in. Rental costs for the year ended June 30, 2019 were $141,139. The annual lease requirements are as follows:
IV. COMPONENT UNIT District management has determined that New Mexico Virtual Academy (Charter School) is a major component unit of the District under Governmental Accounting Standards Board (GASB) Statement No. 14, The Financial Reporting Entity and GASB Statement No. 39, Determining Whether Certain Organizations Are Component Units, an amendment of GASB Statement No. 14, and GASB Statement No. 61, The Financial Reporting Entity: Omnibus – an amendment of GASB Statements No. 14 and No. 34. New Mexico Virtual Academy is chartered under Farmington Municipal School District and is the financial responsibility of Farmington Municipal Schools. Since the charter school relies on its charter from the District and a financial burden exists upon closure of the charter school or when the charter school is in need of financial assistance. The following are summarized details of the charter school’s balances and transactions as of June 30, 2019 and for the year then ended:
A. Cash and Temporary Investments
At June 30, 2019, the carrying amount of the Charter School’s deposits was $404,065 and the bank balance was $583,479 with the difference consisting of outstanding checks. Of this balance $250,000 was covered by federal depository insurance and $333,479 was covered by collateral held in joint safekeeping by a third party.
JUNE 30, AMOUNT
2020 142,322$ 2021 142,322 2022 140,193
Total 424,837$
BALANCEFinancial institution (FDIC):
Citizens 583,479$ Less:
Net reconciling items (179,414) Total cash and equivalents 404,065$

FINANCIAL SECTION NOTES TO THE FINANCIAL STATEMENTS
50 | P a g e JUNE 30, 2019
IV. COMPONENT UNIT (cont’d)
A. Cash and Temporary Investments (cont’d)
Custodial Credit Risk Custodial credit risk is the risk that in the event of a bank failure, the Charter School’s deposits may not be returned to it. New Mexico State Statutes require collateral pledged for deposits in excess of the federal deposit insurance to be delivered, or a joint safekeeping receipt be issued, to the Charter School for at least one half of the amount on deposit with the institution. The statement listed below will meet the State of New Mexico Office of the State Auditor’s requirement in reporting the uninsured portion of the deposits. As of June 30, 2019, none of the Charter School’s bank balance was exposed to custodial risk as follows:
The collateral pledged is listed on Schedule of Pledged Collateral with the component unit financial statements in the Other Supplemental Information section of this report. The types of collateral allowed are limited to direct obligations of the United States Government and all bonds issued by any agency, district or political subdivision of the State of New Mexico. According to the Federal Deposit Insurance Authority, public unit deposits are funds owned by the schools. Time deposits, savings deposits and interest bearing “Now” accounts of a public unit in an institution in the same state will be insured up to $250,000 in aggregate and separate from the $250,000 coverage for public unit demand deposits at the same institution.
B. Receivables
Receivables as of year-end for the government’s individual major funds and non-major funds in the aggregate, including the following:
An allowance for doubtful accounts has not been established. All receivables are expected to be collectible.
INSURED UNDER INSURED TOTAL
Bank deposits:Uninsured and uncollateralized -$ -$ -$ Uninsured and collateral held by pledging
bank's trust dept not in the District's name 333,479 - 333,479
Total uninsured 333,479 - 333,479
Insured (FDIC) 250,000 - 250,000
Total deposits 583,479$ -$ 583,479$
State of New Mexico collateral requirement:50% of uninsured public fund bank deposits 166,740$ -$ 166,740$ Pledged security 1,038,820 - 1,038,820
Over collateralization 872,080$ -$ 872,080$
RECEIVABLES DUE FROM OTHER
Property Taxes Grants Governments Funds
Major Funds:General Funds -$ 1,269$ -$ 37,541$ Entitlement IDEA-B - 36,272 - -
Other Governmental Funds - - 50,549 -
Total -$ 37,541$ 50,549$ 37,541$

NOTES TO THE FINANCIAL STATEMENTS FINANCIAL SECTION JUNE 30, 2019 51 | P a g e
IV. COMPONENT UNIT (cont’d)
C. Inter-Fund Receivables and Payables
The inter-fund receivables and payables at June 30, 2019 were:
The inter-fund loans were made for the purposes of cash shortfalls within the individual funds. The loans are expected to be repaid within the next fiscal year.
D. Inter-Fund Transfers
There were not any inter-fund transfers during the year ended June 30, 2019. V. OTHER INFORMATION
A. Risk Management
The District is exposed to various risks of loss related to torts; theft of, damage to and destruction of assets; errors and omissions; injury to employees; and natural disasters. The New Mexico Public Schools Insurance Authority (NMPSIA) was formed on April 5, 1985 under the New Mexico Public Schools Insurance Authority Act, Chapter 22, Section 2 of the New Mexico Statutes Annotated (NMSA 1978), as amended, as an insurance fund to provide health, disability and life insurance coverage (benefits coverage), and property, casualty and workers’ compensation insurance coverage (risk coverage) to participating public schools, school board members, public school employees, and retirees within the State of New Mexico. The District is one of 91 members that participate in NMPSIA. Participation in NMPSIA is mandatory for all K-12 public schools except those with enrollment exceeding 60,000 students. Participation is voluntary for other public education institutions. The District pays an annual premium to the pool for its general insurance coverage. The agreement for formation of NMPSIA provides that the pool will be self-sustaining through member premiums. NMPSIA establishes self-insured retentions by line of coverage and procures insurance or reinsurance, where indicated, in excess of the self-insured retention on a per occurrence basis. NMPSIA will publish its own financial report for the year ended June 30, 2019.
RECEIVABLES PAYABLESMajor Funds:
General Funds 83,415$ -$ Entitlement IDEA-B - 83,415
Other Governmental Funds - - Total 83,415$ 83,415$

FINANCIAL SECTION NOTES TO THE FINANCIAL STATEMENTS 52 | P a g e JUNE 30, 2019
V. OTHER INFORMATION (cont’d)
B. Employee Retirement Plan
Plan Description - Substantially all of the District’s full-time employees participate in a public employee retirement system authorized under the Educational Retirement Act (Chapter 22, Article 11, Sections 1 through 52, NMSA 1978). The Educational Retirement Board (ERB) is the administrator of the New Mexico Educational Employees' Retirement Plan (Plan), which is a cost-sharing multiple-employer defined benefit retirement plan. ERB issues a separate, publicly available financial report that includes the financial statements and required supplementary information for the plan. That report may be obtained www.nmerb.org, www.saonm.org, or by writing to:
ERB P.O. Box 26129 Santa Fe, New Mexico 87502-6129 www.nmerb.org
Membership in the Plan is a condition of employment. Employees of public schools, universities, regional cooperatives, special schools and state agencies providing educational programs, who are employed at more than 25% of a full-time equivalency, are required to be members of the Plan. There were 156,789 active, retired, and inactive members in fiscal year 2018; there were 153,514 active, retired, and inactive members in fiscal year 2017.
Benefits Provided - The plan provides for retirement benefits, disability benefits, survivor benefits and cost-of-living adjustments to plan members (certified teachers, and other employees of State public school districts, colleges and universities) and beneficiaries. Benefits are based on three components: Final Average Salary (FAS), years of both earned and allowed service credits, and a 2.35% factor. The gross annual benefit is determined by multiplying the three components together. FAS is the higher of annual earnings for the previous 20 calendar quarters prior to retirement or the highest average annual earnings for any 20 consecutive calendar quarters.
For members employed before July 1, 2010, a member is eligible to retire when one of the following events occurs: the member’s age and earned service credit add up to the sum or 75 or more; the member is at least sixty-five years of age and has five or more years of earned service credit; or the member has service credit totaling 25 years or more.
Chapter 288, Laws of 2009 changed the eligibility requirements for new members first employed on or after July 1, 2010. The eligibility for a member who either becomes a new member on or after July 1, 2010, or at any time prior to that date refunded all member contributions and then became, or becomes, reemployed after that date is as follows: the member’s age and earned service credit add up to the sum of 80 or more; the member is at least sixty-seven years of age and has five or more years of earned service credit; or the member has service credit totaling 30 years or more.
The benefit is paid as a monthly life annuity with a guarantee that, if the payments made do not exceed the member’s accumulated contributions plus accumulated interest, determined as of the date of retirement, the balance will be paid in a lump sum to the member’s surviving beneficiary. There are three benefit options available: single life annuity; single life annuity monthly benefit reduced to provide for a 100% survivor’s benefit; or single life annuity monthly benefit is reduced to provide for a 50% survivor’s benefit.
Retired members and surviving beneficiaries receiving benefits receive an automatic cost of living adjustment (COLA) to their benefit commencing on July 1 following the later of: (i) the year a member retires, or (ii) the year in which a member attains age 65 (Tier 1 and Tier 2) or age 67 (Tier 3).
If the plan’s funded ratio for the next preceding fiscal year is 100%, or greater, Section 22-11-31(C)(1) of the New Mexico Statutes Annotated defines the adjustment factor as ½ of the percentage increase of the consumer price index between the next preceding calendar year and the preceding calendar year. The adjustment factor cannot exceed four percent, nor be less than two percent. However, if the percentage increase of the consumer price index is less than two percent, the adjustment factor will be equal to the percentage increase of the consumer price index.
If the plan’s funded ratio for the next preceding fiscal year is greater than 90%, but less than 100%, Section 22-11-31(C)(2) indicates that the adjustment factor for all non-disability retirements will be 95% of the adjustment factor defined in Section 22-11-31(C)(1) if the member had 25 or more years of service credit at retirement and whose annuity is less than or equal to the median adjusted annuity for the fiscal year next preceding the adjustment date. For all other retirees eligible for an adjustment, the adjustment factor will be 90% of the adjustment factor defined in Section 22-11-31(C)(1).

NOTES TO THE FINANCIAL STATEMENTS FINANCIAL SECTION JUNE 30, 2019 53 | P a g e
V. OTHER INFORMATION (cont’d)
B. Employee Retirement Plan (cont’d)
If the plan’s funded ratio for the next preceding fiscal year is 90%, or less, Section 22-11-31(C)(3) indicates that the adjustment factor for all non-disability retirements will be 90% of the adjustment factor defined in Section 22-11-31(C)(1) if the member had 25 or more years of service credit at retirement and whose annuity is less than or equal to the median adjusted annuity for the fiscal year next preceding the adjustment date. For all other retirees eligible for an adjustment, the adjustment factor will be 80% of the adjustment factor defined in Section 22-11-31(C)(1).
Finally, annuities shall not be decreased in the event that there is a decrease in the consumer price index between the next preceding calendar year and the preceding calendar year.
As of July 1, 2013, for current and future retirees the COLA was immediately reduced until the plan is 100% funded. The COLA reduction was based on the median retirement benefit of all retirees excluding disability retirements. Retirees with benefits at or below the median and with 25 or more years of service credit will have a 10% COLA reduction; their average COLA will be 1.5%. All other retirees will have a 20% COLA reduction; their average COLA will be 1.6%. Once the funding is greater than 90%, the COLA reductions will decrease. The retirees with benefits at or below the median and with 25 or more years of service credit will have a 5% COLA reduction; their average COLA will be 1.7%. All other retirees will have a 10% COLA reduction; their average will be 1.8%. Members on disability retirement are entitled to a COLA commencing on July 1 of the third full year following disability retirement. A member on regular retirement who can prove retirement because of a disability may qualify for a COLA beginning July 1 in the third full year of retirement.
A member is eligible for a disability benefit provided (a) he or she has credit for at least 10 years of service, and (b) the disability is approved by ERB. The monthly benefit is equal to 2% of FAS times years of service, but not less than the smaller of (a) one-third of FAS or (b) 2% of FAS times year of service projected to age 60. The disability benefit commences immediately upon the member’s retirement. Disability benefits are payable as a monthly life annuity, with a guarantee that, if the payments made do not exceed the member’s accumulated contributions, determined as of the date of retirement, the balance will be paid in a lump sum to the member’s surviving beneficiary. If the disabled member survives to age 60, the regular optional forms of payment are then applied. A member with five or more years of earned service credit on deferred status may retire on disability retirement when eligible under the Rule of 75 or when the member attains age 65.
The member, upon retirement, has three options as to how to receive the benefit.
Option A – If the member elects the Option A, there is no reduction to the monthly benefit other than any “Rule of 75” deductions or any community property or child support reductions. There will be no continuing benefit to a beneficiary or estate upon the retiree’s death, except the balance, if any, of member contributions. Those contributions are usually exhausted in the first three to four years of retirement.
Option B – If the member elects Option B, the monthly benefit is reduced to provide for a 100% survivor’s benefit. The reduced benefit is payable during the life of the member and upon the retiree’s death, the same benefit is paid to the beneficiary for his or her lifetime. The named beneficiary may not be changed after the effective date of retirement since the amount of the option is calculated by using both the age of the member and the beneficiary. If the beneficiary predeceases the member, the member’s benefit will be adjusted by returning it to the Option A Benefit amount. The IRS prohibits selection of Option B for a non-spouse beneficiary more than ten years younger than the member.
Option C – If the member elects Option C, the monthly benefit is reduced to provide for a 50% survivor’s benefit. The benefit is payable during the life of the member and upon the retiree’s death, one half of the member’s benefit is paid to the beneficiary for his or her lifetime. Here again, the named beneficiary may not be changed after the effective date of retirement. If the beneficiary predeceases the member, the member’s benefit is adjusted by returning it to the Option A Benefit amount.
Under the provisions of Options B and C coverage, the beneficiary must be a person, and only one beneficiary may be named. The term beneficiary means a person having an insurable interest in the life of the member.

FINANCIAL SECTION NOTES TO THE FINANCIAL STATEMENTS 54 | P a g e JUNE 30, 2019
V. OTHER INFORMATION (cont’d)
B. Employee Retirement Plan (cont’d)
Member Contributions – Plan members whose annual salary is $20,000 or less are required by statute to contribute 7.9% of their gross salary. Plan members whose annual salary is over $20,000 are required to make the following contributions to the Plan: 10.7% of their gross salary in fiscal year 2019.
Employer Contributions – In fiscal year 2018, the District was required to contribute 13.9% of the gross covered salary for employees whose annual salary is $20,000 or less, and 13.9% of the gross covered salary for employees whose annual salary is more than $20,000. The contribution rate will increase to 14.15% for the year ended June 30, 2020. The contribution requirements of plan members and the District are established in State statute under Chapter 22, Article 11, NMSA 1978. The requirements may be amended by acts of the legislature. The District’s contributions to ERB for the fiscal year ending June 30, 2018 was $7,851,367, which equal the amount of the required contributions.
New Mexico Virtual Academy Charter School’s contributions to ERB for the fiscal year ending June 30, 2019 was $136,667, which equal the amount of the required contributions for each fiscal year.
Employers
The Educational Retirement Act designates employers as Local Administrative Units, directly responsible for payment of compensation for the employment of members or participants of this Plan. There were 216 contributing employers in fiscal year 2018; there were 218 contributing employers in fiscal year 2017.
Liabilities, Deferred Outflows of Resources, Deferred Inflows of Resources, and Expense Related to Pensions
Farmington Municipal Schools
At June 30, 2019, the District reported a liability of $222,476,100 for its proportionate share of the net pension liability. The net pension liability was measured as of June 30, 2018, and the total pension liability used to calculate the net pension liability was determined by an actuarial valuation as of that date. The District's proportion of the net pension liability was based on a projection of the District's long-term share of contributions to the pension plan relative to the projected contributions of all participating school districts and regional education cooperatives, actuarially determined. At June 30, 2018, the District's proportion was 1.87091 percent, which was a decrease of 0.03901 percent from its proportion measured as of June 30, 2017.
For the year ended June 30, 2019, the District recognized pension expense of $35,502,232.
PENSION EXPENSE CALCULATIONNet pension liability - end of the year 222,476,100$ Net pension liability - beginning of the year (212,258,352) Deferred outflows of resources during the year 16,578,682 Deferred inflows of resources during the year 1,446,989 Reductions to ending net pension liability due contributions paid 7,258,813 Total Pension Expense 35,502,232$

NOTES TO THE FINANCIAL STATEMENTS FINANCIAL SECTION JUNE 30, 2019 55 | P a g e
V. OTHER INFORMATION (cont’d)
B. Employee Retirement Plan (cont’d)
At June 30, 2019, the District reported deferred outflows of resources and deferred inflows of resources related to pensions from the following sources:
Deferred outflows of resources related to pensions in the amount of $7,851,367 resulted from the District’s contributions subsequent to the measurement date will be recognized as a reduction of the net pension liability in the year ended June 30, 2020 (pension measurement date June 30, 2019). Amounts reported as deferred outflows of resources and deferred inflows of resources related to pensions will be recognized in pension expense as follows:
New Mexico Virtual Academy (Component Unit)
At June 30, 2019, the Charter School reported a liability of $3,543,617 for its proportionate share of the net pension liability. The net pension liability was measured as of June 30, 2018, and the total pension liability used to calculate the net pension liability was determined by an actuarial valuation as of that date. The Charter School's proportion of the net pension liability was based on a projection of the Charter School's long-term share of contributions to the pension plan relative to the projected contributions of all participating school districts and regional education cooperatives, actuarially determined. At June 30, 2018, the Charter School's proportion was 0.0298 percent, which was an increase of 0.00293 percent from its proportion measured as of June 30, 2017.
For the year ended June 30, 2019, the Charter School recognized pension expense of $700,964.
OUTFLOWS INFLOWSDifference between expected and actual experience 162,371$ 4,234,078$ Change of assumptions 45,851,272 - Net difference between projected and actual earnings on
pension plan investments 492,505 - Changes in proportion and differences between District
contributions and proportionate share of contributions - 4,483,997 District contributions subsequent to the measurement date 7,851,367 -
Total 54,357,515$ 8,718,075$
JUNE 30, AMORTIZATION
2020 (23,489,631)$ 2021 (15,090,601) 2022 798,641 2023 (6,482) 2024 -
Thereafter - Total (37,788,073)$
Net pension liability - end of the year 3,543,617$ Net pension liability - beginning of the year (2,986,189) Deferred outflows of resources during the year 8,230 Deferred inflows of resources during the year 19,549 Reductions to ending net pension liability due contributions paid 115,757 Total Pension Expense 700,964$
PENSION EXPENSE CALCULATION

FINANCIAL SECTION NOTES TO THE FINANCIAL STATEMENTS 56 | P a g e JUNE 30, 2019
V. OTHER INFORMATION (cont’d)
B. Employee Retirement Plan (cont’d)
At June 30, 2019, the Charter School reported deferred outflows of resources and deferred inflows of resources related to pensions from the following sources:
Deferred outflows of resources related to pensions in the amount of $136,667 resulted from the District’s contributions subsequent to the measurement date will be recognized as a reduction of the net pension liability in the year ended June 30, 2020 (pension measurement date June 30, 2019). Amounts reported as deferred outflows of resources and deferred inflows of resources related to pensions will be recognized in pension expense as follows:
Actuarial Assumptions
A single discount rate of 5.69% was used to measure the total pension liability as of June 30, 2018. This single discount rate was based on an expected rate of return on pension plan investments of 7.25 percent and a municipal bond rate of 3.62 percent. Based on the assumptions described below and the projection of cash flows, pension plan's fiduciary net position and future contributions were projected to be available to finance all projected future benefit payments of current plan members. The long term expected rate of return on pension plan investments was applied to all periods of projected benefit payments to determine the total pension liability.
The total pension liability, net pension liability, and certain sensitivity information are based on an actuarial valuation performed as of June 30, 2018. The total pension liability was rolled forward from the valuation date to the Plan’s year ended June 30, 2018 using generally accepted actuarial principles. The roll-forward incorporates the impact of the new assumptions adopted by the Board on April 21, 2017. There were no other significant events or changes in benefit provisions that required an adjustment to the roll-forward liabilities as of June 30, 2018. The liabilities reflect the impact of the new assumptions adopted by the Board of Trustees on April 21, 2017 as well as the change in the single discount rate between June 30, 2017 and June 30, 2018. Specifically, the liabilities measured as of June 30, 2018 incorporate the following assumptions:
1) All members with an annual salary of more than $20,000 will contribute 10.7% during the fiscal year ending June 30, 2015 and thereafter.
2) Members hired after June 30, 2013 will have an actuarially reduced retirement benefit if they retire before age 55 and their Cost of Living Adjustment (COLA) will be deferred until age 67.
3) COLAs for most retirees are reduced until ERB attains a 100% funded status. 4) The new assumptions adopted by the Board on April 21, 2017 in conjunction with the change in the single discount rate,
and 5) For purposes of projecting future benefits, it is assumed that the full COLA is paid in all future years.
OUTFLOWS INFLOWSDifference between expected and actual experience 2,586$ 67,441$ Change of assumptions 730,323 - Net difference between projected and actual earnings on
pension plan investments 7,845 - Changes in proportion and differences between Charter School
contributions and proportionate share of contributions 225,461 - Charter School contributions subsequent to the measurement 136,667 -
Total 1,102,882$ 67,441$
JUNE 30, AMORTIZATION
2019 517,237$ 2020 349,343 2021 32,091 2022 103 2023 -
Thereafter - Total 898,774$

NOTES TO THE FINANCIAL STATEMENTS FINANCIAL SECTION JUNE 30, 2019 57 | P a g e
V. OTHER INFORMATION (cont’d)
B. Employee Retirement Plan (cont’d)
For the purposes of projecting future benefits, it is assumed that the full COLA is paid in all future years. The actuarial methods and assumptions used to determine contributions rates included in the measurement are as follows:
Actuarial Cost Method: Entry age normal
Amortization Method: Level Percentage of Payroll
Remaining Period: Amortized - closed 30 years from June 30, 2012 to June 30, 2042
Asset Valuation Method: 5 year smoothed market for funding valuation (fair value for financial valuation)
Inflation: 3.00%
Salary Increases: Composition: 2.50% inflation, plus 0.75% productivity increase rate, plus step rate promotional increases for members with less than 10 years of service
Investment Rate of Return: 7.25%
Single Discount Rate: 5.69%
Retirement Age: Experience based table of age and service rates
Mortality: Healthy Males – RP-2000 Combined Mortality Table with white collar adjustments, generational mortality improvements with scale BB.
Healthy Females – GRS Southwest Region Teacher Mortality Table, set back one year, generational mortality improvements in accordance with scale BB from the table's base year of 2012.
The long-term expected rate of return on pension plan investments is determined annually using a building-block approach that includes the following: 1) rate of return projections are the sum of current yield plus projected changes in price (valuation, defaults, etc.), 2) application of key economic projections (inflation, real growth, dividends, etc.), and 3) structural themes (supply and demand imbalances, capital flows, etc.). These items are developed for each major asset class. Best estimates of geometric real rates of return for each major asset class included in the Plan’s target asset allocation for 2018 and 2017 for 30-year return assumptions are summarized in the following table:
2018 2017 Long-Term Expected Long-Term Expected Asset Class Real Rate of Return Real Rate of Return Cash -0.49% -0.25% U.S. Treasuries -0.01% 0.25% IG Corp Credit 1.44% 1.75% Mortgage Backed Securities -0.01% 0.25% Core Bonds* 0.47% 0.75% Treasury Inflation Protected Securities 0.48% 0.50% High-Yield Bonds 2.13% 2.50% Bank Loans 2.16% 2.75% Global Bonds (Unhedged) -0.75% -0.50% Global Bonds (Hedged) -0.47% -0.38% Emerging Market Debt External 1.64% 2.50% Emerging Market Debt Local Currency 3.10% 3.25% Large Cap Equities 4.03% 4.25% Small/ Mid Cap Equities 4.24% 4.50% International Equities (Unhedged) 4.24% 4.50% International Equities (Hedged) 4.65% 4.89% Emerging International Equities 5.61% 6.25% Private Equity 5.92% 6.25% Private Debt 4.07% 4.75% Private Real Assets 4.24% 5.90% Real Estate 3.10% 3.25% Commodities 2.08% 2.25% Hedge Funds 2.97% 3.22%

FINANCIAL SECTION NOTES TO THE FINANCIAL STATEMENTS 58 | P a g e JUNE 30, 2019
V. OTHER INFORMATION (cont’d)
B. Employee Retirement Plan (cont’d)
Rate of Return
The long-term expected rate of return on pension plan investments is determined annually using a building-block approach that includes the following:
1) Rate of return projections are the sum of current yield plus projected changes in price (valuation, defaults, etc.), 2) Application of key economic projections (inflation, real growth, dividends, etc.), and 3) Structural themes (supply and demand imbalances, capital flows, etc.).
These items are developed for each major asset class.
Sensitivity of the Net Pension Liability to Changes in the Discount Rate Assumption
The following table shows the sensitivity of the net pension liability to changes in the discount rate as of fiscal year end 2018, 2017, and 2016. In particular, the table presents the Plan's net pension liability under the current single rate assumption, as if it were calculated using a discount rate one percentage point lower or one percentage point higher than the single discount rate.
C. Post-Retirement Health Care Benefits
Plan Description - The District, as an employer, contributes to the New Mexico Retiree Health Care Fund (RHCA), a cost-sharing multiple-employer defined benefit postemployment healthcare plan. The plan provides healthcare insurance and prescription drug benefits to retired employees of participating employers, their spouses, dependents, and surviving spouses and dependents. The RHCA Board was established by the Retiree Health Care Act (Chapter 10, Article 7C, NMSA 1978). The Board is responsible for establishing and amending benefit provisions of the healthcare plan and is also authorized to designate optional and/or voluntary benefits like dental, vision, supplemental life insurance, and long-term care policies. RHCA issues a separate, publicly available financial report that includes the financial statements and required supplementary information for the plan. That report may be obtained www.nmrhca.org, www.saonm.org, or by writing to:
Retiree Health Care Authority 4308 Carlisle NE, Suite 104 Albuquerque, NM 87107
PENSION CURRENT SINGLE RATE
Discount Single RateRate 1% Decrease Assumption 1% Increase
ERB (All Employers)2018 5.69% 15,454,175,919$ 11,891,330,976$ 8,984,271,849$ 2017 5.90% 14,466,972,041 11,113,468,217 8,372,251,980 2016 7.75% 9,531,509,131 7,196,433,561 5,258,980,529
Farmington Municipal Schools2018 5.69% 289,133,723$ 222,476,100$ 168,087,640$ 2017 5.90% 276,307,589 212,258,352 159,903,312 2016 7.75% 187,323,702 141,432,228 103,355,270
2018 5.69% 4,605,344$ 3,543,617$ 2,677,313$ 2017 5.90% 3,887,275 2,986,189 2,249,624 2016 7.75% 2,412,425 1,821,417 1,331,048
New Mexico Virtual Academy

NOTES TO THE FINANCIAL STATEMENTS FINANCIAL SECTION JUNE 30, 2019 59 | P a g e
V. OTHER INFORMATION (cont’d)
C. Post-Retirement Health Care Benefits (cont’d)
The plan is used to provide postemployment benefits other than pensions (OPEB) for retirees who were an employee of participating employer in either the New Mexico Public Employees Retirement Association (PERA) or Educational Retirement Board (ERB), eligible to receive a pension. For employers who “buy-in” to the plan, retirees are eligible for benefits six months after the effective date of employer participation. Retirees not in a PERA enhanced (Fire, Police, Corrections) pension plan who commence benefits on or after January 1, 2020 will not receive any subsidy from RHCA before age 55. Eligible retirees are: 1) retirees who make contributions to the fund for at least five years prior to retirement and whose eligible employer during
that period of time made contributions as a participant in the RHCA plan on the person’s behalf unless that person retires before the employer’s RHCA effective date, in which the event the time period required for employee and employer contributions shall become the period of time between the employer’s effective date and the date of retirement;
2) retirees defined by the Act who retired prior to July 1, 1990; 3) former legislators who served at least two years; and 4) former governing authority members who served at least four years.
There were 156,025 active, retired, surviving spouses, and inactive members in fiscal year 2018; there were 160,035 active, retired, surviving spouses, and inactive members in fiscal year 2017.
Funding Policy
The Retiree Health Care Act (Section 10-7C-13 NMSA 1978) authorizes the RHCA Board to establish the monthly premium contributions that retirees are required to pay for healthcare benefits. Each participating retiree pays a monthly premium according to a service-based subsidy rate schedule for the medical, plus basic life plan, plus an additional participation fee of five dollars ($5) if the eligible participant retired prior to the employer’s effective date or is a former legislator or former governing authority member. Former legislators and governing authority members are required to pay 100% of the insurance premium to cover their claims and the administrative expenses of the plan. The monthly premium rate schedule can be obtained from RHCA or viewed on their website at www.nmrhca.org.
The employer, employee and retiree contributions are required to be remitted to the RHCA on a monthly basis. The statutory requirements for the employer and employee contributions can be changed by the New Mexico State Legislature. Employers that choose to become participating employers after January 1, 1998, are required to make contributions to the fund in the amount determined to be appropriate by the Board.
The Retiree Health Care Act (Section 10-7C-15 NMSA 1978) is the statutory authority that establishes the required contributions of participating employers and their employees. For employees that were members of an enhanced retirement plan (state police and adult correctional officer member coverage plan 1; municipal police member coverage plans 3, 4 or 5; municipal fire member coverage plan 3, 4 or 5; municipal detention officer member coverage plan 1; and members pursuant to the Judicial Retirement Act) during the fiscal year ended June 30, 2013, the statute required each participating employer to contribute 2.5% of each participating employee’s annual salary; and each participating employee was required to contribute 1.25% of their salary. For employees that were not members of an enhanced retirement plan during the fiscal year ended June 30, 2014, the statute required each participating employer to contribute 2.0% of each participating employee’s annual salary; each participating employee was required to contribute 1.0% of their salary. In addition, pursuant to Section 10-7C-15(G) NMSA 1978, at the first session of the Legislature following July 1, 2013, the legislature shall review and adjust the distributions pursuant to Section 7-1-6.1 NMSA 1978 and the employer and employee contributions to the authority in order to ensure the actuarial soundness of the benefits provided under the Retiree Health Care Act.
Benefits Provided - Retirees and spouses are eligible for medical and prescription drug benefits. Dental and vision benefits are also available but were not included in any valuation since they are 100% retiree-paid. A description of these benefits may be found in Enrolled Participants at www.nmrhca.org.
Member Contributions – Employees that were not members of an enhanced plan, the statute required each participating employee was required to contribute 1% of their gross salary in fiscal year 2019.

FINANCIAL SECTION NOTES TO THE FINANCIAL STATEMENTS 60 | P a g e JUNE 30, 2019
V. OTHER INFORMATION (cont’d)
C. Post-Retirement Health Care Benefits (cont’d)
Employer Contributions – In fiscal year 2019, the District was required to contribute 2% of the gross covered salary for employees who are entitled to RHCA benefits. The District’s contributions to RHCA for the fiscal year ending June 30, 2019 was $1,045,721, which equal the amount of the required contributions for each fiscal year.
New Mexico Virtual Academy Charter School’s contributions to RHCA for the fiscal years ending June 30, 2019 was $19,658, which equal the amount of the required contributions for each fiscal year.
Employers - The Educational Retirement Act designates employers as Local Administrative Units, directly responsible for payment of compensation for the employment of members or participants of this Plan. There were 302 contributing employers in fiscal year 2018.
Liabilities, Deferred Outflows of Resources, Deferred Inflows of Resources, and Expense Related to OPEB
Farmington Municipal Schools
At June 30, 2019, the District reported a liability of $54,156,585 for its proportionate share of the net OPEB liability. The net OPEB liability was measured as of June 30, 2018, and the total OPEB liability used to calculate the net OPEB liability was determined by an actuarial valuation as of that date. The District 's proportion of the net OPEB liability was based on a projection of the District 's long-term share of contributions to the OPEB plan relative to the projected contributions of all participating school districts, actuarially determined. At June 30, 2018, the District's proportion was 1.24545 percent, which was a decrease of 0.02157 percent from its proportion measured as of June 30, 2017.
For the year ended June 30, 2019, the District recognized OPEB income of $300,823.
At June 30, 2019, the District reported deferred outflows of resources and deferred inflows of resources related to OPEB from the following sources:
OPEB EXPENSE/(INCOME) CALCULATIONNet OPEB liability - end of the year 54,156,585$ Net OPEB liability - beginning of the year (57,417,203) Deferred outflows of resources during the year - Deferred inflows of resources during the year 1,915,216 Reductions to ending net OPEB liability due contributions paid 1,044,579 Total OPEB Income (300,823)$
OUTFLOWS INFLOWSDifference between expected and actual experience -$ 3,206,417$ Change of assumptions - 10,110,794 Net difference between projected and actual earnings on
OPEB plan investments - 675,854 Changes in proportion and differences between District
contributions and proportionate share of contributions - 990,172 District contributions subsequent to the measurement date 1,129,703 -
Total 1,129,703$ 14,983,237$

NOTES TO THE FINANCIAL STATEMENTS FINANCIAL SECTION JUNE 30, 2019 61 | P a g e
V. OTHER INFORMATION (cont’d)
C. Post-Retirement Health Care Benefits (cont’d)
Deferred outflows of resources related to OPEB in the amount of $1,045,721 resulted from District contributions subsequent to the measurement date will be recognized as a reduction of the net OPEB liability in the year ended June 30, 2019. Amounts reported as deferred outflows of resources and deferred inflows of resources related to OPEB will be recognized in OPEB expense as follows:
New Mexico Virtual Academy (Component Unit)
At June 30, 2019, the Charter School reported a liability of $847,929 for its proportionate share of the net OPEB liability. The net OPEB liability was measured as of June 30, 2018, and the total OPEB liability used to calculate the net OPEB liability was determined by an actuarial valuation as of that date. The Charter School's proportion of the net OPEB liability was based on a projection of the Charter School's long-term share of contributions to the OPEB plan relative to the projected contributions of all participating school districts, actuarially determined. At June 30, 2018, the Charter School’s proportion was 0.0195 percent, which was an increase of 0.00015 percent from its proportion measured as of June 30, 2017.
For the year ended June 30, 2019, the Charter School recognized OPEB expense of $334.
At June 30, 2019, the Charter School reported deferred outflows of resources and deferred inflows of resources related to OPEB from the following sources:
JUNE 30, AMORTIZATION
2020 3,765,118$ 2021 3,765,118 2022 3,765,118 2023 2,955,399 2024 732,484
Thereafter - Total 14,983,237$
Net OPEB liability - end of the year 847,929$ Net OPEB liability - beginning of the year (876,879) Deferred outflows of resources during the year (6,886) Deferred inflows of resources during the year 19,514 Reductions to ending net OPEB liability due contributions paid 16,656 Total OPEB Expense 334$
OPEB EXPENSE CALCULATION
OUTFLOWS INFLOWSDifference between expected and actual experience -$ 50,203$ Change of assumptions - 158,305 Net difference between projected and actual earnings on
OPEB plan investments - 10,582 Changes in proportion and differences between Charter School
contributions and proportionate share of contributions 6,886 - Charter School contributions subsequent to the measurement 19,658 -
Total 26,544$ 219,090$

FINANCIAL SECTION NOTES TO THE FINANCIAL STATEMENTS 62 | P a g e JUNE 30, 2019
V. OTHER INFORMATION (cont’d)
C. Post-Retirement Health Care Benefits (cont’d)
Deferred outflows of resources related to OPEB in the amount of $19,658 resulted from Charter School contributions subsequent to the measurement date will be recognized as a reduction of the net OPEB liability in the year ended June 30, 2019. Amounts reported as deferred outflows of resources and deferred inflows of resources related to OPEB will be recognized in OPEB expense as follows:
Actuarial Assumptions
The projection of cash flows used to determine the discount rate assumed that employer contributions will be made at rates proportional to the actuary determined contribution rates. For this purpose, employer contributions that are intended to fund benefits of current plan members and their beneficiaries are included. Projected employer contributions that are intended to fund the service costs for future plan members and their beneficiaries are not included. Based on those assumptions, the OPEB plan's fiduciary net position was projected to be available to make all projected future benefit payments for current plan members through the fiscal year ending June 30, 2028.
A blended rate of the assumed investment return on Plan assets (e.g. 7.25% for the June 30, 2019 valuation) and the rate for 20-year, tax-exempt general obligation municipal bonds with an average rating of AA/Aa or higher (e.g. 3.58% as of June 30, 2017). The 7.25% discount rate was used to calculate the net OPEB liability through June 30, 2029. Benefit payments after June 30, 2029 are then discounted by the index rate for 20-year, tax exempt general obligation municipal bonds with an average rating of AA/Aa or higher, currently 4.08%. The blended discount rate of 4.08% was used to measure the total OPEB liability as of June 30, 2018.
The total OPEB liability was determined by an actuarial valuation as of June 30, 2017 using the following actuarial assumptions:
Valuation Date: June 30, 2017
Actuarial Cost Method: Entry age normal, level percent of pay, calculated on individual employee basis
Amortization Method: 30-year open-ended amortization, level percent of payroll
Remaining Period: 30 years as of June 30, 2016
Asset Valuation Method: Market value of assets
Actuarial assumptions
Inflation: 2.50% for ERB; 2.25% for PERA
Projected Salary Increases: 3.5% to 12.50% based on years of service, including inflation
Investment Rate of Return: 7.25%, net of OPEB plan investment expense and margin for adverse deviation including inflation
Health Care Cost Trend Rate: 8% graded down to 4.5% over 14 years for Non-Medicare medical plan costs and 7.5% graded down to 4.5% over 12 for Medicare medical plan costs
JUNE 30, AMORTIZATION
2019 (54,207)$ 2020 (54,207) 2021 (54,207) 2022 (41,529) 2023 (8,054)
Thereafter - Total (212,204)$

NOTES TO THE FINANCIAL STATEMENTS FINANCIAL SECTION JUNE 30, 2019 63 | P a g e
IV. OTHER INFORMATION (cont’d)
C. Post-Retirement Health Care Benefits (cont’d)
Rate of Return
The long-term expected rate of return on OPEB plan investments was determined using a building-block method in which the expected future real rates of return (net of investment fees and inflation) are developed for each major asset class. These returns are combined to produce the long-term expected rate of return by weighting the expected future real rates of return by the target asset allocation percentage, adding expected inflation and subtracting expected investment expenses and a risk margin. The target allocation and projected arithmetic real rates of return for each major asset class, after deducting inflation, but before investment expenses, used in the derivation of the long-term expected investment rate of return assumptions. The target allocation and best estimates for the long-term expected rate of return is summarized as follows:
2018 2017 Long-Term Expected Long-Term Expected Asset Class Real Rate of Return % Real Rate of Return % U.S. core fixed income 2.1 9.1 U.S. equity - large cap 7.1 9.1 Non U.S. - emerging markets 10.2 12.2 Non U.S. - developed equities 7.8 9.8 Private equity 11.8 13.8 Credit and structured finance 5.3 7.3 Real estate 4.9 6.9 Absolute return 4.1 6.1 U.S. equity - small/mid cap 7.1 9.1
Sensitivity of the Net OPEB Liability to Changes in the Discount Rate Assumption
The following table shows the sensitivity of the net OPEB liability to changes in the discount rate as of June 30, 2018. In particular, the table presents the Plan's net OPEB liability under the current single rate assumption, as if it were calculated using a discount rate one percentage point lower (1% decrease) or one percentage point higher (1% increase) than the single discount rate.
OPEB CURRENT SINGLE RATE
Discount Single RateRate 1% Decrease Assumption 1% Increase
RHCA (All Employers)2018 4.08% 5,262,533,266$ 4,348,354,815$ 3,627,778,443$ 2017 3.81% 5,496,848,763 4,531,673,018 3,774,405,896
Farmington Municipal Schools2018 4.08% 65,542,221$ 54,156,585$ 45,182,167$ 2017 3.81% 69,646,173 57,417,203 47,822,478
2018 4.08% 1,026,194$ 847,929$ 707,417$ 2017 3.81% 1,063,640 876,879 730,348
New Mexico Virtual Academy

FINANCIAL SECTION NOTES TO THE FINANCIAL STATEMENTS 64 | P a g e JUNE 30, 2019
IV. OTHER INFORMATION (cont’d)
C. Post-Retirement Health Care Benefits (cont’d)
The following presents the Net OPEB Liability of RHCA as of June 30, 2018, as well as what the Fund’s Net OPEB Liability would be if it were calculated using a health cost trend rate that is one percentage point lower (1% decrease) or one percentage point higher (1% increase) than the health cost trend rates used.
D. Contingent Liabilities
Amounts received or receivable from grant agencies are subject to audit and adjustment by grantor agencies, principally the federal government. Any disallowed claims, including amounts already collected, may constitute a liability of the applicable funds. The amount, if any, of expenditures that may be disallowed by the grantor cannot be determined at this time, although the government expects such amounts, if any, to be immaterial.
The government is a defendant in various lawsuits. Although the outcome of these lawsuits is not presently determinable, in the opinion of the government’s counsel the resolution of these matters will not have a material adverse effect on the financial condition of the government.
E. Cash Flows
The District’s federal and state grants operate on a reimbursement basis. The District must support the expenditures of these grants with monies from the unrestricted operating monies. Operating on a reimbursement basis for these grants in its self does not adversely affect the District’s ability to operate effectively. However, the time it takes to receive reimbursement, if extensive, does significantly affect the District’s cash flows and the ability to deliver educational services to the community in an effective manner. This could affect the District’s financial operations in subsequent years.
F. Subsequent Events
Farmington Municipal Schools has currently elected not to renew the Charter School’s under the district. If sponsorship is not found the Charter School will end operations on June 30, 2019. However, there have been residual activity subsequent to the yearend in order finalize the closing.
Subsequent events were evaluated through November 6, 2019 which is the date the financial statements were available to be issued.
HEALTH COST TREND RATE
Current1% Decrease Trend Rates 1% Increase
RHCA (All Employers)2018 3,675,884,346$ 4,348,354,815$ 4,875,586,778$
Farmington Municipal Schools2018 45,781,302$ 54,156,585$ 60,722,996$
2018 716,797$ 847,929$ 950,739$ New Mexico Virtual Academy

REQUIRED SUPPLEMENTARY INFORMATION FINANACIAL SECTION JUNE 30, 2019 65 | P a g e
SCHEDULE OF THE PROPORTIONATE SHARE OF THE NET PENSION LIABILITY (FARMINGTON MUNICIPAL SCHOOL DISTRICT)
Educational Retirement Board (ERB) Pension Plan Last 10 Fiscal Years*
* These schedules are intended to present 10 years of trending history. However, information is not available prior to the year ended June 30, 2015 and, until a full 10-year trend is compiled, the District will present information for those years for which information is available.
SCHEDULE OF THE PENSION CONTRIBUTIONS (FARMINGTON MUNICIPAL SCHOOL DISTRICT)
Educational Retirement Board (ERB) Pension Plan Last 10 Fiscal Years*
* These schedules are intended to present 10 years of trending history. However, information is not available prior to the year ended June 30, 2015 and, until a full 10-year trend is compiled, the District will present information for those years for which information is available.
June 30, 2019 2018 2017 2016 2015
Measurement date June 30, 2018 2017 2016 2015 2014District's proportion of the net pension liability 1.870910% 1.909920% 1.965310% 2.008370% 1.958300%District's proportionate share of the net pension liability 22,476,100$ 212,258,352$ 141,432,228$ 130,087,473$ 111,735,344$ District's covered-employee payroll 5,287,060$ 54,402,833$ 56,130,511$ 57,084,325$ 53,977,809$
District's proportionate share of the net pension liability as a percentage of its covered-employee payroll 425.12% 390.16% 251.97% 227.89% 207.00%
Plan fiduciary net position as a percentage of the total pension liability 52.17% 52.95% 61.58% 63.97% 66.54%
June 30, 2019 2018 2017 2016 2015
Contractually required contribution 7,859,226$ 7,267,901$ 7,564,470$ 7,800,895$ 7,934,721$
Contributions in relation to the contractually required (7,859,226) (7,258,813) (7,564,470) (7,800,895) (7,935,390)
Contribution deficeiency (excess) -$ 9,088$ -$ -$ (669)$
District's Covered-employee Payroll 56,541,199$ 52,287,060$ 54,402,833$ 56,130,511$ 57,084,325$
Contribution as a percentage of covered-employee payroll 13.90% 13.88% 13.90% 13.90% 13.90%

FINANCIAL SECTION REQUIRED SUPPLEMENTARY INFORMATION 66 | P a g e JUNE 30, 2019
SCHEDULE OF THE PROPORTIONATE SHARE OF THE NET OPEB LIABILITY (FARMINGTON MUNICIPAL SCHOOL DISTRICT)
Retiree Health Care Authority (RHCA) OPEB Plan Last 10 Fiscal Years*
* These schedules are intended to present 10 years of trending history. However, information is not available prior to the year ended June 30, 2018 and, until a full 10-year trend is compiled, the District will present information for those years for which information is available.
SCHEDULE OF THE OPEB CONTRIBUTIONS (FARMINGTON MUNICIPAL SCHOOL DISTRICT)
Retiree Health Care Authority (RHCA) OPEB Plan Last 10 Fiscal Years*
* These schedules are intended to present 10 years of trending history. However, information is not available prior to the year ended June 30, 2018 and, until a full 10-year trend is compiled, the District will present information for those years for which information is available.
June 30, 2019 2018
Measurement date June 30, 2018 2017District's proportion of the net OPEB liability 1.245450% 1.267020%District's proportionate share of the net OPEB liability 54,156,585$ 57,417,203$ District's covered-employee payroll 52,286,029$ 54,392,248$
District's proportionate share of the net OPEB liability as a percentage of its covered-employee payroll 103.58% 105.56%
Plan fiduciary net position as a percentage of the total OPEB liability 13.14% 11.34%
June 30, 2019 2018
Contractually required contribution 1,129,703$ 1,044,579$
Contributions in relation to the contractually required (1,129,703) (1,044,579)
Contribution deficeiency (excess) -$ -$
District's Covered-employee Payroll 56,536,623$ 52,286,029$
Contribution as a percentage of covered-employee payroll 2.00% 2.00%

REQUIRED SUPPLEMENTARY INFORMATION FINANACIAL SECTION JUNE 30, 2019 67 | P a g e
SCHEDULE OF THE PROPORTIONATE SHARE OF THE NET PENSION LIABILITY (NEW MEXICO VIRTUAL ACADEMY)
Educational Retirement Board (ERB) Pension Plan Last 10 Fiscal Years*
* These schedules are intended to present 10 years of trending history. However, information is not available prior to the year ended June 30, 2015 and, until a full 10-year trend is compiled, the District will present information for those years for which information is available.
SCHEDULE OF THE PENSION CONTRIBUTIONS (NEW MEXICO VIRTUAL ACADEMY)
Educational Retirement Board (ERB) Pension Plan Last 10 Fiscal Years*
* These schedules are intended to present 10 years of trending history. However, information is not available prior to the year ended June 30, 2015 and, until a full 10-year trend is compiled, the District will present information for those years for which information is available.
June 30, 2019 2018 2017 2016 2015
Measurement date June 30, 2018 2017 2016 2015 2014
Charter School's proportion of the net pension liability 0.026870% 0.025310% 0.024580% 0.024680% 0.021290%
Charter School's proportionate share of the net pension liability (3,543,617)$ 2,986,189$ 1,821,417$ 1,592,112$ 1,408,166$ Charter School's covered-employee payroll 832,783$ 796,080$ 722,915$ 671,113$ 680,233$
Charter School's proportionate share of the net pension liability as a percentage of its covered-employee payroll -425.52% 375.11% 251.95% 237.23% 207.01%
Plan fiduciary net position as a percentage of the total pension liability 52.17% 52.95% 61.58% 63.97% 66.54%
June 30, 2019 2018 2017 2016 2015
Contractually required contribution 136,666$ 115,756$ 110,655$ 100,485$ 93,284$ Contributions in relation to the contractually required (136,666) (115,756) (110,655) (100,485) (93,284) Contribution deficeiency (excess) -$ -$ -$ -$ -$
Charter School's Covered-employee Payroll 983,213$ 832,783$ 796,080$ 722,915$ 671,113$
Contribution as a percentage of covered-employee payroll 13.90% 13.90% 13.90% 13.90% 13.90%

FINANCIAL SECTION REQUIRED SUPPLEMENTARY INFORMATION 68 | P a g e JUNE 30, 2019
SCHEDULE OF THE PROPORTIONATE SHARE OF THE NET OPEB LIABILITY (NEW MEXICO VIRTUAL ACADEMY)
Retiree Health Care Authority (RHCA) OPEB Plan Last 10 Fiscal Years*
* These schedules are intended to present 10 years of trending history. However, information is not available prior to the year ended June 30, 2018 and, until a full 10-year trend is compiled, the District will present information for those years for which information is available.
SCHEDULE OF THE OPEB CONTRIBUTIONS (NEW MEXICO VIRTUAL ACADEMY)
Retiree Health Care Authority (RHCA) OPEB Plan Last 10 Fiscal Years*
* These schedules are intended to present 10 years of trending history. However, information is not available prior to the year ended June 30, 2018 and, until a full 10-year trend is compiled, the District will present information for those years for which information is available.
June 30, 2019 2018
Measurement date June 30, 2018 2017Charter School's proportion of the net OPEB liability 0.019500% 0.019350%
Charter School's proportionate share of the net OPEB liability 847,929$ 876,879$ Charter School's covered-employee payroll 832,783$ 796,080$
Charter School's proportionate share of the net OPEB liability as a percentage of its covered-employee payroll 101.82% 110.15%
Plan fiduciary net position as a percentage of the total OPEB liability 13.14% 11.34%
June 30, 2019 2018
Contractually required contribution 19,658$ 16,655$ Contributions in relation to the contractually required (19,658) (16,655) Contribution deficeiency (excess) -$ -$
Charter School's Covered-employee Payroll 982,902$ 832,778$
Contribution as a percentage of covered-employee payroll 2.00% 2.00%

REQUIRED SUPPLEMENTARY INFORMATION FINANACIAL SECTION JUNE 30, 2019 69 | P a g e
NOTES TO REQUIRED SUPPLEMENTARY INFORMATION For the Year Ended June 30, 2019
Changes of benefit terms: The COLA and retirement eligibility benefits changes in recent years are described in the Benefits Provided subsection of the financial statement note disclosure General Information on the Pension Plan. Changes of assumptions: ERB conducts an actuarial experience study for the Plan on a biennial basis. Based on the six-year actuarial experience study presented to the Board of Trustees on June 30, 2016. There were no modifications to the benefit provisions that were reflected in the actuarial valuation as of June 30, 2018.
Assumptions that were not changed: a. Wage inflation 3.25% b. Payroll growth 3.00% c. COLA assumption 1.90% per year d. Salary increases at 2.50% inflation, plus 0.75% productivity increase rate, plus step-rate promotional increases for less than
ten years of service e. Inflation rate 2.50% f. Investment return 7.25%
See also the Note VI (B) Actuarial Assumptions of the financial statement note disclosure on the Pension Plan.
Changes of assumptions: RHCA conducts an actuarial experience study for the Plan on a biennial basis. Based on the six-year actuarial experience study presented to the Board of Trustees on June 30, 2017, RHCA implemented the following changes in assumptions for fiscal years 2018 and 2017.
The total OPEB liability as of June 30, 2018 was determined by an actuarial valuation as of June 30, 2018. The mortality, retirement, disability, turnover and salary increase assumptions are based on the PERA annual valuation as of June 30, 2017 and the ERB actuarial experience study as of June 30, 2017.
1) Fiscal year 2018 valuation assumptions that changed based on this study: a. Minor changes to demographic assumptions
2) Assumptions that were not changed: a. Investment return 7.25% b. Inflation rate 2.50% for ERB and 2.25 for PERA c. Population growth per year at 0.00% d. Health care cost trend rate 8% graded down to 4.5% over 14 years for Non-Medicare medical plan costs and 7.5%
See also the Note IV (C) Actuarial Assumptions of the financial statement note disclosure on the OPEB Plan.

70 | P a g e
THIS PAGE INTENTIONALLY LEFT BLANK

FINANACIAL SECTION 71 | P a g e
OTHER SUPPLEMENTAL INFORMATION OF
FARMINGTON MUNICIPAL SCHOOL DISTRICT NO. 5
AS OF AND FOR THE YEAR ENDED
JUNE 30, 2019

FINANACIAL SECTION 72 | P a g e
THIS PAGE INTENTIONALLY LEFT BLANK

FINANACIAL SECTION 73 | P a g e
OTHER SUPPLEMENTAL INFORMATION (GENERAL FUNDS)
Operating Fund (Fund No. 11000)
The government’s primary fund. It accounts for all financial resources of the general government, except those required to be accounted for in another fund.
Transportation Fund (Fund No. 13000)
Accounts for all the Transportation funds received through the state that are used in the maintaining and operating vehicles used to transport students.
Instructional Materials Fund (Fund No. 14000)
Accounts for all the Instructional Materials funds received through the state for the purpose of acquiring study materials for the students.

STATE OF NEW MEXICO
FARMINGTON MUNICIPAL SCHOOL DISTRICT NO. 5
GENERAL FUNDSCombining Balance Sheet
June 30, 2019
Operational TransportationInstructional
Materials Total GeneralFund #11000 Fund #13000 Fund #14000 Funds
AssetsCash and cash equivalents 3,609,407$ 173,761$ 438,767$ 4,221,935$ Receivables:
Property taxes 38,703 - - 38,703 Due from other governments 7,935 - - 7,935 Due from other funds 5,541,120 - - 5,541,120 Parts inventory - 174,568 - 174,568
Total assets 9,197,165$ 348,329$ 438,767$ 9,984,261$
Liabilities, deferred inflows and fund balanceLiabilities:
Accounts payable 311,845$ 1,357$ -$ 313,202$ Accrued salaries 1,501,745 - - 1,501,745
Total liabilities 1,813,590 1,357 - 1,814,947
Deferred inflows of resources:Delinquent property taxes 32,570 - - 32,570
Fund balance:Non-spendable:
Inventories - 174,568 - 174,568 Unassigned 7,351,005 172,404 438,767 7,962,176
Total fund balance 7,351,005 346,972 438,767 8,136,744 Total liabilities, deferred inflows of resources, and fund balance 9,197,165$ 348,329$ 438,767$ 9,984,261$
FINANCIAL SECTION
74 | P a g e
The notes to the financial statements are an integral part of this statement.

STATE OF NEW MEXICO
FARMINGTON MUNICIPAL SCHOOL DISTRICT NO. 5
GENERAL FUNDSCombining Schedule of Revenues, Expenditures, and
Changes in Fund Balance
Year Ended June 30, 2019
General Funds
Operational TransportationInstructional
Materials Total GeneralFund #11000 Fund #13000 Fund #14000 Fund
Revenues:
Taxes:
Property 572,576$ -$ -$ 572,576$
Oil and gas 26,955 - - 26,955
Intergovernmental - federal grants 120,378 - - 120,378
Intergovernmental - state grants 79,067,743 3,262,948 370,113 82,700,804
Contributions - private grants 89,500 - - 89,500
Charges for services 85,813 - - 85,813
Investment and interest income 23 - - 23
Miscellaneous 199,321 - - 199,321
Total revenue 80,162,309 3,262,948 370,113 83,795,370
Expenditures:
Current:
Instruction 51,125,619 - 64,174 51,189,793
Support services:
Students 9,909,386 - - 9,909,386
Instruction 1,499,469 - - 1,499,469
General Administration 1,622,429 - - 1,622,429
School Administration 4,889,672 - - 4,889,672
Central Services 1,099,141 - - 1,099,141
Operation & Maintenance of Plant 9,383,015 - - 9,383,015
Student transportation - 2,994,810 - 2,994,810
Community services 12,258 - - 12,258
Capital outlay - 55,096 - 55,096 Total expenditures 79,540,989 3,049,906 64,174 82,655,069
Excess of revenues over expenditures 621,320 213,042 305,939 1,140,301
Other financing uses:
Transfers out (23,755) - - (23,755)
Net change in fund balance 597,565 213,042 305,939 1,116,546
Fund balance at beginning of the year 6,753,440 133,930 132,828 7,020,198 Fund balance at end of the year 7,351,005$ 346,972$ 438,767$ 8,136,744$
GENERAL FUND FINANCIAL SECTION
75 | P a g e

STATE OF NEW MEXICO
FARMINGTON MUNICIPAL SCHOOL DISTRICT NO. 5
OPERATIONAL FUND - NO. 11000Schedule of Revenues, Expenditures, and
Changes in Fund Balance - Budget and Actual (Non-GAAP Budgetary Basis)
Year Ended June 30, 2019
Variance with Final Budget
Budgeted Amounts Actual Amounts Positive
Original Final (Budgetary Basis) (Negative)Revenues:
Taxes:Property 556,217$ 556,217$ 570,153$ 13,936$ Oil and gas 24,830 24,830 27,914 3,084
Intergovernmental - federal grants 107,363 107,363 120,378 13,015 Intergovernmental - state grants 78,467,048 79,066,399 79,067,743 1,344 Contributions - private grants 70,250 70,250 89,500 19,250 Charges for services 70,250 70,250 85,813 15,563 Investment and interest income 17 17 23 6 Miscellaneous 124,249 124,249 199,321 75,072
Total revenues 79,420,224 80,019,575 80,160,845 141,270
Expenditures:Current:
Instruction 54,128,889 54,128,889 51,098,719 3,030,170 Support services: Students 9,289,622 10,628,973 9,894,038 734,935 Instruction 1,167,561 1,167,561 1,495,893 (328,332) General Administration 1,446,991 1,631,991 1,622,891 9,100 School Administration 4,950,160 4,950,160 4,889,672 60,488 Central Services 2,235,361 2,235,361 1,091,479 1,143,882 Operation & Maintenance of Plant 10,511,962 11,014,962 9,194,873 1,820,089 Other Support services 100,078 100,078 - 100,078 Community services 12,410 12,410 12,258 152
Capital outlay 2,227,413 799,413 7 799,406 Total expenditures 86,070,447 86,669,798 79,299,830 7,369,968
Excess (deficiency) of revenues over expenditures (6,650,223) (6,650,223) 861,015 7,511,238
Other financing uses:Transfers out - - (23,755) (23,755)
Net change in fund balance (6,650,223) (6,650,223) 837,260 7,487,483
Beginning cash balance budgeted 6,650,223 6,650,223 - (6,650,223)
Fund balance at beginning of the year - - 6,753,440 6,753,440
Fund balance at end of the year -$ -$ 7,590,700 7,590,700$
RECONCILIATION TO GAAP BASIS:Change in property tax receivable (69) Change in due from other governments 298 Change in payables (241,160) Change in deferred property taxes 1,236
Fund balance at end of the year (GAAP basis) 7,351,005$
FINANCIAL SECTION
76 | P a g eGENERAL FUND

STATE OF NEW MEXICO
FARMINGTON MUNICIPAL SCHOOL DISTRICT NO. 5
TRANSPORTATION FUND - NO. 13000Schedule of Revenues, Expenditures, and
Changes in Fund Balance - Budget and Actual (Non-GAAP Budgetary Basis)
Year Ended June 30, 2019
Variance with Final Budget
Budgeted Amounts Actual Amounts Positive
Original Final (Budgetary Basis) (Negative)Revenues:
Intergovernmental - state grants 3,262,948$ 3,262,948$ 3,262,948$ -$
Expenditures:Current:
Support services: Student transportation 3,262,948 3,222,008 3,064,210 157,798
Capital outlay - 56,000 55,096 904 Total expenditures 3,262,948 3,278,008 3,119,306 158,702
Excess (deficiency) of revenues over expenditures - (15,060) 143,642 158,702
Beginning cash balance budgeted - 15,060 - (15,060)
Fund balance at beginning of the year - - 133,930 133,930
Fund balance at end of the year -$ -$ 277,572 277,572$
RECONCILIATION TO GAAP BASIS:Change in inventory 70,168 Change in payables (768)
Fund balance at end of the year (GAAP basis) 346,972$
GENERAL FUND FINANCIAL SECTION
77 | P a g e

STATE OF NEW MEXICO
FARMINGTON MUNICIPAL SCHOOL DISTRICT NO. 5
INSTRUCTIONAL MATERIALS FUND - NO. 14000Schedule of Revenues, Expenditures, and
Changes in Fund Balance - Budget and Actual (Non-GAAP Budgetary Basis)
Year Ended June 30, 2019
Variance with Final Budget
Budgeted Amounts Actual Amounts Positive
Original Final (Budgetary Basis) (Negative)Revenues:
Intergovernmental - state grants 370,113$ 399,852$ 370,113$ (29,739)$
Expenditures:Current:
Instruction 370,113 532,680 64,174 468,506
Excess (deficiency) of revenues over expenditures - (132,828) 305,939 438,767
Beginning cash balance budgeted - 132,828 - (132,828)
Fund balance at beginning of the year - - 132,828 132,828
Fund balance at end of the year -$ -$ 438,767 438,767$
RECONCILIATION TO GAAP BASIS:Change in payables -
Fund balance at end of the year (GAAP basis) 438,767$
FINANCIAL SECTION
78 | P a g eGENERAL FUND

FINANACIAL SECTION 79 | P a g e
OTHER SUPPLEMENTAL INFORMATION (MAJOR CAPITAL PROJECTS FUNDS
AND MAJOR DEBT SERVICE FUND)
Budgetary statements for funds that meet the requirements of GASB Statement No. 34, Basic Financial Statements and Management’s Discussion
and Analysis to be considered major funds but are not considered special revenue funds.

STATE OF NEW MEXICO
FARMINGTON MUNICIPAL SCHOOL DISTRICT NO. 5
BOND BUILDING FUND - NO. 31100
Schedule of Revenues, Expenditures, and
Changes in Fund Balance - Budget and Actual (Non-GAAP Budgetary Basis)
Year Ended June 30, 2019
Variance with Final Budget
Budgeted Amounts Actual Amounts Positive
Original Final (Budgetary Basis) (Negative)Revenues:
Investment and interest income 10,000$ 10,000$ 135,435$ 125,435$
Expenditures:Current:
Support services: Operation & Maintenance of Plant 1,096,971 1,196,971 565,547 631,424
Capital outlay 5,270,984 16,170,984 8,478,903 7,692,081 Total expenditures 6,367,955 17,367,955 9,044,450 8,323,505
Excess (deficiency) of revenues over expenditures (6,357,955) (17,357,955) (8,909,015) 8,448,940
Other financing sources:Sale of bonds - 11,000,000 11,000,000 -
Net change in fund balance (6,357,955) (6,357,955) 2,090,985 8,448,940
Beginning cash balance budgeted 6,357,955 6,357,955 - (6,357,955)
Fund balance at beginning of the year - - 4,010,114 4,010,114
Fund balance at end of the year -$ -$ 6,101,099 6,101,099$
RECONCILIATION TO GAAP BASIS:Change in payables (519,064)
Fund balance at end of the year (GAAP basis) 5,582,035$
FINANCIAL SECTION
80 | P a g eMAJOR CAPITAL PROJECTS FUND

STATE OF NEW MEXICO
FARMINGTON MUNICIPAL SCHOOL DISTRICT NO. 5
DEBT SERVICE FUND - NO. 41000
Schedule of Revenues, Expenditures, and
Changes in Fund Balance - Budget and Actual (Non-GAAP Budgetary Basis)
Year Ended June 30, 2019
Variance with Final Budget
Budgeted Amounts Actual Amounts Positive
Original Final (Budgetary Basis) (Negative)Revenues:
Taxes:Property 8,577,738$ 8,577,738$ 7,889,746$ (687,992)$ Oil and gas 193,978 193,978 186,815 (7,163)
Investment and interest income 510 510 1,021 511 Total revenues 8,772,226 8,772,226 8,077,582 (694,644)
Expenditures:Current:
Support services: General Administration 85,777 87,777 78,897 8,880
Debt service:Principal retirement 5,725,000 5,725,000 5,725,000 - Bond interest paid 2,442,699 2,439,199 2,437,987 1,212 Debt service reserves 7,730,020 7,730,020 - 7,730,020 Other - 1,500 1,443 57
Total expenditures 15,983,496 15,983,496 8,243,327 7,740,169
Excess (deficiency) of revenues over expenditures (7,211,270) (7,211,270) (165,745) 7,045,525
Beginning cash balance budgeted 7,211,270 7,211,270 - (7,211,270)
Fund balance at beginning of the year - - 9,954,947 9,954,947
Fund balance at end of the year -$ -$ 9,789,202 9,789,202$
RECONCILIATION TO GAAP BASIS:Change in property tax receivable 18,581 Change in due from other governments 14,791 Change in deferred property taxes 8,342
Fund balance at end of the year (GAAP basis) 9,830,916$
MAJOR DEBT SERVICE FUND FINANCIAL SECTION
81 | P a g e

THIS PAGE INTENTIONALLY LEFT BLANK
FINANCIAL SECTION
82 | P a g e

FINANACIAL SECTION 83 | P a g e
OTHER SUPPLEMENTAL INFORMATION (NONMAJOR GOVERNMENTAL FUNDS)
Funds that did not meet the requirements of GASB Statement No.
34, Basic Financial Statements and Management’s Discussion and Analysis to be considered Major Funds and have not been identified as Major
Funds by management.

FINANACIAL SECTION 84 | P a g e
THIS PAGE INTENTIONALLY LEFT BLANK

NONMAJOR GOVERNMENTAL FUNDS FINANCIAL SECTION JUNE 30, 2019 85 | P a g e
Nonmajor Special Revenue Funds
Special revenue funds are operating funds used to account for the proceeds of specific revenue sources that are intended for specific purposes other than special assessments or major capital projects.
Food Services (Fund No. 21000) Minimum Balance: None This program provides financing for the school breakfast and lunch program. Funding is provided from fees from patrons and USDA food reimbursements, under the National School Lunch Act of 1946, as amended, Public Law 79-396, Sections 2-12, 60 Stat. 230, 42 U.S.C. 1751 et seq.; 80 stat. 889, as amended; 84 stat. 270; and the Child Nutrition Act of 1966, as amended, Sections 4 and 10. Public Law 89-642, 80 sat. 886, 889, 42 U.S.C. 1773, 1779; Public Law 99-591, 100 stat. 3341; Public Law 100-71, 101 stat. 430.
Athletics (Fund No. 22000) Minimum Balance: None This fund provides financing for school athletic activities. Funding is provided by fees from patrons.
Activities (Fund No. 23000) Minimum Balance: None To account for revenue and expenditures associated with the District's non-instructional support activities (primarily after-school activities).
Javits Gifted & Talented (Fund No. 24102) Minimum Balance: None The purpose of this program is to meet the special education needs of gifted and talented students. The major emphasis of the program is on serving students traditionally underrepresented in gifted and talented programs, particularly economically disadvantaged, limited English proficient (LEP), and disabled students, to help reduce the serious gap in achievement among certain groups of students at the highest levels of achievement. Authorization: Elementary and Secondary Education Act of 1965, as amended, Title V, Part D, Subpart 6.
New Mexico Autism (Fund No. 24108) Minimum Balance: None Program is to provide grants to states that flow-through to schools, to assist them in providing a free appropriate public education to all children with disabilities. The program is funded by the United States government, under the Individuals with Disabilities Education Act, Part B, Section 611-617, and part D, Section 674 as amended, 20 U.S.C. 1711-1417 and 1420.
Preschool IDEA-B (Fund No. 24109) Minimum Balance: None The Preschool program is for the purpose of enhancing Special Education for handicapped children from ages 3 to 5. The program is funded by the United States government, under the Individuals With Disabilities Act, Part B, Section 619, as amended, Public Laws 94-142, 99-457, 100-630, 101-497, and 101-476.
Education of Homeless (Fund No. 24113) Minimum Balance: None To ensure that all homeless children and youth have equal access to the same free, appropriate public education available to other children, the Education for Homeless Children and Youth program provides assistance to States, Outlying Areas, and the Department of Interior/Bureau of Indian Education (BIE) to: (1) establish or designate an Office of Coordinator of Education of Homeless Children and Youths; (2) develop and carry out a State plan for the education of homeless children; and (3) make subgrants to local educational agencies to support the education of those children. Authorization: McKinney-Vento Homeless Assistance Act, Title VII, Subtitle B.
IDEA-B Private Schools (Fund No. 24115) Minimum Balance: None To provide grants to States to assist the States in providing a free appropriate public education to all children with disabilities.. The program is funded by the United States government, under the Individuals With Disabilities Act, Part B, Section 619, as amended, Public Laws 94-142, 99-457, 100-630, 101-497, and 101-476.
Fresh Fruits and Vegetables (Fund No. 24118) Minimum Balance: None To assist States, through cash grants, in providing free fresh fruits and vegetables to school children in designated participating schools beginning in school year 2004/2006. Authorization granted under National School Lunch Act, as amended, 42 U.S.C. 1769.
21ST Century Community Learning Centers (Fund No. 24119) Minimum Balance: None After school adolescence care, providing the community with responsible Child Care, while providing the children and their families with referral services, drug prevention education, academic help, and character building (social skill) activities. Funding is provided by the Department of Education under the Elementary and Secondary Education Act of 1965, Title X, part I Section 10901, Public Law 103-382 Stat. 3844, 20 U.S.C. 8241.

FINANACIAL SECTION NONMAJOR GOVERNMENTAL FUNDS 86 | P a g e JUNE 30, 2019
Nonmajor Special Revenue Funds ( cont’d ) Title I 1003g (Fund No. 24124) Minimum Balance: None
The objective of this grant is to provide in conjunction with Title I funds for school improvement reserved under section 1003(a) of the ESEA. School Improvement Grants under section 1003(g) of the ESEA are used to improve student achievement in Title I schools identified for improvement, corrective action, or restructuring so as to enable those schools to make adequate yearly progress (AYP) and exit improvement status. Funding is by the Elementary and Secondary Education Act of 1965, as amended, Title I, Part B, Subpart 1.
IDEA-B Student Success (Fund No. 24132) Minimum Balance: None The purpose of this grant award is to support activities included in the school's Educational Plan for Student Success, or areas in need of improvement, identified through the instructional audit. The program is funded by the United States government, under the Individuals with Disabilities Act, Public Law 108-446 Part B.
Title III English Language (Fund No. 24153) Minimum Balance: None To ensure that limited English proficient children (LEP) and youth, including immigrant children and youth, attain English proficiency and meet the same standards as all children and youth are expected to meet; to provide assistance to Native American, Native Hawaiian, Native American Pacific Islander, and Alaskan native children with certain modifications relative to the unique status of native American language under Federal Law; to develop to the extent possible, the native language skills of such children. The fund is authorized through the Elementary and Secondary Education Act (ESEA), as amended, Title III, Part A, Sections 3101,3129.
Title II Teacher Quality (Fund No. 24154) Minimum Balance: None To provide grants to State Education Agencies (SEAs) on a formula basis to increase student academic achievement through strategies such as improving teacher and principal quality and increasing the number of highly qualified teachers in the classroom and highly qualified principals and assistant principals in schools and hold local educational agencies and schools accountable for improvements in the academic achievement. Authorization is granted through the Elementary and Secondary Education Act of 1965, as amended, Title II, Part A, Public Law 107-110.
Carl D Perkins (Fund No. 27171, 24174, 24175, & 24176) Minimum Balance: None Basic grants assist states and outlying areas to expand and improve their programs of vocational education and provide equal access in vocational education to special need populations. Authorized by Carl D. Perkins Vocational and Applied Technology Education Amendments of 1998, Title I, Public Law 105-332, 20 U.S.C. 2301, et seq.
Carl D Perkins HSTW (Fund No. 24180, 24181 & 24182) Minimum Balance: None To account for funds administered through the State Public Education Office to the deployment of the HSTW framework is intended to improve student achievement, increase graduation rates and provide relevant and rigorous high school instruction. The program is funded by the United States government, under the Carl D. Perkins Vocational-Technical Education Act Amendments, Title I; 20 U.S.C. 2321 et seq., Public Law 105-332.
IDEA-B Stay in School (Fund No. 24188) Minimum Balance: None The purpose of this grant award is to support activities included in the school's Educational Plan for Student Success, or areas in need of improvement, identified through the instructional audit. The program is funded by the United States government, under the Individuals with Disabilities Act, Public Law 108-446 Part B.
Academic Enrichment (Fund No. 24189) To improve student’s academic achievement by increasing the capacity of States, local educational agencies (LEAs), schools and local communities to: (1) provide all students with access to a well-rounded education; (2) improve school conditions for student learning; and (3) improve the use of technology in order to improve the academic achievement and digital literacy for all students. Authorization: Elementary and Secondary Education, et seq., Title IV, Part A, Subpart I, Section (20.U.S. C. 710; Department of Education Appropriations Act, 2017
Title I Comprehensive Support and Improvement (Fund No. 24190) Minimum Balance: None Under the New Mexico Public Education Department’s (NMPED) approved Every Student Succeeds Act (ESSA), the state’ lowest-achieving schools are identified as Comprehensive Support and Improvement (CSI) schools. As a result, CSI schools, with the support of the larger Local Education Agency (LEA) and school community, have an opportunity to develop and implement targeted interventions with the goal of achieving dramatic school-level achievement gains such that the school is in good academic standing within three years. Funding authorization: Elementary and Secondary Education Act of 1965, as amended, Title I, Part B.

NONMAJOR GOVERNMENTAL FUNDS FINANCIAL SECTION JUNE 30, 2019 87 | P a g e
Nonmajor Special Revenue Funds ( cont’d )
Title I – HS Redesign (Fund No. 24191) Minimum Balance: None The High School Redesign initiative would support competitive grants to local educational agencies (LEAs) in partnership with institutions of higher education and other entities, such as non-profits, community-based organizations, government agencies, and business or industry-related organizations to help schools apply academic concepts to real world challenges. Partnerships and projects will connect high school experiences with relevant business, community, and postsecondary partners in science, technology, engineering and math (STEM) fields, while enhancing for students living in high poverty and rural communities. Special consideration will be given to partnerships with employers that provide students at participating schools with career-related experiences or help students attain career-related credentials. Funding is by the Elementary and Secondary Education Act of 1965, as amended, Title I, Part B, Subpart 1..
ARRA – IDEA-B CEIS (Fund No. 24212) Minimum Balance: None Up to 15% of combined entitlement and preschool funding may be budgeted as per 34 CFR § 300.226. Must be used consistent with the applicable provisions of IDEA-B, as follows: (1) Must be used only to pay the excess costs of providing special education and related services to children with disabilities: (2) Must be used to supplement State. local, and other Federal funds and not to supplant such funds: and (3) Must not be used to reduce an LEA's maintenance of effort (MOE) for the education of children with disabilities below the preceding year's level except as allowed by 34 CFR §§ 300.204 and 205.
Johnson O’Malley (Fund No. 25131) Minimum Balance: None The Johnson O’Malley project provides supplemental programs in special education and other special needs for New Mexico public schools where eligible Indian children are enrolled. Funding is provided by the Department of the Interior, Bureau of Indian Affairs, through the Navajo Tribe, under the Johnson O’Malley Act of April 16, 1934; as amended 25 U.S.C. 452, Public Law 93-638; 25 U.S.C. 455-457.
Impact Aid Special/Indian Education (Fund No. 25145 & 25147) Minimum Balance: None To provide financial assistance to local educational agencies (LEA’S) where enrollments or availability of revenue are adversely affected by Federal activities, i.e. where the tax base of a district is reduced through the Federal acquisition of real property (Section 2), where there is a significant number of children who reside on Federal (including Indian) lands and/or children whose parents are employed on Federal property or in the Uniformed Services (Section 3(a) and 3 (b); where there is a significant decrease (Section 3(c)) or a sudden and substantial increase (Section 4) in school enrollment as the result of Federal activities; to provide disaster assistance for reduced or increased operating costs (Section 7(a)), for replacing or repairing damaged or destroyed supplies, equipment, and books, and for repairing minor damage to facilities. Funding authorized by Public Law 81-874.
Title XIX Medicaid (Fund No. 25153) Minimum Balance: None To provide financial assistance from the Federal government which flows-through the State of New Mexico to school districts, for payments of medical assistance on behalf of cash assistance recipients, children, pregnant women and the aged who meet income and resource requirements, and other categorically-eligible groups. The program is funded by the U.S. government under the Social Security Act, Title XIX, as amended; Public Laws 92-223, 92-602, 93-66, 93-233, 96-499, 97-35, 97-2248, 98-369, 99-272, 99-509, 100-93, 100-202, 100-203, 100-360, 100-436, 100-485, 100-647, 101-166, 101-234, 101-239, 101-508, 101-517, 102-234, 102-170, 102-394, 103-66, 103-112, 103-333, 104-91, 104-191, 104-193, 104-208, and 104-134; Balanced Budget Act of 1997, Public Law 105-33.
Indian Ed Formula Grant (Fund No. 25184) Minimum Balance: None The purpose of this program is to support projects which improve educational opportunities and achievement of Native American children. Funding is provided by the Federal Government, under the Elementary and Secondary Education Act of 1965, Title IX, Part A, Subpart 1, as amended, Public Law 103-382, 20 U.S.C. 7811-7818; 25 U.S.C. 2002.
Mentoring for Safe Schools (Fund No. 25187) Minimum Balance: None To provide funding to state, local, community, and national organizations to propose the enhancement or expansion of initiatives that will assist in the development and maturity of community programs to provide mentoring services to high-risk populations that are underserved due to location, shortage of mentors, special physical or mental challenges of the targeted population, or other analogous situations identified by the community in need of mentoring services.
Native American Program (Fund No. 25248) Minimum Balance: None To bring school-wide classroom reading instruction and targeted intervention for Limited English Proficient (LEP) students where the native language is Navajo.

FINANACIAL SECTION NONMAJOR GOVERNMENTAL FUNDS 88 | P a g e JUNE 30, 2019
Nonmajor Special Revenue Funds ( cont’d ) Kellogg Foundation (Fund No. 26121) Minimum Balance: None
This grant will expand evidence-based parent education and family support programs targeting vulnerable families in select New Mexico neighborhoods to promote parental knowledge of child development needs and parental advocacy skills.
Dual Credit Instructional Materials (Fund No. 27103) Minimum Balance: None To provide instructional materials to be used for a dual credit course approved by Higher Education Department (HED) and through a college/university for which the district has an approved agreement.
Library GO Bonds 2012 (Fund No. 27107) Minimum Balance: None Funds to be used for library books and library resources for public school libraries statewide. Library resources include computers, software, projectors, televisions, other related hardware and software, shelving, desks, chairs, and book trucks/carts. Senate Bill 66, Laws of 2012, 2nd Session, Chapter 54, Section 10.B.(3).
Reads to Lead (Fund No. 27114) Minimum Balance: None Provides an aligned approach for districts and schools to ensure that children can read by the end of third grade—giving them essential skills for future career and college success. It also provides regional and district reading coaches, supports for intervention, and professional development for parents, teachers, reading coaches, and administrators.
Excellence in Teaching (Fund No. 27125) Minimum Balance: None The funding under this award must be used solely for Excellence in Teaching salary supplements. These salary supplements are $5,000.00 or $10,000.00 per teacher and may only be awarded to teachers who have met the award criteria.
Recruitment Support (Fund No. 27128) Minimum Balance: None This award must be used for teacher recruitment efforts such as signing bonuses for new teachers, covering the costs of travel to a recruiting/hiring event, updates to your district website with regard to recruitment, or the cost of placing advertisements in a newspaper or external website.
Pre-K Initiative (Fund No. 27149) Minimum Balance: None The pre-k program shall address the total development needs of preschool children, including physical, cognitive, social and emotional needs, and shall include health care, nutrition, safety and multicultural sensitivity.
Indian Education Act (Fund No. 27150) Minimum Balance: None To increase academic achievement and provide culturally relevant learning experiences for American Indian students; to establish collaborative partnerships that engage active participation of American Indian parents, students, tribe(s), community-based organizations, universities, private sector and/or other entities who work with American Indian students; to establish a parent community advisory committee to participate in the development of an Indigenous curriculum framework and to profile Indigenous best practices.
Breakfast for Elementary Students (Fund No. 27155) Minimum Balance: None The Breakfast for Elementary School program provides foods (at no charge) after the instructional day has begun, provided that instruction occurs simultaneously with breakfast. Authorized through 22-13-13.2 NMSA 1978; NMAC 6.12.9
Library GO Bond 2006 (Fund No. 27170) Minimum Balance: None Funding made available to update and expand library collections.
New Mexico Grown (Fund No. 27183) Minimum Balance: None Funds under this award are to be used to purchase locally grown New Mexico fresh fruits and vegetables, to be made available at no charge to students. Funds have been received as appropriation through the General Appropriations Act to distribute to school districts and charter schools.
4R Future Individual/Group (Fund No. 27188 & 27190) Minimum Balance: None To design and development of locally-crafted opportunities to champion and retain educators. Through this opportunity, LEAs will have a powerful tool to ensure that educators who demonstrate the ability to positively impact the academic trajectory of their students will be recognized for their excellence and, furthermore, be incentivized to continue their work within their classrooms and schools.
Youth Conservation (Fund No. 28133) Minimum Balance: None Allows for students to participate in conservation programs at National, State and City Parks as well as study time for academic programs.

NONMAJOR GOVERNMENTAL FUNDS FINANCIAL SECTION JUNE 30, 2019 89 | P a g e
Nonmajor Special Revenue Funds ( cont’d ) Tutoring (Fund No. 28178) Minimum Balance: None
Funds to provide tutoring for students needing specialized help at the mid-school level.
Westmeath Foundation (Fund No. 29102) Minimum Balance: None Exclusively for the Exceptional Programs Office to use only for educational, scientific, or literary purposes.
Nonmajor Capital Projects Funds Capital Projects Funds are used to account for financial resources to be used for the acquisition or construction of major capital facilities.
Special Building Local (Fund No. 31300) Minimum Balance: None The fund provides financing from local revenues for the construction and improvements to District buildings and facilities.
Special Capital Outlay – State (Fund No. 31400) Minimum Balance: None This fund provides financing for special appropriation monies received from the State of New Mexico under Chapter 367, Laws of 1993.
State SB-9 Match (Fund No. 31700) Minimum Balance: None To account for erecting, remodeling, making additions to and furnishing of school buildings, or purchasing or improving school grounds or any combination thereof as identified by the local school board. Financing is provided by the State of New Mexico’s State Equalization Matching as authorized by the Public School District Capital Improvements Act (22-25-1 to 22-25-10 NMSA 1978).
Capital Improvements SB – 9 (Fund No. 31701) Minimum Balance: None This fund provides financing for the purchase of equipment and capital improvements to School District property. Funding is received from a 2 mill property tax levy and interest earned on investments, under New Mexico Senate Bill 9.
Ed Technology Equipment Act (Fund No. 31900) Minimum Balance: None This fund is used to account for the revenues and expenditures associated with Education Technology Bonds in the purchasing of equipment used in the educational process.
Nonmajor Debt Service Funds Debt service funds are used to account for the payment of principal and interest on long-term debt. Debt Service revenues are from taxes and other operating revenues, some of which are pledged specifically to repay certain outstanding bond issues.
Ed Tech Debt Service (Fund No. 43000) Minimum Balance: None Used to account for the accumulation of resources for and the payment of, general long-term debt principal, interest, and related costs associated with the Education Technology bond issues.

STATE OF NEW MEXICO
FARMINGTON MUNICIPAL SCHOOL DISTRICT NO. 5
NON-MAJOR GOVERNMENTAL FUNDSCombining Balance Sheet
June 30, 2019
Special Revenue Funds
Food Service Athletics ActivitiesJavits Gifted &
TalentedNew Mexico
AutismFund #21000 Fund #22000 Fund #23000 Fund #24102 Fund #24108
AssetsCash and cash equivalents 12,318$ 242,891$ 869,008$ 1,610$ -$ Receivables:
Property taxes - - - - - Grant 430,443 - - - -
Due from other governments - - - - - Food inventory 76,754 - - - - Restricted:
Cash and cash equivalents - - - - -
Total assets 519,515$ 242,891$ 869,008$ 1,610$ -$
Liabilities, deferred inflows and fund balanceLiabilities:
Accounts payable 761$ -$ 8,164$ -$ -$ Due to other funds 102,886 - - - -
Total liabilities 103,647 - 8,164 - -
Deferred inflows of resources:Advances of federal, state, and local grants - - - 1,610 - Delinquent property taxes - - - - -
Total deferred inflows of resources - - - 1,610 -
Fund balance:Non-spendable:
Inventories 76,754 - - - - Restricted for:
Special revenue funds 339,114 242,891 860,844 - - Capital projects funds - - - - - Debt service - - - - -
Total fund balance 415,868 242,891 860,844 - -
Total liabilities, deferred inflows of resources, and fund balance 519,515$ 242,891$ 869,008$ 1,610$ -$
( cont'd; 1 of 13 )
FINANCIAL SECTION
90 | P a g e

STATE OF NEW MEXICO
FARMINGTON MUNICIPAL SCHOOL DISTRICT NO. 5
NON-MAJOR GOVERNMENTAL FUNDSCombining Balance Sheet
June 30, 2019
Special Revenue Funds
Preschool IDEA-B
Education of Homeless
IDEA-B Private Schools
Fresh Fruits and Vegetables
Fund #24109 Fund #24113 Fund #24115 Fund #24118Assets
Cash and cash equivalents -$ 20,857$ -$ -$ Receivables:
Property taxes - - - - Grant 23,753 - 6,341 -
Due from other governments - - - - Food inventory - - - - Restricted:
Cash and cash equivalents - - - -
Total assets 23,753$ 20,857$ 6,341$ -$
Liabilities, deferred inflows and fund balanceLiabilities:
Accounts payable -$ -$ -$ -$ Due to other funds 23,753 - 6,341 -
Total liabilities 23,753 - 6,341 -
Deferred inflows of resources:Advances of federal, state, and local grants - 20,857 - - Delinquent property taxes - - - -
Total deferred inflows of resources - 20,857 - -
Fund balance:Non-spendable:
Inventories - - - - Restricted for:
Special revenue funds - - - - Capital projects funds - - - - Debt service - - - -
Total fund balance - - - -
Total liabilities, deferred inflows of resources, and fund balance 23,753$ 20,857$ 6,341$ -$
( cont'd; 2 of 13 )
FINANCIAL SECTION
91 | P a g e

STATE OF NEW MEXICO
FARMINGTON MUNICIPAL SCHOOL DISTRICT NO. 5
NON-MAJOR GOVERNMENTAL FUNDSCombining Balance Sheet
June 30, 2019
Special Revenue Funds21st Century Community
Learning Centers Title I - 1003g
IDEA-B Student Success
Title III English
Language
Title II Teacher Quality
Fund #24119 Fund #24124 Fund #24132 Fund #24153 Fund #24154Assets
Cash and cash equivalents -$ -$ -$ -$ -$ Receivables:
Property taxes - - - - - Grant 134,630 153,619 19,204 24,055 409,159
Due from other governments - - - - - Food inventory - - - - - Restricted:
Cash and cash equivalents - - - - -
Total assets 134,630$ 153,619$ 19,204$ 24,055$ 409,159$
Liabilities, deferred inflows and fund balanceLiabilities:
Accounts payable -$ -$ -$ -$ 1,500$ Due to other funds 134,630 153,619 19,204 24,055 407,659
Total liabilities 134,630 153,619 19,204 24,055 409,159
Deferred inflows of resources:Advances of federal, state, and local grants - - - - - Delinquent property taxes - - - - -
Total deferred inflows of resources - - - - -
Fund balance:Non-spendable:
Inventories - - - - - Restricted for:
Special revenue funds - - - - - Capital projects funds - - - - - Debt service - - - - -
Total fund balance - - - - -
Total liabilities, deferred inflows of resources, and fund balance 134,630$ 153,619$ 19,204$ 24,055$ 409,159$
( cont'd; 3 of 13 )
FINANCIAL SECTION
92 | P a g e

STATE OF NEW MEXICO
FARMINGTON MUNICIPAL SCHOOL DISTRICT NO. 5
NON-MAJOR GOVERNMENTAL FUNDSCombining Balance Sheet
June 30, 2019
Special Revenue Funds
Carl D Perkins -JAG Carl D Perkins
Carl D Perkins Secondary
Carl D Perkins Secondary
RedistributionFund #24171 Fund #24174 Fund #24175 Fund #24176
AssetsCash and cash equivalents -$ -$ 3$ -$ Receivables:
Property taxes - - - - Grant 52,647 29,274 - 11,479
Due from other governments - - - - Food inventory - - - - Restricted:
Cash and cash equivalents - - - -
Total assets 52,647$ 29,274$ 3$ 11,479$
Liabilities, deferred inflows and fund balanceLiabilities:
Accounts payable -$ -$ -$ -$ Due to other funds 52,647 29,274 - 11,479
Total liabilities 52,647 29,274 - 11,479
Deferred inflows of resources:Advances of federal, state, and local grants - - 3 - Delinquent property taxes - - - -
Total deferred inflows of resources - - 3 -
Fund balance:Non-spendable:
Inventories - - - - Restricted for:
Special revenue funds - - - - Capital projects funds - - - - Debt service - - - -
Total fund balance - - - -
Total liabilities, deferred inflows of resources, and fund balance 52,647$ 29,274$ 3$ 11,479$
( cont'd; 4 of 13 )
FINANCIAL SECTION
93 | P a g e

STATE OF NEW MEXICO
FARMINGTON MUNICIPAL SCHOOL DISTRICT NO. 5
NON-MAJOR GOVERNMENTAL FUNDSCombining Balance Sheet
June 30, 2019
Special Revenue Funds
Carl D Perkins HSTW - Current
Carl D Perkins HSTW - PY Unliq. Oblig
Carl D Perkins HSTW -
RedistributionIDEA-B Stay
in SchoolAcademic
EnrichmentFund #24180 Fund #24181 Fund #24182 Fund #24188 Fund #24189
AssetsCash and cash equivalents -$ -$ -$ -$ -$ Receivables:
Property taxes - - - - - Grant 590 3,834 8,794 215,256 69,778
Due from other governments - - - - - Food inventory - - - - - Restricted:
Cash and cash equivalents - - - - -
Total assets 590$ 3,834$ 8,794$ 215,256$ 69,778$
Liabilities, deferred inflows and fund balanceLiabilities:
Accounts payable -$ -$ -$ -$ -$ Due to other funds 590 3,834 8,794 215,256 69,778
Total liabilities 590 3,834 8,794 215,256 69,778
Deferred inflows of resources:Advances of federal, state, and local grants - - - - - Delinquent property taxes - - - - -
Total deferred inflows of resources - - - - -
Fund balance:Non-spendable:
Inventories - - - - - Restricted for:
Special revenue funds - - - - - Capital projects funds - - - - - Debt service - - - - -
Total fund balance - - - - -
Total liabilities, deferred inflows of resources, and fund balance 590$ 3,834$ 8,794$ 215,256$ 69,778$
cont'd; 5 of 13 )
FINANCIAL SECTION
94 | P a g e

STATE OF NEW MEXICO
FARMINGTON MUNICIPAL SCHOOL DISTRICT NO. 5
NON-MAJOR GOVERNMENTAL FUNDSCombining Balance Sheet
June 30, 2019
Special Revenue FundsTitle I
Comprehensive Support &
ImprovementTitle I - HS Redesign
ARRA - IDEA-B CEIS
Johnson O'Malley
Fund #24190 Fund #24191 Fund #24212 Fund #25131Assets
Cash and cash equivalents -$ -$ 55$ -$ Receivables:
Property taxes - - - - Grant 10,991 44,516 - 104,645
Due from other governments - - - - Food inventory - - - - Restricted:
Cash and cash equivalents - - - -
Total assets 10,991$ 44,516$ 55$ 104,645$
Liabilities, deferred inflows and fund balanceLiabilities:
Accounts payable 2,150$ -$ -$ -$ Due to other funds 8,841 44,516 - 104,645
Total liabilities 10,991 44,516 - 104,645
Deferred inflows of resources:Advances of federal, state, and local grants - - 55 - Delinquent property taxes - - - -
Total deferred inflows of resources - - 55 -
Fund balance:Non-spendable:
Inventories - - - - Restricted for:
Special revenue funds - - - - Capital projects funds - - - - Debt service - - - -
Total fund balance - - - -
Total liabilities, deferred inflows of resources, and fund balance 10,991$ 44,516$ 55$ 104,645$
cont'd; 6 of 13 )
FINANCIAL SECTION
95 | P a g e

STATE OF NEW MEXICO
FARMINGTON MUNICIPAL SCHOOL DISTRICT NO. 5
NON-MAJOR GOVERNMENTAL FUNDSCombining Balance Sheet
June 30, 2019
Special Revenue Funds
Impact Aid Special
Education
Impact Aid Indian
EducationTitle XIX Medicaid
Indian Ed Formula Grant
Fund #25145 Fund #25147 Fund #25153 Fund #25184Assets
Cash and cash equivalents 863$ 32,678$ 1,237,712$ -$ Receivables:
Property taxes - - - - Grant - - - 66,223
Due from other governments - - - - Food inventory - - - - Restricted:
Cash and cash equivalents - - - -
Total assets 863$ 32,678$ 1,237,712$ 66,223$
Liabilities, deferred inflows and fund balanceLiabilities:
Accounts payable -$ -$ 1,099$ 301$ Due to other funds - - - 9,107
Total liabilities - - 1,099 9,408
Deferred inflows of resources:Advances of federal, state, and local grants - - - - Delinquent property taxes - - - -
Total deferred inflows of resources - - - -
Fund balance:Non-spendable:
Inventories - - - - Restricted for:
Special revenue funds 863 32,678 1,236,613 56,815 Capital projects funds - - - - Debt service - - - -
Total fund balance 863 32,678 1,236,613 56,815
Total liabilities, deferred inflows of resources, and fund balance 863$ 32,678$ 1,237,712$ 66,223$
( cont'd; 7 of 13 )
FINANCIAL SECTION
96 | P a g e

STATE OF NEW MEXICO
FARMINGTON MUNICIPAL SCHOOL DISTRICT NO. 5
NON-MAJOR GOVERNMENTAL FUNDSCombining Balance Sheet
June 30, 2019
Special Revenue Funds
Mentoring for Safe Schools
Native American Program
Kellogg Foundation
Dual Credit Instructional
MaterialsFund #25187 Fund #25248 Fund #26121 Fund #27103
AssetsCash and cash equivalents 1$ -$ 14,452$ -$ Receivables:
Property taxes - - - - Grant - 7,645 - 17,246
Due from other governments - - - - Food inventory - - - - Restricted:
Cash and cash equivalents - - - -
Total assets 1$ 7,645$ 14,452$ 17,246$
Liabilities, deferred inflows and fund balanceLiabilities:
Accounts payable -$ 2,346$ -$ -$ Due to other funds - 5,299 - 17,246
Total liabilities - 7,645 - 17,246
Deferred inflows of resources:Advances of federal, state, and local grants - - - - Delinquent property taxes - - - -
Total deferred inflows of resources - - - -
Fund balance:Non-spendable:
Inventories - - - - Restricted for:
Special revenue funds 1 - 14,452 - Capital projects funds - - - - Debt service - - - -
Total fund balance 1 - 14,452 -
Total liabilities, deferred inflows of resources, and fund balance 1$ 7,645$ 14,452$ 17,246$
( cont'd; 8 of 13 )
FINANCIAL SECTION
97 | P a g e

STATE OF NEW MEXICO
FARMINGTON MUNICIPAL SCHOOL DISTRICT NO. 5
NON-MAJOR GOVERNMENTAL FUNDSCombining Balance Sheet
June 30, 2019
Special Revenue Funds
Libraries GO Bond 2012 Reads to Lead
Excellence in Teaching
Recruitment Support
Fund #27107 Fund #27114 Fund #27125 Fund #27128Assets
Cash and cash equivalents -$ -$ -$ -$ Receivables:
Property taxes - - - - Grant 7,176 65,142 - -
Due from other governments - - - - Food inventory - - - - Restricted:
Cash and cash equivalents - - - -
Total assets 7,176$ 65,142$ -$ -$
Liabilities, deferred inflows and fund balanceLiabilities:
Accounts payable -$ -$ -$ -$ Due to other funds 7,176 65,142 - -
Total liabilities 7,176 65,142 - -
Deferred inflows of resources:Advances of federal, state, and local grants - - - - Delinquent property taxes - - - -
Total deferred inflows of resources - - - -
Fund balance:Non-spendable:
Inventories - - - - Restricted for:
Special revenue funds - - - - Capital projects funds - - - - Debt service - - - -
Total fund balance - - - -
Total liabilities, deferred inflows of resources, and fund balance 7,176$ 65,142$ -$ -$
( cont'd; 9 of 13 )
FINANCIAL SECTION
98 | P a g e

STATE OF NEW MEXICO
FARMINGTON MUNICIPAL SCHOOL DISTRICT NO. 5
NON-MAJOR GOVERNMENTAL FUNDSCombining Balance Sheet
June 30, 2019
Special Revenue Funds
Pre-K Initiative
Indian Education Act
Breakfast for Elementary
StudentsLibraries GO Bond 2006
New Mexico Grown
Fund #27149 Fund #27150 Fund #27155 Fund #27170 Fund #27183Assets
Cash and cash equivalents -$ -$ -$ 2,431$ -$ Receivables:
Property taxes - - - - - Grant 292,985 17,460 13,774 - -
Due from other governments - - - - - Food inventory - - - - - Restricted:
Cash and cash equivalents - - - - -
Total assets 292,985$ 17,460$ 13,774$ 2,431$ -$
Liabilities, deferred inflows and fund balanceLiabilities:
Accounts payable -$ -$ -$ -$ -$ Due to other funds 292,985 17,460 11,045 - -
Total liabilities 292,985 17,460 11,045 - -
Deferred inflows of resources:Advances of federal, state, and local grants - - - - - Delinquent property taxes - - - - -
Total deferred inflows of resources - - - - -
Fund balance:Non-spendable:
Inventories - - - - - Restricted for:
Special revenue funds - - 2,729 2,431 - Capital projects funds - - - - - Debt service - - - - -
Total fund balance - - 2,729 2,431 -
Total liabilities, deferred inflows of resources, and fund balance 292,985$ 17,460$ 13,774$ 2,431$ -$
( cont'd; 10 of 13 )
FINANCIAL SECTION
99 | P a g e

STATE OF NEW MEXICO
FARMINGTON MUNICIPAL SCHOOL DISTRICT NO. 5
NON-MAJOR GOVERNMENTAL FUNDSCombining Balance Sheet
June 30, 2019
Special Revenue Funds
4R Future Individual
4R Future Group
Youth Conservation
Corp TutoringWestmeath Foundation
Fund #27188 Fund #27190 Fund #28133 Fund #28178 Fund #29102Assets
Cash and cash equivalents -$ -$ 51,615$ 1,546$ 4,055$ Receivables:
Property taxes - - - - - Grant - - - - -
Due from other governments - - - - - Food inventory - - - - - Restricted:
Cash and cash equivalents - - - - -
Total assets -$ -$ 51,615$ 1,546$ 4,055$
Liabilities, deferred inflows and fund balanceLiabilities:
Accounts payable -$ -$ -$ -$ -$ Due to other funds - - - - -
Total liabilities - - - - -
Deferred inflows of resources:Advances of federal, state, and local grants - - - - - Delinquent property taxes - - - - -
Total deferred inflows of resources - - - - -
Fund balance:Non-spendable:
Inventories - - - - - Restricted for:
Special revenue funds - - 51,615 1,546 4,055 Capital projects funds - - - - - Debt service - - - - -
Total fund balance - - 51,615 1,546 4,055
Total liabilities, deferred inflows of resources, and fund balance -$ -$ 51,615$ 1,546$ 4,055$
( cont'd; 11 of 13 )
FINANCIAL SECTION
100 | P a g e

STATE OF NEW MEXICO
FARMINGTON MUNICIPAL SCHOOL DISTRICT NO. 5
NON-MAJOR GOVERNMENTAL FUNDSCombining Balance Sheet
June 30, 2019
Capital Projects Funds
TotalNon-Major
Special RevenueSpecial Capital Outlay - Local
Special Capital Outlay - State
State SB-9 Match
Funds Fund #31300 Fund #31400 Fund #31700Assets
Cash and cash equivalents 2,492,095$ 931,688$ 48,375$ 179,517$ Receivables:
Property taxes - - - - Grant 2,240,659 - - -
Due from other governments - - - - Food inventory 76,754 - - - Restricted:
Cash and cash equivalents - - - -
Total assets 4,809,508$ 931,688$ 48,375$ 179,517$
Liabilities, deferred inflows and fund balanceLiabilities:
Accounts payable 16,321$ -$ -$ -$ Due to other funds 1,847,261 - - -
Total liabilities 1,863,582 - - -
Deferred inflows of resources:Advances of federal, state, and local grants 22,525 - - - Delinquent property taxes - - - -
Total deferred inflows of resources 22,525 - - -
Fund balance:Non-spendable:
Inventories 76,754 - - - Restricted for:
Special revenue funds 2,846,647 - - - Capital projects funds - 931,688 48,375 179,517 Debt service - - - -
Total fund balance 2,923,401 931,688 48,375 179,517
Total liabilities, deferred inflows of resources, and fund balance 4,809,508$ 931,688$ 48,375$ 179,517$
( cont'd; 12 of 13 )
FINANCIAL SECTION
101 | P a g e

STATE OF NEW MEXICO
FARMINGTON MUNICIPAL SCHOOL DISTRICT NO. 5
NON-MAJOR GOVERNMENTAL FUNDSCombining Balance Sheet
June 30, 2019
Capital Projects Funds
Capital Improvements
SB-9Ed Technology Equipment Act
TotalNon-Major
Capital ProjectsEd Tech
Debt ServiceTotal Nonmajor Governmental
Fund #31701 Fund #31900 Funds Fund #43000 FundsAssets
Cash and cash equivalents 2,159,609$ 728,445$ 4,047,634$ 3,233,972$ 9,773,701$ Receivables:
Property taxes 190,647 - 190,647 81,414 272,061 Grant - - - - 2,240,659
Due from other governments 38,733 - 38,733 40,989 79,722 Food inventory - - - - 76,754 Restricted:
Cash and cash equivalents - 363,581 363,581 - 363,581
Total assets 2,388,989$ 1,092,026$ 4,640,595$ 3,356,375$ 12,806,478$
Liabilities, deferred inflows and fund balanceLiabilities:
Accounts payable 103,814$ 83,146$ 186,960$ -$ 203,281$ Due to other funds - - - - 1,847,261
Total liabilities 103,814 83,146 186,960 - 2,050,542
Deferred inflows of resources:Advances of federal, state, and local grants - - - - 22,525 Delinquent property taxes 161,902 - 161,902 50,803 212,705
Total deferred inflows of resources 161,902 - 161,902 50,803 235,230
Fund balance:Non-spendable:
Inventories - - - - 76,754 Restricted for:
Special revenue funds - - - - 2,846,647 Capital projects funds 2,123,273 1,008,880 4,291,733 - 4,291,733 Debt service - - - 3,305,572 3,305,572
Total fund balance 2,123,273 1,008,880 4,291,733 3,305,572 10,520,706
Total liabilities, deferred inflows of resources, and fund balance 2,388,989$ 1,092,026$ 4,640,595$ 3,356,375$ 12,806,478$
( 13 of 13 )
FINANCIAL SECTION
102 | P a g e

STATE OF NEW MEXICO
FARMINGTON MUNICIPAL SCHOOL DISTRICT NO. 5
NON-MAJOR GOVERNMENTAL FUNDSCombining Statement of Revenues, Expenditures, and
Changes in Fund Balance
Year Ended June 30, 2019
Special Revenue Funds
Food Service Athletics ActivitiesJavits Gifted &
TalentedNew Mexico
AutismFund #21000 Fund #22000 Fund #23000 Fund #24102 Fund #24108
Revenues:Taxes:
Property -$ -$ -$ -$ -$ Oil and gas - - - - -
Intergovernmental - federal grants 3,699,338 - - - - Intergovernmental - state grants 28,920 - - - - Contributions - private grants - - - - - Charges for services 819,162 454,190 1,312,904 - - Investment and interest income 137 - - - - Miscellaneous 861 - - - -
Total revenues 4,548,418 454,190 1,312,904 - -
Expenditures:Current:
Instruction - 417,171 645,265 - - Support services: Students - - - - - Instruction - - - - - General Administration - - - - - School Administration - - - - - Central Services - - - - - Operation & Maintenance of Plant - - - - - Student transportation - - - - - Food services operations 4,569,279 - - - - Community services - - - - -
Capital outlay 5,992 8,836 77,738 - - Debt service:
Principal retirement - - - - - Bond interest paid - - - - -
Total expenditures 4,575,271 426,007 723,003 - -
Excess (deficiency) of revenues over expenditures (26,853) 28,183 589,901 - -
Other financing uses:Transfers In - - - - -
Net change in fund balance (26,853) 28,183 589,901 - -
Fund balance at beginning of the year 442,721 214,708 270,943 - - Fund balance at end of the year 415,868$ 242,891$ 860,844$ -$ -$
( cont'd; 1 of 12 )
FINANCIAL SECTION
103 | P a g e

STATE OF NEW MEXICO
FARMINGTON MUNICIPAL SCHOOL DISTRICT NO. 5
NON-MAJOR GOVERNMENTAL FUNDSCombining Statement of Revenues, Expenditures, and
Changes in Fund Balance
Year Ended June 30, 2019
Special Revenue Funds
Preschool IDEA-B
Education of Homeless
IDEA-B Private Schools
Fresh Fruits and Vegetables
21st Century Community
Learning Centers
Fund #24109 Fund #24113 Fund #24115 Fund #24118 Fund #24119Revenues:
Taxes:Property -$ -$ -$ -$ -$ Oil and gas - - - - -
Intergovernmental - federal grants 78,600 17,925 6,224 77,334 173,402 Intergovernmental - state grants - - - - - Contributions - private grants - - - - - Charges for services - - - - - Investment and interest income - - - - - Miscellaneous - - - - -
Total revenues 78,600 17,925 6,224 77,334 173,402
Expenditures:Current:
Instruction 77,438 17,660 - - 136,403 Support services: Students - - 6,224 - 9,183 Instruction - - - - - General Administration 1,162 265 - - 24,066 School Administration - - - - - Central Services - - - - 3,000 Operation & Maintenance of Plant - - - - - Student transportation - - - - - Food services operations - - - 77,334 - Community services - - - - 750
Capital outlay - - - - - Debt service:
Principal retirement - - - - - Bond interest paid - - - - -
Total expenditures 78,600 17,925 6,224 77,334 173,402
Excess (deficiency) of revenues over expenditures - - - - -
Other financing uses:Transfers In - - - - -
Net change in fund balance - - - - -
Fund balance at beginning of the year - - - - - Fund balance at end of the year -$ -$ -$ -$ -$
( cont'd; 2 of 12 )
FINANCIAL SECTION
104 | P a g e

STATE OF NEW MEXICO
FARMINGTON MUNICIPAL SCHOOL DISTRICT NO. 5
NON-MAJOR GOVERNMENTAL FUNDSCombining Statement of Revenues, Expenditures, and
Changes in Fund Balance
Year Ended June 30, 2019
Special Revenue Funds
Title I - 1003gIDEA-B
Student Success
Title III English
Language
Title II Teacher Quality
Carl D Perkins -JAG
Fund #24124 Fund #24132 Fund #24153 Fund #24154 Fund #24171Revenues:
Taxes:Property -$ -$ -$ -$ -$ Oil and gas - - - - -
Intergovernmental - federal grants 315,879 19,204 99,844 528,608 52,646 Intergovernmental - state grants - - - - - Contributions - private grants - - - - - Charges for services - - - - - Investment and interest income - - - - - Miscellaneous - - - - -
Total revenues 315,879 19,204 99,844 528,608 52,646
Expenditures:Current:
Instruction 287,162 19,204 7,751 368,689 - Support services: Students 13,748 - 90,617 173,187 51,868 Instruction - - - - - General Administration 4,668 - 1,476 10,487 778 School Administration 10,301 - - - - Central Services - - - - - Operation & Maintenance of Plant - - - - - Student transportation - - - - - Food services operations - - - - - Community services - - - - -
Capital outlay - - - - - Debt service:
Principal retirement - - - - - Bond interest paid - - - - -
Total expenditures 315,879 19,204 99,844 552,363 52,646
Excess (deficiency) of revenues over expenditures - - - (23,755) -
Other financing uses:Transfers In - - - 23,755 -
Net change in fund balance - - - - -
Fund balance at beginning of the year - - - - - Fund balance at end of the year -$ -$ -$ -$ -$
( cont'd; 3 of 12 )
FINANCIAL SECTION
105 | P a g e

STATE OF NEW MEXICO
FARMINGTON MUNICIPAL SCHOOL DISTRICT NO. 5
NON-MAJOR GOVERNMENTAL FUNDSCombining Statement of Revenues, Expenditures, and
Changes in Fund Balance
Year Ended June 30, 2019
Special Revenue Funds
Carl D Perkins
Carl D Perkins
Secondary
Carl D Perkins Secondary
Redistribution
Carl D Perkins HSTW - Current
Carl D Perkins
HSTW - PY Unliq. Oblig
Fund #24174 Fund #24175 Fund #24176 Fund #24180 Fund #24181Revenues:
Taxes:Property -$ -$ -$ -$ -$ Oil and gas - - - - -
Intergovernmental - federal grants 86,908 - 17,820 - - Intergovernmental - state grants - - - - - Contributions - private grants - - - - - Charges for services - - - - - Investment and interest income - - - - - Miscellaneous - - - - -
Total revenues 86,908 - 17,820 - -
Expenditures:Current:
Instruction 68,494 - 11,186 - - Support services: Students - - - - - Instruction - - - - - General Administration 804 - 166 - - School Administration - - - - - Central Services - - - - - Operation & Maintenance of Plant - - - - - Student transportation - - - - - Food services operations - - - - - Community services - - - - -
Capital outlay 17,610 - 6,468 - - Debt service:
Principal retirement - - - - - Bond interest paid - - - - -
Total expenditures 86,908 - 17,820 - -
Excess (deficiency) of revenues over expenditures - - - - -
Other financing uses:Transfers In - - - - -
Net change in fund balance - - - - -
Fund balance at beginning of the year - - - - - Fund balance at end of the year -$ -$ -$ -$ -$
( cont'd; 4 of 12 )
FINANCIAL SECTION
106 | P a g e

STATE OF NEW MEXICO
FARMINGTON MUNICIPAL SCHOOL DISTRICT NO. 5
NON-MAJOR GOVERNMENTAL FUNDSCombining Statement of Revenues, Expenditures, and
Changes in Fund Balance
Year Ended June 30, 2019
Special Revenue Funds
Carl D Perkins HSTW -
RedistributionIDEA-B Stay in
SchoolAcademic
Enrichment
Title I Comprehensive
Support & Improvement
Title I - HS Redesign
Fund #24182 Fund #24188 Fund #24189 Fund #24190 Fund #24191Revenues:
Taxes:Property -$ -$ -$ -$ -$ Oil and gas - - - - -
Intergovernmental - federal grants - 215,255 69,778 10,991 64,722 Intergovernmental - state grants - - - - - Contributions - private grants - - - - - Charges for services - - - - - Investment and interest income - - - - - Miscellaneous - - - - -
Total revenues - 215,255 69,778 10,991 64,722
Expenditures:Current:
Instruction - 25,977 63,166 10,860 53,705 Support services: Students - 189,278 - - 3,152 Instruction - - - - - General Administration - - 1,035 131 956 School Administration - - 5,577 - 6,909 Central Services - - - - - Operation & Maintenance of Plant - - - - - Student transportation - - - - - Food services operations - - - - - Community services - - - - -
Capital outlay - - - - - Debt service:
Principal retirement - - - - - Bond interest paid - - - - -
Total expenditures - 215,255 69,778 10,991 64,722
Excess (deficiency) of revenues over expenditures - - - - -
Other financing uses:Transfers In - - - - -
Net change in fund balance - - - - -
Fund balance at beginning of the year - - - - - Fund balance at end of the year -$ -$ -$ -$ -$
( cont'd; 5 of 12 )
FINANCIAL SECTION
107 | P a g e

STATE OF NEW MEXICO
FARMINGTON MUNICIPAL SCHOOL DISTRICT NO. 5
NON-MAJOR GOVERNMENTAL FUNDSCombining Statement of Revenues, Expenditures, and
Changes in Fund Balance
Year Ended June 30, 2019
Special Revenue Funds
ARRA - IDEA-B CEIS
Johnson O'Malley
Impact Aid Special
Education
Impact Aid Indian
EducationTitle XIX Medicaid
Fund #24212 Fund #25131 Fund #25145 Fund #25147 Fund #25153Revenues:
Taxes:Property -$ -$ -$ -$ -$ Oil and gas - - - - -
Intergovernmental - federal grants - 244,607 - - 891,188 Intergovernmental - state grants - - - - - Contributions - private grants - - - - - Charges for services - - - - - Investment and interest income - - - - - Miscellaneous - - - - -
Total revenues - 244,607 - - 891,188
Expenditures:Current:
Instruction - 86,212 - 129 - Support services: Students - 140,226 - 1,630 399,846 Instruction - - - - 60,436 General Administration - 13,617 - 26 37,426 School Administration - 4,552 - - - Central Services - - - - - Operation & Maintenance of Plant - - - - - Student transportation - - - - - Food services operations - - - - - Community services - - - - -
Capital outlay - - - - - Debt service:
Principal retirement - - - - - Bond interest paid - - - - -
Total expenditures - 244,607 - 1,785 497,708
Excess (deficiency) of revenues over expenditures - - - (1,785) 393,480
Other financing uses:Transfers In - - - - -
Net change in fund balance - - - (1,785) 393,480
Fund balance at beginning of the year - - 863 34,463 843,133 Fund balance at end of the year -$ -$ 863$ 32,678$ 1,236,613$
( cont'd; 6 of 12 )
FINANCIAL SECTION
108 | P a g e

STATE OF NEW MEXICO
FARMINGTON MUNICIPAL SCHOOL DISTRICT NO. 5
NON-MAJOR GOVERNMENTAL FUNDSCombining Statement of Revenues, Expenditures, and
Changes in Fund Balance
Year Ended June 30, 2019
Special Revenue Funds
Indian Ed Formula Grant
Mentoring for Safe Schools
Native American Program
Kellogg Foundation
Dual Credit Instructional
MaterialsFund #25184 Fund #25187 Fund #25248 Fund #26121 Fund #27103
Revenues:Taxes:
Property -$ -$ -$ -$ -$ Oil and gas - - - - -
Intergovernmental - federal grants 616,848 1 360,894 - - Intergovernmental - state grants - - - - 48,704 Contributions - private grants - - - - - Charges for services - - - - - Investment and interest income - - - - - Miscellaneous - - - - -
Total revenues 616,848 1 360,894 - 48,704
Expenditures:Current:
Instruction 55,478 - 3,802 - 48,704 Support services: Students 357,607 - 351,793 - - Instruction - - - - - General Administration 82,281 - 5,299 - - School Administration 121,481 - - - - Central Services - - - - - Operation & Maintenance of Plant - - - - - Student transportation - - - - - Food services operations - - - - - Community services - - - - -
Capital outlay - - - - - Debt service:
Principal retirement - - - - - Bond interest paid - - - - -
Total expenditures 616,847 - 360,894 - 48,704
Excess (deficiency) of revenues over expenditures 1 1 - - -
Other financing uses:Transfers In - - - - -
Net change in fund balance 1 1 - - -
Fund balance at beginning of the year 56,814 - - 14,452 - Fund balance at end of the year 56,815$ 1$ -$ 14,452$ -$
( cont'd; 7 of 12 )
FINANCIAL SECTION
109 | P a g e

STATE OF NEW MEXICO
FARMINGTON MUNICIPAL SCHOOL DISTRICT NO. 5
NON-MAJOR GOVERNMENTAL FUNDSCombining Statement of Revenues, Expenditures, and
Changes in Fund Balance
Year Ended June 30, 2019
Special Revenue Funds
Libraries GO Bond 2012 Reads to Lead
Excellence in Teaching
Recruitment Support Pre-K Initiative
Fund #27107 Fund #27114 Fund #27125 Fund #27128 Fund #27149Revenues:
Taxes:Property -$ -$ -$ -$ -$ Oil and gas - - - - -
Intergovernmental - federal grants - - - - - Intergovernmental - state grants 80,343 187,328 446,365 - 655,377 Contributions - private grants - - - - - Charges for services - - - - - Investment and interest income - - - - - Miscellaneous - - - - -
Total revenues 80,343 187,328 446,365 - 655,377
Expenditures:Current:
Instruction - 110,574 446,365 - 581,886 Support services: Students - 76,754 - - - Instruction 80,343 - - - - General Administration - - - - - School Administration - - - - 491 Central Services - - - - - Operation & Maintenance of Plant - - - - - Student transportation - - - - 73,000 Food services operations - - - - - Community services - - - - -
Capital outlay - - - - - Debt service:
Principal retirement - - - - - Bond interest paid - - - - -
Total expenditures 80,343 187,328 446,365 - 655,377
Excess (deficiency) of revenues over expenditures - - - - -
Other financing uses:Transfers In - - - - -
Net change in fund balance - - - - -
Fund balance at beginning of the year - - - - - Fund balance at end of the year -$ -$ -$ -$ -$
( cont'd; 8 of 12 )
FINANCIAL SECTION
110 | P a g e

STATE OF NEW MEXICO
FARMINGTON MUNICIPAL SCHOOL DISTRICT NO. 5
NON-MAJOR GOVERNMENTAL FUNDSCombining Statement of Revenues, Expenditures, and
Changes in Fund Balance
Year Ended June 30, 2019
Special Revenue Funds
Indian Education Act
Breakfast for Elementary
StudentsLibraries GO Bond 2006
New Mexico Grown
4R Future Individual
Fund #27150 Fund #27155 Fund #27170 Fund #27183 Fund #27188Revenues:
Taxes:Property -$ -$ -$ -$ -$ Oil and gas - - - - -
Intergovernmental - federal grants - - - - - Intergovernmental - state grants 17,773 33,024 - 20,000 - Contributions - private grants - - - - - Charges for services - - - - - Investment and interest income - - - - - Miscellaneous - - - - -
Total revenues 17,773 33,024 - 20,000 -
Expenditures:Current:
Instruction 5,006 - - - - Support services: Students 12,438 - - - - Instruction - - - - - General Administration - - - - - School Administration 329 - - - - Central Services - - - - - Operation & Maintenance of Plant - - - - - Student transportation - - - - - Food services operations - 33,024 - 20,000 - Community services - - - - -
Capital outlay - - - - - Debt service:
Principal retirement - - - - - Bond interest paid - - - - -
Total expenditures 17,773 33,024 - 20,000 -
Excess (deficiency) of revenues over expenditures - - - - -
Other financing uses:Transfers In - - - - -
Net change in fund balance - - - - -
Fund balance at beginning of the year - 2,729 2,431 - - Fund balance at end of the year -$ 2,729$ 2,431$ -$ -$
( cont'd; 9 of 12 )
FINANCIAL SECTION
111 | P a g e

STATE OF NEW MEXICO
FARMINGTON MUNICIPAL SCHOOL DISTRICT NO. 5
NON-MAJOR GOVERNMENTAL FUNDSCombining Statement of Revenues, Expenditures, and
Changes in Fund Balance
Year Ended June 30, 2019
Special Revenue Funds
4R Future Group
Youth Conservation
Corp TutoringWestmeath Foundation
Total Nonmajor Special Revenue
Fund #27190 Fund #28133 Fund #28178 Fund #29102 FundsRevenues:
Taxes:Property -$ -$ -$ -$ -$ Oil and gas - - - - -
Intergovernmental - federal grants - - - - 7,648,016 Intergovernmental - state grants - 119,101 - - 1,636,935 Contributions - private grants - - - 21,937 21,937 Charges for services - - - - 2,586,256 Investment and interest income - - - - 137 Miscellaneous - - - - 861
Total revenues - 119,101 - 21,937 11,894,142
Expenditures:Current:
Instruction - 91,312 - 16,874 3,656,473 Support services: Students - - - 1,116 1,878,667 Instruction - - - - 140,779 General Administration - - - - 184,643 School Administration - - - - 149,640 Central Services - - - - 3,000 Operation & Maintenance of Plant - - - - - Student transportation - - - - 73,000 Food services operations - - - - 4,699,637 Community services - - - - 750
Capital outlay - - - - 116,644 Debt service:
Principal retirement - - - - - Bond interest paid - - - - -
Total expenditures - 91,312 - 17,990 10,903,233
Excess (deficiency) of revenues over expenditures - 27,789 - 3,947 990,909
Other financing uses:Transfers In - - - - 23,755
Net change in fund balance - 27,789 - 3,947 1,014,664
Fund balance at beginning of the year - 23,826 1,546 108 1,908,737 Fund balance at end of the year -$ 51,615$ 1,546$ 4,055$ 2,923,401$
( cont'd; 10 of 12 )
FINANCIAL SECTION
112 | P a g e

STATE OF NEW MEXICO
FARMINGTON MUNICIPAL SCHOOL DISTRICT NO. 5
NON-MAJOR GOVERNMENTAL FUNDSCombining Statement of Revenues, Expenditures, and
Changes in Fund Balance
Year Ended June 30, 2019
Capital Projects Funds
Special Capital Outlay - Local
Special Capital Outlay - State
State SB-9 Match
Capital Improvements
SB-9Ed Technology Equipment Act
Fund #31300 Fund #31400 Fund #31700 Fund #31701 Fund #31900Revenues:
Taxes:Property -$ -$ -$ 2,941,986$ -$ Oil and gas - - - 185,890 -
Intergovernmental - federal grants - - - - - Intergovernmental - state grants - 1,140,290 - - - Contributions - private grants - - - - - Charges for services 390 - - - - Investment and interest income - - - - 20,588 Miscellaneous - - - - -
Total revenues 390 1,140,290 - 3,127,876 20,588
Expenditures:Current:
Instruction - - - - - Support services: Students - - - - - Instruction - - - - - General Administration - - - 29,323 - School Administration - - - - - Central Services - - - - - Operation & Maintenance of Plant 13,542 - - 4,431,705 1,302,341 Student transportation - - - - - Food services operations - - - - - Community services - - - - -
Capital outlay - 1,140,290 - 110,622 - Debt service:
Principal retirement - - - - - Bond interest paid - - - - -
Total expenditures 13,542 1,140,290 - 4,571,650 1,302,341
Excess (deficiency) of revenues over expenditures (13,152) - - (1,443,774) (1,281,753)
Other financing uses:Transfers In - - - - -
Net change in fund balance (13,152) - - (1,443,774) (1,281,753)
Fund balance at beginning of the year 944,840 48,375 179,517 3,567,047 2,290,633 Fund balance at end of the year 931,688$ 48,375$ 179,517$ 2,123,273$ 1,008,880$
( cont'd; 11 of 12 )
FINANCIAL SECTION
113 | P a g e

STATE OF NEW MEXICO
FARMINGTON MUNICIPAL SCHOOL DISTRICT NO. 5
NON-MAJOR GOVERNMENTAL FUNDSCombining Statement of Revenues, Expenditures, and
Changes in Fund Balance
Year Ended June 30, 2019
Total Nonmajor Capital Projects
Ed Tech Debt Service
Total Nonmajor
GovernmentalFunds Fund #43000 Funds
Revenues:Taxes:
Property 2,941,986$ 3,040,029$ 5,982,015$ Oil and gas 185,890 122,968 308,858
Intergovernmental - federal grants - - 7,648,016 Intergovernmental - state grants 1,140,290 - 2,777,225 Contributions - private grants - - 21,937 Charges for services 390 - 2,586,646 Investment and interest income 20,588 420 21,145 Miscellaneous - - 861
Total revenues 4,289,144 3,163,417 19,346,703
Expenditures:Current:
Instruction - - 3,656,473 Support services: Students - - 1,878,667 Instruction - - 140,779 General Administration 29,323 30,338 244,304 School Administration - - 149,640 Central Services - - 3,000 Operation & Maintenance of Plant 5,747,588 - 5,747,588 Student transportation - - 73,000 Food services operations - - 4,699,637 Community services - - 750
Capital outlay 1,250,912 - 1,367,556 Debt service:
Principal retirement - 3,200,000 3,200,000 Bond interest paid - 151,532 151,532
Total expenditures 7,027,823 3,381,870 21,312,926
Excess (deficiency) of revenues over expenditures (2,738,679) (218,453) (1,966,223)
Other financing uses:Transfers In - - 23,755
Net change in fund balance (2,738,679) (218,453) (1,942,468)
Fund balance at beginning of the year 7,030,412 3,524,025 12,463,174 Fund balance at end of the year 4,291,733$ 3,305,572$ 10,520,706$
( 12 of 12 )
FINANCIAL SECTION
114 | P a g e

FINANACIAL SECTION 115 | P a g e
OTHER SUPPLEMENTAL INFORMATION (NONMAJOR GOVERNMENTAL FUNDS – BUDGETARY PRESENTATION)

STATE OF NEW MEXICO
FARMINGTON MUNICIPAL SCHOOL DISTRICT NO. 5
FOOD SERVICE FUND - NO. 21000
Schedule of Revenues, Expenditures, and
Changes in Fund Balance - Budget and Actual (Non-GAAP Budgetary Basis)
Year Ended June 30, 2019
Variance with Final Budget
Budgeted Amounts Actual Amounts Positive
Original Final (Budgetary Basis) (Negative)Revenues:
Intergovernmental - federal grants 4,200,000$ 4,200,000$ 2,960,548$ (1,239,452)$ Intergovernmental - state grants - - 28,920 28,920 Charges for services 1,606,000 1,606,000 819,162 (786,838) Investment and interest income 400 400 137 (263) Miscellaneous 3,500 3,500 861 (2,639)
Total revenues 5,809,900 5,809,900 3,809,628 (2,000,272)
Expenditures:Current:
Food services operations 5,734,900 5,734,900 4,216,454 1,518,446 Capital outlay 75,000 75,000 5,992 69,008
Total expenditures 5,809,900 5,809,900 4,222,446 1,587,454
Excess (deficiency) of revenues over expenditures - - (412,818) (412,818)
Fund balance at beginning of the year - - 442,721 442,721
Fund balance at end of the year -$ -$ 29,903 29,903$
RECONCILIATION TO GAAP BASIS:Change in inventory (45,605) Change in grant receivable 430,443 Change in payables 1,127
Fund balance at end of the year (GAAP basis) 415,868$
FINANCIAL SECTION
116 | P a g eNONMAJOR SPECIAL REVENUE FUND

STATE OF NEW MEXICO
FARMINGTON MUNICIPAL SCHOOL DISTRICT NO. 5
ATHLETICS FUND - NO. 22000
Schedule of Revenues, Expenditures, and
Changes in Fund Balance - Budget and Actual (Non-GAAP Budgetary Basis)
Year Ended June 30, 2019
Variance with Final Budget
Budgeted Amounts Actual Amounts Positive
Original Final (Budgetary Basis) (Negative)Revenues:
Charges for services 274,698$ 441,899$ 454,190$ 12,291$
Expenditures:Current:
Instruction 269,777 434,978 417,171 17,807 Capital outlay 4,921 6,921 8,836 (1,915)
Total expenditures 274,698 441,899 426,007 15,892
Excess of revenues over expenditures - - 28,183 28,183
Fund balance at beginning of the year - - 214,708 214,708
Fund balance at end of the year -$ -$ 242,891 242,891$
RECONCILIATION TO GAAP BASIS:Change in payables -
Fund balance at end of the year (GAAP basis) 242,891$
NONMAJOR SPECIAL REVENUE FUND FINANCIAL SECTION
117 | P a g e

STATE OF NEW MEXICO
FARMINGTON MUNICIPAL SCHOOL DISTRICT NO. 5
ACTIVITIES FUND - NO. 23000
Schedule of Revenues, Expenditures, and
Changes in Fund Balance - Budget and Actual (Non-GAAP Budgetary Basis)
Year Ended June 30, 2019
Variance with Final Budget
Budgeted Amounts Actual Amounts Positive
Original Final (Budgetary Basis) (Negative)Revenues:
Charges for services 1,024,400$ 1,024,400$ 1,312,904$ 288,504$
Expenditures:Current:
Instruction 864,400 864,400 637,101 227,299 Capital outlay 160,000 160,000 77,738 82,262
Total expenditures 1,024,400 1,024,400 714,839 309,561
Excess of revenues over expenditures - - 598,065 598,065
Fund balance at beginning of the year - - 270,943 270,943
Fund balance at end of the year -$ -$ 869,008 869,008$
RECONCILIATION TO GAAP BASIS:Change in payables (8,164)
Fund balance at end of the year (GAAP basis) 860,844$
FINANCIAL SECTION
118 | P a g eNONMAJOR SPECIAL REVENUE FUND

STATE OF NEW MEXICO
FARMINGTON MUNICIPAL SCHOOL DISTRICT NO. 5
JAVITS GIFTED & TALENTED FUND - NO. 24102
Schedule of Revenues, Expenditures, and
Changes in Fund Balance - Budget and Actual (Non-GAAP Budgetary Basis)
Year Ended June 30, 2019
Variance with Final Budget
Budgeted Amounts Actual Amounts Positive
Original Final (Budgetary Basis) (Negative)Revenues:
Intergovernmental - federal grants -$ -$ -$ -$
Expenditures:Current:
Instruction - - - -
Excess of revenues over expenditures - - - -
Fund balance at beginning of the year - - - -
Fund balance at end of the year -$ -$ - -$
RECONCILIATION TO GAAP BASIS:Change in payables -
Fund balance at end of the year (GAAP basis) -$
NONMAJOR SPECIAL REVENUE FUND FINANCIAL SECTION
119 | P a g e

STATE OF NEW MEXICO
FARMINGTON MUNICIPAL SCHOOL DISTRICT NO. 5
NEW MEXICO AUTISM FUND - NO. 24108
Schedule of Revenues, Expenditures, and
Changes in Fund Balance - Budget and Actual (Non-GAAP Budgetary Basis)
Year Ended June 30, 2019
Variance with Final Budget
Budgeted Amounts Actual Amounts Positive
Original Final (Budgetary Basis) (Negative)Revenues:
Intergovernmental - federal grants -$ 7,353$ 5,998$ (1,355)$
Expenditures:Current:
Instruction - 695 - 695 Support services: Students - 6,658 - 6,658
Total expenditures - 7,353 - 7,353
Excess of revenues over expenditures - - 5,998 5,998
Fund balance at beginning of the year - - - -
Fund balance at end of the year -$ -$ 5,998 5,998$
RECONCILIATION TO GAAP BASIS:Change in grant receivable (5,998)
Fund balance at end of the year (GAAP basis) -$
FINANCIAL SECTION
120 | P a g eNONMAJOR SPECIAL REVENUE FUND

STATE OF NEW MEXICO
FARMINGTON MUNICIPAL SCHOOL DISTRICT NO. 5
PRESCHOOL IDEA-B FUND - NO. 24109
Schedule of Revenues, Expenditures, and
Changes in Fund Balance - Budget and Actual (Non-GAAP Budgetary Basis)
Year Ended June 30, 2019
Variance with Final Budget
Budgeted Amounts Actual Amounts Positive
Original Final (Budgetary Basis) (Negative)Revenues:
Intergovernmental - federal grants -$ 124,236$ 42,290$ (81,946)$
Expenditures:Current:
Instruction - 120,912 77,438 43,474 Support services: Students - 2,500 - 2,500 General Administration - 824 1,162 (338)
Total expenditures - 124,236 78,600 45,636
Excess (deficiency) of revenues over expenditures - - (36,310) (36,310)
Fund balance at beginning of the year - - - -
Fund balance at end of the year -$ -$ (36,310) (36,310)$
RECONCILIATION TO GAAP BASIS:Change in grant receivable 23,753 Change in deferred revenue 12,557
Fund balance at end of the year (GAAP basis) -$
NONMAJOR SPECIAL REVENUE FUND FINANCIAL SECTION
121 | P a g e

STATE OF NEW MEXICO
FARMINGTON MUNICIPAL SCHOOL DISTRICT NO. 5
EDUCATION OF HOMELESS FUND - NO. 24113
Schedule of Revenues, Expenditures, and
Changes in Fund Balance - Budget and Actual (Non-GAAP Budgetary Basis)
Year Ended June 30, 2019
Variance with Final Budget
Budgeted Amounts Actual Amounts Positive
Original Final (Budgetary Basis) (Negative)Revenues:
Intergovernmental - federal grants -$ 18,000$ 19,789$ 1,789$
Expenditures:Current:
Instruction - 17,660 17,660 - Support services: General Administration - 340 265 75
Total expenditures - 18,000 17,925 75
Excess of revenues over expenditures - - 1,864 1,864
Fund balance at beginning of the year - - - -
Fund balance at end of the year -$ -$ 1,864 1,864$
RECONCILIATION TO GAAP BASIS:Change in deferred revenue (1,864)
Fund balance at end of the year (GAAP basis) -$
FINANCIAL SECTION
122 | P a g eNONMAJOR SPECIAL REVENUE FUND

STATE OF NEW MEXICO
FARMINGTON MUNICIPAL SCHOOL DISTRICT NO. 5
IDEA-B PRIVATE SCHOOLS FUND - NO. 24115
Schedule of Revenues, Expenditures, and
Changes in Fund Balance - Budget and Actual (Non-GAAP Budgetary Basis)
Year Ended June 30, 2019
Variance with Final Budget
Budgeted Amounts Actual Amounts Positive
Original Final (Budgetary Basis) (Negative)Revenues:
Intergovernmental - federal grants -$ 6,224$ -$ (6,224)$
Expenditures:Current:
Support services: Students - 6,224 6,224 -
Excess (deficiency) of revenues over expenditures - - (6,224) (6,224)
Fund balance at beginning of the year - - - -
Fund balance at end of the year -$ -$ (6,224) (6,224)$
RECONCILIATION TO GAAP BASIS:Change in grant receivable 6,224
Fund balance at end of the year (GAAP basis) -$
NONMAJOR SPECIAL REVENUE FUND FINANCIAL SECTION
123 | P a g e

STATE OF NEW MEXICO
FARMINGTON MUNICIPAL SCHOOL DISTRICT NO. 5
FRESH FRUITS AND VEGETABLES FUND - NO. 24118
Schedule of Revenues, Expenditures, and
Changes in Fund Balance - Budget and Actual (Non-GAAP Budgetary Basis)
Year Ended June 30, 2019
Variance with Final Budget
Budgeted Amounts Actual Amounts Positive
Original Final (Budgetary Basis) (Negative)Revenues:
Intergovernmental - federal grants -$ 87,963$ 92,219$ 4,256$
Expenditures:Current:
Food services operations - 87,963 77,334 10,629
Excess of revenues over expenditures - - 14,885 14,885
Fund balance at beginning of the year - - - -
Fund balance at end of the year -$ -$ 14,885 14,885$
RECONCILIATION TO GAAP BASIS:Change in grant receivable (14,885)
Fund balance at end of the year (GAAP basis) -$
FINANCIAL SECTION
124 | P a g eNONMAJOR SPECIAL REVENUE FUND

STATE OF NEW MEXICO
FARMINGTON MUNICIPAL SCHOOL DISTRICT NO. 5
21ST CENTURY COMMUNITY LEARNING CENTERS FUND - NO. 24119
Schedule of Revenues, Expenditures, and
Changes in Fund Balance - Budget and Actual (Non-GAAP Budgetary Basis)
Year Ended June 30, 2019
Variance with Final Budget
Budgeted Amounts Actual Amounts Positive
Original Final (Budgetary Basis) (Negative)Revenues:
Intergovernmental - federal grants 175,767$ 189,807$ 170,487$ (19,320)$
Expenditures:Current:
Instruction 136,128 149,961 136,403 13,558 Support services: Students 9,532 9,532 9,183 349 General Administration 24,658 24,865 24,066 799 Central Services 3,300 3,300 3,000 300 Community services 2,149 2,149 750 1,399
Total expenditures 175,767 189,807 173,402 16,405
Excess (deficiency) of revenues over expenditures - - (2,915) (2,915)
Fund balance at beginning of the year - - - -
Fund balance at end of the year -$ -$ (2,915) (2,915)$
RECONCILIATION TO GAAP BASIS:Change in grant receivable 2,915
Fund balance at end of the year (GAAP basis) -$
NONMAJOR SPECIAL REVENUE FUND FINANCIAL SECTION
125 | P a g e

STATE OF NEW MEXICO
FARMINGTON MUNICIPAL SCHOOL DISTRICT NO. 5
TITLE I - 1003G FUND - NO. 24124
Schedule of Revenues, Expenditures, and
Changes in Fund Balance - Budget and Actual (Non-GAAP Budgetary Basis)
Year Ended June 30, 2019
Variance with Final Budget
Budgeted Amounts Actual Amounts Positive
Original Final (Budgetary Basis) (Negative)Revenues:
Intergovernmental - federal grants -$ 393,789$ 300,622$ (93,167)$
Expenditures:Current:
Instruction - 363,519 287,162 76,357 Support services: Students - 15,778 13,748 2,030 General Administration - 5,592 4,668 924 School Administration - 8,900 10,301 (1,401)
Total expenditures - 393,789 315,879 77,910
Excess (deficiency) of revenues over expenditures - - (15,257) (15,257)
Fund balance at beginning of the year - - - -
Fund balance at end of the year -$ -$ (15,257) (15,257)$
RECONCILIATION TO GAAP BASIS:Change in grant receivable 15,257
Fund balance at end of the year (GAAP basis) -$
FINANCIAL SECTION
126 | P a g eNONMAJOR SPECIAL REVENUE FUND

STATE OF NEW MEXICO
FARMINGTON MUNICIPAL SCHOOL DISTRICT NO. 5
IDEA-B STUDENT SUCCESS FUND - NO. 24132
Schedule of Revenues, Expenditures, and
Changes in Fund Balance - Budget and Actual (Non-GAAP Budgetary Basis)
Year Ended June 30, 2019
Variance with Final Budget
Budgeted Amounts Actual Amounts Positive
Original Final (Budgetary Basis) (Negative)Revenues:
Intergovernmental - federal grants -$ 22,000$ -$ (22,000)$
Expenditures:Current:
Instruction - 22,000 19,204 2,796
Excess (deficiency) of revenues over expenditures - - (19,204) (19,204)
Fund balance at beginning of the year - - - -
Fund balance at end of the year -$ -$ (19,204) (19,204)$
RECONCILIATION TO GAAP BASIS:Change in grant receivable 19,204
Fund balance at end of the year (GAAP basis) -$
NONMAJOR SPECIAL REVENUE FUND FINANCIAL SECTION
127 | P a g e

STATE OF NEW MEXICO
FARMINGTON MUNICIPAL SCHOOL DISTRICT NO. 5
TITLE III ENGLISH LANGUAGE FUND - NO. 24153
Schedule of Revenues, Expenditures, and
Changes in Fund Balance - Budget and Actual (Non-GAAP Budgetary Basis)
Year Ended June 30, 2019
Variance with Final Budget
Budgeted Amounts Actual Amounts Positive
Original Final (Budgetary Basis) (Negative)Revenues:
Intergovernmental - federal grants 103,431$ 160,741$ 107,067$ (53,674)$
Expenditures:Current:
Instruction 17,000 21,500 7,751 13,749 Support services: Students 84,902 137,712 90,617 47,095 General Administration 1,529 1,529 1,476 53
Total expenditures 103,431 160,741 99,844 60,897
Excess of revenues over expenditures - - 7,223 7,223
Fund balance at beginning of the year - - - -
Fund balance at end of the year -$ -$ 7,223 7,223$
RECONCILIATION TO GAAP BASIS:Change in grant receivable (7,223)
Fund balance at end of the year (GAAP basis) -$
FINANCIAL SECTION
128 | P a g eNONMAJOR SPECIAL REVENUE FUND

STATE OF NEW MEXICO
FARMINGTON MUNICIPAL SCHOOL DISTRICT NO. 5
TITLE II TEACHER QUALITY FUND - NO. 24154
Schedule of Revenues, Expenditures, and
Changes in Fund Balance - Budget and Actual (Non-GAAP Budgetary Basis)
Year Ended June 30, 2019
Variance with Final Budget
Budgeted Amounts Actual Amounts Positive
Original Final (Budgetary Basis) (Negative)Revenues:
Intergovernmental - federal grants 478,577$ 901,150$ 421,830$ (479,320)$
Expenditures:Current:
Instruction 471,398 491,186 379,189 111,997 Support services: Students - 396,540 173,187 223,353 General Administration 7,179 13,424 10,487 2,937
Total expenditures 478,577 901,150 562,863 338,287
Excess (deficiency) of revenues over expenditures - - (141,033) (141,033)
Other financing uses:Transfers In - - 23,755 23,755
Net change in fund balance - - (117,278) (117,278)
Fund balance at beginning of the year - - - -
Fund balance at end of the year -$ -$ (117,278) (117,278)$
RECONCILIATION TO GAAP BASIS:Change in grant receivable 106,778 Change in payables 10,500
Fund balance at end of the year (GAAP basis) -$
NONMAJOR SPECIAL REVENUE FUND FINANCIAL SECTION
129 | P a g e

STATE OF NEW MEXICO
FARMINGTON MUNICIPAL SCHOOL DISTRICT NO. 5
CARL D PERKINS - JAG FUND - NO. 24171
Schedule of Revenues, Expenditures, and
Changes in Fund Balance - Budget and Actual (Non-GAAP Budgetary Basis)
Year Ended June 30, 2019
Variance with Final Budget
Budgeted Amounts Actual Amounts Positive
Original Final (Budgetary Basis) (Negative)Revenues:
Intergovernmental - federal grants -$ 60,000$ 29,999$ (30,001)$
Expenditures:Current:
Support services: Students - 59,100 51,868 7,232 General Administration - 900 778 122
Total expenditures - 60,000 52,646 7,354
Excess (deficiency) of revenues over expenditures - - (22,647) (22,647)
Fund balance at beginning of the year - - - -
Fund balance at end of the year -$ -$ (22,647) (22,647)$
RECONCILIATION TO GAAP BASIS:Change in grant receivable 22,647
Fund balance at end of the year (GAAP basis) -$
FINANCIAL SECTION
130 | P a g eNONMAJOR SPECIAL REVENUE FUND

STATE OF NEW MEXICO
FARMINGTON MUNICIPAL SCHOOL DISTRICT NO. 5
CARL D PERKINS FUND - NO. 24174
Schedule of Revenues, Expenditures, and
Changes in Fund Balance - Budget and Actual (Non-GAAP Budgetary Basis)
Year Ended June 30, 2019
Variance with Final Budget
Budgeted Amounts Actual Amounts Positive
Original Final (Budgetary Basis) (Negative)Revenues:
Intergovernmental - federal grants 86,654$ 96,500$ 52,583$ (43,917)$
Expenditures:Current:
Instruction 83,929 76,129 68,494 7,635 Support services: General Administration 2,725 2,725 804 1,921
Capital outlay - 17,646 17,610 36 Total expenditures 86,654 96,500 86,908 9,592
Excess (deficiency) of revenues over expenditures - - (34,325) (34,325)
Fund balance at beginning of the year - - - -
Fund balance at end of the year -$ -$ (34,325) (34,325)$
RECONCILIATION TO GAAP BASIS:Change in grant receivable 29,274 Change in deferred revenue 5,051
Fund balance at end of the year (GAAP basis) -$
NONMAJOR SPECIAL REVENUE FUND FINANCIAL SECTION
131 | P a g e

STATE OF NEW MEXICO
FARMINGTON MUNICIPAL SCHOOL DISTRICT NO. 5
CARL D PERKINS SECONDARY FUND - NO. 24175
Schedule of Revenues, Expenditures, and
Changes in Fund Balance - Budget and Actual (Non-GAAP Budgetary Basis)
Year Ended June 30, 2019
Variance with Final Budget
Budgeted Amounts Actual Amounts Positive
Original Final (Budgetary Basis) (Negative)Revenues:
Intergovernmental - federal grants -$ -$ -$ -$
Expenditures:Current:
Instruction - - - -
Excess of revenues over expenditures - - - -
Fund balance at beginning of the year - - - -
Fund balance at end of the year -$ -$ - -$
RECONCILIATION TO GAAP BASIS:Change in payables -
Fund balance at end of the year (GAAP basis) -$
FINANCIAL SECTION
132 | P a g eNONMAJOR SPECIAL REVENUE FUND

STATE OF NEW MEXICO
FARMINGTON MUNICIPAL SCHOOL DISTRICT NO. 5
CARL D PERKINS SECONDARY REDISTRIBUTION FUND - NO. 24176
Schedule of Revenues, Expenditures, and
Changes in Fund Balance - Budget and Actual (Non-GAAP Budgetary Basis)
Year Ended June 30, 2019
Variance with Final Budget
Budgeted Amounts Actual Amounts Positive
Original Final (Budgetary Basis) (Negative)Revenues:
Intergovernmental - federal grants -$ 17,920$ 19,935$ 2,015$
Expenditures:Current:
Instruction - 11,186 11,186 - Support services: General Administration - 266 166 100
Capital outlay - 6,468 6,468 - Total expenditures - 17,920 17,820 100
Excess of revenues over expenditures - - 2,115 2,115
Fund balance at beginning of the year - - - -
Fund balance at end of the year -$ -$ 2,115 2,115$
RECONCILIATION TO GAAP BASIS:Change in grant receivable (2,115)
Fund balance at end of the year (GAAP basis) -$
NONMAJOR SPECIAL REVENUE FUND FINANCIAL SECTION
133 | P a g e

STATE OF NEW MEXICO
FARMINGTON MUNICIPAL SCHOOL DISTRICT NO. 5
CARL D PERKINS HSTW - CURRENT FUND - NO. 24180
Schedule of Revenues, Expenditures, and
Changes in Fund Balance - Budget and Actual (Non-GAAP Budgetary Basis)
Year Ended June 30, 2019
Variance with Final Budget
Budgeted Amounts Actual Amounts Positive
Original Final (Budgetary Basis) (Negative)Revenues:
Intergovernmental - federal grants -$ -$ -$ -$
Expenditures:Current:
Instruction - - - -
Excess of revenues over expenditures - - - -
Fund balance at beginning of the year - - - -
Fund balance at end of the year -$ -$ - -$
RECONCILIATION TO GAAP BASIS:Change in payables -
Fund balance at end of the year (GAAP basis) -$
FINANCIAL SECTION
134 | P a g eNONMAJOR SPECIAL REVENUE FUND

STATE OF NEW MEXICO
FARMINGTON MUNICIPAL SCHOOL DISTRICT NO. 5
CARL D PERKINS HSTW - PY UNLIQ. OBLIG FUND - NO. 24181
Schedule of Revenues, Expenditures, and
Changes in Fund Balance - Budget and Actual (Non-GAAP Budgetary Basis)
Year Ended June 30, 2019
Variance with Final Budget
Budgeted Amounts Actual Amounts Positive
Original Final (Budgetary Basis) (Negative)Revenues:
Intergovernmental - federal grants -$ -$ -$ -$
Expenditures:Current:
Instruction - - - -
Excess of revenues over expenditures - - - -
Fund balance at beginning of the year - - - -
Fund balance at end of the year -$ -$ - -$
RECONCILIATION TO GAAP BASIS:Change in payables -
Fund balance at end of the year (GAAP basis) -$
NONMAJOR SPECIAL REVENUE FUND FINANCIAL SECTION
135 | P a g e

STATE OF NEW MEXICO
FARMINGTON MUNICIPAL SCHOOL DISTRICT NO. 5
CARL D PERKINS HSTW - REDISTRIBUTION FUND - NO. 24182
Schedule of Revenues, Expenditures, and
Changes in Fund Balance - Budget and Actual (Non-GAAP Budgetary Basis)
Year Ended June 30, 2019
Variance with Final Budget
Budgeted Amounts Actual Amounts Positive
Original Final (Budgetary Basis) (Negative)Revenues:
Intergovernmental - federal grants -$ -$ -$ -$
Expenditures:Current:
Instruction - - - -
Excess of revenues over expenditures - - - -
Fund balance at beginning of the year - - - -
Fund balance at end of the year -$ -$ - -$
RECONCILIATION TO GAAP BASIS:Change in payables -
Fund balance at end of the year (GAAP basis) -$
FINANCIAL SECTION
136 | P a g eNONMAJOR SPECIAL REVENUE FUND

STATE OF NEW MEXICO
FARMINGTON MUNICIPAL SCHOOL DISTRICT NO. 5
IDEA-B STAY IN SCHOOL FUND - NO. 24188
Schedule of Revenues, Expenditures, and
Changes in Fund Balance - Budget and Actual (Non-GAAP Budgetary Basis)
Year Ended June 30, 2019
Variance with Final Budget
Budgeted Amounts Actual Amounts Positive
Original Final (Budgetary Basis) (Negative)Revenues:
Intergovernmental - federal grants -$ 271,050$ 99,558$ (171,492)$
Expenditures:Current:
Instruction - 63,677 25,977 37,700 Support services: Students - 207,373 189,278 18,095
Total expenditures - 271,050 215,255 55,795
Excess (deficiency) of revenues over expenditures - - (115,697) (115,697)
Fund balance at beginning of the year - - - -
Fund balance at end of the year -$ -$ (115,697) (115,697)$
RECONCILIATION TO GAAP BASIS:Change in grant receivable 115,697
Fund balance at end of the year (GAAP basis) -$
NONMAJOR SPECIAL REVENUE FUND FINANCIAL SECTION
137 | P a g e

STATE OF NEW MEXICO
FARMINGTON MUNICIPAL SCHOOL DISTRICT NO. 5
ACADEMIC ENRICHMENT FUND - NO. 24189
Schedule of Revenues, Expenditures, and
Changes in Fund Balance - Budget and Actual (Non-GAAP Budgetary Basis)
Year Ended June 30, 2019
Variance with Final Budget
Budgeted Amounts Actual Amounts Positive
Original Final (Budgetary Basis) (Negative)Revenues:
Intergovernmental - federal grants -$ 362,384$ 34,164$ (328,220)$
Expenditures:Current:
Instruction - 325,157 63,166 261,991 Support services: General Administration - 5,227 1,035 4,192 School Administration - 32,000 5,577 26,423
Total expenditures - 362,384 69,778 292,606
Excess (deficiency) of revenues over expenditures - - (35,614) (35,614)
Fund balance at beginning of the year - - - -
Fund balance at end of the year -$ -$ (35,614) (35,614)$
RECONCILIATION TO GAAP BASIS:Change in grant receivable 35,614
Fund balance at end of the year (GAAP basis) -$
FINANCIAL SECTION
138 | P a g eNONMAJOR SPECIAL REVENUE FUND

STATE OF NEW MEXICO
FARMINGTON MUNICIPAL SCHOOL DISTRICT NO. 5
TITLE I COMPREHENSIVE SUPPORT & IMPROVEMENT FUND - NO. 24190
Schedule of Revenues, Expenditures, and
Changes in Fund Balance - Budget and Actual (Non-GAAP Budgetary Basis)
Year Ended June 30, 2019
Variance with Final Budget
Budgeted Amounts Actual Amounts Positive
Original Final (Budgetary Basis) (Negative)Revenues:
Intergovernmental - federal grants -$ 191,000$ -$ (191,000)$
Expenditures:Current:
Instruction - 146,750 8,710 138,040 Support services: General Administration - 12,500 131 12,369
Capital outlay - 31,750 - 31,750 Total expenditures - 191,000 8,841 182,159
Excess (deficiency) of revenues over expenditures - - (8,841) (8,841)
Fund balance at beginning of the year - - - -
Fund balance at end of the year -$ -$ (8,841) (8,841)$
RECONCILIATION TO GAAP BASIS:Change in grant receivable 10,991 Change in payables (2,150)
Fund balance at end of the year (GAAP basis) -$
NONMAJOR SPECIAL REVENUE FUND FINANCIAL SECTION
139 | P a g e

STATE OF NEW MEXICO
FARMINGTON MUNICIPAL SCHOOL DISTRICT NO. 5
TITLE I - HS REDESIGN FUND - NO. 24191
Schedule of Revenues, Expenditures, and
Changes in Fund Balance - Budget and Actual (Non-GAAP Budgetary Basis)
Year Ended June 30, 2019
Variance with Final Budget
Budgeted Amounts Actual Amounts Positive
Original Final (Budgetary Basis) (Negative)Revenues:
Intergovernmental - federal grants -$ 100,000$ 20,206$ (79,794)$
Expenditures:Current:
Instruction - 71,500 53,705 17,795 Support services: Students - 7,500 3,152 4,348 General Administration - 4,000 956 3,044 School Administration - - 6,909 (6,909)
Capital outlay - 17,000 - 17,000 Total expenditures - 100,000 64,722 35,278
Excess (deficiency) of revenues over expenditures - - (44,516) (44,516)
Fund balance at beginning of the year - - - -
Fund balance at end of the year -$ -$ (44,516) (44,516)$
RECONCILIATION TO GAAP BASIS:Change in grant receivable 44,516
Fund balance at end of the year (GAAP basis) -$
FINANCIAL SECTION
140 | P a g eNONMAJOR SPECIAL REVENUE FUND

STATE OF NEW MEXICO
FARMINGTON MUNICIPAL SCHOOL DISTRICT NO. 5
ARRA - IDEA-B CEIS FUND - NO. 24212
Schedule of Revenues, Expenditures, and
Changes in Fund Balance - Budget and Actual (Non-GAAP Budgetary Basis)
Year Ended June 30, 2019
Variance with Final Budget
Budgeted Amounts Actual Amounts Positive
Original Final (Budgetary Basis) (Negative)Revenues:
Intergovernmental - federal grants -$ -$ -$ -$
Expenditures:Current:
Instruction - - - -
Excess of revenues over expenditures - - - -
Fund balance at beginning of the year - - - -
Fund balance at end of the year -$ -$ - -$
RECONCILIATION TO GAAP BASIS:Change in payables -
Fund balance at end of the year (GAAP basis) -$
NONMAJOR SPECIAL REVENUE FUND FINANCIAL SECTION
141 | P a g e

STATE OF NEW MEXICO
FARMINGTON MUNICIPAL SCHOOL DISTRICT NO. 5
JOHNSON O'MALLEY FUND - NO. 25131
Schedule of Revenues, Expenditures, and
Changes in Fund Balance - Budget and Actual (Non-GAAP Budgetary Basis)
Year Ended June 30, 2019
Variance with Final Budget
Budgeted Amounts Actual Amounts Positive
Original Final (Budgetary Basis) (Negative)Revenues:
Intergovernmental - federal grants -$ 295,852$ 231,128$ (64,724)$
Expenditures:Current:
Instruction - 118,837 86,212 32,625 Support services: Students - 155,983 140,226 15,757 General Administration - 15,265 13,617 1,648 School Administration - 5,767 4,552 1,215
Total expenditures - 295,852 244,607 51,245
Excess (deficiency) of revenues over expenditures - - (13,479) (13,479)
Fund balance at beginning of the year - - - -
Fund balance at end of the year -$ -$ (13,479) (13,479)$
RECONCILIATION TO GAAP BASIS:Change in grant receivable 13,479
Fund balance at end of the year (GAAP basis) -$
FINANCIAL SECTION
142 | P a g eNONMAJOR SPECIAL REVENUE FUND

STATE OF NEW MEXICO
FARMINGTON MUNICIPAL SCHOOL DISTRICT NO. 5
IMPACT AID SPECIAL EDUCATION FUND - NO. 25145
Schedule of Revenues, Expenditures, and
Changes in Fund Balance - Budget and Actual (Non-GAAP Budgetary Basis)
Year Ended June 30, 2019
Variance with Final Budget
Budgeted Amounts Actual Amounts Positive
Original Final (Budgetary Basis) (Negative)Revenues:
Intergovernmental - federal grants -$ -$ -$ -$
Expenditures:Current:
Support services: Students - 863 - 863
Excess (deficiency) of revenues over expenditures - (863) - 863
Beginning cash balance budgeted - 863 - (863)
Fund balance at beginning of the year - - 863 863
Fund balance at end of the year -$ -$ 863 863$
RECONCILIATION TO GAAP BASIS:Change in payables -
Fund balance at end of the year (GAAP basis) 863$
NONMAJOR SPECIAL REVENUE FUND FINANCIAL SECTION
143 | P a g e

STATE OF NEW MEXICO
FARMINGTON MUNICIPAL SCHOOL DISTRICT NO. 5
IMPACT AID INDIAN EDUCATION FUND - NO. 25147
Schedule of Revenues, Expenditures, and
Changes in Fund Balance - Budget and Actual (Non-GAAP Budgetary Basis)
Year Ended June 30, 2019
Variance with Final Budget
Budgeted Amounts Actual Amounts Positive
Original Final (Budgetary Basis) (Negative)Revenues:
Intergovernmental - federal grants -$ -$ -$ -$
Expenditures:Current:
Instruction - 14,000 129 13,871 Support services: Students - 19,900 1,630 18,270 General Administration - 563 26 537
Total expenditures - 34,463 1,785 32,678
Excess (deficiency) of revenues over expenditures - (34,463) (1,785) 32,678
Beginning cash balance budgeted - 34,463 - (34,463)
Fund balance at beginning of the year - - 34,463 34,463
Fund balance at end of the year -$ -$ 32,678 32,678$
RECONCILIATION TO GAAP BASIS:Change in payables -
Fund balance at end of the year (GAAP basis) 32,678$
FINANCIAL SECTION
144 | P a g eNONMAJOR SPECIAL REVENUE FUND

STATE OF NEW MEXICO
FARMINGTON MUNICIPAL SCHOOL DISTRICT NO. 5
TITLE XIX MEDICAID FUND - NO. 25153
Schedule of Revenues, Expenditures, and
Changes in Fund Balance - Budget and Actual (Non-GAAP Budgetary Basis)
Year Ended June 30, 2019
Variance with Final Budget
Budgeted Amounts Actual Amounts Positive
Original Final (Budgetary Basis) (Negative)Revenues:
Intergovernmental - federal grants -$ 236,410$ 891,188$ 654,778$
Expenditures:Current:
Support services: Students - 736,410 399,845 336,565 Instruction - 200,000 60,436 139,564 General Administration - 143,133 36,328 106,805
Total expenditures - 1,079,543 496,609 582,934
Excess (deficiency) of revenues over expenditures - (843,133) 394,579 1,237,712
Beginning cash balance budgeted - 843,133 - (843,133)
Fund balance at beginning of the year - - 843,133 843,133
Fund balance at end of the year -$ -$ 1,237,712 1,237,712$
RECONCILIATION TO GAAP BASIS:Change in payables (1,099)
Fund balance at end of the year (GAAP basis) 1,236,613$
NONMAJOR SPECIAL REVENUE FUND FINANCIAL SECTION
145 | P a g e

STATE OF NEW MEXICO
FARMINGTON MUNICIPAL SCHOOL DISTRICT NO. 5
INDIAN ED FORMULA GRANT FUND - NO. 25184
Schedule of Revenues, Expenditures, and
Changes in Fund Balance - Budget and Actual (Non-GAAP Budgetary Basis)
Year Ended June 30, 2019
Variance with Final Budget
Budgeted Amounts Actual Amounts Positive
Original Final (Budgetary Basis) (Negative)Revenues:
Intergovernmental - federal grants -$ 753,414$ 550,625$ (202,789)$
Expenditures:Current:
Instruction - 346,346 55,478 290,868 Support services: Students - 392,584 357,607 34,977 General Administration - 84,293 81,980 2,313 School Administration - 131,947 121,481 10,466 Operation & Maintenance of Plant - 2,058 - 2,058
Total expenditures - 957,228 616,546 340,682
Excess (deficiency) of revenues over expenditures - (203,814) (65,921) 137,893
Beginning cash balance budgeted - 203,814 - (203,814)
Fund balance at beginning of the year - - 56,814 56,814
Fund balance at end of the year -$ -$ (9,107) (9,107)$
RECONCILIATION TO GAAP BASIS:Change in grant receivable 66,223 Change in payables (301)
Fund balance at end of the year (GAAP basis) 56,815$
FINANCIAL SECTION
146 | P a g eNONMAJOR SPECIAL REVENUE FUND

STATE OF NEW MEXICO
FARMINGTON MUNICIPAL SCHOOL DISTRICT NO. 5
MENTORING FOR SAFE SCHOOLS FUND - NO. 25187
Schedule of Revenues, Expenditures, and
Changes in Fund Balance - Budget and Actual (Non-GAAP Budgetary Basis)
Year Ended June 30, 2019
Variance with Final Budget
Budgeted Amounts Actual Amounts Positive
Original Final (Budgetary Basis) (Negative)Revenues:
Intergovernmental - federal grants -$ -$ -$ -$
Expenditures:Instruction - - - -
Excess (deficiency) of revenuesExcess of revenues over expenditures - - - -
Fund balance at beginning of the year - - - -
Fund balance at end of the year -$ -$ - -$
RECONCILIATION TO GAAP BASIS:Change in deferred revenue 1
Fund balance at end of the year (GAAP basis) 1$
NONMAJOR SPECIAL REVENUE FUND FINANCIAL SECTION
147 | P a g e

STATE OF NEW MEXICO
FARMINGTON MUNICIPAL SCHOOL DISTRICT NO. 5
NATIVE AMERICAN PROGRAM FUND - NO. 25248
Schedule of Revenues, Expenditures, and
Changes in Fund Balance - Budget and Actual (Non-GAAP Budgetary Basis)
Year Ended June 30, 2019
Variance with Final Budget
Budgeted Amounts Actual Amounts Positive
Original Final (Budgetary Basis) (Negative)Revenues:
Intergovernmental - federal grants -$ 279,059$ 329,080$ 50,021$
Expenditures:Current:
Instruction - 59,500 3,802 55,698 Support services: Students - 390,933 349,447 41,486 General Administration - 6,860 5,299 1,561
Total expenditures - 457,293 358,548 98,745
Excess (deficiency) of revenues over expenditures - (178,234) (29,468) 148,766
Beginning cash balance budgeted - 178,234 - (178,234)
Fund balance at beginning of the year - - - -
Fund balance at end of the year -$ -$ (29,468) (29,468)$
RECONCILIATION TO GAAP BASIS:Change in grant receivable 7,645 Change in payables (2,346) Change in deferred revenue 24,169
Fund balance at end of the year (GAAP basis) -$
FINANCIAL SECTION
148 | P a g eNONMAJOR SPECIAL REVENUE FUND

STATE OF NEW MEXICO
FARMINGTON MUNICIPAL SCHOOL DISTRICT NO. 5
KELLOGG FOUNDATION FUND - NO. 26121
Schedule of Revenues, Expenditures, and
Changes in Fund Balance - Budget and Actual (Non-GAAP Budgetary Basis)
Year Ended June 30, 2019
Variance with Final Budget
Budgeted Amounts Actual Amounts Positive
Original Final (Budgetary Basis) (Negative)Revenues:
Contributions - private grants -$ -$ -$ -$
Expenditures:Current:
Instruction - - - -
Excess of revenues over expenditures - - - -
Fund balance at beginning of the year - - 14,452 14,452
Fund balance at end of the year -$ -$ 14,452 14,452$
RECONCILIATION TO GAAP BASIS:Change in payables -
Fund balance at end of the year (GAAP basis) 14,452$
NONMAJOR SPECIAL REVENUE FUND FINANCIAL SECTION
149 | P a g e

STATE OF NEW MEXICO
FARMINGTON MUNICIPAL SCHOOL DISTRICT NO. 5
DUAL CREDIT INSTRUCTIONAL MATERIALS FUND - NO. 27103
Schedule of Revenues, Expenditures, and
Changes in Fund Balance - Budget and Actual (Non-GAAP Budgetary Basis)
Year Ended June 30, 2019
Variance with Final Budget
Budgeted Amounts Actual Amounts Positive
Original Final (Budgetary Basis) (Negative)Revenues:
Intergovernmental - state grants -$ 48,704$ 38,675$ (10,029)$
Expenditures:Current:
Instruction - 48,704 48,704 -
Excess (deficiency) of revenues over expenditures - - (10,029) (10,029)
Fund balance at beginning of the year - - - -
Fund balance at end of the year -$ -$ (10,029) (10,029)$
RECONCILIATION TO GAAP BASIS:Change in grant receivable 10,029
Fund balance at end of the year (GAAP basis) -$
FINANCIAL SECTION
150 | P a g eNONMAJOR SPECIAL REVENUE FUND

STATE OF NEW MEXICO
FARMINGTON MUNICIPAL SCHOOL DISTRICT NO. 5
LIBRARIES GO BOND 2012 FUND - NO. 27107
Schedule of Revenues, Expenditures, and
Changes in Fund Balance - Budget and Actual (Non-GAAP Budgetary Basis)
Year Ended June 30, 2019
Variance with Final Budget
Budgeted Amounts Actual Amounts Positive
Original Final (Budgetary Basis) (Negative)Revenues:
Intergovernmental - state grants 82,603$ 82,603$ 74,868$ (7,735)$
Expenditures:Current:
Support services: Instruction 82,603 82,603 80,343 2,260
Excess (deficiency) of revenues over expenditures - - (5,475) (5,475)
Fund balance at beginning of the year - - - -
Fund balance at end of the year -$ -$ (5,475) (5,475)$
RECONCILIATION TO GAAP BASIS:Change in grant receivable 5,475
Fund balance at end of the year (GAAP basis) -$
NONMAJOR SPECIAL REVENUE FUND FINANCIAL SECTION
151 | P a g e

STATE OF NEW MEXICO
FARMINGTON MUNICIPAL SCHOOL DISTRICT NO. 5
READS TO LEAD FUND - NO. 27114
Schedule of Revenues, Expenditures, and
Changes in Fund Balance - Budget and Actual (Non-GAAP Budgetary Basis)
Year Ended June 30, 2019
Variance with Final Budget
Budgeted Amounts Actual Amounts Positive
Original Final (Budgetary Basis) (Negative)Revenues:
Intergovernmental - state grants 202,229$ 202,229$ 248,268$ 46,039$
Expenditures:Current:
Instruction 114,150 114,150 110,573 3,577 Support services: Students 86,073 86,073 76,754 9,319 General Administration 2,006 2,006 - 2,006
Total expenditures 202,229 202,229 187,327 14,902
Excess of revenues over expenditures - - 60,941 60,941
Fund balance at beginning of the year - - - -
Fund balance at end of the year -$ -$ 60,941 60,941$
RECONCILIATION TO GAAP BASIS:Change in grant receivable (60,941)
Fund balance at end of the year (GAAP basis) -$
FINANCIAL SECTION
152 | P a g eNONMAJOR SPECIAL REVENUE FUND
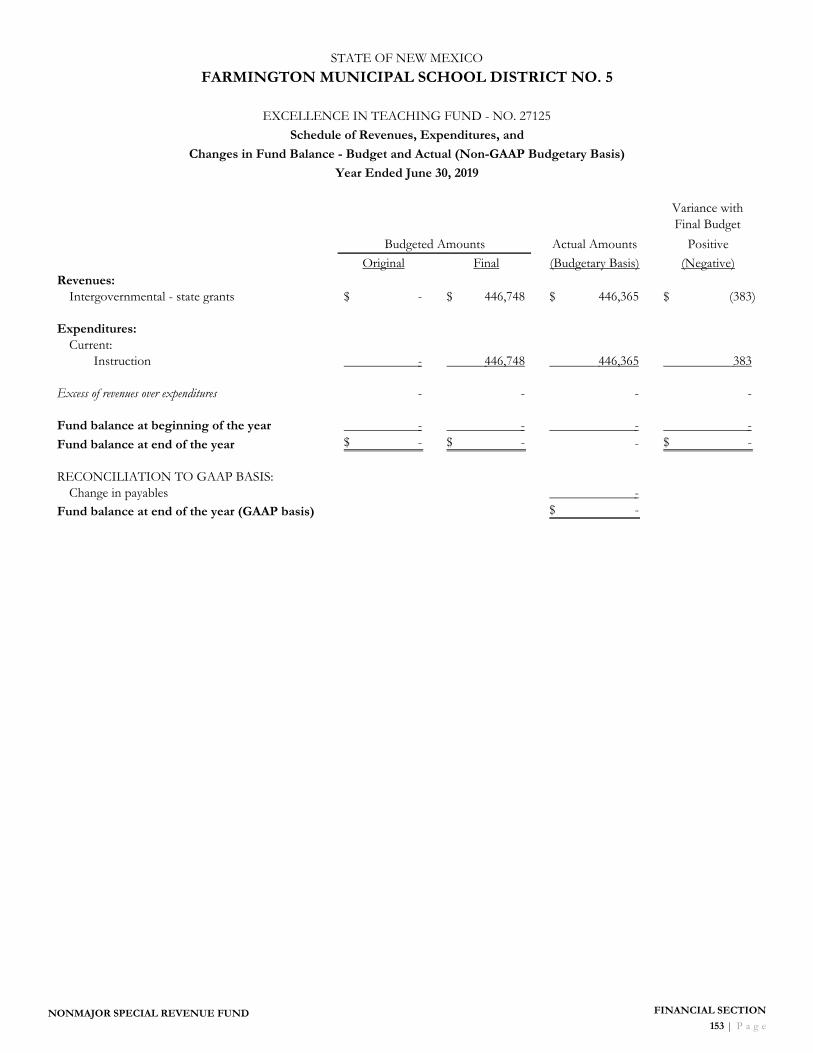
STATE OF NEW MEXICO
FARMINGTON MUNICIPAL SCHOOL DISTRICT NO. 5
EXCELLENCE IN TEACHING FUND - NO. 27125
Schedule of Revenues, Expenditures, and
Changes in Fund Balance - Budget and Actual (Non-GAAP Budgetary Basis)
Year Ended June 30, 2019
Variance with Final Budget
Budgeted Amounts Actual Amounts Positive
Original Final (Budgetary Basis) (Negative)Revenues:
Intergovernmental - state grants -$ 446,748$ 446,365$ (383)$
Expenditures:Current:
Instruction - 446,748 446,365 383
Excess of revenues over expenditures - - - -
Fund balance at beginning of the year - - - -
Fund balance at end of the year -$ -$ - -$
RECONCILIATION TO GAAP BASIS:Change in payables -
Fund balance at end of the year (GAAP basis) -$
NONMAJOR SPECIAL REVENUE FUND FINANCIAL SECTION
153 | P a g e

STATE OF NEW MEXICO
FARMINGTON MUNICIPAL SCHOOL DISTRICT NO. 5
RECRUITMENT SUPPORT FUND - NO. 27128
Schedule of Revenues, Expenditures, and
Changes in Fund Balance - Budget and Actual (Non-GAAP Budgetary Basis)
Year Ended June 30, 2019
Variance with Final Budget
Budgeted Amounts Actual Amounts Positive
Original Final (Budgetary Basis) (Negative)Revenues:
Intergovernmental - state grants -$ -$ 20,203$ 20,203$
Expenditures:Instruction - - - -
Excess of revenues over expenditures - - 20,203 20,203
Fund balance at beginning of the year - - - -
Fund balance at end of the year -$ -$ 20,203 20,203$
RECONCILIATION TO GAAP BASIS:Change in grant receivable (20,203)
Fund balance at end of the year (GAAP basis) -$
FINANCIAL SECTION
154 | P a g eNONMAJOR SPECIAL REVENUE FUND

STATE OF NEW MEXICO
FARMINGTON MUNICIPAL SCHOOL DISTRICT NO. 5
PRE-K INITIATIVE FUND - NO. 27149
Schedule of Revenues, Expenditures, and
Changes in Fund Balance - Budget and Actual (Non-GAAP Budgetary Basis)
Year Ended June 30, 2019
Variance with Final Budget
Budgeted Amounts Actual Amounts Positive
Original Final (Budgetary Basis) (Negative)Revenues:
Intergovernmental - state grants 883,612$ 883,612$ 564,375$ (319,237)$
Expenditures:Current:
Instruction 829,612 802,112 581,886 220,226 Support services: General Administration 4,000 7,500 - 7,500 School Administration - 1,000 491 509 Student transportation 50,000 73,000 73,000 -
Total expenditures 883,612 883,612 655,377 228,235
Excess (deficiency) of revenues over expenditures - - (91,002) (91,002)
Fund balance at beginning of the year - - - -
Fund balance at end of the year -$ -$ (91,002) (91,002)$
RECONCILIATION TO GAAP BASIS:Change in grant receivable 91,002
Fund balance at end of the year (GAAP basis) -$
NONMAJOR SPECIAL REVENUE FUND FINANCIAL SECTION
155 | P a g e

STATE OF NEW MEXICO
FARMINGTON MUNICIPAL SCHOOL DISTRICT NO. 5
INDIAN EDUCATION ACT FUND - NO. 27150
Schedule of Revenues, Expenditures, and
Changes in Fund Balance - Budget and Actual (Non-GAAP Budgetary Basis)
Year Ended June 30, 2019
Variance with Final Budget
Budgeted Amounts Actual Amounts Positive
Original Final (Budgetary Basis) (Negative)Revenues:
Intergovernmental - state grants -$ 22,700$ 10,725$ (11,975)$
Expenditures:Current:
Instruction - 5,352 5,006 346 Support services: Students - 16,879 12,438 4,441 School Administration - 469 329 140
Total expenditures - 22,700 17,773 4,927
Excess (deficiency) of revenues over expenditures - - (7,048) (7,048)
Fund balance at beginning of the year - - - -
Fund balance at end of the year -$ -$ (7,048) (7,048)$
RECONCILIATION TO GAAP BASIS:Change in grant receivable 7,048
Fund balance at end of the year (GAAP basis) -$
FINANCIAL SECTION
156 | P a g eNONMAJOR SPECIAL REVENUE FUND

STATE OF NEW MEXICO
FARMINGTON MUNICIPAL SCHOOL DISTRICT NO. 5
BREAKFAST FOR ELEMENTARY STUDENTS FUND - NO. 27155
Schedule of Revenues, Expenditures, and
Changes in Fund Balance - Budget and Actual (Non-GAAP Budgetary Basis)
Year Ended June 30, 2019
Variance with Final Budget
Budgeted Amounts Actual Amounts Positive
Original Final (Budgetary Basis) (Negative)Revenues:
Intergovernmental - state grants -$ 33,024$ 26,197$ (6,827)$
Expenditures:Current:
Food services operations - 33,024 33,024 -
Excess (deficiency) of revenues over expenditures - - (6,827) (6,827)
Fund balance at beginning of the year - - 2,729 2,729
Fund balance at end of the year -$ -$ (4,098) (4,098)$
RECONCILIATION TO GAAP BASIS:Change in grant receivable 6,827
Fund balance at end of the year (GAAP basis) 2,729$
NONMAJOR SPECIAL REVENUE FUND FINANCIAL SECTION
157 | P a g e

STATE OF NEW MEXICO
FARMINGTON MUNICIPAL SCHOOL DISTRICT NO. 5
LIBRARIES GO BOND 2006 FUND - NO. 27170
Schedule of Revenues, Expenditures, and
Changes in Fund Balance - Budget and Actual (Non-GAAP Budgetary Basis)
Year Ended June 30, 2019
Variance with Final Budget
Budgeted Amounts Actual Amounts Positive
Original Final (Budgetary Basis) (Negative)Revenues:
Intergovernmental - state grants -$ -$ -$ -$
Expenditures:Current:
Instruction - - - -
Excess of revenues over expenditures - - - -
Fund balance at beginning of the year - - 2,431 2,431
Fund balance at end of the year -$ -$ 2,431 2,431$
RECONCILIATION TO GAAP BASIS:Change in payables -
Fund balance at end of the year (GAAP basis) 2,431$
FINANCIAL SECTION
158 | P a g eNONMAJOR SPECIAL REVENUE FUND

STATE OF NEW MEXICO
FARMINGTON MUNICIPAL SCHOOL DISTRICT NO. 5
NEW MEXICO GROWN FUND - NO. 27183
Schedule of Revenues, Expenditures, and
Changes in Fund Balance - Budget and Actual (Non-GAAP Budgetary Basis)
Year Ended June 30, 2019
Variance with Final Budget
Budgeted Amounts Actual Amounts Positive
Original Final (Budgetary Basis) (Negative)Revenues:
Intergovernmental - state grants -$ 20,000$ 20,000$ -$
Expenditures:Current:
Food services operations - 20,000 20,000 -
Excess of revenues over expenditures - - - -
Fund balance at beginning of the year - - - -
Fund balance at end of the year -$ -$ - -$
RECONCILIATION TO GAAP BASIS:Change in payables -
Fund balance at end of the year (GAAP basis) -$
NONMAJOR SPECIAL REVENUE FUND FINANCIAL SECTION
159 | P a g e

STATE OF NEW MEXICO
FARMINGTON MUNICIPAL SCHOOL DISTRICT NO. 5
4R FUTURE INDIVIDUAL FUND - NO. 27188
Schedule of Revenues, Expenditures, and
Changes in Fund Balance - Budget and Actual (Non-GAAP Budgetary Basis)
Year Ended June 30, 2019
Variance with Final Budget
Budgeted Amounts Actual Amounts Positive
Original Final (Budgetary Basis) (Negative)Revenues:
Intergovernmental - state grants -$ -$ -$ -$
Expenditures:Current:
Instruction - - - -
Excess of revenues over expenditures - - - -
Other financing uses:Transfers out - - (164,166) (164,166)
Net change in fund balance - - (164,166) (164,166)
Fund balance at beginning of the year - - - -
Fund balance at end of the year -$ -$ (164,166) (164,166)$
RECONCILIATION TO GAAP BASIS:Change in receivables 164,166
Fund balance at end of the year (GAAP basis) -$
FINANCIAL SECTION
160 | P a g eNONMAJOR SPECIAL REVENUE FUND

STATE OF NEW MEXICO
FARMINGTON MUNICIPAL SCHOOL DISTRICT NO. 5
4R FUTURE GROUP FUND - NO. 27190
Schedule of Revenues, Expenditures, and
Changes in Fund Balance - Budget and Actual (Non-GAAP Budgetary Basis)
Year Ended June 30, 2019
Variance with Final Budget
Budgeted Amounts Actual Amounts Positive
Original Final (Budgetary Basis) (Negative)Revenues:
Intergovernmental - state grants -$ -$ -$ -$
Expenditures:Current:
Instruction - - - -
Excess of revenues over expenditures - - - -
Other financing uses:Transfers In - - 164,166 164,166
Net change in fund balance - - 164,166 164,166
Fund balance at beginning of the year - - - -
Fund balance at end of the year -$ -$ 164,166 164,166$
RECONCILIATION TO GAAP BASIS:Change in payables (164,166)
Fund balance at end of the year (GAAP basis) -$
NONMAJOR SPECIAL REVENUE FUND FINANCIAL SECTION
161 | P a g e

STATE OF NEW MEXICO
FARMINGTON MUNICIPAL SCHOOL DISTRICT NO. 5
YOUTH CONSERVATION CORP FUND - NO. 28133
Schedule of Revenues, Expenditures, and
Changes in Fund Balance - Budget and Actual (Non-GAAP Budgetary Basis)
Year Ended June 30, 2019
Variance with Final Budget
Budgeted Amounts Actual Amounts Positive
Original Final (Budgetary Basis) (Negative)Revenues:
Intergovernmental - state grants -$ 91,312$ 119,101$ 27,789$
Expenditures:Current:
Instruction - 91,312 91,312 -
Excess of revenues over expenditures - - 27,789 27,789
Fund balance at beginning of the year - - 23,826 23,826
Fund balance at end of the year -$ -$ 51,615 51,615$
RECONCILIATION TO GAAP BASIS:Change in payables -
Fund balance at end of the year (GAAP basis) 51,615$
FINANCIAL SECTION
162 | P a g eNONMAJOR SPECIAL REVENUE FUND

STATE OF NEW MEXICO
FARMINGTON MUNICIPAL SCHOOL DISTRICT NO. 5
TUTORING FUND - NO. 28178
Schedule of Revenues, Expenditures, and
Changes in Fund Balance - Budget and Actual (Non-GAAP Budgetary Basis)
Year Ended June 30, 2019
Variance with Final Budget
Budgeted Amounts Actual Amounts Positive
Original Final (Budgetary Basis) (Negative)Revenues:
Intergovernmental - state grants -$ -$ -$ -$
Expenditures:Current:
Instruction - - - -
Excess of revenues over expenditures - - - -
Fund balance at beginning of the year - - 1,546 1,546
Fund balance at end of the year -$ -$ 1,546 1,546$
RECONCILIATION TO GAAP BASIS:Change in payables -
Fund balance at end of the year (GAAP basis) 1,546$
NONMAJOR SPECIAL REVENUE FUND FINANCIAL SECTION
163 | P a g e

STATE OF NEW MEXICO
FARMINGTON MUNICIPAL SCHOOL DISTRICT NO. 5
WESTMEATH FOUNDATION FUND - NO. 29102
Schedule of Revenues, Expenditures, and
Changes in Fund Balance - Budget and Actual (Non-GAAP Budgetary Basis)
Year Ended June 30, 2019
Variance with Final Budget
Budgeted Amounts Actual Amounts Positive
Original Final (Budgetary Basis) (Negative)Revenues:
Contributions - private grants -$ 71,938$ 21,938$ (50,000)$
Expenditures:Current:
Instruction - 67,036 16,875 50,161 Support services: Students - 4,902 1,116 3,786
Total expenditures - 71,938 17,991 53,947
Excess of revenues over expenditures - - 3,947 3,947
Fund balance at beginning of the year - - 108 108
Fund balance at end of the year -$ -$ 4,055 4,055$
RECONCILIATION TO GAAP BASIS:Change in payables -
Fund balance at end of the year (GAAP basis) 4,055$
FINANCIAL SECTION
164 | P a g eNONMAJOR SPECIAL REVENUE FUND

STATE OF NEW MEXICO
FARMINGTON MUNICIPAL SCHOOL DISTRICT NO. 5
SPECIAL CAPITAL OUTLAY - LOCAL FUND - NO. 31300
Schedule of Revenues, Expenditures, and
Changes in Fund Balance - Budget and Actual (Non-GAAP Budgetary Basis)
Year Ended June 30, 2019
Variance with Final Budget
Budgeted Amounts Actual Amounts Positive
Original Final (Budgetary Basis) (Negative)Revenues:
Charges for services 1,263$ 1,263$ 390$ (873)$ Investment and interest income 18 18 - (18)
Total revenues 1,281 1,281 390 (891)
Expenditures:Current:
Support services: Operation & Maintenance of Plant 451,933 451,933 13,542 438,391
Capital outlay 472,016 472,016 - 472,016 Total expenditures 923,949 923,949 13,542 910,407
Excess (deficiency) of revenues over expenditures (922,668) (922,668) (13,152) 909,516
Beginning cash balance budgeted 922,668 922,668 - (922,668)
Fund balance at beginning of the year - - 944,840 944,840
Fund balance at end of the year -$ -$ 931,688 931,688$
RECONCILIATION TO GAAP BASIS:Change in payables -
Fund balance at end of the year (GAAP basis) 931,688$
NONMAJOR CAPITAL PROJECTS FUND FINANCIAL SECTION
165 | P a g e

STATE OF NEW MEXICO
FARMINGTON MUNICIPAL SCHOOL DISTRICT NO. 5
SPECIAL CAPITAL OUTLAY - STATE FUND - NO. 31400
Schedule of Revenues, Expenditures, and
Changes in Fund Balance - Budget and Actual (Non-GAAP Budgetary Basis)
Year Ended June 30, 2019
Variance with Final Budget
Budgeted Amounts Actual Amounts Positive
Original Final (Budgetary Basis) (Negative)Revenues:
Intergovernmental - state grants -$ -$ -$ -$
Expenditures:Current:
Instruction - - - -
Excess of revenues over expenditures - - - -
Fund balance at beginning of the year - - 48,375 48,375
Fund balance at end of the year -$ -$ 48,375 48,375$
RECONCILIATION TO GAAP BASIS:Change in payables -
Fund balance at end of the year (GAAP basis) 48,375$
FINANCIAL SECTION
166 | P a g eNONMAJOR CAPITAL PROJECTS FUND

STATE OF NEW MEXICO
FARMINGTON MUNICIPAL SCHOOL DISTRICT NO. 5
STATE SB-9 MATCH FUND - NO. 31700
Schedule of Revenues, Expenditures, and
Changes in Fund Balance - Budget and Actual (Non-GAAP Budgetary Basis)
Year Ended June 30, 2019
Variance with Final Budget
Budgeted Amounts Actual Amounts Positive
Original Final (Budgetary Basis) (Negative)Revenues:
Intergovernmental - state grants 342,115$ 657,274$ -$ (657,274)$
Expenditures:Current:
Support services: Operation & Maintenance of Plant - 315,159 - 315,159
Capital outlay 342,115 342,115 - 342,115 Total expenditures 342,115 657,274 - 657,274
Excess of revenues over expenditures - - - -
Fund balance at beginning of the year - - 179,517 179,517
Fund balance at end of the year -$ -$ 179,517 179,517$
RECONCILIATION TO GAAP BASIS:Change in payables -
Fund balance at end of the year (GAAP basis) 179,517$
NONMAJOR CAPITAL PROJECTS FUND FINANCIAL SECTION
167 | P a g e

STATE OF NEW MEXICO
FARMINGTON MUNICIPAL SCHOOL DISTRICT NO. 5
CAPITAL IMPROVEMENTS SB-9 FUND - NO. 31701
Schedule of Revenues, Expenditures, and
Changes in Fund Balance - Budget and Actual (Non-GAAP Budgetary Basis)
Year Ended June 30, 2019
Variance with Final Budget
Budgeted Amounts Actual Amounts Positive
Original Final (Budgetary Basis) (Negative)Revenues:
Taxes:Property 2,848,948$ 2,848,948$ 2,932,280$ 83,332$ Oil and gas 99,321 99,321 213,265 113,944
Total revenues 2,948,269 2,948,269 3,145,545 197,276
Expenditures:Current:
Support services: General Administration 28,489 29,489 29,323 166 Operation & Maintenance of Plant 2,226,442 4,425,442 4,366,190 59,252
Capital outlay 1,491,242 2,013,536 110,622 1,902,914 Total expenditures 3,746,173 6,468,467 4,506,135 1,962,332
Excess (deficiency) of revenues over expenditures (797,904) (3,520,198) (1,360,590) 2,159,608
Beginning cash balance budgeted 797,904 3,520,198 - (3,520,198)
Fund balance at beginning of the year - - 3,567,047 3,567,047
Fund balance at end of the year -$ -$ 2,206,457 2,206,457$
RECONCILIATION TO GAAP BASIS:Change in property tax receivable (14,607) Change in due from other governments (10,132) Change in payables (65,515) Change in deferred property taxes 7,070
Fund balance at end of the year (GAAP basis) 2,123,273$
FINANCIAL SECTION
168 | P a g eNONMAJOR CAPITAL PROJECTS FUND

STATE OF NEW MEXICO
FARMINGTON MUNICIPAL SCHOOL DISTRICT NO. 5
ED TECHNOLOGY EQUIPMENT ACT FUND - NO. 31900
Schedule of Revenues, Expenditures, and
Changes in Fund Balance - Budget and Actual (Non-GAAP Budgetary Basis)
Year Ended June 30, 2019
Variance with Final Budget
Budgeted Amounts Actual Amounts Positive
Original Final (Budgetary Basis) (Negative)Revenues:
Investment and interest income 7,375$ 7,375$ 20,588$ 13,213$
Expenditures:Current:
Support services: Operation & Maintenance of Plant 4,212,877 4,212,877 1,219,195 2,993,682
Capital outlay 19,021 19,021 - 19,021 Total expenditures 4,231,898 4,231,898 1,219,195 3,012,703
Excess (deficiency) of revenues over expenditures (4,224,523) (4,224,523) (1,198,607) 3,025,916
Beginning cash balance budgeted 4,224,523 4,224,523 - (4,224,523)
Fund balance at beginning of the year - - 2,290,633 2,290,633
Fund balance at end of the year -$ -$ 1,092,026 1,092,026$
RECONCILIATION TO GAAP BASIS:Change in payables (83,146)
Fund balance at end of the year (GAAP basis) 1,008,880$
NONMAJOR CAPITAL PROJECTS FUND FINANCIAL SECTION
169 | P a g e

STATE OF NEW MEXICO
FARMINGTON MUNICIPAL SCHOOL DISTRICT NO. 5
ED TECH DEBT SERVICE FUND - NO. 43000
Schedule of Revenues, Expenditures, and
Changes in Fund Balance - Budget and Actual (Non-GAAP Budgetary Basis)
Year Ended June 30, 2019
Variance with Final Budget
Budgeted Amounts Actual Amounts Positive
Original Final (Budgetary Basis) (Negative)Revenues:
Taxes:Property 3,203,827$ 3,203,827$ 3,033,823$ (170,004)$ Oil and gas 147,179 147,179 127,354 (19,825)
Investment and interest income 212 212 420 208 Total revenues 3,351,218 3,351,218 3,161,597 (189,621)
Expenditures:Current:
Support services: General Administration 32,038 33,038 30,338 2,700
Debt service:Principal retirement 3,200,000 3,200,000 3,200,000 - Bond interest paid 151,006 150,006 151,532 (1,526) Debt service reserves 2,396,656 2,396,656 - 2,396,656
Total expenditures 5,779,700 5,779,700 3,381,870 2,397,830
Excess (deficiency) of revenues over expenditures (2,428,482) (2,428,482) (220,273) 2,208,209
Beginning cash balance budgeted 2,428,482 2,428,482 - (2,428,482)
Fund balance at beginning of the year - - 3,524,025 3,524,025
Fund balance at end of the year -$ -$ 3,303,752 3,303,752$
RECONCILIATION TO GAAP BASIS:Change in property tax receivable (142,869) Change in due from other governments (1,573) Change in deferred property taxes 146,262
Fund balance at end of the year (GAAP basis) 3,305,572$
FINANCIAL SECTION
170 | P a g eNONMAJOR DEBT SERVICE FUND

FINANACIAL SECTION 171 | P a g e
OTHER SUPPLEMENTAL INFORMATION (CAPITAL ASSETS)
Supplemental schedules of capital assets to provide additional analysis.

STATE OF NEW MEXICO
FARMINGTON MUNICIPAL SCHOOL DISTRICT NO. 5
SCHEDULE OF CAPITAL ASSETS USED IN THE OPERATIONS OFGOVERNMENTAL FUNDS - BY SOURCE
June 30, 2019
Governmental funds capital assets:Land 4,142,761$ Buildings and improvements 321,123,021 Improvements other than buildings 4,448,663 Equipment 12,239,293 Construction in progress 436,003
Total governmental funds capital assets: 342,389,741$
Investment in governmental funds capital assets by source:General funds 7,314,841$ Special revenue funds 2,377,522 Capital projects funds 332,697,378
Total governmental funds capital assets: 342,389,741$
FINANCIAL SECTION172 | P a g e

STATE OF NEW MEXICO
FARMINGTON MUNICIPAL SCHOOL DISTRICT NO. 5
SCHEDULE OF CAPITAL ASSETS USED IN THE OPERATIONS OFGOVERNMENTAL FUNDS - BY FUNCTION AND ACTIVITY
June 30, 2019
Function and Activity LandBuildings andImprovements
Improvements other thanbuildings Equipment
Constructionin progress Total
Educational services:Instruction -$ -$ 26,766$ 1,116,145$ -$ 1,142,911$ Support services:
Students - - - 110,502 - 110,502 Instruction - - - 22,539 - 22,539 General Administration - - - 269,020 - 269,020 School Administration - 82,941 - 134,393 - 217,334 Central Services - - - 62,020 - 62,020 Operation & Maintenance of Plant 650,000 - - 1,275,653 - 1,925,653 Student Transportation - - - 7,049,059 - 7,049,059 Other Support Services - - - 37,700 - 37,700
Non-instructional services:Food Services Operations - - - 1,109,740 - 1,109,740
Capital Outlay 3,492,761 321,040,080 4,421,897 1,052,522 436,003 330,443,263 4,142,761$ 321,123,021$ 4,448,663$ 12,239,293$ 436,003$ 342,389,741$
FINANCIAL SECTION173 | P a g e

STATE OF NEW MEXICO
FARMINGTON MUNICIPAL SCHOOL DISTRICT NO. 5
SCHEDULE OF CAPITAL ASSETS USED IN THE OPERATIONS OFGOVERNMENTAL FUNDS - CHANGES BY FUNCTION AND ACTIVITY
June 30, 2019
Balance BalanceFunction and Activity June 30, 2018 Reclassification Additions Deletions June 30, 2019Educational services:
Instruction 1,102,797$ -$ 51,144$ (11,030)$ 1,142,911$ Support services:
Students 110,502 - - - 110,502 Instruction 7,354 - 15,185 - 22,539 General Administration 293,665 - - (24,645) 269,020 School Administration 255,534 - - (38,200) 217,334 Central Services 62,020 - - - 62,020 Operation & Maintenance of Plant 1,971,017 - - (45,364) 1,925,653 Student Transportation 6,984,713 - 86,060 (21,714) 7,049,059 Other Support Services 37,700 - - - 37,700
Non-instructional services:Food Services Operations 1,110,148 - 5,992 (6,400) 1,109,740
Capital Outlay 323,603,362 - 7,421,999 (582,098) 330,443,263 335,538,812$ -$ 7,580,380$ (729,451)$ 342,389,741$
FINANCIAL SECTION174 | P a g e

FINANACIAL SECTION 175 | P a g e
OTHER SUPPLEMENTAL INFORMATION (STATE REQUIRED DISCLOSURES)
Supplemental schedules required by the State of
New Mexico to provide additional analysis.

STATE OF NEW MEXICO
FARMINGTON MUNICIPAL SCHOOL DISTRICT NO. 5
FIDUCIARY FUNDSSchedule of Changes in Assets and Liabilities - All Agency Funds
Year Ended June 30, 2019
Balance BalanceASSETS June 30, 2018 Receipts Disbursements June 30, 2019Cash and cash equivalents:
Central Office 911,882$ 443,102$ 674,610$ 680,374$ Farmington HS 348,969 144,991 393,258 100,702 Piedra Vista HS 275,080 392,414 470,417 197,077
1,535,931$ 980,507$ 1,538,285$ 978,153$
LIABILITIES
Deposits held for others 1,535,931$ 980,507$ 1,538,285$ 978,153$
FINANCIAL SECTION176 | P a g e

STATE OF NEW MEXICO
FARMINGTON MUNICIPAL SCHOOL DISTRICT NO. 5
SCHEDULE OF PLEDGED COLLATERALJune 30, 2019
Wells Fargo Citizens Bank of the New MexicoBank Bank Southwest Finance Authority Total
Cash on deposit at June 30, 2019:Checking and savings 26,122,765$ 1,407,525$ 12,243$ 6,471,356$ 34,013,889$ Less: FDIC coverage (250,000) (250,000) (12,243) - (512,243)
Uninsured funds 25,872,765$ 1,157,525$ -$ 6,471,356$ 33,501,646$
Amount requiring pledged collateral:50% collateral requirement 12,936,383$ 578,763$ -$ 3,235,678$ 16,750,824$ Pledged collateral 15,591,210 5,303,179 - 6,161,295 27,055,684
Excess (deficiency) of pledged collateral 2,654,827$ 4,724,416$ -$ 2,925,617$ 10,304,860$
Pledged collateral of financial institutions consists of the following at June 30, 2019
Maturity CUSIP # Market ValueWells Fargo Bank:
FNMA Uniform MBS Pool #AQ4034 4/1/2042 3138MKPU4 15,371,510$ FNMA Uniform MBS Pool #AS7462 6/1/2031 3138WHJG8 219,700
15,591,210$
The above securities are held at Bank of New York Mellon, New York, NY.
Citizens Bank:FNMA Ser 2011-105 CL 5-PB 10/25/2041 3136A1MJ1 5,303,179$
The above securities are held at Federal Home Loan Bank in Dallas, TX.
State of New Mexico:Detail of the pledged collateral to the District is unavailable because the bank commingles pledged collateral for all state funds it holds. However, the State Treasurer's Office Collateral Bureau monitors the pledged collateral for all state funds.
FINANCIAL SECTION177 | P a g e

STATE OF NEW MEXICO
FARMINGTON MUNICIPAL SCHOOL DISTRICT NO. 5
SCHEDULE OF DEPOSIT AND INVESTMENT ACCOUNTSYear Ended June 30, 2019
Account Type Account Classification Bank AmountWELLS FARGO BANK:
Operational Checking - Interest Cash and Cash Equivalents 7,856,712$ Op Invest Checking - Interest Cash and Cash Equivalents 12,932 Transportation Checking - Interest Cash and Cash Equivalents 455 Secondary Athletic Checking - Interest Cash and Cash Equivalents 243,136 FHS Scorp Activity Checking - Interest Agency Funds 103,338 NonBudgeted Checking - Interest Cash and Cash Equivalents 863,596 PV Activity Acct Checking - Interest Agency Funds 199,921 Debt Checking - Interest Cash and Cash Equivalents 12,105,222 Debt Checking - Interest Cash and Cash Equivalents 775,254 Employee Benefits Checking - Interest Cash and Cash Equivalents 2,383,306 Accounts payable Checking - Interest Cash and Cash Equivalents 132,142 Payroll Clearing Checking - Interest Cash and Cash Equivalents 1,446,751
Subtotal 26,122,765$
CITIZENS BANK OF FARMINGTON:
Activities Checking - Interest Agency Funds 679,095$
Tech Bonds Checking - Interest Cash and Cash Equivalents 728,430
Subtotal 1,407,525$
BANK OF SOUTHWEST:
School Lunch Checking - Interest Cash and Cash Equivalents 12,243$
NEW MEXICO FINANCE AUTHORITY:
Ed Tech Debt Service Escrow Restricted Cash and Cash Equivalents 1,367$
Ed Tech Debt Service Escrow Restricted Cash and Cash Equivalents 145,335
Debt Service Escrow Restricted Cash and Cash Equivalents 4,131
Bond Building Escrow Restricted Cash and Cash Equivalents 3
Bond Building Escrow Restricted Cash and Cash Equivalents 6,103,641
Ed Tech Debt Service Escrow Restricted Cash and Cash Equivalents 216,879
Subtotal 6,471,356$
TOTAL DEPOSITS 34,013,889$
Adjustments to cash:Bank Balance 34,013,889$ Cash on hand 40 Outstanding deposits 693,703 Outstanding checks (5,117,273) Written checks held at yearend 1,501,745
Total adjusted cash 31,092,104$
FINANCIAL SECTION178 | P a g e

STATE OF NEW MEXICO
FARMINGTON MUNICIPAL SCHOOL DISTRICT NO. 5
CASH RECONCILIATIONYear Ended June 30, 2019
Beginning Cash Receipts Distributions Other Net Cash End of
Period Adjustments to
the report Total Cash on
Report
Operations 4,225,639$ 80,160,844$ 79,299,830$ (2,987,414)$ 2,099,239$ 1,510,168$ 3,609,407$
Transportation 30,119 3,262,948 3,119,306 - 173,761 - 173,761
Instructional Materials 132,828 370,113 64,174 - 438,767 - 438,767
Food Services 322,251 3,809,629 4,222,448 102,886 12,318 - 12,318
Athletics 214,708 454,189 426,006 - 242,891 - 242,891
Activity Funds 270,943 1,312,904 714,839 - 869,008 - 869,008
Federal Flowthrough Funds (22,715) 4,131,749 7,134,116 3,047,607 22,525 - 22,525
Federal Direct Funds 959,443 2,002,020 1,718,095 27,886 1,271,254 - 1,271,254
Local Grants 14,452 - - - 14,452 - 14,452
State Flowthrough Funds 166,597 1,449,677 1,488,915 (124,928) 2,431 - 2,431
State Direct Funds 25,372 119,101 91,312 - 53,161 - 53,161
Local/State 108 21,938 17,991 - 4,055 - 4,055
Bond Building 101,391 135,435 9,044,450 14,908,723 6,101,099 3,000 6,104,099
Special Capital Outlay - Local 944,840 390 13,542 - 931,688 - 931,688
Special Capital Outlay - State 48,375 - - - 48,375 - 48,375
State SB-9 Match 179,517 - - - 179,517 - 179,517
Capital Improvements SB-9 3,520,199 3,145,545 4,506,135 - 2,159,609 - 2,159,609
Ed Technology Equipment Act 2,290,633 20,588 1,219,195 - 1,092,026 - 1,092,026
Debt Service 9,816,380 8,077,582 8,243,327 - 9,650,635 - 9,650,635
Ed Tech Debt Service 3,454,243 3,161,599 3,381,870 - 3,233,972 - 3,233,972
Agency Funds - - - - - 978,153 978,153
Total 26,695,323$ 111,636,251$ 124,705,551$ 14,974,760$ 28,600,783$ 2,491,321$ 31,092,104$
Adjustments to report:Agency funds 978,153$
Interfund loans - pooled cash (1) 3,000
Interfund loans - pooled cash (1) (3,000) Clearing account 11,423 Written checks held at yearend 1,501,745
Total adjustment to the report 2,491,321$
FINANCIAL SECTION179 | P a g e

THIS PAGE INTENTIONALLY LEFT BLANK
FINANCIAL SECTION
180 | P a g e

FINANACIAL SECTION 181 | P a g e
OTHER SUPPLEMENTAL INFORMATION (COMPONENT UNIT)
Component unit financial statements and schedules required by the State of New Mexico.

STATE OF NEW MEXICO
NEW MEXICO VIRTUAL AADEMY CHARTER SCHOOL( COMPONENT UNIT OF FARMINGTON MUNICIPAL SCHOOLS)
STATEMENT OF NET POSITIONJune 30, 2019
Governmental Activities
Assets
Cash and cash equivalents 404,065$
Receivables:
Grant 37,541 Due from primary government 50,549
Total Assets 492,155
Deferred Outflows of Resources:
Contributions to pension subsequent to the measurement date 136,667
Difference between expected and actual pension experience 2,586
Net difference between projected and actual investment earnings on pension plan investments 7,845
Net change in pension assumptions 730,323
Net change in proportionate share of pension liability 225,461
Contributions to OPEB subsequent to the measurement date 19,658
Net change in proportionate share of OPEB liability 6,886
Total Deferred Outflows of Resources 1,129,426
Liabilities
Accounts payable 109,071 Aggregate net pension liability 3,543,617 Aggregate OPEB liability 847,929
Total Liabilities 4,500,617
Deferred Inflows of ResourcesDifference between expected and actual pension experience 67,441 Difference between expected and actual OPEB experience 50,203 Net difference between projected and actual investment earnings on OPEB plan investments 10,582 Net change in OPEB assumptions 158,305
Total Deferred Inflows of Resources 286,531
Net Position
Restricted for:
Special revenue funds 1,965 Unrestricted (3,167,532)
Total Net Position (3,165,567)$
FINANCIAL SECTION
182 | P a g e
The notes to the financial statements are an integral part of this statement.
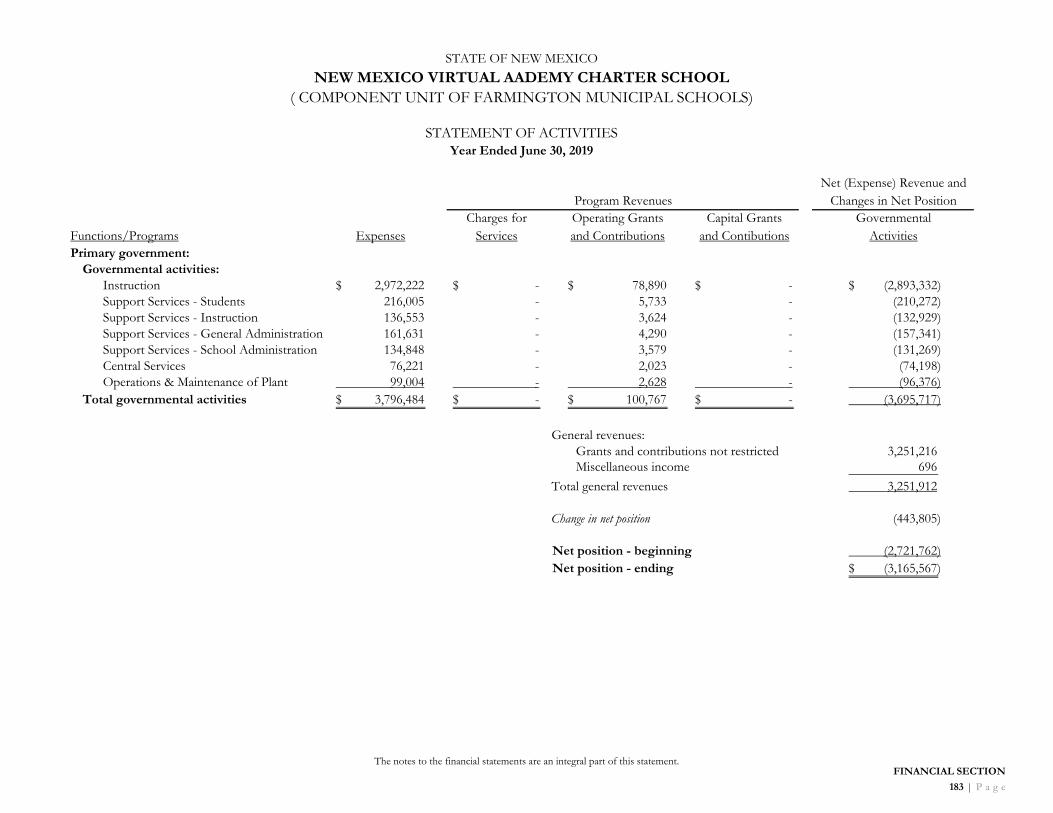
STATE OF NEW MEXICO
NEW MEXICO VIRTUAL AADEMY CHARTER SCHOOL( COMPONENT UNIT OF FARMINGTON MUNICIPAL SCHOOLS)
STATEMENT OF ACTIVITIESYear Ended June 30, 2019
Net (Expense) Revenue andProgram Revenues Changes in Net Position
Charges for Operating Grants Capital Grants GovernmentalFunctions/Programs Expenses Services and Contributions and Contibutions ActivitiesPrimary government:
Governmental activities:Instruction 2,972,222$ -$ 78,890$ -$ (2,893,332)$ Support Services - Students 216,005 - 5,733 - (210,272) Support Services - Instruction 136,553 - 3,624 - (132,929) Support Services - General Administration 161,631 - 4,290 - (157,341) Support Services - School Administration 134,848 - 3,579 - (131,269) Central Services 76,221 - 2,023 - (74,198) Operations & Maintenance of Plant 99,004 - 2,628 - (96,376)
Total governmental activities 3,796,484$ -$ 100,767$ -$ (3,695,717)
General revenues:Grants and contributions not restricted 3,251,216 Miscellaneous income 696
Total general revenues 3,251,912
Change in net position (443,805)
Net position - beginning (2,721,762) Net position - ending (3,165,567)$
The notes to the financial statements are an integral part of this statement.FINANCIAL SECTION
183 | P a g e

STATE OF NEW MEXICO
NEW MEXICO VIRTUAL AADEMY CHARTER SCHOOL( COMPONENT UNIT OF FARMINGTON MUNICIPAL SCHOOLS)
GOVERNMENTAL FUNDSBalance SheetJune 30, 2019
General Funds Special Revenue Funds
OperationalInstructional
Materials General ActivitiesEntitlement
IDEA-B Libraries GO Bond 2012
TotalNon-Major
Special Revenue
Total Governmental
Fund #11000 Fund #14000 Fund Fund #23000 Fund #24106 Fund #27107 Funds FundsAssets
Cash and cash equivalents 365,931$ 36,169$ 402,100$ 1,965$ -$ -$ -$ 404,065$ Receivables:
Grant - 1,269 1,269 - 36,272 - - 37,541 Due from other funds 83,415 - 83,415 - - - - 83,415 Due from primary government - - - - 50,549 - - 50,549
Total assets 449,346$ 37,438$ 486,784$ 1,965$ 86,821$ -$ -$ 575,570$
Liabilities, deferred inflows, and fund balanceLiabilities:
Accounts payable 105,665$ -$ 105,665$ -$ 3,406$ -$ -$ 109,071$ Due to other funds - - - - 83,415 - - 83,415
Total liabilities 105,665 - 105,665 - 86,821 - - 192,486
Fund balance:Restricted for:
Special revenue funds - - - 1,965 - - - 1,965 Unassigned 343,681 37,438 381,119 - - - - 381,119
Total fund balance 343,681 37,438 381,119 1,965 - - - 383,084 Total liabilities and fund balance 449,346$ 37,438$ 486,784$ 1,965$ 86,821$ -$ -$ 575,570$
FINANCIAL SECTION
184 | P a g e
The notes to the financial statements are an integral part of this statement.

STATE OF NEW MEXICO
NEW MEXICO VIRTUAL AADEMY CHARTER SCHOOL( COMPONENT UNIT OF FARMINGTON MUNICIPAL SCHOOLS)
RECONCILIATION OF THE BALANCE SHEET - ALL GOVERNMENTAL FUNDSTO THE STATEMENT OF NET POSITION
June 30, 2019
Amounts reported for governmental activities in the statement of net position aredifferent because:
Fund balances - total governmental funds 383,084$
Capital assets used in governmental activities are not financial resources andtherefore are not reported in the funds.
Deferred outflow of resources are not financial resources, and therefore are not reportedin the funds and include:
136,667 2,586 7,845
730,323 225,461 19,658
Contributions to pension subsequent to the measurement dateDifference between expected and actual pension experienceNet difference between projected and actual investment earnings on pension plan investment Net change in pension assumptionsNet change in proportionate share of pension liabilityContributions to OPEB subsequent to the measurement dateNet change in proportionate share of OPEB liability 6,886
Long-term liabilities, including bonds payable, are not due and payable in thecurrent period and therefore are not reported in the funds
Net pension liability (3,543,617) Net OPEB liability (847,929)
Deferred inflow of resources are not financial resources, and therefore are not reportedin the funds and include:
(67,441) (50,203) (10,582)
Difference between expected and actual pension experienceDifference between expected and actual OPEB experienceNet difference between projected and actual investment earnings on OPEB plan investment Net change in OPEB assumptions (158,305)
Net position of governmental activities (3,165,567)$
The notes to the financial statements are an integral part of this statement.FINANCIAL SECTION
185 | P a g e

STATE OF NEW MEXICO
NEW MEXICO VIRTUAL AADEMY CHARTER SCHOOL( COMPONENT UNIT OF FARMINGTON MUNICIPAL SCHOOLS)
GOVERNMENTAL FUNDSStatement of Revenues, Expenditures, and Changes in Fund Balance
Year Ended June 30, 2019
General Funds Special Revenue Funds
OperationalInstructional
Materials General ActivitiesEntitlement
IDEA-B Libraries GO Bond 2012
TotalNon-Major
Special Revenue
Total Governmental
Fund #11000 Fund #14000 Fund Fund #23000 Fund #24106 Fund #27107 Funds FundsRevenues:
Intergovernmental - federal grants - - -$ -$ 82,666$ -$ 82,666$ 82,666$ Intergovernmental - state grants 3,250,220 18,101 3,268,321 - - - - 3,268,321 Contributions - private grants - - - 996 - - 996 996 Miscellaneous 696 - 696 - - - - 696
Total revenues 3,250,916 18,101 3,269,017 996 82,666 - 83,662 3,352,679
Expenditures:Current:
Instruction 2,423,646 3,119 2,426,765 484 - - 484 2,427,249 Support services: Students 129,184 - 129,184 - 86,821 - 86,821 216,005 Instruction 136,553 - 136,553 - - - - 136,553 General Administration 161,631 - 161,631 - - - - 161,631 School Administration 134,848 - 134,848 - - - - 134,848 Central Services 76,221 - 76,221 - - - - 76,221 Operation & Maintenance of Plant 99,004 - 99,004 - - - - 99,004
Total expenditures 3,161,087 3,119 3,164,206 484 86,821 - 87,305 3,251,511
Excess (deficiency) of revenues over expenditures 89,829 14,982 104,811 512 (4,155) - (3,643) 101,168
Fund balance at beginning of the year 253,852 22,456 276,308 1,453 4,155 - 5,608 281,916 Fund balance at end of the year 343,681$ 37,438$ 381,119$ 1,965$ -$ -$ 1,965$ 383,084$
FINANCIAL SECTION
186 | P a g e
The notes to the financial statements are an integral part of this statement.
$ $
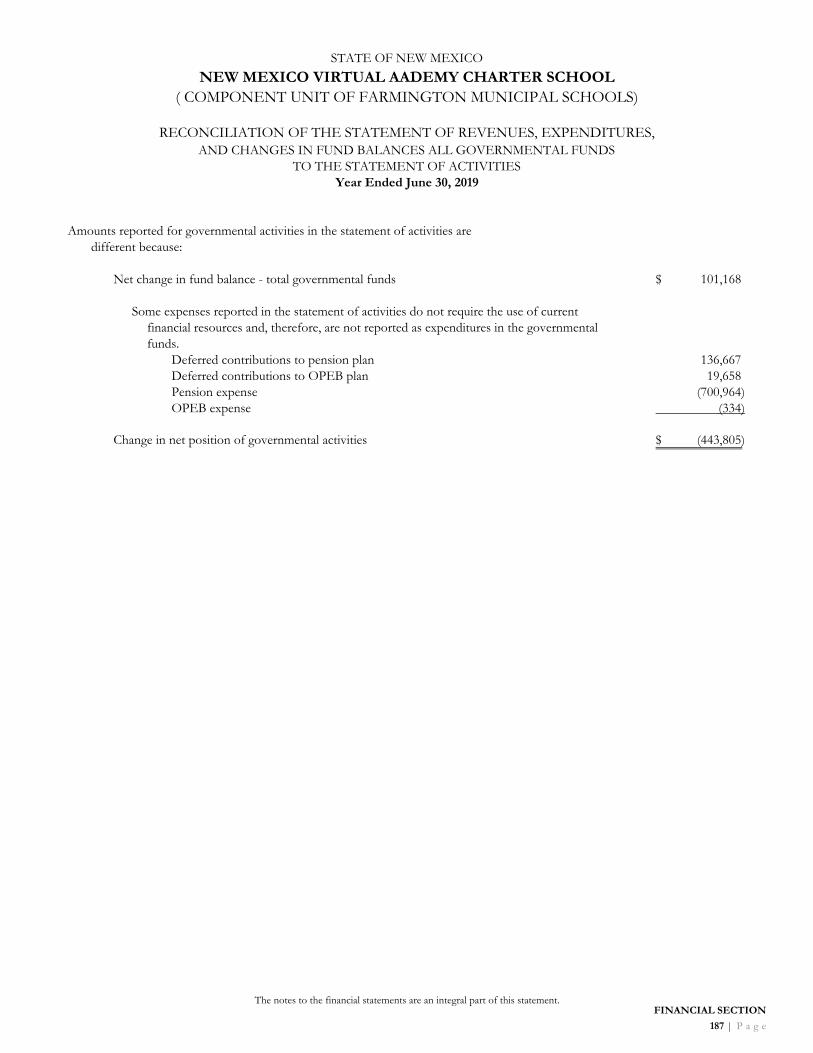
STATE OF NEW MEXICO
NEW MEXICO VIRTUAL AADEMY CHARTER SCHOOL( COMPONENT UNIT OF FARMINGTON MUNICIPAL SCHOOLS)
RECONCILIATION OF THE STATEMENT OF REVENUES, EXPENDITURES,AND CHANGES IN FUND BALANCES ALL GOVERNMENTAL FUNDS
TO THE STATEMENT OF ACTIVITIESYear Ended June 30, 2019
Amounts reported for governmental activities in the statement of activities aredifferent because:
Net change in fund balance - total governmental funds 101,168$
Some expenses reported in the statement of activities do not require the use of currentfinancial resources and, therefore, are not reported as expenditures in the governmentalfunds.
Deferred contributions to pension plan 136,667 Deferred contributions to OPEB plan 19,658 Pension expense (700,964) OPEB expense (334)
Change in net position of governmental activities (443,805)$
The notes to the financial statements are an integral part of this statement.FINANCIAL SECTION
187 | P a g e

THIS PAGE INTENTIONALLY LEFT BLANK
FINANCIAL SECTION
188 | P a g e

189 | P a g e
NEW MEXICO VIRTUAL ACADEMY (COMPONENT UNIT OF FARMINGTON MUNICIPAL SCHOOLS)
General Funds Special revenue funds are operating funds used to account for the proceeds of specific revenue sources that are intended for specific purposes other than special assessments or major capital projects.
Operating (Fund No. 11000) Minimum Balance: None The government’s primary fund. It accounts for all financial resources of the general government, except those required to be accounted for in another fund.
Instructional Materials (Fund No. 14000) Minimum Balance: None Accounts for all the Instructional Materials funds received through the state for the purpose of acquiring study materials for the students.
Special Revenue Funds Special revenue funds are operating funds used to account for the proceeds of specific revenue sources that are intended for specific purposes other than special assessments or major capital projects.
Activities (Fund No. 23000) Minimum Balance: None To account for revenue and expenditures associated with the District's non-instructional support activities (primarily after-school activities).
Entitlement IDEA-B (Fund No. 24106) Minimum Balance: None Program provides grants to states that flow-through to schools, to assist them in providing a free appropriate public education to all children with disabilities. The program is funded by the United States government, under the Individuals with Disabilities Education Act, Part B, Section 611-617, and part D, Section 674 as amended, 20 U.S.C. 1711-1417 and 1420.
Library GO Bonds 2012 (Fund No. 27107) Minimum Balance: None Funds to be used for library books and library resources for public school libraries statewide. Library resources include computers, software, projectors, televisions, other related hardware and software, shelving, desks, chairs, and book trucks/carts. Senate Bill 66, Laws of 2012, 2nd Session, Chapter 54, Section 10.B.(3).
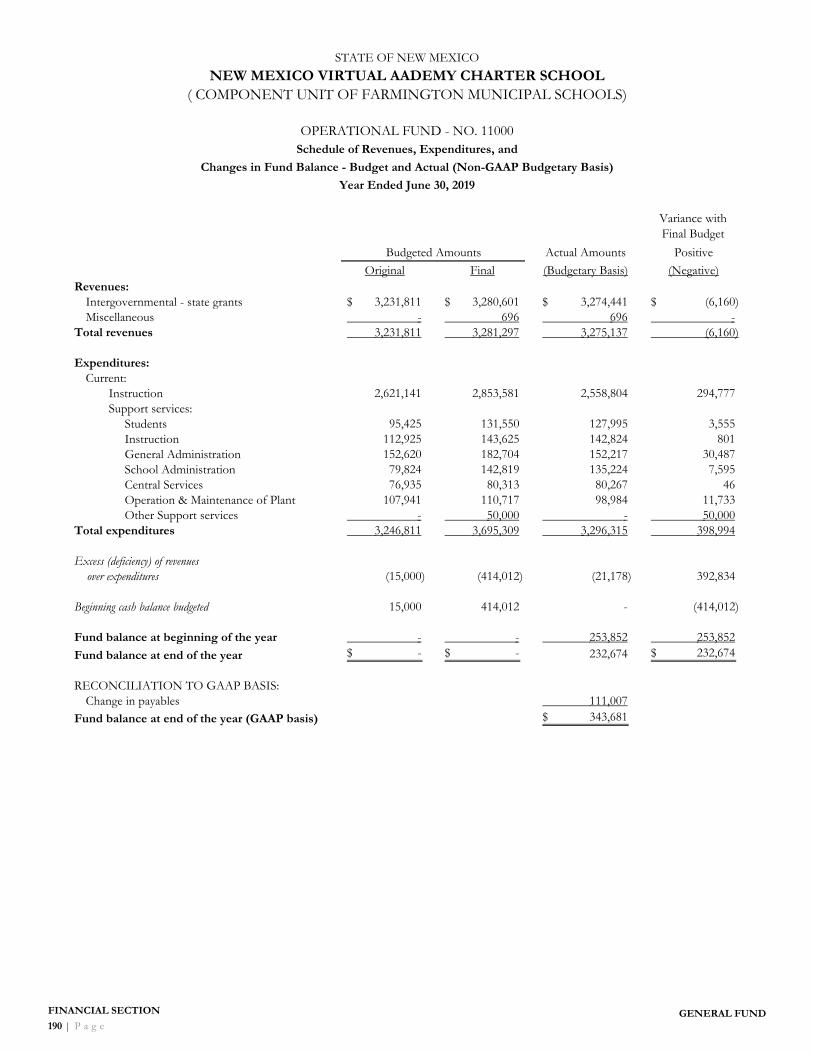
STATE OF NEW MEXICO
NEW MEXICO VIRTUAL AADEMY CHARTER SCHOOL( COMPONENT UNIT OF FARMINGTON MUNICIPAL SCHOOLS)
OPERATIONAL FUND - NO. 11000Schedule of Revenues, Expenditures, and
Changes in Fund Balance - Budget and Actual (Non-GAAP Budgetary Basis)
Year Ended June 30, 2019
Variance with Final Budget
Budgeted Amounts Actual Amounts Positive
Original Final (Budgetary Basis) (Negative)Revenues:
Intergovernmental - state grants 3,231,811$ 3,280,601$ 3,274,441$ (6,160)$ Miscellaneous - 696 696 -
Total revenues 3,231,811 3,281,297 3,275,137 (6,160)
Expenditures:Current:
Instruction 2,621,141 2,853,581 2,558,804 294,777 Support services: Students 95,425 131,550 127,995 3,555 Instruction 112,925 143,625 142,824 801 General Administration 152,620 182,704 152,217 30,487 School Administration 79,824 142,819 135,224 7,595 Central Services 76,935 80,313 80,267 46 Operation & Maintenance of Plant 107,941 110,717 98,984 11,733 Other Support services - 50,000 - 50,000
Total expenditures 3,246,811 3,695,309 3,296,315 398,994
Excess (deficiency) of revenues over expenditures (15,000) (414,012) (21,178) 392,834
Beginning cash balance budgeted 15,000 414,012 - (414,012)
Fund balance at beginning of the year - - 253,852 253,852
Fund balance at end of the year -$ -$ 232,674 232,674$
RECONCILIATION TO GAAP BASIS:Change in payables 111,007
Fund balance at end of the year (GAAP basis) 343,681$
FINANCIAL SECTION
190 | P a g eGENERAL FUND

STATE OF NEW MEXICO
NEW MEXICO VIRTUAL AADEMY CHARTER SCHOOL( COMPONENT UNIT OF FARMINGTON MUNICIPAL SCHOOLS)
INSTRUCTIONAL MATERIALS FUND - NO. 14000Schedule of Revenues, Expenditures, and
Changes in Fund Balance - Budget and Actual (Non-GAAP Budgetary Basis)
Year Ended June 30, 2019
Variance with Final Budget
Budgeted Amounts Actual Amounts Positive
Original Final (Budgetary Basis) (Negative)Revenues:
Intergovernmental - state grants 16,832$ 18,101$ 16,831$ (1,270)$
Expenditures:Current:
Instruction 36,484 40,557 3,118 37,439
Excess (deficiency) of revenues over expenditures (19,652) (22,456) 13,713 36,169
Beginning cash balance budgeted 19,652 22,456 - (22,456)
Fund balance at beginning of the year - - 22,456 22,456
Fund balance at end of the year -$ -$ 36,169 36,169$
RECONCILIATION TO GAAP BASIS:Change in grant receivable 1,269
Fund balance at end of the year (GAAP basis) 37,438$
GENERAL FUND FINANCIAL SECTION
191 | P a g e

STATE OF NEW MEXICO
NEW MEXICO VIRTUAL AADEMY CHARTER SCHOOL( COMPONENT UNIT OF FARMINGTON MUNICIPAL SCHOOLS)
ACTIVITIES FUND - NO. 23000Schedule of Revenues, Expenditures, and
Changes in Fund Balance - Budget and Actual (Non-GAAP Budgetary Basis)
Year Ended June 30, 2019
Variance with Final Budget
Budgeted Amounts Actual Amounts Positive
Original Final (Budgetary Basis) (Negative)Revenues:
Contributions - private grants -$ 484$ 996$ 512$
Expenditures:Current:
Instruction - 484 484 -
Excess of revenues over expenditures - - 512 512
Fund balance at beginning of the year - - 1,453 1,453
Fund balance at end of the year -$ -$ 1,965 1,965$
RECONCILIATION TO GAAP BASIS:Change in payables -
Fund balance at end of the year (GAAP basis) 1,965$
FINANCIAL SECTION
192 | P a g e
The notes to the financial statements are an integral part of this statement.

STATE OF NEW MEXICO
NEW MEXICO VIRTUAL AADEMY CHARTER SCHOOL( COMPONENT UNIT OF FARMINGTON MUNICIPAL SCHOOLS)
ENTITLEMENT IDEA-B FUND - NO. 24106Schedule of Revenues, Expenditures, and
Changes in Fund Balance - Budget and Actual (Non-GAAP Budgetary Basis)
Year Ended June 30, 2019
Variance with Final Budget
Budgeted Amounts Actual Amounts Positive
Original Final (Budgetary Basis) (Negative)Revenues:
Intergovernmental - federal grants -$ 93,660$ 81,767$ (11,893)$
Expenditures:Current:
Support services: Students - 93,660 86,821 6,839
Excess (deficiency) of revenues over expenditures - - (5,054) (5,054)
Fund balance at beginning of the year - - 4,155 4,155
Fund balance at end of the year -$ -$ (899) (899)$
RECONCILIATION TO GAAP BASIS:Change in grant receivable 5,054 Change in payables (4,155)
Fund balance at end of the year (GAAP basis) -$
The notes to the financial statements are an integral part of this statement.FINANCIAL SECTION
193 | P a g e

STATE OF NEW MEXICO
NEW MEXICO VIRTUAL AADEMY CHARTER SCHOOL( COMPONENT UNIT OF FARMINGTON MUNICIPAL SCHOOLS)
LIBRARIES GO BOND 2012 FUND - NO. 27107Schedule of Revenues, Expenditures, and
Changes in Fund Balance - Budget and Actual (Non-GAAP Budgetary Basis)
Year Ended June 30, 2019
Variance with Final Budget
Budgeted Amounts Actual Amounts Positive
Original Final (Budgetary Basis) (Negative)Revenues:
Intergovernmental - state grants 3,951$ 3,951$ -$ (3,951)$
Expenditures:Current:
Support services: Instruction 3,951 3,951 - 3,951
Excess of revenues over expenditures - - - -
Fund balance at beginning of the year - - - -
Fund balance at end of the year -$ -$ - -$
RECONCILIATION TO GAAP BASIS:Change in payables -
Fund balance at end of the year (GAAP basis) -$
FINANCIAL SECTION
194 | P a g e
The notes to the financial statements are an integral part of this statement.

FINANACIAL SECTION 195 | P a g e
OTHER SUPPLEMENTAL INFORMATION (COMPONENT UNIT)
(STATE REQUIRED DISCLOSURES)
Supplemental schedules required by the State of
New Mexico to provide additional analysis.

STATE OF NEW MEXICO
NEW MEXICO VIRTUAL AADEMY CHARTER SCHOOL
SCHEDULE OF PLEDGED COLLATERALJune 30, 2019
CitizensBank
Cash on deposit at June 30, 2019:Checking and savings 583,479$ Less: FDIC coverage (250,000)
Uninsured funds 333,479$
Amount requiring pledged collateral:50% collateral requirement 166,740$ Pledged collateral 1,038,820
Excess (deficiency) of pledged collateral 872,080$
Pledged collateral of financial institutions consists of the following at June 30, 2019
Citizens Bank: Maturity CUSIP # Market ValueFHLB 9/13/2024 3130A2UW4 1,038,820$
The above securities are held at Bank of Federal Home Loan Bank, Dallas TX.
FINANCIAL SECTION196 | P a g e

STATE OF NEW MEXICO
NEW MEXICO VIRTUAL AADEMY CHARTER SCHOOL
CASH RECONCILIATIONYear Ended June 30, 2019
Beginning Cash Receipts Distributions Other Net Cash End of
Period Adjustments to
the report Total Cash on
Report
Operations 524,557$ 3,275,167$ 3,293,398$ (56,980)$ 449,346$ (83,415)$ 365,931$
Instructional Materials 22,456 16,831 3,118 - 36,169 - 36,169
Activity Funds 1,453 996 484 - 1,965 - 1,965
Federal Flowthrough Funds (77,612) 81,767 86,821 (749) (83,415) 83,415 - Total 470,854$ 3,374,761$ 3,383,821$ (57,729)$ 404,065$ -$ 404,065$
Account Name Account Type Bank Name Bank AmountOperational Checking - Interest Citizens 583,479$ Adjustments to cash:
Bank Balance 583,479$ Outstanding deposits - Outstanding checks (179,414) Errors -
Total adjusted cash 404,065$
FINANCIAL SECTION197 | P a g e

THIS PAGE INTENTIONALLY LEFT BLANK
FINANCIAL SECTION
198 | P a g e

199 | P a g e
STATISTICAL SECTION This part of Farmington Municipal School District No. 5’s comprehensive annual financial report presents detailed information as a context for understanding what the information in the financial statements, note disclosures, and required supplementary information says about the government’s
overall financial health.
FINANCIAL TRENDS Page 201
These schedules contain trend information to help the reader understand how the District’s financial performance and well-being have changed over time.
§ REVENUE CAPACITY
Page 209
These schedules contain information to help the reader assess the District’s most significant local revenue source, the sales tax.
§
DEBT CAPACITY Page 215
These schedules present information to help the reader assess the affordability of the District’s current levels of outstanding debt and the District’s ability to issue additional debt in the future.
§
DEMOGRAPHIC AND ECONOMIC INFORMATION Page 218
These schedules offer demographic and economic indicators to help the reader understand the environment within which the District’s financial activities take place.
§
OPERATING INFORMATION Page 221
These schedules contain service and infrastructure data to help the reader understand how the information in the District’s financial report relates to the services the District provides and the
activities it performs.

THIS PAGE INTENTIONALLY LEFT BLANK
STATISTICAL SECTION
200 | P a g e

STATE OF NEW MEXICO
FARMINGTON MUNICIPAL SCHOOL DISTRICT NO. 5
NET POSITION BY COMPONENTLAST TEN FISCAL YEARS
(accrual basis of accounting)
2010 2011 2012 2013 2014Governmental Activities
Net investment in capital assets 44,326,970$ 44,134,648$ 41,429,758$ 87,888,998$ 97,274,871$ Restricted 15,247,416 15,877,450 15,416,710 17,180,682 18,167,016 Unrestricted 17,178,375 21,449,047 22,960,900 24,352,282 22,634,154
Total governmental activities net position 76,752,761$ 81,461,145$ 79,807,368$ 129,421,962$ 138,076,041$
2015 2016 2017 2018 2019
Governmental Activities
Net investment in capital assets 105,039,068$ 89,528,046$ 139,517,254$ 138,081,745$ 143,915,447$
Restricted 24,781,118 51,226,513 19,496,768 26,459,741 19,479,173
Unrestricted (102,994,068) (90,715,061) (117,826,116) (159,994,947) (237,074,262)
Total governmental activities net position 26,826,118$ 50,039,498$ 41,187,906$ 4,546,539$ (73,679,642)$
Note: 2013 capital assets were restated to correct prior years recordings of capital assets.
Note: GASB 68 Pension liability recorded beginning in 2015Note: GASB 75 OPEB liability recorded beginning in 2018
STATISTICAL SECTIONFINANCIAL TRENDS
201 | P a g e

STATE OF NEW MEXICO
FARMINGTON MUNICIPAL SCHOOL DISTRICT NO. 5
EXPENSES, PROGRAM REVENUES, AND NET (EXPENSE)/REVENUELAST TEN FISCAL YEARS(accrual basis of accounting)
2010 2011 2012 2013 2014ExpensesGovernmental Activities: Instruction 52,940,094$ 50,181,718$ 48,705,662$ 50,490,205$ 56,300,845$ Support services: 19,176,000 22,424,212
Students 10,524,749 10,256,813 10,934,607 Instruction - support 1,733,137 2,166,682 1,782,540 General Administrative 1,181,832 1,189,237 1,474,637 School Administrative 4,463,277 6,443,991 5,117,842 Central Services 799,198 477,143 859,423 Operations & Maintenance of Plant 7,608,853 7,627,858 4,194,480 Student Transportation 3,206,068 2,760,952 3,108,422 3,154,396 3,082,206 Other support services 109,193 73,326 91,023
Non-instructional services:Food services 3,134,259 3,495,334 3,873,724 3,843,284 4,018,871 Community services 134,934 13,502 7,408
Bond Interest PayableFacilities, supplies and materials 11,950,619 9,217,681 3,046,988 Depreciation - unallocated 3,171,107 1,639,781 4,025,893
Operation of non-instructional services 17,149,315 14,373,083 Athletics 366,917 280,813 Interest on long-term obligations 1,320,460 1,001,828 1,194,295 1,373,015 1,106,616
RefundsTotal governmental activities expenses 97,293,113$ 94,517,940$ 98,559,002$ 97,966,914$ 96,043,379$
Program RevenuesGovernmental Activities: Charges for services: General government 721,172$ 841,094$ 740,797$ 910,475$ 1,061,757$ Food Services 836,626 872,545 940,227 906,651 884,881 Operating grants and contributions 18,451,821 16,238,340 12,483,985 12,844,998 13,334,879 Capital grants and contributions 414,564 226,196 16,536 242,271 1,255,020 Total governmental activities program revenues 20,424,183$ 18,178,175$ 14,181,545$ 14,904,395$ 16,536,537$
Net (expense)/revenueGovernmental activities 76,868,930$ 76,339,765$ 84,377,457$ 83,062,519$ 79,506,842$
Note - The District began reporting expenditures according to the breakdown by function in 2012.
( cont'd; 1 of 2)
Note 1: New Mexico adopted the UCOA for school districts and combined governmental activity functions into Instruction, Support services, Operation of non-instructional services, Food services, Athletics, Pupil Transportation and Interest on long-term debt. Prior years have been adjusted accordingly.
STATISTICAL SECTIONFINANCIAL TRENDS
202 | P a g e

STATE OF NEW MEXICO
FARMINGTON MUNICIPAL SCHOOL DISTRICT NO. 5
EXPENSES, PROGRAM REVENUES, AND NET (EXPENSE)/REVENUELAST TEN FISCAL YEARS(accrual basis of accounting)
2015 2016 2017 2018 2019ExpensesGovernmental Activities: Instruction 63,425,766$ 44,969,217$ 67,974,302$ 85,009,241$ 87,053,866$ Support services:
Students 12,557,987 11,530,356 12,021,053 12,067,974 14,139,258 Instruction - support 1,916,013 1,753,666 1,083,434 1,101,248 1,845,725 General Administrative 1,460,323 1,454,979 1,736,695 1,746,195 2,115,811 School Administrative 5,326,590 5,699,925 5,290,922 5,889,246 6,414,784 Central Services 1,484,713 1,287,846 1,198,927 1,194,223 1,243,222 Operations & Maintenance of Plant 15,893,619 24,372,188 15,185,927 18,364,623 19,383,839 Student Transportation 4,317,667 3,418,076 2,732,618 2,996,842 3,207,815 Other support services 93,603 25,774 7,678 4,456 -
Non-instructional services: - Food services 4,402,077 4,802,086 4,862,251 4,922,690 4,914,113 Community services 8,332 56,904 11,345 8,922 13,602
Bond Interest PayableFacilities, supplies and materialsDepreciation - unallocated
Operation of non-instructional services Athletics Interest on long-term obligations 1,534,093 2,162,706 2,235,099 2,207,630 2,251,692
Refunds 211,546 - - Total governmental activities expenses 112,420,783$ 101,533,723$ 114,551,797$ 135,513,290$ 142,583,727$
Program RevenuesGovernmental Activities: Charges for services: General government 829,598$ 1,045,498$ 812,746$ 822,994$ 1,853,297$ Food Services 811,223 921,586 815,159 522,852 819,162 Operating grants and contributions 19,138,864 17,181,976 16,352,428 17,066,457 18,258,821 Capital grants and contributions 11,982,223 15,336,594 19,082,712 6,966,441 1,297,914 Total governmental activities program revenues 32,761,908$ 34,485,654$ 37,063,045$ 25,378,744$ 22,229,194$
Net (expense)/revenueGovernmental activities 79,658,875$ 67,048,069$ 77,488,752$ 110,134,546$ 120,354,533$
( 2 of 2)
STATISTICAL SECTIONFINANCIAL TRENDS
203 | P a g e

STATE OF NEW MEXICO
FARMINGTON MUNICIPAL SCHOOL DISTRICT NO. 5
GENERAL REVENUES AND TOTAL CHANGE IN NET POSITIONLAST TEN FISCAL YEARS(accrual basis of accounting)
2010 2011 2012 2013 2014Net (expense)/revenueGovernmental activities 76,868,930$ 76,339,765$ 84,377,457$ 83,062,519$ 79,506,842$
General Revenues and Other Changes in Net PositionGovernmental activities: Taxes Property taxes, general purpose 590,775$ 583,549$ 571,308$ 579,898$ 590,888$ Property taxes, debt service 10,554,810 9,983,458 11,156,818 10,762,854 11,034,174 Property taxes, capital projects 2,787,701 3,136,308 2,510,503 2,892,633 2,942,681 Oil & Gas Unrestricted grants and contributions 64,409,185 67,228,446 68,459,802 70,013,110 73,575,299
Miscellaneous Income 330,227 116,388 25,249 23,467 17,879 Gain/(Loss) on sale of capital assets 492,941 - Total government activities 79,165,639$ 81,048,149$ 82,723,680$ 84,271,962$ 88,160,921$
Change in Net PositionGovernmental activities 2,296,709$ 4,708,384$ (1,653,777)$ 1,209,443$ 8,654,079$
2015 2016 2017 2018 2019Net (expense)/revenueGovernmental activities 79,658,875$ 67,048,069$ 77,488,752$ 110,134,546$ 120,354,533$
General Revenues and Other Changes in Net PositionGovernmental activities: Taxes Property taxes, general purpose 528,737$ 540,502$ 551,471$ 558,562$ 571,340$ Property taxes, debt service 9,794,142 9,950,029 2,814,485 10,794,816 10,803,256 Property taxes, capital projects 3,524,200 3,173,781 10,607,097 2,858,482 2,934,916 Oil & Gas 1,439,430 613,830 594,547 510,604 536,257 Unrestricted grants and contributions 75,837,173 75,897,873 72,116,655 75,622,445 79,112,920
Miscellaneous Income 256,983 85,434 305,034 251,914 200,182 Gain/(Loss) on sale of capital assets (240,758) - - - - Total government activities 91,139,907$ 90,261,449$ 86,989,289$ 90,596,823$ 94,158,871$
Change in Net PositionGovernmental activities 11,481,032$ 23,213,380$ 9,500,537$ (19,537,723)$ (26,195,662)$
STATISTICAL SECTIONFINANCIAL TRENDS
204 | P a g e

STATE OF NEW MEXICO
FARMINGTON MUNICIPAL SCHOOL DISTRICT NO. 5
FUND BALANCES OF GOVERNMENTAL FUNDSLAST TEN FISCAL YEARS
(modified accrual basis of accounting)
2010 2011 2012 2013 2014
General FundUnassigned 5,318,316$ 9,384,014$ 10,714,472$ 12,179,526$ 9,665,269$ Inventories
Total general fund 5,318,316 9,384,014 10,714,472 12,179,526 9,665,269
All other governmental fundsUnassigned -$ -$ -$ -$ -$
Inventories - - - - - Restricted: Special revenue funds 924,709 1,094,888 1,225,957 1,453,776 1,787,908 Capital projects funds 11,157,362 20,427,036 25,286,190 10,016,368 28,055,811 Debt service funds 10,652,904 10,779,975 10,911,578 12,248,617 14,208,070 Total all other governmental funds 22,734,975 32,301,899 37,423,725 23,718,761 44,051,789
Total fund balance 28,053,291$ 41,685,913$ 48,138,197$ 35,898,287$ 53,717,058$
2015 2016 2017 2018 2019
General FundUnassigned 8,135,166$ 6,671,858$ 4,743,157$ 6,915,798$ 7,962,176$
Inventories 138,041 134,821 120,499 104,400 174,568
Total general fund 8,273,207 6,806,679 4,863,656 7,020,198 8,136,744
All other governmental funds
Unassigned -$ -$ (5,586)$ -$ -$
Inventories - - 81,619 122,358 76,754
Restricted:
Special revenue funds 1,803,991 1,622,470 1,426,681 1,786,378 2,846,647
Capital projects funds 8,720,466 32,703,331 11,406,417 110,040,526 9,873,768
Debt service funds 14,118,620 16,765,891 13,627,652 13,478,972 13,136,488
Total all other governmental funds 24,643,077 51,091,692 26,536,783 125,428,234 25,933,657
Total fund balance 32,916,284$ 57,898,371$ 31,400,439$ 132,448,432$ 34,070,401$
Note - amounts restated prior to 2011 for implementation of GASB Statement 54 in 2011.
STATISTICAL SECTIONFINANCIAL TRENDS
205 | P a g e

STATE OF NEW MEXICO
FARMINGTON MUNICIPAL SCHOOL DISTRICT NO. 5
CHANGES IN FUND BALANCES, GOVERNMENTAL FUNDSLAST TEN FISCAL YEARS
(modified accrual basis of accounting)
2010 2011 2012 2013 2014Revenues
Federal Sources:Federal grants 18,117,216$ 15,572,955$ 11,724,519$ 11,305,163$ 11,505,683$
Total federal sources 18,117,216 15,572,955 11,724,519 11,305,163 11,505,683
State Sources:State equalization quarantee 60,836,533 64,288,193 65,310,556 66,548,033 69,945,424 Transportation 3,158,507 2,520,300 2,698,211 2,769,972 2,877,620 State instructional materials 414,145 419,953 451,035 695,105 752,255 State grants 749,169 891,581 542,632 1,539,869 2,440,227
Total state sources 65,158,354 68,120,027 69,002,434 71,552,979 76,015,526
Local Sources:District school tax levy 13,357,629 13,474,931 13,782,009 13,986,761 14,400,614 Fees and activities 1,557,798 1,713,639 1,679,873 1,817,126 1,946,638 Earnings from investments 330,227 116,388 24,150 23,467 17,879 Other revenue - - 235,620 242,237 643,989
Total local sources 15,245,654 15,304,958 15,721,652 16,069,591 17,009,120 Total revenues 98,521,224$ 98,997,940$ 96,448,605$ 98,927,733$ 104,530,329$
ExpendituresInstruction 50,753,301$ 48,611,814$ 48,645,538$ 50,500,144$ 56,171,307$ Support services: 18,854,030 18,292,277
Students 10,484,641 10,211,974 10,923,048 Instruction - support 1,692,426 2,128,788 1,782,540 General Administrative 1,365,643 1,404,004 1,679,249 School Administrative 4,416,577 4,688,741 5,103,738 Central Services 789,070 468,282 853,221 Operations & Maintenance of Plant 7,664,410 7,607,882 8,256,411 Student Transportation 2,683,042 2,679,202 2,729,501 2,783,702 4,122,683 Other support services 97,296 57,034 91,023
Non-instructional services:Food services 3,099,390 3,490,358 3,845,948 3,820,888 4,025,369 Community services - - 134,934 13,502 7,408
Operation of non-instructional services 10,385,256 9,855,378 - - - Athletics 279,746 263,334 - - - Capital outlay 9,858,461 10,312,236 19,420,335 17,539,355 14,939,280 Debt service:
Principal 10,861,286 14,305,648 9,044,230 8,598,102 7,985,000 Interest 1,362,600 1,100,745 1,218,681 1,345,245 1,224,129 Capital lease issuance costs - 106,313 - 33,265
Total expenditures 108,137,112$ 108,910,992$ 111,655,543$ 111,167,643$ 117,197,671$
Revenues over (under) expenditures (9,615,888)$ (9,913,052)$ (15,206,938)$ (12,239,910)$ (12,667,342)$
Other Financing Sources (Uses)Sale of capital assets 492,941$ -$ -$ -$ -$ Bonds issued - 22,710,000 14,000,000 - 33,530,000 Premium on bonds issued - 835,674 909,222 - 486,113 Capital lease - - 6,750,000 - - Payments to refunded debt escrow - - - - (3,530,000)
Total other financing sources (uses) 492,941$ 23,545,674$ 21,659,222$ -$ 30,486,113$
Net Change in Fund Balances (9,122,947)$ 13,632,622$ 6,452,284$ (12,239,910)$ 17,818,771$
Debt Service as a Percentage of Noncapital Expenditures 11.7% 14.6% 9.9% 9.7% 9.2%
Note 1: New Mexico adopted the UCOA for school districts and combined governmental activity categories into Instruction,
Support services,Operation of non-instructional services, Food services, Athletics, Pupil Transportation and
Interest on long-term debt. Prior years have been adjusted accordingly.
Note - The District recomputed the percentage using the capitalized expenditures (capital asset additions) and not the capital outlay amount.
Note - The District began reporting expenditures according to the breakdown by function in 2012. ( cont'd; 1 of 2)
STATISTICAL SECTIONFINANCIAL TRENDS
206 | P a g e

STATE OF NEW MEXICO
FARMINGTON MUNICIPAL SCHOOL DISTRICT NO. 5
CHANGES IN FUND BALANCES, GOVERNMENTAL FUNDSLAST TEN FISCAL YEARS
(modified accrual basis of accounting)
2015 2016 2017 2018 2019Revenues
Federal Sources:Federal grants 12,899,475$ 12,016,822$ 11,484,316$ 11,917,824$ 12,922,565$
Total federal sources 12,899,475 12,016,822 11,484,316 11,917,824 12,922,565
State Sources:State equalization quarantee 74,607,143 75,496,685 72,051,469 75,622,445 79,112,920 Transportation 3,178,562 2,830,628 2,532,756 2,856,023 3,262,948 State instructional materials 778,480 778,264 768,191 345,047 370,113 State grants 14,435,313 16,861,994 20,527,767 8,750,972 2,732,048
Total state sources 92,999,498 95,967,571 95,880,183 87,574,487 85,478,029
Local Sources:District school tax levy 14,771,824 14,189,088 14,497,486 14,693,025 15,008,679 Fees and activities 1,640,821 1,967,084 1,627,905 1,345,846 2,672,459 Earnings from investments 8,257 30,862 121,838 59,985 157,624 Other revenue 1,308,013 486,622 370,492 354,961 311,619
Total local sources 17,728,915 16,673,656 16,617,721 16,453,817 18,150,381 Total revenues 123,627,888$ 124,658,049$ 123,982,220$ 115,946,128$ 116,550,975$
ExpendituresInstruction 59,071,009$ 58,657,865$ 56,969,232$ 54,463,988$ 57,006,184$ Support services:
Students 11,995,208 11,519,452 11,415,346 11,598,818 13,522,150 Instruction - support 1,884,372 1,729,713 1,130,118 1,054,104 1,640,248 General Administrative 1,394,879 1,428,319 1,649,188 1,678,310 2,023,466 School Administrative 5,087,882 5,687,386 5,024,327 5,660,295 6,134,811 Central Services 1,418,176 1,281,644 1,138,516 1,147,796 1,188,962 Operations & Maintenance of Plant 15,181,355 18,079,740 14,420,751 16,984,637 18,397,889 Student Transportation 4,124,173 2,924,893 2,594,929 2,880,336 3,067,810 Other support services 89,408 25,774 7,291 4,283 1,443
Non-instructional services:Food services 4,204,800 4,656,749 4,617,256 4,731,315 4,699,637 Community services 7,959 8,402 10,773 8,575 13,008
Operation of non-instructional servicesAthleticsCapital outlay 29,135,384 27,254,511 37,369,387 18,513,249 7,580,380 Debt service:
Principal 9,400,000 8,375,000 11,200,000 10,830,000 8,925,000 Interest 1,434,057 2,105,108 2,721,492 2,509,851 2,589,519 Capital lease issuance costs - 388,470 - 302,578 138,500
Total expenditures 144,428,662$ 144,123,026$ 150,268,606$ 132,368,135$ 126,929,007$
Revenues over (under) expenditures (20,800,774)$ (19,464,977)$ (26,286,386)$ (16,422,007)$ (10,378,032)$
Other Financing Sources (Uses)Sale of capital assets -$ -$ -$ -$ -$ Bonds issued - 41,700,000 - 18,470,000 11,000,000 Premium on bonds issued - 2,747,064 - - - Capital lease - - - - - Payments to refunded debt escrow - (211,546) - -
Total other financing sources (uses) -$ 44,447,064$ (211,546)$ 18,470,000$ 11,000,000$
Net Change in Fund Balances (20,800,774)$ 24,982,087$ (26,497,932)$ 2,047,993$ 621,968$
Debt Service as a Percentage of Noncapital Expenditures 9.4% 9.0% 12.3% 11.7% 9.7%
( 2 of 2)
STATISTICAL SECTIONFINANCIAL TRENDS
207 | P a g e

THIS PAGE INTENTIONALLY LEFT BLANK
STATISTICAL SECTION
208 | P a g e

STATE OF NEW MEXICO
FARMINGTON MUNICIPAL SCHOOL DISTRICT NO. 5
ASSESSED VALUE AND ESTIMATED ACTUAL VALUE OF TAXABLE PROPERTYLAST TEN FISCAL YEARS
Total EstimatedTotal Taxable Actual Total
Fiscal Local Central Oil & Gas Assessed Assessed Taxable Direct
Year Assessed Assessed Assessed Value Exemptions Value1 Value Tax Rate
2019 1,682,524,039$ 75,861,603$ 28,403,859$ 1,786,789,501$ 294,022,486$ 1,492,767,015$ 4,478,748,920$ 9.946 2018 1,682,524,039 77,992,122 61,512,537 1,822,028,698 294,022,486 1,528,006,212 4,584,477,084 9.946 2017 1,660,751,578 71,832,801 49,660,581 1,782,244,960 293,098,717 1,489,146,243 4,467,885,518 9.947 2016 1,628,353,760 78,630,781 61,125,886 1,768,110,427 283,132,549 1,484,977,878 4,455,379,172 9.921 2015 1,600,883,002 74,064,669 125,310,176 1,800,257,847 283,214,249 1,517,043,598 4,551,585,953 9.939 2014 1,568,435,510 74,491,847 110,402,844 1,753,330,201 281,616,474 1,471,713,727 4,415,582,739 9.931 2013 1,505,199,475 77,702,285 101,656,804 1,684,558,564 257,130,153 1,427,428,411 4,282,713,504 9.926 2012 1,449,286,960 83,782,919 162,995,453 1,696,065,332 242,086,301 1,453,979,031 4,362,373,330 9.924 2011 1,409,817,347 84,283,882 148,590,174 1,642,691,403 230,196,464 1,412,494,939 4,237,908,608 9.923 2010 1,253,326,754 91,177,960 131,413,661 1,475,918,375 101,810,388 1,374,107,987 4,122,736,235 9.921
1 The assessed values are 33 1/3% of actual taxable value, as set
by New Mexico statute.
Source: State of New Mexico, Taxation and Revenue Department Property Tax Division, and Office of San Juan County Assessor.
STATISTICAL SECTIONREVENUE CAPACITY
209 | P a g e

STATE OF NEW MEXICO
FARMINGTON MUNICIPAL SCHOOL DISTRICT NO. 5
COMPUTATION OF DIRECT AND OVERLAPPING GENERAL OBLIGATION MILLAGE RATESLAST TEN FISCAL YEARS
Farmington Municipal Schools Millage Rates Overlapping Millage Rates
Fiscal Year Operational
Debt Service
Capital Improvement
Ed Tech Debt
ServiceTotal
Direct RateState Debt
ServiceSan Juan County
City of Farmington
San Juan College
Total Direct & Overlapping
2019 City of Farmington Residential 0.327 5.390 2.000 2.056 9.773 1.360 6.700 1.425 3.992 23.250City of Farmington Commercial/Oil & Gas 0.500 5.390 2.000 2.056 9.946 1.360 8.500 2.225 5.100 27.131San Juan County Residential 0.327 5.390 2.000 2.056 9.773 1.360 6.700 0.000 3.992 21.825San Juan County Commercial/Oil & Gas 0.500 5.390 2.000 2.056 9.946 1.360 8.500 0.000 5.100 24.906
2018 City of Farmington Residential 0.327 5.390 2.000 2.056 9.773 1.360 6.700 1.425 3.992 23.250City of Farmington Commercial/Oil & Gas 0.500 5.390 2.000 2.056 9.946 1.360 8.500 2.225 5.100 27.131San Juan County Residential 0.327 5.390 2.000 2.056 9.773 1.360 6.700 0.000 3.992 21.825San Juan County Commercial/Oil & Gas 0.500 5.390 2.000 2.056 9.946 1.360 8.500 0.000 5.100 24.906
2017 City of Farmington Residential 0.320 5.258 1.956 2.189 9.723 1.360 6.545 1.394 3.914 22.936City of Farmington Commercial/Oil & Gas 0.500 5.258 2.000 2.189 9.947 1.360 8.500 2.225 5.100 27.132San Juan County Residential 0.320 5.258 1.956 2.189 9.723 1.360 6.545 0.000 3.914 21.542San Juan County Commercial/Oil & Gas 0.500 5.258 2.000 2.189 9.947 1.360 8.500 0.000 5.100 24.907
2016 City of Farmington Residential 0.319 5.167 1.951 2.254 9.691 1.360 6.529 1.392 3.863 22.835City of Farmington Commercial/Oil & Gas 0.500 5.167 2.000 2.254 9.921 1.360 8.500 2.209 5.100 27.090San Juan County Residential 0.319 5.167 1.951 2.254 9.691 1.360 6.529 0.000 3.863 21.443San Juan County Commercial/Oil & Gas 0.500 5.167 2.000 2.254 9.921 1.360 8.500 0.000 5.100 24.881
2015 City of Farmington Residential 0.323 4.656 1.974 2.783 9.736 1.360 6.231 1.410 3.714 22.451City of Farmington Commercial/Oil & Gas 0.500 4.656 2.000 2.783 9.939 1.360 8.500 2.225 5.100 27.124San Juan County Residential 0.323 4.656 1.974 2.783 9.736 1.360 6.231 0.000 3.714 21.041San Juan County Commercial/Oil & Gas 0.500 4.656 2.000 2.783 9.939 1.360 8.500 0.000 5.100 24.899
2014 City of Farmington Residential 0.322 3.937 1.968 3.494 9.721 1.360 6.231 1.407 3.714 22.433City of Farmington Commercial/Oil & Gas 0.500 3.937 2.000 3.494 9.931 1.360 8.500 2.225 5.100 27.116San Juan County Residential 0.322 3.937 1.968 3.494 9.721 1.360 6.231 0.000 3.714 21.026San Juan County Commercial/Oil & Gas 0.500 3.937 2.000 3.494 9.931 1.360 8.500 0.000 5.100 24.891
( cont'd; 1 of 2 )
STATISTICAL SECTIONREVENUE CAPACITY
210 | P a g e
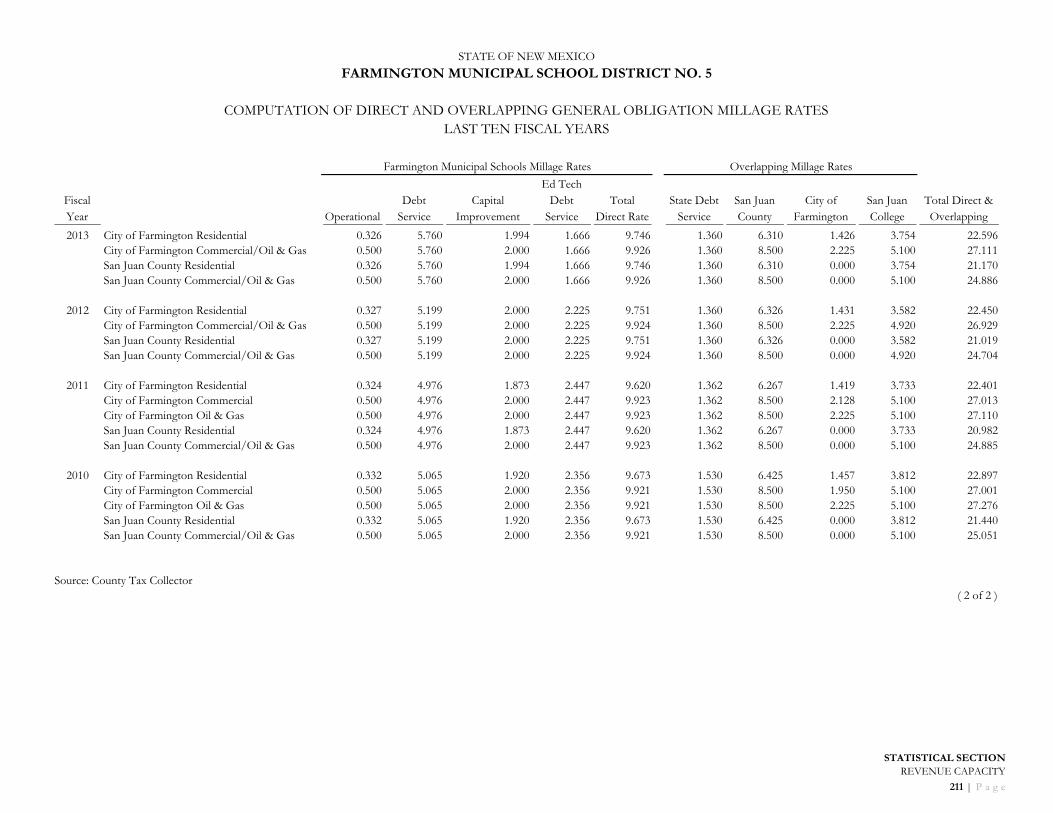
STATE OF NEW MEXICO
FARMINGTON MUNICIPAL SCHOOL DISTRICT NO. 5
COMPUTATION OF DIRECT AND OVERLAPPING GENERAL OBLIGATION MILLAGE RATESLAST TEN FISCAL YEARS
Farmington Municipal Schools Millage Rates Overlapping Millage Rates
Fiscal Year Operational
Debt Service
Capital Improvement
Ed Tech Debt
ServiceTotal
Direct RateState Debt
ServiceSan Juan County
City of Farmington
San Juan College
Total Direct & Overlapping
2013 City of Farmington Residential 0.326 5.760 1.994 1.666 9.746 1.360 6.310 1.426 3.754 22.596City of Farmington Commercial/Oil & Gas 0.500 5.760 2.000 1.666 9.926 1.360 8.500 2.225 5.100 27.111San Juan County Residential 0.326 5.760 1.994 1.666 9.746 1.360 6.310 0.000 3.754 21.170San Juan County Commercial/Oil & Gas 0.500 5.760 2.000 1.666 9.926 1.360 8.500 0.000 5.100 24.886
2012 City of Farmington Residential 0.327 5.199 2.000 2.225 9.751 1.360 6.326 1.431 3.582 22.450City of Farmington Commercial/Oil & Gas 0.500 5.199 2.000 2.225 9.924 1.360 8.500 2.225 4.920 26.929San Juan County Residential 0.327 5.199 2.000 2.225 9.751 1.360 6.326 0.000 3.582 21.019San Juan County Commercial/Oil & Gas 0.500 5.199 2.000 2.225 9.924 1.360 8.500 0.000 4.920 24.704
2011 City of Farmington Residential 0.324 4.976 1.873 2.447 9.620 1.362 6.267 1.419 3.733 22.401City of Farmington Commercial 0.500 4.976 2.000 2.447 9.923 1.362 8.500 2.128 5.100 27.013City of Farmington Oil & Gas 0.500 4.976 2.000 2.447 9.923 1.362 8.500 2.225 5.100 27.110San Juan County Residential 0.324 4.976 1.873 2.447 9.620 1.362 6.267 0.000 3.733 20.982San Juan County Commercial/Oil & Gas 0.500 4.976 2.000 2.447 9.923 1.362 8.500 0.000 5.100 24.885
2010 City of Farmington Residential 0.332 5.065 1.920 2.356 9.673 1.530 6.425 1.457 3.812 22.897City of Farmington Commercial 0.500 5.065 2.000 2.356 9.921 1.530 8.500 1.950 5.100 27.001City of Farmington Oil & Gas 0.500 5.065 2.000 2.356 9.921 1.530 8.500 2.225 5.100 27.276San Juan County Residential 0.332 5.065 1.920 2.356 9.673 1.530 6.425 0.000 3.812 21.440San Juan County Commercial/Oil & Gas 0.500 5.065 2.000 2.356 9.921 1.530 8.500 0.000 5.100 25.051
Source: County Tax Collector( 2 of 2 )
STATISTICAL SECTIONREVENUE CAPACITY
211 | P a g e

STATE OF NEW MEXICO
FARMINGTON MUNICIPAL SCHOOL DISTRICT NO. 5
COMPUTATION OF DIRECT AND OVERLAPPINGGENERAL OBLIGATION DEBT
2019Assessed G/O Debt PercentValuation Outstanding Applicable Amount
Overlapping DebtState of New Mexico 61,126,458,199$ 411,525,000$ 2.49% 10,266,687$
San Juan County 3,680,556,471 - 41.43% -
San Juan College 3,680,556,471 14,345,000 41.43% 5,943,611
City of Farmington 1,190,562,006 - 100.00% -
Total Overlapping Debt 16,210,298
Direct DebtFarmington Schools 1,524,977,124 89,415,000 100.00% 89,415,000
Total Direct and Overlapping Debt 105,625,298.20$
Percent Applicable is calculated based on Assessed Valuation (i.e. Farmington Municipal Schools AV / State of NM AV = 2.51%
STATISTICAL SECTIONREVENUE CAPACITY
212 | P a g e

Assessed Percentage of Assessed Percentage ofTaxpayer Type of Business Valuation Rank Assessed Valuation Valuation Rank Assessed Valuation
San Regional Medical Center Healthcare 10,130,806$ 1 0.70%Animas Valley Mall LLC Retail 9,999,194 2 0.70%Compressco Leasing Pipeline 9,938,063 3 0.70%Transwestern Pipeline Pipeline 9,458,823 4 0.60%HILCORP San Juan LP Pipeline 9,130,444 5 0.60%XTO Energy Inc. Oil Field Services 8,736,462 6 0.60%Gas Company of New Mexico Utility 7,621,809 7 0.50% 280,983,192$ 2 1.81%Enterprise Field Services LLC Oil Field Services 7,059,460 8 0.50% 205,986,196 6 1.33%Archrock Partners/Services Pipeline 6,120,093 9 0.40%Animas Valley Leasing LLC Real Estate 5,959,098 10 0.40%Transwestern Pipeline Pipeline 122,034,376 9 0.79%San Juan Coal Company Coal 285,161,168 1 1.84%BHP Navajo Coal Co Coal 279,930,478 3 1.80%Arizona Public Service Co Utility 247,084,327 4 1.59%Williams Four Corners LLC Oil Field Services 226,297,252 5 1.46%Tucson Electric Power Co Utility 157,816,947 7 1.02%Southern California Edison Co Utility 140,844,244 8 0.91%El Paso Field Service Oil Field Services 119,044,574 10 0.77%
Total 84,154,252$ 5.70% 1,946,138,180$ 13.30%
District's Assessed Valuation 1,528,006,212$ 100.00% 1,439,118,979$ 100.00%
Source: San Juan County's Assessor's OfficeState of New Mexico Taxation & Revenue, Property Tax Division
2019 2010
STATE OF NEW MEXICO
FARMINGTON MUNICIPAL SCHOOL DISTRICT NO. 5
PRINCIPAL PROPERTY TAXPAYERSCURRENT YEAR AND TEN YEARS AGO
STATISTICAL SECTIONREVENUE CAPACITY
213 | P a g e

Taxes Levied CollectionFiscal for the Percentage in Subsequent Percentage Year Fiscal Year Amount of Levy Years Amount of Levy2019 14,432,659$ 13,976,218$ 96.84% -$ 13,841,232$ 95.90%2018 14,210,750 13,658,912 96.12% 243,130 13,902,042 97.83%2017 13,934,874 13,382,726 96.04% 325,333 13,708,059 98.37%2016 13,695,728 13,118,514 95.79% 357,750 13,476,264 98.40%2015 13,395,584 12,901,875 96.31% 416,509 13,318,384 99.42%2014 13,112,805 12,608,715 96.16% 474,904 13,083,619 99.78%2013 12,817,489 12,264,550 95.69% 543,871 12,808,421 99.93%2012 12,367,075 11,802,343 95.43% 562,259 12,364,602 99.98%2011 12,128,833 11,498,161 94.80% 626,495 12,124,656 99.97%2010 11,883,483 11,209,714 94.33% 671,949 11,881,663 99.98%
Source: San Juan County Treasurer.
Fiscal Year of the Levy Total Collections to Date
FARMINGTON MUNICIPAL SCHOOLS DISTRICT NO. 5STATE OF NEW MEXICO
LAST TEN FISCAL YEARSPROPERTY TAX LEVIES AND COLLECTIONS
Collected within the
STATISTICAL SECTIONREVENUE CAPACITY
214 | P a g e
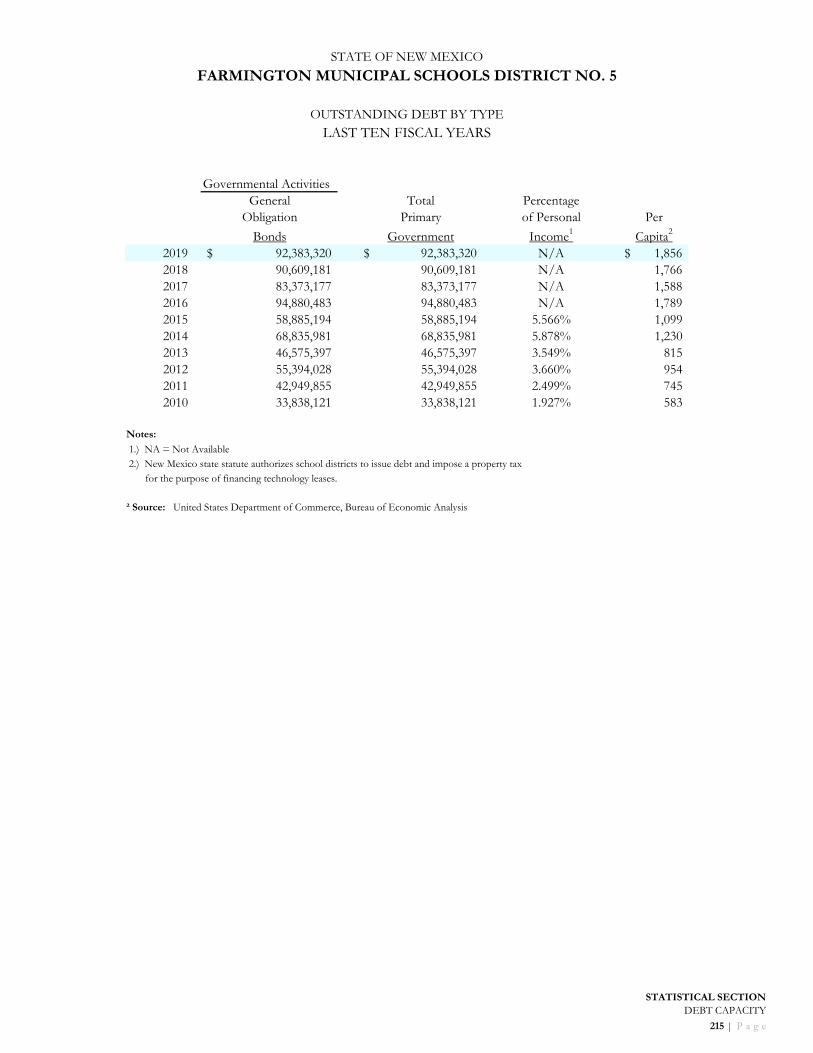
Governmental ActivitiesGeneral Total Percentage
Obligation Primary of Personal Per
Bonds Government Income1 Capita2
2019 92,383,320$ 92,383,320$ N/A 1,856$ 2018 90,609,181 90,609,181 N/A 1,766 2017 83,373,177 83,373,177 N/A 1,588 2016 94,880,483 94,880,483 N/A 1,789 2015 58,885,194 58,885,194 5.566% 1,099 2014 68,835,981 68,835,981 5.878% 1,230 2013 46,575,397 46,575,397 3.549% 815 2012 55,394,028 55,394,028 3.660% 954 2011 42,949,855 42,949,855 2.499% 745 2010 33,838,121 33,838,121 1.927% 583
Notes:
1.) NA = Not Available 2.) New Mexico state statute authorizes school districts to issue debt and impose a property tax
for the purpose of financing technology leases.
² Source: United States Department of Commerce, Bureau of Economic Analysis
STATE OF NEW MEXICO
FARMINGTON MUNICIPAL SCHOOLS DISTRICT NO. 5
OUTSTANDING DEBT BY TYPE
LAST TEN FISCAL YEARS
STATISTICAL SECTIONDEBT CAPACITY
215 | P a g e

Percentage ofEstimated
General Less: Amounts Actual TaxableFiscal Obligation Available in Debt Value of PerYear Bonds Service fund Total Property Capita2019 92,383,320$ 12,884,607$ 79,498,713$ -10.18% 1,715$ 2018 90,609,181 13,270,624 77,338,557 5.19% 1,508 2017 83,373,177 13,377,216 69,995,961 -8.96% 1,624 2016 94,880,483 16,516,851 78,363,632 -10.03% 1,740 2015 58,885,194 13,858,533 45,026,661 4.34% 961 2014 68,835,981 13,861,821 54,974,160 4.94% 1,145 2013 46,575,397 11,949,971 34,625,426 2.84% 703 2012 55,394,028 10,768,985 44,625,043 3.28% 834 2011 42,949,855 10,472,588 32,477,267 2.23% 565 2010 33,838,121 10,334,379 23,503,742 1.71% 398
STATE OF NEW MEXICO
FARMINGTON MUNICIPAL SCHOOLS DISTRICT NO. 5
RATIOS OF GENERAL BONDED DEBT OUTSTANDINGLAST TEN FISCAL YEARS
STATISTICAL SECTIONDEBT CAPACITY
216 | P a g e

STATE OF NEW MEXICO
FARMINGTON MUNICIPAL SCHOOL DISTRICT NO. 5
COMPUTATION OF LEGAL DEBT MARGINLAST TEN YEARS
2010 2011 2012 2013 2014
Debt Limit 82,446,479$ 84,749,696$ 87,238,742$ 85,645,705$ 88,302,824$ Total net debt applicable to limit 33,467,980 41,872,331 53,578,102 44,980,000 66,975,000
Legal debt margin 48,978,499$ 42,877,365$ 33,660,640$ 40,665,705$ 21,327,824$
Total net debt applicable to the limit as a percentage of debt limit 41% 49% 61% 53% 76%
2015 2016 2017 2018 2019
Debt Limit 90,429,785$ 91,022,616$ 89,348,775$ 89,666,646$ 91,498,627$ Total net debt applicable to limit 57,575,000 90,900,000 79,700,000 87,340,000 89,415,000
Legal debt margin 32,854,785$ 122,616$ 9,648,775$ 2,326,646$ 2,083,627$
Total net debt applicable to the limit as a percentage of debt limit 64% 100% 89% 97% 98%
Legal Debt Limit Calculation for Fiscal Year 2018
Assessed Value 1,524,977,124$
Debt limit (6% of total assessed value) 91,498,627$ Debt applicable to limit: General Obligation Bonds 89,415,000
Legal debt margin 2,083,627$
Note: The debt limit for school districts in New Mexico is 6% of the district's assessed value.
STATISTICAL SECTIONDEBT CAPACITY
217 | P a g e

STATE OF NEW MEXICO
FARMINGTON MUNICIPAL SCHOOL DISTRICT NO. 5
DEMOGRAPHIC AND ECONOMIC STATISTICSLAST TEN YEARS
PerCalendar Personal Capita Unemployment
Year Population Income Income 1 Rate 2
2019 49,788 N/A N/A 6.90%2018 51,300 N/A N/A 7.40%2017 52,506 N/A N/A 8.00%2016 53,037 1,379,008,802 26,001 9.10%2015 53,572 2,066,451,466 38,573 7.70%2014 55,980 2,026,293,878 36,197 7.40%2013 57,180 1,928,809,136 33,732 7.60%2012 58,051 1,958,762,376 33,742 7.70%2011 57,623 1,893,557,815 32,861 8.60%2010 58,076 1,756,276,316 30,241 9.80%
Notes: NA=Not available - 2017 to be released in December 2018
Source: 1 United States Department of Commerce, Bureau of Economic Analysis
2 United States Bureau of Labor Statistics
STATISTICAL SECTIONDEMOGRAPHIC AND ECONOMIC INFORMATION
218 | P a g e

STATE OF NEW MEXICO
FARMINGTON MUNICIPAL SCHOOL DISTRICT NO. 5
PRINCIPAL EMPLOYERSCURRENT YEAR AND TEN YEARS AGO
2019 2010Percentage Percentage
of Total of TotalEmployer Employees Rank Employment Employees Rank Employment
San Juan Medical Center 1,930 1 3.87% 1,450 2 2.48%Farmington Municipal School District No.5 1,257 2 2.52% 1,488 1 2.54%Central Consolidated Schools 1,200 3 2.40% 1,205 3 2.06%City of Farmington 1,100 4 2.20% 1,093 4 1.87%San Juan College 900 5 1.80% 1,000 6 1.71%San Juan County 770 6 1.54%Basin Home Health/Basin Coord. 756 7 1.52%Wal-Mart 655 8 1.31% 896 7 1.53%Bloomfield Schools 453 9 0.91%Raytheon 450 10 0.90%BHP Billiton 1,010 5 1.73%Arizona Public Service Company 590 9 1.01%Conoco Phillips 812 8 1.39%Bloomfield Schools 500 10 0.85%
9,471 18.97% 10,044 17.17%
STATISTICAL SECTIONDEMOGRAHIC AND ECONOMIC INFORMATION
219 | P a g e

STATE OF NEW MEXICO
FARMINGTON MUNICIPAL SCHOOL DISTRICT NO. 5
FULL-TIME-EQUIVALENT DISTRICT EMPLOYEES BY FUNCTIONLAST TEN FISCAL YEARS
Full-time Equivalent Employees as of June 30
2019 2018 2017 2016 2015 2014 2013 2012 2011 2010
Instruction:
Teachers 628 623 663 708 710 696 659 651 644 685
Instructional Aides 170 157 179 183 185 178 211 175 184 112
Support services:
Students 187 169 163 165 123 157 155 155 160 154
Instruction - support 17.3 18 19 21 23 21 26 23 23 21
General Administrative 16 10 9 9 9 7 11 14 12 13
School Administrative 61 59 50 54 65 50 42 47 47 50
Central Services 13 13 14 14 17 14 11 9 9 11
Operations & Maintenance of Plant 105 104 92 90 97 92 105 90 97 100
Student Transportation 57 63 61 59 58 60 63 64 64 87
Food Services Operations 3 3 3 4 4 4 4 3 4 4
Total 1,257 1,219 1,253 1,307 1,291 1,279 1,287 1,231 1,244 1,237
Notes: Full-time instructional employees of the district are
employed for all 185 scheduled school days, at 7.5 hours per day or 1,387.5 hours per year.
Bus Drivers FTE calculation changed in 2012 to reflect actualhours in route.
Source: Actuals Expenditure Rollup Report
STATISTICAL SECTIONDEMOGRAPHIC AND ECONOMIC INFORMATION
220 | P a g e

Percentageof StudentsReceiving
Cost Cost Pupil- Free orFiscal Operating Per Percentage Per Percentage Teaching Teacher Reduced-PriceYear Enrollment Expenditures Pupil Change Expenses Pupil Change Staff Ratio Meals2019 10,964 79,299,830 7,233 6.69% 113,080,356 10,314 0.30% 628 17.46 44.40%2018 10,958 74,291,727 6,780 -1.34% 112,685,658 10,283 -4.68% 623 17.59 68.65%2017 10,919 75,030,807 6,872 -3.90% 117,795,535 10,788 -1.03% 663 16.47 62.04%2016 10,928 78,137,653 7,150 1.73% 119,123,975 10,901 -2.30% 708 15.44 57.43%2015 11,069 77,800,382 7,029 5.36% 123,498,205 11,157 17.15% 710 15.59 55.20%2014 10,923 72,871,616 6,671 6.29% 104,025,142 9,523 0.27% 696 15.69 56.08%2013 10,686 67,074,652 6,277 2.49% 101,490,733 9,498 -0.46% 659 16.22 55.22%2012 10,648 65,213,440 6,124 6.35% 101,592,359 9,541 9.86% 651 16.36 55.90%2011 10,572 60,880,957 5,759 -1.37% 91,811,663 8,684 -4.91% 644 16.42 52.58%2010 10,517 61,407,778 5,839 -9.67% 96,050,751 9,133 -5.39% 685 15.35 49.21%
Notes: Enrollment figures from average student counts on 80th and 120th day of school.
2009 Operating expenditures include only expenditures for 11000 general fund. Prior years included transportation and instructional materials as they were classified as general funds by the state until 2009.
Expenses include expenditures for all governmental funds less debt service
STATE OF NEW MEXICO
FARMINGTON MUNICIPAL SCHOOL DISTRICT NO. 5
OPERATING STATISTICSLAST TEN FISCAL YEARS
STATISTICAL SECTIONOPERATING INFORMATION
221 | P a g e

STATE OF NEW MEXICO
FARMINGTON MUNICIPAL SCHOOL DISTRICT NO. 5
SCHOOL BUILDING INFORMATIONLAST FIVE YEARS
School 2015 2016 2017 2018 2019ElementaryAnimas (1963)
Square Feet 56,678 56,678 56,678 56,678 56,678Capacity 528 528 528 528 528
Enrollment 451 426 445 471 453.5Apache (1956)
Square Feet 59,712 59,712 59,712 59,712 59,712Capacity 594 594 594 594 594
Enrollment 520 494 472 459 467.5Bluffview (1961)
Square Feet 61,197 61,197 61,197 61,197 61,197Capacity 578 578 578 578 578
Enrollment 460 427 409 410 406Country Club (1959)
Square Feet 59,164 59,164 59,164 59,164 59,164Capacity 578 578 578 578 578
Enrollment 555 576 555 570 597Esperanza (1995)
Square Feet 79,284 79,284 79,284 79,284 79,284Capacity 660 660 660 660 660
Enrollment 612 612 593 566 519Ladera (1963)
Square Feet 59,159 59,159 59,159 59,159 59,159Capacity 561 561 561 561 561
Enrollment 602 604 595 572 554McCormick (1954)
Square Feet 57,474 57,474 57,474 66,267 66,267Capacity 578 578 578 578 578
Enrollment 497 496 444 429 442McKinley (1954)
Square Feet 73,192 73,192 73,192 73,192 73,192Capacity 644 644 644 644 644
Enrollment 604 583 587 572 577Mesa Verde (1963)
Square Feet 54,131 54,131 54,131 54,131 54,131Capacity 578 578 578 578 578
Enrollment 582 524 502 470 445Northeast (1963)
Square Feet 55,923 76,928 76,928 76,928 76,928Capacity 578 578 580 580 580
Enrollment 564 533 626 631 599.5
Source: School District's Master Facility Survey ( cont'd; 1 of 2)
STATISTICAL SECTIONOPERATING INFORMATION
222 | P a g e

STATE OF NEW MEXICO
FARMINGTON MUNICIPAL SCHOOL DISTRICT NO. 5
SCHOOL BUILDING INFORMATIONLAST FIVE YEARS
School 2015 2016 2017 2018 2019Middle SchoolHeights (1971)
Square Feet 88,229 88,229 88,229 88,229 88,229Capacity 1100 1100 1100 1100 1100
Enrollment 700 706 692 704 701Hermosa (1960)
Square Feet 85,849 94,466 94,466 94,466 94,466Capacity 1025 1025 1025 1025 1025
Enrollment 571 583 603 644 635.5Mesa View (1994)
Square Feet 100,987 100,987 100,987 100,987 100,987Capacity 1080 1080 1080 1080 1080
Enrollment 620 587 544 503 517Tibbetts (2014)
Square Feet 113,217 113,217 113,217 113,217 113,217Capacity 1160 1160 1160 1160 1160
Enrollment 575 587 621 656 666.5
High SchoolFarmington (1955)
Square Feet 262,628 262,628 180,598 317,044 317,044Capacity 2334 2334 2334 2334 2334
Enrollment 1404 1392 1322 1325 1373Piedra Vista (1998)
Square Feet 247,138 247,138 247,138 253,238 253,238Capacity 1821 1821 1821 1821 1821
Enrollment 1379 1412 1430 1401 1433.5Rocinante (1996)
Square Feet 24,187 24,187 24,187 24,187 24,187Capacity 333 333 333 333 333
Enrollment 178 184 207 228 227.5San Juan College HS (2016)
Square Feet 8,322 8,322 8,322Capacity 88 88 88
Enrollment 74 148 231
PreschoolFS Preschool (1991)
Square Feet 13,505 13,505 13,505 13,505 13,505Capacity 92 92 92 92 92
Enrollment 147 164 173 168 168
Cate Center (1949)Square Feet 52,191 52,191 52,191 52,191 52,191
Capacity 719 719 719 719 719Enrollment 200 200 200 200 200
( 2 of 2)
STATISTICAL SECTIONOPERATING INFORMATION
223 | P a g e

THIS PAGE INTENTIONALLY LEFT BLANK
STATISTICAL SECTION
224 | P a g e

225 | P a g e
COMPLIANCE SECTION
Report on Internal Control over Financial Reporting and on Compliance and Other Matters Based on an Audit of Financial Statements
Performed in Accordance with Government Auditing Standards
§ Report on Compliance for Each Major Federal Program and
Report on Internal Control Over Compliance Required By Uniform Guidance
§ Schedule of Findings and Questioned Costs:
Summary of Auditor’s Results Financial Statement Findings
Federal Award Findings
§ Summary Schedule of Prior Year Audit Findings
§ Schedule of Expenditures of Federal Awards
Notes to the Schedule of Expenditures of Federal Awards
§ Required Disclosure

226 | P a g e
THIS PAGE INTENTIONALLY LEFT BLANK

4801NButlerAve.Ste.8101 Farmington,NM87401
Phone(505)566-1900 Fax(505)566-1911
227 | P a g e
REPORT ON INTERNAL CONTROL OVER FINANCIAL REPORTING AND ON COMPLIANCE AND OTHER MATTERS BASED ON AN AUDIT OF FINANCIAL STATEMENTS
PERFORMED IN ACCORDANCE WITH GOVERNMENT AUDITING STANDARDS
INDEPENDENT AUDITORS' REPORT Brian S. Colón, Esq., State Auditor and The Board of Education and Audit Committee of Farmington Municipal School District No. 5 We have audited, in accordance with the auditing standards generally accepted in the United States of America and the standards applicable to financial audits contained in Government Auditing Standards issued by the Comptroller General of the United States, the financial statements of the governmental activities, discretely presented component unit, each major fund, the aggregate remaining fund information, the budgetary comparisons of the general fund and major special revenue funds, of the Farmington Municipal School District No. 5 as of and for the year ended June 30, 2019, and the related notes to the financial statements, which collectively comprise Farmington Municipal School District No. 5’s basic financial statements, and the combining and individual funds and related budgetary comparisons of Farmington Municipal School District No. 5, presented as supplemental information, and have issued our report thereon dated November 6, 2019. Internal Control Over Financial Reporting
In planning and performing our audit, of the financial statements, we considered Farmington Municipal School District No. 5’s internal control over financial reporting (internal control) to determine the audit procedures that are appropriate in the circumstances for the purpose of expressing our opinions on the financial statements, but not for the purpose of expressing an opinion on the effectiveness of Farmington Municipal School District No. 5’s internal control. Accordingly, we do not express an opinion on the effectiveness of Farmington Municipal School District No. 5’s internal control.
Our consideration of internal control was for the limited purpose described in the preceding paragraph and was not designed to identify all deficiencies in internal control that might be material weaknesses or significant deficiencies and therefore, material weaknesses or significant deficiencies may exist that have not been identified. However, as described in the accompanying schedule of findings and responses, we identified certain deficiencies in internal control that we consider to be material weaknesses and significant deficiencies. A deficiency in internal control exists when the design or operation of a control does not allow management or employees, in the normal course of performing their assigned functions, to prevent, or detect and correct, misstatements on a timely basis. A material weakness is a deficiency, or a combination of deficiencies, in internal control such that there is a reasonable possibility that a material misstatement of the entity’s financial statements will not be prevented, or detected and corrected on a timely basis. We consider the deficiencies described in the accompanying schedule of findings and responses to be material weaknesses. Finding 2019-001 and 2019-002. A significant deficiency is a deficiency, or a combination of deficiencies, in internal control that is less severe than a material weakness, yet important enough to merit attention by those charged with governance. We consider the deficiencies described in the accompanying schedule of findings and responses to be significant deficiencies. Finding 2019-003 and 2019-004. Compliance and other matters
As part of obtaining reasonable assurance about whether Farmington Municipal School District No. 5’s financial statements are free of material misstatement, we performed tests of its compliance with certain provisions of laws, regulations, contracts, and grant agreements, noncompliance with which could have a direct and material effect on the determination of financial statement amounts. However, providing an opinion on compliance with those provisions was not an objective of our audit, and accordingly, we do not express such an opinion. We also noted certain other matters that are required to be reported pursuant to Government Auditing Standards and pursuant to Section 12-6-5, NMSA 1978, which are described in the accompanying schedule of findings and questioned costs as finding 2019-005 through 2019-008.

4801NButlerAve.Ste.8101 Farmington,NM87401
Phone(505)566-1900 Fax(505)566-1911
228 | P a g e
Brian S. Colón, Esq., State Auditor and The Board of Education and Audit Committee of Farmington Municipal School District No. 5 Farmington Municipal School District No. 5’s Response to Findings
Farmington Municipal School District No. 5 responses to the findings identified in our audit are described in the accompanying schedule of findings and questioned costs. Farmington Municipal School District No. 5’s responses were not subjected to the auditing procedures applied in the audit of the financial statements and, accordingly, we express no opinion on them. Purpose of this Report
The purpose of this report is solely to describe the scope of our testing of internal control and compliance and the result of that testing, and not to provide an opinion on the effectiveness of the Farmington Municipal School District No. 5’s internal control or on compliance. This report is an integral part of an audit performed in accordance with Government Auditing Standards in considering the entity’s internal control and compliance. Accordingly, this communication is not suitable for any other purpose. Farmington, New Mexico November 6, 2019

4801NButlerAve.Ste.8101 Farmington,NM87401
Phone(505)566-1900 Fax(505)566-1911
229 | P a g e
REPORT ON COMPLIANCE FOR EACH MAJOR FEDERAL PROGRAM AND REPORT ON INTERNAL CONTROL OVER COMPLIANCE REQUIRED BY UNIFORM GUIDANCE
INDEPENDENT AUDITOR’S REPORT
Brian S. Colón, Esq., State Auditor and The Board of Education and Audit Committee of Farmington Municipal School District No. 5 Report on Compliance for Each Major Federal Program We have audited Farmington Municipal School District No. 5’s compliance with the types of compliance requirements described in the OMB Compliance Supplement that could have a direct and material effect on each of Farmington Municipal School District No. 5’s major federal programs for the year ended June 30, 2019. Farmington Municipal School District No. 5’s major federal programs are identified in the summary of auditor’s results section of the accompanying schedule of findings and questioned costs. Management’s Responsibility Management is responsible for compliance with the requirements of laws, regulations, contracts, and grants applicable to its federal programs. Auditor’s Responsibility Our responsibility is to express an opinion on compliance for each of Farmington Municipal School District No. 5’s major federal programs based on our audit of the types of compliance requirements referred to above. We conducted our audit of compliance in accordance with auditing standards generally accepted in the United States of America; the standards applicable to financial audits contained in Government Auditing Standards, issued by the Comptroller General of the United States; and the audit requirements of Title 2 U.S. Code of Federal Regulations Part 200, Uniform Administrative Requirements, Cost Principles, and Audit Requirements for Federal Awards (Uniform Guidance) Those standards and the Uniform Guidance require that we plan and perform the audit to obtain reasonable assurance about whether noncompliance with the types of compliance requirements referred to above that could have a direct and material effect on a major federal program occurred. An audit includes examining, on a test basis, evidence about Farmington Municipal School District No. 5’s compliance with those requirements and performing such other procedures as we considered necessary in the circumstances.
We believe that our audit provides a reasonable basis for our opinion on compliance for each major federal program. However, our audit does not provide a legal determination of Farmington Municipal School District No. 5’s compliance. Opinion on Each Major Federal Program In our opinion, Farmington Municipal School District No. 5 complied, in all material respects, with the types of compliance requirements referred to above that could have a direct and material effect on each of its major federal programs for the year ended June 30, 2019.

4801NButlerAve.Ste.8101 Farmington,NM87401
Phone(505)566-1900 Fax(505)566-1911
230 | P a g e
Brian S. Colón, Esq., State Auditor and The Board of Education and Audit Committee of Farmington Municipal School District No. 5 Report on Internal Control Over Compliance Management of Farmington Municipal School District No. 5 is responsible for establishing and maintaining effective internal control over compliance with the types of compliance requirements referred to above. In planning and performing our audit of compliance, we considered Farmington Municipal School District No. 5’s internal control over compliance with the types of requirements that could have a direct and material effect on each major federal program to determine the auditing procedures that are appropriate in the circumstances for the purpose of expressing an opinion on compliance for each major federal program and to test and report on internal control over compliance in accordance with Uniform Guidance, but not for the purpose of expressing an opinion on the effectiveness of internal control over compliance. Accordingly, we do not express an opinion on the effectiveness of Farmington Municipal School District No. 5’s internal control over compliance. A deficiency in internal control over compliance exists when the design or operation of a control over compliance does not allow management or employees, in the normal course of performing their assigned functions, to prevent, or detect and correct, noncompliance with a type of compliance requirement of a federal program on a timely basis. A material weakness in internal control over compliance is a deficiency, or combination of deficiencies, in internal control over compliance, such that there is a reasonable possibility that material noncompliance with a type of compliance requirement of a federal program will not be prevented, or detected and corrected, on a timely basis. A significant deficiency in internal control over compliance is a deficiency, or a combination of deficiencies, in internal control over compliance with a type of compliance requirement of a federal program that is less severe than a material weakness in internal control over compliance, yet important enough to merit attention by those charged with governance. Our consideration of internal control over compliance was for the limited purpose described in the first paragraph of this section and was not designed to identify all deficiencies in internal control over compliance that might be material weaknesses or significant deficiencies. We did not identify any deficiencies in internal control over compliance that we consider to be material weaknesses. However, material weaknesses may exist that have not been identified. The purpose of this report on internal control over compliance is solely to describe the scope of our testing of internal control over compliance and the results of that testing based on the requirements of Uniform Guidance. Accordingly, this report is not suitable for any other purpose. Farmington, New Mexico November 6, 2019

COMPLIANCE SECTION 231 | P a g e
SCHEDULE OF EXPENDITURES OF FEDERAL AWARDS OF
FARMINGTON MUNICIPAL SCHOOL DISTRICT NO. 5
AS OF AND FOR THE YEAR ENDED
JUNE 30, 2019

STATE OF NEW MEXICOFARMINGTON MUNICIPAL SCHOOL DISTRICT NO. 5
SCHEDULE OF EXPENDITURES OF FEDERAL AWARDSYear Ended June 30, 2019
Pass-ThroughFederal Entity
Federal Grantor/Pass - Through CFDA Identifying Passed To Cluster Federal Grantor/Program or Cluster Title Number Number Subrecipients Programs ExpendituresU.S. Department of Agriculture:
Pass-Through Program From:New Mexico Department of Education:
Child Nutrition Cluster:USDA National School Lunch Program 10.555 21000 -$ 2,748,967$ USDA School Breakfast Program 10.553 21000 - 642,024
Total Child Nutrition Cluster 3,390,991
Fresh Fruits and Vegetables 10.582 24118 - 77,334
Pass-Through Program From:
New Mexico Human Service Department:
USDA Commodities Program 10.565 21000 - 308,347
Total U.S. Department of Agriculture 3,776,672
U.S. Department of Interior
Pass-Through Programs From:
Office of the Navajo Nation:
Johnson O'Malley 15.130 25131 - 244,607
U.S. Department of Education:
Direct Programs:Impact Aid Indian Education 84.041 11000 - - Impact Aid Indian Education 84.041 25147 - 1,785 Indian Ed Formula Grant 84.060 25184 - 616,847 Native American Program 84.060 25248 - 360,894
Subtotal Direct Programs 979,526
Pass-Through Programs From:New Mexico Department of Education:
Special Education (IDEA) Cluster:Entitlement IDEA-B 84.027 24106 82,666 2,879,024$ Preschool IDEA-B 84.173 24109 - 78,600IDEA-B Private Schools 84.027 24115 - 6,224 IDEA-B Student Success 84.027A 24132 - 19,204IDEA-B Stay in School 84.027A 24188 - 215,255
Total Special Education (IDEA) Cluster 3,198,307
Title I 84.010 24101 - 2,275,147 Education of Homeless 84.196 24113 - 17,925 21st Century Community Learning Centers 84.287C 24119 - 173,402 Title I - 1003g 84.377 24124 - 315,879 Title III English Language 84.365 24153 - 99,844 Title II Teacher Quality 84.367 24154 - 552,363 Carl D Perkins - JAG 84.048 24171 - 52,646 Carl D Perkins 84.048 24174 - 86,908 Carl D Perkins Secondary Redistribution 84.048 24176 - 17,820 Academic Enrichment 84.424A 24189 - 69,778 Title I Comprehensive Support & Improvement 84.010A 24190 - 10,991 Title I - HS Redesign 84.010A 24191 - 64,722
Subtotal Pass-Through Programs 6,935,732
Total U.S. Department of Education 7,915,258
Total Expenditures of Federal Awards 82,666$ 11,936,537$
COMPLIANCE SECTION232 | P a g e
See the accompanying notes to the Schedule of Expenditures of Federal Awards.

NOTES THE SCHEDULE OF EXPENDITURES OF FEDERAL AWARDS COMPLIANCE SECTION JUNE 30, 2019 233 | P a g e
I. SCOPE OF AUDIT PURSUANT TO OMB UNIFORM GRANT GUIDANCE
All federal grant operations of Farmington Municipal Schools (the “District”) are included in the scope of the Office of Management and Budget (“OMB”) Uniform Grant Guidance audit (the “Single Audit”). The Single Audit was performed in accordance with the provisions of the OMB Circular Compliance Supplement (Revised July 2019 the “Compliance Supplement”). Compliance testing of all requirements are described in the Compliance Supplement, was performed for the grants programs noted below. These programs represent all federal award programs and other grants with fiscal year 2019 cash and non-cash expenditures to ensure coverage of at least 20% (LOW risk auditee) of federally granted funds. Actual coverage is approximately 31% of total cash and non-cash federal award program expenditures. Total cash expenditures were in the amount of $11,628,190 and all non-cash expenditures amounted to $308,347.
The District did not have any federal programs considered to be a High-Risk Type A program for the year ended June 30, 2019. The U.S. Department of Education is the District’s oversight agency for single audit.
Basis of presentation The accompanying Schedule of Expenditures of Federal Awards (the “Schedule”) includes the federal grant activity of the District under programs of the federal government for the year ended June 30, 2019. The information in this schedule is presented in accordance with the requirements of the Office of Management and Budget (OMB) Uniform Grant Guidance. Because the Schedule presents only a selected portion of the operations of the District, it is not intended to and does not present the financial position and changes in net position of the District. All federal programs considered active during the year ended June 30, 2019, are reflected on the Schedule. An active federal program is defined as a federal program for which there were receipts or disbursements of funds or accrued (deferred) grant revenue adjustments during the fiscal year or a federal program considered as not completed or closed out at the beginning of the fiscal year. The Schedule is prepared using the accrual basis of accounting. Grant revenues are recorded for financial reporting purposes when the District has met the qualifications for the respective grant. Grant revenues for the Food Donation Program are based upon commodities received, at amounts per standard price listing, published quarterly by the United States Department of Agriculture (the “USDA”). In addition, there is no federal insurance in effect during the year and loan or loan guarantee outstanding at year end.
Accrued and deferred reimbursements Various reimbursement procedures are used for Federal awards received by the District. Consequently, timing differences between expenditures and program reimbursements can exist at the beginning and end of the year. Accrued balances at year end represent an excess of reimbursable expenditures over receipts to date. Deferred balance at year-end represent an excess of cash receipts over reimbursable expenditure to date. Generally, accrued or deferred balances covered by differences in the timing of cash receipts and expenditures will be reversed in the remaining grant period.
II. INDIRECT COSTS
The District has not elected to use the 10% de minimis indirect cost.
III. RECONCILIATION OF FEDERAL AWARDS TO EXPENDITURE OF FEDERAL AWARDS
The differences between the federal awards received (Intergovernmental sources – federal) during the year ended June 30, 2019 and the federal awards expended during the year are as follows:
MAJOR FEDERAL PROGRAM CFDA NO. EXPENDITURE
Special Education (IDEA) Cluster 84.027(A) & 84.173(A) 3,198,307$ Title II Teacher Quality 84.367 552,363
Total 3,750,670$
Cash Assistance:
AMOUNT
Federal Sources 12,922,565$ Indirecct costs from federal programs (120,378) Revenues received as vendor (891,188) Unexpended federal sources from current year (89,494) Prior year federal sources expended 115,032
Total Expenditures of Federal Awards 11,936,537$

COMPLIANCE SECTION SCHEDULE OF FINDINGS AND QUESTIONED COSTS 234 | P a g e JUNE 30, 2019
I. SUMMARY OF AUDIT RESULTS Yes No Occurrences
FINANCIAL STATEMENTS:
Type of auditor’s report issued: Unmodified
Internal control over financial reporting:
Material weakness(es) identified? 2
Significant deficiency(ies) identified? 2
Noncompliance material to financial statements noted? -
FEDERAL AWARDS:
Internal control over major programs:
Material weakness(es) identified? -
Significant deficiency(ies) identified? -
Type of auditor’s report issued on compliance with major programs: Unmodified
Any audit findings disclosed that are required to be
reported in accordance with Section 200.516 of the Uniform Guidance? -
The programs treated as major programs include:
Name of Federal Program or Cluster CFDA Number Special Education (IDEA) Cluster 84.027(A) & 84.173(A) Title II Teacher Quality 84.367
The threshold for distinguishing types A and B programs: $750,000
Auditee qualified as low-risk auditee?
NEW MEXICO STATE REQUIREMENTS:
Internal control over state requirements:
Other non-compliance? 4
Finding that does not rise to the level of significant deficiency? -

SCHEDULE OF FINDINGS AND QUESTIONED COSTS COMPLIANCE SECTION JUNE 30, 2019 235 | P a g e
II. AUDIT FINDINGS - FINANCIAL STATEMENTS FARMINGTON MUNICIPAL SCHOOLS
2019 – 001 SEGREGATION OF DUTIES
Material Weakness
Condition: During the inquiry or internal controls and review of cash disbursements it was discovered that there was a lack of segregation of duties over the controls of cash disbursements. The person that monitors purchase orders and prints accounts payable checks was also the accounting system administrator. The accounting system administrator has complete access to all of the components of the accounting system including the master files and the ability to override approval of purchase orders. There were indications that the process of purchase order approval had been overridden. The overrides gave authority to pay without the approvals of the comptroller and the Chief Financial Officer. The amounts of the overrides were undetermined.
Criteria: NMAC 6.20.2.11 “INTERNAL CONTROL STRUCTURE STANDARDS”:
A. Each school district shall develop, establish and maintain a structure of internal accounting controls and written procedures to provide for segregation of duties, a system of authorization and recording procedures, and sound accounting practices in performance of duties and functions.
B. The duties to be segregated are the authorization to execute a transaction, recording the transaction, and custody of assets involved in the transaction.
(1) School district management must ensure that protection of the public trust is a major focus when granting the authorization to execute business of the school district.
(2) Employees handling significant amounts of cash must be adequately bonded. Access to assets is permitted only in accordance with school district authorization.
(3) Receipts, checks or warrants, purchase orders, and vouchers shall be sequentially pre-numbered. (4) School districts shall have proper safeguards to protect unused checks and other pre-numbered forms,
undeposited cash and other receipts, and facsimile signature plates. (5) Transactions are to be recorded as necessary to permit preparation of financial statements in conformity with
GAAP. In addition, school districts shall establish any other criteria applicable to such statements to maintain accountability for assets.
(6) School districts shall conduct independent checks on performance and proper valuation of recorded amounts, such as clerical checks, reconciliations, comparison of assets with recorded accountability, computer-programmed controls, management review of reports that summarize the detail of account balances, and user review of computer generated reports.
C. An internal control structure is required to demonstrate the school district's ability to record, process, summarize and
report financial data consistent with the following financial statement assertions:
(1) rights and ownership; (2) existence and occurrence; (3) valuation and allocations; (4) completeness; and, (5) presentation and disclosure.
D. The internal control structure shall demonstrate that the school district identifies applicable laws and regulations, and that procedures are designed to provide reasonable assurance that the school district complies with those laws and regulations. Internal control procedures shall be established, implemented and documented through school district correspondence, manuals, training, and other additional methods. Appropriate internal control procedures shall be adopted by the local board within a school district to safeguard its assets, check the accuracy and reliability of its accounting data, promote operational efficiency, and encourage adherence to prescribed managerial policies. The internal control structure shall address all school district transactions.

COMPLIANCE SECTION SCHEDULE OF FINDINGS AND QUESTIONED COSTS 236 | P a g e JUNE 30, 2019
II. AUDIT FINDINGS - FINANCIAL STATEMENTS (cont’d)
2019 – 001 SEGREGATION OF DUTIES (cont’d) Material Weakness
NMAC 6.20.2.12 “ORGANIZATIONAL STRUCTURE”: School districts shall develop, establish and maintain an effective organizational structure that includes the following: A. Devise a system for the measurement of and accountability for employee performance.
B. Establish a policy in which the delegation of responsibility for employee actions is combined with sufficient authority to perform the assigned activities.
C. Create and maintain budgets and financial reports which facilitate the discharge of assigned responsibilities and monitors activities at each level of the organizational structure.
D. Develop a system of checks and balances which separates incompatible activities to preclude absolute control by any individual or unit and provides for supervision by higher levels of management and for the monitoring of overall school district activities.
Effect of condition: The District is in violation of state statutes and is susceptible to unauthorized purchases and/or
misappropriations. Cause: The duties of recording and authorization have not been adequately segregated in order to safeguard assets. The accounts
payable position has been given access to the entire accounting system by being given the role of system administrator. Recommendation: The District must train a new system administrator for the accounting system or have another person perform
the accounts payable position. The system administrator of the accounting system should not serve any other role within the financial/accounting control structure.
Management’s response: The Finance department is charged with the financial integrity of district resources to support the success
of our students and provide support to other departments in the district to help them achieve their goals. The District utilizes an integrated financial management system with an automated workflow for purchase requests to identify the approver and the time of all approvals. Each approver in the workflow has a backup and a time limit of at least two days to approve a purchase request before it is sent on to the assigned backup. Once approved, the workflow notifies the originator through email and the request is converted into a purchase order.
In order to effectively change the system to safe guard against any future occurrence of this type the following procedure has been updated. Finance Department procedure on internal controls is based on separation of duties. Accordingly, no single person shall have authority to authorize a transaction, execute a transaction, record a transaction, and have custody of any resulting assets. No single person shall have access to the administrative console or be able to access master files within the finance software and also perform any cash disbursements duties within the department including authorizing, executing and/or recording any transaction.
In order to correct internal control procedures, the system administrator has been relieved of her cash disbursement duties to concentrate solely on the accounting system administration and another employee within the finance office has taken over accounts payable duties as of November 1st 2019. The Comptroller will monitor all cash disbursements and review and sign off on all payments made from accounts payable to assure accuracy. A review of the finance software security is scheduled for November 12th 2019 to review current workflow approvers, insure the backup approvers are current and to make adjustments in the system to notify originators if approval has not occurred within a certain amount of time. Reminders on the approval process and timelines for approving workflow items was sent to Directors, Principals and secretaries at all locations on November 7th 2019.
Responsible party(ies) for corrective action(s): Chief Financial Officer, Comptroller
Corrective action(s) timeline: 11/01/2019.

SCHEDULE OF FINDINGS AND QUESTIONED COSTS COMPLIANCE SECTION JUNE 30, 2019 237 | P a g e
II. AUDIT FINDINGS - FINANCIAL STATEMENTS (cont’d)
2019 – 002 CONTROLS OVER INVENTORIES Material Weakness
Condition: During our substantive procedures, the inventory for the Transportation Fund was requested to be provided for observance and verification of yearend counts. The inventory was not provided for review until September 25, 2019. We were able to determine the reasonableness of the amounts through additional procedures. The inventory amount at June 30, 2019 was $174,568.
Criteria: According to NMAC 6.20.2.11 “INTERNAL CONTROL STRUCTURE STANDARDS”, every school district shall
establish and maintain an internal control structure to provide management with reasonable assurance that assets are safeguarded against loss from unauthorized use or disposition, that transactions are executed in accordance with management's authorization, and recorded properly to permit the preparation of general purpose financial statements in accordance with GAAP. Also, School districts shall conduct independent checks on performance and proper valuation of recorded amounts, such as clerical checks, reconciliations, comparison of assets with recorded accountability, computer-programmed controls, management review of reports that summarize the detail of account balances, and user review of computer generated reports.
Additionally, NMAC 6.20.2.16 “WAREHOUSE/SUPPLY INVENTORY” states that at fiscal year-end, each school district shall take a physical inventory of remaining goods and materials of an expendable nature. School districts shall establish adequate internal accounting control procedures over supplies inventory in accordance with GAAP.
Effect of condition: The District is susceptible reporting errors when the inventory is not prepared and counted within a timely
period at yearend. Additionally, the District is not fully complying with state statutes. Cause: The inventory was not prepared and provided to the central office within a timeframe that allowed for efficient verification
and timely reporting. Recommendation: Policy should be written to ensure that inventories are provided to the Chief Financial Officer or comptroller
on a monthly basis. The reports should be provided within a couple days after the end of the month. The reports should include item description, quantity on hand, amount per piece, total amount per item, and a grand total of inventory. Physical counts should be initiated as near year-end, possibly a day or two before yearend, to ensure timely reporting. The auditor should be notified when a count is going to be done so that the count can be observed if determined to be necessary.
Management’s response: In June 2019 the District’s email was converted to another system effectively taking away the ability to
retrieve the Transportation Fund inventory. The IT department was able to retrieve the information on September 25th 2019. To replace the inventory system connected with the obsolete email the district has implemented a cloud-based inventory system that will go live on November 4th 2019. This system will tie each piece of the inventory to the location, amount of inventory, if used which bus it was put on, low quantity alerts, along with many other benefits. This is a separate software system that is cloud based where retrieval of information will be immediate.
Responsible party(ies) for corrective action(s): Chief Financial Officer
Corrective action(s) timeline: 11/04/2019.

COMPLIANCE SECTION SCHEDULE OF FINDINGS AND QUESTIONED COSTS 238 | P a g e JUNE 30, 2019
II. AUDIT FINDINGS - FINANCIAL STATEMENTS (cont’d)
NEW MEXICO VIRTUAL ACADEMY (Component Unit)
2019 – 003 UNTIMELY PAYMENT OF INVOICES (Original Finding No. 2016-005) Significant Deficiency
Condition: During the search for unrecorded liabilities we found that there was significant number of invoices that had not been
paid within 30 days of the invoice date. The Charter School is incurring late fees, and the utilities had a disconnect notice, due to late payment of invoices.
Status from prior year: This was a decrease in occurrence from the prior year which had eleven occurrences. The amount of the disbursements was $157,073.
Criteria: Disbursement payments made in remittance for products and/or services received by the Charter School should be made in a timely manner as part of sound accounting practices. Payment should be made within vendor terms or within thirty days of the invoice date.
Cause: The Charter School does not have effective controls in place to ensure that purchases are paid within a reasonable time.
Effect of condition: Late fees can be added to the cost of purchases made that are not paid for in a timely manner. Payment of such late fees is not an allowable cost under the guidelines established by the federal government.
Recommendation: A system should be implemented to ensure that invoices are processed and paid within a period not to exceed thirty days from the invoice date. The system should allow for payment of invoices at least twice a month.
Management’s Response: This school is now closed.
Person/positions responsible for overseeing corrective actions: n/a
Timeline for corrective actions: 6/30/19
Invoice Date Check Number Check Date Amount Number of Days
5/31/2018 2464 8/2/2018 21.21 634/30/2018 2481 8/22/2018 200.00 1148/3/2018 2516 9/10/2018 622.75 389/4/2018 2695 1/23/2019 93.50 141

SCHEDULE OF FINDINGS AND QUESTIONED COSTS COMPLIANCE SECTION JUNE 30, 2019 239 | P a g e
II. AUDIT FINDINGS - FINANCIAL STATEMENTS (cont’d)
NEW MEXICO VIRTUAL ACADEMY (Component Unit)
2019 – 004 INTERNAL CONTROLS Significant Deficiency
Condition: During the testing process we selected twenty disbursements to be tested, and 10 alternate disbursements to replace any
voids. We received a total of 17 disbursements to be tested out of a mix of original disbursements and alternative without documentation for why the alternate disbursement was sent to be tested. The following were the items found:
• One purchase was made prior to the approval of the purchase orders. • One of the purchase orders was for $57 and the disbursement was for $116, without an explanation of why the
overage, or a modification. • There was lack of back up for a disbursement (missing invoice). • There was a disbursement for staff shirts without documentation of the purpose of the shirts since this is a virtual
academy. • For two of the disbursements there should have been some form of verification that the items ordered were
received
Criteria: In accordance with 6.20.2.11 NMAC 1978: INTERNAL CONTROL STRUCTURE STANDARDS: A. Every school district shall establish and maintain an internal control structure to provide management with reasonable assurance that assets are safe-guarded against loss from unauthorized use or disposition, that transactions are executed in accordance with management's authorization and recorded properly to permit the preparation of general purpose financial statements in accordance with GAAP, and that state and federal programs are managed in compliance with applicable laws and regulations. The internal control structure shall include written administrative controls (rules, procedures and practices, and policies that affect the organization) and accounting controls (activity cycles, financial statement captions, accounting applications including computer systems) that are in accordance with GAAP. B. Each school district shall develop, establish and maintain a structure of internal accounting controls and written procedures to provide for segregation of duties, a system of authorization and recording procedures, and sound accounting practices in performance of duties and functions. The duties to be segregated are the authorization to execute a transaction, recording the transaction, and custody of assets involved in the transaction. (1) School district management must ensure that protection of the public trust is a major focus when granting the authorization to execute business of the school district. (2) Employees handling significant amounts of cash must be adequately bonded. Access to assets is permitted only in accordance with school district authorization. (3) Receipts, checks or warrants, purchase orders, and vouchers shall be sequentially pre-numbered. (4) School districts shall have proper safeguards to protect unused checks and other pre-numbered forms, undeposited cash and other receipts, and facsimile signature plates. (5) Transactions are to be recorded as necessary to permit preparation of financial statements in conformity with GAAP. In addition, school districts shall establish any other criteria applicable to such statements to maintain accountability for assets. (6) School districts shall conduct independent checks on performance and proper valuation of recorded amounts, such as clerical checks, reconciliations, comparison of assets with recorded accountability, computer-programmed controls, management review of reports that summarize the detail of account balances, and user review of computer generated reports.
Cause: The Charter School is not maintaining adequate internal controls over disbursements.
Effect of condition: The Charter School is out of compliance with requirements for 1978 NMSA 6-20-2.11.
Recommendation: The Charter School needs to set up a internal control system which allows for the School to accurately provide documentation of the expenditures of the School
Management’s Response: This school is now closed.
Person/positions responsible for overseeing corrective actions: n/a
Timeline for corrective actions: 6/30/19

COMPLIANCE SECTION SCHEDULE OF FINDINGS AND QUESTIONED COSTS 240 | P a g e JUNE 30, 2019
III. AUDIT FINDINGS – MAJOR FEDERAL AWARD PROGRAMS AUDIT There were not any findings to be reported.
IV. AUDIT FINDINGS – SECTION 12-6-5 NMSA 1978 FARMINGTON MUNICIPAL SCHOOLS
2019 – 005 PURCHASES MADE PRIOR TO APPROVAL (Original No. 2016-003) (Repeat of prior year finding; updated and revised) Other Noncompliance
Condition: Of the Thirty disbursements tested, four purchases in the amount of $164,687 were made prior to the approval of
purchase orders. Purchase orders are used to control cash and to authorize the purchases in accordance with the authorized budget.
Status from prior year: This was an increase in occurrences from the prior year which had two occurrences in the amount of $1,674.
Criteria: Authorization for a purchase is acquired through the completion of a purchase order, which is signed by a person given authority over purchase control. The purchase order must be approved prior to the purchase or ordering of goods as per PSAB Supplement 13. NMAC 6.20.14(E) states the school district shall verify that there is sufficient cash and budget prior to the disbursement of cash. A revenue ledger is required for each revenue code as approved in the finalized budget, and additional revenue ledgers may be added as necessary.
Cause: Personnel initiated and/or completed purchases prior to obtaining approval for the purchase in accordance with established policies and regulations.
Effect of condition: Any purchases made without prior authorization have the potential to cause cash deficits in the funds from which they are made or violations of the approved budget.
Recommendation: The importance of cash controls and adequate planning need to be made clear to all personnel that will be making purchases for the school.
Management’s response: The district has developed a report that searches the database for purchase orders dated after the invoice date. All locations receive the report and are required to explain why the purchase order was issued late and provide their corrective action plan to avoid future occurrences. Training will be provided where necessary to assist employees in correcting the issue.
Person/positions responsible for overseeing corrective actions: Chief Procurement Officer
Timeline for corrective actions: Corrective action and training will begin effective immediately, November 1st 2019.

SCHEDULE OF FINDINGS AND QUESTIONED COSTS COMPLIANCE SECTION JUNE 30, 2019 241 | P a g e
IV. AUDIT FINDINGS – SECTION 12-6-5 NMSA 1978 (cont’d)
FARMINGTON MUNICIPAL SCHOOLS
2019 – 006 CONTROLS OVER CASH RECEIPTING Other Noncompliance
Condition: During the review of the thirty cash receipts selected for testing the following was identified:
Twenty-four of the receipts tested were not deposited into the bank within one banking day from the time of receipt. The deposits totaled $103,036.
There were 15 receipts that could not be identified to the deposit slip. The amount of the effected deposits was $71,911.
Some receipts were not issued to a person. The line intended for the name of the person making the payment or delivering the cash was completed with a club name, purpose of payment, or left blank. The three receipts totaled $362.
There was one receipt in the amount of $3,784 that was not dated to record the day the money was received.
One receipt selected was not available for review.
Criteria: NMAC 6.20.2.14 CASH CONTROL STANDARDS: A. School districts shall establish and maintain a cash management program to safeguard cash and provide prompt and
accurate reporting that adheres to cash management requirements of the office of management and budget (OMB) Circular A-102, and applicable state and federal laws and regulations.
B. The school district shall issue a factory pre-numbered receipt for all money received. Pre-numbered receipts are to be controlled and secured. If a receipt is voided, all copies shall be marked "VOID" and retained in the receipt book.
C. Money received and receipted shall be deposited in the bank within twenty-four (24) hours or one banking day. If the distance to the bank is considerable, or the cash collection is limited to small amounts and/or low volume and it is impractical to meet the twenty-four hour/one banking day requirement, the local board may request approval from the department for an alternative plan. The bank deposit slip shall have the numbers from applicable receipts entered on it or attached as a reference.
D. A cash receipts journal is to be used for each fiscal year beginning July 1 and ending June 30, and is to be presented to the school district's auditor during the annual audit.
Effect of condition: The District is in violation of NMAC 6.20.2.14. Cash retained by management for extended periods of time are susceptible to misuse or fraud.
Cause: Deposits at times were taking more than 24 hours to be deposited in the bank. Receipts for cash collections are not being completed accurately or enough information to provide a detailed record of the transaction.
Recommendation: On an annual basis, staff members that have responsibilities of collecting and depositing cash receipts should be informed of the legal requirements of depositing cash within one banking day, as well as the District’s policies regarding cash collections. Deposit slips should be completed with enough detail to provide an audit trail of each cash collection from the initiation (collection) of a transaction to the completion (reconciliation).
Management’s response: The District will review the cash receipt procedures in place at each location to ensure compliance with district internal control policies and state law. Corrective actions will be taken at each location that are found to be out of compliance.
The BusinessPlus accounting system was updated in March of 2019 with an automated receipt numbering process implemented to improve controls. We will continue to document when a receipt number is issued out of sequence in error to provide an explanation for the occurrence. Receipt numbers will be written on the corresponding deposit slip for all receipts and deposits made within the district. The District has employed an online payment program beginning September 10th 2019 to alleviate the late deposits and the need for written receipts. The Comptroller will review receipts periodically to assure the proper procedures are being followed.
Responsible party(ies) for corrective action(s): Chief Financial Officer, Comptroller
Corrective action(s) timeline: 11/01/2019

COMPLIANCE SECTION SCHEDULE OF FINDINGS AND QUESTIONED COSTS 242 | P a g e JUNE 30, 2019
IV. AUDIT FINDINGS – SECTION 12-6-5 NMSA 1978 (cont’d)
NEW MEXICO VIRTUAL ACADEMY (Component Unit)
2019 – 007 BACKGROUND CHECK NOT AVAILABLE (Original No. 2017-006) (Repeat of prior year findings; updated and revised) Other Noncompliance
Condition: Ten payroll checks were selected, three were duplicate employees of the seven personnel files reviewed there were not
any background checks provided.
Status from prior year: There was an increase from the prior year which had one occurrence.
Criteria: In accordance with 1978 NMSA 22-10A-5, all employees who have access to children are required to have a background check completed and approved.
Cause: The Charter School is not maintaining adequate controls over employee hiring.
Effect of condition: The Charter School is out of compliance with requirements for 1978 NMSA 22-10A-5.
Recommendation: The Charter School should not employ any individual without prior receipt of the cleared background check.
Management’s Response: This school is now closed.
Person/positions responsible for overseeing corrective actions: n/a
Timeline for corrective actions: 6/30/19

SCHEDULE OF FINDINGS AND QUESTIONED COSTS COMPLIANCE SECTION JUNE 30, 2019 243 | P a g e
IV. AUDIT FINDINGS – SECTION 12-6-5 NMSA 1978 (cont’d)
NEW MEXICO VIRTUAL ACADEMY (Component Unit)
2019 – 008 REPRESENTATIVE NOT PRESENT AT AUDIT EXIT Other Noncompliance
Condition: There was not a representative for the charter school at the exit conference for annual audit.
Criteria: NMAC 2.2.2.10(M) requires representatives of the agency's governing authority and top management including
representatives of any component units to be present at the audit exit conference. 1978 NMSA 22-8-12.3. Local school board finance subcommittee; audit committee; membership; duties section D(3) state that it is the duty of the audit committee to attend the exit conference for the annual audit.
Cause: The Charter School has ceased operations with the exception of activities necessary to finalize the closing of the charter
school. Representatives felt it was unnecessary to attend an exit conference.
Effect of condition: The Charter School is out of compliance with state requirements.
Recommendation: Although the charter school is closing, someone should represent the charter school until all operations have ceased.
Management’s Response: This school is now closed.
Person/positions responsible for overseeing corrective actions: n/a
Timeline for corrective actions: 6/30/19

COMPLIANCE SECTION SCHEDULE OF PRIOR YEAR FINDINGS 244 | P a g e JUNE 30, 2019
I. PRIOR YEAR FINDINGS - NOT RESOLVED FARMINGTON MUNICIPAL SCHOOLS
2018 – 002 PURCHASES MADE PRIOR TO APPROVAL (Original No. 2016-003) Current Status: Not resolved. Repeated in the current year as finding 2019-005.
NEW MEXICO VIRTUAL ACADEMY (Component Unit)
2018 – 004 UNTIMELY PAYMENT OF INVOICES (Original No. 2016-005) Current Status: Not resolved. Repeated in the current year as finding 2019-003.
2018 – 005 BACKGROUND CHECKS (Original No. 2017-006)
Current Status: Not resolved. Repeated in the current year as finding 2019-007.
II. PRIOR YEAR FINDINGS - RESOLVED FARMINGTON MUNICIPAL SCHOOLS
2018 – 001 INTERNAL CONTROL STRUCTURE Current Status: Resolved. Not repeated in the current year.
2018 – 003 LACK OF TIMELY MONITORING OF BUDGET (Original No. 2017-003)
Current Status: Resolved. Not repeated in the current year.
NEW MEXICO VIRTUAL ACADEMY (Component Unit)
2018 – 006 UNAUTHORIZED TEMPORARY INTER-FUND LOANS (Original No. 2017-007) Current Status: Resolved. Not repeated in the current year.
2018 – 007 MISSING OR INCOMPLETE FORM I-9 Current Status: Resolved. Not repeated in the current year.

REQUIRED DISCLOSURE COMPLIANCE SECTION JUNE 30, 2019 245 | P a g e
The independent public accountants assisted in the preparation of the financial statements. The accompanying financial statements are the responsibility of the District and are based on information from the District’s financial records. An exit conference was held November 8, 2019 and was attended by the following individuals: FARMINGTON MUNICIPAL SCHOOL DISTRICT NO. 5 Keith Corley Member, Board of Education / Audit Committee Stephanie Thompson Member, Board of Education / Audit Committee Eugene Schmidt Superintendent; Member, Audit Committee Phil Valdez Deputy Superintendent; Member, Finance Committee Bobbi Newland Chief Financial Officer; Member, Audit Committee Malinda Fowler Comptroller; Member, Audit Committee ACCOUNTING & FINANCIAL SOLUTIONS, LLC Terry Ogle, CPA Partner