farmer field schools in cajamarca - potato
TRANSCRIPT

ISSN 0256-8748 International Potato Center Social Sciences Working Paper No. 2004-1
Impact Assessment of Farmer Field Schools in Cajamarca, Peru:
An Economic Evaluation
Regula Zuger

The Social Sciences Working Paper Series is intended to advance social science knowledge about production and utilization of potato, sweetpotato, and root and tuber crops in developing countries to encourage debate and exchange of ideas. The views expressed in the papers are those of the author(s) and do not necessarily reflect the official position of the International Potato Center. Comments are invited.

Impact Assessment of Farmer Field Schools in Cajamarca, Peru:
An Economic Evaluation
Regula Züger*
March 2004
* Economist, Impact Enhacement División, International Potato Center

Correct Citation: Zuger, Regula. 2004. Impact Assessment of Farmer Field Schools in Cajamarca, Peru: An Economic Evaluation. Social Sciences Working Paper No. 2004-1. International Potato Center. Printed at the International Potato Center, Apdo. Postal 1558, Lima 12, Peru.
Table of Contents Acknowledgements....................................................................................................... ii Executive Summary ..................................................................................................... iii Introduction ................................................................................................................... 1 Subject of the study...................................................................................................... 4 Database ........................................................................................................................ 5 Conceptual Framework and Methodology .................................................................. 7 Results ......................................................................................................................... 12
Knowledge ............................................................................................................ 12 Pesticides.............................................................................................................. 13 Resistant Varieties ................................................................................................ 14 Yields .................................................................................................................... 15
Economics of Training ..................................................................................... 17 Economics of Variety ‘Amarilis’ ........................................................................ 18
Total Costs and Benefits of the Project ................................................................. 19 Cost-effectiveness: Net Present Value and Internal Rate of Return...................... 21
Conclusions................................................................................................................. 23 References................................................................................................................... 26 Appendices.................................................................................................................. 29 List of Tables Table 1. Underlying database..................................................................................... 6 Table 2. Differences between farmer field school (FFS) participants and non-
participants in their protection against pesticides ....................................... 14 Table 3. Real costs of the Cajamarca pilot FFS project ........................................... 19 Table 4. Returns on the Cajamarca pilot FFS project............................................... 21 List of Figures Figure 1. Increases in potato production, potato growing area,
and market value of potatoes produced in Peru ........................................... 2 Figure 2. Real potato prices in Peru ............................................................................ 2 Figure 3. Distribution of the 8 most important varieties in San Miguel 1998-2002 ..... 14 Figure 4. Difference in adoption of ‘Amarilis’ between FFS participants
and non-participants ................................................................................... 15
i

Acknowledgements First, I wish to express my sincere thanks to all the very friendly farming families in Cajamarca who have, some for several years, patiently answered recurrent survey questions and given us their time and their hospitality. Of course I would not have been able to complete this work without the support of the engineers Guillermo Ramírez Mantilla, Tomás Bazán Corcuera, and Segundo Cusma Pajares, who undertook the largest part of the survey fieldwork, and several times risked their lives in the rainy season on slippery roads in remote areas! Thanks are also due to Mario Bazán, who drove me from one place to another and who was always ready to share his rich experience of the Farmer Field Schools.
I also received indispensable help from Maria Lozano and Víctor Suarez, who helped clean up and analyze the data. This was a prerequisite to the discussion of my findings with my helpful supervisors Tom Walker and Oscar Ortiz. I assume all responsibility for the results and opinions expressed in the document.
ii
Executive Summary Economic evaluation of the Farmer Field Schools (FFSs) in the Cajamarca Department (Peru) was undertaken to help determine whether agricultural extension via FFSs can contribute to poverty alleviation. Farmer Field Schools involving a number of important crops have already been evaluated at other sites around the world. These studies reported benefits associated with Integrated Crop/Pest Management (ICM/IPM), such as the reduced used of insecticides, for example. However, the use of ICM/IPM to control potato late blight (the purpose of the Cajamarca FFSs) is quite a complex subject. In Cajamarca, it was found that only a few components of ICM/IPM have been adopted, despite the education received by the project participants. However, any assessment of the project must also take into account the existence of subtle changes in the cropping techniques used which could not be measured by our surveys, but which are known to have occurred because of positive economic effects observed to have benefited the farmers involved in the FFSs studied. An analysis of consecutive survey data covering up to four years allowed us to identify additional benefits at the farm level through increased yields. Despite these benefits, however, it was noted that the economic returns obtained per household at the sites studied are relatively low, due to the limited average area (0.2 hectare per farm) cropped with potato each year.
The study was unable to confirm the following benefits, which were originally expected to result from these FSSs:
• Reduction in the use of pesticides - Only in one of the four years considered could a statistically significant reduction in the application of pesticides by the participants be proved to have occurred. Differences in spraying frequency seem to be highly dependent on the climatic conditions of the year. The reduction of 0.8 applications which was found to occur in that one year did not represent a significant reduction in cost. With application costs of US$20 per hectare, the average benefit for the participants (with an average potato area of some 0.2 ha each) in the specific year identified was only around US$3.
• Reduced applications of very toxic pesticides - With the exception of the banned, very toxic insecticide Aldrin, no significant changes were found to have occurred with regard to the use of toxic pesticides. The percentage use of those products that fell within
iii

specific toxicity classes was the same among project participants and non-participants, i.e. the two groups used almost the same percentages of very, moderately and mildly toxic products. However, it was found that project participants no longer use Ridomil (metalaxyl). This indicates that they have taken note of, and acted upon, what they learned about the issues of disease resistance in the training.
The only benefit resulting from Farmer Field Schools that was found to be statistically significant was an increase in yield. This increase resulted both from the introduction of a new variety (‘Amarilis’) and from an increase in farmers’ knowledge as result of the education they received in FFSs. As the yield increases were not due to any change in costs or managerial changes, the reported yield increase equals the net benefit obtained.
• Benefits of a new variety: The difference in yields generated by replacing one of the other main varieties (‘Liberteña’, ‘Canchan’, ‘Yungay’) with ‘Amarilis’ is 4 tonnes per hectare per year on average, which means an additional benefit of US$350/ha. Even though the adoption rates among non-participants in neighboring sites were not very much lower than those among participants, this benefit can be, at least partially, attributed to the FFSs, as seed flow was definitely initiated through the FFS project. In villages further away from those taking part in the FFSs, the variety ‘Amarilis’ is unknown. This effect may become stronger in the future, when some of the clones introduced are also disseminated.
• Benefits of education: The additional independent yield effect associated with participation in the FFS, but not due to the variety ‘Amarilis’, is the result of the knowledge gained by the farmers, and was calculated to be almost 2.7 tonnes/ha on average (p < 0.05), an additional benefit of about US$236/ha.
In terms of our economic evaluation of the project, when all benefits are considered (including the effects of education effects and the yield effects resulting from the use of ‘Amarilis’, in the fields of participants and non-participants) the net present value (NPV) for this CIP/CARE Pilot project reaches US$84,190. The internal rate of return (IRR) is 31%, which is a very healthy basis for investment. However, concerns exist as to whether the benefits of the introduced variety (‘Amarilis’) can be attributed to the FFS. If they can, then the question of how much credit is due to the breeders, and how much to the extension system, remains a point of debate. And if yes, what is the merit of the breeders and how much is the merit of the extension system?
iv

On a more positive note, there also exist good reasons to assume that project costs would be lower for future schools, as the conceptual costs and the costs of developing a manual would not be incurred when replicating the project. Therefore only operational costs and monitoring costs are of importance when comparing this project with other projects or when considering the cost of future, similar, projects. In such a case, the project may be judged cost-effective even when the benefits arising from the introduction of a new variety (‘Amarilis’) are not considered, with only the increase in yields arising from education in FFSs being attributed to the project. Using these assumptions the project achieved an NPV of US$40,270 and an IRR of 28%. Of course, as the benefits are based on the increase in yield per unit area, it can be concluded that the larger the average potato area of the participating farmers, the more profitable the FFS project will be. In areas where potatoes are grown more commercially, and/or where slightly higher prices are received by the farmers, the additional benefits will be much higher. Therefore, such projects would provide a greater ‘pay back’ than the project which is the subject of this study. One factor that may limit these theoretically promising results is the low and volatile market price available for potato in Peru. Because of this, farmers in remote areas (such as the San Miguel sites in Cajamarca) use potato as a subsistence crop, continually reducing their potato area and increasing dairy production when possible. It should therefore be noted that, if the FFS projects were successfully and extensively scaled up, potato prices might decrease as the supply available to an already-saturated market increased. As a result, farmers would have less incentive to produce and sell potatoes. In the middle and long term, therefore, the benefits farmers receive from such projects in terms of “empowerment” and an increase in their decision-making capacities should be considered to be at least as important as the additional yields they benefit from. Many farmers seem to use what they learnt in the FFS for other purposes in their daily life. This apparent increase in social capital as a result of participatory teaching and capacity building therefore needs to be measured, and is the subject of ongoing work.
v

Impact Assessment of Farmer Field Schools in Cajamarca An economic evaluation Introduction Potato Technologies and Peru As a CGIAR Center, the International Potato Center (CIP) works both to fight hunger and alleviate poverty through its agricultural research activities. The Center works mainly with potato and sweet potato, and was originally intended to generate widely applicable technologies that, with some adaptation by national agricultural research systems (NARS), could be extended to farmers and widely adopted (Thiele et al., 2001b). Though based in Peru, the results of CIP’s work are useful throughout the world: the majority of potatoes are, for example, grown in Asia and Europe (China and Russia). Of course, CIP’s research is very important for its host country too: potato crops originated in the highlands of South America and remain one of the most important food crops grown by farmers in the Peruvian Andes. Earlier impact evaluation studies evaluating the potato-related technologies produced by CIP have shown very positive results (see, for example, Rueda et al., 1996 and Walker et al., 1996). Such studies have, however, been conducted in the context of countries with a high demand for the crop concerned and a need to increase their food supply. In Peru the situation in the potato sector is different, because the potato market is almost saturated. But, even so, an impact study considering CIP projects in Peru has shown them to be both very promising and successful (Fonseca et al., 1996). Potato production in the country in general, as well as productivity per hectare, has grown continuously and considerably over the last 10 years (Fig. 1). This has, of course, affected potato prices, which have dropped as a result (Fig. 2).
1

0
500
1000
1500
2000
2500
3000
3500
4000
63 65 67 69 71 73 75 77 79 81 83 85 87 89 91 93 95 97 99
Year
gross income (1000$) production(1000 t) area by 1000 ha
Figure. 1. Increases in potato production, potato growing area, and market value of potatoes produced in Peru
(Data from the Peruvian Ministry of Agriculture, MINAG, and the Banco Central de Riserva)
100
150
200
250
91 92 93 94 95 96 97 98 99 2000 year
US$ per ton
Figure 2. Real potato prices in Peru
(Data from the Peruvian Ministry of Agriculture, MINAG, and the Banco Central de Riserva)
2

Farmer Field Schools
Farmer Field Schools (FFSs) were first used in Asia in the 1980s to train rice-producing farmers in the techniques of Integrated Pest Management (IPM), mainly in order to extend their knowledge of insect pests and to reduce their dependency on insecticides. Now successfully introduced into various countries around the world, such field schools use discovery-based learning methods to improve farmers’ agro-ecological knowledge and their capacity to make decisions (van de Fliert, 1993). The FFSs developed by CIP (in Peru) were to be vehicles for the simultaneous promotion of the integrated management of late blight, the evaluation and dissemination of resistant varieties, and the gathering of large amounts of data concerned with the effectiveness of resistance in different agro-ecologies (Thiele et al., 2001a, Nelson et al., 2001a). In fact, with regard to both CIP’s projects and those of other CG Centers around the world, several projects now focus on the use of IPM or Farmer Field Schools or a combination of both. These FFS have already been the subject of several technical evaluations, most of which have demonstrated promising results (van de Fliert et al., 2001; Dung, 2003). However, there exist serious reservations as to whether FFS projects are an economically viable participatory research and extension method. (Feder, G. et al. 2003) This study therefore evaluates the efficiency and cost-effectiveness of the Farmer Field School approach. It is an ex post evaluation of the economic impact of the IPM Farmer Field Schools in the Cajamarca region which (1) verifies all benefits at the farm level and (2) considers the institutional cost-effectiveness of the whole project. The focus placed on other impacts is limited. Impacts on consumers, for example, are not included, because the outreach of the project did not have any consequences for the supply of potato.
3
Subject of the study The Farmer Field Schools evaluated in this study are a pilot project, situated in the Province of San Miguel, Department of Cajamarca, in the Northern Andes of Peru. The majority of the farmers in this area grow potatoes for their own consumption and, to a lesser extent, as a cash crop. However, they consider the prices they receive for the potato crops they grow to be too low to provide an incentive for them to invest in the crop. Still, though the commercial possibilities of the crop are limited in these remote sites, almost everybody grows potatoes, which are part of both the regional culture and the people’s daily diet. The Andes in this part of Peru are steeply sloped; the terrain is hilly and the precipitation levels high. Altitudes in the zone included in the different surveys range from between 2700 m to 3500 m above sea level. None of the villages considered by the survey had electricity, though almost three-quarters of their households have access to drinking water, with outlets being situated in front of, or near to, their houses. Depending on the community and whether it has benefited from NGO or government projects (FONCODES) in the past, households may also have latrines (DHS survey: DHS, 1996; Vols.113, 114, 116, 119). Frost, drought, and floods often threaten the local farmers’ harvests; but, generally, the worst enemy of the farmers’ potato crops is late-blight infestation, caused by the fungus Phytophthora infestans (Ortiz et al., 1999; Troost, 2000). Late blight can be an extremely destructive potato disease, especially in the rainy season. It is one of the most important constraints to potato production, both in Peru and in other countries. An increase in disease severity can rapidly result in a significant yield decrease, often leading to complete crop loss. Unfortunately, over the past few years, some old varieties used in Peru have lost their resistance or tolerance to the pathogen. This problem is compounded by the fact that the Peruvian populations of Phytophthora infestans have become resistant to a group of fungicides containing metalaxyl (Nelson et al., 2001a). The FFSs undertaken in Cajamarca were intended to address the above problems. Eight field schools were initiated in 1998, as part of a joint effort on the part of CARE Peru and CIP. In 1999, 13 schools were operating; this number rose to 20 in 2000, and fell to 16 in 2001. Specifically, the field schools were initiated to improve the situation of poor farmers, by introducing late-blight-resistant potato cultivars and knowledge of IPM/ICM (integrated pest
4
management/integrated crop management). At the same time CIP, as a research center, was interested in evaluating promising clones at an early stage in the selection process. CARE was responsible for the implementation of the FFSs while CIP led the development of the training curriculum, the delivery of clones and cultivars, and the monitoring of data generated by the participatory research (Thiele et al., 2001, Nelson et al., 2001). The goals of the project were:
• To evaluate and disseminate late-blight-resistant clones and varieties • To facilitate the dissemination of information about late-blight management • To enhance farmers’ abilities to make better decisions concerning pest control • To contribute to improved potato management in general • To help scientists better understand the farmers and the agro-ecological conditions they
face. In the first instance, the FFS approach used had to be adapted to work with potato-related problems as, prior to this, the FFS participatory research and training method had mainly been used in rice-based cropping systems and in different geographic and agricultural circumstances. In the case of the Andean potato-based cropping system, a longer teaching period was required, as the cropping season is around 4-6 months, and several potato-related ICM techniques had yet to be tested. (Nelson et al., 2001) Database The present evaluation is not based on data from field trials or experimental plots. It only considers the actual achievements attained by farmers in their fields; potential achievements are not considered. Production data were gathered using farm surveys, with the plots considered being randomly chosen. Table 1 lists the surveys undertaken. Some general and descriptive data are taken from other sources and can also be found in Table 1. For the calculation of yields, only data obtained from field measurements was used (no orally reported yields were used in analyses). The balances used were the so-called “romanillas” balances. However, because the same instrument was not used every year, some problems arose in terms of calibration, and had to be addressed by correcting the yields measured in the last survey.
5
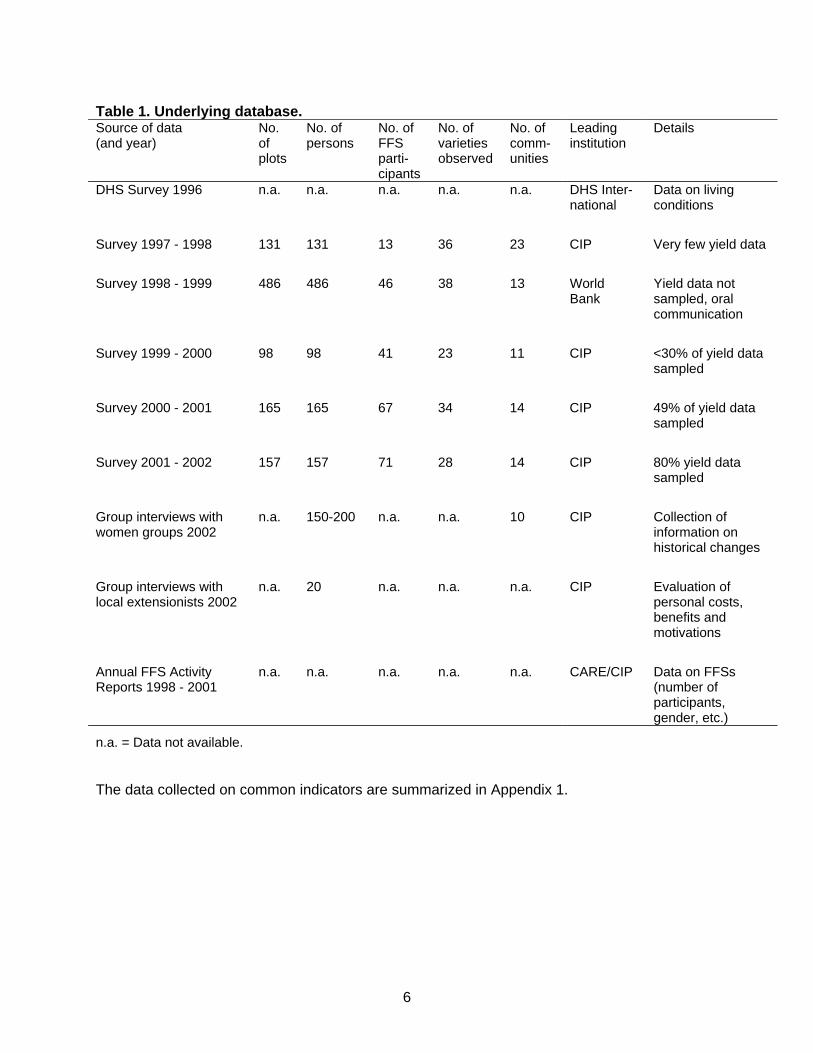
Table 1. Underlying database. Source of data (and year)
No. of plots
No. of persons
No. of FFS parti-cipants
No. of varieties observed
No. of comm-unities
Leading institution
Details
DHS Survey 1996 n.a. n.a. n.a. n.a. n.a. DHS Inter-national
Data on living conditions
Survey 1997 - 1998 131 131 13 36 23 CIP Very few yield data
Survey 1998 - 1999 486 486 46 38 13 World
Bank Yield data not sampled, oral communication
Survey 1999 - 2000 98 98 41 23 11 CIP <30% of yield data
sampled
Survey 2000 - 2001 165 165 67 34 14 CIP 49% of yield data
sampled
Survey 2001 - 2002 157 157 71 28 14 CIP 80% yield data
sampled
Group interviews with women groups 2002
n.a. 150-200 n.a. n.a. 10 CIP Collection of information on historical changes
Group interviews with local extensionists 2002
n.a. 20 n.a. n.a. n.a. CIP Evaluation of personal costs, benefits and motivations
Annual FFS Activity Reports 1998 - 2001
n.a. n.a. n.a. n.a. n.a. CARE/CIP Data on FFSs (number of participants, gender, etc.)
n.a. = Data not available. The data collected on common indicators are summarized in Appendix 1.
6

Conceptual Framework and Methodology It has been said that impact assessment gauges the extent to which a program has led to desired changes in the target field and audience. The overall goal of an impact assessment is to determine if, and the extent to which, a program has reached its objectives [sic]” (Shotton, 1999). However, this definition of ‘impact’ is limited, in so far as unintentional consequences are also important. As Rogers (1995) notes, “change agents often assume that adoption of a given innovation will produce only beneficial results for adopters. This assumption is the pro-innovation bias. Change agents should recognize their responsibility for the consequences of innovations that they introduce. They should be able to predict the advantages and disadvantages of an innovation before introducing it to their clients, but this is seldom done [sic].” In actuality, the impact of an intervention may reach much further than originally foreseen, occurring at different levels (micro, meso, and macro) and in different areas (economic, social, ecological etc.). However, the fact that surveys are not designed to identify, in advance, unknown and unforeseen aspects of a project can cause problems. This is compounded by the fact that the time frames of studies are normally far too short to allow researchers to obtain a holistic overview, especially of slow changes. It should also be remembered that, depending on the focus of the evaluators, some impacts are of interest while others are not. For instance, our study of the Cajamarca FFS project did not assess the impact on consumers, because the outreach of the project was considered to be far too small for it to have any influence on potato prices at either the national or local levels. Both those responsible for the project and its donors did, however, expect it to have economic, ecological, and social impacts for the participating farmers. Our research was built on quantitative survey data, but not experimental methods, and it was decided, after considering several other possible approaches (Garzalho and White, 1997, Backhaus et al., 2000; Kuckartz, 1999), to use the following methods of quantitative measurement and analysis: correlations, t-tests, regression analyses and cost/benefit analyses. Therefore, data on the following indicators, covering several years, were analyzed: (1) changes in the varieties used; (2) increases in farmers’ knowledge of IPM; (3) implementation of IPM practices (alternative insect control methods, repellents, hilling, planting distance,
7

spraying frequencies, reductions in the amount of toxic products used); (4) increase in yield; (5) better use of protection when applying chemicals, etc. Correlations, averages, t-tests As data from before and after project interventions were not available in all cases (to allow before-and-after comparisons) and because the same type of data were not available for every year, annual correlation analyses were used to allow the comparison of participants and non-participants in the FFSs (a ‘with’ and ‘without’ comparison). For that reason, correlation analysis was used to determine whether the variable ’participation’ was correlated with other parameters (for example ‘yield’, ‘spraying frequency’, ‘plant distance’, ‘hilling method’, etc.). Furthermore, t-tests were used to confirm whether differences in the average values of these parameters (between FFS participants and non-participants) were statistically significant. Calculations were made using Excel and SAS software packages. These preliminary analyses provided only a very few positive/conclusive results. The only economically important impact was the fact that yields increased; therefore, this variable was used in a number of further analyses (listed below), which used data from as many years as possible, and which thus aimed to overcome the problem of lack of significance which was assumed to result from the great variation which occurred in study sites (altitude, geographic exposure, etc.), between years, and in the potato varieties used. The following methods were used as the second step in the analysis of the data we obtained:
1. A linear regression model was used to examine which variables contributed independently to the dependent variable yield (y) and, if they did contribute, the extent of that contribution.
2. T-tests were used to quantify and confirm any significant contributions/differences
found. 3. If effects of the Farmer Field Schools were confirmed, then the results were
monetarized and additional benefits at farm level were defined.
4. The net present value (NPV) and the internal rate of return (IRR) of the FFS project over the years were calculated using the additional benefits identified at the farm level and the project costs. This allowed the cost-effectiveness of the project to be assessed, and enabled us to compare it with other projects.
8

Linear regression model A linear regression model was used in data analysis, because data on all possible variables that could affect yield were not available for all years or, if available, were not of a comparable quality. Such incomplete/non-comparable data included data concerned with altitude, geographic exposure of the respective potato plots, fertilization levels, and pesticide applications. Therefore, fertilization effects, for example, were not included even if the surveys with the relevant data showed obvious correlations between yield and fertilization levels (mainly N though, to a lesser extent, P as well). No differences were found between project participants and non-participants with regard to fertilization. This is possibly because fertilization was not treated as a major issue in the curriculum of the potato farmer field schools. Thus, in the regression model used, the dependent variable ‘yield’ was explained only as a function of the following defining variables: ‘variety’ (var), ‘community’ (com), ‘year’ (year 2 = 2000, year 3 = 2001, etc.), and ‘participation in an FFS’ (eca). The regression model used only includes those data sets that contain sampled and directly measured yield data (i.e. only data from the three surveys 1999/2000, 2000/2001 and 2001/2002) and those communities where potato is a very important crop and/or potato plots are not very small (no vegetable gardens are included). Yield data from survey 1 (year 0) were insufficient for inclusion. The data obtained in survey 2 (year 1) were not included either, as they had been gathered by oral communication alone, and thus were deemed not to be sufficiently reliable for use in the regression analyses (actually showing yields to be very much lower than in the other years). The correction factors ‘EA2’, ‘EA3’, and ‘EA4’ are introduced in order to cope with bias which might occur as a result of a “false” correlation between the growing number of project participants in the samples from one year to another and the increase in average yield obtained over the years. This last phenomenon seems to be due to different measuring methods and doesn’t reflect correctly the increase in yields. The regressions were computed using the SAS software package (Box 1).
9

Box 1. Regression model, and variables used in the SAS analysis package. Dependent variable: y = yield Independent variables: anospart = how many years a person had participated (0-4) eca = whether a person had participated or not (0-1) Dummies varieties d_var1 = variety ‘Amarilis’ d_var2 = variety ‘Liberteña’ d_var3 = variety ‘Canchan’ d_var4 = variety ‘Yungay’ d_var5 = other improved varieties d_var6 = native potatoes d_var7 = clones Dummies communities d_com1 = dummy for community 1 d_com2 = dummy for… (see Appendix 2) Dummies years d_year2 = dummy for year 2 d_year3 = dummy for year 3 d_year4 = dummy for year 4 d_EA2 = factor for distortions year 2 d_EA3 = factor for distortions year 3 d_EA4 = factor for distortions year 4 (d_EAX= ECA x d_yearX)
T-tests As the results of the regression analyses indicated that two variables ‘education’ and ‘variety Amarilis’ made a significant contribution to improved yields over the years studied, t-tests were then used to confirm the effects of these two variables. (Appendix 6 and 7) T-tests were used in two ways: (1) to prove that there was a significant difference between the average yields obtained by participants and non-participants, and (2) to prove that there was a significant difference between the average yields attained by ‘Amarilis’ and those attained by ‘other varieties’. The ‘other varieties’ were considered in the following two ways: (1) as ‘all other varieties’ and (2) as ‘other main varieties’ (defined as the simple average of the three varieties ‘Yungay’, ‘Liberteña’ and ‘Canchan’, which are grown almost everywhere in the research site).
10

Monetarized additional net benefits at the farm level As no significant changes in practices and inputs were confirmed by preliminary analysis of the survey data and production costs were not affected by participation in FFSs, changes in yield were concluded to equal net benefits. In order to calculate the benefits obtained by each farmer family as a result of the FFSs, the confirmed additional average yield obtained per hectare was multiplied by the average market price paid to farmers in the research site over the last few years (1998-2002) and multiplied by the potato area per farm. Cost-effectiveness of the project: net present value and the internal rate of return The total additional net benefits over all participant farmers’ fields (calculated as described above) were compared with the overall project costs. Net present values and internal rates of return were calculated for a period of 20 years, assuming (1) an average annual decline of 3.5% in potato prices (see Fig. 2), (2) a discount rate of 10%, (3) no further adoption of the introduced variety after the end of the project, and (4) no spill-over effects of learning to non-participants. Monitoring costs were included, and various scenarios were considered (i.e., including or not including the project’s conceptual costs, and including or not including the benefits obtained from the use of ‘Amarilis’).
11

Results According to the survey results, no differences could be identified between participants and non-participants with regard to IPM practices such as changes in hilling intensity, insect collection, the use of traps, the growing of plants that repel insects, etc. Nor were any differences found in terms of the alternation of systemic fungicides with contact fungicides: farmers applied the same fungicide (or fungicide mixture) throughout the cropping season, irrespective of their participation in a FFS. However, several changes in practices may have taken place, but may have been too subtle to be identified by the survey forms and interviewing styles used. Such changes may include, for example, choosing the time at which to spray more carefully, or changes in the way sprays were applied, soil preparation, sowingtechniques and better decisions for timely management in general. (Buck, 2001) However, comparison of averages and correlation analyses showed that some changes had occurred. We outline these in the sections which follow. Knowledge Results from correlation analyses showed that, in both the 2000/2001 and 1997/1998 surveys, FFS participants achieved significantly better results (p < 0.001, r = 0.86) in knowledge tests (Nelson et al., 2001) than non-participants. Better results in knowledge tests were also found to be correlated with better yields (p < 0.05, r = 0.16). However, the correlation between participation in FFSs and better yields was not significant.
Pearson Correlation Coefficients, N = 152
Prob > |r| under H0: Rho=0
yield FFS Knowledge
yield 1.00000 0.13003 0.16100
0.1103 0.0475
FFS 0.86151
<.0001
(not all of the 165 respondents had made a knowledge test>>>only N=152)
12

This seems to confirm the contribution that increased knowledge was originally expected to make to yield (Gotland et al., 2002). Pesticides Frequency of application Only in the 2000/2001 survey, the year with the most severe late-blight infection, did FFS-participants apply pesticides significantly (p < 0.01) less frequently than non-participants.
Pearson Correlation Coefficients, N = 165
Prob > |r| under H0: Rho=0
part noapplictot uantiyproducts alternance
part 1.00000 -0.20072 -0.01807 0.03015
0.0097 0.8178 0.7007 The average number of applications of both fungicides and insecticides by participants was found to be about 7 (7.26); the average number of applications by non-participants was found to be about 8 (8.08). Therefore, there was a 10% reduction in the frequency of application, which corresponds to a total cost saving of around US$3 per farmer (see Appendix 3). Quality of pesticides used Among FFS participants, a shift was observed away from the use of Ridomil (methalaxyl) to other alternatives. But, no general shift was found to occur away from the use of toxic pesticides towards the use of less toxic pesticides. The only product no longer used (‘mentioned’) by participants was the highly toxic, and officially banned, Aldrin. In some cases, non-participants mentioned that they still use Aldrin, but they often call a pesticide Aldrin when they do not exactly know what it is. However, we were unable to find any actual proof of the use of Aldrin.
13

User protection The 2001/2002 survey showed (Table 2) that FFS participants protected themselves better than non-participants when preparing and spraying pesticides (in terms of the wearing of gloves: p < 0.001, r = 0.27; and, the wearing of protective overalls: p < 0.01, r = 0.24). However, this could not be confirmed in the case of other survey years.
Table 2. Differences between farmer field school (FFS) participants and non-participants in their protection against pesticides (Source: CIP Survey 2001/2002).
Variable FFS Non-FFS
% of farmers who use some protection while spraying 74% 65%
% of farmers who use some protection while preparing pesticides 18% 2%
Resistant Varieties Perhaps the most important IPM measure adopted by the FFS participants is the use of late-blight-resistant varieties. The project gave them access to new varieties, which increased the adoption of resistant varieties (such as ‘Amarilis’) and clones (Fig. 3).
01020304050607080
1998/1999 1999/2000 2000/2001 2001/2002
%
Amarilis Liberteña Yungay Canchan Chaucha Perricholi Machala Zuela colorada
Figure 3. Distribution of the 8 most important varieties in San Miguel 1998-2002 (% of seed planted by all farmers)
14

With regard to the clones, even though several were much superior to Amarilis with respect to late-blight resistance, they will not be considered further in this analysis as they were only introduced in very small quantities. However, it should be noted that interesting data concerning their adoption may arise over the next few years. Because of the informal seed distribution system which exists, in which seed is shared with neighboring farmers, the new variety (‘Amarilis’) was also very quickly adopted by non-participants, though without any additional measures or subsidies (Fig. 4). Despite the massive adoption of a new variety, the farmers who participated in the FFS did not drop the old and prevailing varieties. However, data from the 2001/2002 survey show that participants conserve more varieties than the non-participants (see Appendix 4).
igure. 4. Difference in adoption of ‘Amarilis’ between FFS participants and non-
ields
he results obtained from correlation analyses indicated that use of ‘Amarilis’ and the education
e therefore used a linear regression model to explain the independent contribution of different
% of var ie ty Am arilis plante d by Farm e r Fie ld School participants /non-participants
0
10
20
30
40
50
60
1999 2000 2001 2002
ye ar
% o
f tot
al s
eed
partic ipants
nonpartic ipants
Fparticipants
Y Treceived by participants in FFS very probably had a positive influence on the yields farmers obtained. This could not, however, be proved to be statistically significant. Wfactors (years, communities, varieties and FFS-education) to the variable ‘yield’, as explained above (pages 14-16). For details of one analysis see Box 2, and for the output from SAS, see
15

Appendix 5.
Box 2. Number of observations: 430 Dependent Variable: yield Variety of reference (var 2): ‘Liberteña’ (variety mainly replaced by Amarilis due to similar characteristics) Community of reference: com 9 (Quilcate, community with a moderate average yield) Years of reference: 2000 (first calculation) and 2001 (second calculation); data for 2002 was not used, because of the much higher average yields obtained in that year
Regardless of the year of reference (2000 or 2001, see Box 2) the estimates of an independent positive contribution of the factor ‘participation in a FFS’ (‘eca’) and of the variety ‘Amarilis’ (‘d_var1’) remain significant. The influence of the Farmer Field School (‘eca’) was significant (p < 0.05), as was that of the variety ‘Amarilis’ (p < 0.05).
Parameter Estimate Error t Value Pr > |t|
4.10 1.59 2.57 0.01 Base 2001 eca d_var1 2.35 1.09 2.15 0.03
Base 2000 eca 6.56 2.68 2.45 0.01
d_var1 2.35 1.09 2.15 0.03
or details, see Appendix 5)
hese results show that ‘variety Amarilis’ and ‘FFS participation’ make a completely independent
(F
Tcontribution to yield. However, they do not explain how large the average contribution made by each factor is. In the next step, therefore, we quantify the contribution of these two variables.
16

Economics of Training
In order to quantify the ‘education effect’ (‘eca’) of participation in FFSs, a t-test was used to confirm the differences in yields apparent between participants and non-participants, using combined data from the following three years: 2000, 2001, and 2002.
Statistics
Lower CL Upper CL Lower CL Upper CL
Variable part N Mean Mean Mean Std Dev Std Dev Std Dev Std Err
yield 229 16.76 17.799 18.838 7.31 7.98 8.7864 0.5273
0
yield 201 19.359 20.524 21.689 7.6317 8.3785 9.2886 0.591
1
yield Diff (1-2) -4.277 -2.725 -1.173 7.6562 8.1686 8.7552 0.7895
The t-test revealed a statistically significant difference between the means of 2.725 tonnes/ha over the three years (p < 0.001; see Appendix 6). Therefore the positive annual effect on yield of participating in a Farmer Field School is 2.7 t/ha, this equates to about US$236 per hectare. The average potato price paid to the Cajamarca farmers in the field in recent years has been between US$85 and US$90 per tonne. Considering the additional yield obtained per year (2.7 t/ha), the prices obtained (US$87.5/tonne) and the average potato area per family (0.2 ha), the average additional gain per participant as a result of this FFS project was about US$47.30 per year. And due to the yield increase there has been a reduction in the cost per unit produced, so the potential competitiveness has increased.
17

Economics of Variety ‘Amarilis’
As we have seen from the results from the regression model, the positive contribution of the variety ‘Amarilis’ was confirmed to be significant at the 5% level. In order to determine the importance of this contribution to yield we ran two t-tests, one comparing the yield of ‘Amarilis’ with the average of all other varieties (T1) and one comparing ‘Amarilis’ with the average yield of the three other most important varieties (T2). The analysis (Appendix 7) was similar to the t-test conducted for ‘economics of training’. The t-tests showed an improvement in yield of at least 4 tonnes/ha due to the introduction of the variety ‘Amarilis’. The improvements were 4.4 t/ha and 4.2 t/ha in the cases of T1 and T2, respectively. This additional yield (4 t/ha) is equivalent to an additional gain of about US$350 per year (given the market price of US$87.50/t). However, farmers do not, and will not, plant their whole potato-growing area with ‘Amarilis’ (they use it on only a proportion of their growing area). On average, among the participants, ‘Amarilis’ made up 39.3% of the total seed used, while among non-participants, this figure was 29.5% of the seed used (data from 2002; Fig. 3). However, farmers’ use of ‘Amarilis’ is declining slightly. Therefore, in order to be cautious, from this point onwards, the assumptions used in calculations are that the percentages of farmers’ potato-growing areas that are cropped with ‘Amarilis’ are 35% in the case of participants, and 30% in the case of non-participants. Therefore, with an additional yield of 4 t/ha and a market price of US$87.50/t, the average area of potato grown with the variety ‘Amarilis’ per family (0.07 ha for participants, 0.06 ha for non-participants), would result in an additional benefit (due to ‘Amarilis’) of around US$24.50 for participant households and US$17.50 for non-participant households.
18

Total Costs and Benefits of the Project Costs The costs of the FFSs were monitored over several years. The result (an average operational cost of US$70 per participant per year) was only slightly higher than the average operational costs (about US$60 per participant per year) experienced by other FFS projects around the world. The total cost of the project (US$97,700; Table 3) was slightly higher than those of other FFS projects for several reasons: • Because IPM interventions differ greatly from one crop to another, they needed to be
redesigned for this project. Therefore, many technical details of the teaching curriculum had to be developed.
• Because the potato-cropping season is longer than that of rice or vegetables (the subjects of other FFSs) the lessons had to be distributed over a longer period in this project.
• It was necessary for the scientists and extension specialists to write a manual for use with the project—however, this final product can be used for future FFS projects concerned with potato.
• As mentioned earlier, this Farmer Field School project has also had a strong research component, involving the early evaluation of new clones and varieties. Through the participatory involvement of farmers the selection of promising clones could be considerably accelerated (Ortiz et al., 2002).
Table 3. Real costs of the Cajamarca pilot FFS project (source: CIP/CARE budgetary data and
Annual FFS Activity Reports).
Year Number FFS Participants Costs (US$) Details
97/98 0 0 20,000 Concepts/Manual
98/99 8 115 8,800 Operational costs
99/00 13 160 14,300 Operational costs
00/0I 20 345 22,000 Operational costs
0I/02 16 274 17,600 Operational costs
15,000 Monitoring costs
Total 97,700
19

Benefits The overall benefit of the project reached in this period is the sum of the following. 1 Benefits from participants through better yields due to
1.1 Training 1.2 Adoption of the new variety.
2 Benefits of non-participants through better yields because of 2.1 Adoption of the new variety.
Benefits 1 (participants)
Year Number of beneficiaries
Total potato area (ha)
Benefits (US$/ha) due to education
Benefits (US$/ha) due to ‘Amarilis’
Total benefits of
education
Total benefits of
‘Amarilis’ 10-50-35%1
of potato area
All benefits
1998 115 23 0.0 0.0 0.0 0.0
1999 160 32 236.0 350.0 7552.0 1120.0 8672.0
2000 345 69 236.0 350.0 16284.0 12075.0 28359.0
2001 345 69 236.0 350.0 16284.0 8452.5 24736.5
2002 69 227.7 337.8 15711.3 8157.9 23869.2
Total 85,636.7
Benefits 2 (non-participants)
Year Number of beneficiaries
Area (ha) beneficiaries
Benefits (US$/ha)
due to ‘Amarilis’
% of potato area cropped with ‘Amarilis’
Total benefits of ‘Amarilis’
1998 115 23 0.0
1999 160 32 0.0
2000 345 69 350.0 10.0 2415.0
2001 345 69 350.0 35.0 8452.5
2002 69 337.8 30.0 6992.5
Total 17,860.0 The benefits gained (above) covered the cost of the project, but in order to assess whether the
1 10% in 1999, 50% in 2000, 35% in 2001
20

project would ‘pay back’ the money invested, the evaluation needs to include the calculation of the NPV and IRR, both of which require a longer observation period. In order to assess the cost-effectiveness of an agricultural project, the minimum timespan required is considered to be 15-20 years.
Cost-effectiveness: Net Present Value and Internal Rate of Return Table 4. Returns on the Cajamarca pilot FFS project.
Year
Costs/ year
(US$) Number of participants
Total area:
participants (ha)a
Benefits due to
training: participants
(US$/ha)
Benefits due to
‘Amarilis’: (US$/ha)
Area: non-
participants
(ha) a
Total benefits
of FFS-
training (US$)
Total benefits of ’Amarilis’:
non- participants
(US$)
Total benefits
of ‘Amarilis’:
participants (US$)
Net benefit (US$)
1997 20,000 0 0 0.0 0.0 0.0 0.0 0.0 (20,000.00)1998 8,800 115 23 0.0 0.0 0.0 0.0 0.0 (8,800.00)1999 14,300 160 32 236.0 350.0 7552.0 0.0 1120.0 (5,628.00)2000 22,000 345 69 236.0 350.0 10.0 16284.0 437.5 13282.5 8,004.002001 17,600 274 69 236.0 350.0 25.0 16284.0 2187.5 8452.5 9,324.002002 15,000 69 227.7 337.8 50.0 15714.1 4221.9 8156.7 13,092.602003 69 219.8 325.9 50.0 15164.1 4074.1 7871.2 27,109.362004 69 212.1 314.5 50.0 14633.3 3931.5 7595.7 26,160.532005 69 204.7 303.5 50.0 14121.2 3793.9 7329.8 25,244.912006 69 197.5 292.9 50.0 13626.9 3661.1 7073.3 24,361.342007 69 190.6 282.6 50.0 13150.0 3533.0 6825.7 23,508.692008 69 183.9 272.7 50.0 12689.7 3409.3 6586.8 22,685.892009 69 177.5 263.2 50.0 12245.6 3290.0 6356.3 21,891.882010 69 171.3 254.0 50.0 11817.0 3174.9 6133.8 21,125.672011 69 165.3 245.1 50.0 11403.4 3063.7 5919.1 20,386.272012 69 159.5 236.5 50.0 11004.3 2956.5 5712.0 19,672.752013 69 153.9 228.2 50.0 10619.1 2853.0 5512.0 18,984.202014 69 148.5 220.3 50.0 10247.5 2753.2 5319.1 18,319.752015 69 143.3 212.5 50.0 9888.8 2656.8 5133.0 17,678.562016 69 138.3 205.1 50.0 9542.7 2563.8 4953.3 17,059.81 NPV 84,189.33 IRR 0.31a Assuming 0.2 ha per farmer. The project may be evaluated in different ways according to the different costs and benefits that can be included: (1) If we include the overall benefits obtained (1) by participants, as a result of better yields arising from education and the adoption of the new variety, and (2), by non-participants as a result of better yields arising from the adoption of the new variety, it can be concluded that the project shows a very healthy performance, achieving an NPV of about US$84,200 and an IRR
21

of 31% (Table 4). A project with a return to investment of more than 22% is considered to be solid and cost-effective. So, the NPV attained by this project is positive but not very high, which is, of course, due to its limited outreach. However, there remains the problem of attribution of benefits, in so far as one might argue that the additional benefits participants and non-participants received a result of the introduction of ‘Amarilis’ cannot be entirely attributed to the FFS project, because the FFSs only helped to disseminate the variety and so shortened the adoption time. The breeding work undertaken to produce the variety should also be taken into account when considering benefits and costs. In this case, only part of the additional benefits obtained as a result of the introduction of this variety could be attributed to the project; however, the decision of how much of the benefit obtained could be attributed to the project would, in this instance, be very arbitrary. (2) If this viewpoint is accepted, in order to ensure that no undeserved benefits are assigned to the FFS project, only the increase in yield that originated from the FFS education should be considered. That is, the increase in yield that resulted from the introduction of ‘Amarilis’ should not be included. Using this approach, the project shows an NPV of about US$18,423 and an IRR of 15%, which is insufficient to justify the project (see Appendix 8). (3) However, just as one might argue that the variety benefits cannot be attributed to the project, one can also argue that the costs of the conceptual work and the composition of a manual should not be attributed to the project, as they are one-off costs that would not occur should the project be replicated elsewhere. Using this perspective, therefore, which only considers the operational and monitoring costs of the project and the educational benefits received by participants, the NPV is about US$40,270 and the IRR 28% (see Appendix 9). All estimations are conservative and reliable because they are not based on research trials, as they are in most ex ante evaluations, but on measured data from farmers’ fields and on very few and conservative assumptions concerning future development. Additional sensitivity analyses showed that FFS projects would be much more cost-effective if the average potato area per farmer was bigger than in the pilot sites (Appendix 10). However, they also showed that FFSs would not be a very economic method if used solely for the diffusion of a new variety (Appendix 10). Scaling up the projects would require considering future impacts on potato prices and consumers.
22

Conclusions The study of the Cajamarca FFS project revealed several interesting findings:
1. It is much more difficult to introduce IPM technologies into potato cropping areas where late blight is endemic than it is to introduce such technologies into other sites and/or to other crops where insects are the most severe pest problem. To date, the opportunities for IPM late-blight management are limited to the use of fungicides and resistant varieties.
2. Better crop-management knowledge does not automatically mean that knowledge is applied in the field or in daily life. On the other hand, learning can affect the skills of participants in ways which are not obvious but which do result in yield increases.
3. In reality, farmers could not monetarize their additional benefits, because potato prices fell by 25% in Peru during the period in which the FFSs were implemented. This had a serious effect, as the cost/benefit relations no longer justified the commercialization of the participants’ potato crops. Strong price fluctuations occur in Peru from year to year because of the country’s climatic conditions. However, the general trend observed in the price data for the last ten years (Fig. 2) has been a decline in potato prices. The current changes in the behavior of consumers, and the fact that supply will probably continue to exceed demand, make it likely that potato prices will continue to drop.
All this may explain why we were able to confirm only a few of the changes/differences, which were originally expected to result from the teaching of the IPM Farmer Field School curriculum. Even if the knowledge of FFS participants was significantly better than that of non-participants, it was not possible to capture changes of technologies with the survey method. It might have been possible with other, qualitative methods, but almost none of the changes proposed by the curriculum are implemented. Most importantly, they did not significantly reduce their use of pesticides, nor did they adopt any labor-intensive IPM methods. But FFS participants started to protect themselves better when preparing and applying pesticides; this is a positive result, even if acute pesticide poisonings have never been a major problem in the site at which the project took place, probably because pesticide use was always lower in this area than in other areas, where potatoes are grown for sale. Therefore, the most important outcome is the fact that, despite the lack of any obvious changes in the cropping techniques used, farmers yields were significantly greater (by 2.7 tonnes/ha), as a direct result of the education gained through participation in FFSs.
23

If the yield benefits given by the introduction of ‘Amarilis’ are included in the budget, this project can be considered to have attained an NPV of US$84,000 and an IRR of 31%. However, if none of the benefits resulting from the introduction of ‘Amarilis’ are attributed to the project, and if all conceptual costs are included in the budget, the NPV falls to US$18,000 and the IRR to only 15%. In fact, the most reasonable viewpoint to take when comparing the project with others and evaluating its sustainability involves considering only the additional yield benefits obtained by participants as a result of their education, without actually considering the additional benefits resulting from the introduction of ‘Amarilis’. At the same time, initial conceptual costs and the costs involved in compiling a project manual, which should not be considered as they were unique, and would not be incurred should the project be replicated. Such an assessment provides an NPV of more than US$40,000 and an IRR of 28%. The latter finding shows that the benefits accrued as a result of the project are sufficient to confirm that Farmer Field Schools are an economically interesting way of diffusing IPM technology. The FFS model should therefore definitely be recommended as a viable investment to donors interested in funding similar projects. Our analyses also showed that the cost-effectiveness of the projects, and the economic benefits gained, would be much greater if the area cropped with potato was more than 0.2 ha per participant. Only in the case of schools in which the participants crop a smaller area with potato would the ‘payback’ obtained be negligible. With regard to poverty alleviation and the justification of similar projects, one might say that any increase in income, no matter how small, benefits the farmers involved. From this perspective, the project did contribute to poverty alleviation, even though the benefits gained have been relatively small so far. But, despite the cost-effectiveness of the project and the potential benefits for consumers, the question is: how much sense does it make to invest in increasing the production of a crop for which the market is already saturated? Should FFS focus on increasing competitiveness? We must therefore ask: what will happen if the Potato Farmer Field Schools are scaled up to such extent that prices fall due to the increased offer? The answer is that additional benefits could rapidly diminish as a result of price reductions (see Appendix 11).
24

Of course increased potato production is not the only and ultimate goal of these projects. Farmers learn well in Farmer Field Schools, and there is a real interest among them to learn more. In the San Miguel site, farmers prefer to invest now in dairy production rather than in potato cropping; it should therefore be recognized that the FFS education system could be applied to, and used to improve, many other crops and production systems. In some of the pilot communities the former FFS participants are already using the experience they gained from the potato-FFSs and are continuing the schools on their own initiative. Some of the most skilled farmers had received extra education during the project cycle and are now the new teachers in their community, on a voluntary basis. Some of the experienced FFS groups are choosing to study different crops or subjects and are looking, by themselves, for a teacher or an expert. They now have the skills and knowledge, which enable them to look for support (from NGOs, governmental institutions, etc.) and organize themselves. In some FFS communities, people have initiated community work groups, a tradition, which was practiced previously but had been lost. Thus it could be concluded that, in the long term, the main benefit of the FFS methodology may not be the direct economic advantage associated with increased potato yields or competitiveness, but the effects such a methodology has on the participants and their behavior, in terms of increasing their enthusiasm and developing their skills. This ’empowerment‘ or ‘strengthening’ of human capital still needs to be measured, and is the subject of an ongoing study. This is measuring differences between the personal development of FFS participants and non-participants, as well as the differences apparent between participants and non-participants in other participatory projects.
25

References Backhaus, K., Erichson, B., Plinke, W. and Weiber, R. 2000. Multivariate Analysemethoden,
eine Anwendungsorientierte Einfuehrung, Neunte Ueberarbeitete und Erweiterte Auflage. Springer Verlag, Berlin, Germany.
Buck, A. 2001. Participatory evaluation of farmers’ perceptions about impact from Farmer Field
Schools, Case Study Province San Miguel, Peru. Thesis. Technische Universität München, Wissenschaftszentrum Weihenstephan, Germany.
DHS International. 1996. http://www.measuredhs.com/aboutdhs/start.cfm (June 2001). Dung, N.T. 2003. Applying the farmer field schools approach to genetic resources conservation.
In: Conservation and Sustainable Use of Agricultural Biodiversity, a Sourcebook: Strengthening Local Management of Agricultural Biodiversity (vol. 2). CIP-UPWARD, Los Banos, the Philippines. pp. 337-343.
FAO. 2002. Country Surveys: Averages 1998-2002 and Food Balance Sheet 01498901.
http://www.fao.org/waicent/portal/statistics_en.asp (Jan 2003). Feder, G.,Murgai, R. and Quizon, J.B. 2003. Sending farmers back to school: An Economic
Evaluation of the Farmer Field School (FFS) Extension Approach.” Forthcoming in Review of Agricultural Economics.
Fonseca, C., Labarta, R., Mendoza, A., Landeo, J. and Walker, T.S. 1996. Economic impact of
the high-yielding, late blight-resistant variety Canchán INIAA in Peru. In: Walker, T. and C. Crissman (eds.) Case Studies of the Economic Impact of CIP-Related Technology. CIP, Lima, Peru. pp. 51-64.
Garzalho, S. and White, H. 1997. Combining the quantitative and qualitative approaches to
poverty measurement and analysis (the practice and the potential). World Bank Technical Paper No. 366. World Bank, Washington, DC, USA.
26

Gotland, E., Sadoulet, E., Janvry de A., Murgai R. and Ortiz O. 2003. The Impact of Farmer-
Field-Schools on Knowledge and Productivity: A Study of Potato Farmers in the Peruvian Andes. Department of Agriculture & Resource Economics, UCB, CUDARE Working Papers # 963. University of California, Berkley, USA.
Kuckartz, U. 1999. Computergestützte Analyse Qualitativer Daten, Eine Einführung in Methoden
und Arbeitstechniken. Verlag, Berlin, Germany. Nelson, R., Orrego, R. and Ortiz, O. 2001. Impact evaluation of participatory development of
integrated insect and disease management (IPM) for the potato crop in San Miguel, Peru. CIP Report to the Participatory Research and Gender Analysis Program. CIP, Lima, Peru.
Nelson, R., Orrego, R., Ortiz, O., Tenorio J., Mundt, Ch., Fredrix, M. and Vinh Vien, N. 2001a.
Working with Resource-Poor Farmers to Manage Plant Diseases. Plant Disease, Vol 85 No 7 . pp. 684-695. The American Phytopathological Society.
Ortiz O., Winters, P. and Fano, H. 1999. La percepción de los agricultores sobre el problema
del tizon tardío o rancha (Phytophthora infestans) y su manejo: Estudio de casos en Cajamarca, Peru. Revista Latinoamericana de la Papa 1998-1999 pp. 97-120.
Ortiz, O., Orrego, R., Nelson R. and Leon, V. 2002. Impact evaluation of participatory
development of integrated insect and disease management (IPM) for the potato crop in San Miguel, Peru. Report of PRGA Small Grant for January 1999 - December 2001
Rogers, E.M. 1995. Diffusion of Innovations. 4th ed. Free Press, New York, USA. Rueda, J.L., Ewell, P.T., Walker, T.S., Soto, M., Bicamumpaka, M. and Berrios, D. 1996.
Economic Impact of High-Yielding, Late-blight-Resistant Varieties in the Eastern and Central African Highlands. In: Walker, T. and C. Crissman (eds.) Case Studies of the Economic Impact of CIP-Related Technology. CIP, Lima, Peru. pp. 15-30.
Shotton J., 1999. What is an impact study and how should we do it? Education Research Paper
No. 35. Center for Overseas and Developing Education, Homerton College, University of Cambridge, UK.
27

Thiele, G., Nelson, R., Ortiz, O. and Sherwood S. 2001a. Participatory research and training:
ten lessons from the farmer field schools (FFS) in the Andes. Currents 27: 4-11. Thiele, G., van de Fliert, E. and Campilan, D. 2001b. What happened to participatory research
at the International Potato Center? Agriculture and Human Values 18: 429-446. Troost T.A. 2000. Spatial variation in Late Blight severity (Phytophtora infestans) in potato crops
in relation to climate and crop management. Thesis SB 212.M9 T7 CIP, Lima, Peru and Wageningen University, Wageningen, the Netherlands.
van de Fliert, E. 1993. Integrated Pest Management: farmer field schools generate sustainable
practices. A case study in Central Java evaluating IPM training. Wageningen Agricultural University Papers 93-3. Wageningen University, Wageningen, the Netherlands.
van de Fliert, E., Johnson, N., Asmunati, R. and Wiyanto. 2001. The impact of sweetpotato
integrated crop management farmer field schools in Indonesia, Conference Paper, International Symposium Lima, CIP Lima (Peru), 26-29 November 2001 no. CII-P-8, unpublished
Walker, T. S. and Crissman, Ch. C. 1996. Economic impact of CIP-24 in China. In: Walker, T.
and Crissman, C. (eds.) Case Studies of the Economic Impact of CIP-Related Technology. CIP, Lima, Peru. pp. 31-50.
Webb, R., and Fernandez Baca, G. 2002. Peru en Numeros, Anuario Estadistico. Instituto
Cuanto, Lima, Peru.
28

Appendices
34

29
Appendix 1 Data collected on common indicators (NB none of the differences in this table are statistically significant; the table simply presents averages, for comparison).
1998 1998 1999 1999 2000 2000 2001 2001 2002 2002
Variable Participants Non- participants Participants
Non- participants Participants
Non- participants Participants
Non- participants Participants
Non- participants
Formal education (average years)
5.2 5.1 6.4 4.6 5.8 5.9 6.2 4.7 6.5 4.6
Average age 44 43 38 44 44 43 38 43 40 45
Assets: cattle (male and female)
3-4 4.6 3.5 5.5 7.4 4.7 5 8 8
Land area (ha) 5 9 13.2 11 6.6 8.5 8.3 9.4 7.7 9.8
Area of potatoes/farmer (ha)
0.51 0.68 0.30 0.27 0.22 0.30 0.20 0.26 0.21 0.22
Yield (t/ha) n.a. n.a. 4.9 6.3 10.5 9.9 17.9 16.4 22.7 21.2
Number of pesticide applications/potato crop
7.4 6.7 n.a. n.a. 5.7 5.9 7.3 8.1 8.4 total (6.7 fungicides, 1.7 insecticides)
8.4 total (6.7 fungicides, 1.7 insecticides)
Application of main pesticides (in 2002 survey, ‘%’ refers to the times included in the application – as farmers mix products, total is > 100%)
Ridomil 31% Antracol 14 % Manzate 10% Tamaron 8% Mancozil 5% (% of total number of applications)
Citowet 23% Furadan 13% Manzanex 11% Mancozil=Manzate 5.5%Brestan 5.4% (% of frequency of being mentioned by farmers
Antracol 21%Mancozil 19%Ridomil 14%Manzate 7% (Monofos insect.) 8% (% of total number of applications)
Antracol 33%Mancozil 22%Manzate 10%Dithane 5% (% of total number of applications)
Antracol 37%Mancozil 26%Manzate 9%Ridomil 8% (% of total number of applications)
Monofos 53%Baytroid 22%Buldoc 9%Parathion 4% Mancozil 39%Manzate 30%Antracol 26%Manganet 7%
Monofos 53% Tamaron 16% Baytroid 13% Parathion 6% Aldrin 5% Mancozil 50% Antracol 45% Manzate 23% Ridomil 11%
Main varieties used (% of seed grown) averaged over all farmers
Libertena 36.6% Canchan 17.5% Amarilis 16.0 % Yungay 13.7 % Pericholi 3.8 % Renacimiento 3.1 %
Libertena 70% Yungay 6% Amarilis 5% Zuela colorada 5% Machala 5% Pericholi 3%Canchan 3% Renacimiento 2%
Amarilis 24% Libertena 16% Canchan 13% Chaucha 8% Yungay 8% Machala 5%
Amarilis 43% Libertena 21% Yungay 7%Canchan 7% Chaucha 5% Pericholi 3%Peruanita 3% Machala 2%
Amarilis 33.9% Libertena 26.2% Yungay 9.4% Canchan 6.2% Chaucha 4.8% Pericholi 1.8% Peruanita 1.5% Machala 4.3%
Farmers considered in survey
13 118 45 441 41 57 67 96 71 90

30
Appendix 2
Codes for communities and varieties used in the regression model Community Code Variety CodeArteza 1 ‘Amarilis’ 1Banos 2 ‘Libertena’ 2Cortadera 3 ‘Canchan’ 3Los Angeles 4 ‘Yungay’ 4Milagro 5 Other improved varieties 5Mutish 6 Native varieties 6Pabellon 7 Clones 7Progreso 8 Quilcate 9 San Lucas 10 Sta. Aurelia 11 Tantachual 12 Zognad 13 Laguna 14 Sta. Rosa 15 Lanchepampa 16 Lipoc 17 Quengo 18 Vitian 19
Appendix 3 The data obtained in the 2000/2001 survey showed that, on average, FFS participants made 7.26 applications of pesticide per crop, while non-participants made 8.08 applications, Appendix 1). The difference between the two groups was 0.82 applications, equivalent to a 10% reduction in frequency of application. Participants were found to spend almost the same amount per application as non-participants (Appendix Table 1). Although the average amount spent by participants was slightly higher (2.1 soles per application, per hectare) this difference was not statistically significant. Appendix Table 1. Average costs per pesticide application, per hectare (Peruvian solesa); data from a survey in 2000/2001. Average cost of fungicide + insecticide/ application/ha Cost of fungicides Cost of insecticides Participants 57.6 51.9 5.7 Non-participants 55.5 51.4 4.1 a 1 US dollar = 3.5 Peruvian soles (December 2002). Adding the average costs of labor and hire of spraying equipment (10-12 soles per application), gives a total cost per application of 68-70 soles/ha (US$20/ha). Thus, the average per-hectare saving made by making 0.82 less applications of pesticide (the average reduction noted above) would be only US$16.4/ha (0.82 ×20). With an average potato area per farmer of 0.2 ha the average saving per farmer is US$3.28 (0.2 ×16.4).

31
Appendix 4 Quantity of different potato varieties planted (% of seed grown, averaged over all farmers).
Varieties 2001-2002 Participants Non-participants
In total, 28 varieties were grown.
FFS participants grew 26 varieties. Non-
participants grew 14 varieties, which
included 2 varieties not grown by
participants: ‘Revolucion’ and ‘Colegiala’.
Amarilis* 39.3%
Libertena 18.1%
Yungay 11.2%
Canchan 3.8%
Chaucha 3.9%
Machala 2.8%
Renacimiento 1.1%
Perricholi 2.1%
Atahualpa 3.1%
Peruana 0.7%
Zuela colorada 1.1%
Chagllina 0.9%
Clones* 4.3%
Chata roja 2.6%
Belen 0.8%
Calabaza 0.8%
Shoga colorada 0.7%
Huagalina 0.7%
Sapa 0.4%
Luren 0.4%
Tps* 0.2%
Huayro 0.2%
Maria bonita 0.2%
Chiquibonita 0.2%
Tomasa 0.1%
L uquilla 0.1%
Amarilis* 29.5%
Libertena 32.6%
Yungay 7.9%
Canchan 8.2%
Chaucha 5.5%
Machala 5.5%
Renacimiento 2.6%
Perricholi 1.5%
Atahualpa 0.3%
Peruana 2.0%
Zuela colorada 1.4%
Chagllina 0.2%
Revolucion 1.7%
C olegiala 1.1%
*Introduced by FFS project

32
Appendix 5
GLM (general linear regression model) for yield The standard output from the statistical software package SAS includes an analysis of variance table as well as the Root MSE, the mean of the dependent variable, the coefficient of variation, the R-Square value and the adjusted R-Square. In the ANOVA table, a small p-value (listed under the heading "Prob>F") indicates that the model explains a significant portion of the variation in the data. The characteristics of the parameter estimates depend on the assumptions made about the data. Each p-value listed under the heading "Prob > |t|" represents the significance of the probability test used to test whether the effect of the parameter is significantly different from zero. Sum of Source DF Squares Mean Square F Value Pr > F Model 25 8838.67455 353.54698 6.96 <.0001 Error 404 20515.02243 50.77976 Corrected Total 429 29353.69698 R-Square Coeff Var Root MSE yield Mean 0.301109 37.36186 7.125992 19.07291 Base: year 2001 Standard Parameter Estimate Error t Value Pr > |t| Intercept 14.94249061 1.38701699 10.77 <.0001 anospart -0.80147640 0.62294599 -1.29 0.1990 eca 4.10006867 1.59823940 2.57 0.0107 d_var1 2.35065758 1.09290087 2.15 0.0321 d_var3 -2.75805363 1.56507497 -1.76 0.0788 d_var4 -1.16698497 1.44447656 -0.81 0.4196 d_var5 0.25182060 1.23438942 0.20 0.8385 d_var6 -3.84274257 1.21942689 -3.15 0.0017 d_var7 1.93931946 2.31810241 0.84 0.4033 d_com1 7.34248572 1.77122527 4.15 <.0001 d_com2 1.79689901 1.85504774 0.97 0.3333 d_com3 3.97629846 1.62134425 2.45 0.0146 d_com5 -2.13079146 1.60035077 -1.33 0.1838 d_com6 -0.83493031 1.79295386 -0.47 0.6417 d_com7 0.32563275 1.54214026 0.21 0.8329 d_com8 2.14111933 1.66048932 1.29 0.1980 d_com10 -7.90745752 3.69267806 -2.14 0.0328 d_com11 5.10521133 1.76802024 2.89 0.0041 d_com12 -5.06074139 3.61934026 -1.40 0.1628 d_com14 -2.26628926 4.69994457 -0.48 0.6299 d_com15 5.55409889 1.58963554 3.49 0.0005 d_com18 1.82930589 1.71292664 1.07 0.2862 d_year2 -2.02333222 1.71506287 -1.18 0.2388 d_year4 3.79638044 1.03063429 3.68 0.0003 d_EA2 2.46602409 2.79639852 0.88 0.3784 d_EA4 -2.97147997 1.59535919 -1.86 0.0632

33
Base: year 2000 Standard Parameter Estimate Error t Value Pr > |t| Intercept 12.91915839 1.79508258 7.20 <.0001 anospart -0.80147640 0.62294599 -1.29 0.1990 eca 6.56609277 2.68297070 2.45 0.0148 d_var1 2.35065758 1.09290087 2.15 0.0321 d_var3 -2.75805363 1.56507497 -1.76 0.0788 d_var4 -1.16698497 1.44447656 -0.81 0.4196 d_var5 0.25182060 1.23438942 0.20 0.8385 d_var6 -3.84274257 1.21942689 -3.15 0.0017 d_var7 1.93931946 2.31810241 0.84 0.4033 d_com1 7.34248572 1.77122527 4.15 <.0001 d_com2 1.79689901 1.85504774 0.97 0.3333 d_com3 3.97629846 1.62134425 2.45 0.0146 d_com5 -2.13079146 1.60035077 -1.33 0.1838 d_com6 -0.83493031 1.79295386 -0.47 0.6417 d_com7 0.32563275 1.54214026 0.21 0.8329 d_com8 2.14111933 1.66048932 1.29 0.1980 d_com10 -7.90745752 3.69267806 -2.14 0.0328 d_com11 5.10521133 1.76802024 2.89 0.0041 d_com12 -5.06074139 3.61934026 -1.40 0.1628 d_com14 -2.26628926 4.69994457 -0.48 0.6299 d_com15 5.55409889 1.58963554 3.49 0.0005 d_com18 1.82930589 1.71292664 1.07 0.2862 d_year3 2.02333222 1.71506287 1.18 0.2388 d_year4 5.81971266 1.71685325 3.39 0.0008 d_ea3 -2.46602409 2.79639852 -0.88 0.3784 d_ea4 -5.43750407 2.73928445 -1.99 0.0478 Appendix 6 Significance test of the difference between yields obtained by FFS participants/non-participants Equality of Variances
Variable Method Num DF Den DF F Value Pr > F
yield Folded F 200 228 1.10 0.4752 equality not refused >>>
t-test for equal variance
T-Tests (Ho= There is no difference in yields) Variable Method Variances DF t Value Pr > |t| yield Pooled Equal 428 -3.45 0.0006 yield Satterthwaite Unequal 415 -3.44 0.0006
The null hypothesis ‘There is no difference in yields’ was rejected. Yields of FFS farmers were significantly higher than those of non-participating farmers (p<0.001).

34
Appendix 7 Performance of ‘Amarilis’ compared with the performance of all the other varieties (t test to assess whether the means of the two groups differ significantly) Variable variety N Mean Mean Mean Std Dev Std Dev Std Dev Std Err yield 125 20.694 22.212 23.729 7.6247 8.5716 9.7893 0.7667 1 yield 305 16.907 17.786 18.666 7.2285 7.8024 8.4762 0.4468 2 yield Diff (1-2) 2.7485 4.4252 6.102 7.5289 8.0329 8.6097 0.8531 T-Tests Variable Method Variances DF t Value Pr > |t| yield Pooled Equal 428 5.19 <.0001 Equality of Variances Variable Method Num DF Den DF F Value Pr > F yield Folded F 124 304 1.21 0.1994
Performance of ‘Amarilis’ compared with the performance of the other 3 most important varieties (t test to assess whether the means of the two groups differ significantly) Variable variety N Mean Mean Mean Std Dev Std Dev Std Dev Std Err yield 125 20.694 22.212 23.729 7.6247 8.5716 9.7893 0.7667 1 yield 160 16.817 18.023 19.23 6.9626 7.7266 8.6803 0.6108 2 yield Diff (1-2) 2.2833 4.1884 6.0935 7.4912 8.1077 8.8356 0.9678 T-Tests Variable Method Variances DF t Value Pr > |t| yield Pooled Equal 283 4.33 <.0001 Equality of Variances Variable Method Num DF Den DF F Value Pr > F yield Folded F 124 159 1.23 0.2171

35
Appendix 8 Net present value (NPV) and internal rate of return (IRR) without benefits of variety ‘Amarilis’, but considering all conceptual costs.
Year
Costs/ year
(US$) Number of participants
Total area:
participants (ha)a
Benefits due to
education: participants
(US$/ha)
Benefits due to ‘Amarilis’: participants (US$/ha)
Area: non-
participants (ha)a
Total benefits of education
FFS (US$)
Total benefits of ’Amarilis’:
non- participants
(US$)b
Total benefits
of ‘Amarilis’:
participants (US$)b
Net benefit (US$)
1997 20,000 0 0 0.0 0.0 0.0 0.0 0.0 (20,000.00)1998 8,800 115 23 0.0 0.0 0.0 0.0 0.0 (8,800.00)1999 14,300 160 32 236.0 350.0 7552.0 0.0 1120.0 (6,748.00)2000 22,000 345 69 236.0 350.0 10.0 16284.0 437.5 13282.5 (5,716.00)2001 17,600 274 69 236.0 350.0 25.0 16284.0 s2187.5 8452.5 (1,316.00)2002 15,000 69 227.7 337.8 50.0 15714.1 4221.9 8156.7 714.062003 69 219.8 325.9 50.0 15164.1 4074.1 7871.2 15,164.072004 69 212.1 314.5 50.0 14633.3 3931.5 7595.7 14,633.332005 69 204.7 303.5 50.0 14121.2 3793.9 7329.8 14,121.162006 69 197.5 292.9 50.0 13626.9 3661.1 7073.3 13,626.922007 69 190.6 282.6 50.0 13150.0 3533.0 6825.7 13,149.982008 69 183.9 272.7 50.0 12689.7 3409.3 6586.8 12,689.732009 69 177.5 263.2 50.0 12245.6 3290.0 6356.3 12,245.592010 69 171.3 254.0 50.0 11817.0 3174.9 6133.8 11,816.992011 69 165.3 245.1 50.0 11403.4 3063.7 5919.1 11,403.402012 69 159.5 236.5 50.0 11004.3 2956.5 5712.0 11,004.282013 69 153.9 228.2 50.0 10619.1 2853.0 5512.0 10,619.132014 69 148.5 220.3 50.0 10247.5 2753.2 5319.1 10,247.462015 69 143.3 212.5 50.0 9888.8 2656.8 5133.0 9,888.802016 69 138.3 205.1 50.0 9542.7 2563.8 4953.3 9,542.69
NPV 18,423.39 IRR 0.15
a Assuming 0.2 ha potato area per farmer. b Considering only that part of the 0.2-ha area planted with ‘Amarilis’.

36
Appendix 9 Net present value (NPV) and internal rate of return (IRR) without benefits of variety ‘Amarilis’, and without conceptual costs.
Year
Costs/ year
(US$) Number of participants
Total area:
participants (ha)a
Benefits due to
education: participants
(US$/ha)
Benefits due to ‘Amarilis’:
(US$/ha)
Area: non-
participants (ha) a
Total benefits of education
FFS (US$)
Total benefits of ’Amarilis’:
non- participants
(US$)b
Total benefits
of ‘Amarilis’: participants
(US$)bNet benefit
(US$) 1998 8,800 115 23 0.0 0.0 0.0 0.0 0.0 (8,800.00)1999 14,300 160 32 236.0 350.0 7552.0 0.0 1120.0 (6,748.00)2000 22,000 345 69 236.0 350.0 10.0 16284.0 437.5 13282.5 (5,716.00)2001 17,600 345 69 236.0 350.0 25.0 16284.0 2187.5 8452.5 (1,316.00)2002 15,000 69 227.7 337.8 50.0 15714.1 4221.9 8156.7 714.062003 69 219.8 325.9 50.0 15164.1 4074.1 7871.2 15,164.072004 69 212.1 314.5 50.0 14633.3 3931.5 7595.7 14,633.332005 69 204.7 303.5 50.0 14121.2 3793.9 7329.8 14,121.162006 69 197.5 292.9 50.0 13626.9 3661.1 7073.3 13,626.92
2007 69 190.6 282.6 50.0 13150.0 3533.0 6825.7 13,149.98 2008 69 183.9 272.7 50.0 12689.7 3409.3 6586.8 12,689.732009 69 177.5 263.2 50.0 12245.6 3290.0 6356.3 12,245.592010 69 171.3 254.0 50.0 11817.0 3174.9 6133.8 11,816.992011 69 165.3 245.1 50.0 11403.4 3063.7 5919.1 11,403.402012 69 159.5 236.5 50.0 11004.3 2956.5 5712.0 11,004.282013 69 153.9 228.2 50.0 10619.1 2853.0 5512.0 10,619.132014 69 148.5 220.3 50.0 10247.5 2753.2 5319.1 10,247.462015 69 143.3 212.5 50.0 9888.8 2656.8 5133.0 9,888.802016 69 138.3 205.1 50.0 9542.7 2563.8 4953.3 9,542.69
NPV 40,265.73 IRR 0.28
a Assuming 0.2 ha potato area per farmer.
b Considering only that part of the 0.2-ha area planted with ‘Amarilis’.

37
Appendix 10 Results of sensitivity analyses: Calculation of net present value (NPV) and internal rate of return (IRR) for scenarios in which the average size of potato plots was 0.15 ha and 0.25 ha. NB An IRR greater than 0.22 indicates a cost-effective/worthwhile project. Plot size 0.15 ha All costs included but only education benefits considered NPV -3,837.45IRR 0.09 Only education benefits and only operational costs considered NPV 9,541.92IRR 0.14 All costs included, but benefits of introduction of new varietyfor participants and non-participants considered NPV 50,074.78IRR 0.23 Plot size 0.25 ha
All costs included but only education benefits considered NPV 40,684.23
IRR 0.21 Only education benefits and only operational costs considered NPV 54,357.84IRR 0.30 All costs included, but benefits of introduction of new varietyfor participants and non-participants considered NPV 118,303.87IRR 0.39 NPV and IRR for cases in which FFSs are used only for the diffusion of a new variety Average potato area/farm 0.25 ha NPV 20,685.17IRR 0.17 Average potato area/farm 0.2 ha NPV 14,660.56IRR 0.16 Average potato area/farm 0.15 ha NPV -2,587.19IRR 0.09

Appendix 11 Often the most important economic impact of agricultural research is felt by consumers. This is true when research enhances an agricultural staple that a lot of poor people depend on, and which was previously in short supply. By boosting supply, prices are likely to fall, and this can benefit poor consumers. In Peru, potato is an important staple food, but supply is seldom insufficient to meet demand. This means that, if the project was replicated in many parts of the country, so elevating overall production, prices would fall. However, reductions in the price of potato are becoming less important for consumers in Peru. This is because potatoes are being replaced by rice and wheat, even in the diets of poor rural people. Of course the importance of potato is not the same at all social/geographical levels. But, it is important for the three categories we are especially interested in: - the rural poor in mountain areas who spend between 5% and 9% of their household income on potatoes, - the urban poor in mountain areas who spend 6% of their household income on potatoes and - the urban poor in Lima and in other coastal cities who spend 5% of their household income on potatoes (FAO, 2002; Webb and Fernandez Baca, 2002). As these data are averages, the rural poor in mountain areas can be assumed to consume slightly more potatoes and less rice and wheat products than the data suggest. However, a reduction of 5% in the price of potato (from its current level of US$87.50/t) means that the poor population (the three lower quintiles) would save less than US$1 per person per year. Furthermore, at the current low price, demand for potato is no longer closely linked to price. Therefore, consumers will not buy much more when prices drop. Additional consumption of potatoes will be limited. So, the budgets of neither poor nor rich consumers would be affected significantly. If a 5% price reduction occurred, the loss experienced by a small-scale potato farmer (with 0.2 ha land, who produces 17 t/ha), would be US$14.88 (0.2 × 17 × 87.5 × 0.05). Therefore, if Farmer Field School projects were ‘upscaled’ to such an extent that potato prices fell (by an assumed 5%), the implication for this economic evaluation, is that the US$14.88 would have to be discounted from the benefits of US$50-80 obtained through yield increases.
1