farm-to-school economic viability and...
TRANSCRIPT

OKLAHOMA FARM-TO-SCHOOL ECONOMIC
VIABILITY AND EFFICIENCY
By
Anh Ngoc Vo
Bachelor of Arts in Political Science and French
Saint Louis University
Saint Louis, Missouri
2003
Submitted to the Faculty of the Graduate College of the
Oklahoma State University in partial fulfillment of
the requirements for the Degree of
MASTER OF SCIENCE December, 2009

ii
OKLAHOMA FARM-TO-SCHOOL ECONOMIC
VIABILITY AND EFFICIENCY
Thesis Approved:
Dr. Rodney B. Holcomb Thesis Adviser
Dr. Francis M. Epplin
Dr. Larry D. Sanders
Dr. A. Gordon Emslie Dean of the Graduate College

iii
ACKNOWLEDGMENTS
“If we knew what it was we were doing, it would not be called research, would it?”
-Albert Einstein
The above statement was taped on the door of a former professor, Dr. Brian
Adam, during my first semesters at Oklahoma State University. When working long
hours in my office, I began to fully understand what Einstein meant and these words
provided motivation to continue with my thesis despite not knowing where it would lead
me.
The thesis process was challenging and would not have been possible without the
encouragement and assistance of many. Dr. Holcomb, my advisor, provided funding and
was consistently available for questions yet encouraged my independence. Dr. Epplin and
Dr. Sanders, both committee members, offered insight to my research. Dr. Lusk, a
professor, explained statistical unknowns.
Chris Kirby, the Oklahoma Farm-To-School Coordinator, served as an invaluable
source of information and support. Those who took part in all the survey processes for
my thesis should be mentioned, for their participation was voluntary.
All of my friends within the department and elsewhere who supported me during
my graduate degree deserve merit. Finally, I would like to thank my family for their love
and support. My father, Vien, and brothers, Quoc and Andy, all provided encouragement
during my thesis process. My mother, Diep, was always aware of my abilities.

iv
TABLE OF CONTENTS
I. INTRODUCTION................................................................................................. 1
FTS in the United States ......................................................................................... 2 FTS in Oklahoma .................................................................................................... 4 Why FTS? ............................................................................................................... 7 Problem statement ................................................................................................. 10 Objectives ............................................................................................................. 12 Thesis overview .................................................................................................... 12
II. LITERATURE REVIEW .................................................................................. 14
Program participation ............................................................................................ 14 Transportation costs .............................................................................................. 17
III. METHODS AND PROCEDURES .................................................................... 20
Data collection ...................................................................................................... 20 Program participation - Logistic model ................................................................ 23
Maximum likelihood estimation .................................................................... 28 Contingency tables and chi-square tests ........................................................ 29
IV. DATA SUMMARY ............................................................................................. 32
V. RESULTS ............................................................................................................ 43
Program participation ............................................................................................ 43 Transportation costs .............................................................................................. 45
VI. CONCLUSIONS ................................................................................................. 53
REFERENCES ................................................................................................................ 56
APPENDICES ................................................................................................................. 63
Appendix I: Child Nutrition in Oklahoma Survey ............................................... 64 Appendix II: Oklahoma Distributor Questionnaire ............................................. 70 Appendix III: Farmer Questionnaire ..................................................................... 72 Appendix IV: Farm-To-School Distribution Cost Template ............................... 74 Appendix V: SAS Code ....................................................................................... 79

v
LIST OF TABLES
Table Page
Table III-1. Description of categorical variables used in logit model ........................28
Table III-2. Description of categorical variables used for chi-square test .................31
Table IV-1. District size and number of students served according to district size ..........................................................................................................32
Table IV-2. Breakfast and summer feeding programs and campus policy according to FTS participation ................................................................33
Table IV-3. Free and reduced meals received according to district size ....................34
Table IV-4. Type of FTS program participation ........................................................35
Table IV-5. Distributors for fresh produce and all items ...........................................36
Table IV-6. Produce delivery frequency according to FTS participation ..................37
Table IV-7. Fresh produce expenditure and percentage of fruits and vegetables precut and bagged ...................................................................................38
Table IV-8. Beneficiaries and barriers to FTS ...........................................................39
Table IV-9. Factors influencing FTS participation ....................................................41
Table V-1. Chi-square statistic of FTS participation and independent variables ......43
Table V-2. Logit model results with FTS participation as the dependent variable ....................................................................................................44
Table V-3. Change in probability of FTS participation with arbitrary changes .......45

vi
LIST OF FIGURES
Figure I-1. Map of FTS programs in the United States ..............................................4
Figure I-2. Map of FTS programs in Oklahoma .........................................................7
Figure V-1. Hypothetical per unit cost of different delivery methods for seedless watermelon ................................................................................50
Figure V-2. Hypothetical farm gate margin for different delivery methods for seedless watermelon ................................................................................51

vii
ABSTRACT
Farm-to-School (FTS), a school food program encouraging marketing and
consumption of locally grown fruits and vegetables, began a decade ago and has since
gained national recognition. The nascent food program has several difficulties with its
implementation. Two particular issues addressed in this thesis are program adoption and
distribution of FTS commodities. This research serves as a tool to assist food service
personnel and policy makers in finding school systems likely to adopt the program and
determining an efficient distribution method.
Addressing the first issue, data from a survey sent to Oklahoma school districts
are analyzed using a logistic model, predicting probability of program participation
according to school district characteristics. Example characteristics considered in the
logit model are district size, food budgets, food distributors, campus policy, and
percentage of free and reduced meals available. As district size and food budget allocated
to fresh fruits and vegetables increases, so does probability of program participation.
Distributors used for produce is also linked to program adoption.
Addressing the second issue, a transportation cost template was created to
calculate operation cost per mile, operation cost per trip, distribution cost per unit, and
the farm gate margin1
1 Farm gate margin represents the net profit for the producer at the farm.
. This template along with the results of the logit model provides
information for food service personnel, farmers, and policy makers interested in FTS
viii
programs. This research can also serve as a tool to evaluate past, current, and future FTS
programs nationwide.
Key words: Farm-to-School, locally grown food, logistic model, program participation,
distribution systems, and transportation cost

1
I.
CHAPTER I
INTRODUCTION
Urban sprawl is an issue of rising concern to agriculture. The United States
Department of Agriculture (USDA) reports that between 1992 and 2001, an average of
2.2 million acres of farmland is converted to urban uses (USDA-ERS, 2006). In addition,
the prevalence rate of obesity for children has increased in the past 30 years (Centers for
Disease Control and Prevention, 2006). These two seemingly unrelated problems lie at
the heart of the Farm-To-School (FTS) program. FTS was established to connect schools
with local farms allowing school food service directors to purchase produce from local
farmers. The program aims to reduce childhood obesity and diabetes by increasing the
number of fresh fruits and vegetables in school meals; thus improving child nutrition
while decreasing calorie intake. At the same time, FTS helps farmers by promoting the
consumption of local produce and expanding market opportunities available to them. This
thesis aims to find ways for FTS to be more efficient in terms of program adoption and
distribution methods.
Local food can be defined in many ways. According to Zepeda and Li (2006),
there is no standard definition for what constitutes food as local. In terms of distance,
food can be considered local if it is grown or produced within a 10-mile radius or a 100-
mile radius. In terms of political boundaries, consumers generally define the term as food

2
grown within a county, neighboring counties, or within a state (Wilkins et al., 1996;
Harris et al., 2000). For the purposes of this research, the term local food refers to food
produced within a state, more specifically, Oklahoma.
Oklahomans have a greater number of severe health issues than the national
average. In fact, Oklahoma is ranked second nationally in deaths due to cardiovascular
disease. Since 1990, the prevalence of obesity increased by 148% (United Health
Foundation, 2008). In addition to health concerns, FTS programs were implemented in
Oklahoma to assist farmers with finding alternative markets. In 2002, 56% of Oklahoma
farms lost an average of $9,878 (Kerr Center, 2006.) In addition, the average farm size in
Oklahoma has decreased from 480 acres to 404 acres from 1992 to 2002 (Kerr Center,
2006).
FTS in the United States
FTS programs began more than a decade ago and have since gained national
recognition. In 1996-1997, FTS was initiated as a pilot project in California (Santa
Monica Malibu Unified School District and the Edible Schoolyard, Berkley) and in
Florida (New North Florida Marketing Cooperative) (National FTS Network, 2009). In
Santa Monica, the pilot project included a farmers’ market salad bar, which was launched
at an elementary school. Similar salad bars began appearing in schools throughout the
district. In Gadsden County, Florida, the New North Florida Cooperative began selling
locally grown produce to schools. The awareness of these and other nascent programs
began to build momentum during this time.

3
In 2000, USDA’s Initiative for Future Agricultural Food Systems supported the
establishment of the National FTS Program, serving as a catalyst for program
development, research, and policy (USDA-CSREES, 2008). The following year, the
USDA Agricultural Marketing Service organized numerous FTS workshops nationwide.
In 2003, the Farm-to-Cafeteria Projects Act was proposed in a bill submitted to the House
and Senate, but did not receive a sufficient number of votes in congress and was not
enacted. The purpose of this act was to improve access to local foods in schools and
institutions (Library of Congress, 2003). The FTS program, however, was successfully
enacted as a provision of the Farm Bill. The 2002 and 2008 Farm Bills included a section
promoting the purchase of locally produced foods (USDA-ERS, 2008). Institutions
receiving funding under the Child Nutrition Act of 1966 are encouraged to purchase
unprocessed agricultural products, both locally grown and locally raised, to the maximum
extent practicable and appropriate (USDA-ERS, 2008). In 2009, according to the
National FTS Network (2009), as shown in Figure I-1, FTS exists in 41 states with an
estimated 2,051 programs involving approximately 8,943 schools and 2,065 school
districts.

4
Figure I-1. Map of FTS programs in the United States
FTS in Oklahoma
Oklahoma’s FTS program was started in a similar fashion to the programs in
California and Florida and was lead by a pilot project. Prior to the pilot project, The
Oklahoma Farm-to-School Report was published by the Oklahoma Food Policy Council
in conjunction with the Kerr Center for Sustainable Agriculture, the Oklahoma
Department of Agriculture, Food, and Forestry (ODAFF), and the USDA Risk
Management Agency. The report contains reasons for Oklahoma FTS programs and
results from a survey disseminated to food service directors of public institutions. The
three main reasons for FTS programs highlighted in the report are to revitalize the

5
Oklahoma farm economy, increase food security, and address the health of Oklahomans,
more particularly, children.
The first priority of the FTS program addresses the revitalization of the
Oklahoma farm economy due to several existing concerns. The number of small and
medium sized farms is decreasing due to high input costs, low product prices, and poor
market access. There is concern that rural farmers are no longer able to depend upon
agriculture for their livelihood. Poverty rates in non-metro Oklahoma (17.5%) are
significantly higher than in metropolitan areas (12.9%) (Oklahoma Food Policy Council,
2003). FTS programs have the potential to increase market opportunities for small and
medium sized farms.
The Oklahoma Commissioner of Agriculture emphasized the importance of food
security in communities, which is the second point that FTS was set up to address
(Oklahoma Food Policy Council, 2003). The terrorist attacks on September 11, 2001
caused concern for national security including security of food supply. In the U.S., a fresh
food item is transported an average of 1,500 to 2,500 miles (Oklahoma Food Policy
Council, 2003). There is concern that due to this long distance, disruption to food
supplies is more likely. Through FTS programs, communities are less dependent on
foreign countries for food; therefore, concerns of food shortages during times of global
political unrest are reduced.
The third reason for FTS involves the overall health of Oklahomans. Oklahoma
has higher rates of death due to chronic diseases when compared to the rest of the nation.
Less than 50% of Oklahomans meet the recommended daily allowance for key nutrients,
vegetable, grain, fruit, meat, and dairy servings (Oklahoma Food Policy Council, 2003).

6
Due to these facts, FTS seems to be a viable solution to addressing health issues. In
Oklahoma, 61% of students participate in school a lunch program, which makes schools
an ideal environment to impact children’s health. It is also believed that good dietary
habits learned at an early age will continually be practiced in adulthood.
The results of the survey reported in The Oklahoma Farm-to-School Report are
encouraging. According to the Oklahoma Food Policy Council (2003), if price and
quality were competitive and local sources were available, 68% of the institutions would
like to purchase locally produced foods. The food council also reveals that large school
systems (school districts with over 1,500 students) were least likely to make local
purchases (83%), whereas medium (districts with 300 to 1,500 students) and small school
systems (districts with less than 300 students) were slightly more likely to do so, with
72% and 74%, respectively.
As a result of positive feedback from the report, FTS began as a pilot program in
2004 with assistance from the Oklahoma Food Policy Council. This pilot program
consisted of distributing seedless watermelons grown near Hinton, Oklahoma to 144
schools in 6 districts. In 2006, the Oklahoma State Legislature passed the Oklahoma
Farm to School Program Act in order to provide schools with minimally processed farm
commodities grown in Oklahoma (Oklahoma Legislature, 2006). The act also encourages
activities integrating nutrition and agriculture in school curriculum. To date, there are 59
Oklahoma school districts that have participated in a FTS program (see estimated map in
Figure I-2).

7
Figure I-2. Map of FTS programs in Oklahoma
Why FTS?
There are various reasons why consumers and producers participate in FTS. For
FTS, consumers consist of food service directors, communities, parents, and children;
whereas, producers are the farmers. Some of the motivations behind FTS participation are
shared among producers and consumers. However, the basic premise behind FTS
participation for each entity is inherently different.
FTS research shows that food service directors participate in FTS programs to:
support the local economy (Izumi et al., 2006; Oklahoma Food Policy Council, 2003;
Vogt and Kaiser, 2006), have access to a fresher product (Izumi et al., 2006; Oklahoma
Food Policy Council, 2003; Vogt and Kaiser, 2006), and increase fruit and vegetable
consumption among children (Izumi, Wright, and Hamm, 2009; Joshi and Azuma, 2009).

8
Communities are willing to participate in FTS programs because they provide fresh food
from known sources to consumers (Bellows, Dufour, and Bachmann, 2003; Sanger and
Zenz, 2004). There are also beliefs that local farms have produce with superior taste and
quality (Bellows, Dufour, and Bachmann, 2003). The National FTS Network sprouted
from the desire to support community-based food systems, strengthen family farms, and
improve student health by reducing childhood obesity (Center for Food and Justice,
2009.) FTS, unlike other school-based programs, involves parents, gardeners, farmers,
and community members. FTS gives food service directors and community members the
opportunity to become actively involved in schoolchildren’s health and have a positive
outlook towards school food programs.
For the producers, FTS is a program that gives them an additional market outlet
where geographic proximity limits competition. Currently, much of the research and
interviews with farmers who participate in FTS show that FTS accounts for only a small
fraction of business for the farmers; however, many farmers express the desire to
participate and feel FTS could become a more profitable program in the future. Farmers
typically report FTS programs contribute approximately 5-10% of their income (Joshi
and Azuma, 2009). According to a study in Vermont, all farmers involved in the
Burlington School Food Project enjoy having the opportunity to educated students about
their farms and the potential FTS provided for direct marketing opportunities (Schmidt
and Kolodinsky, 2006). A study of 6 California farmers reported profits and quantities
related to FTS were too small to contribute to an overall profit margin; nevertheless,
farmers want to nurture the program for its potential benefits (Joshi and Azuma, 2009).
These sentiments are shared by the single largest producer participating in the Oklahoma

9
FTS program (Hughes, Kirby, Holcomb, 2009). Like food service directors and
communities, the farmers consider FTS as a program that is in line with their own values
and FTS is a program that creates synergy among farmers, school personnel, children,
and other community members (Ohmart, 2002).
FTS is a program that allows local farmers to market their goods directly or
“almost directly” to schools. Under usual circumstances, small-sized, local farms would
not be able to sell their products to schools in this manner. Small-sized, local farms do
not have the opportunity to take advantage of economies of scale and cannot compete
with industrialized farms. Small-scale farms have typically been perceived as inefficient
since they lack the ability to cut costs with economies of scale (Buitenhuys et al., 1983).
In addition, school cafeterias traditionally operate with minimal budgets. Historically,
food service professional in schools are known to operate under extremely tight time and
budget constraints (Izumi, Wright, and Hamm, 2009). Participation in FTS programs can
incur additional cafeteria costs and requires more time from food service professionals to
coordinate food orders.
Institutions such as schools with minimal budgets can now participate in FTS due
to a couple of reasons. One reason is that political influence from advocates for localism
has penetrated the school food system. Orden and Paarlberg (2001) predict that process-
defined farmers and like-minded consumer activists would try to persuade government to
regulate agricultural products according to production processes, such as locally grown
foods. This form of persuasion in government to enact policy to gain economic benefit is
a form of rent-seeking. A more formal definition of rent-seeking is to influence
governments to acquire or resist wealth transfers (Tullock, 1967). Examples of rent-

10
seeking are monopolies, tariffs, and other forms of government regulation. Rent-seeking
incurs social costs for two reasons—loss of consumer and producer surplus from
monopolization and resources spent in the pursuit of economic rents, which result in a
loss to society because the expended resources do not create additional social product
(Tollison, 1982). Due to rent-seeking activities, small-scale farms are able to thrive.
A second reason why FTS is a viable program is that farmers are able to market a
unique product—local foods. Farmers with local foods are able to pursue a formerly
untapped market opportunity. FTS provides an additional market outlet for farmers and
gives greater potential for profitability. With government and community support for
programs such as FTS, small and medium sized farms, despite their inability to take
advantage of economies of size, are able to compete with larger farms. It is imperative to
acknowledge that FTS, like many government programs, is not solely based on supply
and demand and that there are self-interests groups seeking profit. These existing
inefficiencies in food systems reinforce the necessity of finding ways for programs such
as FTS to become more efficient.
Problem statement
Numerous issues pertain to FTS, such as operation costs, supply, program
adoption, and distribution. This study is limited to the issues of program adoption and
distribution, more specifically, the probability of FTS participation and distribution costs.
Over 2000 FTS programs exist in the U.S. (National FTS Network, 2009). Many FTS
programs, past and present, have been implemented, but not all of the programs are
successful. FTS literature exists on program costs and benefits in addition to how to
11
implement the programs. However, there is no literature on where to implement FTS to
ensure program success. The same scenario exists for issues related to distribution. With
distribution reported as one of the main barriers to FTS adoption, (Berkenkamp, 2006;
Vogt and Kaiser, 2006; and Zajfen, 2008) research on the matter is vital to a successful
program.
The distribution of FTS commodities can be carried out in various ways. For this
research, when directors of FTS programs in various states were surveyed as to what
distribution methods are most salient within their state, many of them responded that the
distribution of FTS commodities was piecemeal and varied throughout their state. A
paper by Kalb and Barron (2005) contains four different distribution models for FTS
commodities each with a farmer, cooperative, or wholesaler delivering food, in addition
to the option of school personnel picking up produce from a farmers’ market. Various
vehicles, distances, distribution companies, and third party entities can play a role in
distribution of FTS. Organizing the myriad of options available when distributing FTS
commodities will help identify a least cost distribution system applicable to Oklahoma.
For this thesis, three different entities are separately considered responsible for
distribution, each with a possibility of backhauling produce. The entities considered to
carry out delivery are farmers, where the farmer is responsible for negotiation and
delivery; warehouses, where a warehouse or large distributor takes ownership of the
produce and negotiates pricing and delivery; and intermediaries, such as another
producer, cooperative, broker, or small contract distributor. The three different delivery
methods will be referred to as direct delivery (DD), warehouse delivery (WD), and

12
intermediary delivery (ID), respectively. Determining which of the three options for
distribution is least costly will allow for FTS programs in Oklahoma to be cost efficient.
Due to budget constraints, economic uncertainties, and the fact that FTS is
gaining more national recognition, information regarding program adoption and
distribution will be useful to food and agricultural policy makers, school food service
directors, and producers and consumers interested in FTS.
Objectives
The objective of this research is to address issues concerning FTS program
adoption and distribution.
Specifically, the aim is:
(1) To determine what school district characteristics are associated with FTS
participation; and
(2) To identify a least cost method to distribute produce to school districts.
Thesis overview
The remaining chapters of this thesis address program adoption and
transportation. These chapters outline the motivation for the thesis, methodologies
used, and the results and conclusions of this study. Chapter II cites the existing
literature written on school meal and FTS participation and transportation costs.
These cited works lay a foundation for the research and identify areas lacking
sufficient examination. Chapter III describes the methods and procedures used for
explaining the survey design, the statistical methods for identification of school
13
district characteristics associated with FTS participation, and the cost template
created to determine a least cost distribution method for FTS. Chapter IV presents
the findings and discussion of the results. Finally, Chapter V examines how the
research has addressed the objectives, followed by a summary of results, policy
implications due to these results, and suggestions for further research.

14
II.
CHAPTER II
LITERATURE REVIEW
The literature review analyzes current research related to FTS. Areas of research
included in this literature review cover food program participation and transportation.
Program participation
Govindasamy et al. (1998) use logistical models to evaluate the effectiveness of
the Jersey Fresh Program, a state sponsored agricultural program created to increase
buying of local produce. The purposes of the models are to predict consumer awareness
and willingness to buy Jersey Fresh produce. Produce origin is not statistically significant
in the models described in the paper. The prominent demographic characteristic of
consumers who are more likely to have bought Jersey Fresh produce are those who were
female, 35 years or age, and have a high school or higher education. Awareness of Jersey
Fresh is high among consumers who frequented direct marketing facilities. Quality is
considered the most important factor by both consumers who have bought Jersey Fresh
produce and those who were willing to buy Jersey Fresh produce (Govindasamy et al.,
1998).
Many researchers find relationships between participation in school lunch and
breakfast programs and school characteristics. Maurer (1984) uses national data to

15
estimate the effects various school and program characteristics have on lunch and
breakfast programs. Variables listed under school and program characteristics are
breakfast program availability, open campus policy, à la carte service availability,
vending machine availability, number of meal choices, and offer verses served meals.
Maurer finds students from low-income families are more likely to participate in
breakfast and lunch programs than those from families with high income. In addition,
students tend to participate in the programs regularly (4 or 5 days a week) or not at all.
Results also show students are slightly more likely to participate in lunch programs at
schools with breakfast programs available.
Research from Ham, Hiemstra, and Yoon (2002) describes an ordinary least
squares approach to estimate participation of school lunch programs in Indiana. Two
dependent variables are examined: total average daily participation rate of all students
(Total ADP) and paid average daily participation rate of paid meals (Paid ADP). Total
ADP differs from Paid ADP, in that Total ADP includes free and reduced-price meals in
addition to those paid. Participation is measured by the number of meals served. The
authors find the percentage of students eligible for reduced lunch and free lunch were
both significant and positive predictors for Total ADP. However, for Paid ADP, reduced
lunch and free lunch were both statistically significant yet showed positive and negative
relationships, respectively. This means as the number of students eligible for free lunch
increases, the amount of Paid ADP decreases. Larger schools have higher school lunch
participation rates and schools with open campus policies have lower rates (Ham,
Hiemstra, and Yoon 2002).

16
Gleason (1995) uses a probit model to estimate participation rates in the
National School Lunch Program (NSLP) and the School Breakfast Program (SBP).
Three main questions are addressed: Who is participating in the NLSP and SBP? What
policy changes at the school, district, or federal levels could directly influence the
number or type of participants? Would policy changes designed to improve nutritional
quality of school meals adversely affect program participation as a whole? Free and
reduced meal certification status of students is strongly related to NSLP participation.
The author finds that, “more than three-fourths of certified students eat a school lunch
on a given day, compared with fewer than half who pay the full price” (Gleason,
1995, 215).
Grainger, Senauer, and Runge (2005) use logistic models to analyze student
receptiveness to health innovations in a high school cafeteria in Minneapolis. When à la
carte and full meals are analyzed together, students clearly make healthier food choices,
described as meals with less trans fats, low in sugar, and high in fiber. Minorities, with
the exception of Asians, make less healthy lunch choices (Grainger, Senauer, and
Runge, 2005).
Murray (2005) reports descriptive statistics on the characteristics of colleges
participating in FTS. College FTS programs are concentrated in Northeast, Midwest, and
West Coast areas. Sixty-five percent of the programs are private, 35% are public, and
41% are self-operated whereas 59% are contract-managed food services. About 20% of
the programs use external funding sources. The most frequently cited program barrier is
coordinating purchases and delivery of commodities.

17
Transportation costs
The number of studies conducted on the distribution of FTS commodities is
sparse. Kalb and Barron (2005) acknowledge many issues must be considered when
determining a means to transport farm commodities to schools. Some of the issues are
school district size, cafeteria storage capacity, existence of farmer cooperatives or
networks, volume and type of commodity delivered, and delivery capacity. The
authors describe four distribution methods. These FTS distribution methods include
obtaining local commodities from individual farmers, cooperatives, wholesalers,
farmers’ markets. Kalb and Barron explain advantages and disadvantages with each
method; however, this paper does not address the associated cost with these methods.
Zajfen (2008) highlights current distribution models and makes suggestions for
increased distribution. The distribution models are particular to the Greater Los
Angeles region and many of them are similar to those mentioned by Kalb and Barron.
These distribution models include large produce firms, smaller produce firms,
shipping firms, farmer direct, farmers’ markets, CSAs, and firms selling ready-made
school lunches. The publication, however, does not compare the costs of each
distribution method.
There are researchers that analyze the specific costs associated with alternative
transportation methods; two examples are Berwick and Dooley (1997) and Barnes and
Langworthy (2003). Computer programs exist to calculate transportation costs,
conveniently allowing modification in order to adhere to specific scenarios and
conditions.

18
Berwick and Dooley (1997) provide a spreadsheet simulation model to
estimate truck costs for different truck configurations, trailer types, and trip
movements. The spreadsheet allows for owners and operators to benchmark
performance against competitors and industry standards. Berwick and Dooley (1997)
estimate cost per mile, cost per 100 weight, cost per ton-mile, cost per hour, and cost
per trip along with sensitivity analyses. The authors of the study find factors
influencing cost of owner/operator costs to include annual miles, trip distance, and
truck speed or fuel efficiency. Decreasing annual miles and waiting for additional
loads may prove to be more profitable than having fewer loads (Berwick and Dooley,
1997). Wait time is another important contributor to costs. The shorter the trip, the
larger an impact the loading and unloading time has on costs. Fuel efficiency is also a
major factor in costs. Revenue may be higher by driving 55 miles per hour instead of
70 miles per hour. Nevertheless, the increased revenue from more business may offset
higher fuel costs.
Barnes and Langworthy (2003) describe a methodology and spreadsheet model
for calculating the costs of operating cars and trucks with varying road conditions.
The study serves as a cost-benefit analysis of highway projects and includes only
variable costs. Information on trucking costs tends to focus on the full cost of taking a
load from point A to point B, which includes many costs that are fixed and would be
incurred whether the trip was taken or not (Barnes and Langworthy, 2003). The
authors find that city driving conditions with frequent stops increases the baseline
cost of highway driving on smooth pavement by 9.5 cent for trucks. Extreme rough

19
pavement increases the baseline cost by 5.5 cents for trucks. These studies provide a
basis of information for the template used for FTS distribution.
Numerous researchers have analyzed participation in various food programs
using logit models and have developed templates to calculate transportation costs, but
none of these studies has applied these tools to FTS. Therefore, this thesis aims to
address a fundamental lack of information and is necessary to analyze the effects of
district characteristics on FTS program participation and determine least cost
distribution methods for FTS commodities. Reliable cost estimates will help
determine an efficient distribution alternative and be useful to schools, farmers, and
all third-party entities. In addition, policy makers can use the information gathered
from the logit model and the cost template when determining whether to implement a
FTS program.

20
III.
CHAPTER III
METHODS AND PROCEDURES
Data collection
In order to fulfill the thesis objective, a survey of Oklahoma school districts, titled
the Oklahoma Child Nutrition Survey (see Appendix I), was conducted under the
auspices of the Robert M. Kerr Food and Agricultural Products Center at Oklahoma State
University. Districts participating in FTS and those not participating in FTS are referred
to as FTS participants and non-FTS participants, respectively. The following information
was obtained through the surveys: school district size, current suppliers of fruits and
vegetables to the schools, the portion of the schools’ food budget allocated for fruits and
vegetables, distributors utilized by the schools when placing food orders, and produce
preferences. With assistance from the Oklahoma Department of Agriculture, Food, and
Forestry (ODAFF) FTS coordinator and the Coordinator of Child Nutrition for the
Stillwater Independent School District, the Child Nutrition in Oklahoma Survey was
created with a total of 24 questions.
Prior to sending the survey, pre-tests were conducted with surveys emailed to
various food service directors to ensure the questions were perceived correctly and the
answers corresponded with the information needed for the research. After responses from
the pre-tests were collected, a web-based survey was sent to Oklahoma school districts

21
participating in FTS via e-mail a third party survey company. This method of conducting
the surveys was the most expedient option for the respondents and the researcher in
comparison to telephone, in-person, or mailed surveys.
The sample frame consists of food service directors, child nutritionists,
superintendents, and other school personnel from Oklahoma school districts. Contact
information was obtained from the State Department of Education (SDE) which included
names of school personnel, phone numbers, emails, and addresses. Data on the districts
participating in FTS was also provided by the ODAFF.
The survey was sent out in August 2008 to over 800 school personnel in
Oklahoma. Although there are only 535 school districts in Oklahoma, the contact list
provided by the SDE had more than one contact name listed for the majority of the
districts. Many of the emails were either incorrect or outdated causing for many of the
emails to be returned to the sender. In some cases, the security network of certain districts
would not allow emails to be received from unknown parties, also resulting in returned
emails. The emails were sent out a total of three times over a period of three months to
remind the recipients of the survey. The response rates to the emailed survey were 30%
for the first send, an additional 17% from the second email, and finally another 10% from
the third email attempt. Some recipients requested that a survey to be sent in paper form
via mail. Less than 1% of the responses were obtained from mailed surveys. Overall,
there was approximately a 57% response rate to the survey. Because there were multiple
responses for some districts, duplicate surveys were removed from the sample. In
addition, some responses were erroneous and were also removed resulting in a final 52%
response rate of useable surveys.

22
Although conducting the survey via email may have saved time and money, many
of the responses were omitted leaving surveys incomplete. In an attempt to have more
complete information on the districts, additional information was retrieved from the SDE
website including the number of students enrolled in a district (Question 2 in the Child
Nutrition in Oklahoma Survey) and the percentage of free and reduced meals received by
the district (Question 6). Because the question regarding district size captures only ranges
and not exact numbers, the information on district size was then replaced with the exact
population sizes from the SDE. Since ODAFF is aware of the current and past
participants of FTS in Oklahoma, that information was included for the respondents who
did not state whether their district has participated in FTS (question #8).
The question regarding the percentage of free and reduced priced meals refers to
the amount the district receives and not the percentage of students eligible, therefore,
values used to replace missing values may not be completely accurate. Finally, the
information on the total expenditure on food (question #14) was also omitted in some of
the surveys and in attempt to retrieve this information, means according to district size
were calculated and then replaced for missing values. After these efforts to obtain
complete sets of data, a total of 276 observations were used for analysis.
A survey for distributors, titled, Oklahoma Food Distributor Survey (see
Appendix II), was also conducted during this research. Thirteen food distributors were
included in this survey process. The list of distributors was provided by the FTS
coordinator from ODAFF. The survey includes questions on fee structures, delivery truck
type, and fees incurred when doing business with Oklahoma farmers. The survey was
sent to food distributors via email. The response rate of the survey was 69%.

23
The second portion of the research objective, determining a least cost method to
distribute FTS commodities, is fulfilled by creating a cost template. Some of the
information used for the cost template was obtained from an interview with an Oklahoma
Farmer, Kevin Hughes. Mr. Hughes has participated in FTS since the FTS pilot program
in 2004-2005, when he supplied seedless watermelons to schools during the year. Later,
Mr. Hughes continued to participate in FTS through a Statewide FTS program and is
continually providing seedless watermelons. The questions Mr. Hughes addresses (see
Appendix III) involve information about his FTS participation, costs, and distribution
methods used by the farmer. Though the values in the template take into account
information on one farmer, the models and methods of calculating distribution costs can
be applied to various other farms and produce types.
Program participation - Logistic model
An alternative to an OLS regression is needed when estimating a dichotomous
independent variable because two standard assumptions of linear regression do not hold:
homoscedasticity of error terms and error terms are normally distributed about the mean.
Estimation techniques such as logistic modeling address these issues.
Logistic and probit models are often used for estimating dichotomous variables;
however, the logit is easier to compute and provides odds ratios useful for interpretation
of coefficients. The utility function of the school districts when choosing whether to
participate in FTS is a random utility function, which is shown in eq. III-1,
(III-1) Ui j=Vij+ε i j

24
where j represents the districts and i is the choice option of participating (FTS) or not
participating (NFTS) in the program. Uij is the district’s utility defined by a deterministic
(Vij) and a stochastic (εij) component. Assuming Vij is linear in parameters, the utility
function may be expressed as eq. III-2,
(III-2)
Xkij represents characteristic k (k=1,…, 6) of the jth district for the ith choice option. βk is
the coefficient associated with Xkij. The district utility is not observable but the choice to
participate or not to participate in FTS is. A district chooses to participate in the program
when the utility of participating is greater than the utility of not participating; thus, the
probability for a district to participate in FTS program can be described by eq. III-3,
assuming the distribution of the error terms (stochastic component) is independent and
identical:
(III-3) Prob (FTS ) =P(UF T S j>UN F T S j )
A binary logistic model could be used to fit the regression, as show in eq. III-4
and III-5. Let NFTS be the reference category where the parameter estimates are
normalized to zero. Let Pj denote the probability that a jth district chooses to participate in
FTS. The probability for a district to participate in FTS program can be expressed in eq.
III-4,
(III-4)
The empirical model used for the analysis is seen in eq.III-5 and III-6,

25
(III-5)
further,
(III-6)
Equation III-6 represents the deterministic portion of the utility function, which is
expressed as the sum product of the parameters of the independent variables listed.
Because interpretation of the coefficients in logistic models are not intuitive,
alternative means of understanding coefficients are used. The marginal effect is estimated
using eq. III-7,
(III-7)
where is a particular explanatory variable and βk is the coefficient associated with Xkj.
Applying this equation, if the base or reference equation contains Xkj values equal to their
means, then the change in probability can be observed for a 1-unit or a 1% increase in Xkj.
The change in probability depends upon the logit regression coefficients and the value of
the probabilities. Marginal effects are used to measure changes in probability of
participation in the FTS program due to given changes in the independent or explanatory
variables.
In this study, 12 variables were analyzed before the final 6 were determined for
the logistic model. Here, a description of the 12 variables and discussion on how the final
variables were determined is presented. In the logit model, DISTRICT_SIZE is a
continuous variable representing the size of the district according to student population.

26
In Oklahoma, district sizes can range from approximately 40 students to 40,000 students
(State Department of Education, 2008).
School food programs can consist of the National School Lunch Program (NSLP),
the School Breakfast Program (SBP), and summer feeding programs. BREAKFAST is
treated as a continuous variable determined by the number of students participating in
breakfast programs. SUMMER_FEED is a binary variable associated with whether a
school district has a summer feeding program. CAMPUS_POLICY is a binary variable
indicating whether the districts have an open campus policy, allowing students to leave
campus during lunch hours, or a closed campus policy.
Cafeteria management practices differ from district to district.
DELIVERY_FREQUENCY, a continuous variable, represents the number of deliveries for
produce received within a month. PRE_CUT_BAGGED is a continuous variable
indicating the percentage of produce received that is pre-cut and bagged.
DISTRIBUTOR_ALL_ITEMS, a binary variable, represents the type of food distributor
used by school districts when ordering all food items including any form of fruits and
vegetables. In Oklahoma, there are approximately 15 main food distributors or
wholesalers who commonly provide food items for schools. Small, less common
distributors and grocery stores were categorized as one group, and the large, more
common distributors were categorized in another. The same classification technique was
applied to distributors of only fresh fruits and vegetables—making
DISTRIBUTOR_PRODUCE a binary variable as well. The impact of grocery stores used
for school food orders on FTS participation was also determined. In this case, grocery
stores were coded separately from all other distributors, where grocery stores were coded

27
as 1 and all other distributors were coded as 0. GROCERY_ALL represents the grocery
stores used for all food items including any form of fruits and vegetables.
GROCERY_PRODUCE represents the grocery stores used for only fresh fruits and
vegetables.
Cafeteria budgets are limited and play an important role in determining food
program participation and purchasing. Schools are reimbursed for free and reduced meals
offered to students and the assistance available is dependent upon income eligibility of
the student (Spark, 2007). The variable associated with the percentage of free and
reduced meals offered is a continuous variable labeled, FREE_REDUCE. The variable,
BUDGET, is continuous and refers to the percentage of cafeteria food budgets allocated
to produce alone.
All of the mentioned variables were tested against the chi-square statistic in
relation to FTS participation. GROCERY_PRODUCE and GROCERY_ALL were not
statistically significant at the 5% level and were grouped with
DISTRIBUTOR_PRODUCE and DISTRIBUTOR_ALL, respectively, where they were
newly considered as small, less common distributors. A test for correlation between the
10 newly defined variables and FTS participation was conducted. Five variables were
statistically significant at the 5% level and two were significant at the 10% level. Next, a
correlation between the 7 explanatory variables was conducted. Two of the variables,
DISTRICT_SIZE and BREAKFAST were closely correlated. To avoid multicollinearity,
BREAKFAST was eliminated, leaving 6 variables to be estimated in the logistic model.
All the explanatory variables considered for this research are described in detail in
Table III-1.

28
Table III-1. Description of categorical variables used in logit model
Independent variables Coding
DISTRICT_SIZE (students) District size (continuous variable ranging from 0-40,000)
BREAKFAST Existing breakfast program (yes=1, no=0)
SUMMER_FEED Existing summer feeding program (yes=1, no=0)
CAMPUS_POLICY Campus policy during lunch hours (open=1, closed=0)
DELIVERY_FREQUENCY Frequency of produce delivery (1=once a month, 2=twice a month, 4=once a week, 8=twice a week)
PRE_CUT_BAGGED (percentage)
Amount of produce received pre-cut and bagged (continuous variable ranging from 10-100)
FREE_REDUCED (percentage) Student population receiving free and reduced meals (continuous variable ranging from 0-100)
BUDGET (percentage) Amount of cafeteria food budget allocated to fresh produce (continuous variable ranging from 0% to 70%)
DISTRIBUTOR_ALL Distributor used for all food items (less common, small distributor and grocery store=1, commonly used, large distributor=0)
DISTRIBUTOR_PRODUCE Distributor used for produce (less common, small distributor and grocery store=1, commonly used, large distributor=0)
GROCERY_ALL Distributor used for all food items (grocery store=1, all other distributors=0)
GROCERY_PRODUCE Distributor used for produce (grocery store=1, all other distributors=0)
Maximum likelihood estimation
There are many ways to estimate a logistic model, but maximum likelihood (ML)
estimation is most widely used. There are appealing properties associated with using the
ML approach. First, as the sample size increases, the probability of the estimates falling
within the range of some true value also increases. Second, due to asymptotic efficiency
of larger samples, the standard errors computed are as efficient (small) as those for any

29
other estimation model. Third, the sampling distribution of the estimates is normal in
large samples, meaning normal and chi-squared distributions are valid when calculating
confidence intervals and p-values. ML maximizes the probability of observing an
outcome given available parameters. This is accomplished by constructing a likelihood
function and maximization, which entails iterative successive approximations
(Allison, 1999).
Using Statistical Analysis Software to run a logistic model, the estimates
automatically predict the probability of obtaining the lowest possible value of the
dependent variable. In this study, the lowest value for y is 0, which is predicting the
likelihood of not participating in FTS. Otherwise, participating in FTS means y is 1. In
this case, the word “descending” will be added in the statistical code to predict the needed
outcome—the probability of participating in FTS.
The results of a logistic model give parameter estimates and hypotheses tests. To
test the overall model, the section, Testing Global Null Hypothesis: Beta=0, has three chi-
square statistics: likelihood ratio chi-square, score statistic, and Wald test statistic. There
is no reason to prefer either of these statistics, they will be generally quite close (Allison,
1999). For the FTS logistic model, the likelihood ratio, score statistic, and Wald score are
either all either equal to or less than .0005, so we reject the null hypothesis and conclude
at least one of the coefficients is not 0.
Contingency tables and chi-square tests
Two-way contingency tables also known as frequency tables, are used to classify
two qualitative variables, and can illustrate associations between variables. The data used

30
for these tables are discrete. Data observations are recorded as frequencies with
corresponding probabilities. To test if the results of a contingency table are not due to
chance, a chi-square test can be applied.
When frequency tables are large (with more than four cells), it is best to combine
or collapse cells. For example, a frequency table with the dependent variable, FTS
participation and the independent variable, delivery frequency, there are two possible
responses for FTS participation, and four for delivery frequency. The possible answers
for FTS participation are yes and no. In the Child Nutrition in Oklahoma survey, there are
four possible responses for a question on delivery frequency: twice a week, once a week,
twice a month, and once a month. It is possible to combine the categories with weekly
intervals into one group and those for the monthly intervals into another. Therefore,
delivery frequency would be divided into two groups instead of four where one group has
deliveries taking place at least once a week and the second group having deliveries twice
a month or less. This procedure was applied to all variables with more than two possible
responses, including the responses with continuous variables as answers. The newly
coded variables were then treated as binary variables. For a complete list of how the
variables were coded for the chi-square test, see Table III-2.

31
Table III-2. Description of categorical variables used for chi-square test
Independent variables Coding
DISTRICT_SIZE (students) District size ( 2,500 or more=1, less than 2,500=0)
BREAKFAST Existing breakfast program (yes=1, no=0)
CAMPUS_POLICY Campus policy during lunch hours (open=1, closed=0)
SUMMER_FEED Existing summer feeding program (yes=1, no=0)
DELIVERY_FREQUENCY Frequency of produce delivery (once a week or more=1, less than once a week=0)
PRE_CUT_BAGGED (percentage) Amount of produce received pre-cut and bagged (greater than 25=1, 25 or less=0)
DISTRIBUTOR_PRODUCE Distributor used for produce (less common, small distributor and grocery store=1, commonly used, large distributor=0)
DISTRIBUTOR_ALL Distributor used for all food items (less common, small distributor and grocery store=1, commonly used, large distributor=0)
FREE_REDUCED (percentage) Student population receiving free and reduced meals (greater than 50=1, 50 or less=0)
BUDGET (percentage) Amount of cafeteria food budget allocated to fresh produce (greater than 20=1, 20 or less=0)
GROCERY_PRODUCE Distributor used for produce (grocery store=1, all other distributors=0)
GROCERY_ALL Distributor used for all food items (grocery store=1, all other distributors=0)
Building the logit model and evaluating marginal probabilities will fulfill the first
portion of the objective in determining characteristics associated with FTS participation.
Addressed next is the second portion of the research objective, to identify a least cost
method to distribute FTS produce. To fulfill this objective, a transportation cost template
and cost curves were created and will be discussed.

32
IV.
CHAPTER IV
DATA SUMMARY
The results of the Child Nutrition in Oklahoma Survey are summarized and
discussed in a number of ways: aggregate responses, responses by district size, and
responses by FTS participation level.
Table IV-1. District size and number of students served according to district size
Number Question
2. Please classify the school district population under one of the following categoriesa:
District size < 500 500-1,000 1,000-
2,500 2,500-5,000
5,000-10,000
> 10,000
Number 153b 54 45 13 3 8 Percent 55%b 20% 16% 5% 1% 3% 3. On average, how many students does your district serve per day during
the school year?c
Range of number of students served < 500 500-1,000 1,000-
2,500 2,500-5,000
5,000-10,000
> 10,000
Number 179 50 27 7 4 6 Percent 66% 18% 10% 3% 1% 2% aN=276 b153 respondents (55%) reported a school district of 500 students or less. cN=273 District size refers to the number of students enrolled within each school district.
Table IV-1 illustrates the majority of the schools responding to Question 2 are of smaller
size (population of 500 students or less). Question 3 is pertinent because not all students

33
participate in school meal programs. Some students have the option of bringing a sack
lunch or buying food outside of the school lunch and breakfast program.
Table IV-2. Breakfast and summer feeding programs and campus policy according to FTS participation
Number Question
4. Do your schools participate in breakfast programs? If so, how many students do you serve per day with the breakfast program?a
No breakfast program Breakfast program Non-FTS participant Number 13b 231
Percent 5%b 95%
FTS participant Number 0 29
Percent 0% 100% 5. Do any of the schools within your district house a summer feeding
program?c
No summer feeding program
Summer feeding program
Non-FTS participant Number 183 62
Percent 75% 25%
FTS participant Number 16 13
Percent 55% 45%
7. Is your school district a closed campus or an open campus for high-school students during lunch hours?d
Closed campus policy Open campus policy Non-FTS participant Number 171 66
Percent 72% 28%
FTS participant Number 16 13 Percent 55% 45%
aN=273
bAmong non-FTS participants, 13 (5%) do not have a breakfast program cN=274 dN=266
Table IV-2 divides results into 2 categories—Non-FTS participant and FTS
participant. Table IV-2 illustrates all FTS participants have a breakfast program. Among
FTS participants alone, there is not a stark difference between districts with summer

34
feeding programs and those without (55% and 45%). Also among FTS participants, there
is not a large difference between districts with closed verses open campus policies (55%
and 45%). However, there is a larger difference among non-FTS participants in regards to
campus policy (72% and 28%).
Table IV-3. Free and reduced meals received according to district size
Number Question
6. What is the percentage of free and reduce breakfast and lunch programs your school district receives?a
District size
< 500
500-1,000
1,000-2,500
2,500-5,000
5,000-1,000 > 10,000
All districts
< 25% 1%b 4% 9% 0% 67% 14% 4%c
25% to 50% 17% 22% 27% 38% 0% 14% 20%
51% to 75% 48% 54% 56% 46% 33% 43% 50%
> 75% 34% 20% 9% 15% 0% 29% 26% aN=273 bOne percent of the respondents with district size of 500 students or less reported less than 25% of the students receive free and reduced meals. cAcross all district sizes, 4% reported less than 25% of the students receive free and reduced meals.
The amount of free and reduced lunch reflects the amount of reimbursement the
districts receive for the meals served to students. According to Table IV-3, only two
district sizes (500 to 1,000 and 1,000 to 2,500) receive the majority of free and reduced
lunch in the 51 to 75% range. All other district sizes receive varied percentages of free
and reduced meal reimbursements. Across all district sizes, 50% of the districts receive
reimbursements between 51 and 75 %.

35
Table IV-4. Type of FTS program participation
Number Question
8. Has your district participated in any of the following Farm-To-School Programs?a
Pilot program
Statewide program
Working with local farmers
None of these
Number 16b 28 29 218 Percent 6%b 10% 11% 79%
aN=276 bOf the 276 collected responses, 16 respondents (6%) participated in the FTS pilot program.
For Question 8, (Table IV-4) respondents were able to check multiple answers if
they had participated in more than one program. The majority of the responses fell under
“none of these.” Districts work more with local farmers independently and participate
less in all FTS related program, comparatively. This means FTS informally exists without
assistance from FTS programs.
Table IV-5 contains information on which distributors are used for produce and
non-produce items. The reason why Thomas Brothers is listed twice is there are two
distribution centers in Oklahoma and each serve different areas of Oklahoma. The list of
distributors is meant to encompass the most widely used distributors in Oklahoma. If
there is a food distributor not listed, the “other” option allows respondents to list the
name of the distributor.

36
Table IV-5. Distributors for fresh produce and all items
Number Question
11. From what distributor(s) does your school district receive food items including any form of fruits and vegetables?a
Small distributors 22%b
U.S. Foods 15% Sysco 11% Grocery Stores 11% Tankersley Food Company 6% Tom E. Boggs 6% Mid-America 5% Performance Food Group 5% Ben E. Keith 5% Vinyards 3% Buddy's Produce 3% Tulsa Fruits & Produce 3% Southwest Food Service 2% Thomas Brothers-Tulsa 1% Okie Produce 1% Frontier Produce 1% Thomas Brothers-OKC 0% 12. Regarding the list below, which distributor(s) provide(s) fresh fruits and
vegetables (i.e.: whole produce, cut, or bagged)?c
Small distributors 18% U.S. Foods 13% Sysco 12% Grocery Stores 11% Tankersley Food Company 9% Ben E. Keith 6% Tom E. Boggs 5% Mid-America 4% Vinyards 4% Performance Food Group 4% Buddy's Produce 4% Tulsa Fruits & Produce 4% Southwest Food Service 2% Thomas Brothers-Tulsa 2% Okie Produce 1% Frontier Produce 1% Thomas Brothers-OKC 0%
aN=261 bN=Across all districts, 22% buy all food items from small distributors. cN=257

37
The collected responses for both questions do not differ greatly among
respondents, meaning many of the districts use the same distributor for both fresh
produce and items other than fresh produce. Two categories along with two distribution
companies ranked highest in usage among school districts for both produce and non-fresh
items and are listed as small distributors, U.S. Foods, Sysco, and grocery stores.
Table IV-6. Produce delivery frequency according to FTS participation
Number Question
13. How frequently are fresh fruits and vegetables delivered to the school district?a
Delivery frequency
Once a month
Twice a month Once a week
Twice a week
Non-FTS participant Number 8b 12 178 33
Percent 3%b 5% 77% 14%
FTS participant Number 0 0 23 5
Percent 0% 0% 82% 18% aN=259 bAmong non-FTS participants, 8 (3%) have produce delivered once a month.
Table IV-6 shows most FTS participants (82%) and non-participants (77%) have
produce delivered once a week. Because fresh produce has a short shelf life, delivery
frequency is important to ensure that produce is fresh and of high quality. Because fresh
fruits and vegetables start to perish after a week, it is likely that the majority of the
districts have produce delivered once a week to maintain quality. In addition, refrigerated
and cool storage space is limited in many kitchens, which may not allow many districts to
store produce exceeding a week’s worth of consumption. Having produce delivered
weekly is possibly the most convenient and efficient option for schools.

38
None of the FTS participants has produce delivered once or twice a month.
Table IV-7. Fresh produce expenditure and percentage of fruits and vegetables precut and bagged
Number Question
16. On average, how much does the school district spend on fresh fruits and vegetables?a
Percentage
<5% 5% to 15% 16% to 25% 26% to 50% >50%
Non-FTS participant Number 85b 125 6 7 14
Percent 36%b 53% 3% 3% 6%
FTS participant Number 7 15 0 2 4
Percent 25% 54% 0% 7% 14%
17. What percentage of your fruits and vegetables are precut and bagged when received?c
Percentage
10% 25% 50% 75% 100%
Non-FTS participant Number 85 62 44 28 4
Percent 38% 28% 20% 13% 2%
FTS participant Number 7 12 2 7 0
Percent 25% 43% 7% 25% 0% aN=265 bAmong non-FTS participants, 85 (36%) allocate less than 5% of their food budget to produce. cN=251
According to Table IV-7, the majority of both participants and non-participants
allocate less than 15% of their food budget to produce. Among non-participants, as the
percentage of produce precut and bagged increases from 10 to 100%, the percentage of
produce received decreases.
Question 17 is pertinent to FTS because the majority of the FTS products are
received whole and unpackaged. According to the Oklahoma Department of Health

39
guidelines, cutting or processing produce in any form would be considered value-added
processing. Businesses with value-added products are considered food processors and
must meet specific food handling regulations (Oklahoma State Department of Health,
1991). Meeting these regulations can be costly and time consuming. Therefore, the
majority of farmers that participate in supplying FTS products do not cut or package their
produce. The majority of the districts receive 25% or less of their produce precut and
bagged. It is common to see schools receive products ready for use. However, at some
point a cost-savings line has to be drawn between the marginal benefit of precut and
bagged produce and the marginal costs associated with using cafeteria labor for in-school
cutting and processing. According to Table IV-7, not many schools have all of their
produce precut and bagged. Districts with 2,500 or fewer students exhibit a lower
percentage of precut and bagged produce.
Table IV-8. Beneficiaries and barriers to FTS
Number Question
19. In your opinion, who benefits from Farm-To-School? Please check all that apply.a
Schools Students Farmers Community Other Number 135b 148 152 112 5 Percent 74%b 81% 84% 62% 3% 21. What do you feel is the greatest barrier to a successful Farm-To-School
program within your district?c
Costs Delivery Seasonality Health
concerns Availability of products Other
Number 18 107 24 13 25 12
Percent 9% 54% 12% 7% 13% 6% aN=182 b135 respondents (74%) stated schools benefit from FTS. cN=199

40
Responding to Question 19, many respondents checked multiple answers stating
that schools, students, farmers, and communities benefit from FTS. Surprisingly, the
greatest perceived barrier to FTS is not costs; it is delivery. Of least concern are other
barriers and health concerns. According to the results in Table IV-8, seasonality and
availability of products are perceived as problems to FTS success as well.

41
Table IV-9. Factors influencing FTS participation
Factors Not important Very important
1a 2 3 4 5 6 7 8 9 10
Freshness of product 1 0 0 0 9 0 3 17 17 145 1% 0% 0% 0% 5% 0% 2% 9% 9% 76%
Consistency in product quality 1 0 0 1 14 2 8 15 35 117 1% 0% 0% 1% 7% 1% 4% 8% 18% 61%
Expense 1 0 0 1 16 4 6 24 23 117 1% 0% 0% 1% 8% 2% 3% 13% 12% 61%
Ease of participating in FTS program 2 0 1 0 17 6 9 24 27 106 1% 0% 1% 0% 9% 3% 5% 13% 14% 55%
Ability to produce desired quality 2 0 2 2 13 5 12 33 28 95 1% 0% 1% 1% 7% 3% 6% 17% 15% 49%
Convenience 1 1 1 1 17 5 11 35 33 86 1% 1% 1% 1% 9% 3% 6% 18% 17% 45%
Ability to adjust timing of deliveries 2 2 2 1 20 9 10 30 34 83 1% 1% 1% 1% 10% 5% 5% 16% 18% 43%
Delivery frequency 2 0 1 3 19 10 11 29 31 86 1% 0% 1% 2% 10% 5% 6% 15% 16% 45%
Willingness to provide specific products 1 0 4 2 23 7 12 38 36 68
1% 0% 2% 1% 12% 4% 6% 20% 19% 36%
Produce origin 2 2 5 3 25 14 17 35 22 66 1% 1% 3% 2% 13% 7% 9% 18% 12% 35%
aN=195, measured on a likert scale, -top row of each factor is the number of responses, bottom row is the percentage of responses for each factor

42
In Table IV-9, factors affecting FTS participation received ratings on a likert scale
from 1-10. The majority of the factors received ratings of 5 or above. The factors that
received the greatest number of ratings of 10 were: freshness of product, consistency in
product quality, and expense. The factor receiving the lowest number of ratings of 10 was
Produce origin. It is imperative to point out that freshness of the product is important to
food service directors; however, the origin of the product is not of high significance.

43
V.
CHAPTER V
RESULTS
The results of the logistic model and the transportation cost template are included
in this section.
Program participation
Table V-1. Chi-square statistic of FTS participation and independent variables
Item Chi-square statistic P-value
DISTRICT_SIZE Continuity Adj. Chi-square <0.0001 BREAKFAST Continuity Adj. Chi-square <0.0001 SUMMER_FEED Chi-square 0.0258 CAMPUS_POLICY Chi-square 0.0589 DELIVERY_FREQUENCY Continuity Adj. Chi-square 0.2128 PRE_CUT_BAGGED Chi-square 0.8382 FREE_REDUCED Chi-square 0.2125 BUDGET Continuity Adj. Chi-square 0.0803 DISTRIBUTOR_ALL Chi-square 0.1477 DISTRIBUTOR_PRODUCE Chi-square 0.0057 GROCERY_ALL Continuity Adj. Chi-square 0.0883 GROCERY_PRODUCE Continuity Adj. Chi-square 0.0924
Table V-1 lists 12 independent variables and their statistical significance with FTS
participation according to the Chi-square statistic. Non-binary variables are modified as
binary variables for the chi-square test. Of the 12 listed variables in Table 13, only four of
the variables are statistically significant at the 5% level. This implies district size,

44
breakfast program participation, summer feeding, and distributor used for produce each
have an effect on FTS participation.
Table V-2. Logit model results with FTS participation as the dependent variable
Variables Estimate Standard
Error Change in probability
Intercept** -2.0781 0.9839 -- DISTRICT_SIZE* 0.000356 0.000133 0.0025% FREE_REDUCED -0.0162 0.015 -0.1140% SUMMER_FEED -0.0425 0.5861 -0.0030% CAMPUS_POLICY 0.7957 0.5048 0.0566% DISTRIBUTOR_PRODUCE** -1.7005 0.7895 -0.1196% BUDGET* 3.4032 1.325 0.2446% *Indicates significance at the 0.01 level. **Indicates significance at the 0.05 level.
In the logistic model, DISRICT_SIZE, DISTIBUTOR_PRODUCE, and BUDGET
were all statistically significant variables in determining FTS participation. In addition to
the coefficients, marginal effects were calculated to measure the effects of change of
explanatory variables on the probability of FTS participation; however, the percentages
are small, making interpretation difficult.
In Table V-2, the signs on the coefficients reveal relationships between
explanatory variables and FTS participation. DISTRICT_SIZE is positively related to FTS
participation, implying that as size increases, probability of participation increases.
DISTIBUTOR_PRODUCE is negatively related to FTS participation meaning that as a
school district goes from using a large, common distributor to a smaller, less common
distributor, probability of FTS participation decreases. As expected, BUDGET has a
positive relationship with FTS participation. Additional availability in funds for fruits and
vegetables allows for districts to participate in food programs like FTS and as the
proportion of food budget for produce increases so does probability of FTS participation.

45
Table V-3. Change in probability of FTS participation with arbitrary changes
Variables Amount increase Change in probability
DISTRICT_SIZE * 1000 3.60% PERCENT_FREE_REDUCED 10% -1.30% SUMMER_FEEDING program-yes -0.37% CAMPUS_POLICY policy-yes 9.60% DISTRIBUTOR_PRODUCE ** small-yes -7.80% PERCENT_BUDGET_PRODUCE* 5% 2.00% *Indicates significance at the 0.01 level. **Indicates significance at the 0.05 level.
Table V-3 differs from Table V-2 by the increments in which the explanatory
variables change. Table V-3 has arbitrary changes in the X variable, which will add
understanding to affects on the dependent variable. In Table V-3, DISTRICT_SIZE was
increased by 1,000 students from its mean value of 1,397 students, which resulted in a
3.6% increase in probability of participation. The variable, FREE_REDUCED was
increased from 63% to 73%, decreasing probability of participation by 1.3%. Probability
of program participation decreases slightly when SUMMER_FEEDING is changed and a
district goes from not having a summer feeding program to having one. FTS participation
increases by 9.6% when CAMPUS_POLICY changes from a closed campus policy to an
open campus policy. Using small, less common produce distributors instead of large,
more common distributors decreases the probability of participation by 7.8%. Increasing
the BUDGET variable by 5% from its mean value of 11% increases the probability of
participation by 2%.
Transportation costs
The transportation cost template (see Appendix IV) was designed to assist
agricultural producers in devising least cost distribution methods for fruits and vegetables

46
and allows them to evaluate and compare total cost sensitivity due to change in prices.
The values used in the cost template were arbitrarily chosen and serve as an example for
producers interested in FTS distribution. For a producer to compare transportation
options, he would need to enter values in the template that pertain to a real case scenario
for his operation.
The template has a total of four tabs, an introductory tab with brief directions and
suggested readings, and three additional tabs for each possible delivery method: DD,
WD, and ID. Each tab is similar with the exception of a few rows. The tabs have three
main sections. The first section, General Information, contains information on the
quantity of commodity, labor, distance, and fuel costs associated with transport. The
second section, Vehicle Information, has information related to vehicles. The third
section has the cost of distribution for each mile, trip, and unit of commodity. In addition
to this section is an account of the farm gate margin of profit for the farmer per unit of
commodity. The farm gate margin represents the value of the unit of produce at the farm.
Each year, the Internal Revenue Service (IRS) releases standard mileage rates for
business expense deductions. The cost template provides the option of using the standard
mileage rate or entering a different value. The standard mileage rate for business is based
on an annual study of the fixed and variable costs of operating an automobile and is
currently set at 55 cents per mile (IRS, 2008).
The template sections titled General Information and Vehicle Information contain
estimated figures gathered from a myriad of sources. The following items discussed are
included in the section General Information. The selling price of the unit, watermelon, is
information provided by a watermelon farmer, Kevin Hughes, who cultivates the

47
watermelon provided for the FTS Statewide project (Hughes, Kirby, and Holcomb,
2009). According to Mr. Hughes, watermelon is delivered in crates with two watermelons
in each crate; therefore, a unit of produce includes two watermelons. The price of labor
refers to the labor costs of the truck driver. The delivery size, unloading time for each
delivery, and number of deliveries per trip can be modified for individual analyses. For
the Statewide FTS program, the delivery route begins in Hinton, Oklahoma, where the
commodity is loaded, and then the truck travels to Oklahoma City and Tulsa. This
distance is approximately 150 miles. The final item in the General Information section is
fuel cost. Historical gas prices can be found online. Due to fluctuating gas prices, the
current price for fuel was used.
Under the section, Vehicle Information, items related to vehicles such as fuel
economy, tire and maintenance costs, and depreciation are listed. According to Barnes
and Langworthy (2003), gas mileage for a straight truck (pickup or delivery van) is 8-9
miles per gallon (mpg). Tire costs differ according to vehicle type and size. The estimated
life of a tire is 45,000 miles (Barnes and Langworthy, 2003). For a pickup, van, or a sport
utility vehicle, a set of tires costs 1.2 cents per mile on extremely poor pavement quality
and 1.0 cents per mile on smooth pavement conditions. There are estimated maintenance
and repair costs for various vehicle types cited study by Barnes and Langworthy (2003).
Vehicle depreciation is function of age and use (miles driven). Depreciation for
newer trucks may be spread equally across a number of years (straight-line method) or by
the Modified Accelerated Cost Recovery System (MACRS) formula. Older trucks may
depreciate very little as result of an additional year or a few extra thousand miles. The
expected number of miles driven is derived through consideration of multiple items. The

48
distance the truck travels between Oklahoma City, Hinton, and Tulsa is short. The
number of deliveries occurs only once or twice a week. Finally, watermelon, currently the
main produce item distributed in the Oklahoma FTS program, can be harvested in
Oklahoma from July through October; however, the academic year traditionally begins in
August. Therefore, the schools are receiving watermelon for only three months in a year.
For FTS distribution alone, the expected distance driven in a year is approximately
10,000 miles. The average speed of a truck can vary depending upon whether the vehicle
is traveling on highways or city streets. For the purposes of this research, the speed of a
truck will be an assumed 45 miles per hour. This value, along with all other values
included in the transportation cost template, can be changed to mimic the conditions and
prices producers face. For an illustration of the three delivery tabs within the cost
template, please refer to Appendix IV.
Utilizing the cost information from the template, cost curves were constructed
using a simulation program. Values for means, standard deviations, constants of
variation, minimums, and maximums were simulated for each distribution scenario and
iterations of cost values were calculated for distances varying from 25 miles to 150 miles.
Two graphs were created with the simulated data, one illustrating per unit delivery cost
and the other illustrating the farm gate margin. Similar to the transportation cost template,
the results of the cost curves are subject to variations in price.
The distribution cost per unit of produce given the base scenario with general
information and vehicle information fixed, is $1.04 for DD, $1.03 for WD, and $2.73 for
ID. The distribution curves correspond with these distribution costs and illustrate the least
costly transportation method for each unit delivered is WD, closely followed by DD. ID

49
is higher in costs due to the intermediary’s charge per unit of service. The farmer absorbs
this charge. If the number of deliveries made by the farmer increases from 2 to 10 or 15,
the per unit cost of distribution will increase and exceed that of WD however, remaining
lower than the cost of ID.
The farm gate margin or the net profit per unit for the producer, given the base
scenario, is highest using DD, at $7.46. For WD and ID, the margin is $5.97 and $5.77,
respectively. When the number of deliveries is increased to 10 and 15, the farm gate
margin is still highest with DD at $7.19 and $7.02, respectively. Distribution costs
increase when number of deliveries increases because labor costs are greater. An increase
in the delivery route would affect all three scenarios similarly, increasing the cost of the
entire trip, yet decreasing the cost per mile and decreasing the farm gate margin. These
reported values are reflective of the information provided for the base scenario and any
stated modifications. For the producer to decide which distribution method is least costly,
the producer would need to provide cost information relevant to his operation.
Cost curves were generated based upon the base estimates used in the template.
These estimates are subject to change and are reflective of given price information.

50
Figure V-1. Hypothetical per unit cost of different delivery methods for seedless watermelon
Subject to given price information, Figure V-1 illustrates WD as the least cost
method of delivery. ID is the most costly method. Although the marginal cost decreases
as distance increases, the total cost of transportation increases, hence the upward sloping
curves. The per unit cost of delivery can decrease if the labor or fuel price decreases or if
the number of delivered units increases.
Figure V-1 illustrates the per unit delivery costs for the various delivery methods.
In the cost template, there are particular values that affect total cost of distribution. When
the farmer delivers, the number of trips the farmer makes increases the unloading time
and in turn increases labor. For the base scenario, unloading takes approximately 20
$0.00
$1.00
$2.00
$3.00
$4.00
$5.00
$6.00
$7.00
$8.00
$9.00
0 20 40 60 80 100 120 140 160
$/un
it
Transport Distance
DD/unit WD/unit ID/unit

51
minutes per delivery. As the number of deliveries increases, so does the hours of driver
labor. Depending upon the distances between the farm and drop-off points, the number of
miles traveled or delivery route could potentially increase as well. If the delivery route
increases, fuel costs increase. It is reasonable to believe that as the number of deliveries
increases, distances will naturally increase, unless the school districts receiving FTS
commodities are within close proximity. The cost factors that stay relatively constant
within the cost template are those related to vehicles. It is assumed in the given example
that tire costs, maintenance costs, fuel economy, and depreciation are the same for each
delivery method.
Figure V-2. Hypothetical farm gate margin for different delivery methods for seedless watermelon
$0.00
$1.00
$2.00
$3.00
$4.00
$5.00
$6.00
$7.00
$8.00
$9.00
0 20 40 60 80 100 120 140 160
$/un
it
Transport Distance
DD Marg WD Marg ID Marg

52
Subject to given price information, Figure V-2 illustrates the greatest marginal
profit is gained using DD and lowest with ID. As distance increases, total transportation
cost increases and results in a downward sloping curve. The producer has incentive to
deliver commodities as close as possible to the farm to decrease transportation costs and
increase profit margins. For the farm gate margin to increase, the price of the product or
the quantity sold needs to increase.
Figure V-2 shows a stark difference in farm gate margin between farmer delivery
and the other two possibilities. The reasons for this are mainly due to the difference in
selling price to the warehouse and the intermediary’s charge per unit of delivery service.
When the farmer delivers, the selling price per unit of produce is $8.50, whereas when
the warehouse delivers, the selling price is only $7.00. If the farmer conducts delivery, he
will be making an extra $1.50 per unit delivered which explains the apparent difference
in the farm gate margin. For the scenario where the intermediary delivers, the farmer is
charged $1.70 per unit of produce that is picked up at the farm. Though the selling price
in this scenario is set at $8.50, the farmer is actually only receiving $6.80 per unit of
produce after the intermediary’s service charge is deducted. For the farmer, using an
intermediary is least desirable because the farm gate margin per unit is lowest at $6.80
and most profitable with direct delivery (farm gate margin is $8.50) even when the
number of trips increases. If the farmer does not object greatly to the amount of labor and
time associated with the direct delivery method, then it may be the most preferred
method. This analysis will assist a farmer when considering the comparative advantages
of direct delivery and other delivery alternatives.

53
VI.
CHAPTER VI
CONCLUSIONS
States with strong local food initiatives have the potential for adoption of FTS
programs. Identifying the school district characteristics associated with participation may
help policy makers, food service directors, and farmers target their FTS programs
towards school districts more likely to adopt FTS. Further, schools, farmers, and
communities may benefit from the results of this research by minimizing distribution
costs.
Assuming school personnel maximize expected utility, using a logit procedure, a
binary choice model was specified to represent the dichotomous decision to participate in
FTS. The probability of FTS participation was assumed to depend on factors such as
district size, breakfast programs, summer feeding programs, campus policy during lunch
hours, food distributors, and food budgets. The estimated model was then used to
evaluate the response of a district having mean characteristics. Marginal effects were
calculated to measure the effects of change in the explanatory variables on the probability
of participation.
Overall, the results indicate that size, food distributors, and food budgets are
associated with a district’s participation in FTS more so than other food programs and
campus policy. The percentage of free and reduced meals offered to the students is not
likely to affect the adoption of a FTS program. Districts with high reimbursement rates

54
for free and reduced priced meals are not more likely to participate in FTS than those will
low reimbursement rates. Schools with larger food budgets for produce, however, have
the option to spend additional funds on fresh fruits and vegetables and are more likely to
participate in FTS. Because food distributors play a large role in FTS participation, this
information might be useful to farmers when determining whether to deliver produce
directly or to contract a third party to distribute FTS commodities.
When considering the base scenario, in terms of distribution costs per trip, cost
was highest when the farmer delivered. Per unit cost of distribution was highest when the
intermediary delivered, while the farm gate margin was highest when the farmer
delivered. Should farmers use direct delivery as a distribution method? This depends
upon the specifications of delivery and the farmer’s preferences. This study was
conducted under controlled conditions with specific delivery routes, prices, and quantities
determined by previous research on transportation costs and existing FTS distribution
conditions. It is possible that different results could be found by changing values within
the cost template.
Limitations of this research can be seen in the explanatory variables. The
explanatory variables consisted of characteristics of districts; however, another possible
proponent to FTS participation is access to information. All of the school personnel from
districts officially participating in FTS have had contact with the Oklahoma FTS
coordinator. Determining whether FTS programs were due to a charismatic organizer
may be significant. In addition, it might have been useful to observe the opinions of food
service and school personnel towards local food initiatives.

55
A recommendation for further research is applying the methods of this study to
FTS programs in other states, which may assist the National FTS Network in establishing
FTS programs. In addition, a study on willingness-to-pay for a FTS program may be of
interest. This thesis is an attempt to establish and encourage additional research in the
area of FTS.

56
REFERENCES
Allison, Paul D. 1999. Logistic Regression Using SAS System: Theory and Applications.
Cary, NC: SAS Institute Inc.: 304.
Barnes, G. and P. Langworthy. 2003. “The Per-mile Costs of Operating Automobiles and
Trucks.” Humphrey Institute of Public Affairs, University of Minnesota. Internet
site: www.hhh.umn.edu/centers/slp/pdf/reports_papers/per_mile_costs.pdf
(Accessed August 5, 2009).
Bellows, B.C., R. Dufour, and J. Bachmann. 2003. “Bringing Local Food to Local
Institutions: A Resource Guide For Farm-to-School and Farm-to-Institutions
Programs.” ATTRA, National Sustainable Agriculture Information Service.
Internet site: http://attra.ncat.org/attra-pub/PDF/farmtoschool.pdf (Accessed
September 29, 2009).
Berkenkamp, J. 2006. “Making the Farm / School Connection: Opportunities and Barriers
to Greater Use of Locally-Grown Produce in Public Schools.” Department of
Applied Economics, University of Minnesota. Internet site:
www.farmtoschool.org/files/publications_120.pdf (Accessed September 26,
2009).
Berwick, M. and F. Dooley. 1997. “Truck Costs for Owner/Operators.” Department of
Transportation, University Transportation Centers Program. Internet site:
www.mountain-plains.org/pubs/pdf/MPC97-81.pdf (Accessed August 5, 2009).
57
Buitenhuys, N., R. King, A. Kezis, and H. Kerr. 1983. “A Comparison of Direct Market
User and Non-user Habits, Acceptance, and Preferences for Direct Marketed
Small Farms’ Horticultural Commodities.” Maine Agricultural Experiment
Station, Experimental Station Bulletin 796.
Center for Food and Justice. 2009. “Farm to School Brochure.” Urban & Environmental
Policy Institute, Occidental College. Internet site:
http://www.farmtoschool.org/files/FARMTOSCHOOL-
FINAL%20BROCHURE.pdf (Accessed September 28, 2009).
Centers for Disease Control and Prevention. 2006. “NHANES data on the Prevalence of
Overweight Among Children and Adolescents: United States, 2003–2006.” CDC.
National Center for Health Statistics, Health E-Stat. Internet site:
www.cdc.gov/nchs/products/pubs/pubd/hestats/overweight/overwght_child_03.ht
m (Accessed August 5, 2009).
Gleason, P.M. 1995. “Participation in the National School Lunch Program and the School
Breakfast Program.” American Journal Clinical Nutrition 61(suppl): 213S-20S.
Govindasamy, R., A. Pingali, J. Italia, and D. Thatch. 1998. “Consumer Response to
State-Sponsored Marketing Programs: The Case of Jersey Fresh.” New Jersey
Agricultural Experiment Station, P-02137.
Grainger, C., B. Senauer, and C. F. Runge. “Analyzing Health Innovations in a School
Lunch Program.” Working Paper WP05-2.Center for International Food and
Agricultural Policy, University of Minnesota.

58
Ham, S., S. J. Hiemstra, and B. J. Yoon. 2002. “Factors Affecting School Lunch
Participation in Indiana Schools.” Foodservice Research International
13: 133- 146.
Harris, B., D. Burress, S. Mercer, P. Oslund, and C. Rose. “Kaw Valley Focus Groups on
Local and Organic Produce.” University of Kansas. IPPBR Report No. 254B.
Internet site: www.ipsr.ku.edu/resrep/pdf/m254B.pdf (Accessed August 5, 2009).
Hughes, K., K. Kirby, and R. Holcomb. Personal Interview. 22 May 2009.
Izumi, B. T., O. S. Rostant, M. J. Moss, and M. W. Hamm. 2006. “Results From the 2004
Michigan Farm-to-School Survey.” Journal of School Health 76(5): 169-174.
Izumi, B.T., D. W. Wright, and M. W. Hamm. 2009. “Farm to school programs:
exploring the role of regionally-based food distributors in alternative agrifood
networks.” Agriculture and Human Values July 26. Internet site:
http://www.springerlink.com/content/8632j280744740g5/ (Accessed
September 28, 2009).
Joshi, A. and A. M. Azuma. 2009. “Bearing Fruit: Farm to School Program Evaluation
Resources and Recommendations.” Center for Food & Justice, Urban and
Environmental Policy Institute, Occidental College. Internet site:
http://departments.oxy.edu/uepi/cfj/bearingfruit.htm (Accessed April 21, 2009).
Kalb, M. and S. Barron. 2005. “Distribution Models for Farm to School.” Community
Food Security Coalition. Internet site:
www.foodsecurity.org/f2s_distribution_method.pdf (Accessed August 5, 2009).

59
Kerr Center for Sustainable Agriculture. 2006. “Closer to Home: Healthier Food, Farms,
Families in Oklahoma, A Centennial Report.” Internet site:
www.kerrcenter.com/publications/closer_to_home/toc.htm (Accessed
August 5, 2009).
Maurer, K. M. 1984. “The National Evaluation of School Nutrition Programs: factors
affecting student participation.” The American Journal of Clinical Nutrition
40: 425-447.
Murray, S. 2005. “A Survey of farm-to-college programs: history, characteristics and
student involvement.” University of Washington, College of Forest Resources.
Internet site: www.farmtocollege.org/Murraythesis_final_June2005.pdf (Accessed
August 2, 2008)
National Farm-to-School Network. 2009. Homepage. Internet site:
http://www.farmtoschool.org/ (Accessed August 2009).
Ohmart J. 2002. “Direct Marketing to Schools – A New Opportunity for Family
Farmers.” UC Sustainable Agriculture Research and Education Program. Internet
site: http://www.sarep.ucdavis.edu/cdpp/directmarketingtoschool.htm (Accessed
September 28, 2009).
Oklahoma Food Policy Council. 2003. “Farm to School Report 2003.” Available at:
http://www.kerrcenter.com/ofpc/publications/Farm-to-School_report.pdf
(Accessed August 28, 2007).
Oklahoma Legislature. 2006. “Oklahoma Farm to School Program Act.” S.2-5-60.1.
Added by-Laws 2006, c. 257, S 1.
60
Oklahoma State Department of Health. 1991. “Good Manufacturing Practice
Regulations.” Oklahoma Administrative Code 310: 260. Internet site:
http://www.ok.gov/health/documents/Water%20Vending260.pdf (Accessed
June 24, 2009).
Orden, D. and R. Paarlberg. 2001. “The New Century of Multi-Agriculturalism.”
Review of Agricultural Economics 23(2): 289-301.
Sanger, K. and L. Zenz. 2004. “Farm-to-Cafeteria Connections: Marketing Opportunities
for Small Farms in Washington State.” Washington State Department of
Agriculture, Small Farm and Direct Marketing Program. Internet site:
http://agr.wa.gov/Marketing/SmallFarm/docs/102-FarmToCafeteriaConnections-
Web.pdf (Accessed September 28, 2009).
Schmidt, M.C. and J. Kolodinsky. 2006. “The Burlington School Food Project, Final
Evaluation Report.” Center for Rural Studies.
Spark, A. 2007. Nutrition in Public health, Principles, Policies, and Practice. Taylor and
Francis Group LLC: Boca Raton, FL.
State Department of Education, Oklahoma. 2009. School District Database. Internet site:
sde.state.ok.us/Services/Data/database.html (Accessed: October 5, 2009).
Tollison, R.D. 1982.“Rent Seeking: a Survey.” Kyklos 35(4): 575-602.
Tullock, G. 1967.”The Welfare Costs of Tariffs, Monopolies, and Theft.”
Western Economic Journal 5: 224-232.

61
U.S. Department of Agriculture, Economic Research Service. 2006. “Farmland
Preservation Programs: Another Tool for Managing Urban Growth?”
Amber Waves 5(2). Internet site:
http://www.ers.usda.gov/AmberWaves/April07/PDF/Farmland.pdf (Accessed
October 13, 2009).
U.S. Department of Agriculture, Economic Research Service. 2008. “2008 Farm Bill
Side-By-Side Comparison.” 110th Congress: Food, Conservation, and Energy Act
of 2008, H. R. 6124. Internet site:
frwebgate.access.gpo.gov/cgibin/getdoc.cgi?dbname=110_cong_public_laws&do
cid=f:publ246.pdf (Accessed August 5, 2009).
U.S. Department of Agriculture-Cooperative State Research, Education, and Extension
Service. 2008. “From Farm to School: Improving Small Farm Viability and
School Meals.” Initiative for Future Agricultural Food Systems . Internet site:
www.eric.ed.gov/ERICDocs/data/ericdocs2sql/content_storage_01/0000019b/80/
42/cb/89.pdf (Accessed June 28, 2009).
United Health Foundation. 2008. “America’s Health Rankings: Oklahoma” Internet site:
www.americashealthrankings.org/2008/pdfs/ok.pdf (Accessed
September 22, 2009).
Vogt, R. A. and L.L. Kaiser. 2006. “Perceived Barriers and Proposed Solutions to Farm-
to-School Programs in California.” Journal of Nutrition Education and Behavior.
38(4): 50.
62
Wilkins, J. L., J. Bokaer-Smith, D.Hilchey. “Local Foods and Local Agriculture: A
Survey of Attitudes Among Northeastern Consumers.” Northeast Regional Food
Guide Project. Cornell University, Division of Natural Sciences. Internet site:
www.smallfarms.cornell.edu/pages/resources/pdfs/AttitudeSurvey.rtf (Accessed
August 5, 2009).
Zajfen, V. 2008. “Fresh Food Distribution Models for the Greater Los Angeles Region.”
Findings from an Action Research Project of the Center for Food & Justice, a
division of the Urban & Environmental Policy Institute, Occidental College,
December 2006-March 2008. Internet site:
departments.oxy.edu/uepi/publications/TCE_Final_Report.pdf (Accessed
August 5, 2009).
Zepeda, L and J. Li. 2006. “Who Buys Local Food?” Journal of Food Distribution
Research 37(3).

63
APPENDICES
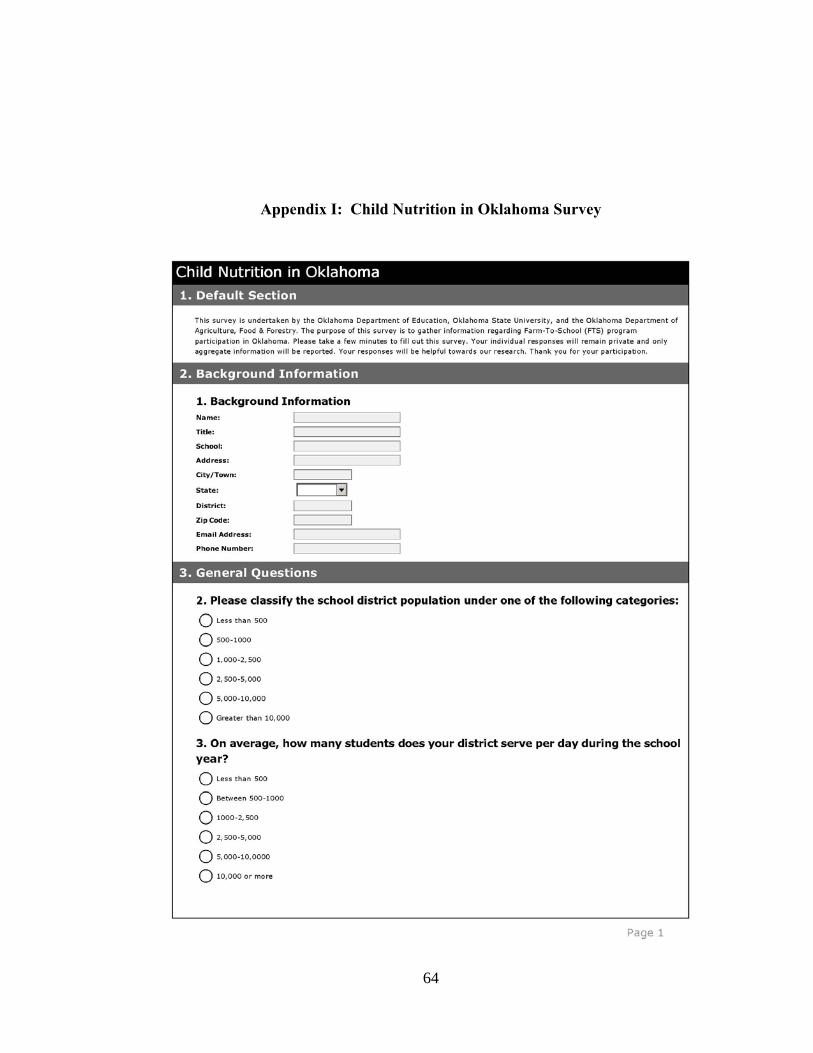
64
I.
Appendix I: Child Nutrition in Oklahoma Survey

65

66

67

68
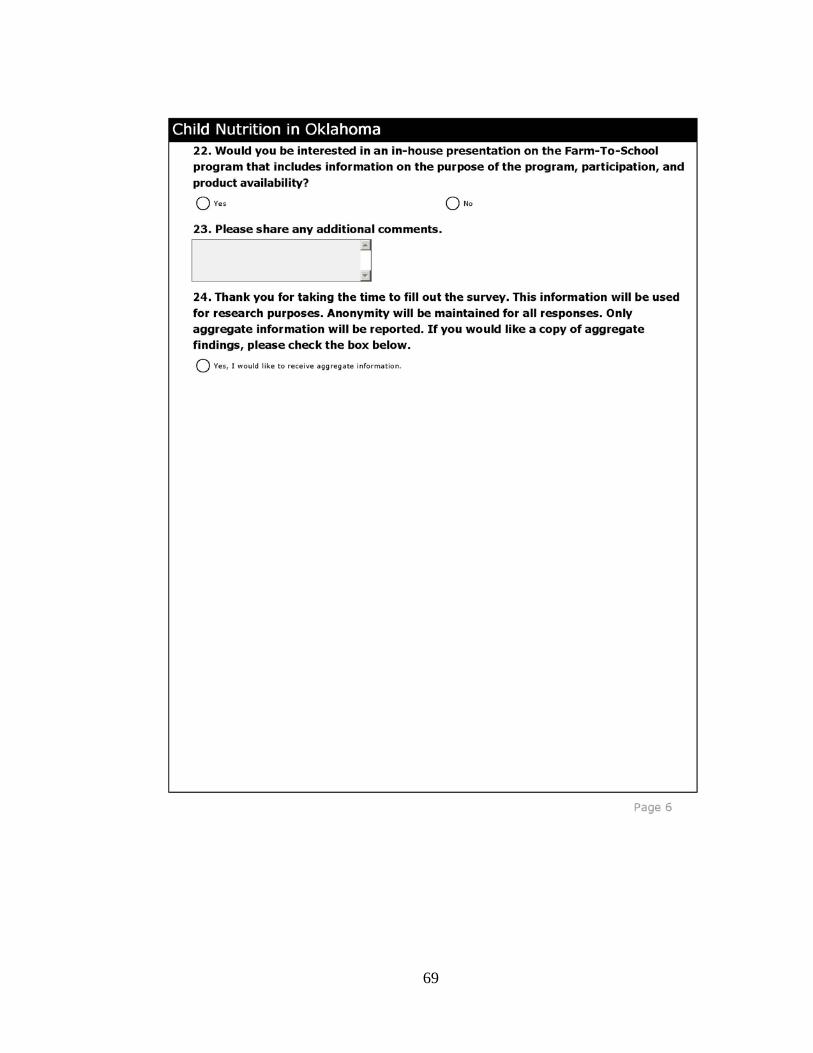
69

70
II.
Appendix II: Oklahoma Distributor Questionnaire
Dear Distributor: Please take a few minutes to complete this questionnaire regarding the Farm-To-School (FTS) program in Oklahoma. Because of your stature as a food distributor to Oklahoma schools, your input regarding locally grown versus non-locally grown produce is vital. Oklahoma State University, the Oklahoma Department of Agriculture, Food & Forestry, and the Oklahoma State Department of Education will collectively use this information to assess the potential for expanding the Farm-To-School program in the near future. Your individual responses will remain private and only aggregate information will be reported. Thank you in advance for your time. General questions related to business with schools
1) To how many school districts does your company distribute produce?
2) What percent of your total produce business is with schools?
3) Do you utilize different fee structures for schools compared to your non-school customers? If so, what is that difference?
4) When you provide a produce bid for a school, are you required to sell the produce at the bid price if the bid is for the year? For the month? For the week?
5) Distribution companies have certain documentation and requirements that farmers must follow to distribute produce through your company. What are those? For example, product liability insurance (how much), Good Agricultural Practice documentation? 3rd party certification? Others?
Questions related to locally grown products 6) How many of your school clientele specifically request local produce?
7) What type of delivery truck(s) does your company use for making deliveries to schools?
8) Are you currently back hauling any local produce back to your warehouse? Are you interested in doing so?

71
9) How does your company view the distribution fee of $1.50 per case for FTS produce? Do you think it should be raised? By how much?
10) Is the fee charged to cooperatives, brokers, and farmers for doing business with your company different for those out-of-state (e.g.: California) verses those in Oklahoma?
11) Are you currently buying produce from any local farmers for clients other than the FTS participants?
12) If you receive local produce other than for FTS, do you segregate the local from the other produce and promote as local?
13) Is your company looking to purchase more local produce?
14) What are the barriers/issues regarding local produce purchasing and what would make it easier for your company to distribute locally grown produce?
15) Are you interested in distributing FTS food products?

72
III.
Appendix III: Farmer Questionnaire
Questionnaire for Farmer Kevin Hughes FTS Case study Production
1) For the average farmer, how many lbs of watermelon does a farmer produce per acre each month? Each week?
2) For the average farmer, how many lbs of watermelon can be produced per acre for the month of August, September, October, and November?
3) How is your farm irrigated? Are there any special/additional farming techniques used on your farm?
4) Is your actual production more than what the usual farmer produces? (Please answer questions 1 and 2 in terms of your farm).
Consumer demographics
5) To what type of institutions do you sell your watermelons? 6) What percentage of your watermelon production is marketed in the Farm To
School (FTS) program? 7) How many schools/districts are you supplying produce to?
Transportation
8) How are FTS products delivered from the farm to the school? 9) What types of vehicles are used? 10) Do you use third party distributors to transport your produce? What is the cost of
using this entity? 11) Does transporting watermelon require refrigerated trucks? 12) What is the distance traveled? 13) How often are deliveries made each month? Each week? 14) Are they delivered on the same day? 15) Are they picked up from your farm? 16) Is there a central farm location near your farm and other watermelon farmers?
What would you say the average distance between that central location and other farms be?
17) (should I ask about insurance and maintenance cost on their vehicles?)

73
Quantity/Capacity/Price
18) On average, how many lbs of watermelon are loaded onto a farm truck? What is the maximum capacity? What are these values for different types of trucks (med-size, or farm trucks with trailers semis)?
19) Are you able to consistently meet demand? 20) What product, at what price and quantities have you sold to schools? 21) Are you selling at, below, or above the standard price for watermelon?
Financial Feasibility
22) Is there a break-even point for you to deliver to a distributor? In other words, what is the minimum numbers of case you need to deliver to a distributor in 1 drop to make it profitable?
23) Is there a charge for delivery from the distributor when you drop a load for FTS? 24) Is this project economically viable for your farm?
Opinion and General Business
25) Has Farm to School helped you get any additional business with distributors separate from the FTS program?
26) What are some major problems/barriers you see with a FTS program? 27) What are the positive aspects of FTS for you as a grower?

74
IV.
Appendix IV: Farm-To-School Distribution Cost Template
Farm-To-School Distribution Cost Template Rodney B. Holcomb, Professor Anh Vo, Former Graduate Research Assistant Oklahoma State University Robert M. Kerr Food & Agricultural Products Center Department of Agricultural Economics This template was designed to assist agricultural producers marketing fruits and vegetables through a state-supported Farm-To-School (FTS) program. The template allows producers to assess and compare the costs of alternative transportation/distribution methods and determine their farm-level returns for each unit of produce marketed through the FTS program. It also provides producers an opportunity to examine the sensitivity of their chosen distribution method to changes in a number of cost factors and/or a change in market price for their produce. Users of the template are requested to provide the appropriate information in the green cells. The template will generate the per-unit costs for transporting produce a stated distance. NOTE: The true costs of transportation for fruits and vegetables vary greatly by the vehicles employed, the use of refrigeration (if necessary), fuel prices, and distance traveled. Long-haul versus short-haul costs, back-haul versus no back-haul, the number of delivery points, and even road conditions all have large impacts on distribution costs. Although some of these factors are addressed in the template, users of the template are also directed to review literature related to operational costs in the trucking industry. Some useful references (in alphabetical order) include the following: Barnes, G., and P. Langworthy. (June 2003). "The Per-Mile Costs of Operating Automobiles and Trucks." Minnesota Department of Transportation, Office of Research Services, Report 2003-19. Authors are faculty with the Humphrey Institute of Public Affairs, University of Minnesota, Minneapolis, MN. Available at http://www.lrrb.org/pdf/200319.pdf, accessed July 9, 2009. Tolliver, D., and A. Dybing. (2009). "Highway User Costs at 2008 Prices." Transportation Research Board Annual Meeting 2009 paper #09-2831, Transportation Research Board, Washington, D.C. The paper may be ordered at http://pubsindex.trb.org/orderform.html.
75
US Dept. of Agriculture, Agricultural Marketing Service (USDA-AMS). Go to http://www.ams.usda.gov and click on "Market News and Transportation Data". The site provides links to transportation data, along with PDF issues of Agricultural Refrigerated Truck Quarterly. US Dept. of the Treasury, Internal Revenue Service (IRS). Standard Mileage Rates. Each year the IRS releases standard mileage rates for business expense deductions at http://www.irs.gov. The 2009 mileage rates are available at http://www.irs.gov/newsroom/article/0,,id=200505,00.html, accessed July 9, 2009.

76
Direct Delivery by Farmer-Owned Truck
General Information
Commodity to be delivered watermelons
Enter "1" if using the IRS standard mileage rate Commodity unit (case, pound, carton, etc.) 2-count
(otherwise leave blank)
Selling price per unit (what schools pay) $8.50
Current IRS standard mileage rate ($/mile) $ 0.55 Delivery size, in units 100
Labor rate ($/hr) $10.00
Operating Costs per Mile Unloading time per delivery (minutes) 20
Fuel costs $0.02
Number of deliveries per trip 2
Maintenance/Repair $0.15 Delivery route (miles, round trip) 150
Tires $0.01
Fuel cost (gas or diesel, $/gal) $2.39
Depreciation $0.25
Labor $0.27
Vehicle Information
Total Operating Costs per Mile $0.70 Farm truck fuel economy (mpg) 9.00
Vehicle tire costs (set of tires) $575.00
Total Operating Costs per Trip $104.31 Vehicle tire life (thousand miles) 45,000
Expected maint./repair expenses this year $1,500.00
Distribution Cost per Unit of Produce $1.04 per 2-count Expected depreciation this year $2,500.00
Expected miles driven this year 10,000
"Farm Gate" Margin per Unit $7.46 per 2-count Avg speed when making deliveries (mph) 45

77
Delivery to a Warehouse*
General Information Commodity to be delivered watermelons
Enter "1" if using the IRS standard mileage rate
Commodity unit (case, pound, carton, etc.) 2-count
(otherwise leave blank)
Distributor purchase price $7.00
Current IRS standard mileage rate ($/mile) $0.55 Delivery size, in units 100
Labor rate ($/hr) $10.00
Operating Costs per Mile Unload/waiting time at warehouse (min) 30
Fuel costs $0.02
Delivery route (miles, round trip) 150
Maintenance/Repair $0.15 Fuel cost (gas or diesel, $/gal) $2.39
Tires $0.01
Depreciation $0.25 Vehicle Information
Labor $0.26
Vehicle fuel economy (mpg) 9.00
Total Operating Costs per Mile $0.68 Vehicle tire costs (set of tires) $575.00
Vehicle tire life (thousand miles) 45,000
Total Operating Costs per Trip $102.64 Expected maint./repair expenses this year $1,500.00
Expected depreciation this year $2,500.00
Distribution Cost per Unit of Produce $1.03 per 2-count Expected miles driven this year 10,000
Avg speed when making deliveries (mph) 45
"Farm Gate" Margin per Unit $5.97 per 2-count
*A warehouse, or large distributor, takes ownership of the produce and negotiates both pricing and delivery specifications with the schools.

78
Delivery Using an Intermediary*
General Information Commodity to be delivered watermelons
Enter "1" if using the IRS standard mileage rate
Commodity unit (case, pound, carton, etc.) 2-count
(otherwise leave blank) Selling price per unit (what schools pay) $8.50
Current IRS standard mileage rate ($/mile) $ 0.55
Intermediary's charge per unit for service $1.70 Delivery size, in units 100
Farmer's Operating Costs Labor rate ($/hr) $10.00
Fuel costs $0.02
Unload/waiting time at intermediary (min) 30
Maintenance/Repair $0.15 Delivery route (miles, round trip) 150
Tires $0.01
Fuel cost (gas or diesel, $/gal) $2.39
Depreciation $0.25
Labor $0.26
Vehicle Information
Farmer's Operating Costs per Mile $0.68 Vehicle fuel economy (mpg) 9.00
Vehicle tire costs (set of tires) $575.00
Farmer's Operating Costs per Trip to Intermed. $102.64 Vehicle tire life (thousand miles) 45,000
Expected maint./repair expenses this year $1,500.00
Distribution Cost per Unit of Produce $2.73 per 2-count Expected depreciation this year $2,500.00
Expected miles driven this year 10,000
"Farm Gate" Margin per Unit $5.77 per 2-count Avg speed when making deliveries (mph) 45
*An intermediary may be another producer, a broker, a small contract producer distributor, or a cooperatively-operated distribution network. If the intermediary picks up the produce at the farm, then only the intermediary's charge for services is needed.

79
VII.
Appendix V: SAS Code
FTS5_25 Code Dm'log;clear;output;clear;'; PROC IMPORT OUT= WORK.AnhFinal DATAFILE= "C:\FarmToSchoolORganized\4 FTS\SurveySasStuff\New Data5_22DoNotChangedoc.xls" DBMS=EXCEL REPLACE; SHEET="Sheet1$"; GETNAMES=YES; MIXED=NO; SCANTEXT=YES; USEDATE=YES; SCANTIME=YES; RUN; data CompleteSurvey; set anhfinal (drop=ID StartDate EndDate IPAddress EmailAddressSent FirstName LastName CustomData Name Title School Address City_Town State District Zip_Code EmailAddress PhoneNumber Population OtherProg ProductsReceived DateReceivedF_V OtherDistributorAnyF_V OtherDist OtherDistributorFreshF_V2 OtherFreshDist IfNoWhy OtherBeneficiaries OtherBarrier Comments website); /*Trying to use reduced and free info and convert into groups*/; **newpercentreduced=0; /* think this is a bias so will leave it out*/; if((percentreduced>0) & ( Percentreduced <= 25)) then newpercentreduced=1; if ((Percentreduced>25) & (Percentreduced<=50)) then newpercentreduced=2; if ((Percentreduced>50) & (Percentreduced<=75)) then newpercentreduced=3; if Percentreduced >75 then newpercentreduced=4; /*Trying to get rid of zeros*/; if Pilot= 0 then pilot= .; if Statewide= 0 then statewide= .; if LocalFarmers=0 then localfarmers=.; if BenEKeith=0 then BenEKeith=.; if Sysco=0 then Sysco=.; if MidAmerica=0 then midamerica=.; if USFoods=0 then USFoods=.; if SouthwestFoodservice=0 then SouthwestFoodservice=.; if Tankersley=0 then Tankersley=.; if PerformanceFdGroup=0 then PerformanceFdGroup=.; if ThomasBrothersOKC=0 then ThomasBrothersOKC=.; if ThomasBrothersTulsa=0 then ThomasBrothersTulsa=.; if BuddysProduce=0 then BuddysProduce=.;

80
if TulsaFruits=0 then TulsaFruits=.; if OKIEProduce=0 then OKIEProduce=.; if Vinyards=0 then Vinyards=.; if FrontierProduce=0 then FrontierProduce=.; if TomEBoggs=0 then TomEBoggs=.; if BenEKeith2=0 then BenEKeith2=.; if Sysco2=0 then Sysco2=.; if MidAmerica2=0 then MidAmerica2=.; if USFoods2=0 then USFoods2=.; if SouthwestFoodservice2=0 then SouthwestFoodservice2=.; if Tankersley2=0 then Tankersley2=.; if PerformanceFdGroup2=0 then PerformanceFdGroup2=.; if ThomasBrothersOKC2=0 then ThomasBrothersOKC2=.; if ThomasBrothersTulsa2=0 then ThomasBrothersTulsa2=.; if BuddysProduce2=0 then BuddysProduce2=.; if TulsaFruits2=0 then TulsaFruits2=.; if OKIEProduce2=0 then OKIEProduce2=.; if Vinyards2=0 then Vinyards2=.; if FrontierProduce2=0 then FrontierProduce2=.; if TomEBoggs2=0 then TomEBoggs2=.; if ContinuingFTS=999 then ContinuingFTS=.; if Grocery_AllFoods=0 then Grocery_AllFoods=.; if Grocery_FreshStore=0 then Grocery_FreshStore=.; if Schools=0 then Schools=.; if Students=0 then Students=.; if Farmers=0 then Farmers=.; if Community=0 then Community=.; if ResultsRequest=0 then ResultsRequest=.; if grocer1=999 then grocer1=.; if grocer2=999 then grocer2=.; /*Putting deliveryfreq in order*/; /* from twice a week, once a week,twice a month, to once a month*/; if deliveryfrequency=2 then deliveryfreq=8; if deliveryfrequency=1 then deliveryfreq=4; if deliveryfrequency=4 then deliveryfreq=2; if deliveryfrequency=3 then deliveryfreq=1; /*Putting FTS participation into binary form*/; if ((pilot=1) & (statewide=2)) or (pilot=1)or (statewide=2) then FTSpart=1; if (noprogs=4) or ((noprogs=4) & (localfarmers=3)) or (localfarmers=3) then FTSpart=0; /*trying to have all distributors together for non-fresh*/; if benekeith=1 then distributor=1; if sysco=2 then distributor=2; if midamerica=3 then distributor=3; if usfoods=4 then distributor=4;
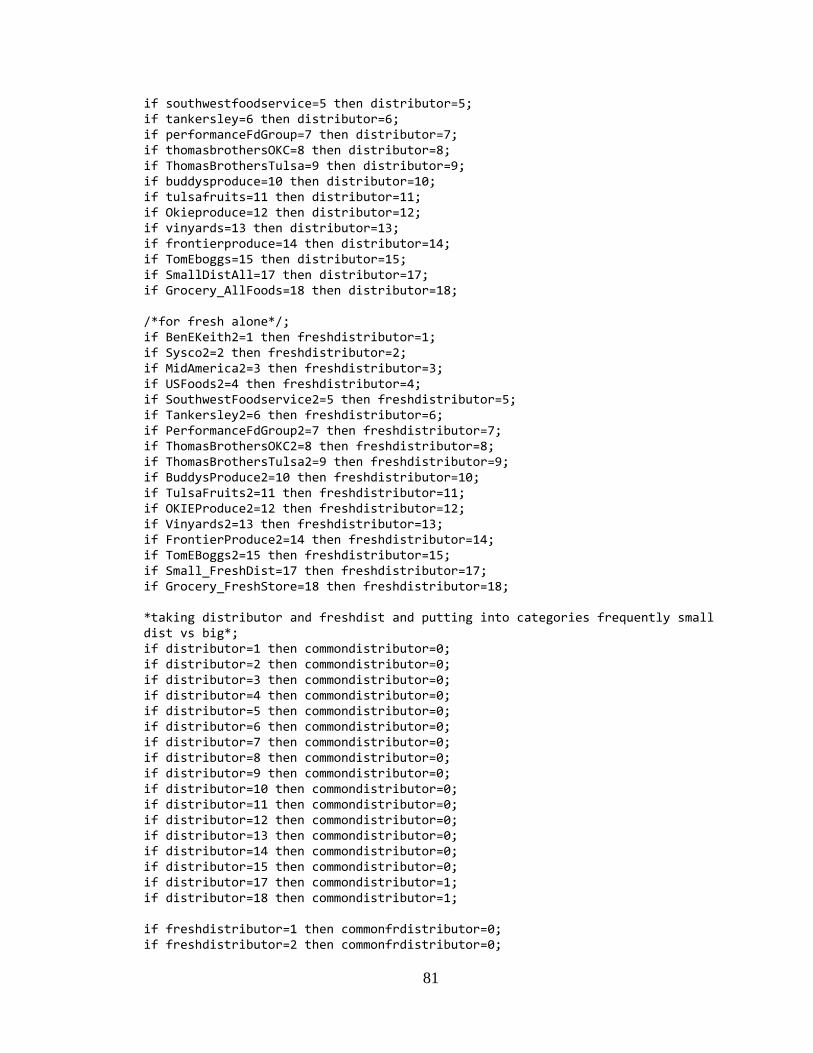
81
if southwestfoodservice=5 then distributor=5; if tankersley=6 then distributor=6; if performanceFdGroup=7 then distributor=7; if thomasbrothersOKC=8 then distributor=8; if ThomasBrothersTulsa=9 then distributor=9; if buddysproduce=10 then distributor=10; if tulsafruits=11 then distributor=11; if Okieproduce=12 then distributor=12; if vinyards=13 then distributor=13; if frontierproduce=14 then distributor=14; if TomEboggs=15 then distributor=15; if SmallDistAll=17 then distributor=17; if Grocery_AllFoods=18 then distributor=18; /*for fresh alone*/; if BenEKeith2=1 then freshdistributor=1; if Sysco2=2 then freshdistributor=2; if MidAmerica2=3 then freshdistributor=3; if USFoods2=4 then freshdistributor=4; if SouthwestFoodservice2=5 then freshdistributor=5; if Tankersley2=6 then freshdistributor=6; if PerformanceFdGroup2=7 then freshdistributor=7; if ThomasBrothersOKC2=8 then freshdistributor=8; if ThomasBrothersTulsa2=9 then freshdistributor=9; if BuddysProduce2=10 then freshdistributor=10; if TulsaFruits2=11 then freshdistributor=11; if OKIEProduce2=12 then freshdistributor=12; if Vinyards2=13 then freshdistributor=13; if FrontierProduce2=14 then freshdistributor=14; if TomEBoggs2=15 then freshdistributor=15; if Small_FreshDist=17 then freshdistributor=17; if Grocery_FreshStore=18 then freshdistributor=18; *taking distributor and freshdist and putting into categories frequently small dist vs big*; if distributor=1 then commondistributor=0; if distributor=2 then commondistributor=0; if distributor=3 then commondistributor=0; if distributor=4 then commondistributor=0; if distributor=5 then commondistributor=0; if distributor=6 then commondistributor=0; if distributor=7 then commondistributor=0; if distributor=8 then commondistributor=0; if distributor=9 then commondistributor=0; if distributor=10 then commondistributor=0; if distributor=11 then commondistributor=0; if distributor=12 then commondistributor=0; if distributor=13 then commondistributor=0; if distributor=14 then commondistributor=0; if distributor=15 then commondistributor=0; if distributor=17 then commondistributor=1; if distributor=18 then commondistributor=1; if freshdistributor=1 then commonfrdistributor=0; if freshdistributor=2 then commonfrdistributor=0;

82
if freshdistributor=3 then commonfrdistributor=0; if freshdistributor=4 then commonfrdistributor=0; if freshdistributor=5 then commonfrdistributor=0; if freshdistributor=6 then commonfrdistributor=0; if freshdistributor=7 then commonfrdistributor=0; if freshdistributor=8 then commonfrdistributor=0; if freshdistributor=9 then commonfrdistributor=0; if freshdistributor=10 then commonfrdistributor=0; if freshdistributor=11 then commonfrdistributor=0; if freshdistributor=12 then commonfrdistributor=0; if freshdistributor=13 then commonfrdistributor=0; if freshdistributor=14 then commonfrdistributor=0; if freshdistributor=15 then commonfrdistributor=0; if freshdistributor=17 then commonfrdistributor=1; if freshdistributor=18 then commonfrdistributor=1; *changing percentage bagged into numbers*; if percentagebaggedcut=1 then producebaggedcut=10; if percentagebaggedcut=2 then producebaggedcut=25; if percentagebaggedcut=3 then producebaggedcut=50; if percentagebaggedcut=4 then producebaggedcut=75; if percentagebaggedcut=5 then producebaggedcut=100; *trying to fill in blanks for cafecost by putting in averages for each size*; **go back and find the right numbers*; **done!*; if ((cafecost=.) & (districtsize<500)) then cafecost=9339.29; if ((cafecost=.) & ((districtsize>=500) &(districtsize<1000))) then cafecost=19234.69; if ((cafecost=.) & ((districtsize>=1000) & (districtsize<2500))) then cafecost=31875.00; if ((cafecost=.) & ((districtsize>=2500)& (districtsize<5000))) then cafecost=69375.00; if ((cafecost=.) & ((districtsize>=5000) & (districtsize<10000))) then cafecost=63333.33; if ((cafecost=.) & (districtsize>=10000)) then cafecost=139583.33; if districtsize<500 then distsizegroup=1; if ((districtsize>=500) &(districtsize<1000))then distsizegroup=2; if ((districtsize>=1000) & (districtsize<2500))then distsizegroup=3; if ((districtsize>=2500)& (districtsize<5000)) then distsizegroup=4; if ((districtsize>=5000) & (districtsize<10000)) then distsizegroup=5; if (districtsize>=10000) then distsizegroup=6; /*Turning Breakfast into binary*/; if ((breakfast>0)&(breakfast <= 6)) then BreakfastPart=1; if (breakfast =7) then BreakfastPart=0; *putting breakfast into a continuous var*; if breakfast=1 then breakfastp=250; if breakfast=2 then breakfastp=1250; if breakfast=3 then breakfastp=1750; if breakfast=4 then breakfastp=3750; if breakfast=5 then breakfastp=7500; if breakfast=6 then breakfastp=10000;

83
if breakfast=7 then breakfastp=0; if otherbene=0 then otherbene=.; proc print data=completesurvey; var grocer1 grocer2; run; /*Getting the means for cafecosts that are missing for each size*/; *proc freq data=completesurvey; *tables distsizegroup*cafecost; *run; data Ratios; set completesurvey; if cafecost=1 then totalcost=2500; if cafecost=2 then totalcost=15000; if cafecost=3 then totalcost=50000; if cafecost=4 then totalcost=87500; if cafecost=5 then totalcost=125000; if cafecost=6 then totalcost=150000; if freshexpenses2=1 then fresh=250; if freshexpenses2=2 then fresh=1500; if freshexpenses2=3 then fresh=3750; if freshexpenses2=4 then fresh=6500; if freshexpenses2=5 then fresh=9000; if freshexpenses2=6 then fresh=10000; if cafecost=9339.29 then totalcost=9339.29; if cafecost=19234.69 then totalcost=19234.69; if cafecost=31875.00 then totalcost=31875.00; if cafecost=69375.00 then totalcost=69375.00; if cafecost=63333.33 then totalcost=63333.33; if cafecost=139583.33 then totalcost=139583.33; */delete obvious outliers/*; if ((freshexpenses2=3) & (cafecost=1)) then delete; percentagefresh=fresh/totalcost; proc print data=Ratios(obs=276); var fresh totalcost percentagefresh; run; /*we put the word descending p. 18 to predict the highest value of the dependent variable*/; *Proc Logistic tells us the how the likelyhood variable affects Y*"how all vars together affect model*; *this model will have as many *discrete variables as possible*; *possibly put distributor into sizes or even most used*; * all possible variables: breakfastp breakfast summerfeeding population cntpopulation newpercentreduced percentreduced newdelivery openclosed commondistributor commonfrdistributor percentbaggedcut percentagefresh continuingfts*; proc logistic data=ratios descending; title "Model 1: Y affected by all vars";

84
model FTSpart=districtsize percentreduced breakfastp summerfeeding Openclosed deliveryfreq commondistributor commonfrdistributor producebaggedCut percentagefresh; run; data percentfreshgroups; set ratios (obs=276); if ((percentagefresh>0) &(percentagefresh<.05)) then prcntfrsh='1'; if ((percentagefresh>=.05) & (percentagefresh<.15)) then prcntfrsh='2'; if ((percentagefresh>=.15) & (percentagefresh<.25)) then prcntfrsh='3'; if ((percentagefresh>=.25) & (percentagefresh<.50)) then prcntfrsh='4'; if (percentagefresh>=.5) then prcntfrsh='5'; run; proc print data=percentfreshgroups (obs=276) ; var prcntfrsh; run; /*Is multicollinearity an issue?*/; proc corr data=ratios; var districtsize percentreduced breakfastp summerfeeding Openclosed deliveryfreq commondistributor commonfrdistributor producebaggedCut percentagefresh; with FTSpart; run; proc corr data=ratios; var districtsize percentreduced breakfastp summerfeeding Openclosed deliveryfreq commondistributor commonfrdistributor producebaggedCut percentagefresh FTSpart; run; *due to results of this proc corr, believe should leave out commondist and breakfastp, correlated.; /*proc reg will tell us if they are correlated for sure*/; proc reg data=ratios; model FTSpart=districtsize percentreduced breakfastp summerfeeding Openclosed deliveryfreq commondistributor commonfrdistributor producebaggedCut percentagefresh/tol vif; run; /*tried to pick up the problem with distributors but this proc didn't find much,leave it out*; proc logistic des data=ratios; model FTSpart=districtsize percentreduced breakfastp summerfeeding Openclosed deliveryfreq commondistributor commonfrdistributor producebaggedCut percentagefresh; output out=a pred=phat; data b; set a; w=phat*(1-phat); proc reg data=b; weight w; model FTSpart=districtsize percentreduced breakfastp summerfeeding Openclosed deliveryfreq

85
commondistributor commonfrdistributor producebaggedCut percentagefresh/tol vif; run; /*Now will run it with less vars */; proc logistic data=ratios des; title "Model 2: FTS Participation and Less Vars"; model FTSpart=districtsize percentreduced summerfeeding Openclosed commonfrdistributor percentagefresh; run; proc logistic data=ratios des; model FTSpart=districtsize percentreduced summerfeeding Openclosed grocer2 percentagefresh; run; *this will be my final model, only 2 are sig but will be interesting to discuss; proc logistic data=ratios des; model FTSpart=districtsize percentreduced summerfeeding Openclosed commonfrdistributor percentagefresh; run; /*Table1:*/; proc freq data=ratios (obs=276); tables Distsizegroup*(FTSpart breakfastpart summerfeeding openclosed); run; /*Table 2: delivery frequency alone*/; proc freq data=ratios(obs=276); tables deliveryfreq;run; /*Table 2 & 3 & 4*/; proc freq data=ratios(obs=276); tables distsizegroup*(deliveryfreq studentsserveddaily producebaggedcut); run; /*Table 4: wait for new data from Jake*/; proc freq data=ratios(obs=276); tables distsizegroup*(newpercentreduced); run; /*Table 5 & 6*/; proc freq data=ratios(obs=276); tables Distsizegroup*(distributor freshdistributor); run; /*Table 7: districtsize alone*/; proc freq data=ratios(obs=276); tables distsizegroup;run; /*Table 8 & 9: Students served daily and FTS progs alone*/; proc freq data=ratios(obs=276); tables studentsserveddaily pilot statewide localfarmers noprogs;run; /*Table 10: Beneficiaries alone*/; proc freq data=ratios(obs=276); tables Schools Students Farmers community otherbene; run; /*Table 11,12 & 13: Barrier*/; proc freq data=ratios(obs=276); tables barrier in_house resultsrequest;run; /*Table 14*/; data factors; set ratios; if convenience<=8 then convrank=1; if convenience>8 then convrank=2; if DeliveryImportance<=8 then delivrank=1; if DeliveryImportance>8 then delivrank=2;

86
if Consistency<=8 then consistrank=1; if Consistency>8 then consistrank=2; if Expense<=8 then expenserank=1; if Expense>8 then expenserank=2; if Freshness<=8 then Freshnessrank=1; if Freshness>8 then Freshnessrank=2; if ProductQuality<=8 then pqrank=1; if ProductQuality>8 then pqrank=2; if AdjustDelivery<=8 then adjustrank=1; if AdjustDelivery>8 then adjustrank=2; if SpecificProducts<=8 then specrank=1; if SpecificProducts>8 then specrank=2; if Ease<=8 then Easerank=1; if Ease>8 then Easerank=2; if ProduceOrigin<=8 then Originrank=1; if ProduceOrigin>8 then Originrank=2; proc freq data=factors(obs=276); tables convrank delivrank consistrank expenserank freshnessrank pqrank adjustrank specrank easerank originrank; run; ***************************************************************************; /*Table Blah2: districtsize and percentage fresh*/; proc freq data=percentfreshgroups(obs=276); tables distsizegroup*prcntfrsh;run; ***************************************************************************/*Now work on FTS freq tables*/; /*Table 15 All Vars against FTSpart*/; proc freq data=percentfreshgroups(obs=276); tables FTSpart*(distsizegroup newpercentreduced breakfastp summerfeeding Openclosed deliveryfreq commondistributor commonfrdistributor producebaggedCut prcntfrsh); run; proc means data=ratios(obs=276); title "for cont vars"; var districtsize percentreduced breakfastp summerfeeding Openclosed deliveryfreq commondistributor commonfrdistributor producebaggedCut percentagefresh ftspart grocer1 grocer2;run; /*Table 14*/; proc freq data=percentfreshgroups(obs=276); tables FTSpart*breakfastpart; run; proc freq data=percentfreshgroups(obs=276); tables FTSpart*( newpercentreduced prcntfrsh breakfastpart) ; run; Chi-square Code Dm'log;clear;output;clear;'; PROC IMPORT OUT= WORK.AnhFinal DATAFILE= "C:\FarmToSchoolORganized\4 FTS\SurveySasStuff\New Data5_22DoNotChangedoc.xls" DBMS=EXCEL REPLACE; SHEET="Sheet1$"; GETNAMES=YES; MIXED=NO; SCANTEXT=YES;
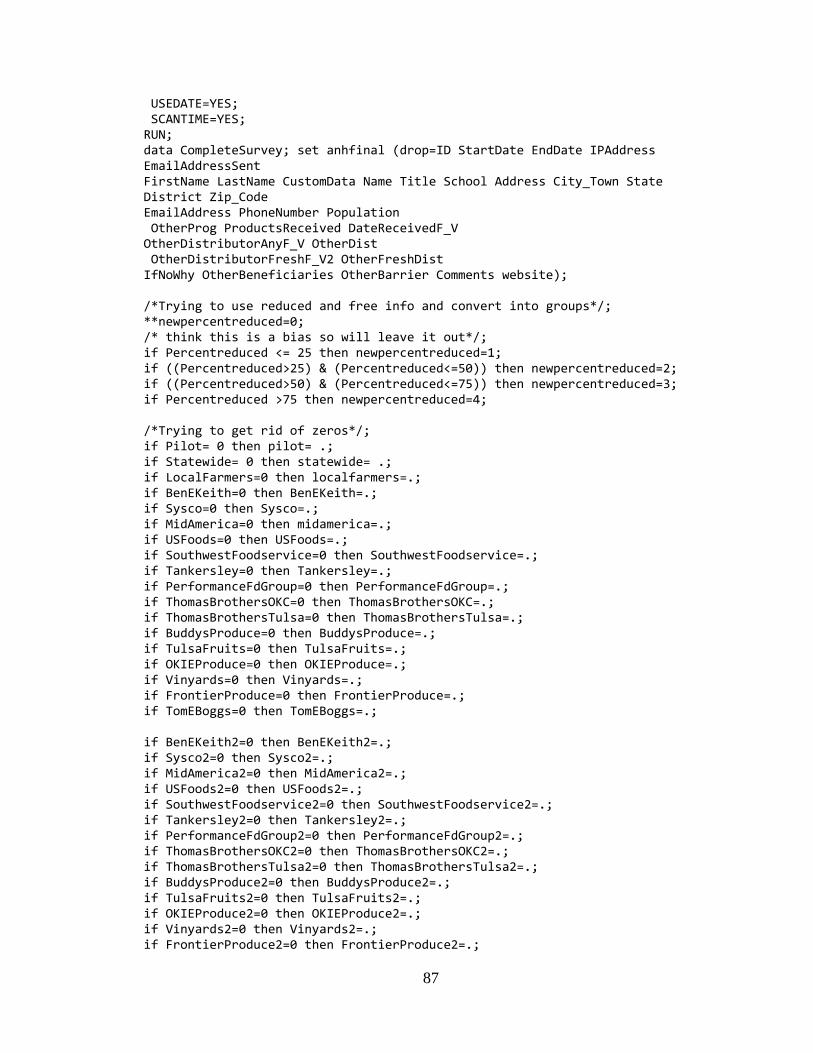
87
USEDATE=YES; SCANTIME=YES; RUN; data CompleteSurvey; set anhfinal (drop=ID StartDate EndDate IPAddress EmailAddressSent FirstName LastName CustomData Name Title School Address City_Town State District Zip_Code EmailAddress PhoneNumber Population OtherProg ProductsReceived DateReceivedF_V OtherDistributorAnyF_V OtherDist OtherDistributorFreshF_V2 OtherFreshDist IfNoWhy OtherBeneficiaries OtherBarrier Comments website); /*Trying to use reduced and free info and convert into groups*/; **newpercentreduced=0; /* think this is a bias so will leave it out*/; if Percentreduced <= 25 then newpercentreduced=1; if ((Percentreduced>25) & (Percentreduced<=50)) then newpercentreduced=2; if ((Percentreduced>50) & (Percentreduced<=75)) then newpercentreduced=3; if Percentreduced >75 then newpercentreduced=4; /*Trying to get rid of zeros*/; if Pilot= 0 then pilot= .; if Statewide= 0 then statewide= .; if LocalFarmers=0 then localfarmers=.; if BenEKeith=0 then BenEKeith=.; if Sysco=0 then Sysco=.; if MidAmerica=0 then midamerica=.; if USFoods=0 then USFoods=.; if SouthwestFoodservice=0 then SouthwestFoodservice=.; if Tankersley=0 then Tankersley=.; if PerformanceFdGroup=0 then PerformanceFdGroup=.; if ThomasBrothersOKC=0 then ThomasBrothersOKC=.; if ThomasBrothersTulsa=0 then ThomasBrothersTulsa=.; if BuddysProduce=0 then BuddysProduce=.; if TulsaFruits=0 then TulsaFruits=.; if OKIEProduce=0 then OKIEProduce=.; if Vinyards=0 then Vinyards=.; if FrontierProduce=0 then FrontierProduce=.; if TomEBoggs=0 then TomEBoggs=.; if BenEKeith2=0 then BenEKeith2=.; if Sysco2=0 then Sysco2=.; if MidAmerica2=0 then MidAmerica2=.; if USFoods2=0 then USFoods2=.; if SouthwestFoodservice2=0 then SouthwestFoodservice2=.; if Tankersley2=0 then Tankersley2=.; if PerformanceFdGroup2=0 then PerformanceFdGroup2=.; if ThomasBrothersOKC2=0 then ThomasBrothersOKC2=.; if ThomasBrothersTulsa2=0 then ThomasBrothersTulsa2=.; if BuddysProduce2=0 then BuddysProduce2=.; if TulsaFruits2=0 then TulsaFruits2=.; if OKIEProduce2=0 then OKIEProduce2=.; if Vinyards2=0 then Vinyards2=.; if FrontierProduce2=0 then FrontierProduce2=.;

88
if TomEBoggs2=0 then TomEBoggs2=.; if ContinuingFTS=999 then ContinuingFTS=.; if Grocery_AllFoods=0 then Grocery_AllFoods=.; if Grocery_FreshStore=0 then Grocery_FreshStore=.; if grocer1=999 then grocer1=.; if grocer2=999 then grocer2=.; if Schools=0 then Schools=.; if Students=0 then Students=.; if Farmers=0 then Farmers=.; if Community=0 then Community=.; if ResultsRequest=0 then ResultsRequest=.; /*Putting deliveryfreq in order*/; /* from twice a week, once a week,twice a month, to once a month*/; if deliveryfrequency=2 then deliveryfreq=8; if deliveryfrequency=1 then deliveryfreq=4; if deliveryfrequency=4 then deliveryfreq=2; if deliveryfrequency=3 then deliveryfreq=1; /*Putting FTS participation into binary form*/; if ((pilot=1) & (statewide=2)) or (pilot=1)or (statewide=2) then FTSpart=1; if (noprogs=4) or ((noprogs=4) & (localfarmers=3)) or (localfarmers=3) then FTSpart=0; /*trying to have all distributors together for non-fresh*/; if benekeith=1 then distributor=1; if sysco=2 then distributor=2; if midamerica=3 then distributor=3; if usfoods=4 then distributor=4; if southwestfoodservice=5 then distributor=5; if tankersley=6 then distributor=6; if performanceFdGroup=7 then distributor=7; if thomasbrothersOKC=8 then distributor=8; if ThomasBrothersTulsa=9 then distributor=9; if buddysproduce=10 then distributor=10; if tulsafruits=11 then distributor=11; if Okieproduce=12 then distributor=12; if vinyards=13 then distributor=13; if frontierproduce=14 then distributor=14; if TomEboggs=15 then distributor=15; if SmallDistAll=17 then distributor=17; if Grocery_AllFoods=18 then distributor=18; /*for fresh alone*/; if BenEKeith2=1 then freshdistributor=1; if Sysco2=2 then freshdistributor=2; if MidAmerica2=3 then freshdistributor=3; if USFoods2=4 then freshdistributor=4; if SouthwestFoodservice2=5 then freshdistributor=5; if Tankersley2=6 then freshdistributor=6; if PerformanceFdGroup2=7 then freshdistributor=7;
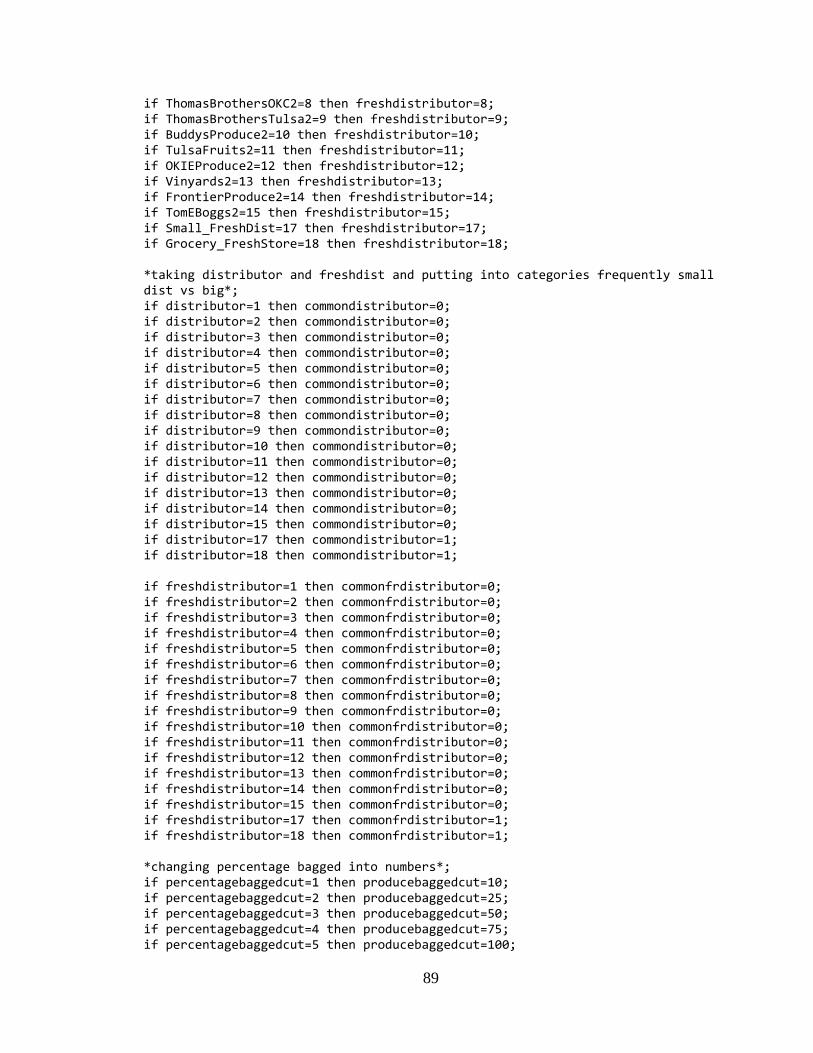
89
if ThomasBrothersOKC2=8 then freshdistributor=8; if ThomasBrothersTulsa2=9 then freshdistributor=9; if BuddysProduce2=10 then freshdistributor=10; if TulsaFruits2=11 then freshdistributor=11; if OKIEProduce2=12 then freshdistributor=12; if Vinyards2=13 then freshdistributor=13; if FrontierProduce2=14 then freshdistributor=14; if TomEBoggs2=15 then freshdistributor=15; if Small_FreshDist=17 then freshdistributor=17; if Grocery_FreshStore=18 then freshdistributor=18; *taking distributor and freshdist and putting into categories frequently small dist vs big*; if distributor=1 then commondistributor=0; if distributor=2 then commondistributor=0; if distributor=3 then commondistributor=0; if distributor=4 then commondistributor=0; if distributor=5 then commondistributor=0; if distributor=6 then commondistributor=0; if distributor=7 then commondistributor=0; if distributor=8 then commondistributor=0; if distributor=9 then commondistributor=0; if distributor=10 then commondistributor=0; if distributor=11 then commondistributor=0; if distributor=12 then commondistributor=0; if distributor=13 then commondistributor=0; if distributor=14 then commondistributor=0; if distributor=15 then commondistributor=0; if distributor=17 then commondistributor=1; if distributor=18 then commondistributor=1; if freshdistributor=1 then commonfrdistributor=0; if freshdistributor=2 then commonfrdistributor=0; if freshdistributor=3 then commonfrdistributor=0; if freshdistributor=4 then commonfrdistributor=0; if freshdistributor=5 then commonfrdistributor=0; if freshdistributor=6 then commonfrdistributor=0; if freshdistributor=7 then commonfrdistributor=0; if freshdistributor=8 then commonfrdistributor=0; if freshdistributor=9 then commonfrdistributor=0; if freshdistributor=10 then commonfrdistributor=0; if freshdistributor=11 then commonfrdistributor=0; if freshdistributor=12 then commonfrdistributor=0; if freshdistributor=13 then commonfrdistributor=0; if freshdistributor=14 then commonfrdistributor=0; if freshdistributor=15 then commonfrdistributor=0; if freshdistributor=17 then commonfrdistributor=1; if freshdistributor=18 then commonfrdistributor=1; *changing percentage bagged into numbers*; if percentagebaggedcut=1 then producebaggedcut=10; if percentagebaggedcut=2 then producebaggedcut=25; if percentagebaggedcut=3 then producebaggedcut=50; if percentagebaggedcut=4 then producebaggedcut=75; if percentagebaggedcut=5 then producebaggedcut=100;

90
*trying to fill in blanks for cafecost by putting in averages for each size*; **go back and find the right numbers*; **done!*; if ((cafecost=.) & (districtsize<500)) then cafecost=9339.29; if ((cafecost=.) & ((districtsize>=500) &(districtsize<1000))) then cafecost=19234.69; if ((cafecost=.) & ((districtsize>=1000) & (districtsize<2500))) then cafecost=31875.00; if ((cafecost=.) & ((districtsize>=2500)& (districtsize<5000))) then cafecost=69375.00; if ((cafecost=.) & ((districtsize>=5000) & (districtsize<10000))) then cafecost=63333.33; if ((cafecost=.) & (districtsize>=10000)) then cafecost=139583.33; if districtsize<500 then distsizegroup=1; if ((districtsize>=500) &(districtsize<1000))then distsizegroup=2; if ((districtsize>=1000) & (districtsize<2500))then distsizegroup=3; if ((districtsize>=2500)& (districtsize<5000)) then distsizegroup=4; if ((districtsize>=5000) & (districtsize<10000)) then distsizegroup=5; if (districtsize>=10000) then distsizegroup=6; /*Turning Breakfast into binary*/; if breakfast <= 6 then BreakfastPart=1; if breakfast =7 then BreakfastPart=0; *putting breakfast into a continuous var*; if breakfast=1 then breakfastp=250; if breakfast=2 then breakfastp=1250; if breakfast=3 then breakfastp=1750; if breakfast=4 then breakfastp=3750; if breakfast=5 then breakfastp=7500; if breakfast=6 then breakfastp=10000; if breakfast=7 then breakfastp=0; if otherbene=0 then otherbene=.; /*Making tables for syposium*/; /* 1)BigSize v. FTSpart summerfeeding breakfastpart openclosed*/; /* 2)BigSize V. Students served meals & breakfast daily*/; /* 3)Bigsize V deliveryfreq*/; /* 4)SML V delivery freq*/; /* 5)Bigsize V Percent precut and bagged*/; /* 6)Bigsizes v Reduced lunch (do both)*/; /* 7)SML V Reduced*/; /* 8)SML sizes V distributors*/; /* 9)SML V expenses*/; proc print data=completesurvey (obs=1); run; /*Getting the means for cafecosts that are missing for each size*/; *proc freq data=completesurvey; *tables distsizegroup*cafecost; *run;

91
data Ratios; set completesurvey; if cafecost=1 then totalcost=2500; if cafecost=2 then totalcost=15000; if cafecost=3 then totalcost=50000; if cafecost=4 then totalcost=87500; if cafecost=5 then totalcost=125000; if cafecost=6 then totalcost=150000; if freshexpenses2=1 then fresh=250; if freshexpenses2=2 then fresh=1500; if freshexpenses2=3 then fresh=3750; if freshexpenses2=4 then fresh=6500; if freshexpenses2=5 then fresh=9000; if freshexpenses2=6 then fresh=10000; if cafecost=9339.29 then totalcost=9339.29; if cafecost=19234.69 then totalcost=19234.69; if cafecost=31875.00 then totalcost=31875.00; if cafecost=69375.00 then totalcost=69375.00; if cafecost=63333.33 then totalcost=63333.33; if cafecost=139583.33 then totalcost=139583.33; */delete obvious outliers/*; if ((freshexpenses2=3) & (cafecost=1)) then delete; percentagefresh=fresh/totalcost; proc print data=Ratios (obs=276); var fresh totalcost percentagefresh; run; **************************************/*Merging data into two groups only*/; ***take all the data and have only 1 df; data chisqtwos; set ratios; if ((distsizegroup>0) &(distsizegroup<=3)) then districtlvl=0; if distsizegroup>3 then districtlvl=1; if ((breakfastp>0) &(breakfastp<=1750)) then breakfastlvl=0; if breakfastp>1750 then breakfastlvl=1; if ((deliveryfreq>0) & (deliveryfreq<=2)) then deliverylvl=0; if deliveryfreq>2 then deliverylvl=1; if ((producebaggedcut>0) &(producebaggedcut<=25)) then producebagcutlvl=0; if producebaggedcut>25 then producebagcutlvl=1; if ((percentagefresh>0)&(percentagefresh<=.20)) then prcntfrshlvl=0; if percentagefresh>.20 then prcntfrshlvl=1; if ((newpercentreduced>0)&(newpercentreduced<=2)) then newprcntreducedlvl=0; *this is 50 percent or less; if newpercentreduced>2 then newprcntreducedlvl=1; run; proc freq data=chisqtwos (obs=276); tables FTSpart*(districtlvl breakfastlvl summerfeeding openclosed deliverylvl producebagcutlvl newprcntreducedlvl prcntfrshlvl commondistributor commonfrdistributor grocer1 grocer2)/chisq;run; proc freq data=chisqtwos (obs=276); tables FTSpart*( newprcntreducedlvl )/chisq;run;

92
LOF Code PROC IMPORT OUT= WORK.anhfinal DATAFILE= "F:\Anh'sStuff\4 FTS\SurveySasStuff\NewData5_22DoN otChangedoc.xls" DBMS=EXCEL REPLACE; SHEET="Sheet1$"; GETNAMES=YES; MIXED=NO; SCANTEXT=YES; USEDATE=YES; SCANTIME=YES; RUN; data CompleteSurvey; set anhfinal (drop=ID StartDate EndDate IPAddress EmailAddressSent FirstName LastName CustomData Name Title School Address City_Town State District Zip_Code EmailAddress PhoneNumber Population OtherProg ProductsReceived DateReceivedF_V OtherDistributorAnyF_V OtherDist OtherDistributorFreshF_V2 OtherFreshDist IfNoWhy OtherBeneficiaries OtherBarrier Comments website); /*Trying to use reduced and free info and convert into groups*/; **newpercentreduced=0; /* think this is a bias so will leave it out*/; if Percentreduced <= 25 then newpercentreduced=1; if ((Percentreduced>25) & (Percentreduced<=50)) then newpercentreduced=2; if ((Percentreduced>50) & (Percentreduced<=75)) then newpercentreduced=3; if Percentreduced >75 then newpercentreduced=4; /*Trying to get rid of zeros*/; if Pilot= 0 then pilot= .; if Statewide= 0 then statewide= .; if LocalFarmers=0 then localfarmers=.; if BenEKeith=0 then BenEKeith=.; if Sysco=0 then Sysco=.; if MidAmerica=0 then midamerica=.; if USFoods=0 then USFoods=.; if SouthwestFoodservice=0 then SouthwestFoodservice=.; if Tankersley=0 then Tankersley=.; if PerformanceFdGroup=0 then PerformanceFdGroup=.; if ThomasBrothersOKC=0 then ThomasBrothersOKC=.; if ThomasBrothersTulsa=0 then ThomasBrothersTulsa=.; if BuddysProduce=0 then BuddysProduce=.; if TulsaFruits=0 then TulsaFruits=.; if OKIEProduce=0 then OKIEProduce=.; if Vinyards=0 then Vinyards=.; if FrontierProduce=0 then FrontierProduce=.; if TomEBoggs=0 then TomEBoggs=.; if BenEKeith2=0 then BenEKeith2=.; if Sysco2=0 then Sysco2=.; if MidAmerica2=0 then MidAmerica2=.; if USFoods2=0 then USFoods2=.;

93
if SouthwestFoodservice2=0 then SouthwestFoodservice2=.; if Tankersley2=0 then Tankersley2=.; if PerformanceFdGroup2=0 then PerformanceFdGroup2=.; if ThomasBrothersOKC2=0 then ThomasBrothersOKC2=.; if ThomasBrothersTulsa2=0 then ThomasBrothersTulsa2=.; if BuddysProduce2=0 then BuddysProduce2=.; if TulsaFruits2=0 then TulsaFruits2=.; if OKIEProduce2=0 then OKIEProduce2=.; if Vinyards2=0 then Vinyards2=.; if FrontierProduce2=0 then FrontierProduce2=.; if TomEBoggs2=0 then TomEBoggs2=.; if ContinuingFTS=999 then ContinuingFTS=.; if Grocery_AllFoods=0 then Grocery_AllFoods=.; if Grocery_FreshStore=0 then Grocery_FreshStore=.; if grocer1=999 then grocer1=.; if grocer2=999 then grocer2=.; if Schools=0 then Schools=.; if Students=0 then Students=.; if Farmers=0 then Farmers=.; if Community=0 then Community=.; if ResultsRequest=0 then ResultsRequest=.; /*Putting deliveryfreq in order*/; /* from twice a week, once a week,twice a month, to once a month*/; if deliveryfrequency=2 then deliveryfreq=8; if deliveryfrequency=1 then deliveryfreq=4; if deliveryfrequency=4 then deliveryfreq=2; if deliveryfrequency=3 then deliveryfreq=1; /*Putting FTS participation into binary form*/; if ((pilot=1) & (statewide=2)) or (pilot=1)or (statewide=2) then FTSpart=1; if (noprogs=4) or ((noprogs=4) & (localfarmers=3)) or (localfarmers=3) then FTSpart=0; /*trying to have all distributors together for non-fresh*/; if benekeith=1 then distributor=1; if sysco=2 then distributor=2; if midamerica=3 then distributor=3; if usfoods=4 then distributor=4; if southwestfoodservice=5 then distributor=5; if tankersley=6 then distributor=6; if performanceFdGroup=7 then distributor=7; if thomasbrothersOKC=8 then distributor=8; if ThomasBrothersTulsa=9 then distributor=9; if buddysproduce=10 then distributor=10; if tulsafruits=11 then distributor=11; if Okieproduce=12 then distributor=12; if vinyards=13 then distributor=13; if frontierproduce=14 then distributor=14; if TomEboggs=15 then distributor=15; if SmallDistAll=17 then distributor=17;

94
if Grocery_AllFoods=18 then distributor=18; /*for fresh alone*/; if BenEKeith2=1 then freshdistributor=1; if Sysco2=2 then freshdistributor=2; if MidAmerica2=3 then freshdistributor=3; if USFoods2=4 then freshdistributor=4; if SouthwestFoodservice2=5 then freshdistributor=5; if Tankersley2=6 then freshdistributor=6; if PerformanceFdGroup2=7 then freshdistributor=7; if ThomasBrothersOKC2=8 then freshdistributor=8; if ThomasBrothersTulsa2=9 then freshdistributor=9; if BuddysProduce2=10 then freshdistributor=10; if TulsaFruits2=11 then freshdistributor=11; if OKIEProduce2=12 then freshdistributor=12; if Vinyards2=13 then freshdistributor=13; if FrontierProduce2=14 then freshdistributor=14; if TomEBoggs2=15 then freshdistributor=15; if Small_FreshDist=17 then freshdistributor=17; if Grocery_FreshStore=18 then freshdistributor=18; *taking distributor and freshdist and putting into categories frequently small dist vs big*; if distributor=1 then commondistributor=0; if distributor=2 then commondistributor=0; if distributor=3 then commondistributor=0; if distributor=4 then commondistributor=0; if distributor=5 then commondistributor=0; if distributor=6 then commondistributor=0; if distributor=7 then commondistributor=0; if distributor=8 then commondistributor=0; if distributor=9 then commondistributor=0; if distributor=10 then commondistributor=0; if distributor=11 then commondistributor=0; if distributor=12 then commondistributor=0; if distributor=13 then commondistributor=0; if distributor=14 then commondistributor=0; if distributor=15 then commondistributor=0; if distributor=17 then commondistributor=1; if distributor=18 then commondistributor=1; if freshdistributor=1 then commonfrdistributor=0; if freshdistributor=2 then commonfrdistributor=0; if freshdistributor=3 then commonfrdistributor=0; if freshdistributor=4 then commonfrdistributor=0; if freshdistributor=5 then commonfrdistributor=0; if freshdistributor=6 then commonfrdistributor=0; if freshdistributor=7 then commonfrdistributor=0; if freshdistributor=8 then commonfrdistributor=0; if freshdistributor=9 then commonfrdistributor=0; if freshdistributor=10 then commonfrdistributor=0; if freshdistributor=11 then commonfrdistributor=0; if freshdistributor=12 then commonfrdistributor=0; if freshdistributor=13 then commonfrdistributor=0; if freshdistributor=14 then commonfrdistributor=0;

95
if freshdistributor=15 then commonfrdistributor=0; if freshdistributor=17 then commonfrdistributor=1; if freshdistributor=18 then commonfrdistributor=1; *changing percentage bagged into numbers*; if percentagebaggedcut=1 then producebaggedcut=10; if percentagebaggedcut=2 then producebaggedcut=25; if percentagebaggedcut=3 then producebaggedcut=50; if percentagebaggedcut=4 then producebaggedcut=75; if percentagebaggedcut=5 then producebaggedcut=100; *trying to fill in blanks for cafecost by putting in averages for each size*; **go back and find the right numbers*; **done!*; if ((cafecost=.) & (districtsize<500)) then cafecost=9339.29; if ((cafecost=.) & ((districtsize>=500) &(districtsize<1000))) then cafecost=19234.69; if ((cafecost=.) & ((districtsize>=1000) & (districtsize<2500))) then cafecost=31875.00; if ((cafecost=.) & ((districtsize>=2500)& (districtsize<5000))) then cafecost=69375.00; if ((cafecost=.) & ((districtsize>=5000) & (districtsize<10000))) then cafecost=63333.33; if ((cafecost=.) & (districtsize>=10000)) then cafecost=139583.33; if districtsize<500 then distsizegroup=1; if ((districtsize>=500) &(districtsize<1000))then distsizegroup=2; if ((districtsize>=1000) & (districtsize<2500))then distsizegroup=3; if ((districtsize>=2500)& (districtsize<5000)) then distsizegroup=4; if ((districtsize>=5000) & (districtsize<10000)) then distsizegroup=5; if (districtsize>=10000) then distsizegroup=6; /*Turning Breakfast into binary*/; if breakfast <= 6 then BreakfastPart=1; if breakfast =7 then BreakfastPart=0; *putting breakfast into a continuous var*; if breakfast=1 then breakfastp=250; if breakfast=2 then breakfastp=1250; if breakfast=3 then breakfastp=1750; if breakfast=4 then breakfastp=3750; if breakfast=5 then breakfastp=7500; if breakfast=6 then breakfastp=10000; if breakfast=7 then breakfastp=0; if otherbene=0 then otherbene=.; /*Making tables for syposium*/; /* 1)BigSize v. FTSpart summerfeeding breakfastpart openclosed*/; /* 2)BigSize V. Students served meals & breakfast daily*/; /* 3)Bigsize V deliveryfreq*/; /* 4)SML V delivery freq*/; /* 5)Bigsize V Percent precut and bagged*/; /* 6)Bigsizes v Reduced lunch (do both)*/; /* 7)SML V Reduced*/;

96
/* 8)SML sizes V distributors*/; /* 9)SML V expenses*/; proc print data=completesurvey (obs=1); run; /*Getting the means for cafecosts that are missing for each size*/; *proc freq data=completesurvey; *tables distsizegroup*cafecost; *run; data Ratios; set completesurvey; if cafecost=1 then totalcost=2500; if cafecost=2 then totalcost=15000; if cafecost=3 then totalcost=50000; if cafecost=4 then totalcost=87500; if cafecost=5 then totalcost=125000; if cafecost=6 then totalcost=150000; if freshexpenses2=1 then fresh=250; if freshexpenses2=2 then fresh=1500; if freshexpenses2=3 then fresh=3750; if freshexpenses2=4 then fresh=6500; if freshexpenses2=5 then fresh=9000; if freshexpenses2=6 then fresh=10000; if cafecost=9339.29 then totalcost=9339.29; if cafecost=19234.69 then totalcost=19234.69; if cafecost=31875.00 then totalcost=31875.00; if cafecost=69375.00 then totalcost=69375.00; if cafecost=63333.33 then totalcost=63333.33; if cafecost=139583.33 then totalcost=139583.33; */delete obvious outliers/*; if ((freshexpenses2=3) & (cafecost=1)) then delete; percentagefresh=fresh/totalcost; proc print data=Ratios; var fresh totalcost percentagefresh; run; proc means data=ratios; var percentagefresh districtsize; run; *with lackfit; proc logistic des data=ratios (obs=276) ; model FTSpart=districtsize percentreduced summerfeeding Openclosed commonfrdistributor percentagefresh/lackfit; run; proc logistic des data=ratios(obs=276); model FTSpart=districtsize percentreduced commonfrdistributor percentagefresh/lackfit; run; proc logistic des data=ratios(obs=276); model FTSpart=districtsize

97
commonfrdistributor percentagefresh/lackfit; run; *with rsq; proc logistic des data=ratios(obs=276); model FTSpart=districtsize percentreduced summerfeeding Openclosed commonfrdistributor percentagefresh/rsq; run; proc logistic des data=ratios(obs=276); model FTSpart=districtsize percentreduced commonfrdistributor percentagefresh/rsq; run; proc logistic des data=ratios(obs=276); model FTSpart=districtsize commonfrdistributor percentagefresh/rsq; run;

VITA
Anh Vo
Candidate for the Degree of
Master of Science
Thesis: OKLAHOMA FARM-TO-SCHOOL ECONOMIC VIABILITY AND EFFICIENCY Major Field: Agricultural Economics Biographical:
Personal Data: Born in Tulsa, Oklahoma on September 28, 1980, daughter of Vien and Diep Vo, and sister of Quoc and Andy.
Education: Graduated for Booker T. Washington High School, Tulsa, Oklahoma
in May 1999; received a Bachelor of Arts degree in political science and French in May 2003; and completed the requirements for the Master of Science in agricultural economics at Oklahoma State University, Stillwater, Oklahoma in December, 2009.
Experience: Agricultural Extension Peace Corps volunteer in Senegal, West
Africa, 2003-2005; Graduate Research assistant, Department of Agricultural Economics, Oklahoma State University, August 2007 to August 2009.
Professional Memberships: AAEA, Gamma Sigma Delta, and Phi Beta Delta

ADVISER’S APPROVAL: Rodney Holcomb
Name: Anh Ngoc Vo Date of Degree: December, 2009 Institution: Oklahoma State University Location: OKC or Stillwater, Oklahoma Title of Study: OKLAHOMA FARM-TO-SCHOOL ECONOMIC VIABILITY AND
EFFICIENCY Pages in Study: 97 Candidate for the Degree of Master of Science
Major Field: Agricultural Economics Scope and Method of Study: This study analyzes characteristics of school districts
associated with Farm-to-school participation (FTS) by using logit models. In addition, a transportation cost template was created to determine a least cost method to distribute FTS commodities.
Findings and Conclusions: Among the variables used in the logit model, three are
statistically significant. District size and the budget for produce are positively related to FTS participation; whereas, food distributor type is negatively related to FTS participation. The information and tools provided in this study will be useful to farmers, school food personnel, and policy makers when making decisions to implement FTS programs.