family structure final
DESCRIPTION
Family Structure FinalTRANSCRIPT
EIGHT
SUBSYSTEMS
Housing
Recreation
Politics and government
Fire and safety
Education
Communication
Health
economics
HOUSING

A house satisfies the need for subsistence by offering shelter. In this regard, it is
considered to provide sufficient living area for household members if not more than two
people share the same room. It is central to household functionality and productivity,
social harmony and the development of a healthy and sustainable economy. Studies
have shown that a lack of adequate housing reduces productive opportunities and
increases physical and psychological well-being. Households are the basic organizing
units of socio-cultural institutions of civil society.
According to the 2010 Socio Economic profile of Paranque City, Barangay
Tambo is part of the list of depressed areas. The residential housing of Barangay
Tambo is mostly poorly regulated, and can be primarily described as shanty. Even
though there are housing laws/regulations that govern, they are not being adhered to, at
least not by the “informal” settlers. Most homes are not professionally built and are
made out of mixed materials, primarily of wood, and with little steel and concrete.
There is also unsatisfactory lighting and ventilation due to most homes being built
adjacent to each other. In addition, there is also the presence of poor drainage and
sewage system in the area that breeds bacterial pathogens and make the area prone to
flooding. Due to these factors, the residential housing of Barangay Tambo is at risk to
several dangers such as fire hazards and health related concerns.
RECREATION
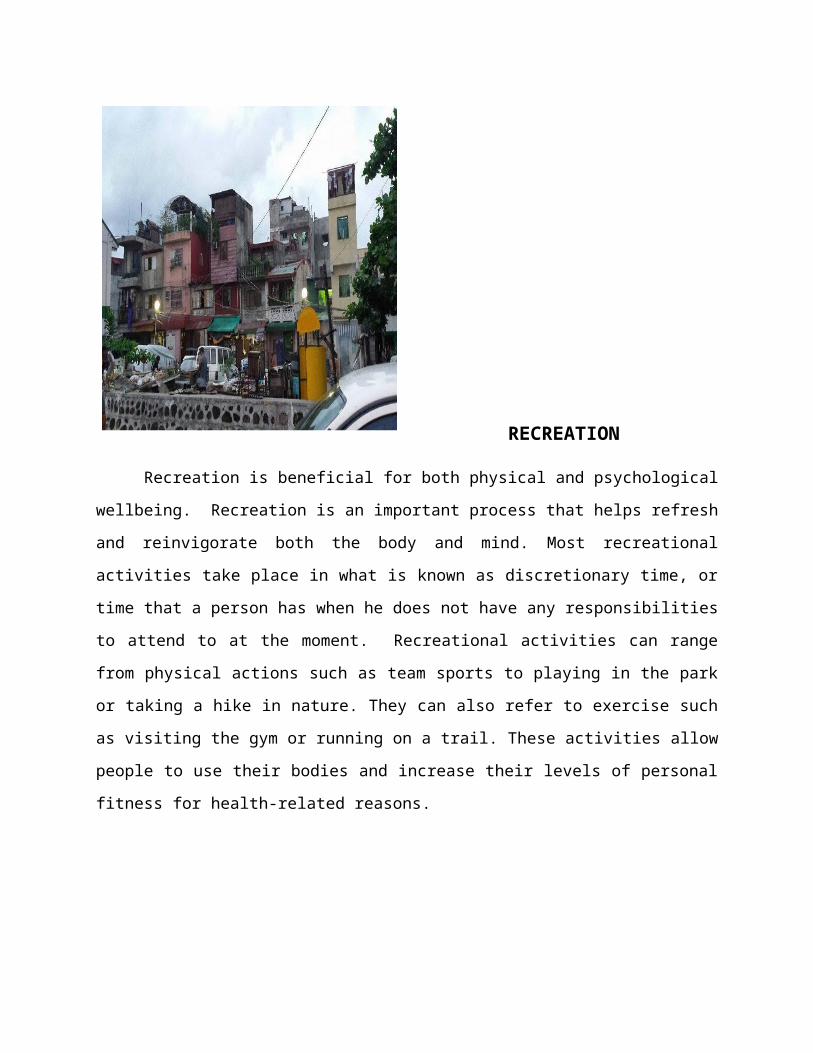
Recreation is beneficial for both physical and psychological wellbeing.
Recreation is an important process that helps refresh and reinvigorate both the body
and mind. Most recreational activities take place in what is known as discretionary time,
or time that a person has when he does not have any responsibilities to attend to at the
moment. Recreational activities can range from physical actions such as team sports to
playing in the park or taking a hike in nature. They can also refer to exercise such as
visiting the gym or running on a trail. These activities allow people to use their bodies
and increase their levels of personal fitness for health-related reasons.
Based from our team’s observation of Barangay Tambo’s recreational activity
outlets, recreational activities varies based on age groups. As expected, most young
children from toddlers to school age mainly play among their peers outside their homes.
Young adults play sports at the nearby gymnasium such as basketball and volleyball.
There are also PC cafes where a mixture of age groups spends their leisure time
playing PC games and surfing the net. As for the older adults, they mostly chat with
their friends and neighbors, singing karaoke, and drinking alcoholic beverages.
POLITICS AND GOVERNMENT

The government passes the laws, provides law enforcement, provides local and
national protection, and oversees a country's infrastructure. Most governments also
provide education for its citizens and some provide health care, and may provide a wide
variety of other types of services. Local governments, city, and state governments have
a role in providing these things and for collecting the taxes to pay for them. Government
is important because it control the scale of the population, tax and make policy for the
country and agency to regulate it. Government guides society and creates norms and
expectations for behavior. Government ensures stability and reasonable peace in
which to live and work. Good government requires quality leadership.
A community leader is a socially and/or politically prominent and respected
member of a community. Their role is one of the most important parts to building a
strong community. There many other factors that help or hinder progress, but it is
leadership that makes everything else that goes into creating a great community
possible; leadership is the indispensible element of success.
The Punong Barangay, commonly known as the Barangay Captain and less
commonly Barangay Chairman, is the highest elected official in a barangay, the
smallest of the elected administrative divisions of the Philippines. Barangay Tambo’s
local leadership is headed by Barangay Chairman: Capt. Godofredo B. De Leon.
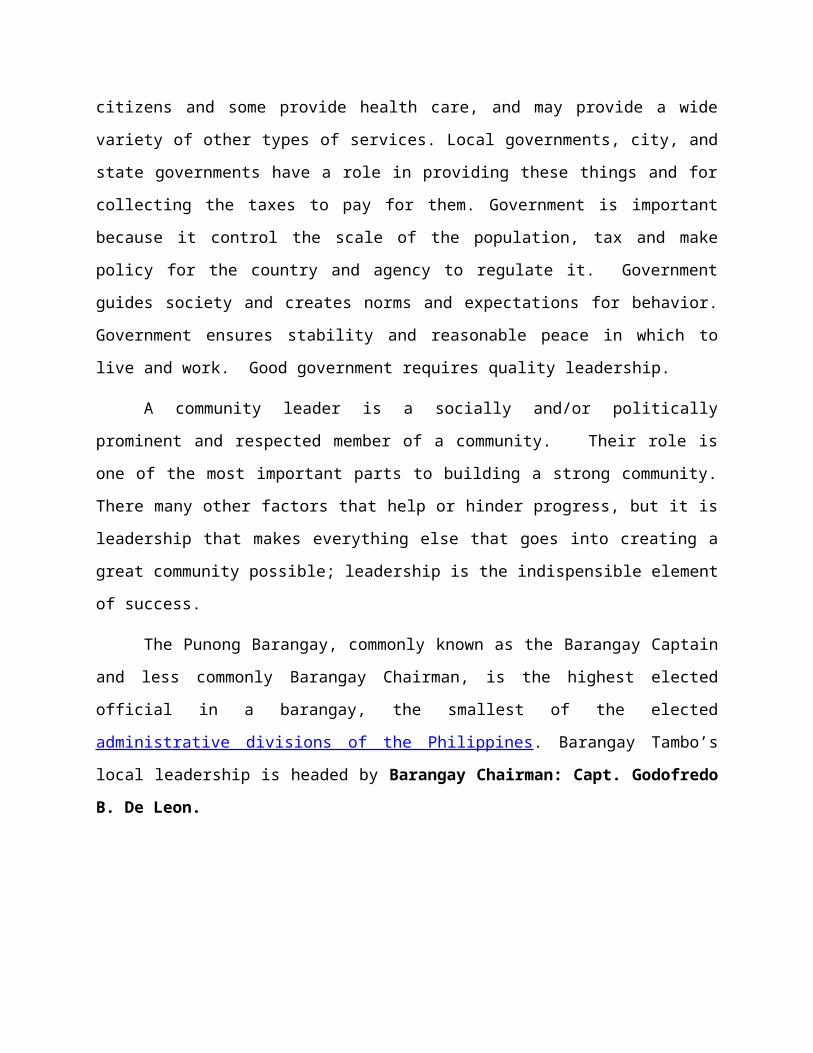
Based on our team’s interviews about Barangay Tambo residents’ current
government and political opinions, it is unfortunate to report that most do not have
favorable views about their political leaders at the national level, but are at least content
with the local level.
EDUCATION
Education has a great social importance especially in the modern, complex
industrialized societies. Philosophers of all periods, beginning with ancient stages,
devoted to it a great deal of attention. The main social objective of education is to
complete the socialization process. The family gets the child, but the modern family
tends to leave much undone in the socialization process. The school and other
institutions have come into being in place of family to complete the socialization
process, among other important objectives.
According to the 2010 Paranaque City Socio-Economic Profile, Barangay Tambo
has (3) Three Day Care Centers: Seaside day care center I, Seaside Day Care Center
II, and Puyat Compound Day Care Center; With 2 or 3 sessions in each Day Care
Center, the average class accommodates 40 pupils per session. (2) Two Public
Elementary Schools: Tambo E.S Main, Tambo E.S Unit I. (3) Listed private schools:
Martyrs Enumerical School, Growing Place Pre-School, Clay and Potter. There ARE no
Public or Private High Schools and Universities located within the vicinity of Barangay
Tambo.
Tambo Elementary School caters to 5-12 years old children living within
Barangay Tambo of Parañaque City. The school uses the Reformed Basic Education
Curriculum (RBEC) for all the Grade levels and provides the entire mean for the basic
education access.
As of date, there are 20 teaching personnel – 19 are permanent teachers while 1
is still a contractual. The plantilla items of these teachers were all original item of the
said in the Division of Parañaque City. At present, Ms. Myla R. Velasquez, Master
Teacher II, is designated as the officer-in-charge of the school. The school has seven
(7) non-teaching personnel (2 watchmen and 5 administrative aides) whose salaries are
funded by the Local School Board SEF.
There is only one main building which houses the 11 instructional rooms – 10
Grade School classrooms, and 1 Kinder Classroom and 5 non-instructional rooms –
library, guidance, canteen, principal’s room and multi-purpose room.
The school is located at C. Santos Street, Brgy. Tambo, Parañaque City which is
in front of Camp Claudio. The landmarks near the school are the Camp Claudio, St.
Joseph Church, and Tambo Elementary School Main. The school can be accessed
using Quirino Avenue. The people surrounding the school belong to the low to average
economic class. However, most of the pupils enrolled in the school come from Seaside
Portion of Brgy. Tambo along Coastal Road. Ninety-five percent (95%) of the students
are Brgy. Tambo residents while only five percent (5%) came from the neighbor
barangay in Parañaque City. About thirty percent (30%) of the pupils enrolled belong to
the middle and above average income bracket while seventy percent (70%) are from
the lower economic bracket.

COMMUNICATIONS
Community development is the process of helping a community to strengthen
itself and develop towards its full potential. Communication is a key component of
sustainable development. Mobilizing community members for community development
purpose is important but members of communities can only be mobilized when
communication is effective. Adequate community communication leads to effective
collaborative efforts in issue of development. Communication will help engage citizens
in development.
Barangay Tambo is under the governance of the city of Parañaque. The existing
telecommunication network of Parañaque is being served by PLDT andSMART but,
PLDT covers the largest cross section of the sixteen barangays. Expansion and
upgrading of then system by way of XC5 Program is completed from Barangay San
Antonio up to the South Superhighway including Moonwalk, Don Bosco, and Merville.
The program also includes Sucat Barangay San Isidro, San Dionisio and La Huerta.
This includes the completion and expansion of projects in Barangays Baclaran, Tambo,
Don Galo, Sto. Niño, Ninoy Aquino Ave., San Martin de Porres and the Coastal Marina
and Asia World areas. Four (4) telecommunication companies serve Parañaque
namely: GLOBE, SMART, PLDT, and SUN. Parañaque Central Post Office and an
annex in the City Hall serve the postal system.
HEALTH
According to the World Health Organization (WHO), “health is a state of complete
physical, social and mental well-being, and not merely the absence of disease or
infirmity. Health is a resource for everyday life, not the object of living, and is a positive
concept emphasizing social and personal resources as well as physical capabilities.
Health is a fundamental human right, recognized in the Universal Declaration of Human
Rights (1948). It is also an essential component of development, vital to a nation's
economic growth and internal stability. Along with the traditional and unequivocal
arguments on social justice and the importance of health, it is now accepted that better
health outcomes play a crucial role in reducing poverty.”
Barangay Tambo health care needs are accommodated by the City of
Paranaque. The Paranaque City Health Office deliver its health services through
promotion, protection, preservation and restoration of health of the people in 16 health
centers , 5 barangay stations and 7 lying –ins . On the other hand, the curative aspect is
taken cared of by 6 private and one [1] public hospital.
Health Profile of Paranaque City
Health Services
The city’s health situation in the last five (7) years can be highly evaluated as for
being the recipient of Healthy City by the Alliance of Healthy Cities of Western
Pacific Region. A healthy city is a process of improving the health of city dwellers
through improved living condition and better health services with various urban
development activities through the partnership of public, private and voluntary sectors.
Births
The crude birth rate is a measure of the increase of population through birth
statistics of birth population and registered in the Office of the Civil Registrar. In 2012,
the City had recorded 7,777 live births by a crude birth rate of 12.4 per thousand live
births. This figure is lower than the previous year, of which 13.13 per one thousand live
births. Of these live births, 3,993 (51.34%) were male while 3,784 (48.66%) were
female. In 2012, ninety one (91) percent of deliveries were attended by trained/skilled
health personnel. Of which, 59 % were doctors, 32.08 % were mid-wives, 8.92 % were
hilots. Almost 9 for every 10 deliveries were attended by trained health personnel. Small
proportion, 22.91% or 1,782 of deliveries were done at home. 37.38 % or 2,907
deliveries were done in government/private hospitals, 1,679 or 21.59 % in lying in and
1,373 or 17.65 % in clinics.
Morbidity
A total of 35,640 patients were seen and examined by the different health
centers. Upper Respiratory Tract Infection with a rate of 190.12/ 10, 000 population
remains the leading cause of morbidity in Paranaque.This was followed by wound
(45.16 rate) and Animal Bite (37.20 rate). Other causes of morbidity are Tuberculosis
(21.81 rate), Bronchitis, all forms (17.62 rate), Hypertension (17.28 rate), Urinary Tract
Infection(16.35 rate), Diarrhea (14.92 rate), Dermatosis (10.98 rate) and
Tonsillopharyngitis (10.90 rate). Among children less than 5 years, majority with 55.37%
of the cases were seen due to Upper Respiratory Tract Infection, the leading cause of
morbidity followed by Diarrhea, Bronchitis, and Pneumonia.
Mortality
Crude Death Rate [CDR] is a measure of one -mortality from all causes which
may result in a decrease population. A steady increase in CDR was noted from 2008 –
2011 but a slight decrease in 2012. There was 0.09 decrease in CDR in 2012 (3.79
deaths/1,000 population) as compared to the average (3.70) of the previous 5
years. There were 2,380 deaths from all causes in 2012 with the crude death rate of
3.79 per 1000 population.It was slightly lower compared to the CDR last 2011. Highest
number of deaths was reported in Barangay San Dionisio with 283 deaths, followed by
Barangay San Isidro with 269 deaths and Barangay BF with 268 deaths. In 2012,
highest number of deaths (388) was due to Coronary Artery Diseases, 272 deaths were
due to Pneumonia, and 261 deaths due to Cancer. Other causes of deaths were
Diabetes Mellitus, Hypertension, Renal Disease, Tuberculosis, and Bronchial Asthma.
Infant Mortality
Infant mortality is the death of an infant under one year of age. Infant mortality
rate (IMR) measures the risk of dying during the first year of life. It is a good index of the
general health condition of a community since it reflects the changes in the
environmental and medical conditions of a community. There were 106 infant deaths
from all causes with a crude death rate of 13.63 per 1000 livebirths in 2012. This was
2.15 deaths/ 1000 livebirths lower compared to the average of the past 5 years. Highest
in Barangay Marcelo Green with the highest IMR with 27.44 infant deaths / 1000
livebirths, followed by Barangay Don Bosco and San Antonio with 22.04 infant deaths
and with 18.0 infant deaths per 1000 livebirths respectively. Sepsis, Pneumonia and
prematurity were the top leading causes of infant mortality in the city.
Mortality of Children Less Than 5 Year
A total of 144 deaths among children less than 5 years registered in 2012 with a
proportionate mortality ratio of 18.52 deaths per 1000 livebirths. Barangay Don Bosco
had the highest rate with 32 deaths/ 1000 livebirths followed by Barangay Marcelo
Green and San Antonio with recorded 30 deaths and 26 deaths per 1000 livebirths
respectively. Common causes of deaths for children less than 5 years were Sepsis
Neonatorum (25.69%), Pneumonia (25%), and Prematurity (9.72%). Other causes of
death for children less than 5 years were Gastroentiritis, Asphyxia, Aspiration, Bronchial
Asthma, Dengue Fever, Sepsis and Accident.
Maternal Mortality
Maternal death is the death of a woman while pregnant or within 42 days
of termination pregnancy, irrespective of the duration and the site of the pregnancy,
from any cause relative to or aggravated by pregnancy or its management, but not from
accidental or incidental causes. Maternal Mortality Rate (MMR) measures the risk of
dying from causes relative to pregnancy, and childbirth. It is an index of the obstetrical
care needed and received by the women in the community. There were 4 maternal
death reported in 2012 with a maternal moratlity ratio of 0.51 deaths per 1000 livebirths
in 2012. This was 16.39 % lower compared last year. Barangay Merville had the highest
MMR recorded with 6.62 deaths / 1000 livebirths, followed by Barangay Don Bosco and
Barangay Moonwalk with 2 and 1.82 deaths /1000 livebirths respectively. Causes of

maternal deaths were ruptured ectopic pregnancy, pulmonary trombo embolism, post-
partum hemorrhage and abruption placenta.
Health Resources
The Paranaque City Health Office deliver its health services through
promotion, protection, preservation and restoration of health of the people in 16 health
centers , 5 barangay stations and 7 lying –ins . On the other hand, the curative aspect is
taken cared of by 6 private and one [1] public hospital.
A. Health Manpower
The total health manpower compliment was 323 permanent, casual and job
order personnel. This comprises the following: 22 Medical Officers, 23 Dentists, 16
Medical Technologists, 70 Nurses, 5 Nutritionist-Dietician, 32 Nursing Attendants, 48
midwives, 30 Sanitary Inspectors, 183 Barangay Health Workers and Administrative
Support Staff.
Health Budget
The City Health Office has a total budget of Php 197,488,932.81 in the current
year 2013 which is 5.37% of the total city budget. Of this office budget, 92.58% or
Php 182,840,784.81 is appropriated for personnel services. About 7.42% or
14,648,148.00 will be utilized for maintenance and other operating expenses. There is
no appropriation for capital outlay.
B. NUTRITION
Being underweight, even mild increases the risk of death and inhibits
cognitive development in children. This leads to less fit and productive adults in the
future. Moreover, it perpetuates the problem from one generation to the next through
malnourished women having low birth weight babies.
Parañaque City ranks 15 among cities with low prevalence rate of Slight increase
in OPT coverage, 91.10% to 91.52% makes the city find more underweight children.
Among the 16 barangays in Parañaque, Barangay BF and Barangay San Isidro have
the highest prevalence of malnutrition among Preschool Children with 261 and 252

Underweight Children respectively. Barangay Baclaran ranked third with 190
underweight children and with high prevalence rate. However, Barangay La Huerta, the
second smallest population in the city with estimated population size of 9,525 registered
58 malnourished children.
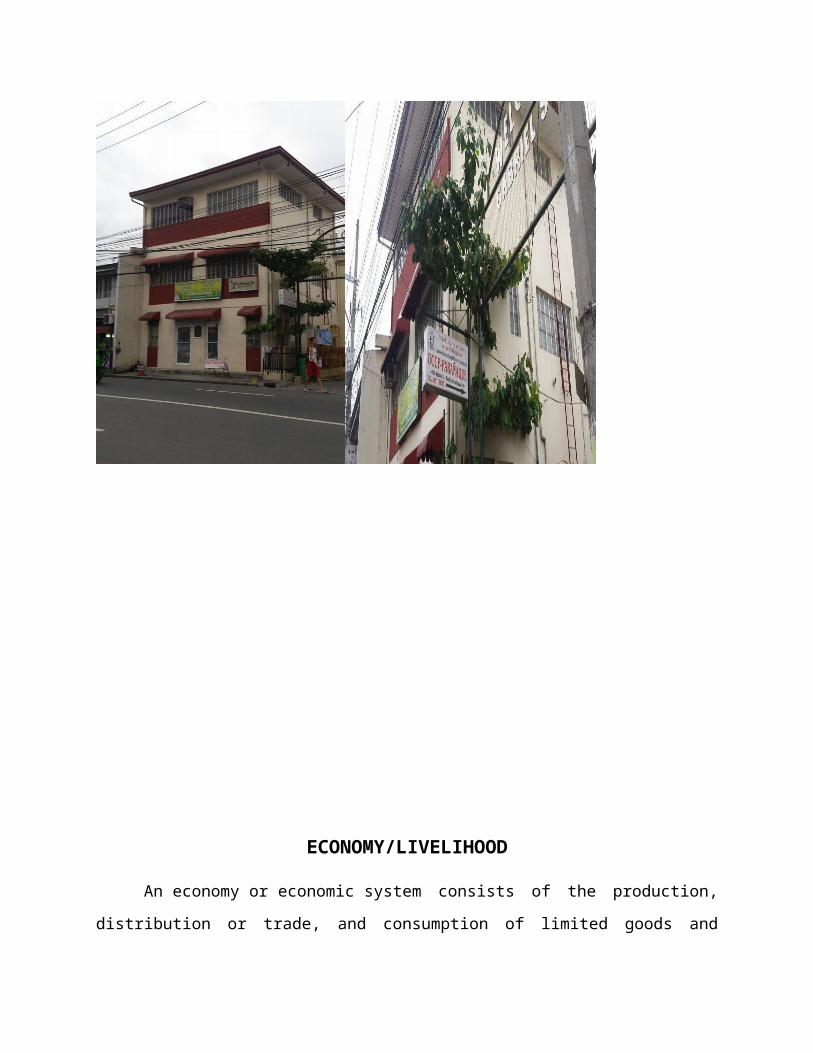
ECONOMY/LIVELIHOOD
An economy or economic system consists of the production, distribution or trade,
and consumption of limited goods and services by different agents in a given
geographical location. The economic agents can be individuals, businesses,
organizations, or governments. For society, the economy provides a scientific approach
to analyzing and understanding government decisions for ensuring stable economic
growth with low inflation and the highest possible level of employment. Economic
methods also provide the tools by which policy analysts study the possible costs,
benefits and effects of government policies in a range of areas, from national security to
health care and education. Outside of government, economic principles help guide the
business decisions and actions that help foster a prosperous society.
According to the 2010 Socio Economic Profile of Paranaque, the average
monthly income of the informal settlers of Barangay Tambo falls below the minimum
wage. The main occupation of Barangay Tambo Seaside Square is “Self Employment”
(street vendors, freelance contractors, etc...). The community is mostly residential with a
small number of commercial and business establishments. Most noted among them is
the Alimango for exports.
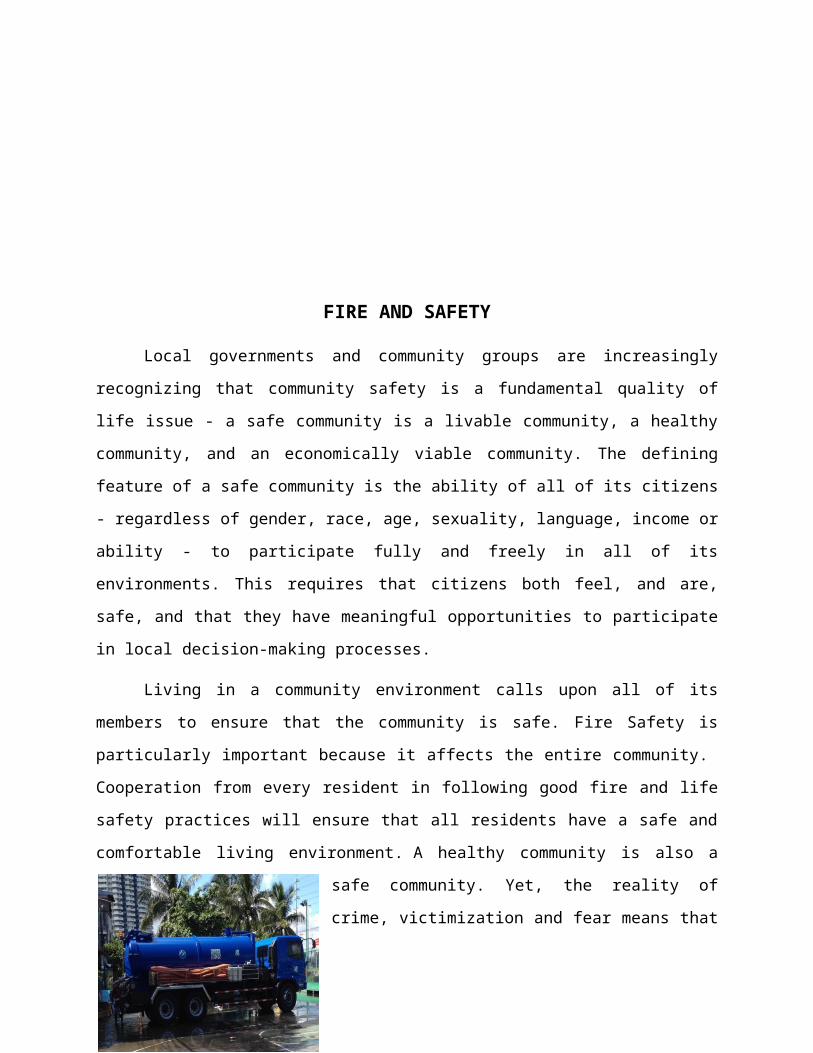
FIRE AND SAFETY
Local governments and community groups are increasingly recognizing that
community safety is a fundamental quality of life issue - a safe community is a livable

community, a healthy community, and an economically viable community. The defining
feature of a safe community is the ability of all of its citizens - regardless of gender,
race, age, sexuality, language, income or ability - to participate fully and freely in all of
its environments. This requires that citizens both feel, and are, safe, and that they have
meaningful opportunities to participate in local decision-making processes.
Living in a community environment calls upon all of its members to ensure that
the community is safe. Fire Safety is particularly important because it affects the entire
community. Cooperation from every resident in following good fire and life safety
practices will ensure that all residents have a safe and comfortable living
environment. A healthy community is also a safe community. Yet, the reality of crime,
victimization and fear means that many people, especially those who are the most
vulnerable are severely limited in the way they can use and be part of their
communities.
BARANGAY TAMBO, SEASIDE PARAÑAQUE CITY
Godofredo b. de leonBarangay captain
KagawadJennifer S. quizon
Cesar b,DeleonDaniel eric m. baesRoberto b. bidol jr.Michael d. aguilarRichmond g. favilaEmanuel z. paulino
Gladys lumagbasBaranagay Secretaty
Belinda z. samsomBarangay Treasurer
Albert cesarAdministration
Telephone number : 853-2065 / 852-8712
Data analysis
FAMILY STRUCTURE
Population
Age and sex distribution
Civil status
Types of family
Family size
POPULATION
Total Population of the Families Interviewed at Barangay Tambo Seaside
Parañaque as of 2015
45 Families
FREQUENCY DISTRIBUTION SHOWING THE AGE AND SEX COMPOSITION OF Barangay TAMBO SEASIDE paraÑaque
(AS OF 2015)
AGE MALE % FEMALE % TOTAL % TOTAL
<1 4 4% 9 7.38 % 13 11.38 %
1-4 10 10% 8 6.56 % 18 16.56 %
5-9 12 12% 8 6.56 % 20 18.56 %
10-14 9 9% 12 9.83 % 21 18.83 %
15-19 6 6% 11 9.01% 17 15.01 %
20-24 11 11% 15 12.30 % 26 23.30 %
25-29 14 14% 12 9.83 % 26 23.83 %
30-34 10 10% 12 9.83 % 22 19.83 %
35-39 8 8% 5 4.1 % 13 12.1 %
40-44 6 6% 4 3.28 % 10 9.28 %
45-49 2 2% 4 3.28 % 6 5.28 %
50-54 2 2% 10 8.2 % 12 10.2 %
55-59 2 2% 3 2.46 % 5 4.46 %
60-64 3 3% 3 2.46 % 6 5.46 %
65 & above 1 1% 6 4.92 % 7 5.92 %
TOTAL 100 100% 122 100 % 222 200%

MALEAge<1 1-45-9
10-1415-19 20-24 25-29 30-34 35-39 40-44 45-49 50-54 55-59 60-64
65 & above
0.040.1
0.12
0.0900000000000001
0.060.11
0.140.1
0.0800000000000001
0.060.020.020.02
0.030.01
MALE

FEMALEAge<1 1-45-9
10-1415-19 20-24 25-29 30-34 35-39 40-44 45-49 50-54 55-59 60-64
65 & above
0.0737704918032788
0.0655737704918033
0.0655737704918033
0.0983606557377049
0.0901639344262295
0.122950819672131
0.0983606557377049
0.0983606557377049
0.0409836065573771
0.0327868852459016
0.0327868852459016
0.0819672131147541
0.0245901639344262
0.0245901639344262
0.0491803278688525
FEMALE
INTERPRETATION, ANALYSIS AND JUSTIFICATION

The table shows that most of the residents of Brangay Tambo Seaside
Parañaque are male with 100 respondents and 122 female respondents. For males,
ages 25-29 with 14 males or 14%, ages 5-9 with 12 males or 12%, ages 20-24 with 11
males or 11%, ages 1-4 with 10 males or 10%, ages 30-34 with 10 males or 10%, ages
10-14 with 9 males or 9%, ages 35-39 with 8 males or 8%, ages 15-19 with 6 males or
6%, ages 40-44 with 6 males or 6%, ages below 1 with 4 males or 4%, ages 60-64 with
3 males or 3%, ages 45-49 with 2 males or 2%, ages 50-54 with 2 males or 2%, ages
55-59 with 2 males or 2%, and for ages 65 & above with 1 male or 1%. For females,
ages 20-24 with 15 females or 12.30%, ages 10-14 with 12 females or 9.83%, ages 30-
34 with 12 females or 9.83%, ages 15-19 with 11 females or 9.01%, ages 50-54 with 10
females or 8.2%, ages below 1 with 9 females or 7.38%, ages 1-4 with 8 females or
6.56%, ages 5-9 with 8 females or 6.56%, ages 65 & Above with 6 females or 4.92%,
ages 35-39 with 5 females or 4.1%, ages 40-44 with 4 females or 3.28%, ages 45-49
with 4 females or 3.28%, ages 55-59 with 3 females or 2.46%, ages 60-64 with 3
females or 2.46%.
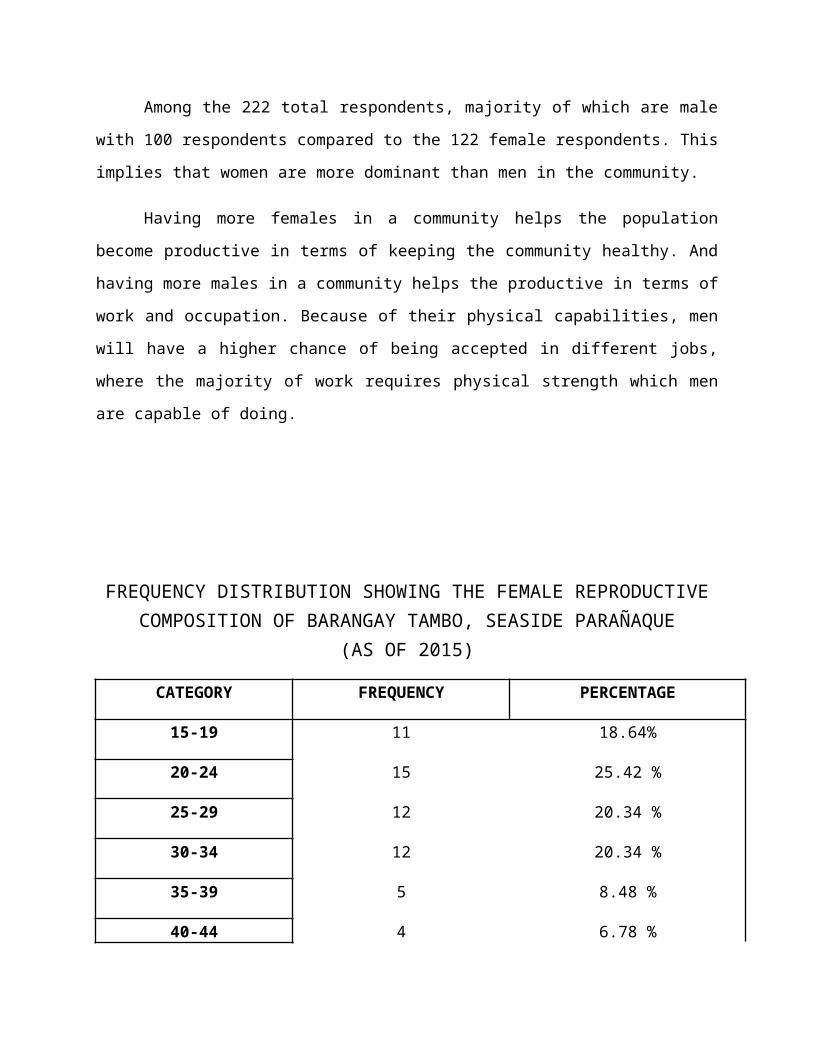
Among the 222 total respondents, majority of which are male with 100
respondents compared to the 122 female respondents. This implies that women are
more dominant than men in the community.
Having more females in a community helps the population become productive in
terms of keeping the community healthy. And having more males in a community helps
the productive in terms of work and occupation. Because of their physical capabilities,
men will have a higher chance of being accepted in different jobs, where the majority of
work requires physical strength which men are capable of doing.
FREQUENCY DISTRIBUTION SHOWING THE FEMALE REPRODUCTIVE COMPOSITION OF BARANGAY TAMBO, SEASIDE
PARAÑAQUE (AS OF 2015)

CATEGORY FREQUENCY PERCENTAGE
15-19 11 18.64%
20-24 15 25.42 %
25-29 12 20.34 %
30-34 12 20.34 %
35-39 5 8.48 %
40-44 4 6.78 %
45-49 0 0 %
TOTAL 59 100 %
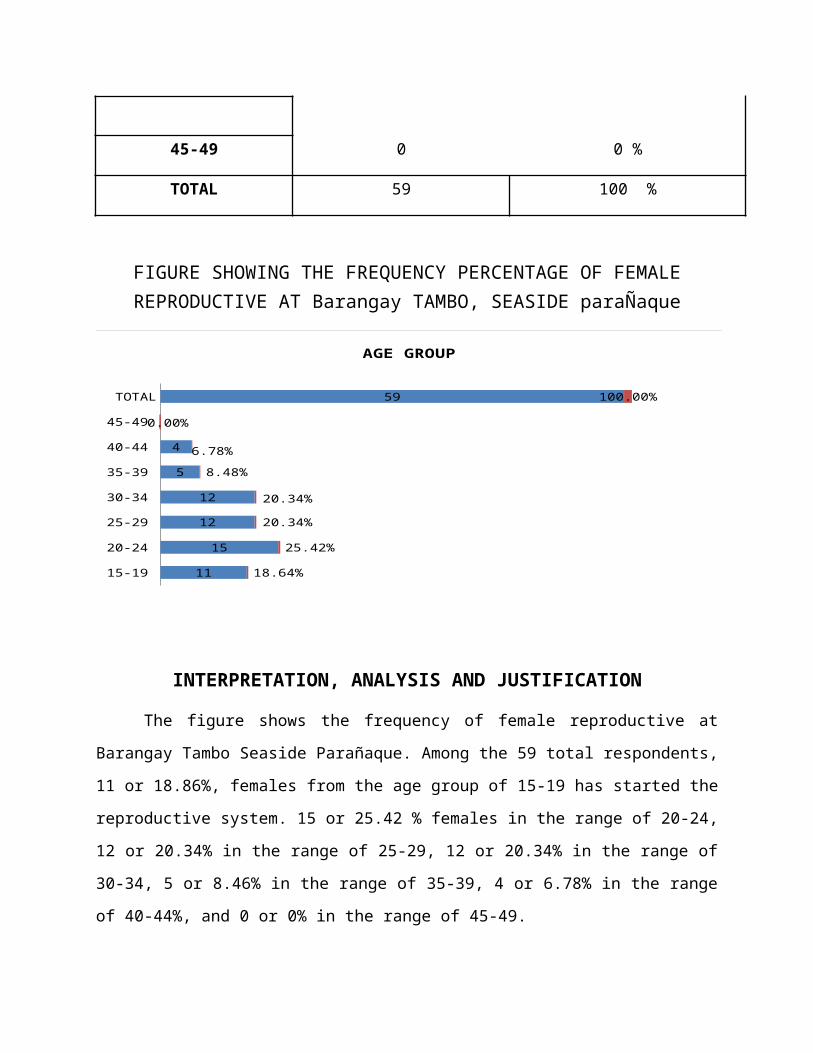
FIGURE SHOWING THE FREQUENCY PERCENTAGE OF FEMALE REPRODUCTIVE AT Barangay TAMBO, SEASIDE paraÑaque
15-19
20-24
25-29
30-34
35-39
40-44
45-49
TOTAL
11
15
12
12
5
4
59
18.64%
25.42%
20.34%
20.34%
8.48%
6.78%
0.00%
100.00%
AGE GROUP
INTERPRETATION, ANALYSIS AND JUSTIFICATION
The figure shows the frequency of female reproductive at Barangay Tambo
Seaside Parañaque. Among the 59 total respondents, 11 or 18.86%, females from the

age group of 15-19 has started the reproductive system. 15 or 25.42 % females in the
range of 20-24, 12 or 20.34% in the range of 25-29, 12 or 20.34% in the range of 30-34,
5 or 8.46% in the range of 35-39, 4 or 6.78% in the range of 40-44%, and 0 or 0% in the
range of 45-49.
Women between the ages 20-30 should be counseled about the age related risk
of infertility and reproductive health issue. Between the age group of 20-24, 15 or
25.42% is the highest population that are currently pregnant or have children. This age
range is the best time for conceiving and carrying a baby. At this age group, female’s
eggs are released from the ovaries and are more viable. As the body ages, the eggs
become less viable which can result from genetic abnormalities that can result to birth
defects. The risks of miscarriages, premature babies, and health complications such as
high blood pressure and diabetes are far less low than compared in the other age
groups.
FREQUENCY DISTRIBUTION SHOWING THE CIVIL STATUS DISTRIBUTION OF BARANGAY TAMBO, SEASIDE PARAñAQUE (AS
OF 2015)

Category Frequency Percentage
Single 56 32.94 %
Married 56 32.94 %
Separated 5 2.94 %
Lived-In 40 23.53 %
Widow 10 5.88 %
LGBT 2 1.18 %
Single Parent 1 0.59 %
TOTAL 170 100 %
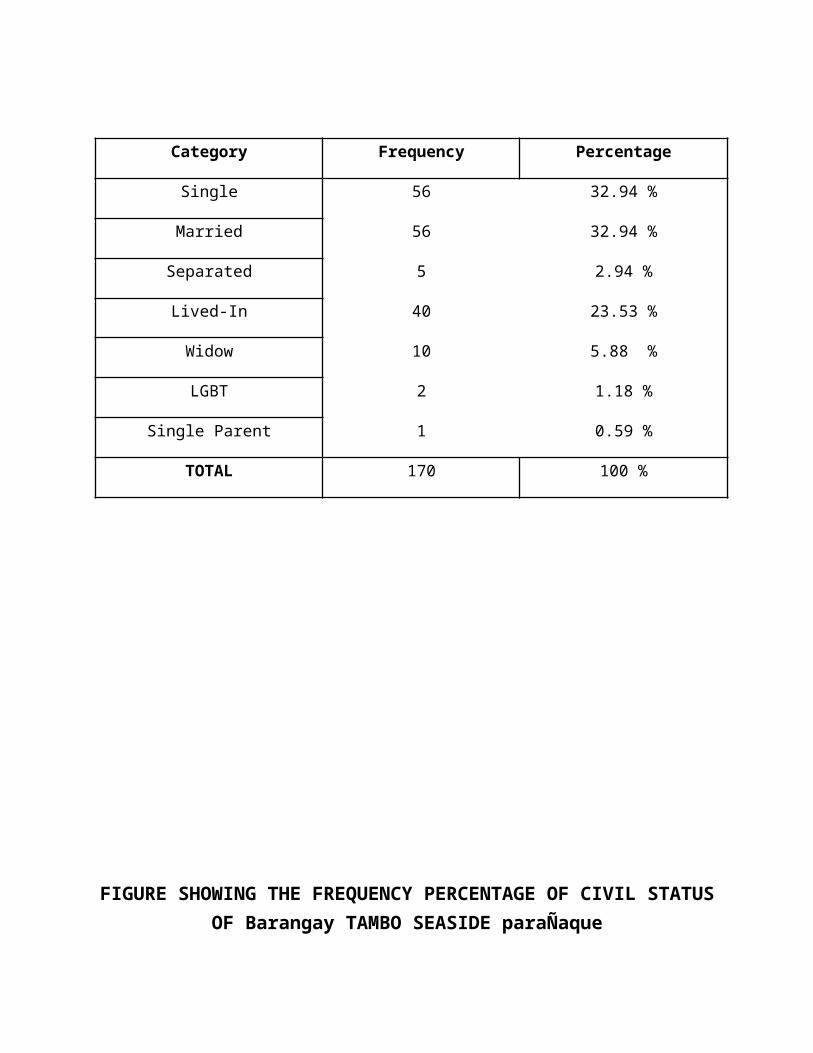
FIGURE SHOWING THE FREQUENCY PERCENTAGE OF CIVIL STATUS OF Barangay TAMBO SEASIDE paraÑaque

0.00%
5.00%
10.00%
15.00%
20.00%
25.00%
30.00%
35.00%0.329400000000001 32.94%
0.0294
0.2353
0.0588
0.01180.00590000000000
001
SingleMarriedSeparatedLived-InWidowLGBT Single Parent
INTERPRETATION, ANALYSIS AND JUSTIFICATION
The figure shows the frequency of civil status in Barangay. Tambo Seaside. The
respondents are from 15 years old and above. Among the total of 170 respondents, the
number of respondents who are single is 56 or 32.94%. The number of respondents

who are married is 56 or 32.94%. The number of respondent who are separated is 5 or
2.94%. The number of the respondent who are Lived in together is 40 or 23.53%. The
number of respondent who are widowed is 10 or 5.88%. The number of respondent who
are LGBT is 2 or 1.18%. The number of respondents who are single parent is 1 or
0.59%.
Among the 170 respondents, majority of which are married and single. Our data shows
56 (32.94%) respondents are married and single. Marriage is considered a legally,
religiously or socially sanctioned union of persons who commit to one another, forming
a familial and economic bond. Advantages of marriage help ones physical and mental
well being. It helps an individual to become tolerant, unselfish, and caring. It provides a
sense of meaning in one’s life. Research shows married couples build more wealth on
average than singles or cohabiting couples. Married couples are better off financially,
and are less likely to experience extreme poverty. Children raised by married parents
are most likely to stay in school, have fewer behavioral and attendance problem and
have positive attitudes towards marriage and greater success in forming lasting in
families and at home. Our data shows 5 (2.94%) respondents are separated which can
cause problems in families and at home. Separated individuals can have an effect in
children’s behavior and cause emotional trauma. The number of respondents who are
lived in together is 40 (23.53%) and study shows cohabitation couples are more likely to
experience problems in their homes and can cause behavioral problems. The number of
respondents who are widowed is 10 (5.88%) and can cause financial and emotional
problems towards the spouse and family and may lead to depression. The number of
respondents who are LGBT is 2 (1.18%). And the number of respondents who are
single parent is 1 (0.59%).
Marriage is the most important and significant family status. It is the core family
structure in most of societies around the world. It is also considered to be most sacred
bond between two human beings as they commit themselves in spending the rest of
their lives together.
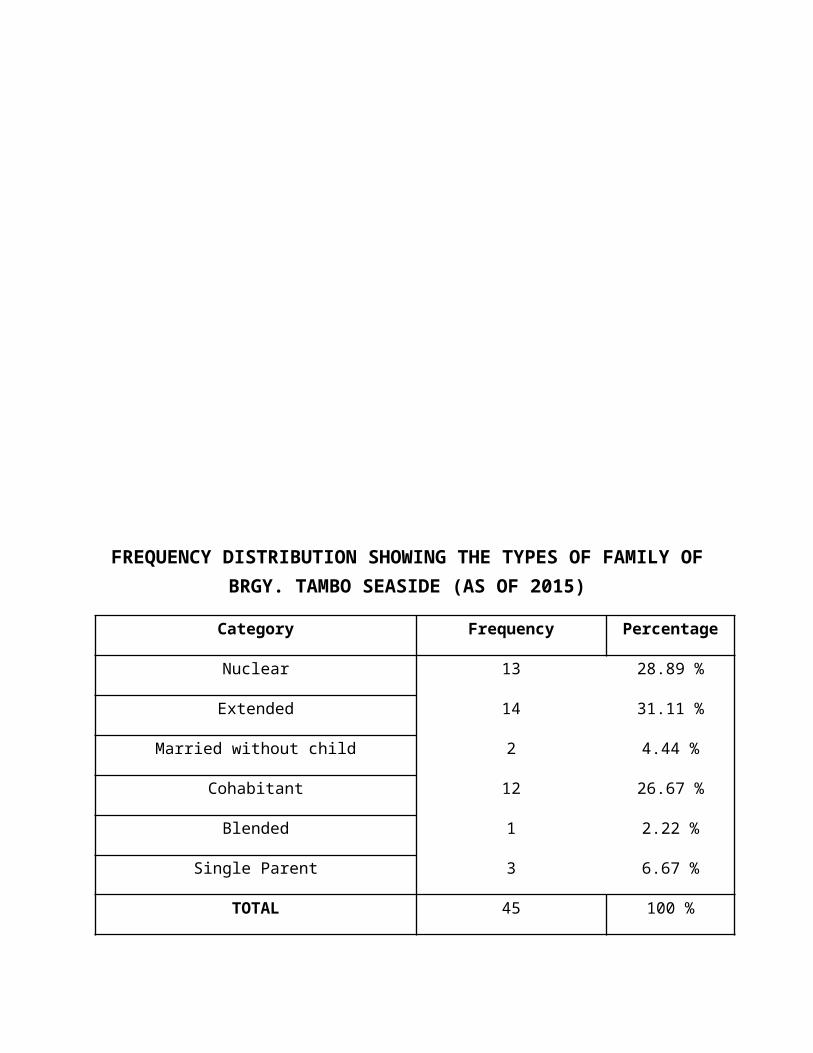
FREQUENCY DISTRIBUTION SHOWING THE TYPES OF FAMILY OF BRGY. TAMBO SEASIDE (AS OF 2015)
Category Frequency Percentage
Nuclear 13 28.89 %
Extended 14 31.11 %
Married without child 2 4.44 %
Cohabitant 12 26.67 %
Blended 1 2.22 %
Single Parent 3 6.67 %
TOTAL 45 100 %
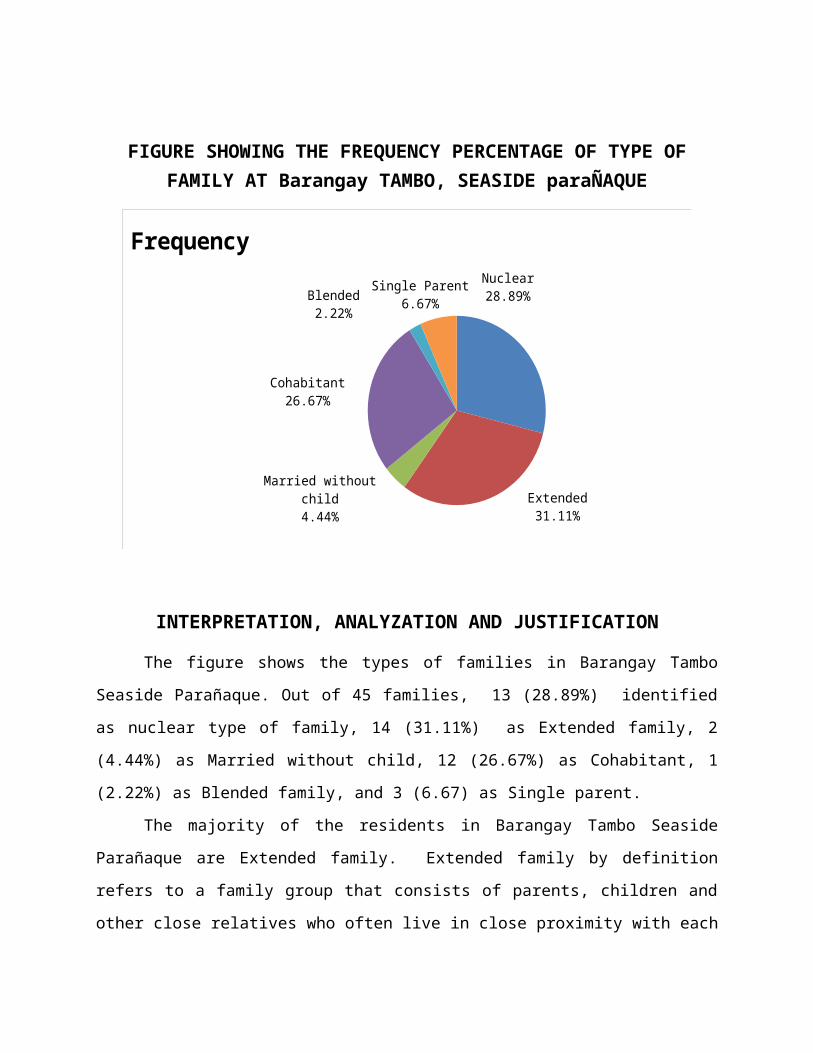
FIGURE SHOWING THE FREQUENCY PERCENTAGE OF TYPE OF FAMILY AT Barangay TAMBO, SEASIDE paraÑAQUE
Nuclear28.89%
Extended31.11%
Married without child4.44%
Cohabitant26.67%
Blended2.22%
Single Parent6.67%
Frequency
INTERPRETATION, ANALYZATION AND JUSTIFICATION
The figure shows the types of families in Barangay Tambo Seaside Parañaque.
Out of 45 families, 13 (28.89%) identified as nuclear type of family, 14 (31.11%) as
Extended family, 2 (4.44%) as Married without child, 12 (26.67%) as Cohabitant, 1
(2.22%) as Blended family, and 3 (6.67) as Single parent.
The majority of the residents in Barangay Tambo Seaside Parañaque are
Extended family. Extended family by definition refers to a family group that consists of
parents, children and other close relatives who often live in close proximity with each
other. The extended family can include friends, in-laws or other individual whom parents
share a bond and emotional closeness with. It can collaborate with parents to reinforce
various aspects of positive discipline. This encourages the children to be more
independent and enables them to regulate their own behaviors.
Support from members of extended family has a significant impact on the healthy
development of a child. Extended family members can be great role models and
influences for children; provide children with a sense of encouragement, security and
stability; help children better understand the roots of their family; let children know that
there are people outside the immediate family that love and care about them; help build
on the sense community for the child.
Nuclear family is the second majority, is defined as a family unit consisting of a
mother and father and their children. Generally it is believed that it is the ideal
arrangement to raise a family where the father is the one who provides the needs of the
families with the income he receives from work, the one who serves as the family
disciplinary model and the one who insures the protection of his family while, on the
other hand, the mother is the one who is in-charge with the household.
There are family also having married without child, a cohabitant family, person
living together with another or others, a blended family, consisting of a couple and their
children from this and all previous relationships and single parent sometimes called a
solo parent, is a parent, not living with a spouse or partner, who has most of the day-
to-day responsibilities in raising the child or children.
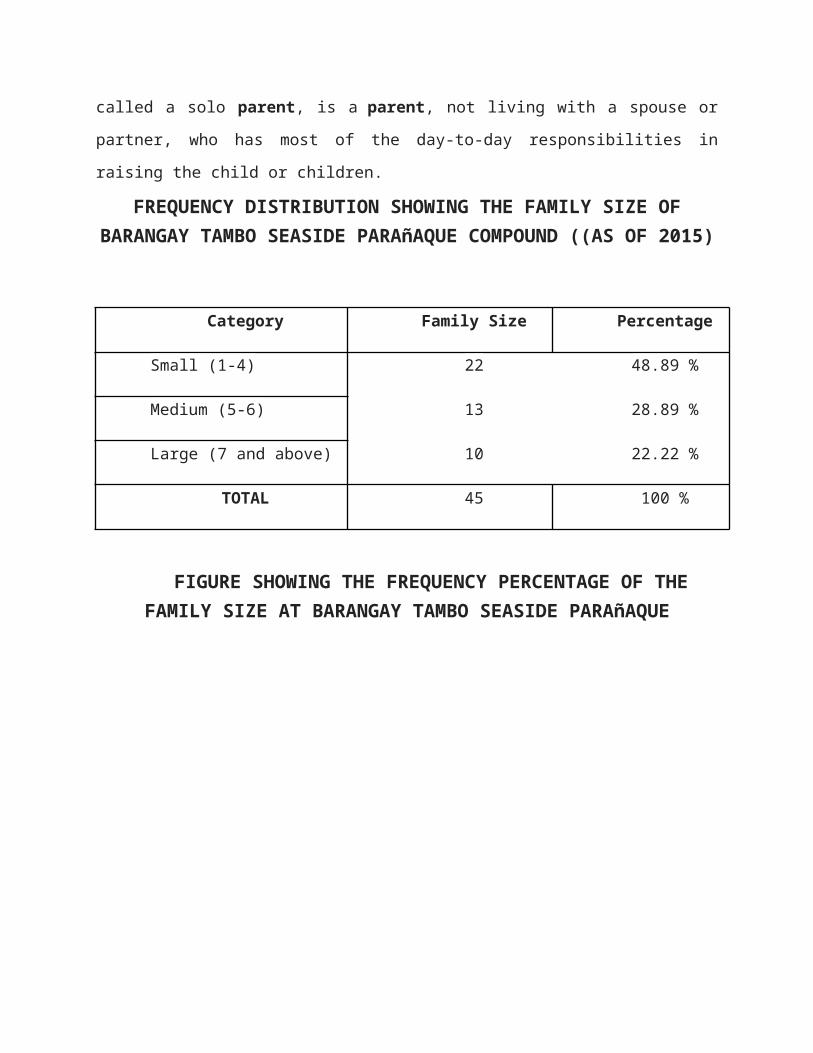
FREQUENCY DISTRIBUTION SHOWING THE FAMILY SIZE OF BARANGAY TAMBO SEASIDE PARAñAQUE COMPOUND ((AS
OF 2015)
Category Family Size Percentage
Small (1-4) 22 48.89 %
Medium (5-6) 13 28.89 %
Large (7 and above) 10 22.22 %
TOTAL 45 100 %
FIGURE SHOWING THE FREQUENCY PERCENTAGE OF THE FAMILY SIZE AT BARANGAY TAMBO SEASIDE
PARAñAQUE
49%
29%
22%
SalesSmall Medium Large
INTERPRETATION, ANALYZATION AND JUSTIFICATION
The figure shows the frequency of family size in Barangay Tambo Seaside
Parañaque. There are 45 family respondents. There are 22 (48.49%) with a small sized
families, 13 (28.89%) with a medium sized families and 10 (22.22%) with a large sized
family.
Out of the 45 respondents, majority of them are small sized families. There is an
increasing trend around the world to have a small family rather than a large family. As
small family can benefit children and parents and make it easier to find sufficient
resources for a family. Children can enjoy their parent’s full attention instead of sharing
it with multiple siblings. Additionally, family with less children sibling rivalry is less likely
to be a problem among children. Parents can spend more time with the individual child
and the child’s favorite activities. Caring for a large family can be stressful mad
exhausting. Parents of a small family should therefore be more relaxed and patient.
Lastly, fewer children mean the family budget is more likely to leave room for some
extras, like holidays or separate bedrooms for each child. On the other hand, there is
also some downside for all family members of a small family. Children can end become
spoilt and less responsible than their peer growing in large families. Being an only child
often associated with egoism and less developed social skills.
A large family has some very strong advantages. First of all, it has a lot of
members and there is more than one earning member in a large family. In addition,
members can help each other in bad times. A large family has parents, children and
uncles, aunties and grandparents. Therefore, children can enjoy the company of all the
members. Everyone has his/her story at the end of the day and they all sit and talk
about their good experiences, their problems and possible solutions together. Finally, a
large family can save money in various different ways. Because they all live together,
the cost becomes low in total and they can save a lot. There are several disadvantages
of having a large family. First of all, there is hardly any privacy. You may have to share
bedrooms with your sisters or brothers. It is hard to have any time alone because there
are so many people living in one house. In addition, a large family often has more
expenses than a small family.

ECONOMICEMPLOYMENT STATUS
Types of occupation
Monthly income
Length of residency
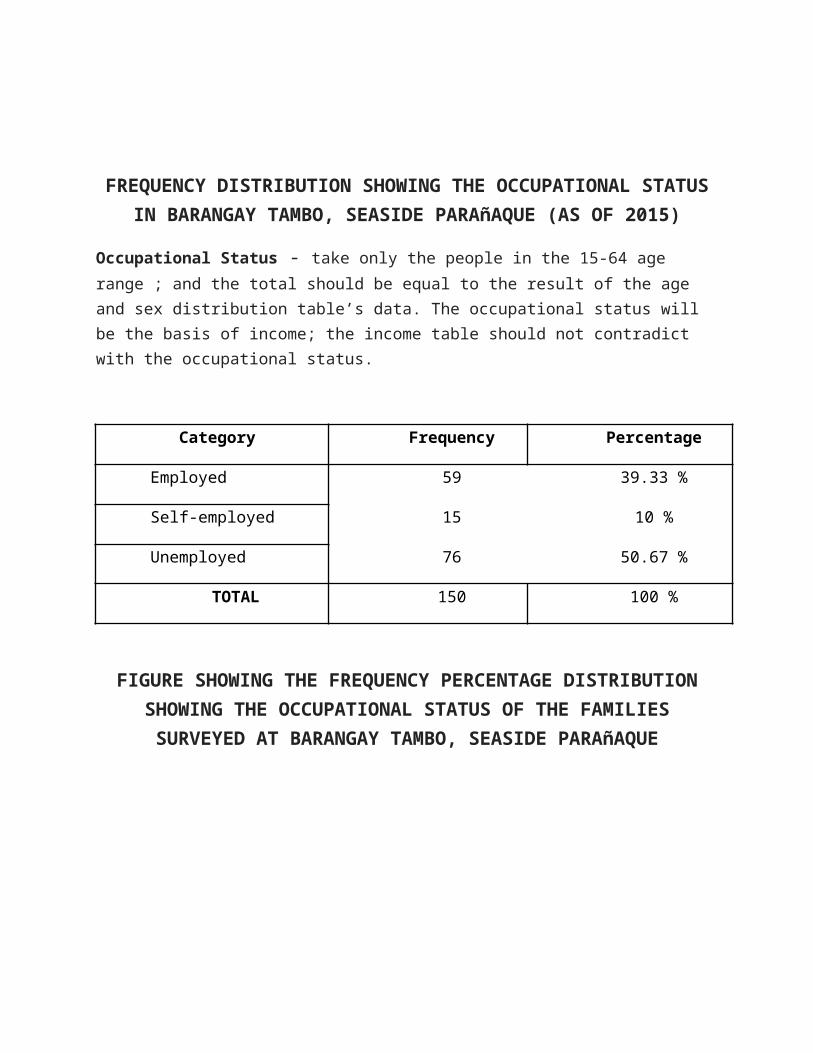
FREQUENCY DISTRIBUTION SHOWING THE OCCUPATIONAL STATUS IN BARANGAY TAMBO, SEASIDE PARAñAQUE (AS
OF 2015)
Occupational Status - take only the people in the 15-64 age range ; and the total should be equal to the result of the age and sex distribution table’s data. The

occupational status will be the basis of income; the income table should not contradict with the occupational status.
Category Frequency Percentage
Employed 59 39.33 %
Self-employed 15 10 %
Unemployed 76 50.67 %
TOTAL 150 100 %
FIGURE SHOWING THE FREQUENCY PERCENTAGE DISTRIBUTION SHOWING THE OCCUPATIONAL STATUS OF THE FAMILIES SURVEYED AT BARANGAY TAMBO, SEASIDE
PARAñAQUE
Unemlpoyed Employed Self-Employed Retired0.00%
10.00%
20.00%
30.00%
40.00%
50.00%
60.00%
70.00%
INTERPRETATION, ANALYZATION AND JUSTIFICATION
This graph shows that the vast majority occupational statuses in Barangay
Tambo, Seaside Parañaque are unemployed with a total percentage of 50.67%, for
employed are 39.33% and for self-employed are 10%.

The rate of unemployment is much higher than those who are employed. One of
the causes of unemployment is lack of education, most of the people that we
interviewed they did not have proper education due to financial problem.
Surviving without a job is challenging. If you don't have a regular monthly
income, you may have a hard time paying your bills, filling your time and coping with
your emotions. It may result to stress, poverty and depression and may lead to health
problems.
Unemployment has remained high in the Philippines, at almost twice the level of
neighboring countries, despite relatively fast employment growth in the past decade.
Employment growth was not sufficient to reduce unemployment because of rapid
population growth and increased labor force participation.
Despite these situations people in the community were still looking for jobs and
hoping that someday they will be lucky enough to find a job that works for them. Others
are having their own small business around the community to survive for their daily
living.
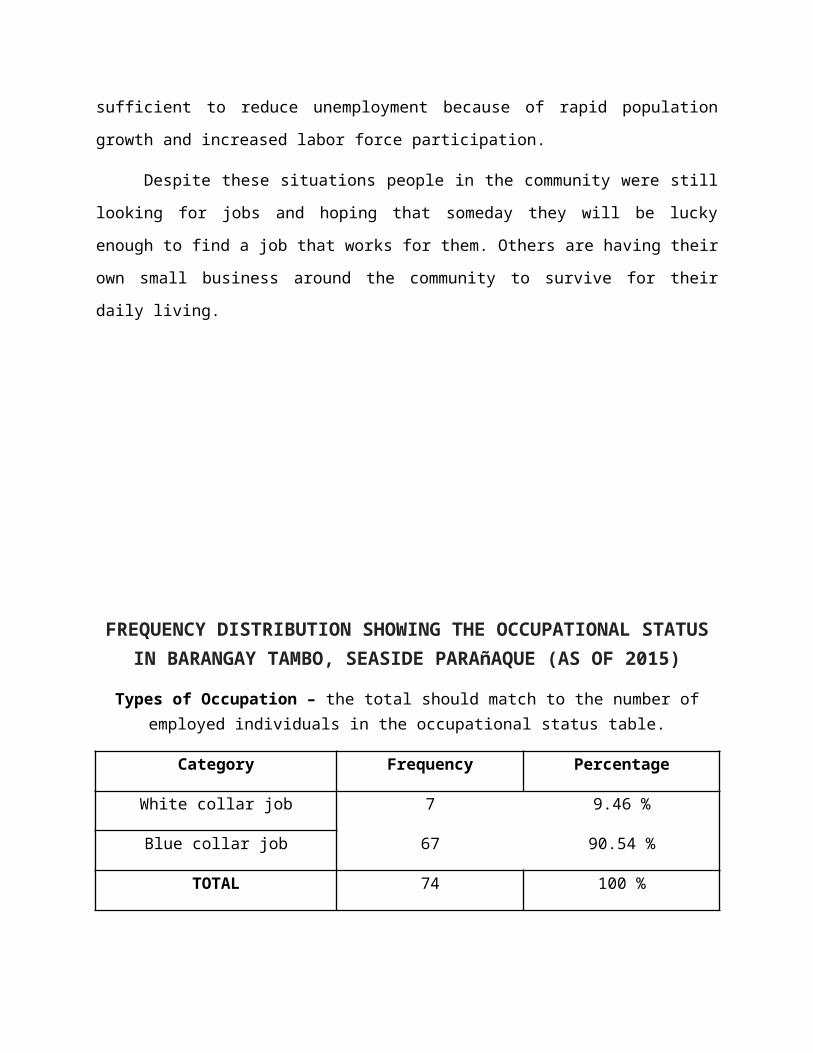
FREQUENCY DISTRIBUTION SHOWING THE OCCUPATIONAL STATUS IN BARANGAY TAMBO, SEASIDE PARAñAQUE (AS
OF 2015)
Types of Occupation – the total should match to the number of employed individuals in the occupational status table.
Category Frequency Percentage
White collar job 7 9.46 %
Blue collar job 67 90.54 %
TOTAL 74 100 %
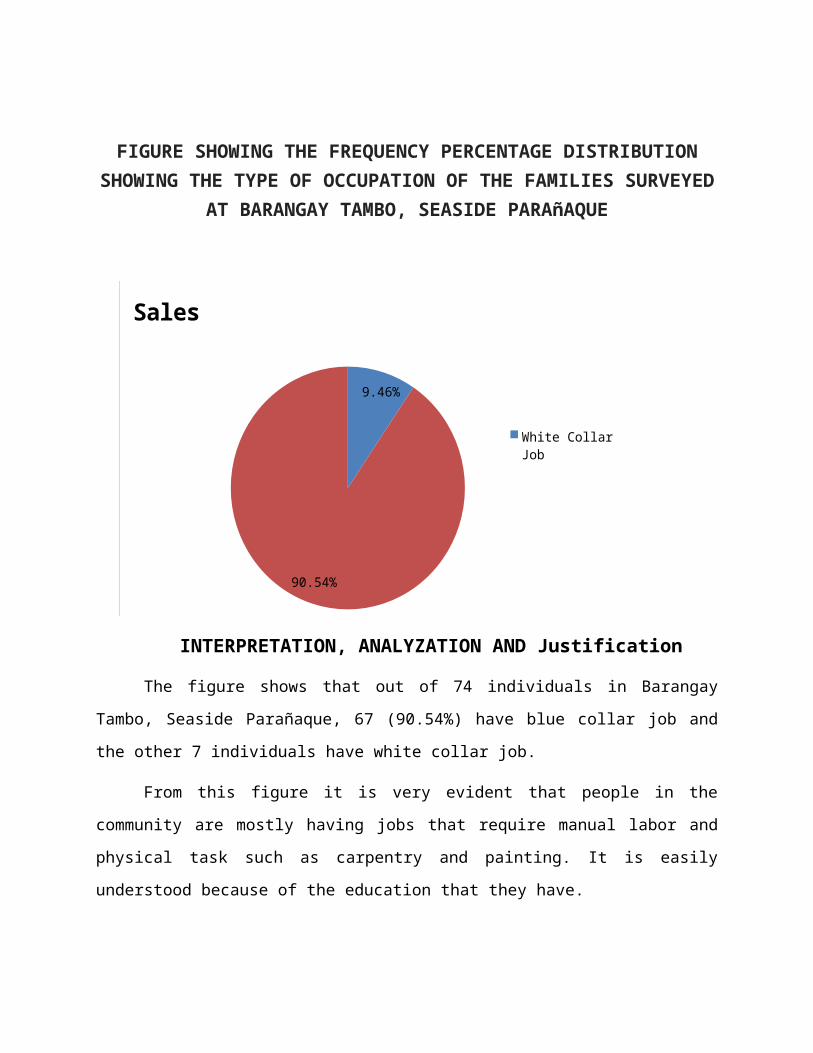
FIGURE SHOWING THE FREQUENCY PERCENTAGE DISTRIBUTION SHOWING THE TYPE OF OCCUPATION OF
THE FAMILIES SURVEYED AT BARANGAY TAMBO, SEASIDE PARAñAQUE
9.46%
90.54%
Sales
White Collar Job
Blue Collar Job
INTERPRETATION, ANALYZATION AND Justification
The figure shows that out of 74 individuals in Barangay Tambo, Seaside
Parañaque, 67 (90.54%) have blue collar job and the other 7 individuals have white
collar job.
From this figure it is very evident that people in the community are mostly having
jobs that require manual labor and physical task such as carpentry and painting. It is
easily understood because of the education that they have.
Blue-collar work can be unskilled, low-skilled, or highly skilled. Some of the
occupations in this category are construction, maintenance, carpentry, assembly,
plumbing and heating, typesetting, and truck driving. Blue-collar workers often are paid
an hourly rate and are eligible for overtime pay. Some aspects of blue-collar jobs are
unpleasant, such as the risk associated with construction, fire fighting, and law
enforcement. In general blue-collar work is often standardized and less autonomous
than other types of work. Particularly in manufacturing, workers have seen periods of
low job security for many reasons, including the substitutability of physical capital, which
is the machinery and equipment used in production. Another important characteristic is
that blue-collar work has been done mostly by men.
White-collar jobs generally require a fair amount of formal schooling, including
college degrees ranging from associate’s degrees through professional degrees such
as medicine and jurisprudence and academic degrees such as doctorates. Much of this
white-collar work is performed sitting at a desk in an office environment, such as
engineering, architecture, and bookkeeping. Many of these jobs are well paid, largely
because of the amount of education and skill building required to enter these
occupations.
That is what’s lacking in this community, without access to education they can
only be hired as laborers or blue collar work.
FREQUENCY DISTRIBUTION SHOWING THE OCCUPATIONAL STATUS IN BARANGAY TAMBO SEASIDE PARAñAQUE (AS
OF 2015)
Monthly Income- the table should be coherent with the number of employed individuals and the types of occupation table.
Category Frequency Percentage
<1,000 7 9.46 %
1,000 - 2,999 5 6.76 %
3,000 - 4,999 8 10.81 %
5,000 - 6,999 7 9.46 %
7,000 - 8,999 11 14.86 %
9,000 - 10,999 8 10.81 %
11,000 - 12,999 13 17.57 %
13,000 - 14,999 1 1.35 %
15,000 - above 14 18.92 %
TOTAL 74 100 %
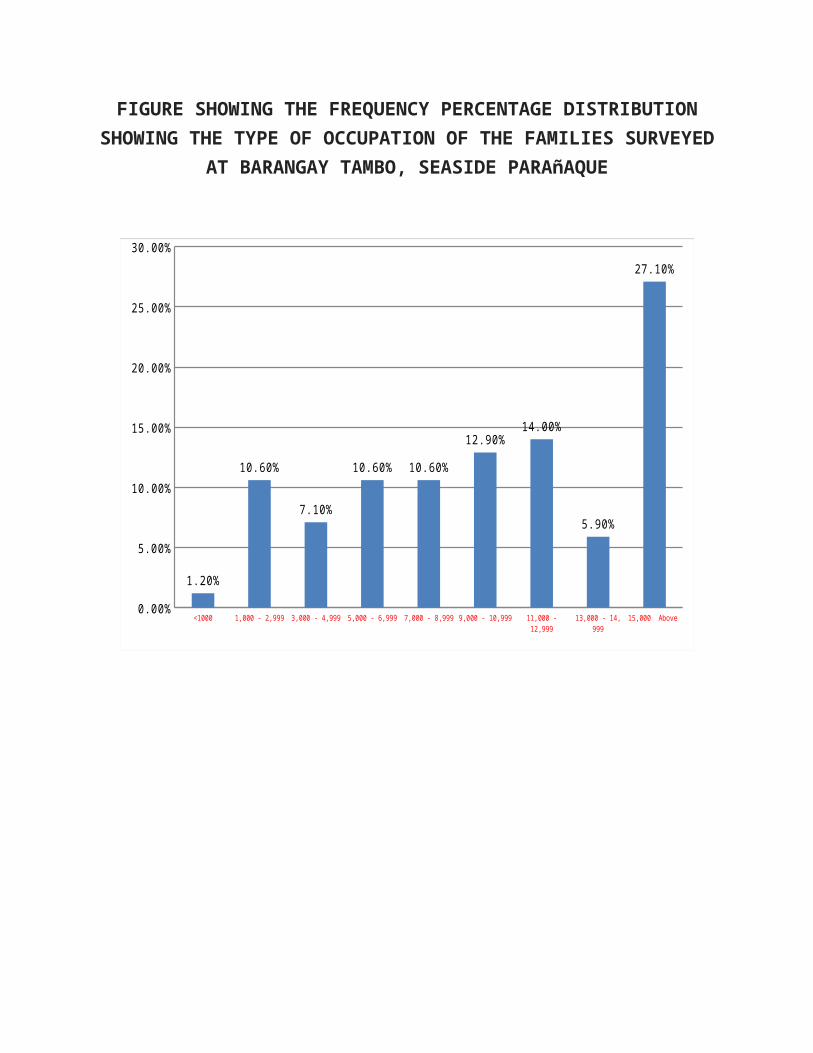
FIGURE SHOWING THE FREQUENCY PERCENTAGE DISTRIBUTION SHOWING THE TYPE OF OCCUPATION OF
THE FAMILIES SURVEYED AT BARANGAY TAMBO, SEASIDE PARAñAQUE
<1000 1,000 - 2 ,999 3,000 - 4 ,999 5,000 - 6 ,999 7,000 - 8 ,999 9,000 - 10,999 11 ,000 - 12,999 13,000 - 14, 999 15,000 Above 0.00%
5.00%
10.00%
15.00%
20.00%
25.00%
30.00%
1.20%
10.60%
7.10%
10.60% 10.60%
12.90%14.00%
5.90%
27.10%
INTERPRETATION, ANALYZATION AND Justification
Presented graphically is the monthly income in every family that we have
interviewed. It shows that 14 individuals have the highest percentage, 18.92% have an
income of 15,000 – above. 13 individuals (17.57%) have an income of 11,000 – 12,999.
9,000 -10,999 and 3,000 – 4,999 are tied having both 8 individuals with a percentage of

10.81%, the same with <1,000 and 5,000 – 6,999 with both 7 individuals and
percentage of 9.46%, 5 individuals (6.76%) with an income of 1,000 – 2,999 and only 1
individual have an income of 13,000 – 14,999 with a percentage of 1.35%.
An income of 15,000 – above have highest percentage, the kind of work that
these people have are mostly carpentry and painting (house). From this income they
can sustain and support their daily living and every day needs.
Income is important in order to support the family. It is important to have money
in regular basis to not feel worry for the days ahead. Income is important because with
it, we can afford the things we desire, and we can pay our bills, the food and water that
we consume. It is the major source of survival which is important to individual family and
community.
FREQUENCY DISTRIBUTION SHOWING THE Length of residency of the families in BARANGAY TAMBO SEASIDE
PARAñAQUE (AS OF 2015)
Residency of Families – continues stay in the same address for more than 6 months. These should be coherent in the number of families interviewed.
Category Frequency Percentage
Less than 6 months 0 0 %
More than 6 months 45 100 %
TOTAL 45 100 %
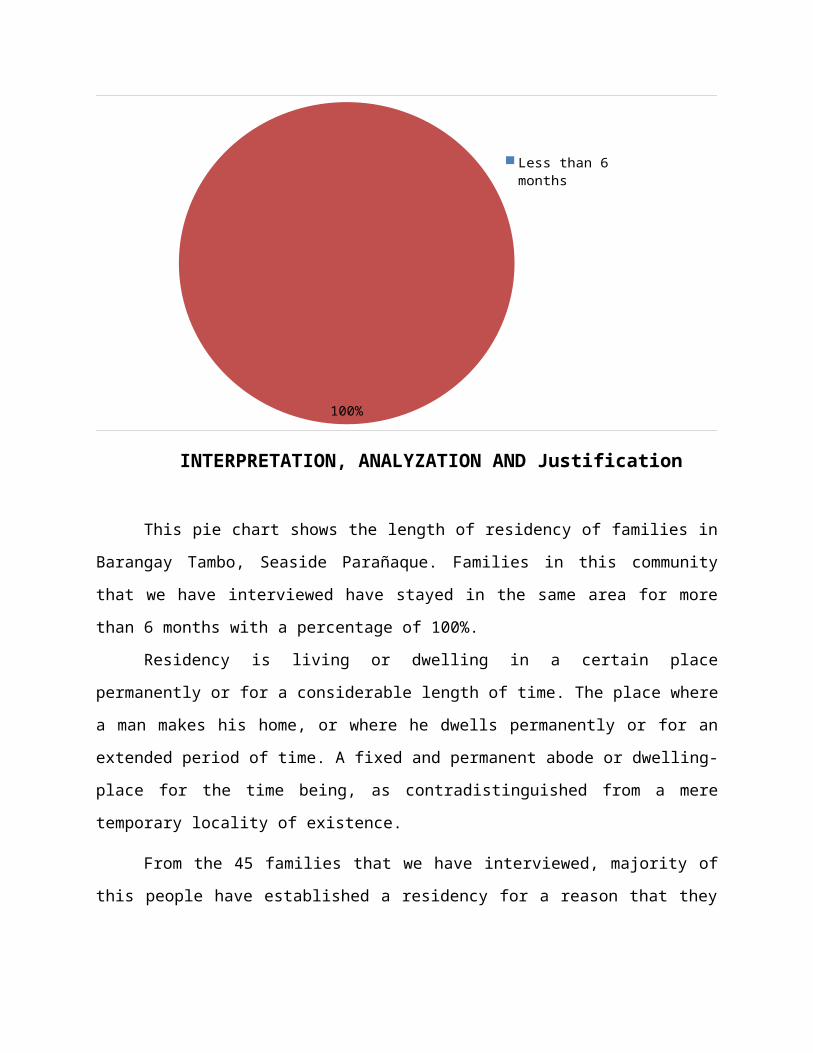
FIGURE SHOWING THE FREQUENCY PERCENTAGE DISTRIBUTION SHOWING THE length of residency OF THE
FAMILIES SURVEYED AT BARANGAY TAMBO, SEASIDE PARAñAQUE
100%
Less than 6 months
More than 6 months
INTERPRETATION, ANALYZATION AND Justification
This pie chart shows the length of residency of families in Barangay Tambo,
Seaside Parañaque. Families in this community that we have interviewed have stayed
in the same area for more than 6 months with a percentage of 100%.
Residency is living or dwelling in a certain place permanently or for a
considerable length of time. The place where a man makes his home, or where he
dwells permanently or for an extended period of time. A fixed and permanent abode or
dwelling-place for the time being, as contradistinguished from a mere temporary locality
of existence.
From the 45 families that we have interviewed, majority of this people have
established a residency for a reason that they have inherited their place from their
forefathers. Others are there husband or wives are living in the place since birth.
Socio cultural
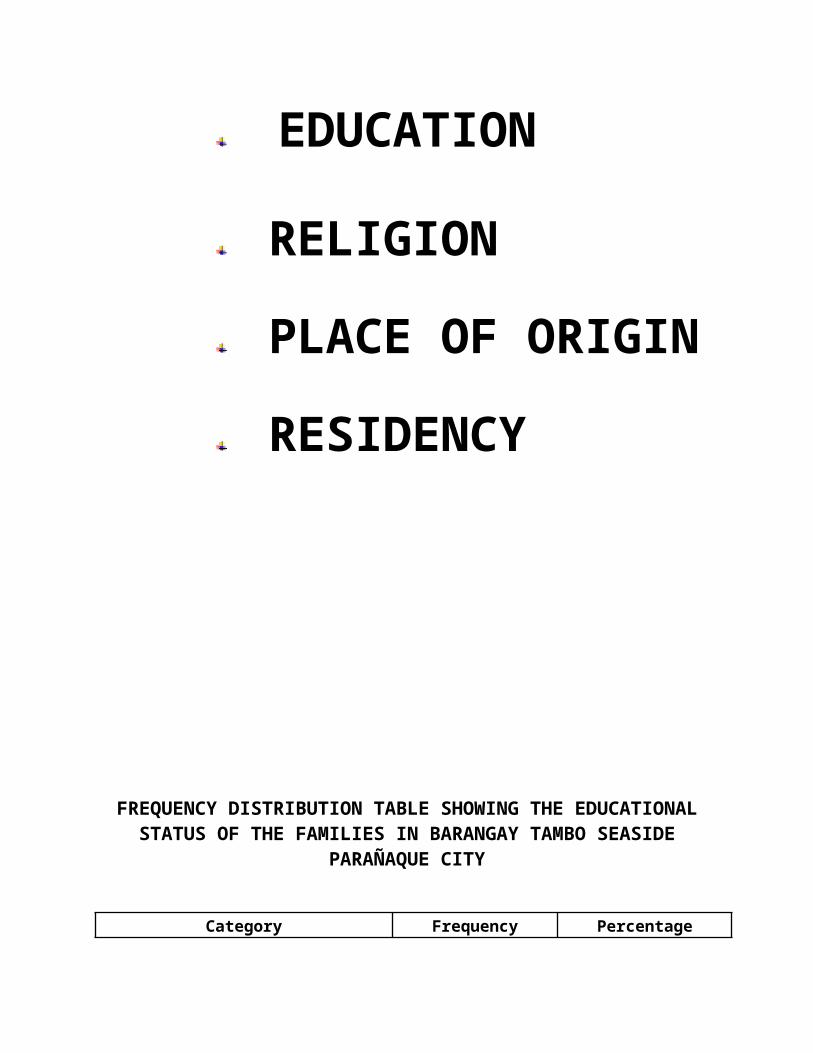
EDUCATION
RELIGION
PLACE OF
ORIGIN
RESIDENCY

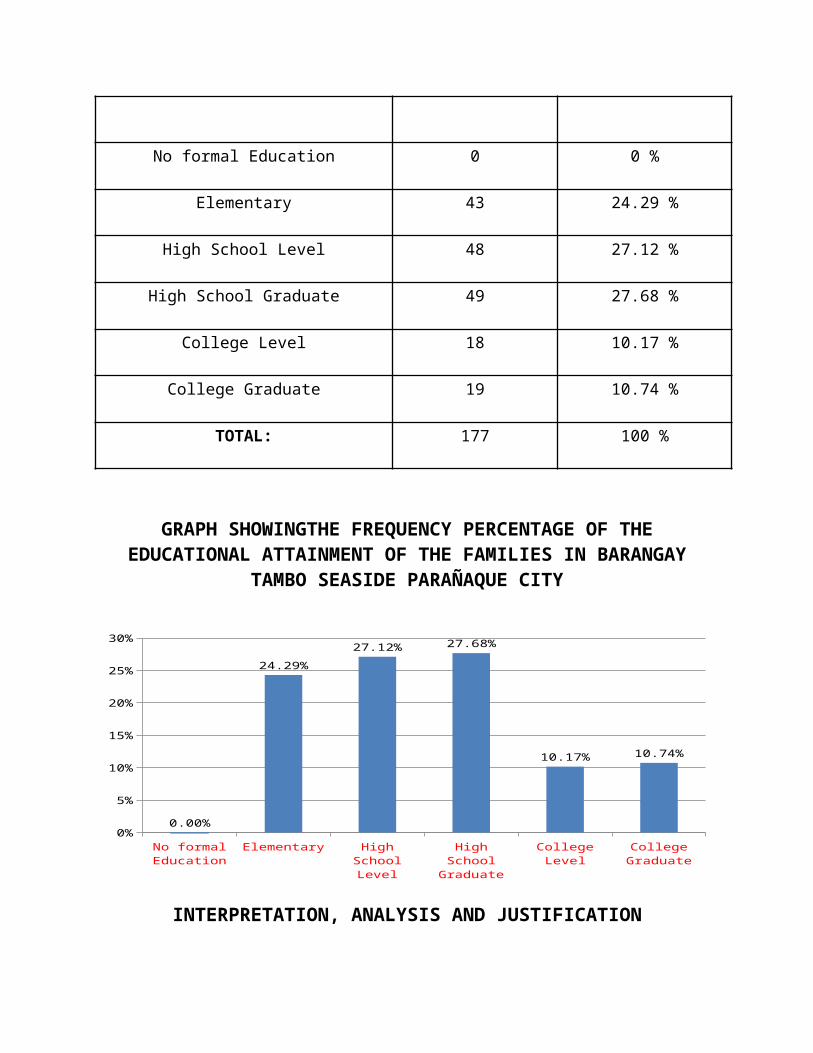
FREQUENCY DISTRIBUTION TABLE SHOWING THE EDUCATIONAL STATUS OF THE FAMILIES IN BARANGAY
TAMBO SEASIDE PARAÑAQUE CITY
Category Frequency Percentage
No formal Education 0 0 %
Elementary 43 24.29 %
High School Level 48 27.12 %
High School Graduate 49 27.68 %
College Level 18 10.17 %
College Graduate 19 10.74 %
TOTAL: 177 100 %
GRAPH SHOWINGTHE FREQUENCY PERCENTAGE OF THE EDUCATIONAL ATTAINMENT OF THE FAMILIES IN BARANGAY TAMBO SEASIDE PARAÑAQUE CITY
No formal Education
Elementary High School Level
High School Graduate
College Level
College Graduate
0%
5%
10%
15%
20%
25%
30%
0.00%
24.29%
27.12% 27.68%
10.17% 10.74%
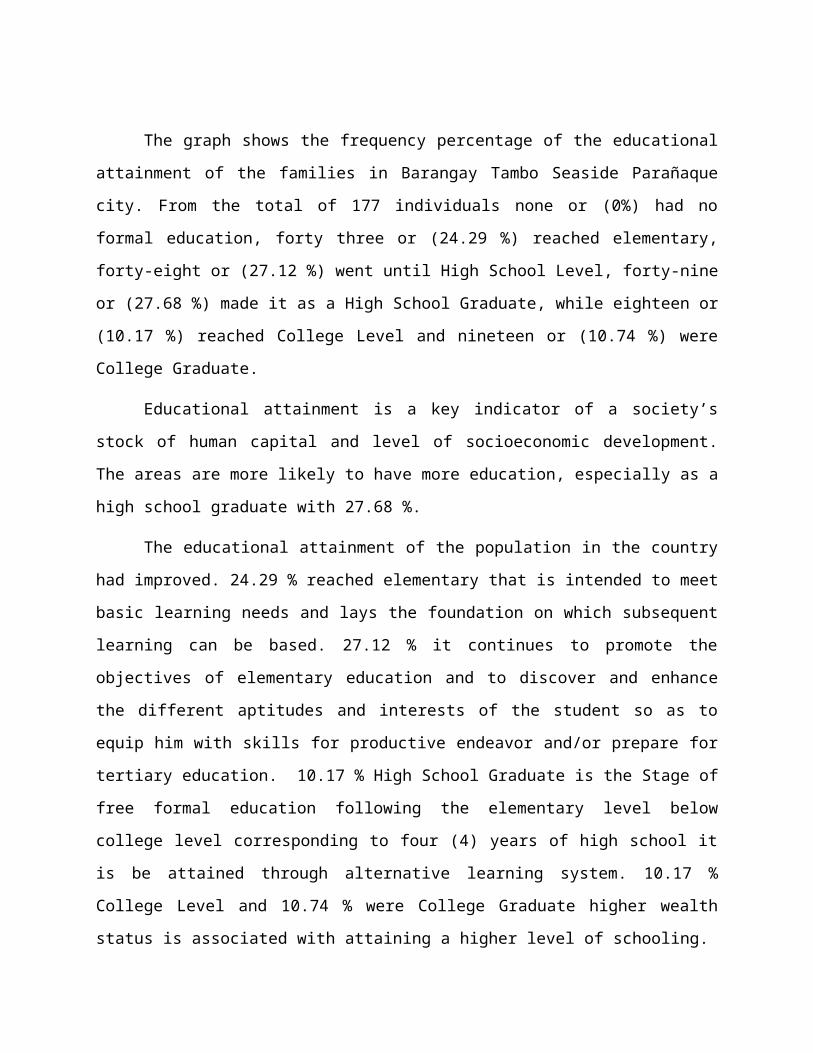
INTERPRETATION, ANALYSIS AND JUSTIFICATION
The graph shows the frequency percentage of the educational attainment of the
families in Barangay Tambo Seaside Parañaque city. From the total of 177 individuals
none or (0%) had no formal education, forty three or (24.29 %) reached elementary,
forty-eight or (27.12 %) went until High School Level, forty-nine or (27.68 %) made it as
a High School Graduate, while eighteen or (10.17 %) reached College Level and
nineteen or (10.74 %) were College Graduate.
Educational attainment is a key indicator of a society’s stock of human capital
and level of socioeconomic development. The areas are more likely to have more
education, especially as a high school graduate with 27.68 %.
The educational attainment of the population in the country had improved. 24.29
% reached elementary that is intended to meet basic learning needs and lays the
foundation on which subsequent learning can be based. 27.12 % it continues to
promote the objectives of elementary education and to discover and enhance the
different aptitudes and interests of the student so as to equip him with skills for
productive endeavor and/or prepare for tertiary education. 10.17 % High School
Graduate is the Stage of free formal education following the elementary level below
college level corresponding to four (4) years of high school it is be attained through
alternative learning system. 10.17 % College Level and 10.74 % were College Graduate
higher wealth status is associated with attaining a higher level of schooling.
There are a lot of practices in the Philippine schools that have worked through the
years. The Philippines, being a third world country is one of those low economic
countries providing low budget for education. . It helps us to realize that education is
fundamental and essential to every person and every nation. It provides us a venue to
know that what every country it is, the school brings out the need for teachers who stay
and make a difference not only in the classroom, nor in his or her own country but …
makes a difference in the world.
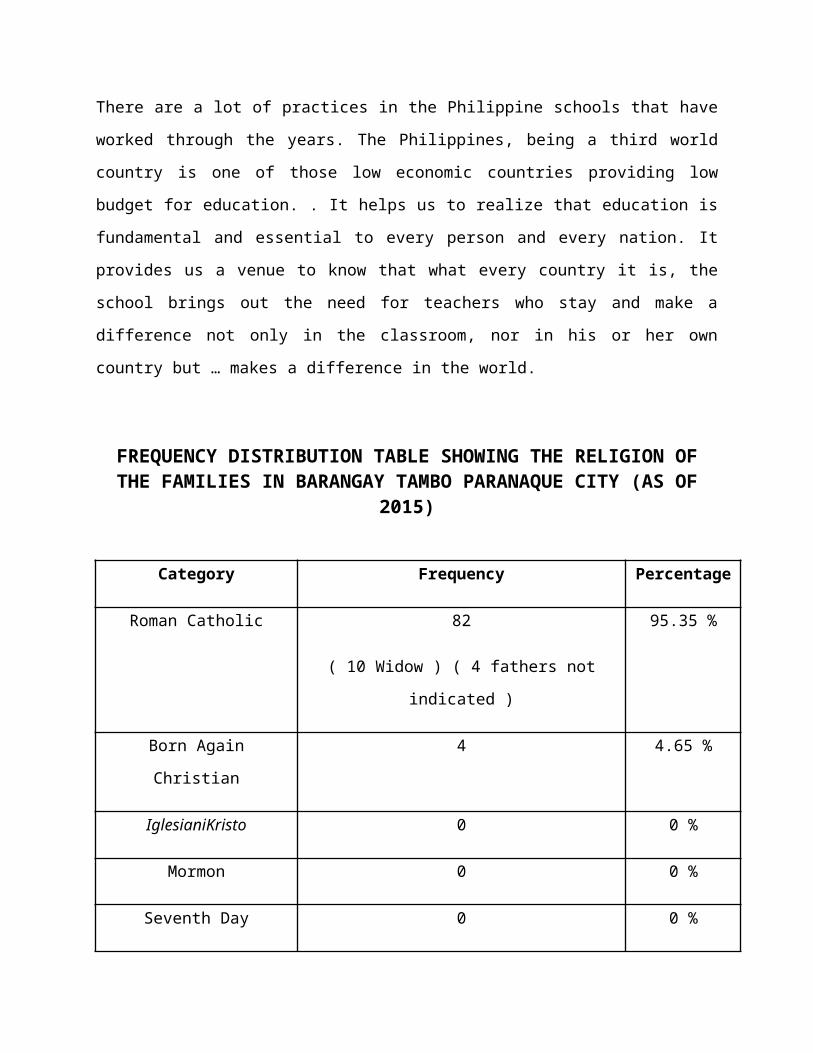
FREQUENCY DISTRIBUTION TABLE SHOWING THE RELIGION OF THE FAMILIES IN BARANGAY TAMBO PARANAQUE CITY
(AS OF 2015)
Category Frequency Percentage
Roman Catholic 82
( 10 Widow ) ( 4 fathers not indicated )
95.35 %
Born Again Christian 4 4.65 %
IglesianiKristo 0 0 %
Mormon 0 0 %
Seventh Day Adventist 0 0 %
TOTAL 86 100 %
GRAPH SHOWING THE FREQUENCY PERCENTAGE OF THE RELIGION OF THE FAMILIES IN BARANGAY TAMBO SEASIDE
PARANAQUE CITY (AS OF 2015)
Roman Catholic Born Again Christian
Iglesia ni Kristo Mormon Seventh Day Ad-ventist
Religion of the Families
0.9335 0.0465 0 0 0
5.00%15.00%25.00%35.00%45.00%55.00%65.00%75.00%85.00%95.00%
Religion of the Families

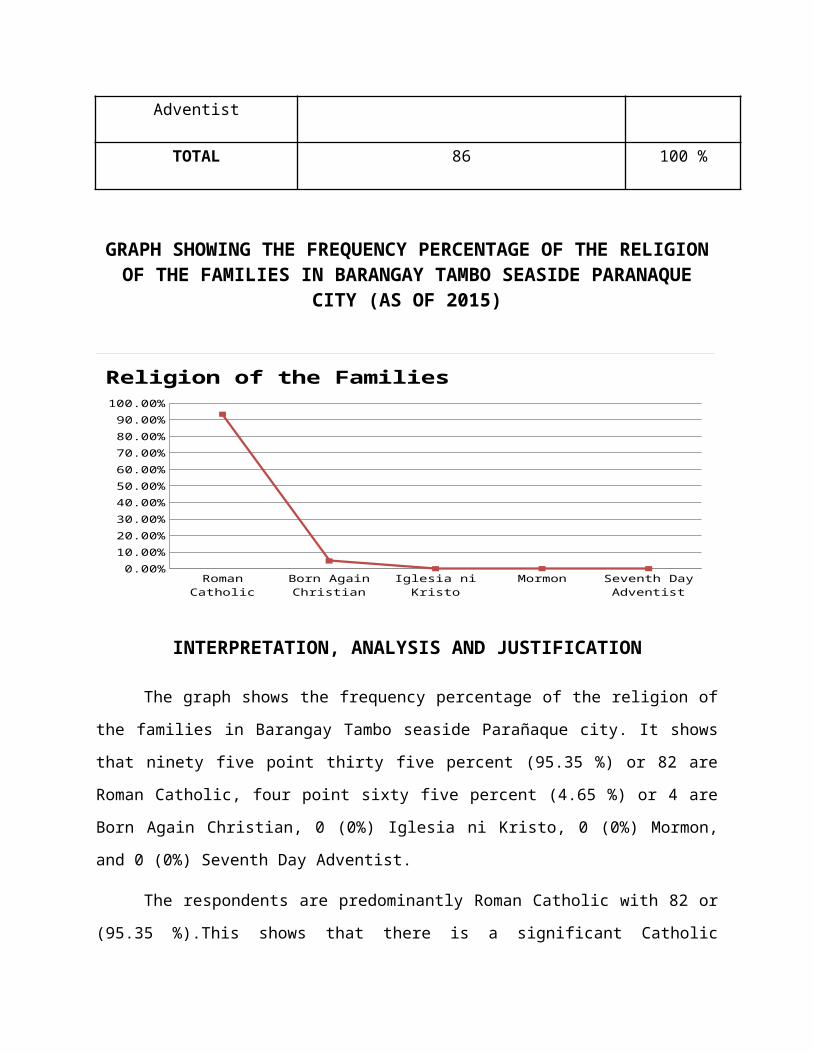
INTERPRETATION, ANALYSIS AND JUSTIFICATION
The graph shows the frequency percentage of the religion of the families in
Barangay Tambo seaside Parañaque city. It shows that ninety five point thirty five
percent (95.35 %) or 82 are Roman Catholic, four point sixty five percent (4.65 %) or 4
are Born Again Christian, 0 (0%) Iglesia ni Kristo, 0 (0%) Mormon, and 0 (0%) Seventh
Day Adventist.
The respondents are predominantly Roman Catholic with 82 or (95.35 %).This
shows that there is a significant Catholic tradition, and Catholicism is embedded in the
culture, which was acquired from priests or friars. There were 4 or (4.65 %) Born Again
Christian it is when an individual was encouraged to change their life and ‘come to
Jesus.’ Even with these early revivalists, the use of the term “born again” to describe
this experience of conversion is still not wide spread. While 0 or (0%) are Iglesia ni
Kristo who are indigenous-initiated religious organization in the religious affiliation in the
Philippines, Mormon, Seventh Day Adventist.
The Philippines is one of only two nations in Asia with Roman Catholicism as the
predominant religion and is the third largest Catholic country in the world. In the 16th
century Spanish explorers and colonists arrived in the Philippines with two major goals:
to participate in the spice trade which was previously dominated by Portugal and to
spread Catholicism in the Philippines and in nearby civilizations. Therefore Roman
Catholics are predominant religion.

FREQUENCY DISTRIBUTION TABLE SHOWING THE LENGTH OF RESIDENCY OF THE FAMILIES IN BARAGAY TAMBO
SEASIDE PARAÑAQUE CITY
Category Frequency Percentage
Less than 6 months 0 0 %
More than 6 months 45 100 %
TOTAL 45 100 %
GRAPH SHOWING THE FREQUENCY PERCENTAGE OF THE LENGTH OF RESIDENCY OF THE FAMILIES SURVEYED AT
THE BARANGAY TAMBO SEASIDE PARAÑAQUE CITY (AS OF 2015)
Less than 6 months
More than 6 months
0%
10%
20%
30%
40%
50%
60%
70%
80%
90%
100%
0%
100%
INTERPRETATION, ANALYSIS AND JUSTIFICATION
The graph shows the length of residency or how long that the families we
surveyed are living in Barangay Tambo, Seaside Parañaque. Out of 45 families
surveyed, all resided in the area for more than 6 months.
During our survey with the families, we observed that the resident that we
interviewed almost know all the people in the area, due to fact that they are accustomed
to the area and developed a good relationship with the people in the community . It is
important to get connected with the people in the community, so that in times of trouble
and you need help the people in the community is willing to help you. The longer time
you are with familiar surroundings or people, the greater the bond and stronger the
relationship with them. Our group truly believes that when you are working within a
community of like-minded people that the wisdom of crowds is considerably greater
than any one person working alone. Those scenes that we observed from them are
astounding and eye-opening. Despite the problems that they are facing still we see at
their faces how life is beautiful. Look around your community and be inspired!

FREQUENCY DISTRIBUTION TABLE SHOWING THE ADEQUACY OF HOUSE LIGHTING OF THE FAMILIES IN BARANGAY TAMBO SEASIDE PARANAQUE CITY
Category Frequency Percentage
Adequate 36 80%
Inadequate 9 20%
TOTAL 45 100%
GRAPH SHOWING THE FREQUENCY PERCENTAGE OF THE ADEQUACY OF HOUSE LIGHTING OF THE FAMILIES
SURVEYED AT THE BARANGAY TAMBO SEASIDE PARANAQUE CITY
Inadequate
Adequate
0% 10% 20% 30% 40% 50% 60% 70% 80% 90%

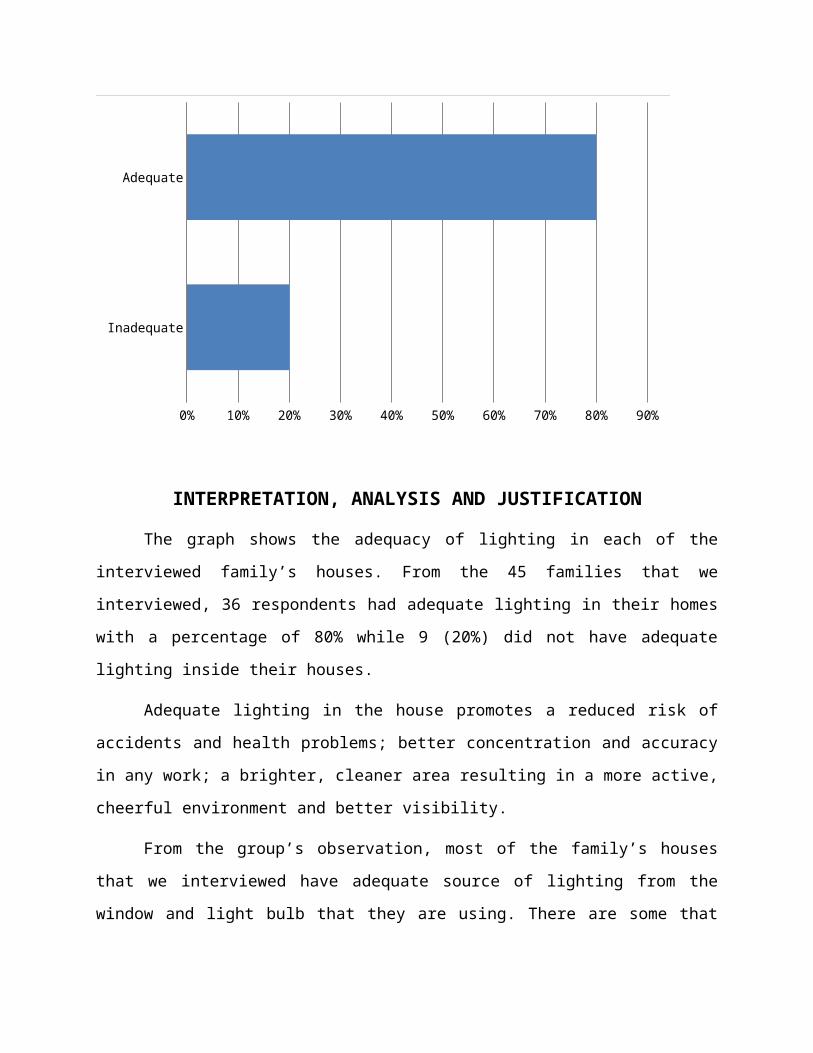
INTERPRETATION, ANALYSIS AND JUSTIFICATION
The graph shows the adequacy of lighting in each of the interviewed family’s
houses. From the 45 families that we interviewed, 36 respondents had adequate lighting
in their homes with a percentage of 80% while 9 (20%) did not have adequate lighting
inside their houses.
Adequate lighting in the house promotes a reduced risk of accidents and health
problems; better concentration and accuracy in any work; a brighter, cleaner area
resulting in a more active, cheerful environment and better visibility.
From the group’s observation, most of the family’s houses that we interviewed
have adequate source of lighting from the window and light bulb that they are using.
There are some that have inadequate lighting, due to their house is small and close to
each other that’s the reason why they cannot install a window.
Accidents can happen due to inadequate lighting. Poor lighting can be a safety
hazard - misjudgment of the position, shape or speed of an object can lead to accidents
and injury. Poor lighting can affect the quality of work, specifically in situation where
precision is required, and overall productivity. Poor lighting can be a health hazard - too
much or too little light strains eyes and may cause eye discomfort (burning, etc.) and
headaches.
It can be easy to improve lighting without increasing the number of light bulbs,
light fixtures or the electric bill. Improved lighting can be achieved by using more
daylight, by changing the position of light sources and by effectively using reflected light.
HOUSINGTYPES OF HOUSING LAND OF OWNERSHIP HOUSE OWNERSHIPADEQUACY OF HOUSEHOLD
LIGHTING ADEQUACY OF HOUSEHOLD
VENTILATION
FREQUENCY DISTRIBUTION SHOWING THE LAND OWNERSHIP IN BARANGAY TAMBO SEASIDE PARANAQUE
CITY (AS OF 2015)
Category Frequency Percentage
Owned 38 84%
Rented 7 16%
Rent Free 0 0%
TOTAL 45 100%
FIGURE SHOWING THE FREQUENCY PERCENTAGE OF THE LAND OWNERSHIP DISTRIBUTION IN BARANGAY TAMBO
SEASIDE PARANAQUE CITY
Rent free Rented Owned0%
10%
20%
30%
40%
50%
60%
70%
80%
90%
0%
16%
84%
INTERPRETATION, ANALYSIS AND JUSTIFICATION
The figure shows the land ownership in Barangay Tambo, Seaside Parañaque.
38 (84%) families owned the land, 7 (16%) families rented their house while 0% rented
free. These are the results from the 45 families that were being interviewed.
Based from the results, majority of the families owns the land due to the fact that
it is inherited from their elders. Living in urban areas is costly, you will have to pay a lot
of bills, and it is advantageous for the families that own a land that they are not paying
rent, it reduces concern and the money will be intended for their daily needs and
healthcare needs. One advantage of home ownership is you have the ability to do
whatever you want without getting consent from a landlord. Lastly, owning a home can
offer the stability of knowing where you will be living.
Some families are still renting their house; it is disadvantageous because you are
subject to owner’s rule. You are also subject to the quality in which the owner cares for
the property, which may result in a living situation you consider unpleasant. The
greatest disadvantage for renters is there zero return on your investment for rent
payments. Renters always concern about paying the rent.
FREQUENCY DISTRIBUTION SHOWING THE HOUSE OWNERSHIP IN BARANGAY TAMBO SEASIDE PARANAQUE
CITY (AS OF 2015)
Category Frequency Percentage
Owned 38 84%
Rented 7 16%
Squatter 0 0%
TOTAL 45 100%
FIGURE SHOWING THE FREQUENCY PERCENTAGE OF THE HOUSE OWNERSHIP DISTRIBUTION IN BARANGAY TAMBO
SEASIDE PARANAQUE CITY (AS OF 2015)
Owned Rented Squatter
Total 0.840000000000001 0.16 0
5%
15%
25%
35%
45%
55%
65%
75%
85%
INTERPRETATION, ANALYSIS AND JUSTIFICTAION
The figure shows the house ownership in Barangay Tambo, Seaside Parañaque.
From the total of 45 families being interviewed, thirty eight (38) respondents with the
percentage of eighty four (84%) owns their houses, owning a house can offer the
stability of knowing where you will be living. Seven (7) respondents with the percentage
of sixteen percent (16) rent their house, anytime the owner can kick you out if he/she
wants to sell the property. Your housing costs aren’t fixed; It will most likely grow from
year to year and zero (0) respondents with the percentage of zero (0) are neither renting
nor owning the house.
Majority of the respondents owns the house, which has Greater privacy. The
parents can afford to send their children to school; there is reserved money for
education since they don’t have obligation to pay for a rent. There’s pride in
homeownership, which also closely ties you to your community.
Flood happen always in the community, it affects the livelihood and health of the
families since flood can potentially increase the transmission of communicable disease
which is rampant during this time. Usually, during flood the area is covered with water
that occurs most commonly from heavy rainfall when natural watercourses do not have
the capacity to convey excess water. During flooding drinking water supplies may result
in disease and other health effects, especially in under developed areas. Gas and
electrical service may be disrupted. Transportation systems may be disrupted, resulting
in shortages of food and clean-up supplies. In under developed areas food shortages
often lead to starvation.
FREQUENCY DISTRIBUTION SHOWING THE TYPE OF HOUSING IN BARANGAY TAMBO SEASIDE PARANAQUE CITY
(AS OF 2015)
Category Frequency Percentage
Strong 9 20%
Light 9 20%
Mixed 27 60%
Makeshift 0 0%
TOTAL 45 100%
FIGURE SHOWING THE FREQUENCY PERCENTAGE OF THE TYPE OF HOUSING DISTRIBUTION IN BARANGAY
TAMBO SEASIDE PARANAQUE CITY (AS OF 2015)
Strong Light Mixed Makeshift0%
10%
20%
30%
40%
50%
60%
INTERPRETATION, ANALYSIS AND JUSTIFICATION
The figure shows the type of housing in the Baranagy Tambo, Seaside
Parañaque. From 45 families being interviewed, twenty-seven (27) respondents with the
percentage of Sixty (60%) have mixed materials used to construct their house. A mixed
material contains hollow block, cement and wood. It can lead to accidents and
occurrence of injuries from falls since it is not that durable or strong built.
Nine (9) respondents with the percentage of twenty (20%) have strong materials
used to construct their houses. Strong materials are concrete, bricks and metals.
Concrete is a building material made from cement and mineral aggregates such as
sand. Concrete is commonly used for home foundations because it can be counted on
to withstand the weight of the home as well as moisture in the ground and the natural
shifting and settling that occurs over the years. If you want to build a home that will last
for generations use bricks. Homes are rarely built from any type of metal. However,
thick steel rods are often used to reinforce homes made of other building materials,
including wood, cement and brick. Additionally, metal is becoming increasingly popular
as a roofing material because metal roofs can withstand time a lot better than roofs of
other materials, and they tend to stand up to extreme weather better.
Nine (9) respondents with the percentage of twenty (20%) have light materials
used to construct their houses. Light materials are made of wood, which are not that
durable, it deteriorates in some years past and it burns immediately if fire accidents
happen.
Lastly is zero (0) respondent with a percentage of Zero (0) have a makeshift
house. Makeshift home are temporary and usually of poor quality, but they are used
because there is nothing better available.
If you're building a home for yourself and your family, you want to ensure that the
resulting structure is a sturdy one that will not only last a lifetime, but it will also be
around when your children have their own children and when your grandchildren, too,
are ready to raise their families. Thus, it's important to select only the strongest building
materials.
FREQUENCY DISTRIBUTION SHOWING THE HOUSE
LIGHTING IN BARANGAY TAMBO SEASIDE PARANAQUE CITY
(AS OF 2015)
Category Frequency Percentage

Adequate 36 80%
Inadequate 9 20%
TOTAL 45 100%
FIGURE SHOWING THE FREQUENCY PERCENTAGE DISTRIBUTION OF HOUSE LIGHTING IN BARANGAY TAMBO
PARANAQUE CITY (AS OF 2015)
80%
20%
HOUSE LIGHTINGAdequate Inadequate
INTERPRETATION, ANALYSIS AND JUSTIFICATION
The graph shows the adequacy of lighting in each of the interviewed family’s
houses. From the 45 families that we interviewed, 36 respondents had adequate lighting
in their homes with a percentage of 80%. Many people do not have adequate lighting in
key locations in their home, and this is a common source of injury. Make sure you have
adequate lighting for all staircases and dark rooms, and be sure to replace any burned-

out bulbs in a timely manner. Benefits of adequate lighting; ease of seeing, families
should be able to see the house clearly and with ease when working. Good illumination
enables the family to see the objects in the house clearly and easily. Reduced
eyestrain, eyestrain is the result of inadequate and bad lighting. It causes fatigue and
impairs vision.
Other families have inadequate lighting in their house, there are 9 (20%)
respondents were in their house lack of lighting. Poor lighting can cause you to fall: Slip
and fall, trip and fall due to inadequate lighting. It can cause fall and get hurt during
household chores because there was not enough light to see properly.
The lights in your home and at the office can make a difference to the way you
feel and can even affect your health.
In fact, according to new research published in the Journal of Clinical Endocrinology &
Metabolism, exposure to certain types of electric light before bed and at night can
increase the risk of type 2 diabetes, high blood pressure and cancer.
Light is critical for our health and wellbeing. Ensuring that we receive adequate
light levels at the appropriate time of day benefits our alertness, mood, productivity,
sleep patterns and many aspects of our physiology.
FREQUENCY DISTRIBUTION SHOWING THE ADEQUACY OF HOUSEHOLD VENTILATION (AS OF 2015)
Category Frequency Percentage
Adequate 28 62%
Inadequate 17 38%
TOTAL 45 100%
FIGURE SHOWING THE FREQUENCY PERCENTAGE DISTRIBUTION OF HOUSEHOLD VENTILATION (AS OF 2015)
Adequate
Inadequate
0% 10% 20% 30% 40% 50% 60% 70%
House Ventilation
INTERPRETATION, ANALYSIS AND JUSTIFICATION
The graph shows the adequacy of household ventilation in Barangay Tambo,
Seaside Parañaque. From the 45 families that we interviewed, 28 (62%) respondents
have adequate ventilation in their house. Proper ventilation is vital to your family's health
and comfort. It helps your home rid itself of moisture, smoke, cooking odors, and indoor
pollutants. Controls heat levels, moderates dampness, and keeps moisture out of
uninsulated walls. Kitchens, bathrooms, and laundries are the biggest sources of
moisture and odors. Having enough windows in the house, provide adequate

ventilation, it creates an upward flow of air, cool air flows in the window. Proper
ventilation ensures that adequate fresh, outdoor air flows into a home, which helps to
both control moisture and reduce indoor air pollutants such as particulate matter,
biological contaminants, and harmful gases. Natural ventilation refers to the movement
of air in and out of a home through opened windows and doors can be achieved by the
community if windows and doors are correctly used and installed.
According to the survey, there are houses that have inadequate ventilation, from
45 families being surveyed, 17 (38%) respondents with this kind of house. Many
property owners are unaware of the impact that poor ventilation can have on different
parts of their house. Not only can it create with damp and mould, it can also have a
detrimental effect on the health of all of those who use a house. This is perhaps one of
the most consequences of poor ventilation in a property. A lack of ventilation has been
linked to respiratory diseases such as asthma, and can also facilitate the spread of
diseases. It has also been linked with allergies, pneumonia, fatigue, nausea, dry eyes,
headaches and nasal congestion. However, by installing a system that helps to
distribute air evenly throughout at home, it is possible to avoid these unpleasant side-
effects.
Natural ventilation is probably one of the most cost-effective ways to improve air
flow, as it comes with no running costs and does not use up energy.
ENVIRONMENTFood storage
Water supplySource of drinking waterExcreta disposalPresence of pestsDomesticated animals
FREQUENCY DISTRIBUTION TABLE SHOWING THE FOOD
STORAGE OF FAMILIES IN BARANGAY TAMBO PARAÑAQUE CITY
Category Frequency Percentage
Refrigerated 10 22%
Non Refrigerated: 0 0%
a. Covered 35 78%
a. Not Covered 0 0%
TOTAL 45 100%

GRAPH SHOWING THE FREQUENCY PERCENTAGE OF THE FOOD STORAGE OF THE FAMILIES IN BARANGAY
TAMBO SEASIDE PARAÑAQUE CITY
Refrigerated Non refrigerate a. Covered b. Not Covered
Total 0.22 0 0.78 0
5%
15%
25%
35%
45%
55%
65%
75%
85%
Food storage
INTERPRETATION, ANALYSIS AND JUSTIFICATION
The graph presents the type of food storage used by the families interviewed in
Barangay Tambo, Seaside Paranaque City. Out of 45 families, twenty-two percent of
them (22%) or 10 respondents using refrigerators for storage of food and 35
respondents or seventy eight percent (78%) use container covered for their food
storage.
According to our surveys, majority of the families are using container covered for
their food storage. Left over foods that not refrigerated can be contaminated or a
possibility to be spoiled. When this happen food poisoning may occur, also called
foodborne illness - is caused by harmful organisms, such as bacteria in contaminated
food. Because bacteria typically don't change the taste, smell or look of food, you can't

tell whether a food is dangerous to eat. So if you're in doubt about a food's safety, it's
best to throw it out. Food that has been left too long on the counter may be dangerous
to eat, but could look fine. Fortunately, most cases of food poisoning can be prevented
with proper food handling.
A refrigerator is one of the most important pieces of equipment in the kitchen for
keeping foods safe. We are instantly reminded of its importance to our daily lives when
the power goes off or the unit fails, putting our food's safety in jeopardy. Refrigeration
slows bacterial growth. Bacteria exist everywhere in nature. They are in the soil, air,
water, and the foods we eat. When they have nutrients (food), moisture, and favorable
temperatures, they grow rapidly, increasing in numbers to the point where some types
of bacteria can cause illness. Food that has been stored too long in the refrigerator or
freezer may be of lessened quality, but most likely would not make anyone sick.
(However, some bacteria such as Listeria monocytogenes thrive at cold temperatures,
and if present, will multiply in the refrigerator over time and could cause illness.)
Cook the food well and if there are leftover pre-heat before eating. Cool down
leftovers as quickly as possible (ideally within 90 minutes), store them in the fridge and
eat them within 2 days.
FREQUENCY DISTRIBUTION TABLE SHOWING THE WATER SUPPLY OF THE FAMILIES IN BARANGAY TAMBO SEASIDE PARANAQUE CITY
Category Frequency Percentage
Level 1 (Point Source) 45 100%
Level 2 (Communal Faucet/ Standposts) 0 0%
Level 3 (Waterworks System) 0 0%
Others (Specify) 0 0%
TOTAL 45 100%

GRAPH SHOWING THE FREQUENCY PERCENTAGE OF THE WATER SUPPLY OF THE FAMILIES IN BARANGAY TAMBO SEASIDE PARANAQUE CITY
LEVEL 1
LEVEL 2
LEVEL 3
0% 10% 20% 30% 40% 50% 60% 70% 80% 90% 100%
WATER SUPPLY
INTERPRETATION, ANALYSIS AND JUSTIFICATION
The graph shows the type of water supplied to the community in Barangay
Tambo, Seaside Parañaque City. The residents in the community use level 1 for their
water supply. From our observation, majority or 45 families (100%) are using.
As we look around the area we noticed and seen that the pipelines have
NAWASA or National water and Sewarage Authority as their source of water supply.
Water is essential for the human body to function. The body cannot store water
and must have fresh supplies every day to perform virtually every metabolic process.
Babies and the elderly are vulnerable to lack or dehydration. Not drinking enough water
increases the risk of kidney stones and, in women, urinary tract infections.
The National Water and Sewerage Authority (NAWASA) is currently the only
agency in water supply and sewerage collection, treatment and disposal. NAWASA is a
premier water utility, providing customers with a safe, adequate and reliable water
supply, as well as safe disposal of waste water in a viable and efficient manner.

The human body can last week without food, but only days without water. That
is how important water is in our body. Avoid drinking dirty or contaminated water.
Cholera, a bacterial illness, can be acquired when sources of drinking water have been
contaminated. Malaria is caused by a parasite, and a virus causes Dengue fever. Both
malaria and Dengue fever are carried by mosquitoes, which lay their larvae in still water.
The amount of water we need depends on our body size, metabolism, the
weather, the food we eat and our activity levels.
FREQUENCY DISTRIBUTION TABLE SHOWING THE DRINKING WATER OF THE FAMILIES IN BARANGAY TAMBO
SEASIDE PARANAQUE CITY (AS OF 2015)
Category Frequency Percentage
Level 1 (Point Source) 0 0%
Level 2 (Communal Faucet/Stand posts) 0 0%
Level 3 (Waterworks System) 38 84%
Others (specify) 7 16%
TOTAL 45 100%
GRAPH SHOWING THE FREQUENCY PERCENTAGE OF THE DRINKING WATER OF THE FAMILIES IN BARANGAY TAMBO
SEASIDE PARANAQUE CITY (AS OF 2015)

LEVEL 1 LEVEL 2 LEVEL 3 OTHER
DRINKING WATER 0 0 0.840000000000001
0.16
5%
15%
25%
35%
45%
55%
65%
75%
85%
DRINKING WATER
INTERPRETATION, ANALYSIS AND JUSTIFICATION
The graph showed the type of drinking water in the community of Barangay
Tambo Seaside Paranaque City. From 45 families interviewed, 38 (84%) is at level 3
while 7 respondents or (16%) drinking other water supply such as mineral water.
Majority of the families drinks water directly from the faucet, where NAWASA is
the source of their water supply. Based on our research, water from NAWASA is safe
and a reliable water supply. Despite this it is still important to boil or filter the water from
NAWASA before drinking because there is a possibility that the water coming from them
could be contaminated, if we can drink contaminated water that contains
microorganisms such as “Giardia” (a common microorganism that if not killed, leads to
intestinal disorders), bacteria, or viruses that can lead to infections. Boiling, filtering, or
chemically treating water can remove or kill microorganisms. How many minutes to boil
water until safe to drink: 30 minutes at 16 degree Fahrenheit; 3 minutes at 185 degree
Fahrenheit and instant at 212 degree Fahrenheit.
Water is essential to good health. There are many different opinions on how
much water we should be drinking every day. The health authorities commonly

recommend eight 8-ounce glasses, which equals about 2 liters, or half a gallon. This is
called the 8×8 rule and is very easy to remember. But in according to other research,
your water needs depend on many factors, including your health, how active you are
and where you live. Water is our body's principal chemical component and makes up
about 60 percent of our body weight. Every system in our body depends on water. Lack
of water can lead to dehydration, a condition that occurs when you don't have enough
water in your body to carry out normal functions. Even mild dehydration can drain your
energy and make you tired.
FREQUENCY DISTRIBUTION TABLE SHOWING THE METHODS OF WATER TREATMENT OF THE FAMILIES IN
BARANGAY TAMBO SEASIDE PARAÑAQUE CITY
Category Frequency Percentage
Boiling 20 44%
Filtration 7 16%
Sedimentation 0 0%
Others (purchasing bottled mineral water) 4 9%
NONE 14 31%
TOTAL 45 100%
GRAPH SHOWING THE FREQUENCY PERCENTAGE OF THE water treatment method of the families in Barangay
tambo, seaside ParaÑaque city
44%
16%
9%
31%
Water Treatment
Boiling
Filtration
Sedimation
Others (purchased bottled mineral water)
None
INTERPRETATION, ANALYSIS AND JUSTIFICATION
The graph showed the type of water treatment method of the families in
Barangay Tambo, Seaside Parañaque City. From 45 families interviewed 20 (44%)
respondent use boiling. Water boiled before drinking it is one of the recommended
practices by health officers especially the third world countries where their source of
drinking water is not safe and sometimes the causes for some incidence of common
illness for children. To ward off the impending occurrence of water-borne diseases,
boiling your drinking water is the safest way, study shows that water boiled for three
minutes kills’ bacteria, including disease-causing organisms and giardia cysts.
Respondent using filtration is 7 families or 16%. Water filtration also makes water
taste better. When water tastes better, people are more likely to drink it. There are
plenty of ways to filter your water, and they all hold some kind of importance for your
wellbeing.
On the other hand, no one is using Sedimentation as a method of water
treatment. Sedimentation is a physical water treatment process using gravity to
remove suspended solids from water. Solid particles entrained by the turbulence of

moving water may be removed naturally by sedimentation in the still water of lakes
and oceans.
There are 4 families or 9% purchasing bottled mineral water that uses mostly by
babies or children in the family while other families 14 (31%) are not using any method
of water treatment. These families drink directly the water coming from their faucets.
The water is found almost everywhere on Earth. Water resources like rivers,
lakes, which provide water contain a lot of pollution, garbage unfit for consumption. To
be clean, the water should undergo a number of treatments necessary to make it
drinkable.
FREQUENCY DISTRIBUTION TABLE SHOWING THE PRESENCE OF PESTS IN THE FAMILIES HOUSES IN
BARANGAY TAMBO SEASIDE PARAÑAQUE CITY
Category Frequency Percentage
Cockroach 45 25%
Rodents 45 25%
Flies 45 25%
Insects 45 25%
TOTAL 180 100%
GRAPH SHOWING THE FREQUENCY PERCENTAGE OF PRESENCE OF PESTS IN THE FAMILIES HOUSES IN
BARANGAY TAMBO SEASIDE PARAÑAQUE CITY

COCKROACH RODENTS FLIES INSECTS
PRESENCE OF PESTS 0.25 0.25 0.25 0.25
5%
15%
25%
35%
45%
55%
65%
75%
85%
95%
Presence of Pests
INTERPRETATION, ANALYSIS AND JUSTIFICATION
The graph shows the frequency percentage of presence of pests in the families’
houses in Barangay Tambo Seaside Paranaque City. From the total of 45 or families
that was interviewed all of them or 100% indicated the presence of pests such as
cockroach, rodents, flies, insects present in every household.
It is inevitable that pests will invade our homes. It is always best to have these
pests controlled by the individual and community who know how to do it with less cost
and safer for you, and your family. The results indicate that all or (100%) of the families
that was interviewed had presence of pests such as cockroach, rodents, flies, insects
which is very alarming especially because it is the cause of poor sanitation.
A clean home will always have fewer pests than a dirty home, but that doesn’t
mean that the clean one doesn’t have any. Some insects can survive without food and
they are capable of living in your home while being completely unnoticed. All that is left
to do is keep them out of your sight and keep their numbers at bay.
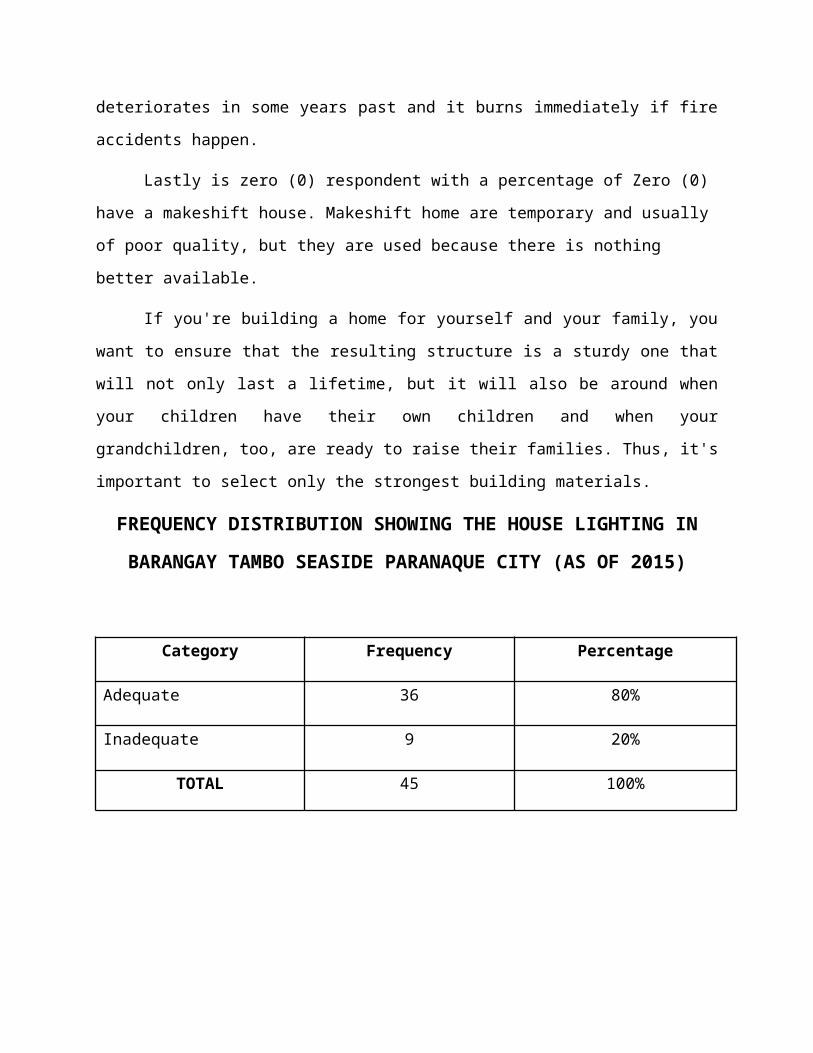
Sanitation and exclusion through sealing possible entry points are the best ways
of preventing pest problems. Aside from these are less costly, they have been proven to
be more effective means of keeping pests away from your property. Seal tiny holes
around the facility to keep ants from establishing passageway through your area.
Concerns for the environment and the requirements by regulators for improved
practices in the industry have meant that new methods to control pests have had to be
developed.
FREQUENCY DISTRIBUTION TABLE SHOWING THE DOMESTICATED ANIMALS PRESENT IN BARANGAY TAMBO
SEASIDE PARAñAQUE CITY
Category Frequency Percentage
Birds 0 0%
Cats 9 36%
Dogs 15 60%
Rabbit 1 4%
TOTAL 25 100%
GRAPH SHOWING THE FREQUENCY PERCENTAGE OF THE DOMESTICATED ANIMALS PRESENT IN BARANGAY TAMBO
SEASIDE PARAÑAQUE CITY
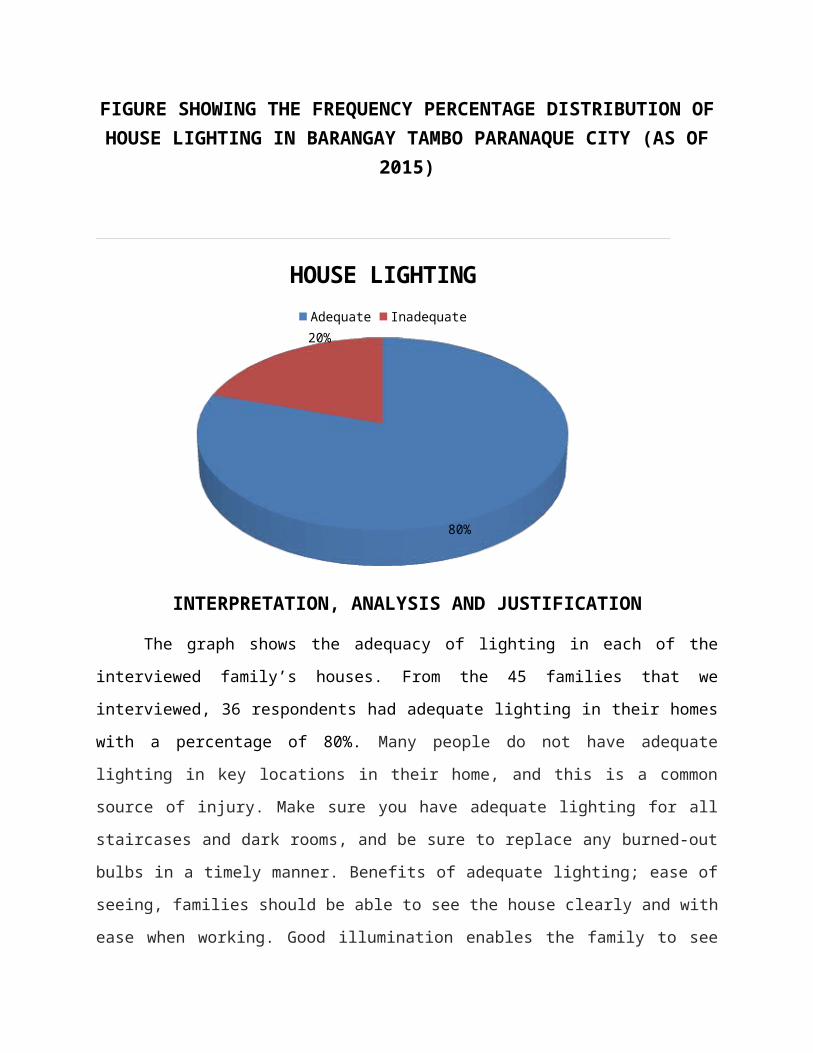
36%
60%
4%
Domesticated Animasl
BIRDS CATS DOGS RABBIT
INTERPRETATION, ANALYSIS AND JUSTIFICATION
This graph shows the frequency percentage of the domesticated animals present
in Barangay Tambo Seaside Paranaque City. From the families that was interviewed
nine or (36%) have been domesticating cats, fifteen or (60%) has dogs, one or (4%)has
a pet rabbit.
Almost every household in the Philippines has a pet dog. Dogs, after all, are
supposed to be “Man’s Best Friend.” Their loyalty, intelligence, and of course cuteness
make them endearing to pet owners. While36% who have cats also preferred pet by
people who want low-maintenance animal companions. “Cats are not as high
maintenance as dogs. They are a little bit independent. You can leave for a longer
period of time.” And rabbit with 4% may be easy to love, but they’re not quite as easy to
care for. These lovable, social animals are wonderful companions for people who take
the time to learn about their needs.
The condition that such facilities are adequate, clean and sanitary, and that they
will not be used for nor cause pain and/or suffering to the animals is a continuing
requirement for the operation of these establishments. Aside from rabies, the ordinance
authors also expressed apprehension over “zoonotic diseases” or diseases that can be
transmitted from animals to humans such as salmonella and ringworm.
Family health care Status of pregnancy Prenatal visit Birth attendant who handled the delivery Place of delivery Nutritional status of children (0-6 yrs. Old)
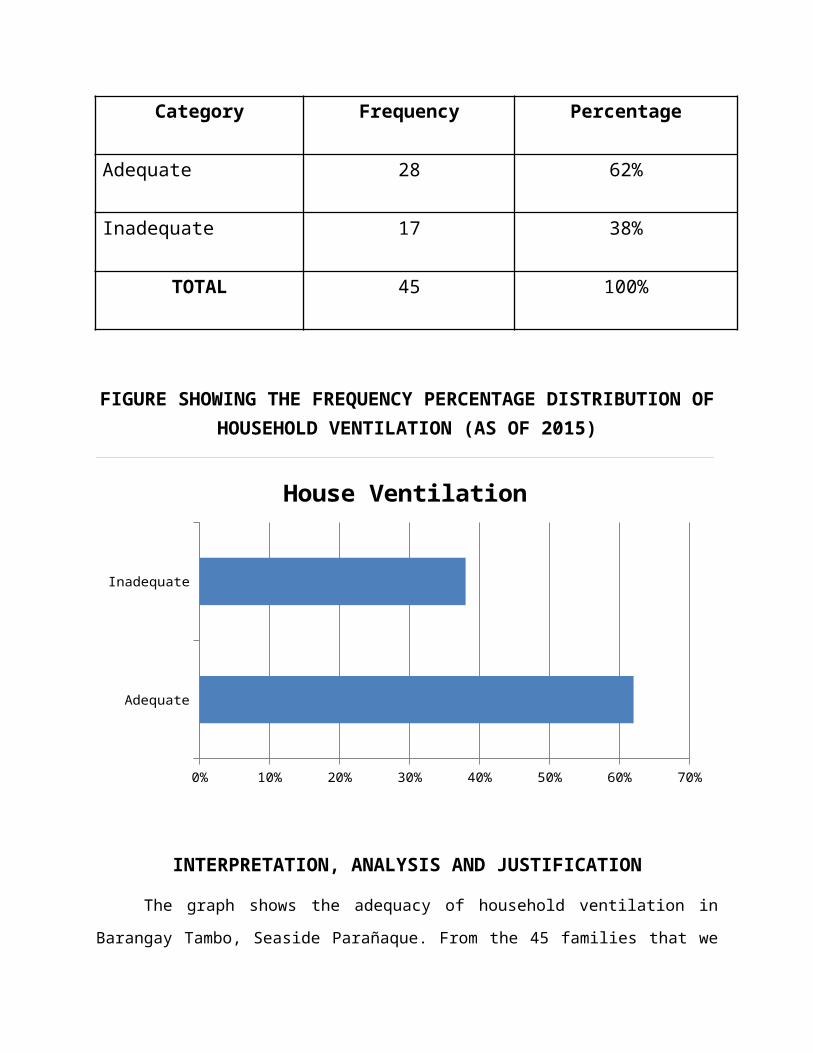
Immunization of children (0-5 yrs. Old) Morbidity and mortality distribution of the total population
FREQUENCY DISTRIBUTION SHOWING STATUS OF PREGNANCY IN BARANGAY TAMBO SEASIDE PARAÑAQUE
CITY (AS OF 2015)
Category Frequency Percentage
Number of Pregnancies last year 16 80%
Number of Pregnancies as of present year
4 20%
TOTAL 20 100%
GRAPHICAL PRESENTATION SHOWING THE FREQUENCY PERCENTAGE STATUS OF PREGNANCY AT BARANGAY
TAMBO SEASIDE PARAÑAQUE CITY
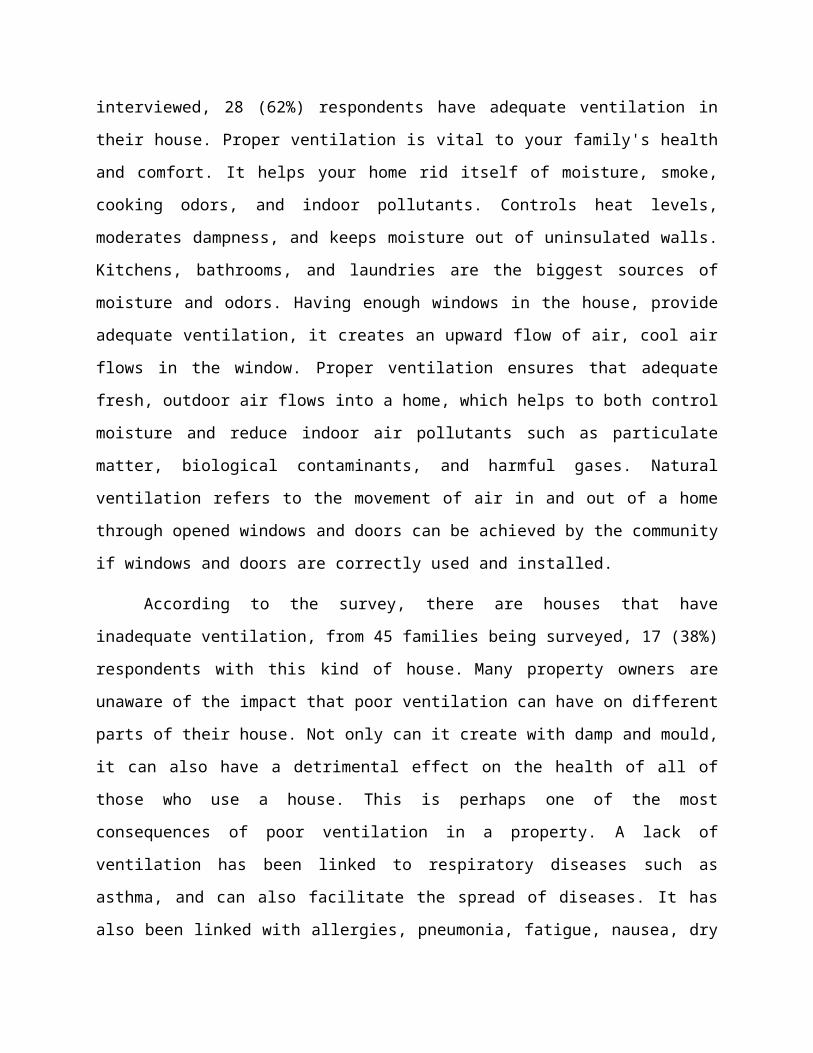
80%
20%
Status of Pregnancy
Number of preg-nancies last year
Number of pregnan-cies as of present year
INTERPRETATION, ANALYSIS AND JUSTIFICATION
This graph shows the status of pregnancy at Barangay Tambo Seaside
Parañaque City. There were sixteen 16 individuals who had their Pregnancy last year
and four (4) that was Pregnant as of this year (2015).
This indicates all age groups have contributed to the decline in pregnancy rates
as of this year (2015). The observed graphical presentation of the frequency percentage
status of pregnancy can most likely be attributed to changes in family planning practices
and programs.
Fertility trends can also be established using retrospective data from a single
survey. It uses information from the retrospective birth histories obtained in the 2008
NDHS to examine trends in age-specific fertility rates for successive five-year periods
before the survey. To calculate these rates, births were classified according to the
period of time in which the birth occurred and the mother’s age at the time of birth.
FREQUENCY AND PERCENTAGE DISTRIBUTION SHOWING THE TEN LEADING CAUSES OF MORBIDITY IN PARANAQUE
(AS OF 2015)
RANK CAUSE RATE
1 RTI (Respiratory Tract Infection)
206
2 Dermatitis 85
3 Wound 76
4 ATP 52
5 PTB 51
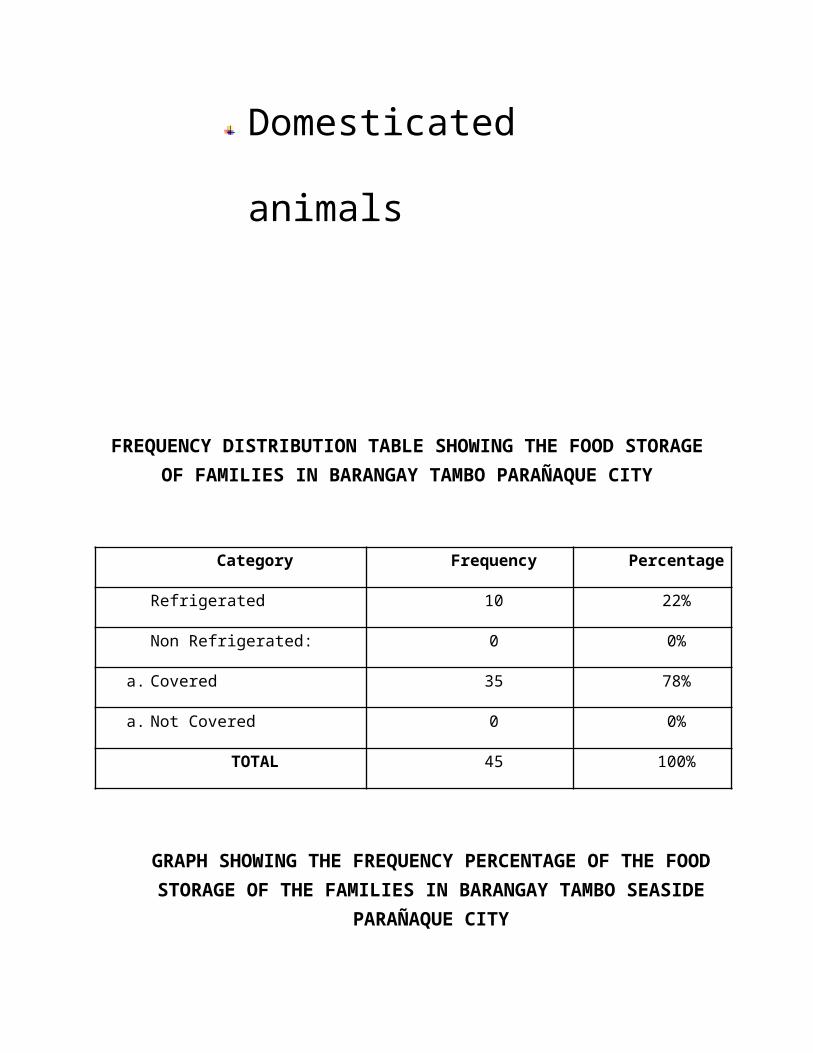
6 Hypertension 51
7 Diarrhea 47
8Animal Bite 38
9Pneumonia 35
10 UTI 34
GRAPHICAL REPRESENTATION SHOWING THE RATE OF MORBIDITY IN PARANAQUE (AS OF 2015)
RTI
DERMATI
TIS
WOUND
ATP PTB
HYPER
TENSI
ON
DIARRHEA
ANIMAL
BITE
PNEUMONIA UTI
0%
50%
100%
150%
200%
250%
206%
85% 76%
52% 51% 51% 47% 38% 35% 34%
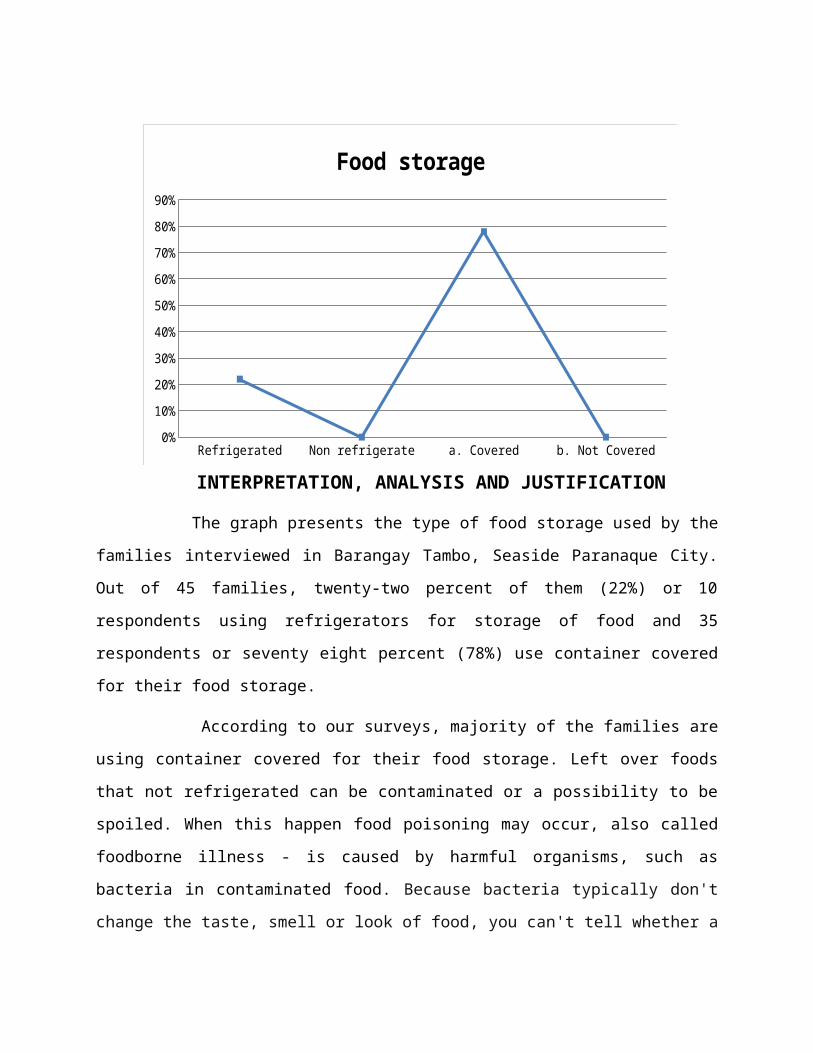
INTERPRETATION, ANALYSIS AND JUSTIFICATION

FREQUENCY AND PERCENTAGE DISTRIBUTION SHOWING THE TEN LEADING CAUSES OF MORTALITY IN PARANAQUE
(AS OF 2015)
RANK CAUSE RATE
1 CAD 66
2 Hypertension 46
3 Pneumonia 41
4 Cancer 33
5 Diabetes Miletus 28
6 Tuberculosis 18

7 Multi Organ Failure 15
8 Renal Disease 15
9 Congenital Disease 12
10 Bronchial Asthma 9
GRAPHICAL REPRESENTATION SHOWING THE RATE OF MORTALITY IN PARANAQUE (AS OF 2015)
CAD
HYPER
TENSI
ON
PNEUMONIA
CANCER DM TB
MULTIO
RGAN FAILU
RE
RENAL D
ISEA
SE
CONGENIT
AL DISE
ASE
BRONCHIA A
STHMA
0%10%20%30%40%50%60%70%
66%
46%41%
33%28%
18% 15% 15% 12% 9%
Rate


INTERPRETATION, ANALYSIS AND JUSTIFICATION
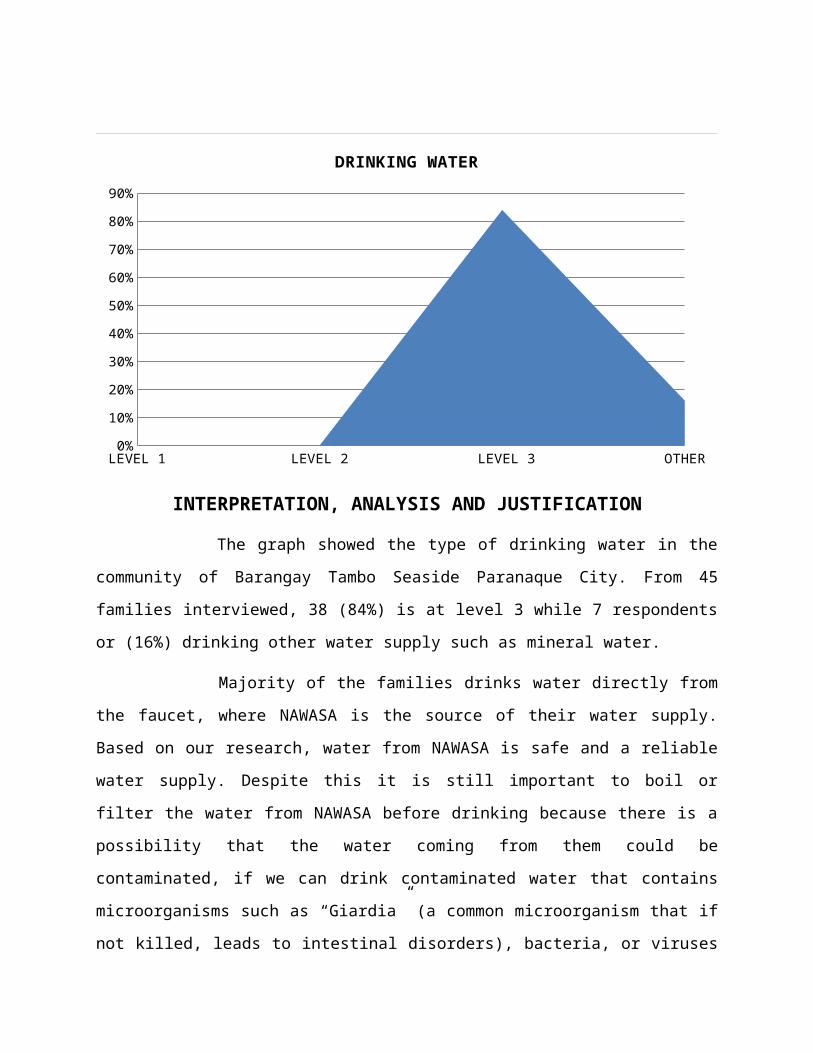
HEALTH SEEKING BEHAVIOR
Common ailments
Area sought information for
consultation
Source of health
FREQUENCY AND PERCENTAGE DISTRIBUTION SHOWING THE COMMON AILMENTS OF THE FAMILIES INTERVIEWED
at barangay tambo, seaside paraÑaque (as of 2015)
CATEGORY FREQUENCY PERCENTAGE
Colds 8 17.78%
Fever 4 8.89%
Cough 8 17.18%
Asthma 5 11.11%
Flu 4 8.89%
High Blood Pressure 6 13.33%
Sore Eyes 10 22.22%
Total 45 100%
GRAPHICAL PRESENTATION SHOWING THE COMMON AILMENTS OF THE FAMILY MEMBERS OF THE HOUSEHOLDS
SURVEYED
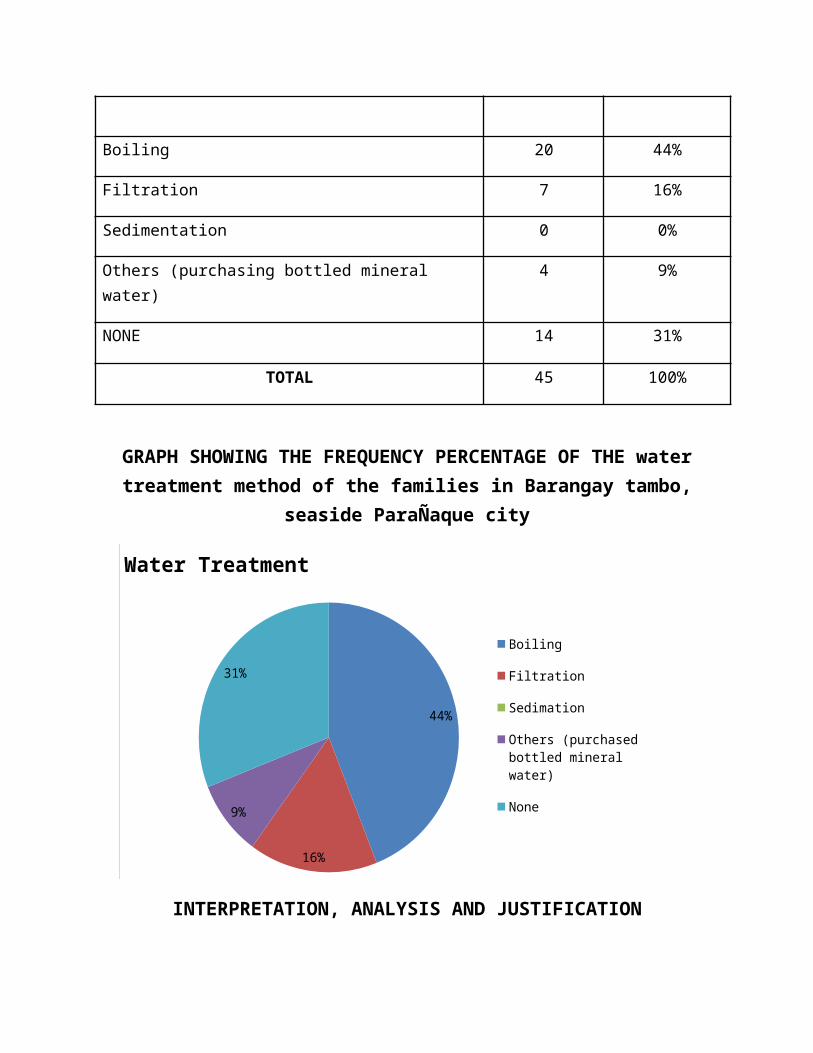
C F C AFL
U HISO
17.78%
8.89%
17.78%
11.11%
8.89%
13.33%
22.22%Common Ailments of the Family
Members
INTERPRETATION, ANALYSIS AND JUSTIFICATION
The table shows the common ailments of the families interviewed in Tambo
Seaside Paranaque. In a total of 45 families it shows that Sore Eyes has the highest
percentage Twenty-two point twenty two percent (22.22%) of the total average, followed
by Cough and Cold with the same equivalent percentage of seventeen point seventy
eight percent (17.78%), High Blood Pressure with a percentage of thirteen point thirty
three percent (13.33%), Asthma with a percentage of eleven point eleven (11.11%), Flu
and Fever with same equivalent percentage of eight point eighty nine percent (8.89%).
Commonly observed in Tambo seaside Paranaque are congested houses which
can result to raid spread of diseases throughout the community. Sore Eyes is the most
common Ailment based on the families interviewed, the residents of the community are
at a higher risk of having this type of virus or bacterial infection in the eye as it is very
contagious. Sore eyes are such a common and recurring ailment. A common cause of
sore eyes is conjunctivitis (or pink eye), but the problem can also be caused by an
infection, allergies, too much sun exposure, eye fatigue, or contact lens wear.
Colds and Cough are also very common in Tambo seaside community. Colds
and Cough here in the Philippines are common because colds and cough are minor
infections of the respiratory tract which can lead to major illnesses. Colds and Cough
are commonly considered as a symptom of some illness.
Information about common ailments in the community is important. In this study it
is very important to know the most common ailments that are in the community which
allows the researcher to keep track of common illnesses across a defined community
and as well profound ways on how to prevent or manage these ailments in the
community. Keeping track of common illness found in a specific community and to
determine self-awareness of each family in the community and to promote a healthy
status or a healthy wellbeing in the community is the primary focus of the researcher.
Contrary to common belief, Sore eyes does not infect someone by just looking
into an infected eye, one can only get infected by direct contact with secretions or
something holding secretions of patient such as handkerchief, towel, wash bowl or
water.
Cold weather does not directly cause Colds and Cough, although some colds
viruses easily grow during cold weather. The reason why colds are more common
during cold days is because people tend to stay inside when it gets chilly out. Indoor air
is trapped, so when people sneeze, others catch the viruses that come along with it.
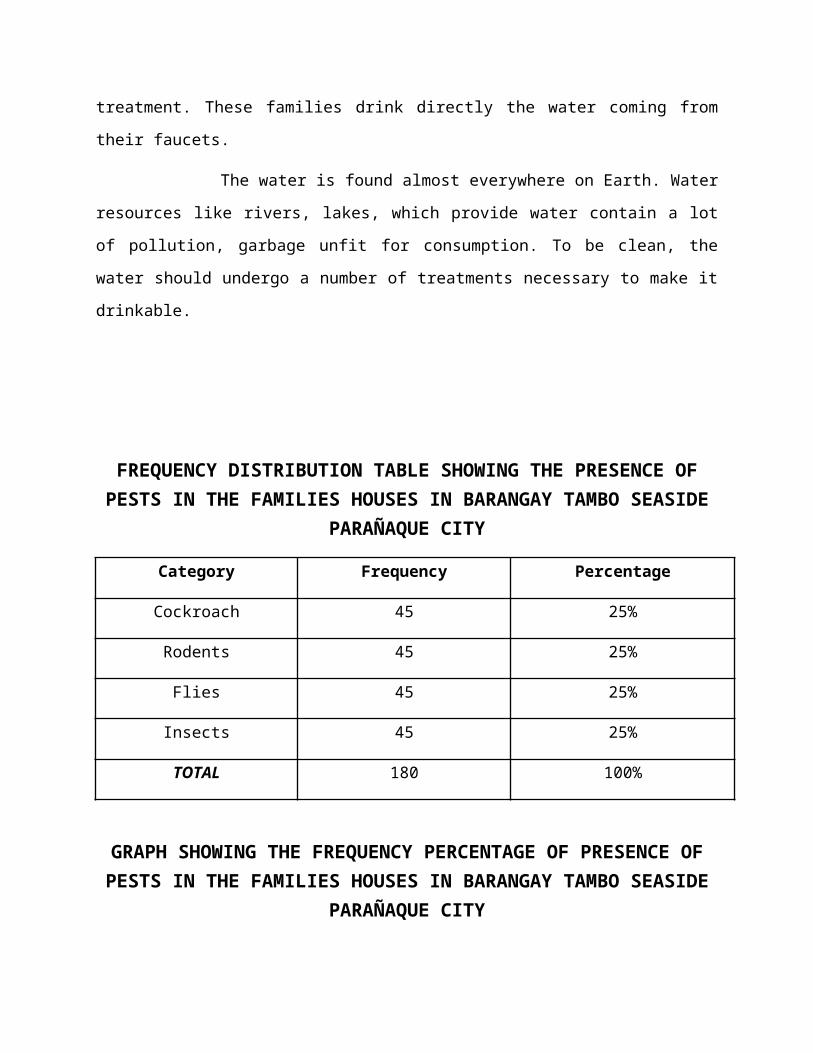
Allergies and physical stress also do not cause colds but they are factors that make a
person more susceptible to the infection. Common colds are transmitted from person to
person through direct contact or contaminated surfaces commonly touched.

THE FREQUENCY AND PERCENTAGE DISTRIBUTION SHOWING THE PLACES SOUGHT FOR CONSULTATION OF THE FAMILIES INTERVIEWED at barangay tambo, seaside
paraÑaque (as of 2015)
CATEGORY FREQUENCY PERCENTAGE
Hospital 5 11.11%
Health Center 17 37.78%
Private Clinic 2 4.44%
None 21 46.67%
TOTAL 45 100%
GRAPHICAL REPRESENTATION SHOWING THE PLACES SOUGHT FOR CONSULTATION OF THE FAMILIES SURVEYED
HOSPITALHEALTH CENTER PRIVATE
CLINIC NONE
11.11%
37.78%
4.44%
46.67%
Places Sought for Consultation
INTERPRETATION, ANALYSIS, AND JUSTIFICATION
The table shows the areas of consultation of the citizens in Tambo seaside
Paranaque. None (people who don’t ask for consultation) has the highest percentage of
forty six point sixty seven percent (46.67%) as most people in Tambo seaside practice
home care such as use of Breast milk for treatment of sore eyes, herbs, and self-
medications. Following is Health Center with a percentage of thirty seven point seventy
eight percent (37.78%) where people of in Tambo seaside mostly have consultation
about their illness. Hospital with a percentage of eleven point eleven percent (11.11%)
and Private Clinic with a percentage of four point forty four percent (4.44%).
As poverty is an issue when it comes to seeking health care in the Philippines, it
is hard for people to consult health status from Private Clinics and Hospitals. It is very
important to consult in Health centers at least once a month knowing the different
services they provide for people in the community. It is also most convenient
considering its proximity to the community with professional health care providers
available in the health centers.
The Community Health Center is a community-based and patient-directed
organization. Its goal is to provide first aid, maternal and child health care, diagnosis of
social diseases, and other basic health services to all the members of the community it
is serving. It is usually the first point of contact between residents of the community and
other health care facility levels.
According to the World Health Organization (WHO), the goal of Primary Health
Care is beneficial for all. It aims to reduce health exclusion and social disparities. It
helps in organizing health services according to people’s needs and expectations. It
also works on integrating health into all sectors. Primary health care gives high
importance to education, nutrition, preventive medicine and treatment of the most
common diseases and injuries. It is considered as a practical means of giving any form
of health care for increasing populations in poor economies such as in Third World
countries. The Philippines is among the first countries to adopt the idea of Primary
health care and integrate it in most local communities.

FREQUENCY AND PERCENTAGE DISTRIBUTION SHOWING THE SOURCE OF HEALTH INFORMATION OF THE FAMILIES
SURVEYED INTERVIEWED at barangay tambo, seaside paraÑaque (as of 2015)
CATEGORY FREQUENCY PERCENTAGE
Health Center 21 46.67%
Television 15 33.33%
Phone 0 0%
Newspaper/Flyers/Posters 5 11.11%
Radio 4 8.89%
TOTAL 45 100%
GRAPHICAL REPRESENTATION SHOWING THE SOURCE OF HEALTH INFORMATION OF THE FAMILIES SURVEYED
46.67%
33.33%
11.11%
8.89%
Source of Health Information
HEALTH CENTER
TELEVISION
PHONE
NEWSPAPER/ FLIERS/ POSTERS
RADIO
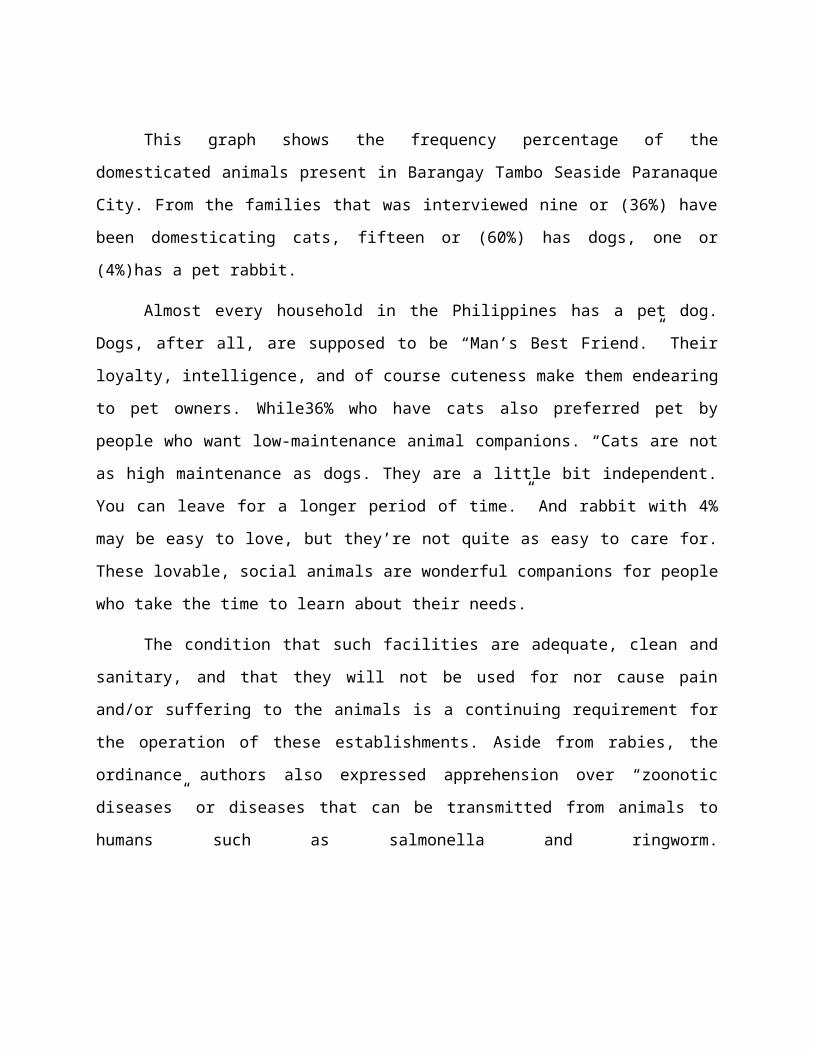
INTERPRETATION, ANALYSIS AND JUSTIFICATION
The table shows the source of health information of the family surveyed at
Tambo seaside Paranaque. In a total of 45 families it shows health centers has the
highest percentage of forty six point sixty seven percent (46.67%) as the source of
health information, followed by Television with a percentage of thirty three point thirty
three percent (33.33%), Newspapers, fliers and posters with a percentage of eleven
point eleven percent (11.11%), Radio with eight point eight nine percent (8.89%) and
Phone with Zero percent (0%).
Community-based primary care information systems are one of the building
blocks for national health information systems.These structures lead to a huge amount
of “information work” in the transformation of health information at the community level.
Information about health prevention is very important. Sources like health center
personnel, television, radio, phones, and newspapers/fliers/posters can be used as a
means of receiving health information.
Base on the survey, health center has the highest percentage which is very
useful to the people of Tambo seaside community. Health center personnel usually
conduct a house-to- house visit for children’s immunization depending on the effect of
the vaccine. In some cases they also go to schools and conduct health teaching for
additional information regarding whatever present health issue is affected.
COMMUNITY HEALTH
PROBLEMS

Teaching plan
TEACHING PLAN FOR ENVIRONMENTAL SANITATION
LECTURER : BSN 2A (GROUP 1)
SUBJECT : COMMUNITY HEALTH NURSING
TOPIC : Proper Garbage Disposal
VENUE : Tambo Seaside Paranaque
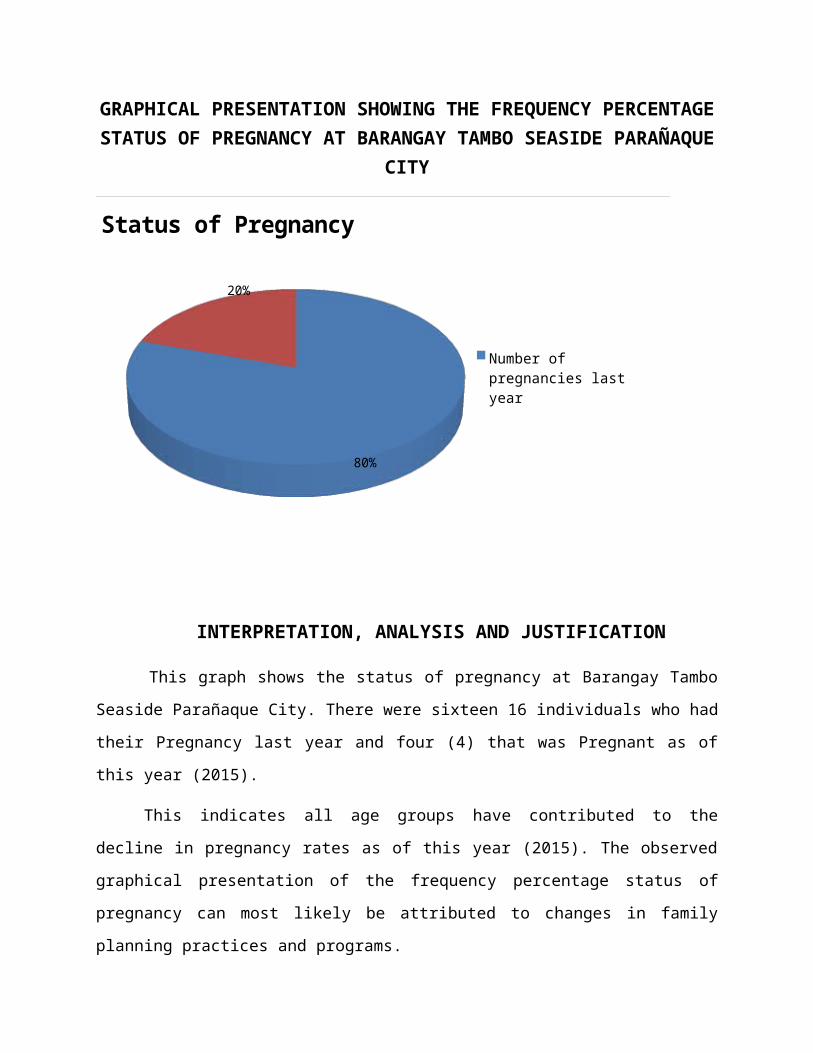
PARTICIPANTS : Interviewed families in Tambo seaside
I. GOAL : The people in the community will be able to gain knowledge regarding the proper waste disposal
GENERAL OBJECTIVES : To develop awareness and importance of proper waste
disposal, segregation and management.
II. CONTENT
1. What is environmental sanitation?
These are activities aimed at improving or maintaining the standard of
basic environmental conditions affecting the well-being of people.
These conditions include:
clean and safe water supply,
clean and safe ambient air,
efficient and safe animal, human, and industrial waste disposal,
protection of food from biological and chemical contaminants,
Adequate housing in clean and safe surroundings also called
environmental hygiene.
2. Importance of Proper Garbage Disposal
Proper waste disposal is critical due to the fact that certain types of wastes
can be hazardous and can contaminate the environment if not handled properly.
These types of waste also have the potential to cause disease or get into water
supplies. Properly disposing of waste is not just a personal responsibility; some
kinds of waste, usually hazardous, must be properly disposed of. Toxic waste
can seep into the ground and contaminate our water supplies, and sometimes
cause widespread disease. Even non-toxic waste causes pollution that
contributes to global warming and a general negative impact on the public health.
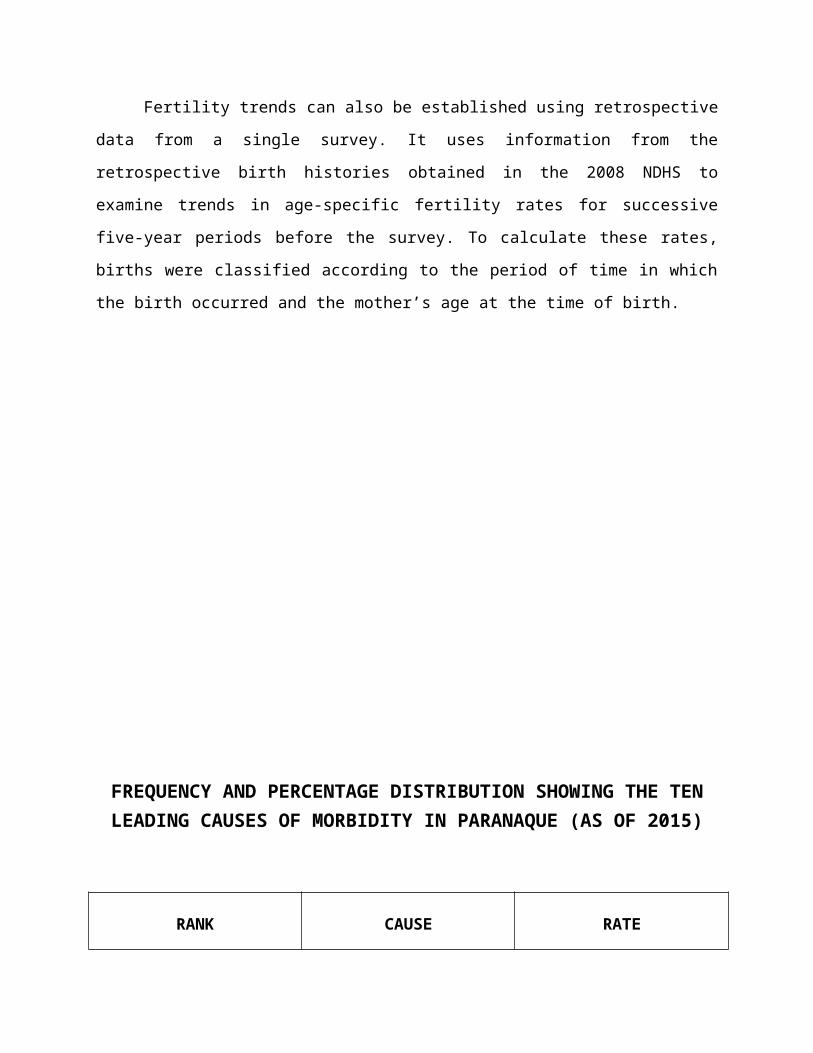
3. What are the effects of poor Domestic Waste management?
Solid wastes, when improperly disposed of can be an environmental
hazard in that the surrounding environments as well as the fish are
affected. Poor solid waste has also led to the death of animals (especially
domestic animals).
These wastes when improperly dumped into the atmosphere can lead to
the destruction of the ozone layer and may cause diseases such as
cancer.
It also affects drainage. This may cause flooding.
Poor Domestic Waste management also displays an ugly scenario of the
environment. This can affect the tourism industry, as the tourist may not
get attracted to visit the country.
It has also led to the spread of diseases in such a way that when wastes
like broken bottles and these are dumped anywhere, they collect water in
them (when it rains) and this may become a breeding ground for
mosquitoes.
Wastes like human stool cause diseases when poorly dumped, as the flies
will carry the germ from the stool.
It can also lead to human injury. For example, when a person is walking
and steps on the broken bottles or nails or even pins (shape objects), he
can get injured which may lead to bleeding. (These waste objects are
infected with germs)
4. Diseases related to Improper Waste Disposal
Diarrhea
Skin diseases
Cholera
Dengue fever
Hepatitis
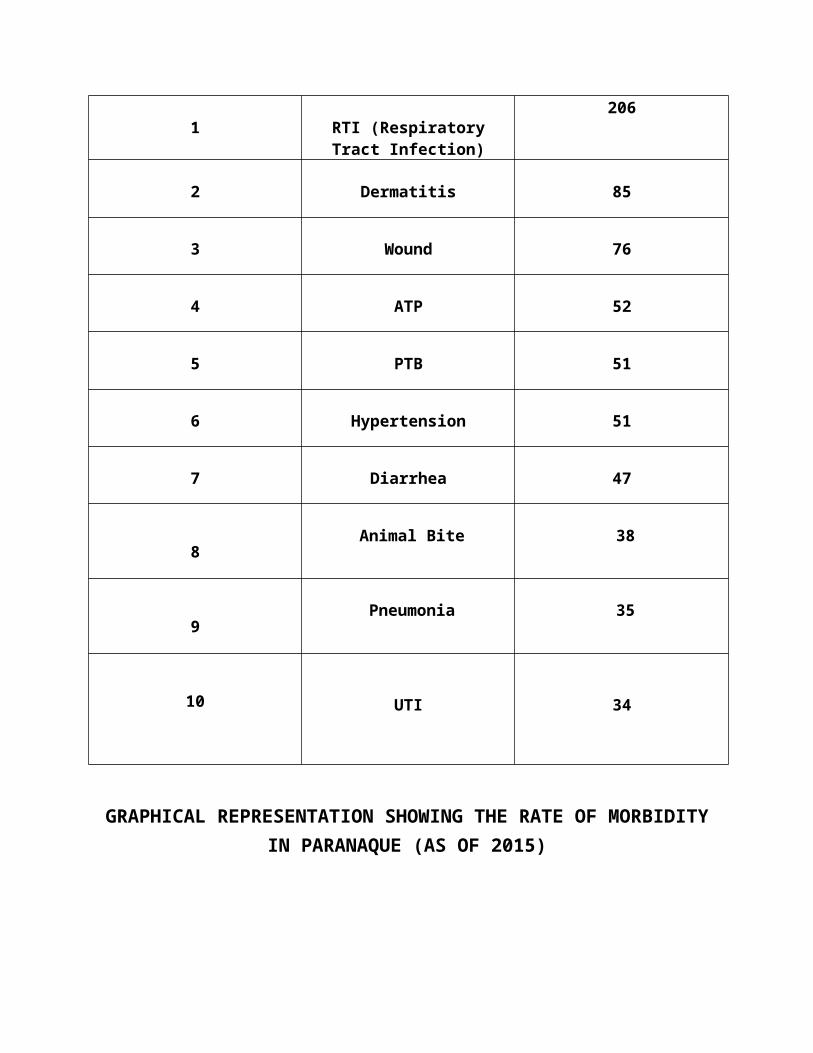
Tuberculosis
5. Different Ways of Proper Garbage Disposal
Waste can be segregated as
1. Biodegradable and
2. Non-biodegradable
Biodegradable waste includes organic waste, e.g. kitchen waste, vegetables,
fruits, flowers, leaves from the garden, and paper.
Non-biodegradable waste can be further segregated into:
a) Recyclable waste – plastics, paper, glass, metal, etc.
b) Toxic waste – old medicines, paints, chemicals, bulbs, spray cans,
fertilizer and pesticide containers, batteries, shoe polish.
c) Soiled – hospital waste such as cloth soiled with blood and other body
fluids.
Toxic and soiled waste must be disposed of with utmost care.
Dispose in the right place
Always cover the garbage can
Be aware of the time the garbage collector will get the garbage
All garbage must be ready for pick up in the right place and at the right
time.
Collect reusable materials as much as possible.
IV. METHODOLOGY : Lecture and Discussion
V. TIME FRAME : 20 minutes
VI. RESOURCES : Visual Aids, Brochures / Leaflets
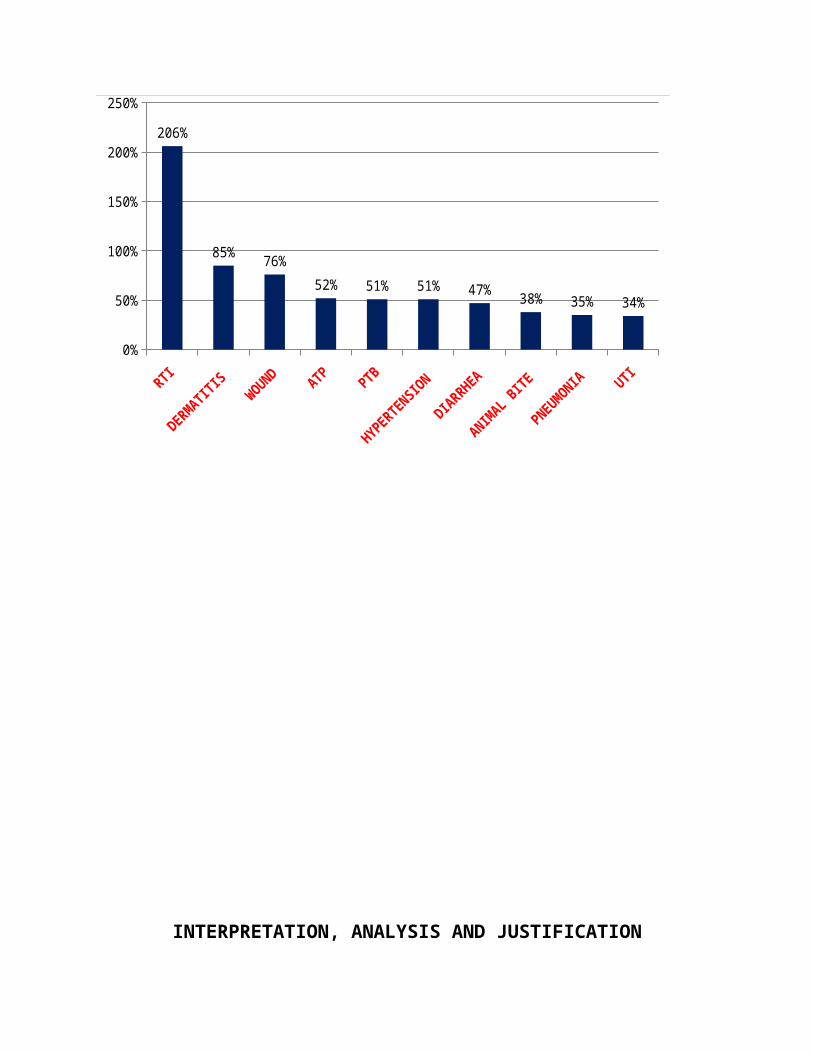
vii. EVALUATION TOOL : Survey Questionnaires
VIII. REFERENCES : http://www.doh-bin.com/Managing-waste.html

TEACHING PLAN FOR COUGH AND COLDS PREVENTION AND MANAGEMENT
LECTURER : BSN 2A (GROUP 1)
SUBJECT : Community Health Nursing
TOPIC : COUGH AND COLD AS A RELATED HEALTH PROBLEM
VENUE : Barangay Tambo, Seaside Paranaque
PARTICIPANTS : Families Interviewed
I. GOAL : The participants would be able to know the importance of cough and
cold prevention and management
II. OBJECTIVES
1. After health teaching, the participants will have enough knowledge on the
causes of cough and colds.
2. After health teaching, the participants will have enough knowledge on how
cough and colds can be prevented.
3. The residents of Tambo seaside will be able to manage cough and colds
in the community.
III. CONTENT
1. Definition of cough?
A cough is a healthy reflex that helps keep the airways in the throat and chest
free from mucus, dust, and dirt. Coughs can be associated with colds, bacteria, or
other viral illnesses such as influenza (the flu), which causes swelling of the voice
box and windpipe. Coughs that don't go away may be a sign of more worrisome
diseases, such as asthma and pneumonia, and even heart problems.
2. What are causes of cough and colds?
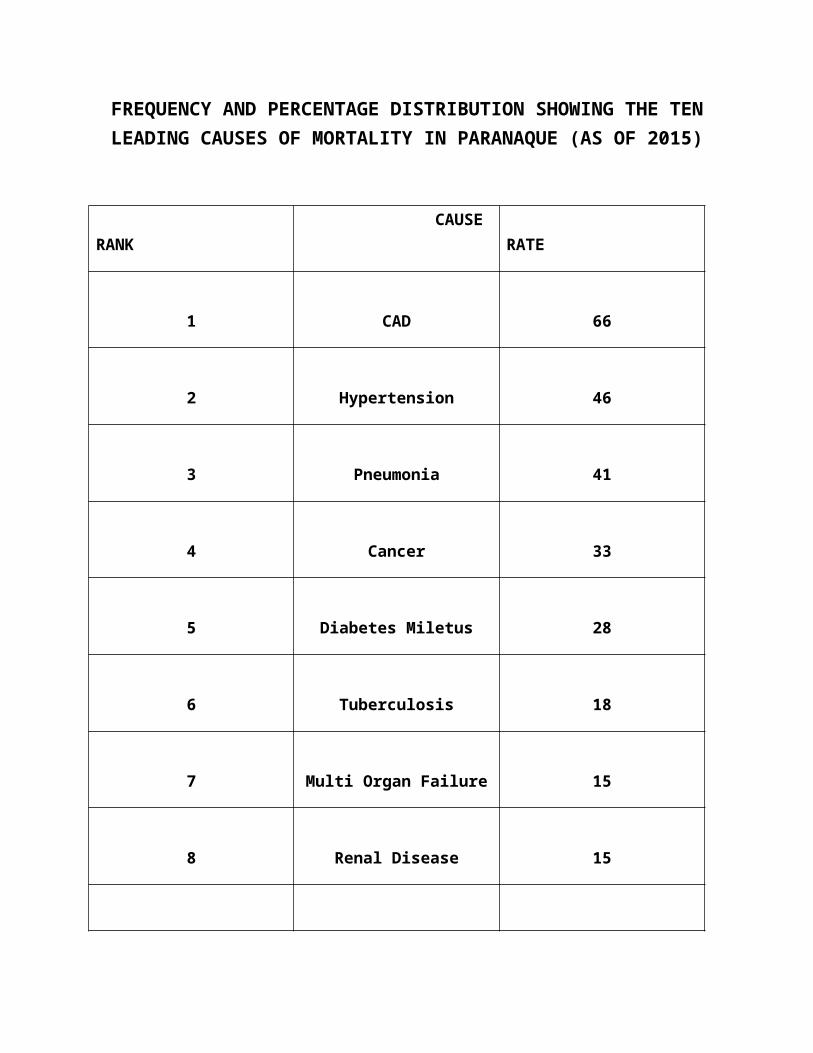
A cold virus enters your body through your mouth, eyes or nose. The virus
can spread through droplets in the air when someone who is sick coughs, sneezes
or talks. But it also spreads by hand-to-hand contact with someone who has a cold
or by sharing contaminated objects, such as utensils, towels, toys or telephones. If
you touch your eyes, nose or mouth after such contact or exposure, you're likely to
catch a cold.
3. Are colds and cough contagious?
It can be. Colds and the flu can be spread through droplets released into the
air when someone coughs or sneezes, so coughing can spread certain illnesses.
Teach your child to cough into his elbow or shoulder, rather than coughing into his
hand or a tissue (and you should do the same). This way the virus won't get on his
hands, where he can spread it to every object he touches.
4. How can you manage cough and colds?
Get plenty of rest and drink plenty of fluids.
Try to breathe moist air. Use a humidifier or take a steamy shower.
Consume warm fluids (soup or tea) to provide relief for a stuffy nose and
to loosen phlegm.
Eat a well-balanced diet. If you cannot, ensure you are getting enough
nutrients by taking a daily multivitamin.
Avoid dairy products, as they can thicken phlegm.
Avoid alcohol, as it impairs your body’s immune system.
5. When should I call my child's healthcare provider?
CONTACT YOUR DOCTOR IF YOU EXPERIENCE ANY OF THE FOLLOWING:
High fever
Ear pain
Sinus-type headache
Unusually severe cold symptoms
Cough that gets worse while other cold symptoms improve
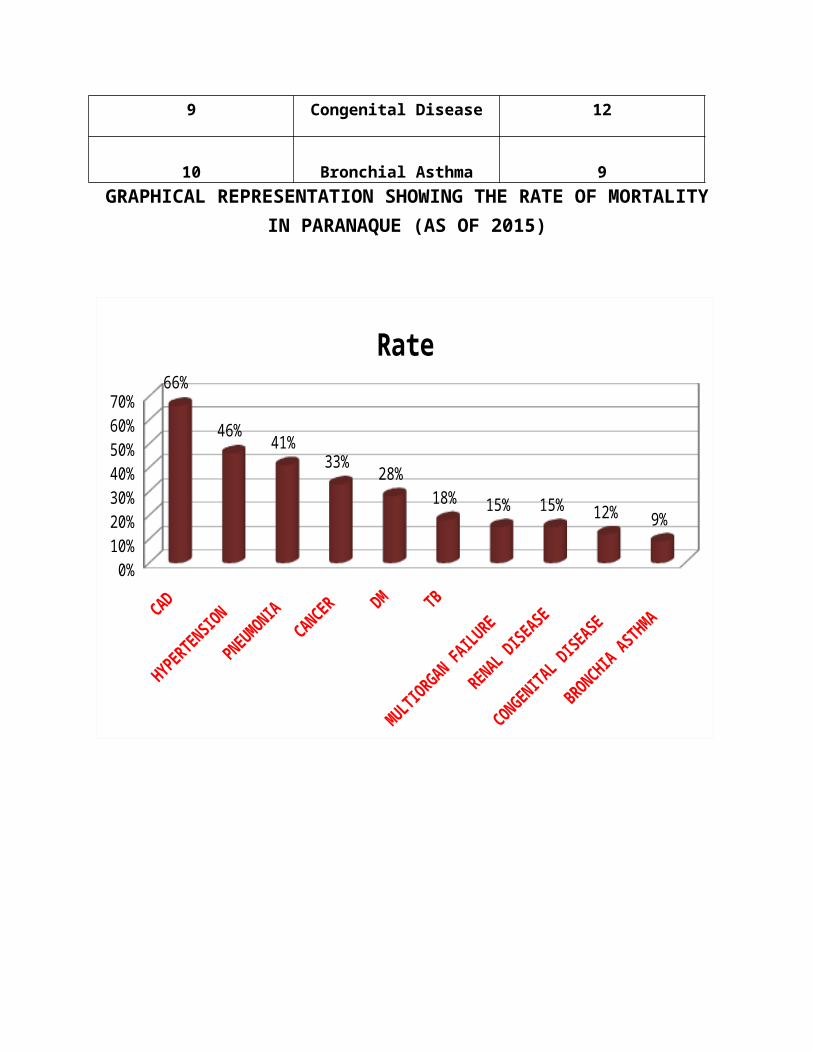
Flare up of any chronic lung problem, such as asthma
Coughing up blood
Wheezes when exhales.
IV. METHODOLOGY : Lecture/Discussion
V. TIME FRAME : 20 minutes
VI. RESOURCES : Brochure
VII. EVALUATION : Survey Questionnaires form
VIII. REFERENCES : http://patient.info/health/coughs-and-colds-in-children
TEACHING PLAN FOR PROPER MANAGEMENT OF SORE EYES
LECTURER : BSN 2A (GROUP 1)
SUBJECT : Community Health Nursing
TOPIC : SORE EYES (PREVENTION AND MANAGEMENT)
VENUE : Tambo Seaside Paranaque
PARTICIPANTS : Families Interviewed
I. GOAL : Each family will be able to manage and prevent sore eyes in the
community.
OBJECTIVE :
The participants will be able to identify the symptoms of sore eyes.
The participants will understand the causes of sore eyes and how it can
spread.
The residents of Tambo seaside will be able to apply what they have
learned about proper management of Sore eyes.
II. CONTENT
1. What is Sore Eyes?
It is also known as conjunctivitis, sore eyes is manifested in redness
and inflammation of the membranes (conjunctiva) covering the whites of the
eyes and the membranes in the inner part of the eyelids. Incubation period of
time from exposure to onset of symptoms is usually 5-12 days.
2. What are the causes of Sore Eyes?
Virus infection (Adenoviruses)
Chemicals
Trauma
3. How can Sore eyes be transmitted?
Direct contact with hands contaminated with eye secretions of an
infected person
Touching eyes with hands, getting in contact with surfaces,
instruments, eye solutions, or make-ups contaminated with the
virus from an infected person
Entry of the virus through the eyes by swimming in poorly
chlorinated pools
4. What are the Signs and Symptoms of Sore eyes?
Begins in one eye and may later affect both eyes
Watery to pus-like discharge
Redness of the eye with pain and/or itching sensation
Eyelids that are stuck together upon waking up
In severe cases, pain of the eyes upon exposure to sunlight and
foreign-body solution
5. How can it be treated?
There is no specific treatment during the acute phase (1-2 weeks).
If eye discharge is profuse and pus- like or patient develops blurring
of vision or severe pain, consult with an ophthalmologist.
6. How can you prevent Sore eyes?
Wash hands frequently and thoroughly with soap and water.
Minimize hand-to-eye contact.
Use only own towels, eye drops, make-ups and applicators,
sunglasses, or eye glasses.
Wear eye/sunglasses on windy days to protect one’s eyes from
foreign particles.
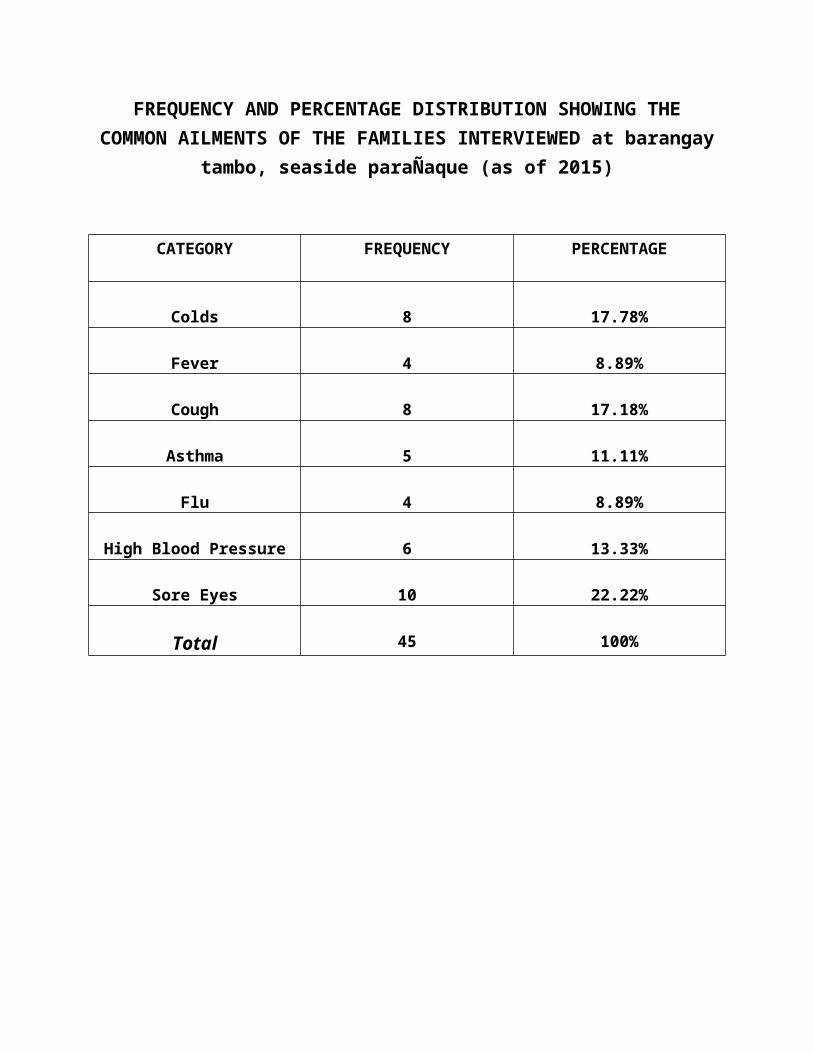
Avoid crowded places. Disinfect with dilute bleach solution
surfaces, doorknobs, counters, elevator buttons, and handrails.
Wash clothes, towels, pillow cases, and anything else which may
have come in contact with an infected person.
III. METHODOLOGY : Lecturing
IV. TIME FRAME : 20 minutes
V. RESOURCES : Visual Aids, Brochure
VI. EVALUATION TOOL : Survey Questionnaires Form
VII. REFRENCES : http://www.gmanetwork.com/lifestyle/healthandwellness/doh-issues-tips-to-prevent-sore-eyes
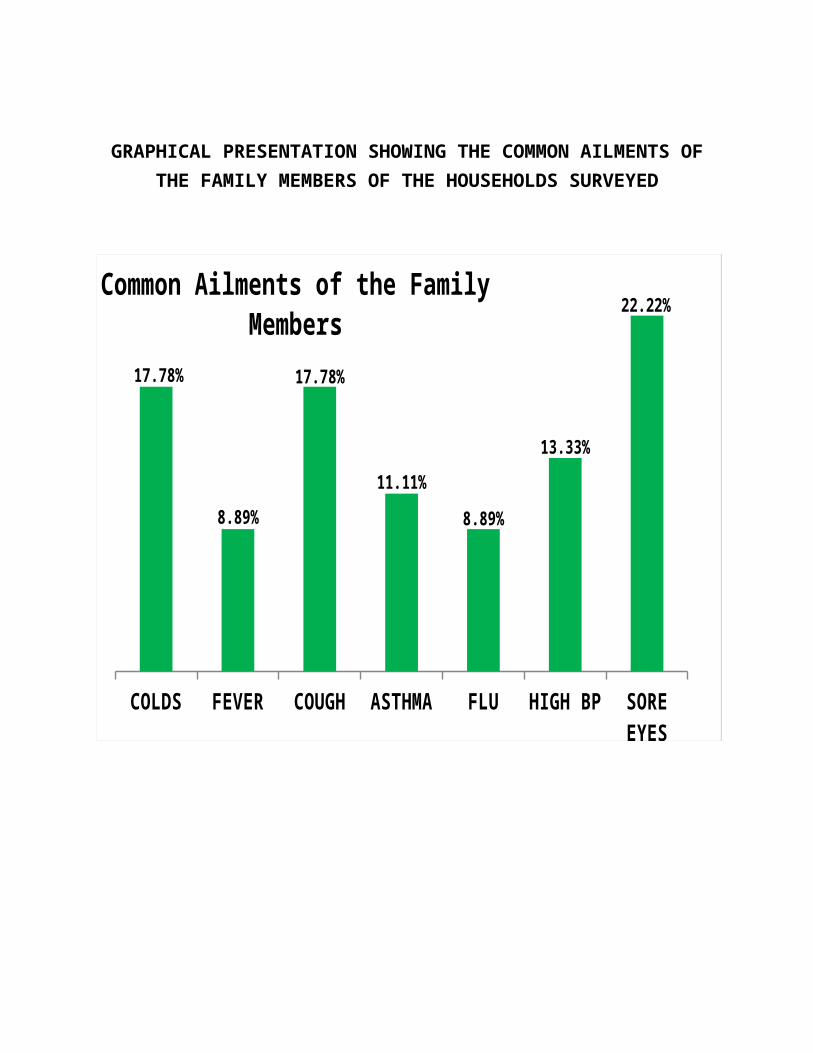
Session plan
(note DiFF. Filename)
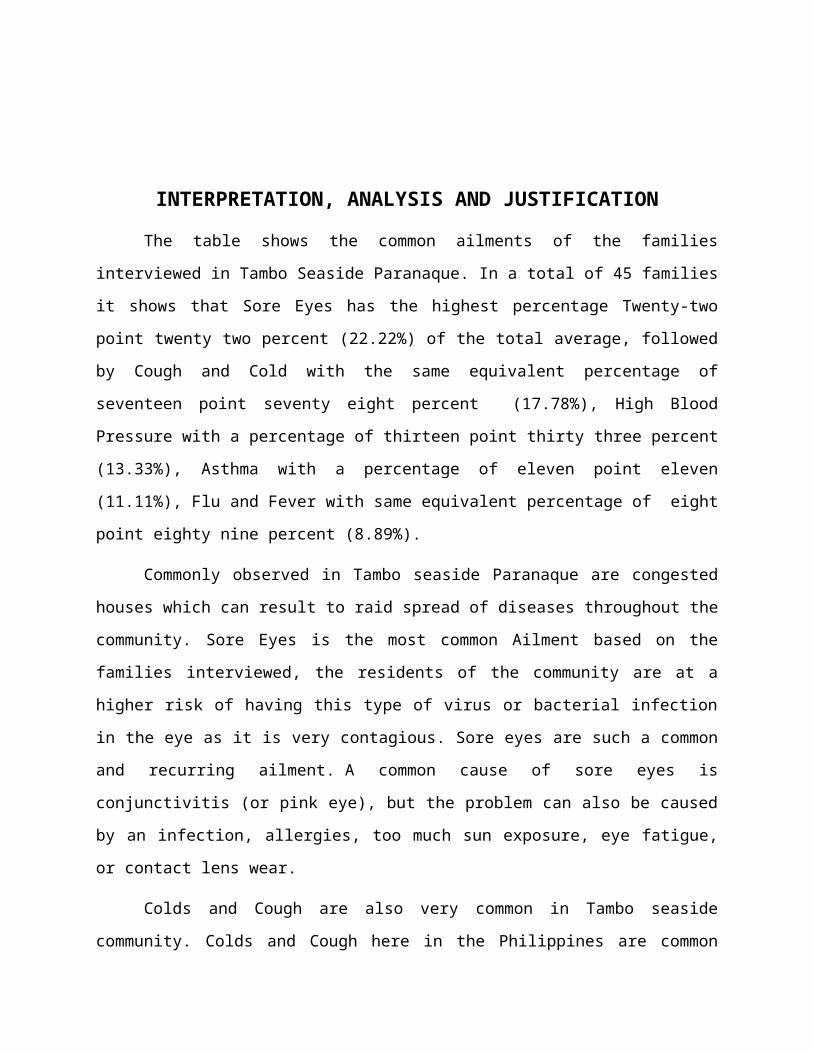
evaluation
Kalinisan ay Kailangan para sa maayos na Kalusugan
FREQUENCY DISTRIBUTION SHOWING the evaluation of the
families surveyed at BARANGAY TAMBO SEASIDE
PARAÑAQUE CITY

(AS OF 2015)
Title of seminar/ Activity : Health Teaching / Community Get
Together
Name of the Evaluator : Group 1
Inclusive Date : September 16, 2016
Please Evaluate the Seminar/ Activity you attended by encircling the number
corresponding to your rating feedback will serve as our bases for improving the
program. Rating shall be interpreted as:
5 - Excellent 4 - Very Good
4 - Good 2 - Fair 1 - Poor
I. TOPICS
5 4 3 2 1
(Excellent) (Very Good) ( Good ) ( Fair ) ( Poor )
1. Interesting 27 9 0 2 0
2. Informative and Complete
24 10 3 0 0
3. Clearly Discussed 24 12 1 0 0
4. Relevant / Applicable 19 9 8 1 0
5. Organized Discussed 22 10 5 1 0
TOTAL 116 50 17 4 0
II. Facilities and materials
5
(Excellent)
4
(Very Good)
3
( Good )
2
( Fair )
1
( Poor )
1. Cleanliness 23 5 2 2 0
2. Lights and Ventilation 14 13 6 0 0
3. Arrangement of Venue
25 11 1 0 0
4. Useful Materials / Kit 22 10 4 1 0
5. Availability of Equipment and Visual
20 14 3 0 0
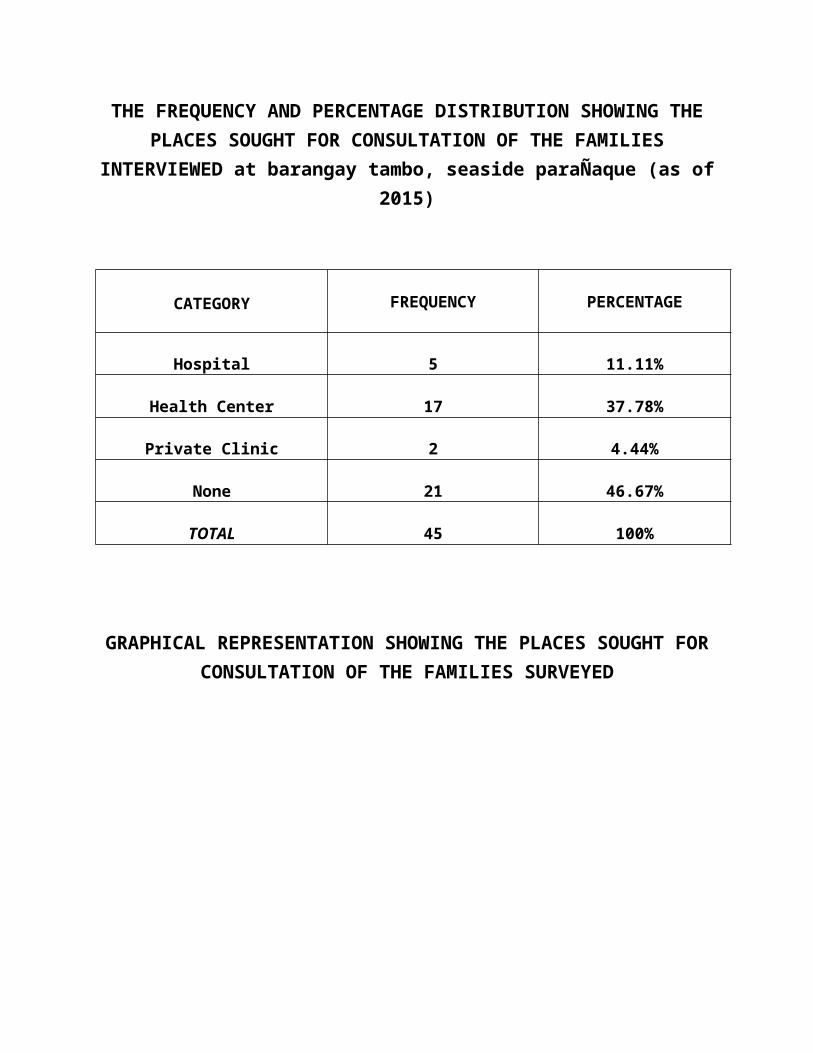
Aids
TOTAL 104 53 6 3 0
III. Speakers
5
(Excellent)
4
(Very Good)
3
( Good )
2
( Fair )
1
( Poor )
1.Mastery of Topic 27 14 1 1 0
2. Method / Style 22 11 4 0 0
3. Appearance and Confidence
27 8 2 0 0
4. Tactful and Responsive
20 10 6 1 0
5. Time Management 21 15 1 0 0
TOTAL 117 58 14 2 0