fall webinar october 30, 2013. open and hide your control panel join audio: choose “mic &...
TRANSCRIPT

2013 International Survey of Adult Skills
Fall WebinarOctober 30, 2013

Housekeeping
Open and hide your control panel
Join audio:• Choose “Mic & Speakers”
to use VoIP• Choose “Telephone” and
dial using the information provided
Submit questions and comments via the Questions panel
Your Participation
Agenda
Welcome: Sharon Bush, LFN President, Grand Victoria Foundation
LFN Update: Kim Scott, LFN Executive Director2014 LFN SymposiumNational Results and Equity Collaborative Attendance Awareness Month
New Member Spotlight: Joe Welsh, Administration Manager ,Community Impact
United Way of Allegheny County
Featured Presentation: 2013 International Survey of Adult SkillsEugene Owen, PIAAC National Project Manager, National Center for Education Statistics
Respondents:Gail Spangenberg, President & Founder, Council for Advancement of Adult LiteracyJeff Carter, Board Member, National Coalition for Literacy
Closing: Sharon

2014 LFN Symposium
Save the Date!February 17-18, 2014
The Symposium will be held once again in partnership with Literacy Powerline and the National Center for Family Literacy and will take place at the Renaissance Washington, DC Downtown Hotel, in the heart of Penn Quarter.
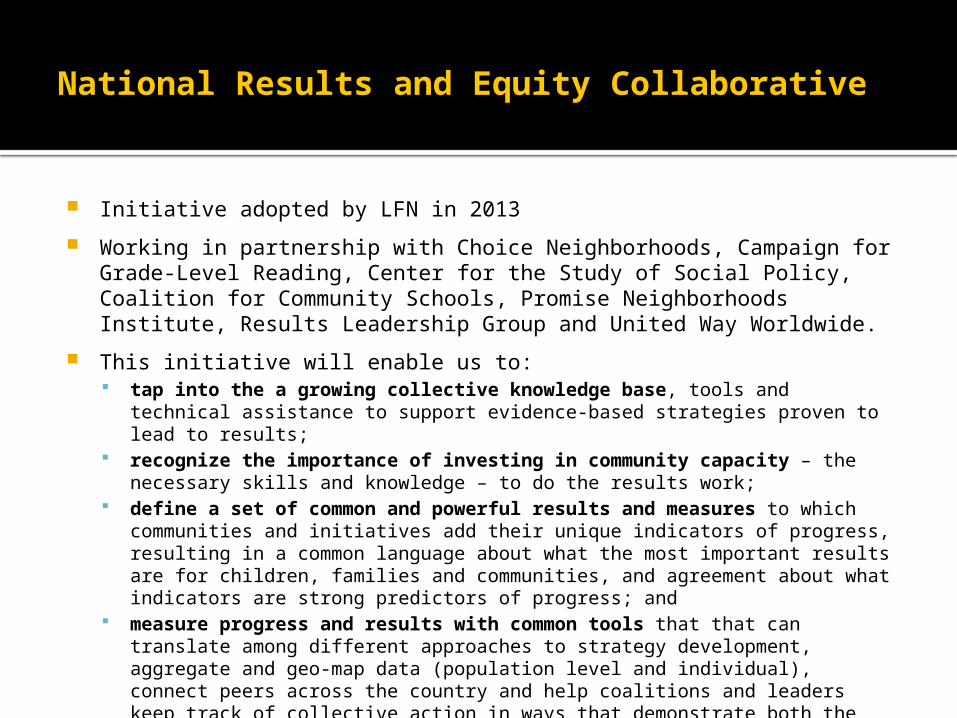
National Results and Equity Collaborative
Initiative adopted by LFN in 2013
Working in partnership with Choice Neighborhoods, Campaign for Grade-Level Reading, Center for the Study of Social Policy, Coalition for Community Schools, Promise Neighborhoods Institute, Results Leadership Group and United Way Worldwide.
This initiative will enable us to: tap into the a growing collective knowledge base, tools and technical
assistance to support evidence-based strategies proven to lead to results; recognize the importance of investing in community capacity – the
necessary skills and knowledge – to do the results work; define a set of common and powerful results and measures to which
communities and initiatives add their unique indicators of progress, resulting in a common language about what the most important results are for children, families and communities, and agreement about what indicators are strong predictors of progress; and
measure progress and results with common tools that that can translate among different approaches to strategy development, aggregate and geo-map data (population level and individual), connect peers across the country and help coalitions and leaders keep track of collective action in ways that demonstrate both the costs and benefits of improved results.

Attendance Awareness Month
Attendance Awareness Month Partnership Results
The Literacy Funders Network received a huge thank you for participating in Attendance Awareness Month as a national partner. This was the first time for this effort and the results exceeded everyone’s wildest dreams. Consider the numbers:
• 1,318 people from 49 states and the District of Columbia joined the Attendance Awareness listserv• 249 schools and communities from 42 states and the District of Columbia pinned events and activities on the Community Action Map• 155 news articles, blogs and commentary pieces appeared in media outlets in 28 states• At least four governors and 20 mayors issued proclamations• The Count Us In! toolkit was downloaded 13,200 times, and the banners and flyers, 14,700 times.• The parting message on Sept. 30 was sent to 189,000 Facebook and Twitter accounts at the same moment, courtesy of the folks who participated in our Thunderclap. The message was simple: #SchoolEveryDay = School Success!

Member Spotlight
Joe WelshAdministration Manager, Community Impact
United Way of Allegheny County
www.uwac.org

Roles:
Funder Implementer Intermediary Focuses:
Education Income Health Call to Action:
Give - Advocate - Volunteer

Allies for Children

Allegheny CountyEarly Literacy Team
Establish a common language & messagingLeverage existing resourcesProvide shared learning opportunities
• Best Practices, Networking & Collaboration
Create High-Level BrandingMeasure & Report Data

Contact Information
Joe WelshAdministration Manager, Community ImpactUnited Way of Allegheny County
Tel. (412) 456-6740 | [email protected]

Featured Presentation
Highlights from the Program for the International Assessment of Adult
Competencies (PIAAC), 2012
Eugene OwenPIAAC National Project ManagerNational Center for Education Statistics (NCES)Washington, DCOctober 30, 2013

What is PIAAC?
International large-scale assessment administered in 2011-12 in 23 countries
16- to 65-year-olds, non-institutionalized, residing in the country, irrespective of nationality, citizenship, or language status
Laptop computer or paper-and-pencil: In the U.S., 80% took the computer tests and 15% took the paper-
and-pencil tests. Assessment subjects:
Literacy, Numeracy, and Problem Solving in Technology-Rich Environments
Conducted in English in the U.S.: Background survey in English or Spanish. About 4% could not
complete the questionnaire because of language difficulties or learning or mental disabilities, and 1% could not complete it for other reasons.
13

14
Participating countries
14
2012 2015
AustraliaAustriaBelgiumCanadaCyprusCzech RepublicDenmarkEstoniaFinlandFranceGermanyIreland
ItalyJapan Korea, Rep ofNetherlandsNorwayPolandSlovak RepublicSpainSwedenUnited Kingdom United States
ChileGreece IndonesiaIsraelLithuaniaNew ZealandSingaporeSloveniaTurkey

What PIAAC reports
Average Scores: Reported on a scale of 0-500 for all domains.
Proficiency Levels: Reported as the percentages of adults scoring at six performance levels in literacy andnumeracy and at four performance levels in problem solving in technology-rich environments.
15

Literacy proficiency levels
Locate single piece of information in familiar texts.
Read relatively short digital, print or mixed texts to locate single text.
Make matches between text and information that may require low level para-phrasing and drawing low-level inferences.
Identify, interpret, or evaluate one or more pieces of information and often require varying levels of inference.
Perform multiple-step operations to integrate, interpret, or synthesize information from complex texts, and may require complex inferences.
Integrate information across multiple, dense texts; construct syntheses, ideas or points of view; or evaluate evidence based arguments.
Below Level 1
Level 1Level 2
Level 3
Level 4
Level 5
16

Literacy example item
Below Level 1: Election results
The stimulus is a report of the results of a union election. It consists of several brief paragraphs and a simple table identifying the three candidates and the number of votes they received. The test taker is asked to identify which candidate received the fewest votes. To do this, the test taker must simply compare the number of votes that each candidate received. The word “votes” appears only in the question and in the table. Therefore, the task consists of recognizing this direct relationship between the two to infer the answer.
17

Literacy example item
Level 4: Library search
The stimulus displays the results of a bibliographic search from a simulated library website. The test taker is asked to identify a book suggesting that the claims made both for and against genetically modified foods are unreliable. To do this, the test taker needs to read the title and description of each book included in the search results. Many pieces of distracting information are present. The necessary information must be inferred from the statement that the author “describes how both sides in this hotly contested debate have manufactured propaganda, tried to dupe the public and . . . [text ends].”
18

19
U.S. PIAAC Findings

U.S. average literacy score (270) lower than the international average (273)
Lower than in 12 countries:Japan, Finland, Netherlands, Australia, Sweden, Norway, Estonia, Flanders-Belgium, Czech Republic, Slovak Republic, Canada, Republic of Korea
Not significantly different than in 5 countries:England and Northern Ireland- U.K., Denmark, Germany, Austria, Cyprus
Higher than in 5 countries:Poland, Ireland, France, Spain, Italy
20

21
Below level 1 range: 0-175Level 1 range: 176-225Level 2 range: 226-275Level 3 range: 276-375Level 4/5 range: 376-500
Median
Seven countries had higher percentages of adults reaching the highest proficiency level (4/5) in literacy
Median
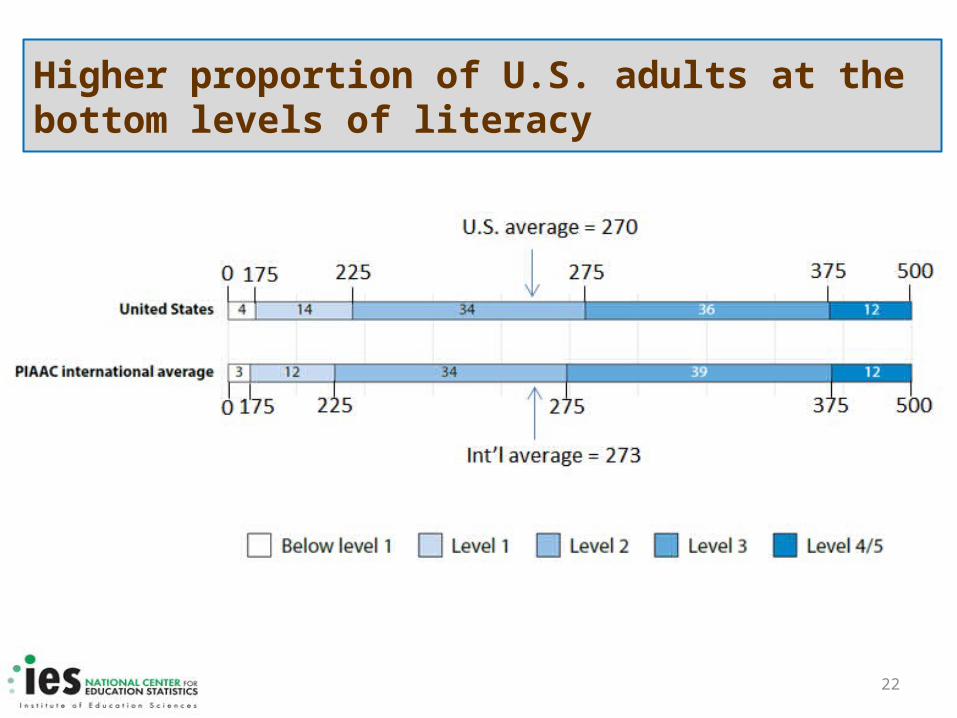
Higher proportion of U.S. adults at the bottom levels of literacy
22

U.S. average numeracy score (253) lower than the international average (269)
Lower than in 18 countries:Japan, Finland, Flanders-Belgium, Netherlands, Sweden, Norway, Denmark, Slovak Republic, Czech Republic, Austria, Estonia, Germany, Australia, Canada,Cyprus, Republic of Korea, England and Northern Ireland- U.K., Poland
Not significantly different than in 2 countries:Ireland, France
Higher than in 2 countries:Italy, Spain
23

Fifteen countries had higher percentages of adults reaching the highest proficiency level (4/5) in numeracy
24
Below level 1 range: 0-175Level 1 range: 176-225Level 2 range: 226-275Level 3 range: 276-375Level 4/5 range: 376-500
Median

25
Higher proportion of U.S. adults at the bottom levels of numeracy

U.S. average problem solving in technology-rich environments score (277) lower than the international average (283)Lower than in 14 countries:Japan, Finland, Australia, Sweden, Norway, Netherlands, Austria, Denmark, Czech Republic, Republic of Korea, Germany, Canada, Slovak Republic, Flanders-Belgium
Not significantly different than in 4 countries:England and Northern Ireland- U.K., Estonia, Ireland, Poland
26

Eight countries had higher percentages reaching the highest proficiency level (3) in problem solving in technology-rich environments
27
Below level 1 range: 0-240Level 1 range: 241-290Level 2 range: 291-340Level 3 range: 341-500
Median

28
Higher proportion of U.S. adults at the bottom levels of problem solving in technology-rich environments

Only oldest U.S. adults outperformed the international average in literacy
29*p < .05. U.S. average score is significantly different from PIAAC international average.
55-6545-5435-4425-3416-24
55-6545-5435-4425-3416-24
PIAA
C in
tern
ation
al a
vera
ge
0 50 100 150 200 250 300
263*266
273*275*
272*
255268
279284
279

Least educated adults below the international average in literacy
30*p < .05. U.S. average score is significantly different from PIAAC international average.
Graduate or professional degree
Bachelor's degree
Associate's degree
High school credential
Below high school
Graduate or professional degree
Bachelor's degree
Associate's degree
High school credential
Below high school
Unite
d St
ates
PIAA
C in
tern
ation
al a
vera
ge
0 50 100 150 200 250 300 350
310
298
283
262*
230*
307
298
285
271
246

Employed adults in the U.S. had lower average literacy scores than their peers internationally
31*p < .05. U.S. average score is significantly different from PIAAC international average.
Employed
Unemployed
Out of the labor force
Employed
Unemployed
Out of the labor force
Unite
d St
ates
PIAA
C in
tern
ation
al a
vera
ge
0 50 100 150 200 250 300
274*
260
257
277
265
261

U.S. White adults had higher average literacy scores than either Black or Hispanic adults
32*p < .05. Average score is significantly different from White average.
White
Black
Hispanic
Other
0 50 100 150 200 250 300
283
244*
233*
272*

33
U.S. gaps in literacy scores larger than international average by parental education and nativity status

34
In literacy, U.S. gaps larger by educational attainment and skill level of job, but similar to international average by income and employment status

U.S. gaps in literacy scores similar to international average by gender, smaller by age, and larger by health status
35

U.S. average literacy score in 2012 not significantly different from 2003, but lower than in 1994
36*p < .05. Average score is significantly different from PIAAC.
1994 2003 2012245
250
255
260
265
270
275
280
285
IALS:273*
ALL:268
PIAAC:270

U.S. average numeracy score in 2012 lower than in 2003
37*p < .05. Average score is significantly different from PIAAC.
2003 2012235
240
245
250
255
260
265
270
275
ALL:262*
PIAAC:253

U.S. PIAAC Findings Summary:
38
U.S. PIAAC Findings Summary: Lower overall scores than international average in all
subjects Higher percentages of low performers than
internationally Larger gaps between less advantaged and more
advantaged peers in literacy and numeracy, but not in problem solving in technology-rich environments
Relatively lower performance of young adults and those with high school education or less
Relatively higher performance of older adults in literacy and problem solving in technology-rich environments

Release ScheduleReleased in October 2013 OECD PIAAC International Report (October 8th 2013) PIAAC International Technical Report: an authored report by OECD (October
8th 2013) NCES PIAAC National Report: “First Look” Report (October 18th 2013)
Will be Released between November 2013 to February 2014 OECD authored US country report (November 12, 2013) NCES PIAAC Web Portal Data Explorer (NCES) US National Technical Report (NCES) Public use data file (NCES) Restricted use data file (NCES) OECD Education and Skills Online (E & S Online)
39

Time for the United States to Reskill? What the Survey of Adult Skills Says (An OECD authored report)
Funded by the Office of Vocational and Adult Education, U.S. Department of Education
Report will: Interpret the U.S. main findings Offer a detailed profile of low-skilled adults in the U.S. Identify policy implications and offer broad policy
recommendations for the U.S. Be released on November 12th in Washington, D.C.
More detailed information regarding this event will be posted at www.piaacgateway.com
40

NCES PIAAC Web Portal Content
Literacy, numeracy, and problem-solving in technology-rich environments proficiency levels by: Country of birth Informal training Health status
Profile of the employed by: age, gender, whether they are born in the United States, education, industry of employment, occupation, and earnings
Profile of the unemployed by: age, gender, whether they are born in the United States, and education
41

NCES PIAAC Data Explorer
Interactive online data tool that allows users to produce customized PIAAC reports
Data displayed and exported in a variety of formats, including: Tables Charts Maps
42

Education and Skills (E&S)Online
What Is Education and Skills
Online
Uses and Benefits
Education and Skills
Online Components

What is Education & Skills Online
A joint initiative of the OECD and the European Union
An assessment tool designed to provide individual level results linked to PIAAC
Measures both cognitive and non-cognitive skills Downloadable on demand over the internet and
includes technical support Available in multiple languages/versions In the US it is available both in English and Spanish
44

Education & Skills Online components
Background Questionnaire Cognitive Items:
Literacy Numeracy Problem-solving in Technology rich environment (optional) Reading Components (optional)
Optional Non-Cognitive Module Reporting Scores:
Proficiency levels Descriptive reports of strengths and weaknesses in the skill areas assessed Summary information for each of the non-cognitive areas Comparative information for both the cognitive and non-cognitive areas
45

Uses and benefits of Education & Skills Online
Appropriate for use in both educational and workplace settings
Can be used to evaluate classes, programs or any group of respondents
Organizations will have access to their database for further analyses
Tests cover a wide range of skills and domains Individuals and organizations have flexibility to determine
which skills to assess
46

47

For more information
Contact:Eugene Owen
NCES202-502-7422
PIAACPIAAC at NCES:
http://nces.ed.gov/surveys/piaac/
http://piaacgateway.com/
48

Respondents
Gail Spangenberg President & Founder Council for Advancement of Adult [email protected]
www.caalusa.org
Jeff Carter Board MemberNational Coalition for [email protected]
http://literacypolicy.org/

Closing: Sharon Bush
Thank you for attending!Any further questions/comments
please contact Kim Scott
Phone: 315.857.6960Email: [email protected]
Website: funders.literacypowerline.com