fall risk assessment and conditioning program sd/fallrisk_crm.pdf · fall risk assessment and...
TRANSCRIPT
FALL RISKASSESSMENT AND
CONDITIONINGPROGRAM
(#945-340)DESIGNED TO REDUCE THE INCIDENCE OF FALLS AMONG OLDER ADULTS
BIODEX MEDICAL SYSTEMS
“The Clinical Advantage” ™
• Determine if patients are at risk to fall • Identify the factors that put them at risk
• Modify the risk factors• Improve mobility
• Maintain independence
1-800-224-6339In New York and Int’l, Call 631-924-9000
www.biodex.comBIODEX
Consistent with
American Geriatric Society
clinical practice guidelines for
prevention of falls in older adults.
FN: 04-458 11/04

FALL RISK ASSESSMENT &CONDITIONING PROGRAM
table of contents
IMPLEMENTATION ..............................................................................................................................................1
THE PROTOCOL ..................................................................................................................................................2
SAMPLE REPORTS ...............................................................................................................................................3
SUPPORTING REFERENCES ..............................................................................................................................4
MARKETING SUPPORT MATERIALS ................................................................................................................5
© BIODEX MEDICAL SYSTEMS, INC.
Fall RiskAssessment &ConditioningProgram Manual
1) Implementation
FN: 03-013


ENTRY INTO PROGRAM
The need and demand for structured objective fall prevention programs is significant. Patients may either enter on their own in thecase of private pay, or through a doctor’s referral. In either case there must be public awareness to the existence of the program.
A doctor referral could be based on increase risk due to age, history, medication changes, muscle weakness, degenerative joint dis-ease, post arthroplasty, osteoporosis or on the basis of a Balance screening. Appropriate ICD-9 codes are described later.
REFERRALS:
The target market for the fall prevention program is the non-symptomatic older active adult that may or may not have experienceda fall, The program is not intended for symptomatic multiple fallers.
• Various strategies can be used to create the public awarenessAdvertising in local newspapersRadio spotsPlacing educational pamphlets in referring physicians officeHolding an open houseParticipating in a health fairsCooperative marketing and services with a health club
The smaller tri-fold pamphlet is intended for the patient. There is space on the back panel for the clinic to place either a sticker orstamp noting their facility. The larger brochure provides scientific and clinical description of the program. These two brochuresalong with the protocol and an introduction letter are excellent marketing tools to the referring physicians.
The advantage to a physician referral is the increased likely-hood for insurance reimbursement. However, the possibility for privatepay is equally strong, particularly in areas where there is a large population of "Gold Card" older active adults.
VISITS
• Initial visit: Self-assessment can be done in waiting room. The physical assessment portion usually requires less than an hour of clini-cal time. The initial visit can be billed as 97001 Initial evaluation.
Submit the Fall Prevention program Assessment of Modifiable Risk Factors report along with copies of the Isokinetic test, BalanceTest and Gait Summary and the appropriate initial evaluation sample letter and a copy of the intervention plan if intervention is nec-essary. Medicare has traditionally been paying 80% of the initial evaluation.(Approximately $60)
• If intervention is necessary then visits 2-7 are billed under:97110 Therapeutic, one or more areas (strength, endurance, flexibility ROM) each 15 minutes –
can be billed in multiple units.97530 Therapeutic activities, direct one on one, each 15 minutes97116 Gait Training, each 15 minutes 97112 Neuromuscular reeducation, each 15 minutes97535 Self care/home management training, each 15 minutes
• Visit 8: Re-evaluation. Submit as 97750 Physical performance test with written report. Submit the Fall Prevention program Assessment of Modifiable Risk Factors report along with copies of the Isokinetic test,Balance Test and Gait Summary and the appropriate re-evaluation letter.
Again reimbursement is approximately $60.
© BIODEX MEDICAL SYSTEMS, INC. 1-1
IMPLEMENTATION referrals, visits & reimbursement
1-2 REFERRALS, VISITS & REIMBURSEMENT
At this point, the patient may decide to enroll in a continuing exercise program on their own (private pay); or the doctor may referthem back into the program or for further advanced medical testing as in the case of a suspected problem beyond musculoskeletal.
• In summary: Visits 1 & 8, Evaluations: $120Visits 2-7: (6 x $50): $300Total per patient: $420 for 4 weeks
• Private pay: Charge $150 for the initial evaluation, interpretation of results and exercise prescription.Charge $40 per half-hour for personal therapy, and/or cognitive training or $40 per hour for group exercise.Patient has option to take exercise prescription to a health club.
• Tips: Billing: Never charge private pay less than Medicare. Medicare expects better pricing forthe increased volume of patients.
Scheduling: Set this program up for Tuesday and Thursday when caseloads are usually lighter than Monday,Wednesday, and Friday.
Follow Up: A follow-up evaluation is recommended every six months or following any change in physical health, activitystatus, or medications.
REIMBURSEMENT
This information is intended to be a guideline. It is based on national feedback. Provider business managers should adjust to bettermatch customary local billing and reimbursement needs.
• When accompanied by a physician referral and ICD-9 code related to:728.9 Muscle weakness780.79 Leg weakness715.0(x) Degenerative joint disease715.2 Osteoarthritis as a secondary condition719.9(x) Difficulty in walking719.4(x) Pain in joint719.5(x) Stiffness in joint718.8(x) Instability in joint
(x) = modifier
• The following CPT codes can be applied. 97110 Therapeutic activities one or more areas (strength, endurance, flexibility, ROM) each 15 minutes97112 Neuromuscular reeducation, each 15 minutes97116 Gait Training, each 15 minutes97530 Functional activities, one area, each 15 minutes97535 Self care/home management training, each 15 minutes97750 Physical performance test and measurement with written report,each 15 minutes
Generally, Medicare is allowing up to (4) CPT codes per patient visit. Medicare has been paying 80% for each CPT code. In theone-hour time, clinics are receiving approximately $50-$70 per patient.

© BIODEX MEDICAL SYSTEMS, INC. 1-3
Biodex Medical Systems, Inc.20 Ramsay Road, Shirley, New York 11967-0702
Tel: (631) 924-9000, (800) 224-6339
BIODEX
Fax Lines: Corporate Office: (631) 924-8355 Radiology Sales: (631) 924-9241 Physical Medicine Sales: (631) 924-9338
International Sales: (631) 924-9620 Purchasing Department: (631) 924-0814
Email: [email protected] www.biodex.com
SAMPLE FINANCIAL MODEL
GAIT TRAINING
Patient Caseload Average # of new patients per week requiring gait training* 3Number of weeks per year x 52
Total number of new patients per year = 156 (A)
Gait Training Exercise Revenues GeneratedAverage # of treatment sessions per week 2Average # of weeks to complete rehabilitation x 8
Total number of treatment sessions per patient = 16 (B)
Total # of treatment sessions per year (AxB) 2,496 (C)
Average reimbursement** for Gait Training (CPT Code: 97116) $20.83Average co-pay for therapy visit + $10.00
Total average receivables for therapy visit = $30.83 (D)
Total annual Gait Training Revenue (CxD) $76,952
*Adding a Fall Risk Assessment and Conditioning Program to your practice will dramatically increase the volume of new patients.
**Reimbursement based on Medicare schedule.


Fall RiskAssessment &ConditioningProgram Manual
2) The Protocol

© BIODEX MEDICAL SYSTEMS, INC.
FALL RISK ASSESSMENT &CONDITIONING PROTOCOL
Overview ...................................................................................................................................................................................2-1VisitsReimbursementCompendium
Self Assessment ........................................................................................................................................................................2-3General health questions Selected SF36 self-assessment questions
Objective Evaluation..........................................................................................................................................................2-7Postural orthostatic hypotensionLower extremity strength and powerDynamic balanceGait characteristics
Assessment................................................................................................................................................................................2-9Results analysis
Plan ..........................................................................................................................................................................................2-11In-clinic exercise programHome exercise programCognitive and educational trainingEnvironmental factorsPersonal behavioral risk factors
What if you fall?.....................................................................................................................................................................2-15
Supporting references............................................................................................................................................................2-17Self AssessmentObjective Evaluation and AssessmentGait CharacteristicsPlan
IMPORTANT NOTE
The Biodex Fall Risk Assessment and Conditioning Program is designed to identify known risk factors for which research hasdemonstrated a correlation to falling.
While the program can help reduce the risk of falling and associated injury, it cannot totally eliminate the chance of a fall or injury.
table of contents
FALL RISK ASSESSMENT &CONDITIONING PROTOCOL
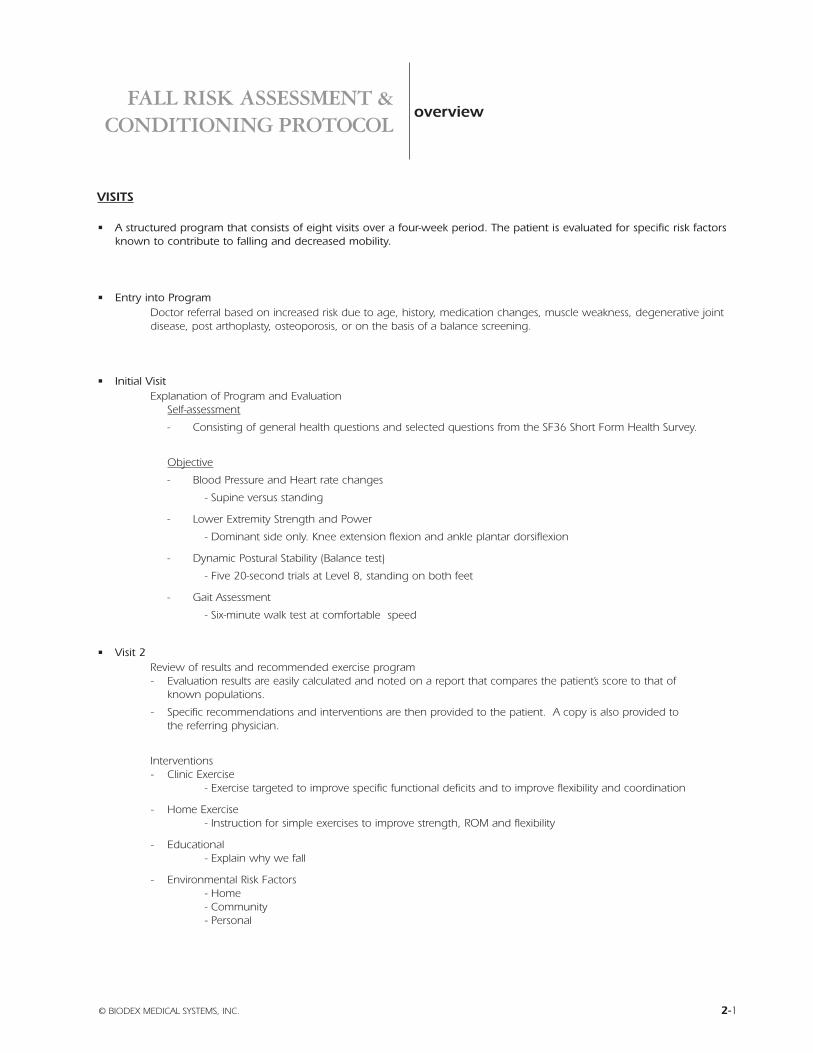
VISITS
• A structured program that consists of eight visits over a four-week period. The patient is evaluated for specific risk factorsknown to contribute to falling and decreased mobility.
• Entry into ProgramDoctor referral based on increased risk due to age, history, medication changes, muscle weakness, degenerative jointdisease, post arthoplasty, osteoporosis, or on the basis of a balance screening.
• Initial Visit Explanation of Program and Evaluation
Self-assessment
- Consisting of general health questions and selected questions from the SF36 Short Form Health Survey.
Objective
- Blood Pressure and Heart rate changes
- Supine versus standing
- Lower Extremity Strength and Power
- Dominant side only. Knee extension flexion and ankle plantar dorsiflexion
- Dynamic Postural Stability (Balance test)
- Five 20-second trials at Level 8, standing on both feet
- Gait Assessment
- Six-minute walk test at comfortable speed
• Visit 2 Review of results and recommended exercise program- Evaluation results are easily calculated and noted on a report that compares the patient’s score to that of
known populations.
- Specific recommendations and interventions are then provided to the patient. A copy is also provided tothe referring physician.
Interventions- Clinic Exercise
- Exercise targeted to improve specific functional deficits and to improve flexibility and coordination
- Home Exercise- Instruction for simple exercises to improve strength, ROM and flexibility
- Educational- Explain why we fall
- Environmental Risk Factors- Home- Community- Personal
© BIODEX MEDICAL SYSTEMS, INC. 2-1
overview

• Visit 3Clinic Exercise
• Visit 4Home exercise instruction and some clinic exercise
• Visit 5Clinic exercise and reinforcement of home exercise
• Visit 6Cognitive training and survival skills, plus some clinic exercise
• Visit 7Clinic exercise and continued reinforcement of home exercise
• Visit 8Re-evaluation
A report is sent to the patient and referring physician summarizing the net effect of the four-week program. Referring physician may recommend continued structured exercise to address specific neuromuscular deficiencies.
• Follow-upA follow-up evaluation is recommended every six months or following a change in physical health, activity statusor medication.
REIMBURSEMENT:
• When accompanied by a physician referral, and ICD-9 code related to:728.9 Muscle weakness
780.79 Leg weakness
715.0(x) Degenerative joint disease
715.2 Osteoarthritis as a secondary condition
719.9(x) Difficulty in walking
719.4(x) Pain in joint
719.5(x) Stiffness in joint
718.8(x) Instability in joint
• The following CPT codes can be applied. Reimbursement amounts vary among plans and states.97110: Therapeutic, activities one or more areas (strength, endurance, flexibility, ROM) each 15 minutes
97112: Neuromuscular re-education, each 15 minutes
97116: Gait Training, each 15 minutes
97530: Functional activities, one area, each 15 minutes
97535: Self care/home management training, each 15 minutes
97750: Physical performance test and measurement with written report, each 15 minutes
2-2 OVERVIEW

COMPENDIUM
General Health Questions and Selected SF36 questions:
• Age and weight:Will be used for normalizing data in the Balance and Gait evaluations
• Side in which a ball is kicked determines the dominant side.This is the side, which will have the isokinetic evaluation.
• Current prescription medications:It is very important to establish a baseline balance score for the current medications. This helps to see the effects of achange in medication or the addition of others to balance. Over the counter drugs should also be noted.
• Current Medical Conditions:Good background information for correlation to performance.
• Perception of their own balance ability:This is meant to be an insightful question. People have a tendency to have a good idea if they have difficulty balancing.They may have initiated getting a balance test for affirmation of good balance or confirmation of their own balance concerns.
• Number of times fallen this past year?Again, needed information as background. People could have fallen, but not suffered an injury. Perhaps they may havetripped, did something that was ill advised, or did in fact have an unexplained event. You need to ask the question andprobe a little.
• SF 36 Questions: The self perceived function scores have been proven to be valid and reliable instruments for self-health status. It is impor-tant to note one’s perceptions of mental and physical health. It is vital to know if someone has modified their lifestyledue to a lack of confidence in their physical performance. It is the hope that through recognition of either the presenceor lack of problems and through the intervention, that confidence and the sense of well being can be restored and sup-ported by an improvement in self assessment scores at the time of re-evaluation.
Physical Performance Measures:
• Postural Hypotension (Orthostatic)A disabling feature of autonomic dysfunction. The generally accepted criteria for evaluation are a postural decrease fromsupine to standing position of at least 20mmHg in systolic, or 10 mmHg in diastolic blood pressure sustained for at least3 minutes. The 3 minute criteria is to differentiate autonomic failure from sluggish baro-reflex responses that are commonin the elderly. Postural hypotension can cause a variety of symptoms including dimming or loss of vision, light-headed-ness, profuse sweating, paleness and weakness. If postural hypotension is suspected, this should be clearly noted withinthe initial evaluation report and letter to the referring physician.
• Lower Extremity Strength and Power Indices: If these are within or near the range of fallers, strength training is needed for ankle and knees.
• Balance: Balance is the collective contribution of visual, vestibular, somatosensory input and how they are supported by thestrength and motor mechanisms. Having poor balance doesn’t necessarily mean one will fall. This is because we cancompensate for the impairment with some other mechanism. However as we age, our impairments tend to increaseand our ability to compensate decreases. The balance score is an reliable objective means to compare one’s balanceability to a similar age healthy person. As the balance score increases so does the significance of poor balance as a con-tributing risk factor to falling. Lower extremity strength deficiency has been correlated to poor balance. In additionimproving strength has been shown to improve balance. Balance training and trunk stabilization exercises also help toimprove balance.
© BIODEX MEDICAL SYSTEMS, INC. 2-3
2-4 OVERVIEW
• Gait Results:Walking is function and a common basis of defining independence. Walking or gait characteristics are a good barome-ter of personal wellness. Several specific gait characteristics have been identified as when compromised, correlate to lossof independence or increased risk of falling. They include distance achieved in a 6 minute walk test, gait velocity, stridelength and step length variability. Should any of parameters note risk, exercise to improve strength and cardiovascularconditioning should be recommended.

FALL RISK ASSESSMENT &CONDITIONING PROTOCOL
self assessment
GENERAL HEALTH QUESTIONS AND SF36 FORM
Name __________________________________________________________________________________________________________
Referring Physician _______________________________________________________________________________________________
• Male Female
• Age _________________
• Weight ______________
• Height ______________
• Which leg do you kick a ball with? Right Left
• List Current Prescription Drugs
__________________________________________ __________________________________________
__________________________________________ __________________________________________
__________________________________________ __________________________________________
• List Current Diagnosed Medical Conditions
__________________________________________ __________________________________________
__________________________________________ __________________________________________
__________________________________________ __________________________________________
• Your perception of Balance ability (please indicate with a number)
POOR 1 2 3 4 5 6 7 8 9 10 EXCELLENT
• Do you consider yourself: independent need assistance dependent
• Do you consider yourself: active somewhat active inactive
• Number of times you have fallen this year: _______
© BIODEX MEDICAL SYSTEMS, INC. 2-5

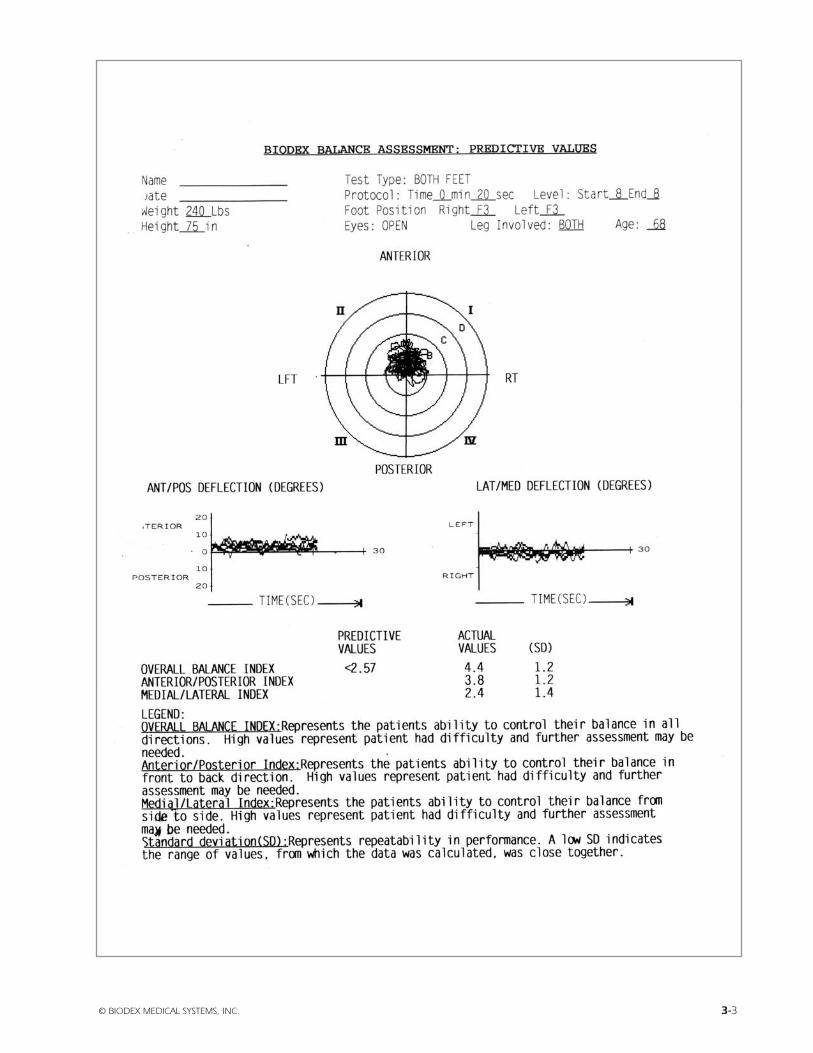
SELF ASSESSMENT
Name: ____________________________________________________ Date: _____________________________________________
• General Health
1. In general, would you say your health is:
5 Excellent
4 Very good
3 Good
2 Fair
1 Poor
2. How TRUE or FALSE is each of the following sentences for you? (Circle one number on each line)
Definitely True Mostly True Do Not Know Mostly False Definitely False
I seem to get sick a little 1 2 3 4 5easier than other people
I am as healthy as 5 4 3 2 1anybody I know
I expect my health to 1 2 3 4 5get worse
My health is excellent 5 4 3 2 1
Total raw score of 1 + 2: _________
2-6 SELF ASSESSMENT
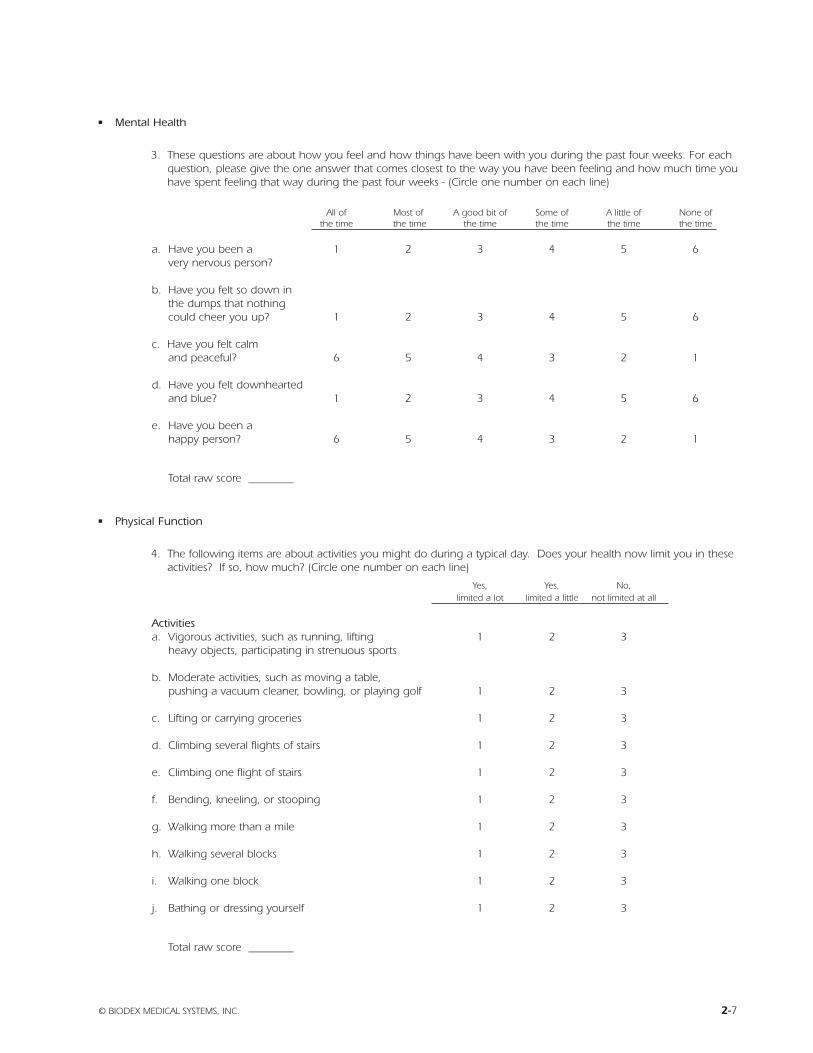
• Mental Health
3. These questions are about how you feel and how things have been with you during the past four weeks. For eachquestion, please give the one answer that comes closest to the way you have been feeling and how much time youhave spent feeling that way during the past four weeks - (Circle one number on each line)
All of Most of A good bit of Some of A little of None ofthe time the time the time the time the time the time
a. Have you been a 1 2 3 4 5 6very nervous person?
b. Have you felt so down inthe dumps that nothing could cheer you up? 1 2 3 4 5 6
c. Have you felt calmand peaceful? 6 5 4 3 2 1
d. Have you felt downheartedand blue? 1 2 3 4 5 6
e. Have you been ahappy person? 6 5 4 3 2 1
Total raw score ________
• Physical Function
4. The following items are about activities you might do during a typical day. Does your health now limit you in theseactivities? If so, how much? (Circle one number on each line)
Yes, Yes, No,limited a lot limited a little not limited at all
Activitiesa. Vigorous activities, such as running, lifting 1 2 3
heavy objects, participating in strenuous sports
b. Moderate activities, such as moving a table,pushing a vacuum cleaner, bowling, or playing golf 1 2 3
c. Lifting or carrying groceries 1 2 3
d. Climbing several flights of stairs 1 2 3
e. Climbing one flight of stairs 1 2 3
f. Bending, kneeling, or stooping 1 2 3
g. Walking more than a mile 1 2 3
h. Walking several blocks 1 2 3
i. Walking one block 1 2 3
j. Bathing or dressing yourself 1 2 3
Total raw score ________
© BIODEX MEDICAL SYSTEMS, INC. 2-7
Name: ____________________________________________________ Date: _____________________________________________
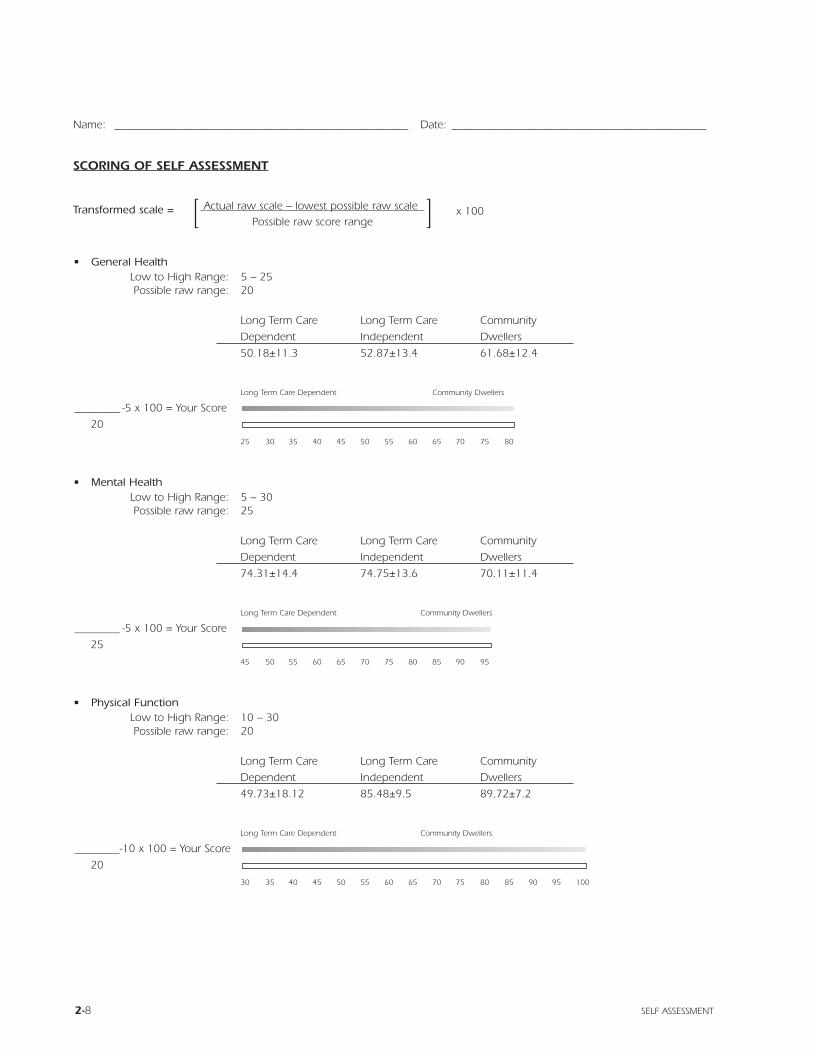
SCORING OF SELF ASSESSMENT
Transformed scale = [ Actual raw scale – lowest possible raw scale ] x 100Possible raw score range
• General HealthLow to High Range: 5 – 25Possible raw range: 20
Long Term Care Long Term Care Community
Dependent Independent Dwellers
50.18±11.3 52.87±13.4 61.68±12.4
Long Term Care Dependent Community Dwellers
________ -5 x 100 = Your Score
20
25 30 35 40 45 50 55 60 65 70 75 80
• Mental HealthLow to High Range: 5 – 30Possible raw range: 25
Long Term Care Long Term Care Community
Dependent Independent Dwellers
74.31±14.4 74.75±13.6 70.11±11.4
Long Term Care Dependent Community Dwellers
________ -5 x 100 = Your Score
25
45 50 55 60 65 70 75 80 85 90 95
• Physical FunctionLow to High Range: 10 – 30Possible raw range: 20
Long Term Care Long Term Care Community
Dependent Independent Dwellers
49.73±18.12 85.48±9.5 89.72±7.2
Long Term Care Dependent Community Dwellers
________-10 x 100 = Your Score
20
30 35 40 45 50 55 60 65 70 75 80 85 90 95 100
2-8 SELF ASSESSMENT
FALL RISK ASSESSMENT &CONDITIONING PROTOCOL
objective evaluation
Name: ____________________________________________________ Date: _____________________________________________
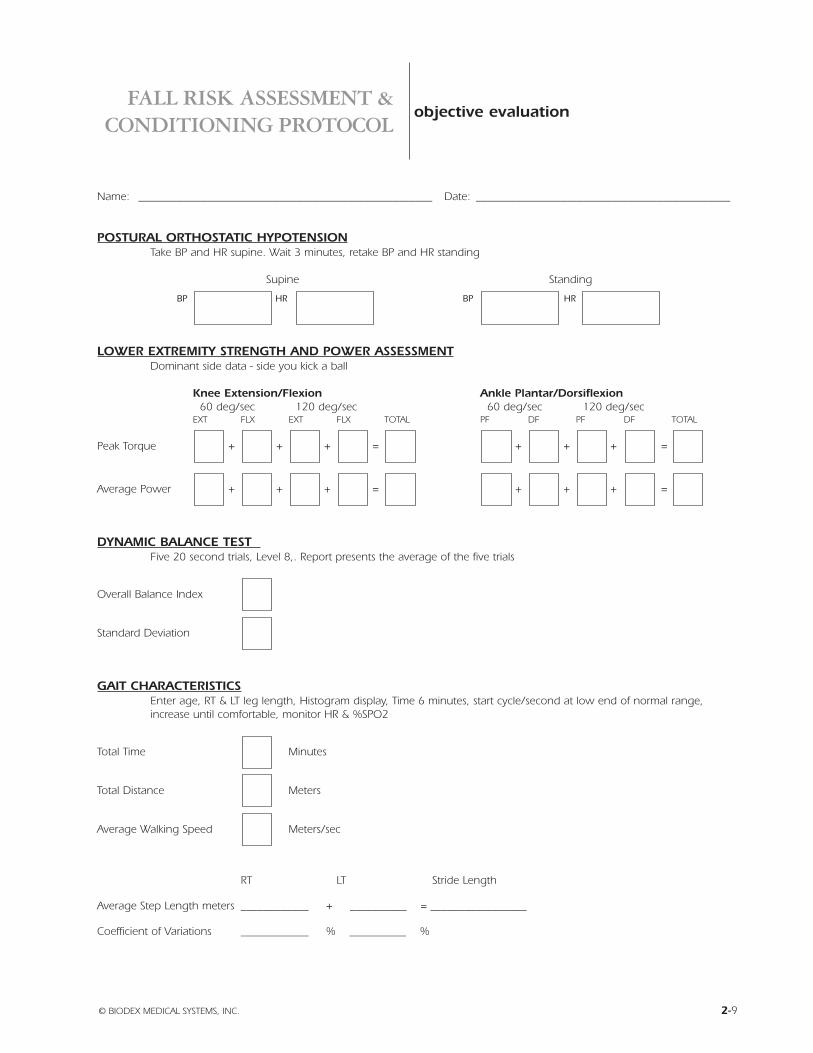
POSTURAL ORTHOSTATIC HYPOTENSIONTake BP and HR supine. Wait 3 minutes, retake BP and HR standing
Supine Standing
BP HR BP HR
LOWER EXTREMITY STRENGTH AND POWER ASSESSMENTDominant side data - side you kick a ball
Knee Extension/Flexion Ankle Plantar/Dorsiflexion60 deg/sec 120 deg/sec 60 deg/sec 120 deg/sec
EXT FLX EXT FLX TOTAL PF DF PF DF TOTAL
Peak Torque + + + = + + + =
Average Power + + + = + + + =
DYNAMIC BALANCE TEST Five 20 second trials, Level 8,. Report presents the average of the five trials
Overall Balance Index
Standard Deviation
GAIT CHARACTERISTICSEnter age, RT & LT leg length, Histogram display, Time 6 minutes, start cycle/second at low end of normal range,increase until comfortable, monitor HR & %SPO2
Total Time Minutes
Total Distance Meters
Average Walking Speed Meters/sec
RT LT Stride Length
Average Step Length meters ____________ + __________ = _________________
Coefficient of Variations ____________ % __________ %
© BIODEX MEDICAL SYSTEMS, INC. 2-9

2-10
FALL RISK ASSESSMENT &CONDITIONING PROTOCOL
© BIODEX MEDICAL SYSTEMS, INC. 2-11
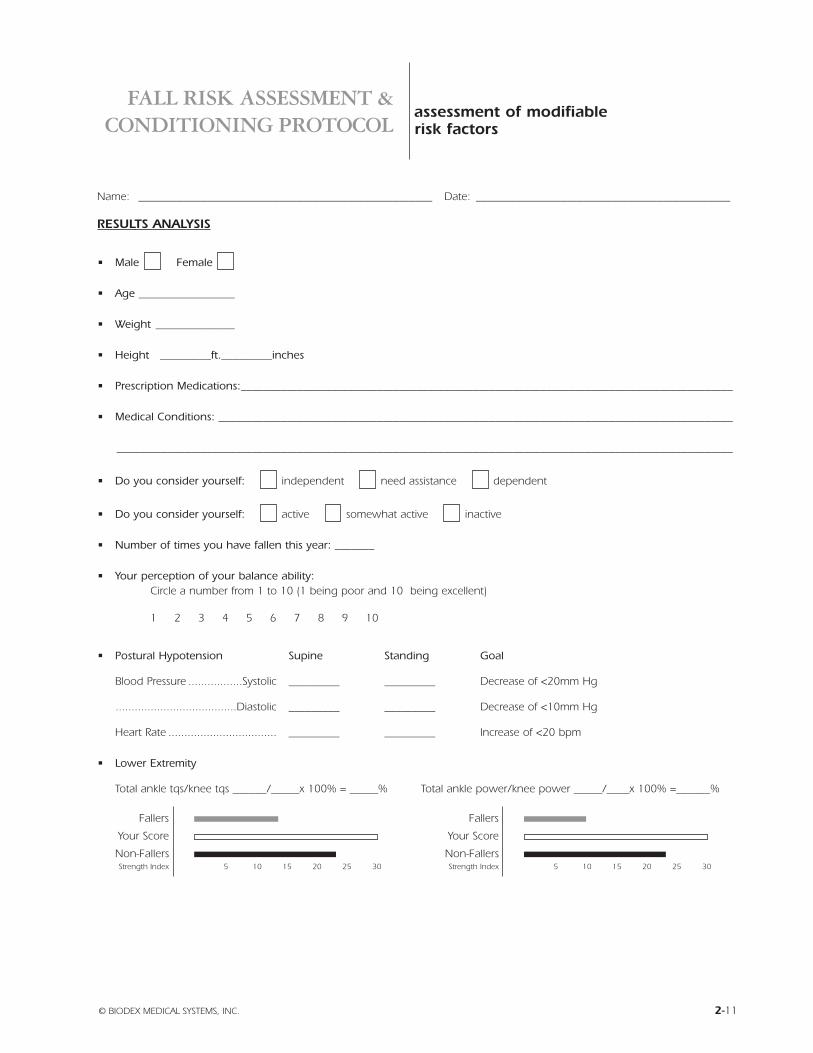
assessment of modifiablerisk factors
Name: ____________________________________________________ Date: _____________________________________________
RESULTS ANALYSIS
• Male Female
• Age _________________
• Weight ______________
• Height _________ft._________inches
• Prescription Medications:_______________________________________________________________________________________
• Medical Conditions: ___________________________________________________________________________________________
_____________________________________________________________________________________________________________
• Do you consider yourself: independent need assistance dependent
• Do you consider yourself: active somewhat active inactive
• Number of times you have fallen this year: _______
• Your perception of your balance ability: Circle a number from 1 to 10 (1 being poor and 10 being excellent)
1 2 3 4 5 6 7 8 9 10
• Postural Hypotension Supine Standing Goal
Blood Pressure .................Systolic _________ _________ Decrease of <20mm Hg
......................................Diastolic _________ _________ Decrease of <10mm Hg
Heart Rate .................................. _________ _________ Increase of <20 bpm
• Lower Extremity
Total ankle tqs/knee tqs ______/_____x 100% = _____% Total ankle power/knee power _____/____x 100% =______%
Fallers
Your Score
Non-FallersStrength Index 5 10 15 20 25 30
Fallers
Your Score
Non-FallersStrength Index 5 10 15 20 25 30
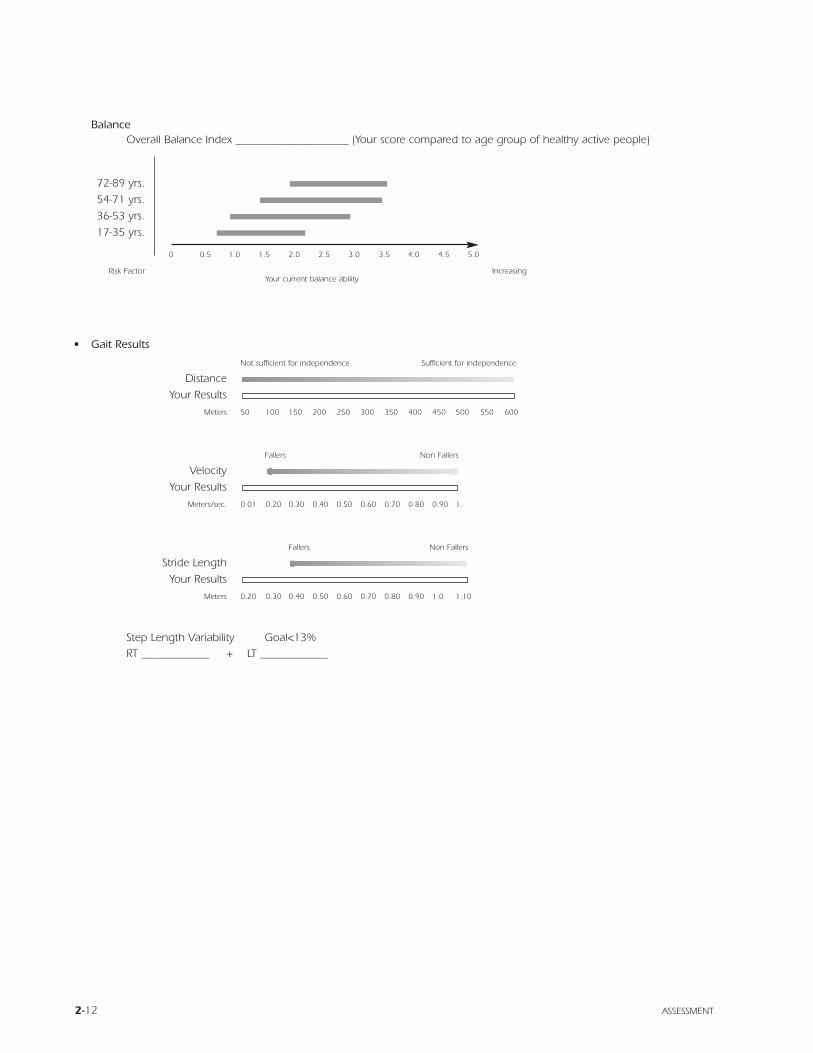
BalanceOverall Balance Index ____________________ (Your score compared to age group of healthy active people)
72-89 yrs.
54-71 yrs.
36-53 yrs.
17-35 yrs.
0 0.5 1.0 1.5 2.0 2.5 3.0 3.5 4.0 4.5 5.0
Risk FactorYour current balance ability
Increasing
• Gait Results
Not sufficient for independence Sufficient for independence
Distance
Your Results
Meters 50 100 150 200 250 300 350 400 450 500 550 600
Fallers Non Fallers
Velocity
Your Results
Meters/sec. 0.01 0.20 0.30 0.40 0.50 0.60 0.70 0.80 0.90 1.
Fallers Non Fallers
Stride Length
Your Results
Meters 0.20 0.30 0.40 0.50 0.60 0.70 0.80 0.90 1.0 1.10
Step Length Variability Goal<13%RT ____________ + LT ____________
2-12 ASSESSMENT

FALL RISK ASSESSMENT &CONDITIONING PROTOCOL
IN-CLINIC EXERCISE
Exercise targeted to improve specific functional deficits and to improve flexibility and coordination
• To Improve Lower Extremity Strength and Power RatiosTreadmill walking forward and reverse with slight inclineIsokinetic exercise of knee and ankle Isotonic knee and ankle exercise Isokinetic cycle SRC
• To Improve FlexibilityFlexibility in the ankles, legs and hips is important to comfort and safety in daily activities. A chronically short muscle can-not develop its full power when called upon to contract. In addition a chronically short muscle will limit range ofmotion. For instance, tight hamstrings or psoas will limit stride length. Over distance this translates to taking more steps.More steps means more work, increasing the potential for fatigue and injury.
Ankle Plantarflexion- Gastrocnemius stretch
- Soleus stretch
Inversion- Tibialis anterior stretch
- Tibialis posterior stretch
Dorsiflexion- Tibialis anterior stretch
Eversion- Peroneal stretches
Knee Extension and FlexionHamstring and Quadriceps stretch
Hip Flexion- Psoas
Extension- Hamstrings
• To Improve Coordination Reciprocal leg movementsBridgingSitting to standingBraiding exercisesReciprocal ankle movementsRung ladder and forward stepping
• Postural stability and kinesthetic training Weight shift excursionsDynamic limits of stability trainingTrunk stabilization trainingSitting on balance ballUpper Body Cycle exercise that promotes torso rotation
© BIODEX MEDICAL SYSTEMS, INC. 2-13
plan

COGNITIVE AND EDUCATIONAL TRAINING
• From North Shore University Hospital at Glen Cove, NY, Department of Physical Medicine and Rehabilitation,Occupational Therapy Department
• In addition to the health factors, environmental and risk taking behavior contribute to falling.
• Environmental Factors: The frequently preventable cause of falls is thought to be environmental. These include hazards insurroundings, particularly in the home.
• Check list of potential environmental risk factors in the home:
2-14 PLAN
General:
Poor lighting
Slippery floors
Uneven floors
Throw rugs
Runners
Mats
Curled carpet edges
Electric or telephone wires in the areas where we walk
Clutter
Small objects in pathways
Unstable seating such as swivel chairs or chairs on casters
Pet or children’s belongings left in walkways
Newspapers left on floor in walkways
Laundry left on floor in pathways
Cleaning products that leave slippery surfaces
Stairways:
Missing light switches at top and/or bottom of steps
Unsturdy handrails
Uneven steps or steps needing repair
Items placed on stairs
Kitchen
Unstable step stool
Storage areas that require excessive reaching or bending for access
Appliances arranged inefficiently
Unstable seating
Wet floors
Bathroom:
Lack of grab bars in shower or tub
Lack of non skid surfaces in shower or tub
Toilets that are wobbly or too low to floor
Unstable towel rack or sink
Wet floors
Outside:
Walkways in disrepair
Wet smooth surfaces, i.e., slate
Cluttered walkways and storage areas
Poor night lighting
Poor placement of trash and recycle bins
Garden hose across the walk area
Children’s toys
Pet toys and leashes
High curbs
ENVIRONMENTAL FACTORS
• Environmental Remedies- Grab bars in the bathroom
- Use of non skid mats in/out of tub
- Handrails along the hallways
- Removal of scatter rugs
- Motion sensor lighting
- Use of reachers
- Careful arrangement of work areas
- Improved lighting
- Cordless telephone
- Straighten up clutter
- Clear the pathways and walkways
- Telephone with easily identifiable speed dials to people who can help
• Risk Taking BehaviorThings we do consciously or unconsciously can increase the risk of falling. Education and counseling of all family mem-bers to work out strategies to help decrease the risk of falls is very beneficial. The older person at risk should be assertivein asking for assistance when needed. They also should learn to recognize their limits and needs.
• Examples of risk taking behavior- Rushing to answer the door or phone
- Reaching
- Using a step stool or ladder to reach an overhead item
- Picking up dropped items
- Transferring from lying to standing too quickly, or sitting to standing too quickly
- Carrying heavy parcels
- Careless use of stairs
- Bathing and moving from bedroom to bathroom at night
PERSONAL BEHAVIORAL RISK FACTORS- Loose clothing such as robes that may get caught on furniture or shoes
- Proper fitting footwear
- Non-slip firm sole shoes with good support (not heals, flip flop sandals or slippers) increases proprioception
- Use of stretch type knee and ankle supports, also to increase proprioception
- Use precaution against the side effects of prescription medicine
- Avoid alcohol
- Maintain an active life to stimulate both mind and body which leads to increased awareness of the environment aswell as psychological fitness
© BIODEX MEDICAL SYSTEMS, INC. 2-15

2-16

FALL RISK ASSESSMENT &CONDITIONING PROTOCOL
• What if… you are falling or feel yourself falling?Your training may help reduce the potential of a fall and the possibility of severe injury. There is no way to eliminate allpossibilities of a fall.
Part of the preparation for dealing with falls is to have a telephone located in an accessible place in your home. Easilyrecognized speed dials are highly recommended.
• Should you feel yourself falling- Don’t panic
- Get your arms between your body and the ground/floor
• Should you find yourself down on the floor or ground- Again, don’t panic
- Try to relax, chances are you are not seriously injured
- Do not try to get up right away
- Catch your breath, calm yourself down, gather your thoughts
- Slowly move your arms and legs, one at a time, to check for injury
- Then simply follow the directions below
Turn onto your side and push up with your hands into a sitting position bywalking your hands toward your body until you are upright.
Turn onto your hands and knees. Crawl to a sturdy chair.
Place your hands on the chair and with one leg on the floor and the other in akneeling position push yourself up and onto the chair.
If you are unable to get up by using a chair, crawl on your hands and knees to a telephone to call for help. If you cannot crawl,turn onto your side or back and scoot yourself to the telephone.
© BIODEX MEDICAL SYSTEMS, INC. 2-17
what if you fall?

2-18

FALL RISK ASSESSMENT &CONDITIONING PROTOCOL
SELF ASSESSMENTWare JE, Shelbourne CD.The MOS 36 item Short Form Health Survey (SF-36) Med Care 1992;30:473-83
Cress ME, Buchner DM, Questad KA, Essel PC, daLateur BJ, Schwartz RS.Continuous-scale physical functional performance in healthy older adults: a validation study.Arch Phys Med Rehabil 1996; 77:1234-50
OBJECTIVE EVALUATION AND ASSESSMENT
• Postural (orthostatic) hypotension Engstrom J, Martin JB. in Harrison’s Principles of Internal Medicine.14th ed. McGraw-Hill. New York, 1998 pg2372
• Lower extremity strength and power development Whipple RH, Wolfson LI, Amerman PM.The relationship of Knee and Ankle Weakness to Falls in Nursing Home Residents: An isokinetic study.J Am Geriatric Society 35: 13-20, 1987
• Balance normal rangesFinn JA, Alvarez M, Jett RE, Axtell RS, Kemler DS. Biodex Balance System assessment among subjects of disparatebalancing abilities. Presented at the 1999 American College of Sports Medicine Annual Meeting
• Gait characteristicsHarada ND, Chiu V, Stewart AL.Mobility-related function in older adults: assessment with a 6-minute walk test.Arch Phys Med. Rehabil. 1999;80:837-41
Wolfson L. Whipple R, Amerman P, Tobin JN.Gait Assessment in the Elderly: A Gait Abnormality Rating Scale and its Relation to Falls.J of Gerontology 1990; 45:M12-19
Sekiya N, Hiroshi N, Ito H, Furuna T.Optimal Walking in Terms of Variability in Step Length.JOSPT; 26:5; 266-272, Nov 1997.
PLANSimpson JM, Harrington R, Marsh N.Guidelines for Managing Falls Among Elderly People.Physiotherapy, 84:4;173-177 April 1998.
Tinetti M. Speechley M, Ginter SF.Risk Factors for Falls Among Elderly Persons Living in the Community.N Engl Med 1988; 319:1701-7.
Perkins-Carpenter, Betty.How to Prevent Falls.Senior Fitness Production Rochester NY 1993.
North Shore University Hospital at Glen Cove. Dept. of PM&R, OT Dept.
© BIODEX MEDICAL SYSTEMS, INC. 2-19
supporting references
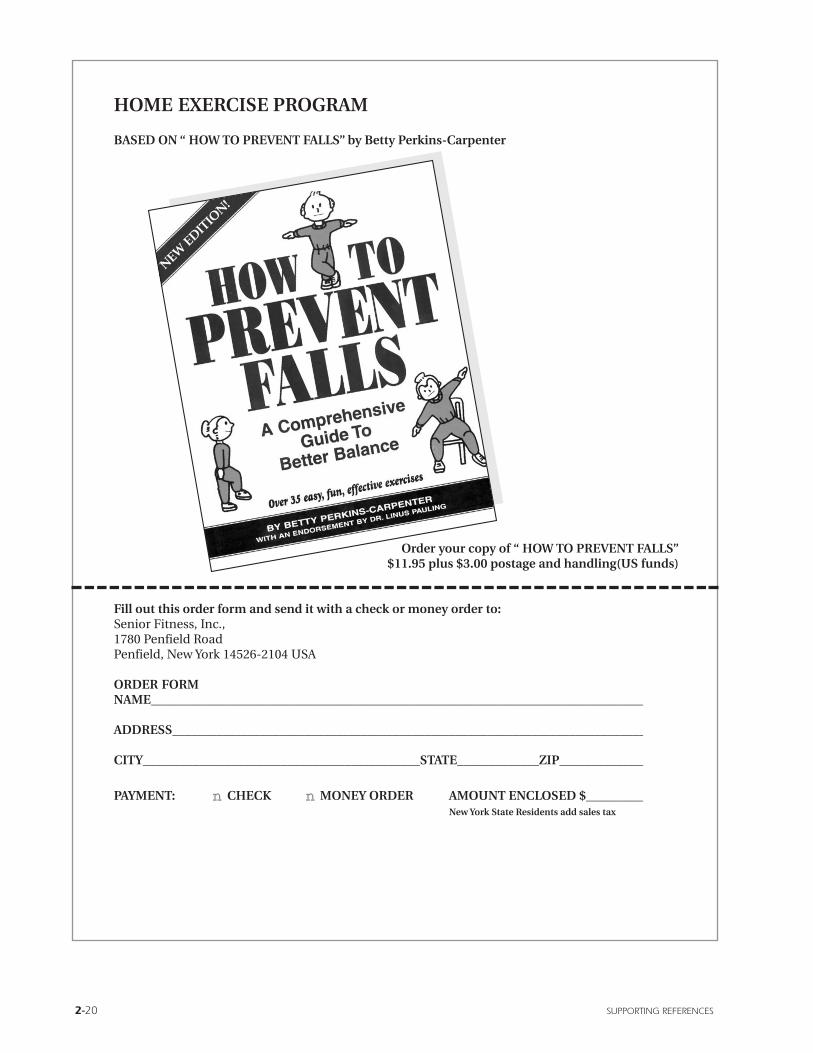
HOME EXERCISE PROGRAM
BASED ON “ HOW TO PREVENT FALLS” by Betty Perkins-Carpenter
Order your copy of “ HOW TO PREVENT FALLS”$11.95 plus $3.00 postage and handling(US funds)
Fill out this order form and send it with a check or money order to:Senior Fitness, Inc.,1780 Penfield RoadPenfield, New York 14526-2104 USA
ORDER FORMNAME_______________________________________________________________________________
ADDRESS_____________________________________________________________________________
CITY____________________________________________STATE_____________ZIP________________
PAYMENT: nn CHECK nn MONEY ORDER AMOUNT ENCLOSED $___________New York State Residents add sales tax
2-20 SUPPORTING REFERENCES
FN: 03-013
Fall RiskAssessment &ConditioningProgram Manual
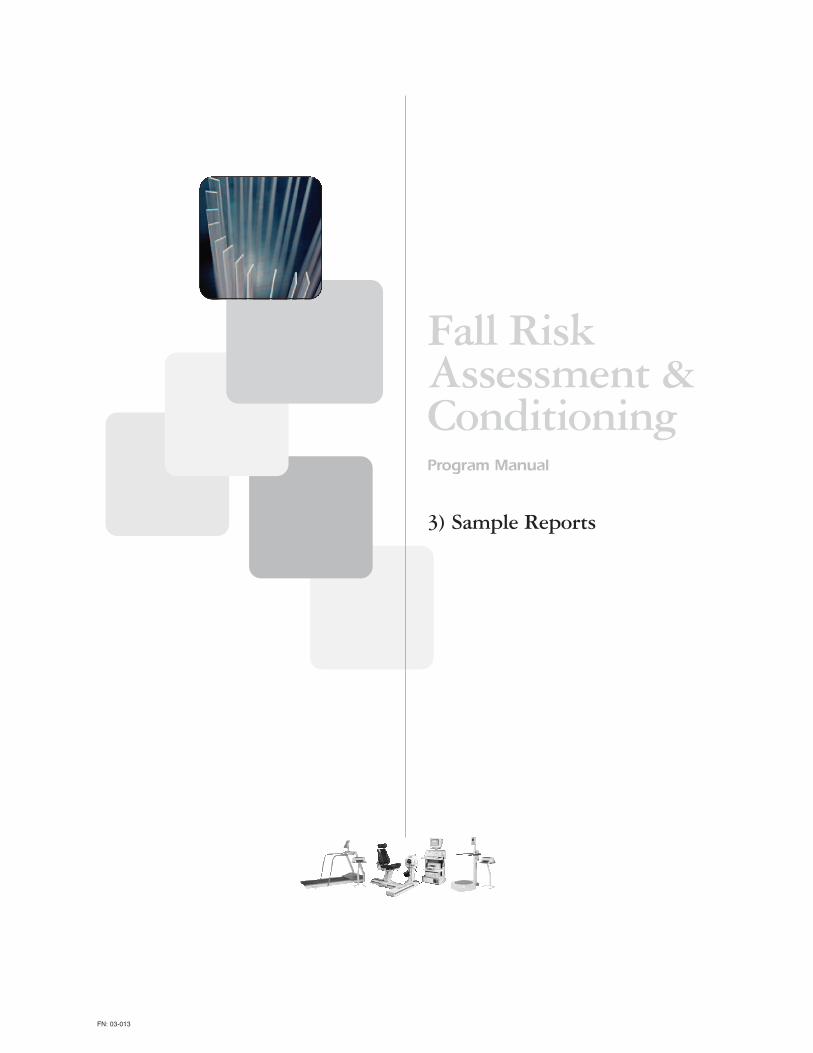
3) Sample Reports

© BIODEX MEDICAL SYSTEMS, INC. 3-1

3-2 SAMPLE REPORTS
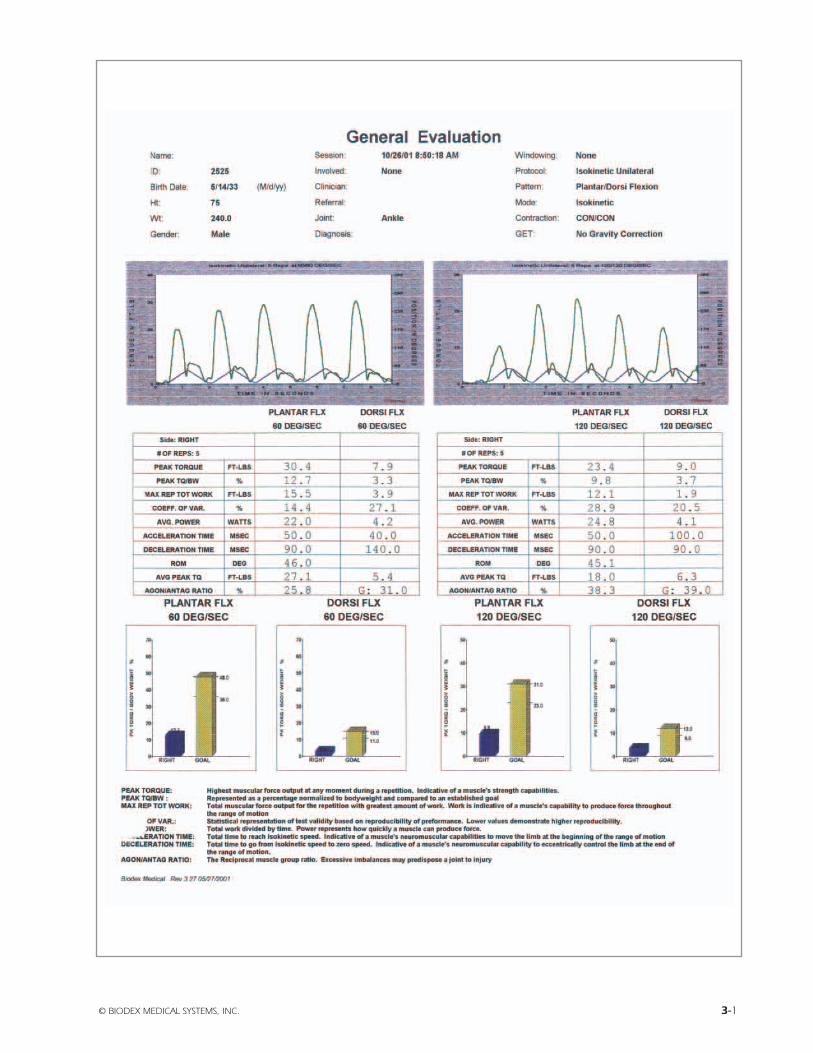
© BIODEX MEDICAL SYSTEMS, INC. 3-3
3-4 SAMPLE REPORTS

© BIODEX MEDICAL SYSTEMS, INC. 3-5

3-6 SAMPLE REPORTS

© BIODEX MEDICAL SYSTEMS, INC. 3-7

3-8 SAMPLE REPORTS

Fall RiskAssessment &ConditioningProgram Manual
4) Supporting References
FALL RISK ASSESSMENT &CONDITIONING PROGRAM
supporting references
SELF ASSESSMENTWare JE, Shelbourne CD. The MOS 36 item Short Form Health Survey (SF-36) Med Care 1992;30:473-83
Cress ME, Buchner DM, Questad KA, Essel PC, daLateur BJ, Schwartz RS. Continuous-scale physical functionalperformance in healthy older adults: a validation study. Arch Phys Med Rehabil 1996; 77:1234-50
OBJECTIVE EVALUATION AND ASSESSMENT
Postural hypotension (orthostatic)Engstrom J, Martin JB. in Harrison’s Principles of Internal Medicine.
14th ed. McGraw-Hill. New York, 1998; 2372
Lower Extremity Strength and Power Development Whipple RH, Wolfson LI, Amerman PM.The relationship of Knee and Ankle Weakness to Falls in Nursing Home Residents: An isokinetic study.
J Am Geriatric Society 35: 13-20, 1987
Balance normal rangesFinn JA, Alvarez M, Jett RE, Axtell RS, Kemler DS. Biodex Balance System assessment among subjects of disparatebalancing abilities.
Presented at the 1999 American College of Sports Medicine Annual Meeting
Gait CharacteristicsHarada ND, Chiu V, Stewart AL. Mobility-related function in older adults: assessment with a 6-minute walk test.
Arch Phys Med. Rehabil. 1999;80:837-41
Wolfson L. Whipple R, Amerman P, Tobin JN. Gait Assessment in the Elderly: A Gait Abnormality Rating Scale and itsRelation to Falls.
J of Gerontology 1990; 45:M12-19
Sekiya N, Hiroshi N, Ito H, Furuna T. Optimal Walking in Terms of Variability in Step Length.JOSPT; 26:5; 266-272, Nov 1997.
PLANSimpson JM, Harrington R, Marsh N.,Guidelines for Managing Falls Among Elderly People.
Physiotherapy, 84:4;173-177 April 1998.
Tinetti M. Speechley M, Ginter SF. Risk Factors for Falls Among Elderly Persons Living in the Community.N Engl Med 1988; 319:1701-7.
Perkins-Carpenter, Betty. How to Prevent Falls.Senior Fitness Production Rochester NY 1993.
North Shore University Hospital at Glen Cove.Dept. of PM&R, OT Dept.
© BIODEX MEDICAL SYSTEMS, INC. 4-1

4-2

© BIODEX MEDICAL SYSTEMS, INC. 4-3
BACKGROUND AND SIGNIFICANCEFalls are among the most common and serious prob-
lems facing elderly persons. Falling is associated withconsiderable mortality, morbidity, reduced functioning,and premature nursing home admissions.1-5 Falls general-ly result from an interaction of multiple and diverse riskfactors and situations, many of which can be corrected.This interaction is modified by age, disease, and the pres-ence of hazards in the environment.6 Frequently, olderpeople are not aware of their risks of falling, and neitherrecognize risk factors nor report these issues to theirphysicians. Consequently opportunities for prevention offalling are often overlooked with risks becoming evidentonly after injury and disability have already occurred .7-9
Both the incidence of falls and the severity of fallrelated complications rise steadily after age 60. In the age65-and-over population as a whole, approximately 35% to40% of community-dwelling, generally healthy older per-sons fall annually. After age 75, the rates are higher.10,11
Incidence rates of falls in nursing homes and hospitalsare almost three times the rates for community-dwellingpersons age >65 (1.5 falls per bed annually). Injury ratesare also considerably higher with 10% to 25% of institu-tional falls resulting in fracture, laceration, or the need forhospital care.12 Fall-related injuries recently accounted for6% of all medical expenditures for persons age 65 andolder in the United States.12,13
A key concern is not simply the high incidence offalls in older persons (young children and athletes have aneven higher incidence of falls) but rather the combinationof high incidence and a high susceptibility to injury. Thispropensity for fall-related injury in elderly persons stemsfrom a high prevalence of comorbid diseases (e.g., osteo-porosis) and age-related physiological decline (e.g., slow-er reflexes) that make even a relatively mild fall potential-ly dangerous. Approximately 5% of older people who fallrequire hospitalization.14
Unintentional injuries are the fifth leading cause ofdeath in older adults (after cardiovascular, neoplastic,cerebrovascular, and pulmonary causes), and falls areresponsible for two-thirds of the deaths resulting fromunintentional injuries. More pointedly, 75% of deaths dueto falls in the United States occur in the 13% of the popu-
lation age 65 and over.15 In addition to physical injury,falls can also have psychological and social consequences.Recurrent falls are a common reason for admission of pre-viously independent elderly persons to long-term careinstitutions.16,17 One study found that falls were a majorreason for 40% of nursing home admissions.14 Fear offalling and the post-fall anxiety syndrome are also wellrecognized as negative consequences of falls. The loss ofself-confidence to ambulate safely can result inself-imposed functional limitations.1,18
RISK FACTORS FOR FALLINGAs detailed in Table 1, a number of studies have iden-
tified risk factors for falling. These can be classified aseither intrinsic (e.g., lower extremity weakness, poor gripstrength, balance disorders, functional and cognitiveimpairment, visual deficits) or extrinsic (e.g., polypharma-cy (i.e., four or more prescription medications) and envi-ronmental factors such as poor lighting, loose carpets, andlack of bathroom safety equipment). Although investiga-tors have not used consistent classifications, a recentreview of fall risk factor studies ranked the risk factors andsummarized the relative risk of falls for persons with eachrisk factor (Table 1).11 In addition, a meta-analysis thatstudied the relationship of falls and medications, whichincluded studies that examined both multiple and singlerisk factors, found a significantly increased risk from psy-chotropic medication (odds ratio (OR) = 1.7), Class laantiarrhythmic medications (OR 1.6), digoxin (OR = 1.2),and diuretics (OR = 1.1).32
Perhaps as important as identifying risk factors isappreciating the interaction and probable synergismbetween multiple risk factors. Several studies have shownthat the risk of falling increases dramatically as the num-ber of risk factors increases. Tinetti et al. surveyed com-munity-dwelling elderly persons and reported that the per-centage of persons falling increased from 27% for thosewith no or one risk factor to 78% for those with four ormore risk factors.30 Similar results were found among aninstitutionalized population.5 In another study, Nevitt et al.reported that the percentage of community-living personswith recurrent falls increased from 10% to 69% as thenumber of risk factors increased from one to four ormore.27 Robbins et al. used multivariate analysis to sim-plify risk factors so that maximum predictive accuracycould be obtained by using only three risk factors (i.e., hipweakness, unstable balance, taking > 4 medications) in analgorithm format. With this model, the predicted 1-yearrisk of falling ranged from 12% for persons with none of
GUIDELINE FOR THE PREVENTION OF FALLS IN OLDER PERSONSAmerican Geriatrics Society, British Geriatrics Society, and AmericanAcademy of Orthopaedic Surgeons Panel on Falls Prevention
Key words: falls; risk of falling; fall assessment; fall intervention; fall prevention
This guideline was developed and written under the auspices of theAmerican Geriatrics Society (AGS) Panel on Falls in Older Persons andapproved by the AGS Board of Directors on April 5, 2001.
Address correspondence and reprint requests to: Nancy Lundebjerg,Senior Director, Professional Education and Publications, AmericanGeriatrics Society, 350 Fifth Avenue, Suite 801, New York, NY 10118.
JAGS 49:664-672, 2001© 2001 by the American Geriatric Society
(1)

4-4 GUIDELINE FOR THE PREVENTION OF FALLS IN OLDER PERSONS
the three risk factors to 100% for persons with all three.3
There is emerging evidence of an overlap between thesymptoms of falls and syncope in some older adults. This isdue either to amnesia for loss of consciousness or to hypoten-sion-induced imbalance in persons with existing gait and bal-ance instability. To date, the overlap has been reported inselected populations with bradycardiac disorders such ascarotid sinus syndrome. The prevalence of cardiovascularcauses of falls in the general population is as yet unknown.
GUIDELINE DEVELOPMENT PROCESSAND METHODS
The aim of this guideline is to assist health care pro-fessionals in their assessment of fall risk and in their man-agement of older patients who are at risk of falling and thosewho have fallen. The Panel on Falls Prevention assumes thathealth care professionals will use their clinical knowledgeand judgment in applying the general principles and specif-ic recommendations of this document to the assessment andmanagement of individual patients. Decisions to adopt anyparticular recommendation must be made by the practition-er in light of available evidence and resources.
The literature search attempted to locate systematicreviews and meta-analysis, randomized trials, controlledbefore-and-after studies, and cohort studies using a combi-nation of subject heading and free text searches. The panelmade extensive use of high-quality recent review articlesand bibliographies, as well as contact with subject areaexperts. New searches were concentrated in areas of impor-tance to the guideline development process, for which exist-ing systematic reviews were unable to provide valid orup-to-date answers. The expert knowledge and experienceof panel members also reinforced the search strategy. It isimportant to note that the literature upon which the guide-line is based includes only those articles that were availableto the Panel during its September 2000 meeting.
A literature search conducted by researchers at theRAND Corporation (RAND Corporation, Santa Monica,CA) for the purpose of identifying quality of care indicatorsfor falls and mobility problems for two ongoing nationalprojects provided the initial set of articles reviewed for theguideline. “Included” articles were meta-analysis and sys-tematic literature reviews, randomized controlled trials,nonrandomized clinical trials, case control studies, andcohort studies in which outcomes involved data related tofall risk or fall prevention as well as articles that providedepidemiological or other background information. For eachincluded article, data were extracted. Reference lists ofincluded articles were scanned for any additional relevantstudies, and further relevant articles were identified.
The Panel identified and synthesized relevant pub-lished evidence to allow recommendations to be evidencebased, whenever possible, using the grading criteria shownin Table 2. The grading criteria distinguish between catego-ry of evidence and strength of the associated recommenda-tion. It was possible to have methodologically sound (Class1) evidence about an area of practice that was clinicallyirrelevant or had such a small effect that it was of little prac-tical importance and would, therefore, attract a lowerstrength of recommendation. More commonly, a statementof evidence would only cover one part of an area in which arecommendation had to be made or would cover it in a waythat conflicted with other evidence. Therefore, to producecomprehensive recommendations, the Panel had to extrapo-late from the available evidence. This may lead to weakerlevels of recommendation (B, C, or D) based on evidenceClass I statements.33 This is inevitably a subjective process.
It was accepted that there would be areas without evi-dence where recommendations should be made and thatconsensus would be required to address such areas. For anumber of the interventions, there was not sufficient evi-dence to make recommendations and “Comment” sectionswere written. Throughout the guideline developmentprocess, the Panel identified important unanswered researchquestions that are listed in the “Research Agenda” section atthe end of this guideline.
ASSESSMENT OF PERSONS WHO HAVE FALLENOR ARE AT RISK OF FALLING
General PrinciplesIt is a fundamental tenet of this guideline, based on a
number of controlled studies, that detecting a history of fallsand performing a fall-related assessment are likely to reducefuture probability of falls when coupled with intervention(see Interventions to Prevent Falls, below). Because of thisdependence of the assessment on subsequent interventionfor effectiveness, it was more difficult to ascribe strength ofrecommendation to assessment recommendations alone.Therefore, specific recommendations for assessment havebeen left ungraded. Likewise, prior to any intervention,assessment of an individual’s risks and deficits is required todetermine specific needs and, if necessary, to deliver target-ed interventions.
(2)
Table 1. Results of Univariate Analysis* of MostCommon Risk Factors for Falls Identified in 16Studies* That Examined Risk factors.
MeanRisk Factor Significant/Total† RR-OR†† Range
Muscle weakness 10/11 4.4 1.5-10.3History of falls 12/13 3.0 1.7-7.0Gait deficit 10/12 2.9 1.3-5.6Balance deficit 8/11 2.9 1.6-5.4Use assisstive device 8/8 2.6 1.2-4.6Visual deficit 6/12 2.5 1.6-3.5Arthritis 3/7 2.4 1.9-2.9Impaired ADL 8/9 2.3 1.5-3.1Depression 3/6 2.2 1.7-2.5Cognitive impairment 4/11 1.8 1.0-2.3Age >80 years 5/8 1.7 1.1-2.5
*References: 3,5, 19-31.†Number of studies with significant odds ratio or relative risk ratio in univariateanalysis/total number of studies that included each factor.††Relative risk ratios (RR) calculated for prospective studies. Odds ratio (OR) calculated for retrospective studies.ADL = activities of daily living
© BIODEX MEDICAL SYSTEMS, INC. 4-5
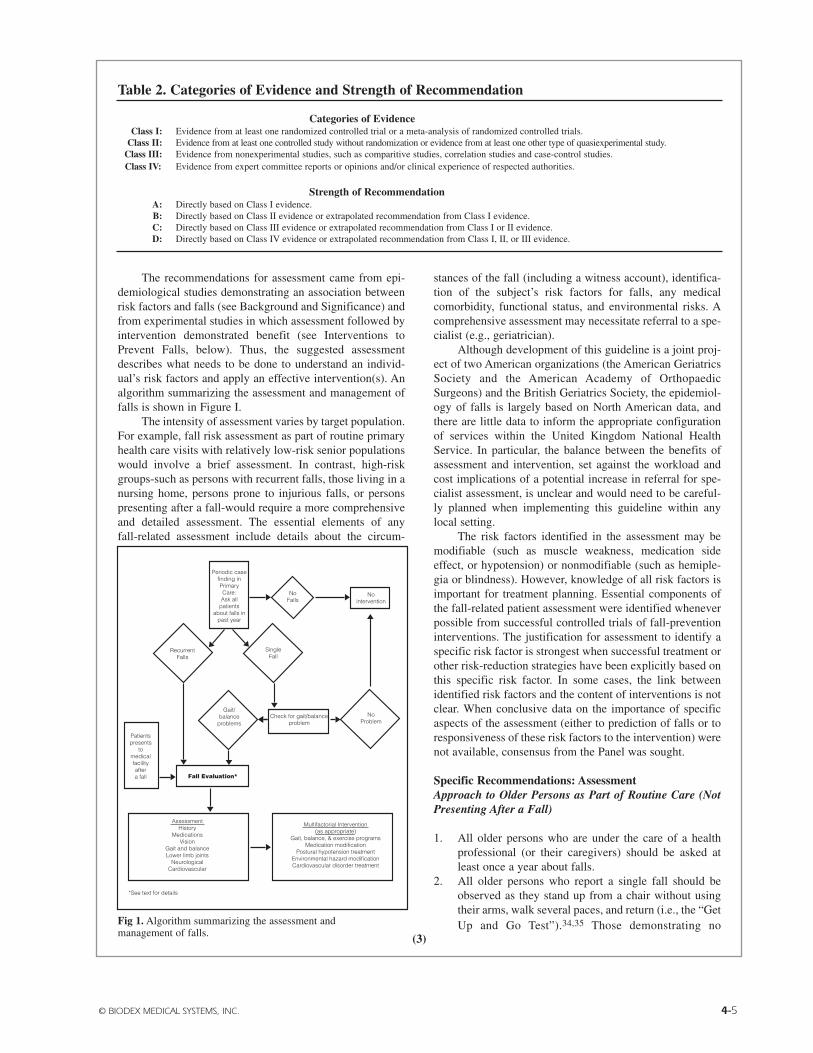
The recommendations for assessment came from epi-demiological studies demonstrating an association betweenrisk factors and falls (see Background and Significance) andfrom experimental studies in which assessment followed byintervention demonstrated benefit (see Interventions toPrevent Falls, below). Thus, the suggested assessmentdescribes what needs to be done to understand an individ-ual’s risk factors and apply an effective intervention(s). Analgorithm summarizing the assessment and management offalls is shown in Figure I.
The intensity of assessment varies by target population.For example, fall risk assessment as part of routine primaryhealth care visits with relatively low-risk senior populationswould involve a brief assessment. In contrast, high-riskgroups-such as persons with recurrent falls, those living in anursing home, persons prone to injurious falls, or personspresenting after a fall-would require a more comprehensiveand detailed assessment. The essential elements of anyfall-related assessment include details about the circum-
stances of the fall (including a witness account), identifica-tion of the subject’s risk factors for falls, any medicalcomorbidity, functional status, and environmental risks. Acomprehensive assessment may necessitate referral to a spe-cialist (e.g., geriatrician).
Although development of this guideline is a joint proj-ect of two American organizations (the American GeriatricsSociety and the American Academy of OrthopaedicSurgeons) and the British Geriatrics Society, the epidemiol-ogy of falls is largely based on North American data, andthere are little data to inform the appropriate configurationof services within the United Kingdom National HealthService. In particular, the balance between the benefits ofassessment and intervention, set against the workload andcost implications of a potential increase in referral for spe-cialist assessment, is unclear and would need to be careful-ly planned when implementing this guideline within anylocal setting.
The risk factors identified in the assessment may bemodifiable (such as muscle weakness, medication sideeffect, or hypotension) or nonmodifiable (such as hemiple-gia or blindness). However, knowledge of all risk factors isimportant for treatment planning. Essential components ofthe fall-related patient assessment were identified wheneverpossible from successful controlled trials of fall-preventioninterventions. The justification for assessment to identify aspecific risk factor is strongest when successful treatment orother risk-reduction strategies have been explicitly based onthis specific risk factor. In some cases, the link betweenidentified risk factors and the content of interventions is notclear. When conclusive data on the importance of specificaspects of the assessment (either to prediction of falls or toresponsiveness of these risk factors to the intervention) werenot available, consensus from the Panel was sought.
Specific Recommendations: AssessmentApproach to Older Persons as Part of Routine Care (NotPresenting After a Fall)
1. All older persons who are under the care of a health professional (or their caregivers) should be asked at least once a year about falls.
2. All older persons who report a single fall should be observed as they stand up from a chair without using their arms, walk several paces, and return (i.e., the “GetUp and Go Test”).34,35 Those demonstrating no Fig 1. Algorithm summarizing the assessment and
management of falls.
Periodic case finding in Primary Care: Ask all
patients about falls in
past year
Patients presents
to medical facility after a fall
Recurrent Falls
Gait/ balance
problems
No Problem
Check for gait/balance problem
Single Fall
No intervention
No Falls
Fall Evaluation*
Assessment History
Medications Vision
Gait and balance Lower limb joints
Neurological Cardiovascular
Multifactorial Intervention (as appropriate)
Gait, balance, & exercise programs Medication modification
Postural hypotension treatment Environmental hazard modification Cardiovascular disorder treatment
*See text for details
Table 2. Categories of Evidence and Strength of Recommendation
Categories of EvidenceClass I: Evidence from at least one randomized controlled trial or a meta-analysis of randomized controlled trials.
Class II: Evidence from at least one controlled study without randomization or evidence from at least one other type of quasiexperimental study.Class III: Evidence from nonexperimental studies, such as comparitive studies, correlation studies and case-control studies.Class IV: Evidence from expert committee reports or opinions and/or clinical experience of respected authorities.
Strength of RecommendationA: Directly based on Class I evidence.B: Directly based on Class II evidence or extrapolated recommendation from Class I evidence.C: Directly based on Class III evidence or extrapolated recommendation from Class I or II evidence.D: Directly based on Class IV evidence or extrapolated recommendation from Class I, II, or III evidence.
(3)
4-6 GUIDELINE FOR THE PREVENTION OF FALLS IN OLDER PERSONS
difficulty or unsteadiness need no further assessment.3. Persons who have difficulty or demonstrate
unsteadiness performing this test require further assessment.
Approach to Older Persons Presenting with One or MoreFalls or, Have Abnormalities of Gait and/or Balance, orWho Report Recurrent Falls
1. Older persons who present for medical attention because of a fall, report recurrent falls in the past year, or demonstrate abnormalities of gait and/or balance should have a fall evaluation performed. This evaluation should be performed by a clinician with appropriate skills and experience, which may necessitate referral to a specialist (e.g., geriatrician).
2. A fall evaluation is defined as an assessment that includes the following: a history of fall circumstances, medications, acute or chronic medical problems, and mobility levels; an examination of vision, gait and balance, and lower extremity joint function; an examination of basic neurological function, including mental status, muscle strength, lower extremity periph-eral nerves, proprioception, reflexes, tests of cortical, extrapyramidal, and cerebellar function; and assessment of basic cardiovascular status including heart rate and rhythm, postural pulse and blood pressure and, if appropriate, heart rate and blood pressure responses to carotid sinus stimulation.
INTERVENTIONS TO PREVENT FALLS
General PrinciplesThe literature identified for this part of the guideline
was heterogeneous across most dimensions. This hetero-geneity precluded the use of meta-analytic techniques anddictated the use of narrative summary. Again, the Panelidentified and synthesized relevant published evidenceaccording to the grading criteria shown in Table 2.
The populations included in the studies varied from fitolder persons who had not fallen, those at risk for falls, andthose experiencing single or frequent falls. The cognitivestatus of the study population was not reported consistently.Study environments included community settings (themajority), long-term care facilities, and acute hospital units.The method of reporting the effect of interventions on fallsalso varied across studies. The system used most commonlyreported the total number of falls during a given interval fol-lowing randomization. Other methods included reportingthe number of fallers or the time to the first fall event.Evidence for compliance with the intervention(s) was notalways reported. Methods for documenting fall outcomesalso varied. The most frequently used method was calen-dar/diary cards. other methods included telephone or per-sonal interviews.
Most studies evaluating multifactorial interventionswere conducted in community settings. The individual ele-ments of the interventions were described inconsistentlyand, as a consequence of the study designs, it was not pos-sible to determine which components were effective.
However, by examining at the components of studies withand without an overall positive effect, it was possible toidentify specific interventions that were used more com-monly in positive studies. The multifactorial interventionstudies were considered for the different settings in whichparticipants resided: community-based, long-term care, andin hospital studies.
The intervention strategies that were evaluated for theireffectiveness in preventing falls were classified as single ormultifactorial strategies and as generic or individuallydesigned. The recommendations are presented for multifac-torial interventions followed by single interventions becausethis sequence reflects the underlying evidence.
Specific Recommendations: Multifactorial Interventions
1. Among community-dwelling older persons (i.e., those living in their own homes), multifactorial interventions should include: gait training and advice on the appropriate use of assistive devices (B); review and modification of medication, especially psychotropic medication (B); exercise programs, with balance training as one of the components (B); treatment of postural hypotension (B); modification of environmental hazards (C); and treatment of cardiovascular disorders, including cardiac arrhythmias (D).
2. In long-term care and assisted living settings,multifactorial interventions should include: staff education programs (B); gait training and advice on the appropriate use of assistive devices (B); and reviewand modification of medications, especially psychotropic medications (B).
3. The evidence is insufficient to make recommendations for or against multifactorial interventions in acute hospital settings.
Community-Based StudiesThere were 11 randomized controlled studies of com-
munity-dwelling older adults.36-46 The elements of the mul-tifactorial interventions included education programs, selfmanagement programs, home environment modifications,advice about medication use (with or without subsequentmodification of medications), exercise, medical assessment,and management of cardiovascular disorders (such as pos-tural hypotension and carotid sinus syndrome).
Reductions in the number and dosages of prescribedmedications were associated with benefit in all three studiesthat included this intervention (Class I).36,37,43 However,medication review without subsequent direct efforts to mod-ify medications was of no benefit in three38,39,45 of four 46
studies (Class I).Exercise programs were associated with benefit in all
three studies that included this intervention (Class I).36,41,43
Medical assessment followed by specific interventionsfor any medical problems that were identified (includingcardiovascular disorders and visual problems) was benefi-cial in one study (Class I).37 Referral for medical assessmentwas of benefit in two37,46 of three 45 studies (Class I). In addi-
(4)

© BIODEX MEDICAL SYSTEMS, INC. 4-7
tion, the management of postural hypotension was part of theeffective intervention in two studies (Class I).37,44
Evidence of benefit from modification of home envi-ronmental hazards was equivocal in one43 study and of nobenefit in a second45 (Class I).
Staff education programs were not effective in reduc-ing falls (Class I).38 Self-management programs were notbeneficial in the five studies in which they were reported(Class I).38-41,45
Advice alone about fall risk factor modification (with-out measures to implement recommended changes) was ofequivocal benefit in three37,41,46 and of no benefit intwo39,40 studies (Class I).
Long-Term Care-Based StudiesThere were two randomized controlled studies in
long-term care settings.47,48 Both showed overall benefitfrom multifactorial interventions, although only one 47 studydocumented significant reductions in subsequent falls. (ClassI). The effective components appeared to be comprehensiveassessment, staff education (in contrast to community set-tings), assistive devices, and reduction of medications.
In-Hospital-Based StudiesAlthough the strategy is widely implemented, there
are no adequate randomized controlled trials of multifactorial intervention studies to reduce falls among hospital inpatients.49
Specific Recommendations: Single Intervention
Exercise1. Although exercise has many proven benefits, the
optimal type, duration and intensity of exercise for falls prevention remain unclear (B).
2. Older people who have had recurrent falls should be offered long-term exercise and balance training (B).
3. Tai Chi C’uan is a promising type of balance exercise, although it requires further evaluation before it can be recommended as the preferred balance training (C).
The Panel made a number of general observationsabout exercise. There is good evidence of benefit from exer-cise in falls prevention. However, the Panel was unable todetermine which configuration of exercise program to rec-ommend. The Panel identified a number of key findings: theevidence is strongest for balance training; there is less evi-dence for resistance and aerobic training; there are little dataregarding the intensity or type of exercise. Successful pro-grams have consistently been over 10 weeks duration.
Exercise needs to be sustained for sustained benefit.There is only preliminary evidence to support the use of TaiChi C’uan. There is a dearth of studies involving men. Inlong-term care settings, there is no evidence of benefit forexercise alone.
Among relatively healthy, community-dwelling olderpeople, a program of very intensive strength and endurancetraining reduced the risk of subsequent falls and the propor-
tion of fallers (Class I).50 In another study involving com-munity-dwelling women, there was no evidence that ageneric exercise program reduced falls (Class I).51 In youngelderly, community-dwelling women, frequent low-impactweight-bearing exercises, and calcium supplementationover a 2-year period did not significantly reduce falls (ClassI).52 In community-dwelling older women, individuallydesigned exercise programs in the home that incorporatedstrength and balance training reduced both falls and injuries;for those who continued to exercise, the benefits were evi-dent after a 2-year period (Class I).53 In the Frailty andInjuries: Cooperative Studies of Intervention Techniques(FICSIT) meta-analysis of seven studies that featured exer-cise as a prominent part of multifactorial interventions, therewas an overall significant reduction in falls among interven-tion subjects, although only three of the seven individual tri-als showed significant reductions (Class I).54 In a random-ized trial of a group exercise program held thrice weekly forfall-prone older men, there was improvement in strength,endurance, gait, and function as well as reduced fall ratesadjusted for increased levels of activity (Class I).55
In community-dwelling women at moderate risk offalls, Tai Chi C’uan reduced the rate of falls during a shortfollow-up period of 4 months (Class I).56 In the same popu-lation, a computerized balance training program did notreduce falls (Class I).56
Among older women who had recurrent falls, a courseof physical therapy targeting strength and balance was effec-tive in reducing falls,57 while a community-based genericexercise program in older men was of no benefit in fallsreduction (Class I).55,58 An individually designed exerciseprogram for nursing home patients with moderate dementiadid not reduce falls (Class I).59
Environmental Modification1. When older patients at increased risk of falls are
discharged from the hospital, a facilitated environmentalhome assessment should be considered (B).
In a subgroup of older patients, a facilitated home mod-ification program after hospital discharge was effective inreducing falls (Class I).60 Otherwise, modification of homeenvironment without other components of multifactorialintervention was not beneficial (Class I).61-65
Medications1. Patients who have fallen should have their medications
reviewed and altered or stopped as appropriate in light of their risk of future falls. Particular attention to medication reduction should be given to older persons taking four or more medications and to those taking psychotropic medications. (C)
For all settings (i.e., community, long-term care, hospi-tal, and rehabilitation), there is a consistent associationbetween psychotropic medication use (i.e., neuroleptics,benzodiazepines, and antidepressants) and falls. Althoughthere are no randomized controlled studies of manipulation
(5)

4-8 GUIDELINE FOR THE PREVENTION OF FALLS IN OLDER PERSONS
of medication as a sole intervention, reduction of medica-tions was a prominent component of effective fall reducinginterventions in community-based and long-term care mul-tifactorial studies (Class I).36,37,43,46,47 Multifactorial stud-ies suggest that a reduction in the number of medications inpatients who are taking more than four preparations is ben-eficial. There is no clear difference in the risk for fallsbetween long- and short-acting benzodiazepines (ClassII).32 Compliance with intervention needs to be sustained tobe effective.
Assistive Devices1. Studies of multifactorial interventions that have
included assistive devices (including bed alarms, canes, walkers (Zimmer frames), and hip protectors) have demonstrated benefit. However, there is no direct evidence that the use of assistive devices alone will prevent falls. Therefore, while assistive devices may be effective elements of a multifactorial intervention program, their isolated use without attention to other risk factors cannot be recommended (C).
There are few studies evaluating the effect of assistivedevices (such as canes and walkers) as an intervention forpreventing falls (Class IV).66 Among hospitalized patientsthere is insufficient evidence for or against the use of bedalarms (Class I).67
Hip protectors do not appear to affect the risk of falling(Class I).68 However, there are a number of studies, includingthree randomized trials, that strongly support the use of hipprotectors for prevention of hip fractures in high-risk individ-uals. The Panel refers the reader to the published guidelineson the treatment and prevention of osteoporosis.69,70
Behavioral and Educational Programs1. Although studies of multifactorial interventions that
have included behavioral and educational programs have demonstrated benefit, when used as an isolated intervention, health or behavioral education does not reduce falls and should not be done in isolation (B).
A structured group educational program among com-munity-dwelling older people did not reduce the number offalls but did achieve short-term benefits in attitudes andself-efficacy (Class I).71 Practice guidelines in the emer-gency department did not alter documentation of falls riskfactors, causes of falls, consequences of falls, or the imple-mentation of practice guidelines (Class I).72,73
Comments on Other Potential Interventions
Bone Strengthening MedicationsA number of medications used widely to prevent or treat
osteoporosis (e.g., hormone replacement therapy (HRT), cal-cium, vitamin D, antiresorptive agents) reduce fracture rates.However, these agents do not reduce rates of falls per se.Given the wealth of information concerning HRT and vitaminD in osteoporotic fractures, including ample prior analysis
and practice guidelines, the Panel refers the reader to pub-lished guidelines on HRT for osteoporosis.69,70,74
Cardiovascular InterventionThere is emerging evidence that some falls have a car-
diovascular cause that may be amenable to interventionstrategies often directed to syncope, such as medicationchange or cardiac pacing. The role of these cardiac investi-gations and treatments is not yet clear.
Case series report an overlap of symptoms of falls andsyncope and a causal association between some cardiovas-cular disorders and falls, particularly orthostatic hypoten-sion carotid sinus syndrome, and vasovagal syndrome.75-80
In particular, up to 30% of older patients with carotid sinussyndrome present with falls and have amnesia for loss ofconsciousness when bradyarrhythmia is induced experimen-tally.81,82 Preliminary studies suggest that patients withrecurrent unexplained falls and a bradycardiac response tocarotid sinus stimulation experience fewer falls afterimplantation of a permanent cardiac pacemaker. However,pending the results of an ongoing randomized trial, pace-maker therapy for the treatment of recurrent falls cannot berecommended at this time.
Visual InterventionPatients should be asked about their vision and if they
report problems, their vision should be formally assessed,and any remediable visual abnormalities should be treated.
There are no randomized controlled studies of inter-ventions for individual visual problems despite a significantrelationship between falls, fractures, and visual acuity.83
Fall-related hip fractures were higher in patients with visualimpairment.84 Visual factors associated with two or morefalls included poor visual acuity, reduced contrast sensitivi-ty, decreased visual field, posterior subcapsular cataract, andnonmiotic glaucoma medication.83-85
Footwear InterventionsBecause there are no experimental studies of footwear
examining falls as an outcome, the Panel is not able to rec-ommend specific footwear changes to reduce falls.However, some trials report improvement in intermediateoutcomes, such as balance and sway from specific footwearintervention. In women, results of functional reach andtimed mobility tests were better when subjects wore walkingshoes than when they were barefoot.86 Static and dynamicbalance were better in low-heeled rather than high-heeledshoes or than the patient’s own footwear.87 In men, footposition awareness and stability were best with high midsolehardness and low mid-sole thickness.88 Static balance wasbest in hard-soled (low resistance) shoes.89
RestraintsThe Panel found no evidence to support restraint use
for falls prevention. Restraints have been traditionally usedas a falls prevention approach. However, they have major,serious drawbacks and can contribute to serious injuries.There is no experimental evidence that widespread use of
(6)

© BIODEX MEDICAL SYSTEMS, INC. 4-9
restraints or, conversely, the removal of restraints, willreduce falls.90-93
RESEARCH AGENDAIn the process of developing these guidelines, the Panel
identified a number of issues related to falls prevention thatit believes should be given high priority for future researchand analysis. The Panel believes that further research will benecessary to gather sufficient evidence that will lead tomeaningful conclusions about the following concerns:1. What is the cost effectiveness of recommended strategies?2. Can fall-prone individuals be risk stratified in terms
of whom will most benefit from assessmentand interventions?
3. What are the effective elements for falls prevention among hospital inpatients?
4. How can falls best be prevented in patients with cognitive impairment and dementia?
5. What are the effective elements of exercise programs (such as type, duration, intensity, and frequency)?
6. What are the effective elements of cardiovascular programs for fall prevention?
7. For whom and when is home assessment by anoccupational therapist or other home carespecialist effective?
8. What is the effectiveness of assistive devices (e.g., canes and walkers/Zimmer frames) used alone as a strategy for preventing falls?
9. What is the effect of restraint removal, coupled with other specific interventions, on falls and serious injuries?
10. Does treatment of visual problems prevent falls?11. What is the safest footwear for people who have fallen
or are at risk of falling?12. What is the role of hip protectors in persons who have
fallen or are at risk of falling and what are the most effective designs?
ACKNOWLEDGMENTSThe Panel on Falls Prevention was co-chaired by
Laurence Z. Rubenstein, MD, MPH, FACP, UCLA Schoolof Medicine, Sepulveda VA GRECC, Los Angeles, CA,USA (American Geriatrics Society) and Rose Anne Kenny,MD, FRCPI, FRCP, Institute for Health of the Elderly,University of Newcastle upon Tyne, UK (British GeriatricsSociety). The Vice Chair of the Panel was Kenneth J. Koval,MD, Hospital for Joint Diseases, New York, NY, USA(American Academy of Orthopaedic Surgeons). The pri-mary authors of the Guideline for the Prevention of Falls inOlder Persons are Rose Anne Kenny, MD, FRCPI, FRCP;Laurence Z. Rubenstein, MD, MPH, FACP; Finbarr C.Martin, MD, FRCP, Medicine and Elderly Care, Guy’s andSt. Thomas Hospitals Trust, London, UK; and Mary E.Tinetti, MD, Yale University School of Medicine, NewHaven, CT, USA.
The remaining members of the panel are: David F.Apple Jr., MD, Shepherd Center, Atlanta, GA, USA; JudithAnne Cantrill, BSc, MSc, FpharmS, School of Pharmacyand Pharmaceutical Sciences, University of ManchesterManchester, UK; John T. Chang, MD, MPH, Division of
General Internal Medicine and Health Services Research,UCLA School of Medicine, Los Angeles, CA, USA; PamelaW. Duncan, PhD, PT, Kansas University Medical Center onAging, Kansas City, KS, USA; Margaret Ellis, PhD, OT,West Square Associates, London, UK; Teresita Hogan, MD,FACEP, Emergency Medicine, Resurrection MedicalCenter, Chicago, IL, USA; Kenneth J. Koval, MD, Hospitalfor Joint Diseases, New York, NY, USA; Lewis A. Lipsitz,MD, Harvard Medical School, Beth Israel DeaconessMedical Center, Hebrew Rehabilitation Center for the Aged,Boston, MA, USA; Michael W. Rich, MD, CardiovascularDivision, Washington University School of Medicine, St.Louis, MO, USA; Neville E. Strumpf, RN, PhD, FAAN,University of Pennsylvania School of Nursing, Philadelphia,PA, USA; William Angus Wallace, MB, ChB, FRCS,FRCSEd, Orthopaedic and Accident Surgery, QueensMedical Centre, University of Nottingham, UK; and ArchieYoung, MD, FRCP, Department of Clinical and SurgicalSciences, University of Edinburgh, UK.
Research services were provided by Sue Radcliff,Independent Researcher, Denver, CO, USA. Editorial serv-ices were provided by Janet L. Tremaine, ELS, TremaineMedical Communications, Dublin, OH, USA. Additionalresearch and administrative support were provided byAdrienne Prassas, Mary Flum, and Nancy Lundebjerg,Professional Education and Publications, AmericanGeriatrics Society, New York, NY, USA.
The following organizations with special interest andexpertise in the management of falls in older persons pro-vided peer review of a preliminary draft of this guideline:American College of Cardiology, American Academy ofOphthalmology, American Academy of Otolaryngology,American Academy of Physical Medicine & Rehabilitation,American College of Emergency Physicians, AmericanPhysical Therapy Association, British Association ofAccident and Emergency Medicine, College ofOccupational Therapists (UK), National GerontologicalNurses Association, Royal College of General Practitioners,Royal College of Physicians in London (England andWales), Royal College of Nursing-Older Peoples Section,and the Society for Academic Emergency Medicine.
The guideline was a joint project of the AmericanGeriatrics Society (AGS), the British Geriatrics Society(BGS), and the American Academy of Orthopedic Surgeons(AAOS). Funding was provided as unrestricted educationalgrants from Medtronic, Inc. (Minneapolis, MN, USA) andShire Pharmaceuticals (Richwood, KY, USA). We are verygrateful to Professor Gene Feder, Department of GeneralPractice and Primary Care, St. Bartholomew’s and the RoyalLondon School of Medicine and Dentistry, London, UK, forsharing a draft copy of his falls guideline with the Panel.
(7)

4-10 GUIDELINE FOR THE PREVENTION OF FALLS IN OLDER PERSONS
REFERENCES
1. Brown AP. Reducing falls in elderly people: A review of exerciseinterventions. Physiother Theory Pract 1999;15:59-68.
2. Nevitt MC. Falls in the elderly: Risk factors and prevention. In:Masdeu JC, Sudarsky L, Wolfson L, eds. Gait Disorders of Aging:Falls and Therapeutic Strategies. Philadelphia: Lippincott-Raven,1997, pp 13-36.
3. Robbins AS, Rubenstein LZ, Josephson KR et at. Predictors of fallsamong elderly people. Results of two population-based studies. Arch Intern Med 1989;149:1628-1633.
4. Rubenstein LZ, Josephson KR, Robbins AS. Falls in the nursing home.Ann Intern Med 1994; 121:442-451.
5. Tenetti ME, Williams TF, Mayewski R. Fall risk index for elderlypatients based on number of chronic disabilities. Am J Med1986;80:429-434.
6. Fleming BE, Pendergast DR. Physical condition, activity pattern, andenvironment as factors in falls by adult care facility residents. ArchPhys Med Rehabil 1993;74:627-630.
7. Cumming RG, Kelsey JL, Nevitt MC. Methodologic issues in the studyof frequent and recurrent health problems. Falls in the elderly. AnnEpidemiol 1990;1:49-56.
8. Cummings SR, Nevitt MC, Kidd S. Forgetting falls: The limited accu-racy of recall of falls in the elderly. J Am Geriatr Soc 1988;36:613-616.
9. Jarrett PG, Rockwood K, Carver D et al. Illness presentation in elder-ly patients. Arch Intern Med 1995; 155:1060-1064.
10. Campbell AJ, Spears GF, Borrie MJ. Examination by logistic regression modelling of the variables which increase the relative risk ofelderly women falling compared to elderly men. J Clin Epidemiol1990;43:1415-1420.
11. Rubenstein LZ, Josephson KR. The epidemiology of falls and syncope. In:Kenny RA, O'Shea D, eds. Falls and Syncope in ElderlyPatients. Clinics in Geriatric Medicine. Philadelphia: W. B. SaundersCo., (In press) 2002.
12. Rubenstein LZ, Powers C. Falls and mobility problems: Potential qual-ity indicators and literature review (the ACOVE Project). SantaMonica, CA: RAND Corporation, 1999, pp 1-40.
13. Bernstein AB, Schur CL. Expenditures for unintentional injuriesamong the elderly. J Aging Health 1990;2:157-178.
14. Bezon J, Echevarria KH, Smith GB. Nursing outcome indicator:Preventing falls for elderly people. Outcomes Manag Nuts Pract1999;3:112-116.
15. Josephson KR, Fabacher DA, Rubenstein LZ. Home safety and fallprevention. Clin Geriatr Med 1991;7:707-731.
16. Donald IP, Bulpitt CJ. The prognosis of falls in elderly people living athome. Age Ageing 1999;28:121-125.
17. Grisso JA, Schwarz DF, Wolfson V et al. The impact of falls in aninner-city African-American population. J Am Geriatr Soc1992;40:673-678.
18. Clark RD, Lord SR, Webster IW. Clinical parameters associated withfalls in an elderly population. Gerontology 1993;39:117-123.
19. Berg WP, Alessio HM, Mills EM et al. Circumstances and consequences of falls in independent community-dwelling older adults.Age Ageing 1997;26:261-268.
20. Campbell AJ, Bottle MJ, Spears GF. Risk factors for falls in a community based prospective study of people 70 years and older. JGerontol 1989;44: M112-M117.
21. Davis JW, Ross PD, Nevitt IMC et al. Risk factors for falls and for seri-ous injuries on falling among older Japanese women in Hawaii. J Am Geriatr Soc 1999;47:792-798.
22. Kiely DK, Kiel DP, Burrows AB et al. Identifying nursing home resi-dents at risk for falling. J Am Geriatr Soc 1998;46:551-555.
23. Lipsitz LA, Jonsson PV, Kelley MM et al. Causes and correlates ofrecurrent falls in ambulatory frail elderly. J Gerontol 1991;46:M114-M122.
24. Luukinen H, Koski K, Laippala P et al. Risk factors for recurrent fallsin the elderly in long-term institutional care. Public Health1995;109:57-65.
25. Mahoney J, Sager M, Dunham NC et al. Risk of falls after hospital dis-charge. J Am Geriatr Soc 1994;42:269-274.
26. Myers AH, Baker SP, VanNatta ML et al. Risk factors associated withfalls and injuries among elderly institutionalized persons. Am JEpidemiol 1991;133:1179-1190.
27. Nevitt MC, Cummings SR, Kidd S et al. Risk factors for recurrent non-
syncopal falls. A prospective study. JAMA 1989;261:2663-2668.28. Oliver D, Britton M, Seed P et al. Development and evaluation of evi-
dence based risk assessment tool (STRATIFY) to predict which elder-ly inpatients will fall: Case-control and cohort studies. BMJ1997;315:1049-1053.
29. Thapa PB, Gideon P, Fought RL et al. Psychotropic drugs and risk ofrecurrent falls in ambulatory nursing home residents. Am J Epidemiol1995;142:202-211.
30. Tinetti ME, Specchley M, Ginter SF. Risk factors for falls amon-gelderly persons living in the community. N Engl J Med 1988;319:1701-1707.
31. Vellas BJ, Wayne SJ, Garry PJ et al. A two year longitudinal study offalls in 482 community-dwelling elderly adults. J Gerontol A Biol Sci Med Sci 1998;53A:M264-M274.
32. Leipzig RM, Cumming RG, Tinetti ME, Drugs and falls in older peo-ple: A systematic review and meta-analysis; I. Psychotropic drugs. JAm Geriatr Soc 1999;47:30-39.
33. Shekelle PG, Woolf SH, Eccles M et al. Developing guidelines. BMJ1999;318:593-596.
34. Mathias S, Nayak US, Isaacs B. Balance in elderly patients; The "get-up and go" test. Arch Phys Med Rehabil 1986;67:387-389.
35. Podsiadlo D, Richardson S. The timed "Up & Go": A test of basic func-tional mobility for frail elderly persons. J Am Geriatr Soc 1991;39:142-148.
36. Campbell AJ, Robertson MC, Gardner MM et al. Psychotropic med-ication withdrawal and a home-based exercise program to preventfalls: A randomized controlled trial. J Am Geriatr Soc 1999;47:850-853.
37. Close J, Ellis IM, Hooper R et al. Prevention of falls in the elderly trial(PROFET): A randomized controlled trial. Lancer 1999;353:93-97.
38. Coleman EA, Grothaus LC, Sandhu N et al. Chronic care clinics: Arandomized controlled trial of a new model of primary care for frailolder adults. J Am Geriatr Soc 1999;47:775-783.
39. Gallagher EM, Brunt H. Head over heels: Impact of a health promotionprogram to reduce falls in the elderly. Can J Aging 1996;15:84-96.
40. Hornbrook MC, Stevens VJ, Wingfield DJ et al. Preventing fallsamong community-dwelling older persons: Results from a randomizedtrial. Gerontologist 1994;34:16-23.
41. Steinberg M, Cartwright C, Peel N et al. A sustainable programme toprevent falls and near falls in community dwelling older people:Results of a randomized trial. J Epidemiol Community Health2000;54:227-232.
42. Stevens VJ, Hornbrook MC, Wingfield DJ et al. Design and imple-mentation of a falls prevention intervention for community-dwellingolder persons. Behav Health Aging 1992;2:57-73.
43. Tinetti ME, Baker DI, McAvay G et al. A multifactorial intervention tointroduce the risk of falling among elderly people living in the com-munity. N Err J Med 1994;331:821-827.
44. Tinetti ME, McAvay G, Claus E. Does multiple risk factor reductionexplain the reduction of fall rate in the Yale FICSIT trial? Am JEpidemiol 1996;144:389-399.
45. Vetter NJ, Lewis PA, Ford D. Can health visitors prevent fractures inelderly people? BMJ 1992;304:888-890.
46. Wagner EH, LaCroix AZ, Grothaus L et al. Preventing disability andfalls in older adults: a population-based randomized trial. Am J PublicHealth 1994; 84:1800-1806.
47. Ray WA, Taylor JA, Meador KG et al. A randomized trial of a consultation service to reduce falls in nursing homes. JAMA1997;278:557-562.
48. Rubenstein LZ, Robbins AS, Josephson KR et al. The value of assessing falls in an elderly population. Ann Intern Med 1990;113:308-316.
49. Oliver D, Hopper A, Seed P. Do hospital fall prevention programswork? A systematic review. J Am Geriatr Soc 2000;48:1679-1689.
50. Buchner DM, Cress ME, deLateur BJ et al. The effect of strength andendurance training on gait, balance, fall risk, and health services use incommunity-living older adults. J Gerontol A Biol Sci Med Scil997;52A:M218-M224.
51. Lord SR, Ward JA, Williams P et al. The effect of a 12-month exercise trial on balance, strength, and falls in older women: A ran-domized controlled trial. J Am Geriatr Soc 1995;43:1198-1206.
52. McMurdo ME, Mole PA, Paterson CR. Controlled trial of weight bear-ing exercise in older women in relation to bone density and falls. BMJ1997;314:569.
(8)
© BIODEX MEDICAL SYSTEMS, INC. 4-11
53. Campbell AJ, Robertson MC, Gardner MM et al. Falls prevention overyears: A randomized controlled trial in women 80 years and older. AgeAgeing 1999;28:513-518.
54. Province MA, Hadley EC, Hornbrook MC et al. The effects of exercise of falls in elderly patients: A preplanned meta-analysis of theFICSIT trials. Frailty and Injuries: Cooperative Studies of InterventionTechniques. JAIMA 1995;273:1341-1347.
55. Rubenstein LZ, Josephson KR, Trueblood PR et al. Effects of a groupexercise program on strength, mobility and falls among fall-prone eld-erly men. J Gerontol A Biol Sci Med Sci 2000;55A:M317-M321.
56. Wolf SL, Barnhart HX, Kutner NG et al. Reducing frailty and falls in olderpersons: an investigation of Tai Chi and computerized balance training.Atlanta FICSIT Group. Frailty and Injuries: Cooperative Studies ofIntervention Techniques. J Am Geriatr Soc 1996;44:489-497.
57. McMurdo ME, Millar AM, Daly F. A randomized controlled trial of fallprevention strategies in old peoples' homes. Gerontology 2000;46:83-87.
58. Means KM, Rodell DE, O'Sullivan PS et al. Rehabilitation of elderlyfallers: Pilot study of a low to moderate intensity exercise program.Arch Phys Med Rehabil 1996;77:1030-1036.
59. Mulrow CD, Gerety MB, Kanten D et al. A randomized trial of physi-cal rehabilitation for very frail nursing home residents. JAMA1994;271:519-524.
60. Cumming RG, Thomas M, Szonyi G et al. Home visits by an occupa-tional therapist for assessment and modification of environmental haz-ards: A randomized trial of falls prevention. J Am Geriatr Soc1999;47:1397-1402.
61. Northridge ME, Nevitt MC, Kelsey JL et al. Home hazards and falls inthe elderly: The role of health and functional status. Am J Public Health1995;85:509-515.
62. Plautz B, Beck DE, Selmar C et al. Modifying the environment: Acommunity-based injury-reduction program for elderly residents, Am JPrev Med 1996;12:33-38.
63. Sattin RW, Rodriguez JG, DeVito CA et al. Home environmental haz-ards and the risk of fall injury events among community-dwelling olderpersons. Study to Assess Falls among the Elderly (SAFE) Group. J AmGeriatr Soc 1998;46:669-676,
64. Thompson PG. Preventing falls in the elderly at home: A communitybased program. Med J Aust 1996;164:530-532.
65. Weber J, Kehoe T, Bakoss M et al. Safety at home: A practical homeinjury control program for independent seniors. Caring 1996;15:62-66.
66. Dean E, Ross J. Relationships among cane fitting, function, and falls.Phys Ther 1993;73:494-504.
67. Tideiksaar R, Feiner CF, Maby J. Falls prevention: The efficacy of abed alarm system in an acute care setting. Mt. Sinai J Med1993;60:522-527.
68. Kannus P, Parkkari J, Niemi S, et al. Prevention of hip fracture in eld-erly people with use of a hip protector. N Engl J Med 2000;343:1506-1513.
69. Royal College of Physicians. Osteoporosis-clinical guidelines for theprevention and treatment [On-line]. Available; http://www.open.gov.uk/doh/ osteop.htm, 1999.
70. Agency for Healthcare Research and Quality. Osteoporosis guidelines.National Guideline Clearinghouse [On-line]. Available:http://www.guideline.gov, 2000.
71. Tennstedt S, Howland J, Lachman M et al. A randomized, controlledtrial of a group intervention to reduce fear of falling and associatedactivity restriction in older adults. J Gerontol B Psychol Sci Soc Sci1998;53B:P384-P392.
72. Baraff LJ, Lee TJ, Kader S et al. Effect of a practice guideline on theprocess of emergency department care of falls in elder patients. AcadEmerg Med 1999;6:1216-1223.
73. Baraff LJ, Lee TJ, Kader S et al. Effect of a practice guideline for emer-gency department care of falls in elder patients on subsequent falls andhospitalizations for injuries. Acad Emerg Med 1999;6:1224-1231.
74. Agency for Healthcare Research and Quality. Hormone replacementtherapy guidelines. National Guideline Clearinghouse [On-line].Available: http:// www.guideline.gov, 2000.
75. Crilley JG, Herd B, Khurarna CS et al. Permanent cardiac pacing inelderly patients with recurrent falls, dizziness and syncope, and ahypersensitive cardioinhibitory reflex. Postgrad Med J1997;73:415-418.
76. Dey AB, Stout NR, Kenny RA. Cardiovascular syncope is the mostcommon cause of drop attacks in the elderly. Pacing ClinElectrophysiol 1997;20:818-819.
77. Gordon M, Huang M, Gryfe Cl. An evaluation of falls, syncope anddizziness by prolonged ambulatory cardiographic monitoring in a geri-atric institutional setting. J Am Geriatr Soc 1982;30:6-12.
78. Mclntosh S, DaCosta D, Kenny RA. Outcome of an integratedapproach to the investigation of dizziness, falls and syncope in elderlypatients referred to a ‘syncope’ clinic. Age Ageing 1993;22:53-58.
79. O’Mahony D, Foote C. Prospective evaluation of unexplained syn-cope, dizziness, and falls among community dwelling elderly adults. JGerontol A Biol Sci Med Sci 1998;53A:M435-M440.
80. Richardson DA, Bexton RS, Shaw FE et al. Prevalence of cardioin-hibitory carotid sinus hypersensitivity in patients 50 years or over pre-senting in the accident and emergency department with “unexplained”or “recurrent” falls. Pacing Clin Electrophysiol 1997;20:820-823.
81. Kenny RA, Traynor G. Carotid sinus syndrome-clinical characteristicsin elderly patients, Age Ageing 1991;20:449-454.
82. Parry SW, Richardson DA, O’Shea D et al. Diagnosis of carotid sinushypersensitivity in older adults: Carotid sinus massage in the uprightposition is essential. Heart 2000;83:22-23.
83. Jack Cl, Smith T, Neoh C et al. Prevalence of low vision in elderlypatients admitted to an acute geriatric unit in Liverpool: Elderly peoplewho fall are more likely to have low vision. Gerontology1995;41:280-285.
84. Glynn RJ, Seddon JIM, Krug JH et al. Falls in elderly patients withglaucoma. Arch Ophthalmol 1991;109:205-210.
85. Ivers RQ, Cumming RG, Mitchell P et al. Visual impairment and fallsin older adults: The Blue Mountains Eye Study. J Am Geriatr Soc1998;46:58-64.
86. Arnadottir SA, Mercer VS. Effects of footwear on measurements ofbalance and gait in women between the ages of 65 and 93 years. PhysTher 2000;80:17-27.
87. Lord SR, Bashford GM. Shoe characteristics and balance in olderwomen. J Am Geriatr Soc 1996;44:429-433.
88. Robbins S, Waked E, Allard P et al. Foot position awareness in youngerand older men: The influence of footwear sole properties. J Am GeriatrSoc 1997;45:61-66,
89. Robbins S, Waked E, Krouglicof N. Improving balance. J Am GeriatrSoc 1998;46:1363-1370.
90. Capezuri E, Evans L, Strumpf N et al. Physical restraint use and fallsin nursing home residents. J Am Geriatr Soc 1996;44:627-633.
91. Capezuri E, Strumpf NE, Evans LK et al. The relationship betweenphysical restraint removal and falls and injuries among nursing homeresidents. J Gerontol A Biol Sci Med Sci 1998;53A:M47-M52.
92. Evans LK, Strumpf NE, Allen-Taylor SL et al. A clinical trial to reduce restraints in nursing homes. J Am Geriatr Soc 1997;45:675-681.
93. Tinetti ME, Litt WL, Ginter SF. Mechanical restraint use and fall-related injuries among residents of skilled nursing facilities. Anti Intern Med 1992;116:369-374.
(9)

4-12
© BIODEX MEDICAL SYSTEMS, INC. 4-13
IntroductionThe National Health Service Executive is funding the CharteredSociety of Physiotherapy and the College of OccupationalTherapists to conduct a national sentinel audit of the extent towhich the ‘Guidelines for the Collaborative RehabilitativeManagement of Elderly People who have Fallen’ are being imple-mented (see Frontline, January 7, 1998, page 15). The NHSExecutive is very keen that all acute care and community trusts inEngland and Wales participate.
The purpose of this paper is to introduce these guidelines to phys-iotherapy managers and elder rehabilitation specialists who may notbe familiar with them or have only come across one of the earlierdraft versions. A similar paper is being published concurrently inthe British Journal of Occupational Therapy.
Falls are the most important reason for elderly people beingadmitted to hospital (Cryer et al, 1993) and apprehension aboutfalling is a source of distress to between about 25% and 50% ofcommunity dwelling elderly people (Tinetti el al, 1988, 1994). Yetthe management of this problem, in contrast to the management ofpeople with, for example, stroke or back pain, has until recentlyreceived scant attention in rehabilitation textbooks. This may bepartly due to ‘postural instability’ rarely being recognized as apotential physiotherapy diagnosis and a tendency to regard balanceproblems as normal concomitants of ageing (Simpson, 1996). Not,surprisingly, therefore, the standard of intervention offered to elder-ly people who have fallen and who show evidence of postural insta-bility tends to vary considerably between rehabilitation services.
In response to this need and also to the Royal College ofPhysicians’ and the British Geriatrics Society’s January 1994 initia-tive in setting up a workshop to consider the whole falls problem,‘Guidelines for the Collaborative Rehabilitative Management ofElderly People who have Fallen’ have been drawn up and endorsedby three organizations of specialist clinicians:
• Chartered physiotherapists working with older people (AGILE).• Association of Chartered Physiotherapists in the
Community (ACPC).• Occupational Therapists working with Elderly People (OCTEP).
As yet these guidelines have not been subject to formal appraisal.Nevertheless the NHS Executive acknowledges their potential impor-tance to those concerned nationally with standards in this area as wellas their potential value to clinicians seeking to improve their practiceat the local level. A fall is defined as unintentionally coming to rest onthe ground or at some other lower level (Tinetti et al, 1988).
Purpose of these GuidelinesThe guidelines are intended to help physiotherapists, occupationaltherapists and nurses working in the community, acute care orlongterm care in making decisions about appropriate treatment forelderly people who have fallen (NHS Executive 1996). It is antici-pated that rehabilitation services will collaborate to develop localguidelines based on these general recommendations and that spe-cialists responsible for implementing each goal-related componentwill be identified within each service.
The guidelines will help elderly health service users and their car-
ers to understand how to reduce the likelihood of falling again andhow to cope if they do have another fall. They will indicate to geri-atricians, general practitioners and other doctors the type of reha-bilitative programme they can expect to be offered to posturallyunstable elderly patients.
It is intended that adoption of the guidelines will increase thelikelihood that therapists, together with nurses and carers, imple-ment the treatment and management strategies that research evi-dence, when available, and collected expert opinion currently sug-gest are most likely to be effective in:1. Improving elderly people’s ability to withstand threats to theirbalance.2. Improving the safety of elderly people’s surroundings.3. Preventing elderly people from suffering the consequences of along lie on the floor.4. Optimizing older people’s confidence and, whenever relevant,their carers’ confidence, in their ability to move about as safely andas independently as possible in their surroundings in order to do thethings they want to do.
The Target GroupAlthough ‘elderly people who have fallen’ are specified as the tar-get user group, the guidelines are applicable to elderly people who,although as yet they may not have fallen, consider themselves to beat risk of doing so. The practical importance of the distinctionbetween these two groups is that those who have fallen should beexamined to identify any underlying medical reasons for doing so.Such causes must be ruled out or addressed in people who have fall-en, whereas in people who have not done so this requirement maybe less pressing.
Active elderly community residents may blame their own care-lessness if they fall and may consider any preventive interventionunnecessary. On the other hand, frail elders and their carers may bevery concerned about falling. Besides the risk of injury, this clientgroup is in danger of having to endure a “long lie’ on the floor, ieone hour or more, with the attendant risks of pressure sores,hypothermia, bronchopneumonia and dehydration (Isaacs, 1992).The guidelines are especially relevant to them.
However, these quidelines cannot be successfully implementedunless elderly people recognize the value of the interventions. Inparticular, their own views and preferences must be taken intoaccount if measures to achieve the goal of reducing hazards in thehome, such as changes to clothing, footwear, carpets and furniture,are to be accepted.
Rationale and DevelopmentIn January 1994, the British Geriatrics Society and the RoyalCollege of Physicians organized a workshop to develop clinicalguidelines for the management of elderly people who have fallen.One of authors (JMS) was invited to participate and to contribute abackground paper. Although the goal was to develop multi-discipli-nary guidelines, it came to be felt that, in line with the distinctionalready made between medical, rehabilitative and environmentalaspects of managing this problem (Tinetti, 1990), the rehabilitativecomponent, together with the environmental component, warrantedseparate consideration.
SUMMARY Falling among elderly people is recognized as a serious problem for the health services as well as for elderly people’s welfare. Nevertheless, therehabilitative management, as opposed to the medical management, has received little systematic attention. We describe the ‘Guidelines for the CollaborativeRehabilitative Management of Elderly People who have Fallen’. They have been drawn up and endorsed by three organizations of specialist rehabilitationclinicians. A national audit of the implementation of these guidelines is taking place, funded by the NHS Executive.
GUIDELINES FOR MANAGING FALLS AMONG ELDERLY PEOPLEJanet M Simpson, with Rachel Harrington, Nicola MarshKeywordsFalls, older people, carers
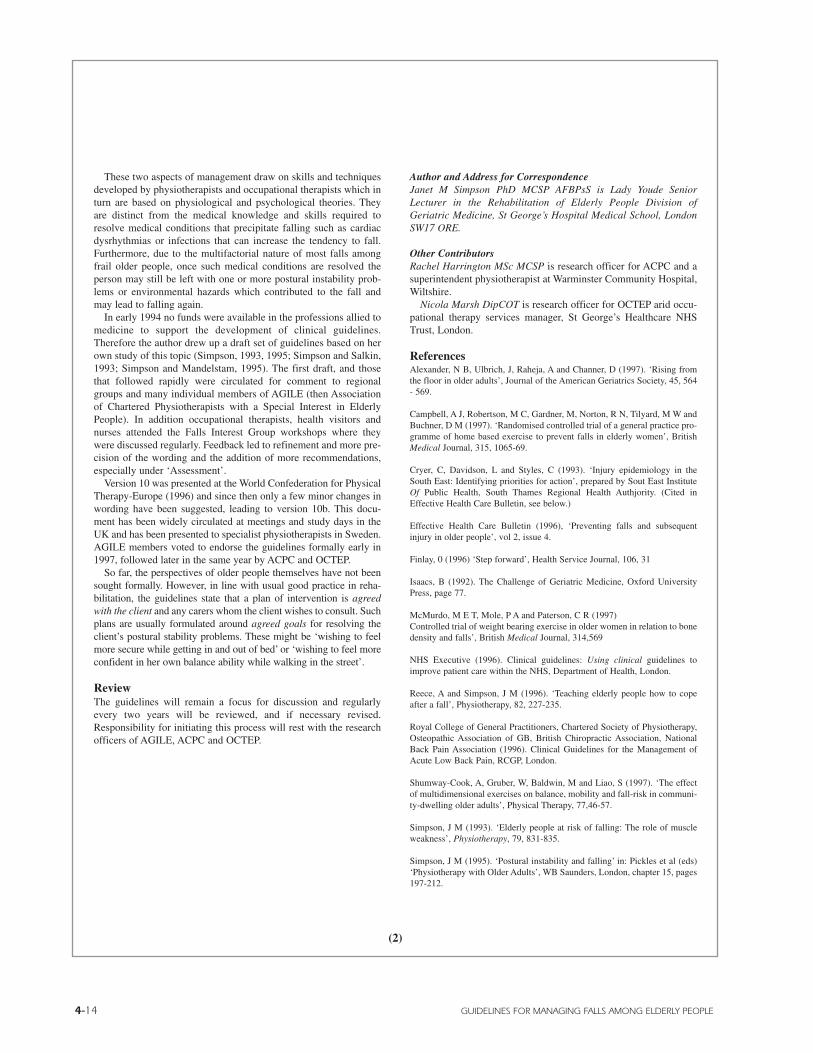
4-14 GUIDELINES FOR MANAGING FALLS AMONG ELDERLY PEOPLE
These two aspects of management draw on skills and techniquesdeveloped by physiotherapists and occupational therapists which inturn are based on physiological and psychological theories. Theyare distinct from the medical knowledge and skills required toresolve medical conditions that precipitate falling such as cardiacdysrhythmias or infections that can increase the tendency to fall.Furthermore, due to the multifactorial nature of most falls amongfrail older people, once such medical conditions are resolved theperson may still be left with one or more postural instability prob-lems or environmental hazards which contributed to the fall andmay lead to falling again.
In early 1994 no funds were available in the professions allied tomedicine to support the development of clinical guidelines.Therefore the author drew up a draft set of guidelines based on herown study of this topic (Simpson, 1993, 1995; Simpson and Salkin,1993; Simpson and Mandelstam, 1995). The first draft, and thosethat followed rapidly were circulated for comment to regionalgroups and many individual members of AGILE (then Associationof Chartered Physiotherapists with a Special Interest in ElderlyPeople). In addition occupational therapists, health visitors andnurses attended the Falls Interest Group workshops where theywere discussed regularly. Feedback led to refinement and more pre-cision of the wording and the addition of more recommendations,especially under ‘Assessment’.
Version 10 was presented at the World Confederation for PhysicalTherapy-Europe (1996) and since then only a few minor changes inwording have been suggested, leading to version 10b. This docu-ment has been widely circulated at meetings and study days in theUK and has been presented to specialist physiotherapists in Sweden.AGILE members voted to endorse the guidelines formally early in1997, followed later in the same year by ACPC and OCTEP.
So far, the perspectives of older people themselves have not beensought formally. However, in line with usual good practice in reha-bilitation, the guidelines state that a plan of intervention is agreedwith the client and any carers whom the client wishes to consult. Suchplans are usually formulated around agreed goals for resolving theclient’s postural stability problems. These might be ‘wishing to feelmore secure while getting in and out of bed’ or ‘wishing to feel moreconfident in her own balance ability while walking in the street’.
ReviewThe guidelines will remain a focus for discussion and regularlyevery two years will be reviewed, and if necessary revised.Responsibility for initiating this process will rest with the researchofficers of AGILE, ACPC and OCTEP.
Author and Address for CorrespondenceJanet M Simpson PhD MCSP AFBPsS is Lady Youde SeniorLecturer in the Rehabilitation of Elderly People Division ofGeriatric Medicine, St George’s Hospital Medical School, LondonSW17 ORE.
Other ContributorsRachel Harrington MSc MCSP is research officer for ACPC and asuperintendent physiotherapist at Warminster Community Hospital,Wiltshire.
Nicola Marsh DipCOT is research officer for OCTEP arid occu-pational therapy services manager, St George’s Healthcare NHSTrust, London.
ReferencesAlexander, N B, Ulbrich, J, Raheja, A and Channer, D (1997). ‘Rising fromthe floor in older adults’, Journal of the American Geriatrics Society, 45, 564- 569.
Campbell, A J, Robertson, M C, Gardner, M, Norton, R N, Tilyard, M W andBuchner, D M (1997). ‘Randomised controlled trial of a general practice pro-gramme of home based exercise to prevent falls in elderly women’, BritishMedical Journal, 315, 1065-69.
Cryer, C, Davidson, L and Styles, C (1993). ‘Injury epidemiology in theSouth East: Identifying priorities for action’, prepared by Sout East InstituteOf Public Health, South Thames Regional Health Authjority. (Cited inEffective Health Care Bulletin, see below.)
Effective Health Care Bulletin (1996), ‘Preventing falls and subsequentinjury in older people’, vol 2, issue 4.
Finlay, 0 (1996) ‘Step forward’, Health Service Journal, 106, 31
Isaacs, B (1992). The Challenge of Geriatric Medicine, Oxford UniversityPress, page 77.
McMurdo, M E T, Mole, P A and Paterson, C R (1997)Controlled trial of weight bearing exercise in older women in relation to bonedensity and falls’, British Medical Journal, 314,569
NHS Executive (1996). Clinical guidelines: Using clinical guidelines toimprove patient care within the NHS, Department of Health, London.
Reece, A and Simpson, J M (1996). ‘Teaching elderly people how to copeafter a fall’, Physiotherapy, 82, 227-235.
Royal College of General Practitioners, Chartered Society of Physiotherapy,Osteopathic Association of GB, British Chiropractic Association, NationalBack Pain Association (1996). Clinical Guidelines for the Management ofAcute Low Back Pain, RCGP, London.
Shumway-Cook, A, Gruber, W, Baldwin, M and Liao, S (1997). ‘The effectof multidimensional exercises on balance, mobility and fall-risk in communi-ty-dwelling older adults’, Physical Therapy, 77,46-57.
Simpson, J M (1993). ‘Elderly people at risk of falling: The role of muscleweakness’, Physiotherapy, 79, 831-835.
Simpson, J M (1995). ‘Postural instability and falling’ in: Pickles et al (eds)‘Physiotherapy with Older Adults’, WB Saunders, London, chapter 15, pages197-212.
(2)

© BIODEX MEDICAL SYSTEMS, INC. 4-15
Simpson J M (1996). ‘Elder rehabilitation: Are we overlooking the mainproblem?’ Editorial, British Journal of Therapy and Rehabilitation, 3, 1-2.
Simpson, J M and Salkin, S (1993). ‘Are elderly people at risk of fallingtaught how to get up again?’ Age and Ageing, 22, 294-296.
Simpson, J M and Mandelstam, H (1995). ‘Elderly people at risk of falling:Do they want to be taught how to get up again?’ Clinical Rehabilitation, 9,65-69.
Simpson, J M, Worsfold, C, Fisher, K and Hastie, R (1997). ‘The correlatesof fear of falling among elderly people’. Final report to the NHS Executive,South Thames Research and Development Directorate.
Tinetti, M E (1990) . ‘Falls’ in Cassel, C K, Riesenberg, D E et al (eds)Geriatric Medicine, Springer Verlag, Berlin, 2nd edn.
Tinett, M E, Speechley, M and Ginter, S F (1988).‘Risk factors for fallsamong elderly persons living in the community’, New England Journal ofMedicine, 319, 1701-07.
Tinetti, M E, Baker, D I, McAvay, G, Claus, E B, Garrett, P, Gottschalk, M,Koch, M L, Trainor, K and Horwitz, R I (1994). ‘A multifactorial interven-tion to reduce the risk of falling among elderly people living in the commu-nity’, New England Journal of Medicine, 331, 822-827.
A: Good practice points• A hospital physician or a general practitioner should examine anelderly person who has fallen to identify any underlying medicalreasons.
• A plan of intervention is agreed with the elderly person (and whenrelevant her/his carer).
• A baseline of appropriate measurements about the elderly person’spre-intervention state is established against which the post-inter-vention state can be compared. From this the effectiveness of theinterventions can be estimated, taking account of any plausible,alternative explanations for any change observed.
• The extent to which the elderly person (and his/her carer) are like-ly to be able to co-operate with an intervention programme in termsof memory ability and willingness to participate is established.
B: Special considerations in the communityReferrals to community physiotherapy may come from severalsources apart from the person’s general practitioner. Therefore com-munity physiotherapists are alert to signs that a person’s fall mayhave been precipitated by factors which need medical investigationsuch as:
• An underlying infection, eg chest infection, urinary tract infection.
• In appropriate medication or overdose, eg sedatives.• Stroke, epilepsy.• Syncope caused by, eg cardiac dysrhythmia, postural
hypotension, carotid sinus hypersensitivity.
(3)

4-16 GUIDELINES FOR MANAGING FALLS AMONG ELDERLY PEOPLE
Box C: Getting started with implementing the FallsGuidelines: Standard 1: That they shall be read!
• A copy of the ‘Guidelines for the Collaborative RehabilitativeManagement of Elderly People who have Fallen' and the corre-sponding standards will be kept with the departmental clinical doc-umentation in the physiotherapy departmental offices of :
(a) The acute hospital Elder Rehabilitation Service and any other acute service responsible for the rehabilitation of posturally unstable elderly people.(b) The community services.
• A copy of the guidelines and the corresponding standards will beincluded in the induction pack prepared for physiotherapists work-ing in these services,• All physiotherapists and student physiotherapists working in theseservices will read these guidelines and sign the corresponding reg-ister when they have done so:
(a) When starting the rotation, placement or post.(b) if permanent staff, subsequently at least once each year.
• Measurement: Audit via the register.
Adapted from a standard developed by physiotherapists working inthe Lady Youde Rehabilitation Service, St George’s Hospital,London SW17, The Bolingbroke Hospital, London SW 11 andWandsworth Community Physiotherapy Service.
Guidelines for the Collaborative RehabilitativeManagement of Elderly People who have FallenThe content of the guidelines as presented here is the same as thatin Version 10b, ie the version examined by the NHS Executive andaccepted as the basis for the National Audit. However, the arrange-ment of the information has been altered for greater impact. Eachgoal of management is listed together with recommendations forcorresponding assessment and intervention. A summary of the evi-dence to support these recommendations then follows.
The amount of research conducted in the rehabilitative manage-ment of elderly people who fall is sparse. Most of it is about exer-cise to reduce the likelihood of falling, moreover it has been con-ducted largely among community recruits -many of them fit,healthy people. These guidelines, however, target less active andfrailer people, who are probably already health service users. Forthis reason evidence supporting the recommendations is limited andnot always very strong. Nevertheless any rational, systematic set ofrecommendations to manage this critical health problem is betterthan none.
The system used to weight the evidence is the same as that usedin the Clinical Guidelines for the Management of Acute Low BackPain (Royal College of General Practitioners et al, 1996).
• Generally consistent findings in a majority of acceptable studies.• Either based on a single acceptable study or a weak or
inconsistent finding in some of multiple acceptable studies.• Limited scientific evidence available, which does not
meet all the criteria of ‘acceptable’ studies.
Aim 1: To improve elderly people’s ability to withstand threats to their balance
Assess to identify the impairments, likely to respond to rehabilita-tive intervention, that probably contributed to the person’s previousfalls or might lead to further falls:
Intervene to increase the elderly person’s stabitity during standing,transferring, walking and other functional movement,for example by:
(a) Balance training.(b) Strengthening the muscles around the hip, knee and ankle.(c) Increasing the flexibility of the trunk and lower limb.(d) Providing mobility aids and appliances if really necessary.
• Supporting evidenceA systematic review of the literature concludes that "There is someevidence to suggest that exercise, such as balance training, is effec-tive in reducing the risk of falls in older people. Access to such inter-ventions should be offered and ways of promoting uptake should beinvestigated. New programmes should be part of controlled evalua-tions" (Effective Health Care Bulletin, April 1995). Recent commu-nity-based studies further support this conclusion (Shumway-Cooket al,1997; McMurdo et al, 1997; Campbell et al, 1997).
(4)

© BIODEX MEDICAL SYSTEMS, INC. 4-17
Aim 2: To improve the safety of elderly people’s surroundings
Assess to identify any environmental hazards that contributed toprevious falls, and that might lead to further falls (including cloth-ing and footwear).
Intervene by:
(a) Removing, replacing or modifying any hazards, with the per-son’s consent.
(b) Teaching the person to be aware of hazards and how toavoid them.
• Supporting evidenceThe systematic review states: ‘Home visits and surveillance toassess and, where appropriate, modify environmental and personalrisk factors can be effective in reducing falls. This can be carried out by nurses, health visitors, occupational therapistsor trained volunteers.’
In the guidelines, footwear and clothing are classed as environ-mental risk factors, extrinsic to the person. The systematic reviewgoes on to note: ‘Older people’s footwear may be important inaffecting their balance and stability. In some hospitals, footwearassessment by physiotherapists is routinely carried out (Finlay,1996).’ The reviewers admitted that they were unable to identifyany rigorous evaluations of such footwear-based interventions.
Aim 3: To prevent elderly people suffering the consequences of a long lie
Assess to establish how the elderly person (and carer) coped fol-lowing previous fall/s and if they have any strategies for coping fol-lowing a fall in the future.
Intervene by teaching the person how to
(a) Get up from the floor (if this is possible).(b) Summon help.(c) Move about, keep warm, etc, while on the floor.
• Supporting evidenceThere has been very little research in this area. Inability to get upfrom the floor is relatively common among elderly people, eventhose only in their mid-seventies and living in the community(Alexander et al, 1.997). Only in few cases is it possible to teachthem, much less even older people in hospital, how to get up fromthe floor using the traditional method (Simpson and Mandelstam,1995). However, in a small non-randomised trial, Reece andSimpson (1996) showed that success is more likely using the back-ward chaining method. Other strategies for summoning help andavoiding the complications of a long lie should be explored, but thelong-term effectiveness of this teaching has yet to be established.
Aim 4: To optimize elderly people’s confidence and, wheneverrelevant, their carers’ confidence, in their ability to move aboutas safely and as independently as possible.
Assess to identify any psychological consequences of the fall thatmight lead to self-imposed restriction of activity.
Intervene to help elderly people to regain confidence in their bal-ance ability and functional competence, by encouraging them tocope successfully with increasingly severe threats to their balanceand increasingly demanding functional tasks.
• Supporting EvidenceFears and concerns about falling are highly correlated with postur-al instability among elderly in-patients (Simpson et al, 1997).Elderly participants in a controlled trial who received balance andtransfer training, leg muscle strengthening and review of their med-ications increased their balance self-confidence by a small but sta-tistically significant amount compared with the control group whoreceived friendly visits (Tinetti et al, 1994).
(5)

4-18

© BIODEX MEDICAL SYSTEMS, INC. 4-19
(1)
ObjectiveThe continuous-scale physical functional performance test(CS-PFP) is an original instrument designed to provide acomprehensive, in-depth measure of physical function thatreflects abilities in several separate physical domains. It isbased on a concept of physical function as the integration ofphysiological capacity, physical performance, and psy-chosocial factors.
SettingThe test was administered under standard conditions in ahospital facility with a neighborhood setting. The CS-PFPconsists of a battery of 15 everyday tasks, ranging from easyto demanding, that sample the physical domains of upperand lower body strength, upper body flexibility, balance andcoordination, and endurance. Participants are told to worksafely but at maximal effort, and physical functional per-formance was measured as weight, time, or distance. Scoreswere standardized and scaled 0 to 12. The test yields a totalscore and separate physical domain scores.
DesignThe CS-PFP was evaluated using 148 older adults — 78community dwellers, 31 long-term care facility residents liv-ing independently, and 39 residents with some dependence.
Main Outcome MeasuresMaximal physical performance assessment included meas-ures of maximal oxygen consumption (Vo2max), isokineticstrength, range of motion, gait, and balance. Psychosocialfactors were measured as self-defined health status using theSickness Impact Profile (SIP), self-perceived function usingthe Health Survey (SF36), and Instrumental Activities ofDaily Living (IADL).
ResultsIADL scores were not significantly different among thegroups. Test-retest correlations ranged front .84 to .97 and
Front the Department of Medicine, Division of Gerontology & Geriatric Medicine (Dr. Cress), theDepartment of’ Rehabilitation Medicine (Drs. Questad, Esselman), and the Department of HealthServices and Community Medicine (Dr. Buchner), University off Washington, Seattle; theNorthwest HSR&D Field Program, Seattle Veterans Affairs Medical Center (Dr. Buchner): and theDepartment of Physical Medicine and Rehabilitation, Johns Hopkins University (Dr. deLateur),Baltimore, MD.
Submitted for publication November 9, 1995. Accepted in revised form April 17, 1996.Supported by National Institutes of Health grant 1 R29 AG10267, Centers for Disease Control grant
U48-CCU009654, National Institutes of Health grant I R01 AG 10853, and National Institutes ofHealth grant R010943.
Presented in part at the 1994 annual meeting of the Gerontological Society of America, Atlanta,GA.
No commercial party having a direct financial interest in the results of the research supporting thisarticle has or will confer a benefit upon the authors or upon any organization with which the authorsare associated.
Reprint requests to M. Elaine Cress, PhD, University of Washington, Box 358852, Seattle, WA 98195.
© 1996 by the American Congress of Rehabilitation Medicine and the American Academy ofPhysical Medicine and Rehabilitation
0003-9993/96/7712-3762$3.00/0
inter-rater reliability from .92 to .99 for the CS-PFP totaland 5 domains. Internal consistency was high (Cronbach’s a,.74 to .97). Both total and individual domain CS-PFP scoreswere significantly different for the three groups of study par-ticipants, increasing with higher levels of independence,supporting construct validity. CS-PFP domain scores weresignificantly correlated with measures of maximal physicalperformance (Vo2max, strength, etc) and with physical butnot emotional aspects of self-perceived function.
Conclusions The CS-PFP is a valid, reliable measure of physical func-tion, applicable to a wide range of functional levels, andhaving minimal floor and ceiling effect. The total and phys-ical domains may be used to evaluate, discriminate, and pre-dict physical functional performance for both research andclinical purposes.
© 1996 by the American Congress of Rehabilitation Medicineand the American Academy of Physical Medicine andRehabilitation
PHYSICAL PERFORMANCE tests have become popularbecause of research concerns that self-reported function pro-vides insufficient information about the type of impairmentand lacks sensitivity to change.1 Many investigators and cli-nicians find physical performance measures appealingbecause of their potential for insight into the site and sever-ity of functional impairment, sensitivity to change, and facevalidity. Several new performance tests have been publishedin recent years.2-6 With one exception,5 they focus on mobil-ity dysfunction or on people having severe limitations. Ouraim was to develop a reliable measure of physical function-al performance that was not constrained by ceiling or flooreffects, used several physical domains, and applied to abroad spectrum of abilities. A secondary goal was to devel-op an instrument that provides insight into causes of poorphysical functional performance.
Although there is no gold standard for the measurementof physical function, several instruments are available toassess factors that contribute to physical function in varyingdegrees. The Venn diagram in figure 1 represents a concep-tual model of the physical and psychological spheres affect-ing physical function. The physiological capacities of thecardiovascular. musculoskeletal, and neuromuscular sys-tems are primary determinants of function. In this model,“physiological capacity” refers to the basic cellular andanatomic function such as cardiac ejection fraction, nerveconduction velocity, or muscle strength per cross-sectionalarea. “Physical performance” is the ability to integrate thesephysiological systems into coordinated, efficient move-ments to achieve optimum physical function.
ABSTRACT: Cress ME, Buchner DM, Questad KA, Esselman PC, deLateur BJ, Schwartz RS. Continuous-scale physical functional performance in healthyolder adults: a validation study. Arch Phys Med Rehabil 1996;77:1243-50.
CONTINUOUS-SCALE PHYSICAL FUNCTIONAL PERFORMANCE INHEALTHY OLDER ADULTS: A VALIDATION STUDYM. Elaine Cress, PhD, David H. Buchner, MD, Kent A. Questad, PhD, Peter C Esselman, MD, Barbara J. deLateur, MD, Robert S. Schwartz, MD
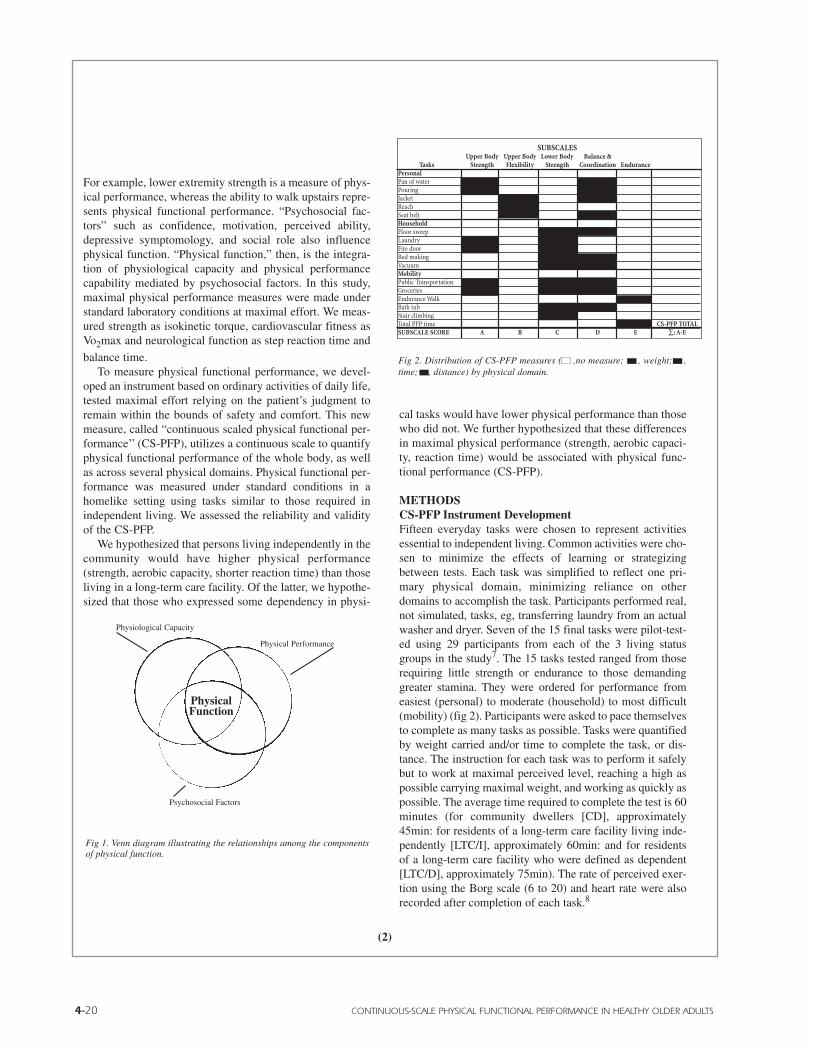
4-20 CONTINUOUS-SCALE PHYSICAL FUNCTIONAL PERFORMANCE IN HEALTHY OLDER ADULTS
For example, lower extremity strength is a measure of phys-ical performance, whereas the ability to walk upstairs repre-sents physical functional performance. “Psychosocial fac-tors” such as confidence, motivation, perceived ability,depressive symptomology, and social role also influencephysical function. “Physical function,” then, is the integra-tion of physiological capacity and physical performancecapability mediated by psychosocial factors. In this study,maximal physical performance measures were made understandard laboratory conditions at maximal effort. We meas-ured strength as isokinetic torque, cardiovascular fitness asVo2max and neurological function as step reaction time and
balance time.To measure physical functional performance, we devel-
oped an instrument based on ordinary activities of daily life,tested maximal effort relying on the patient’s judgment toremain within the bounds of safety and comfort. This newmeasure, called “continuous scaled physical functional per-formance’’ (CS-PFP), utilizes a continuous scale to quantifyphysical functional performance of the whole body, as wellas across several physical domains. Physical functional per-formance was measured under standard conditions in ahomelike setting using tasks similar to those required inindependent living. We assessed the reliability and validityof the CS-PFP.
We hypothesized that persons living independently in thecommunity would have higher physical performance(strength, aerobic capacity, shorter reaction time) than thoseliving in a long-term care facility. Of the latter, we hypothe-sized that those who expressed some dependency in physi-
cal tasks would have lower physical performance than thosewho did not. We further hypothesized that these differencesin maximal physical performance (strength, aerobic capaci-ty, reaction time) would be associated with physical func-tional performance (CS-PFP).
METHODSCS-PFP Instrument DevelopmentFifteen everyday tasks were chosen to represent activitiesessential to independent living. Common activities were cho-sen to minimize the effects of learning or strategizingbetween tests. Each task was simplified to reflect one pri-mary physical domain, minimizing reliance on otherdomains to accomplish the task. Participants performed real,not simulated, tasks, eg, transferring laundry from an actualwasher and dryer. Seven of the 15 final tasks were pilot-test-ed using 29 participants from each of the 3 living statusgroups in the study7. The 15 tasks tested ranged from thoserequiring little strength or endurance to those demandinggreater stamina. They were ordered for performance fromeasiest (personal) to moderate (household) to most difficult(mobility) (fig 2). Participants were asked to pace themselvesto complete as many tasks as possible. Tasks were quantifiedby weight carried and/or time to complete the task, or dis-tance. The instruction for each task was to perform it safelybut to work at maximal perceived level, reaching a high aspossible carrying maximal weight, and working as quickly aspossible. The average time required to complete the test is 60minutes (for community dwellers [CD], approximately45min: for residents of a long-term care facility living inde-pendently [LTC/I], approximately 60min: and for residentsof a long-term care facility who were defined as dependent[LTC/D], approximately 75min). The rate of perceived exer-tion using the Borg scale (6 to 20) and heart rate were alsorecorded after completion of each task.8
Physical Function
Physiological Capacity
Physical Performance
Psychosocial Factors
Fig 1. Venn diagram illustrating the relationships among the componentsof physical function.
SUBSCALESUpper Body Upper Body Lower Body Balance &
Tasks Strength Flexibility Strength Coordination EndurancePersonalPan of waterPouringJacketReachSeat beltHouseholdFloor sweepLaundryFire doorBed makingVacuumMobilityPublic TransportationGroceriesEndurance WalkBath tubStair climbingTotal PFP time CS-PFP TOTALSUBSCALE SCORE A B C D E ∑: A-E
Fig 2. Distribution of CS-PFP measures ( ,no measure; , weight; ,time; , distance) by physical domain.
(2)

© BIODEX MEDICAL SYSTEMS, INC. 4-21
(3)
Nine judges ( 1 geriatrician, 1 physiatrist, 2 biomech-anists, 1 physical therapist, 1 occupational therapist, 1 phys-iologist, 1 retirement home administrator/physical therapist,and 1 biomechanist/physical therapist) categorized the tasksinto five physical domains (fig 2) using a modified Delphiprocedure.9 The judges regarded weight-carried data as pro-viding information about skeletal muscle strength. Time tocomplete the task was regarded primarily as a reflection ofbalance and coordination, although in some tasks time wasdeemed to be a measure of strength. The judges considereddistance measured as providing information about flexibili-ty and endurance. Also, the CS-PFP presents a number oftasks to be performed serially because this closely mimicsthe real demands of everyday physical function, eg, goshopping, take the bus, cook, wash dishes, etc. The cumula-tive time of the timed tasks was regarded as one measure ofendurance.
The CS-PFP tests were administered in a facility with aneighborhood setting. The facility contains a kitchen, diningroom, bedroom, grocery store, and bus platform. Distancesand procedures were constant from test to test. Participantinstructions and measurement protocols were standardized.
The following is a brief description of the tasks. (Adetailed description of the tasks and procedure dialog isavailable from the first author.) The distribution of thesemeasures across the physical domains is shown in figure 2. Asubscale score is determined for each domain and thesescores are averaged to determine the total score. Tasks thatare quantified using both weight and time include: (1) carry-ing a pan of water a distance of 1 meter; (2) carrying and thenpouring from a jug of water into a cup; (3) carrying sandbagsin a luggage carry-on bag from a park bench, up a 3-stairpublic transportation platform and returning to the bench;and (4) distributing groceries into one or two paper bags cov-ered with plastic bags and carrying the groceries a distanceof 70 meters, including ascent and descent of the publictransportation platform and negotiating a closed door. Tasksthat are quantified by time alone include: (1) transferring7.7kg of laundry and sandbags from the washer to a dryerand then to a basket which is then set on the counter; (2) don-ning and removing a jacket and a seat-belt; (3) sweeping a setamount of kitty litter into a dustpan from a prescribed area(4) vacuuming a set amount of oats from a prescribed area ofcarpet; (5) making a double bed with fitted sheet, comforter,and pillows; (6) climbing a set of stairs; and (7) getting intoand out of a bathtub. Tasks that are quantified by distanceinclude: (1) walking as far as possible in 6 minutes; and (2)placing and removing a sponge from the highest adjustmentof a sliding shelf. Only one task is quantified with weightalone: pulling on a spring scale to simulate the opening of afire door. Tasks were selected so that the lowest two levels of
difficulty were judged by the panel to reflect all physicaldomains. This was done to gain the most information onindividuals who may not have had the stamina to completeall tasks. In addition, tasks were selected so that several taskscontributed to any particular domain score. For example,putting on a jacket, putting on a seat belt, and reaching ontoa high shelf all represent upper body flexibility. Tasks reflec-tive of upper body strength and balance and coordinationincluded all three levels of difficulty. Tasks requiring lowerbody strength were moderate or difficult.
Time as a measure of strength. While time to completea task was usually used as a measure of balance and coordi-nation, in several tasks it is a measure of strength (fig 2).Strength is dependent on the integration of muscular andneurological systems. Isokinetic performance used to meas-ure strength is the optimal integration of the neuromuscularproperties (physiological capacity) to generate force (physi-cal performance). The potential for strength training toimprove physical performance in older adults is dependenton the inverse relationship between strength (kg) and fatigue(sec). The logarithmic relationship between maximumstrength and muscular endurance at submaximal tasks wasfirst described by Simonson and later clarified.10,11
Consider a person who can lift a maximum of 20kg isotoni-cally and hold it for 1 second. After a progressive resistanceexercise program, that person can lift 40kg for 1 second andsustain a 20kg force for 60sec. This principle also helps toclarify the relationship between strength and time. A weak-er person is incapable of sustaining the contraction thatallows performance in the most efficient manner.Accommodation strategies that will take longer are used toaccomplish the task. For example, in the floor sweepingtask, a person with weak back muscles will stand upright,using arm motion to gather the kitty litter into a pile, mini-mizing the time required to stoop and sweep it into the dust-pan. A person with stronger back muscles will accomplishthe task in a shorter time by stooping from the beginning andsweeping directly into the dustpan.
For the CS-PFP, tasks requiring lower back and trunkstrength were classified in the lower body strength domain.For example. transferring laundry, floor sweeping, vacuum-ing, and making a bed require sustained contraction of thehip extensor, throughout the duration of the task.
Time as a measure of balance and coordination. Formost tasks, the time required also reflected the subject’s levelbalance and coordination. For example, once a weight (bag,pan, or basket) is lifted, the time it takes to accomplish (thetask is dependent on balance and coordination). Physical per-formance measures of the neuromuscular system (time onthe wide balance beam; step reaction time) were significant-ly associated with time to complete tasks of the CS-PFP.

4-22 CONTINUOUS-SCALE PHYSICAL FUNCTIONAL PERFORMANCE IN HEALTHY OLDER ADULTS
(4)
Scales and Measurement IssuesCombining measures derived from rating scales or ques-tionnaires is usually easy when the same rating scale is usedfor each item measured. However, when measures are madeusing performance parameters such as time or weight, as inthis study, the task of combining them into a single scale isnot as simple. The most common approach to this problemis to transform the measures of a scale into a standard score.This indicates how far above or below a norm group meanan individual measure is, using standard deviation units. Thestandard deviation units are then summed to form a scale.Some measures of performance such as the Jebsen-TaylorHand Function Test12 and almost all achievement and intel-ligence tests, use this solution.13 Normative scoring, how-ever, is particularly troublesome when it is applied to directmeasures of functional performance. An extremely high orlow individual score can skew the entire scale it belongs to,and if a person is unable to perform a task there is no clearway of computing a scale score.
To counter these problems for the CS-PFP, all measuresof time, weight, and distance were transformed to standardscores with the mean of all persons tested set at 0, using thedescriptive statistical procedure of the Statistical Packagefor Social Sciences (SPSS). This procedure standardizedvarying units (kg, cm, sec) and directions of measurement(lower time scores but higher weight scores generally indi-cate higher function). Standard scores were converted intoa scale of 0 to 12, with the lowest 10% being scored as 1and the highest 10% scored as 12. Scores between the 10thand 90th percentile were grouped in 8-percentile incre-ments that were assigned the numbers 2 through 11. Zerowas used for persons unable or refusing to perform a task.The total CS-PFP score is the sum of all standard scores,scaled 0 to 12. The sensitivity of the scales to an exerciseintervention is currently being assessed, and is not reportedon here.
Weighting of the domains. In the CS-PFP, domainscores are obtained by summing the scaled scores for thetasks of each domain (fig 2). The CS-PFP-total is the aver-age of the 5 domain scores. By leaving the domains equal-ly weighted we avoid imposing a bias of importance on anyparticular physical domain. For a person with Parkinson’sdisease, the most important domain may be balance andcoordination, whereas for a person with generalized weak-ness, the strength domains may be more important. Anequal weighting system allows this testing procedure to beeasily interpreted across clinical circumstances.
Study ParticipantsMen and women 70 years of age or older and in relativelygood health were recruited from the greater Seattle area.Respondents were screened to exclude persons with unsta-ble cardiovascular or metabolic disease, recent unhealedfractures, disorders with a highly variable course (eg, mul-tiple sclerosis), a pacemaker, a life expectancy of less than1 year, excessive alcohol intake (more than 2 drinks a day),inability to speak English, inability to follow directions, orinability to keep appointments. Ability to keep a rathercomplicated appointment schedule in 5 different testingsites in a timely manner and properly dressed was acceptedas sufficient evidence of adequate cognitive function to par-ticipate in the study. The final sample included 148 partici-pants (26 men; 122 women) from 3 living-status categories:78 community dwellers, persons living in single-familydwellings, apartments, or condominiums (CD group); 31residents of a long-term care facility who said they wereliving independently, eg, without assistance (LTC/I group);and 39 residents of a long-term care facility who had ascore of <65 on the physical function scale of the HealthSurvey SF-36 and were defined as dependent (LTC/Dgroup). The study was approved by the university’s andhospital's Human Subjects Review committees.
Maximal Physical Performance MeasuresMaximal oxygen consumption. Maximal oxygen con-sumption (Vo2max) was elicited using a ramp testing proto-col on a Medgraphics CPX electronically braked cycleergometer.a Watts were increased at a fixed rate per minute(8 to 16 watts) to complete the test in 8 to 12min. Expiredair was analyzed using Medgraphics zirconia fuel cell 02,and infrared CO2 analyzers.a Gas flow was measured usinga pneumatach and a waveform analyzer. Data were aver-aged over an 8-breath period, and the final report was forevery 30 seconds.
A physician continuously monitored the 12-leadQuinton Q650b electrocardiogram (ECG) throughout thetest, and heart rates were recorded every 30 seconds.Criteria for test termination included subject fatigue, signsand symptoms of exercise intolerance, ECG changes, andabnormal blood pressure or respiratory response. The testwas stopped if the subject showed signs of cardiovascularincompetence in accordance with American College ofSports Medicine guidelines.14
Strength. Biceps bracchi isometric strength at 90° elbowflexion and isokinetic knee flexion and extension strengthwere assessed using a LIDO dynamometer.C Grip strengthwas assessed on both left and right sides, and was reported
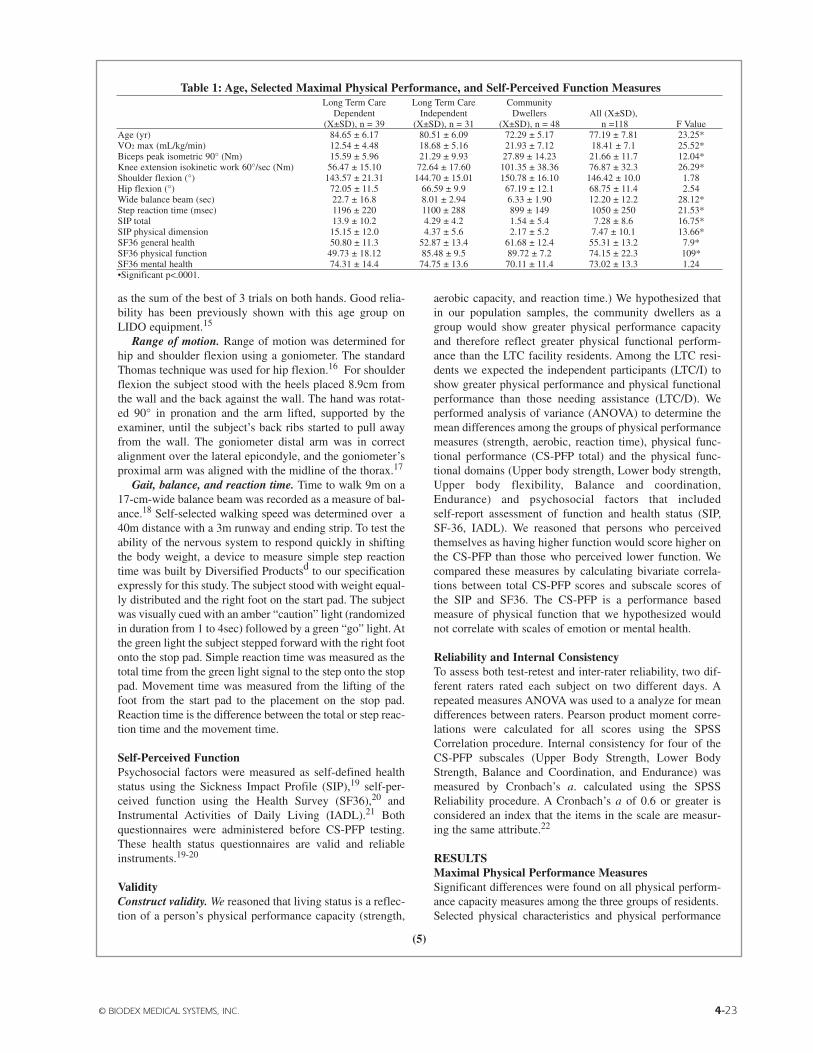
© BIODEX MEDICAL SYSTEMS, INC. 4-23
(5)
as the sum of the best of 3 trials on both hands. Good relia-bility has been previously shown with this age group onLIDO equipment.15
Range of motion. Range of motion was determined forhip and shoulder flexion using a goniometer. The standardThomas technique was used for hip flexion.16 For shoulderflexion the subject stood with the heels placed 8.9cm fromthe wall and the back against the wall. The hand was rotat-ed 90° in pronation and the arm lifted, supported by theexaminer, until the subject’s back ribs started to pull awayfrom the wall. The goniometer distal arm was in correctalignment over the lateral epicondyle, and the goniometer’sproximal arm was aligned with the midline of the thorax.17
Gait, balance, and reaction time. Time to walk 9m on a17-cm-wide balance beam was recorded as a measure of bal-ance.18 Self-selected walking speed was determined over a40m distance with a 3m runway and ending strip. To test theability of the nervous system to respond quickly in shiftingthe body weight, a device to measure simple step reactiontime was built by Diversified Productsd to our specificationexpressly for this study. The subject stood with weight equal-ly distributed and the right foot on the start pad. The subjectwas visually cued with an amber “caution” light (randomizedin duration from 1 to 4sec) followed by a green “go” light. Atthe green light the subject stepped forward with the right footonto the stop pad. Simple reaction time was measured as thetotal time from the green light signal to the step onto the stoppad. Movement time was measured from the lifting of thefoot from the start pad to the placement on the stop pad.Reaction time is the difference between the total or step reac-tion time and the movement time.
Self-Perceived FunctionPsychosocial factors were measured as self-defined healthstatus using the Sickness Impact Profile (SIP),19 self-per-ceived function using the Health Survey (SF36),20 andInstrumental Activities of Daily Living (IADL).21 Bothquestionnaires were administered before CS-PFP testing.These health status questionnaires are valid and reliableinstruments.19-20
ValidityConstruct validity. We reasoned that living status is a reflec-tion of a person’s physical performance capacity (strength,
aerobic capacity, and reaction time.) We hypothesized thatin our population samples, the community dwellers as agroup would show greater physical performance capacityand therefore reflect greater physical functional perform-ance than the LTC facility residents. Among the LTC resi-dents we expected the independent participants (LTC/I) toshow greater physical performance and physical functionalperformance than those needing assistance (LTC/D). Weperformed analysis of variance (ANOVA) to determine themean differences among the groups of physical performancemeasures (strength, aerobic, reaction time), physical func-tional performance (CS-PFP total) and the physical func-tional domains (Upper body strength, Lower body strength,Upper body flexibility, Balance and coordination,Endurance) and psychosocial factors that includedself-report assessment of function and health status (SIP,SF-36, IADL). We reasoned that persons who perceivedthemselves as having higher function would score higher onthe CS-PFP than those who perceived lower function. Wecompared these measures by calculating bivariate correla-tions between total CS-PFP scores and subscale scores ofthe SIP and SF36. The CS-PFP is a performance basedmeasure of physical function that we hypothesized wouldnot correlate with scales of emotion or mental health.
Reliability and Internal ConsistencyTo assess both test-retest and inter-rater reliability, two dif-ferent raters rated each subject on two different days. Arepeated measures ANOVA was used to a analyze for meandifferences between raters. Pearson product moment corre-lations were calculated for all scores using the SPSSCorrelation procedure. Internal consistency for four of theCS-PFP subscales (Upper Body Strength, Lower BodyStrength, Balance and Coordination, and Endurance) wasmeasured by Cronbach’s a. calculated using the SPSSReliability procedure. A Cronbach’s a of 0.6 or greater isconsidered an index that the items in the scale are measur-ing the same attribute.22
RESULTSMaximal Physical Performance MeasuresSignificant differences were found on all physical perform-ance capacity measures among the three groups of residents.Selected physical characteristics and physical performance
Table 1: Age, Selected Maximal Physical Performance, and Self-Perceived Function MeasuresLong Term Care Long Term Care Community
Dependent Independent Dwellers All (X±SD),(X±SD), n = 39 (X±SD), n = 31 (X±SD), n = 48 n =118 F Value
Age (yr) 84.65 ± 6.17 80.51 ± 6.09 72.29 ± 5.17 77.19 ± 7.81 23.25*VO2 max (mL/kg/min) 12.54 ± 4.48 18.68 ± 5.16 21.93 ± 7.12 18.41 ± 7.1 25.52*Biceps peak isometric 90° (Nm) 15.59 ± 5.96 21.29 ± 9.93 27.89 ± 14.23 21.66 ± 11.7 12.04*Knee extension isokinetic work 60°/sec (Nm) 56.47 ± 15.10 72.64 ± 17.60 101.35 ± 38.36 76.87 ± 32.3 26.29*Shoulder flexion (°) 143.57 ± 21.31 144.70 ± 15.01 150.78 ± 16.10 146.42 ± 10.0 1.78Hip flexion (°) 72.05 ± 11.5 66.59 ± 9.9 67.19 ± 12.1 68.75 ± 11.4 2.54Wide balance beam (sec) 22.7 ± 16.8 8.01 ± 2.94 6.33 ± 1.90 12.20 ± 12.2 28.12*Step reaction time (msec) 1196 ± 220 1100 ± 288 899 ± 149 1050 ± 250 21.53*SIP total 13.9 ± 10.2 4.29 ± 4.2 1.54 ± 5.4 7.28 ± 8.6 16.75*SIP physical dimension 15.15 ± 12.0 4.37 ± 5.6 2.17 ± 5.2 7.47 ± 10.1 13.66*SF36 general health 50.80 ± 11.3 52.87 ± 13.4 61.68 ± 12.4 55.31 ± 13.2 7.9*SF36 physical function 49.73 ± 18.12 85.48 ± 9.5 89.72 ± 7.2 74.15 ± 22.3 109*SF36 mental health 74.31 ± 14.4 74.75 ± 13.6 70.11 ± 11.4 73.02 ± 13.3 1.24•Significant p<.0001.
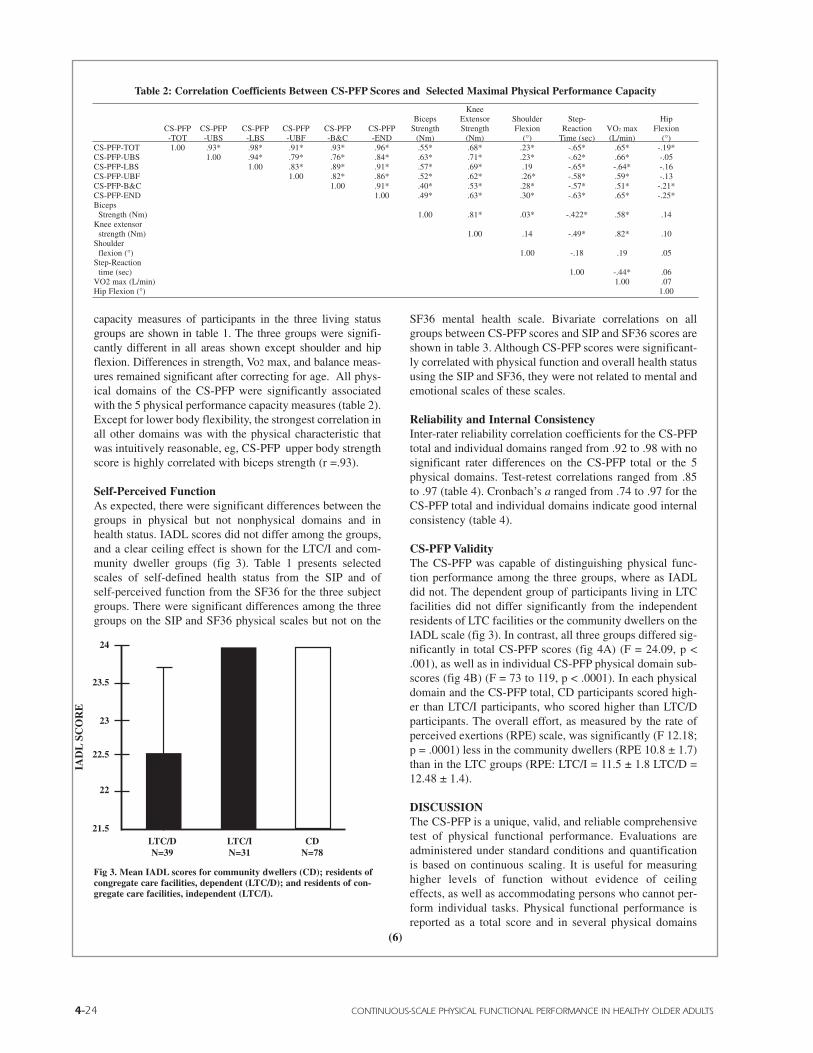
4-24 CONTINUOUS-SCALE PHYSICAL FUNCTIONAL PERFORMANCE IN HEALTHY OLDER ADULTS
capacity measures of participants in the three living statusgroups are shown in table 1. The three groups were signifi-cantly different in all areas shown except shoulder and hipflexion. Differences in strength, Vo2 max, and balance meas-ures remained significant after correcting for age. All phys-ical domains of the CS-PFP were significantly associatedwith the 5 physical performance capacity measures (table 2).Except for lower body flexibility, the strongest correlation inall other domains was with the physical characteristic thatwas intuitively reasonable, eg, CS-PFP upper body strengthscore is highly correlated with biceps strength (r =.93).
Self-Perceived FunctionAs expected, there were significant differences between thegroups in physical but not nonphysical domains and inhealth status. IADL scores did not differ among the groups,and a clear ceiling effect is shown for the LTC/I and com-munity dweller groups (fig 3). Table 1 presents selectedscales of self-defined health status from the SIP and ofself-perceived function from the SF36 for the three subjectgroups. There were significant differences among the threegroups on the SIP and SF36 physical scales but not on the
SF36 mental health scale. Bivariate correlations on allgroups between CS-PFP scores and SIP and SF36 scores areshown in table 3. Although CS-PFP scores were significant-ly correlated with physical function and overall health statususing the SIP and SF36, they were not related to mental andemotional scales of these scales.
Reliability and Internal ConsistencyInter-rater reliability correlation coefficients for the CS-PFPtotal and individual domains ranged from .92 to .98 with nosignificant rater differences on the CS-PFP total or the 5physical domains. Test-retest correlations ranged from .85to .97 (table 4). Cronbach’s a ranged from .74 to .97 for theCS-PFP total and individual domains indicate good internalconsistency (table 4).
CS-PFP ValidityThe CS-PFP was capable of distinguishing physical func-tion performance among the three groups, where as IADLdid not. The dependent group of participants living in LTCfacilities did not differ significantly from the independentresidents of LTC facilities or the community dwellers on theIADL scale (fig 3). In contrast, all three groups differed sig-nificantly in total CS-PFP scores (fig 4A) (F = 24.09, p <.001), as well as in individual CS-PFP physical domain sub-scores (fig 4B) (F = 73 to 119, p < .0001). In each physicaldomain and the CS-PFP total, CD participants scored high-er than LTC/I participants, who scored higher than LTC/Dparticipants. The overall effort, as measured by the rate ofperceived exertions (RPE) scale, was significantly (F 12.18;p = .0001) less in the community dwellers (RPE 10.8 ± 1.7)than in the LTC groups (RPE: LTC/I = 11.5 ± 1.8 LTC/D =12.48 ± 1.4).
DISCUSSIONThe CS-PFP is a unique, valid, and reliable comprehensivetest of physical functional performance. Evaluations areadministered under standard conditions and quantificationis based on continuous scaling. It is useful for measuringhigher levels of function without evidence of ceilingeffects, as well as accommodating persons who cannot per-form individual tasks. Physical functional performance isreported as a total score and in several physical domains
KneeBiceps Extensor Shoulder Step- Hip
CS-PFP CS-PFP CS-PFP CS-PFP CS-PFP CS-PFP Strength Strength Flexion Reaction VO2 max Flexion-TOT -UBS -LBS -UBF -B&C -END (Nm) (Nm) (°) Time (sec) (L/min) (°)
CS-PFP-TOT 1.00 .93* .98* .91* .93* .96* .55* .68* .23* -.65* .65* -.19*CS-PFP-UBS 1.00 .94* .79* .76* .84* .63* .71* .23* -.62* .66* -.05CS-PFP-LBS 1.00 .83* .89* .91* .57* .69* .19 -.65* -.64* -.16CS-PFP-UBF 1.00 .82* .86* .52* .62* .26* -.58* .59* -.13CS-PFP-B&C 1.00 .91* .40* .53* .28* -.57* .51* -.21*CS-PFP-END 1.00 .49* .63* .30* -.63* .65* -.25*Biceps
Strength (Nm) 1.00 .81* .03* -.422* .58* .14Knee extensor
strength (Nm) 1.00 .14 -.49* .82* .10Shoulder
flexion (°) 1.00 -.18 .19 .05Step-Reaction
time (sec) 1.00 -.44* .06VO2 max (L/min) 1.00 .07Hip Flexion (°) 1.00
Table 2: Correlation Coefficients Between CS-PFP Scores and Selected Maximal Physical Performance Capacity
24
23.5
23
22.5
22
21.5LTC/DN=39
LTC/IN=31
CDN=78
IAD
LSC
OR
E
Fig 3. Mean IADL scores for community dwellers (CD); residents ofcongregate care facilities, dependent (LTC/D); and residents of con-gregate care facilities, independent (LTC/I).
(6)

© BIODEX MEDICAL SYSTEMS, INC. 4-25
that include upper and lower body strength, endurance, bal-ance, and flexibility.
Level of FunctionThe CS-PFP fills the need for measurement of physical func-tion in people living independently. Although the evaluationis applicable to adults with a broad range of functional lev-els, it is not intended for people who require assistance withADL tasks or for those with cognitive impairments.Assessment tools (eg, Functional Independence Measure[FIM]) that quantify the level of assistance a person requiresprovide crucial information for discharge planning or forassessing progress of inpatients. Measure of physical func-tion that target ADL limitations requiring assistance do notlend themselves to timing-based evaluation. For example, ifa person requires some assistance dressing, such as gettingthe arm into the sleeve, the time to complete the task may bemore dependent on timing the assistance given or on cueingthan on physical function. For the same reason, the CS-PFPis not intended to measure function in individuals with cog-nitive impairments or who may require multiple cues to com-plete a task. Although the CS-PFP is intended for measure-ment of higher levels of function, the scaling is designed toaccommodate people who cannot perform an individual task,minimizing a measurement floor effect. The minimum CS-PFP-total score was 1.3 out of 12, and no one received ascore of 0 on any of the domains.
Several aspects of the testing process contribute to mini-mizing a ceiling effect: instruction to work at maximaleffort, performance of several tasks serially, evaluation ofseveral physical domains, and continuous scaling. Peopleare asked to work at their functional capacity as quickly asthey can or carrying the maximum amount of weight withinthe limits of comfort and safety. They are required to judgetheir ability and rest if they need to in order to complete alltasks. People who are stronger can carry more weight, workfaster, and cover more distance. Using continuous scales oftime, weight, and distance, as well as providing additionalweight for carrying tasks, challenges stronger participants,reducing the possibility of reaching a cap on the highest
score attained. Of the possible total scale of 12, the maxi-mum score achieved was 10.6, and no one scored 12 on anydomain. Assessing total body physical functional perform-ance may also help to minimize the ceiling effect. By takingseveral physical systems (cardiorespiratory, neuromuscular)into account, the test assesses the integration of total bodyphysical functional performance, rather than relying on onlyone or two performance scores (eg, tandem walk, sit-to-stand) to represent overall physical function.
8
7
6
5
4
3
2
1
0
B UpperBody
Strength
UpperBody
Flexibility
LowerBody
Strength
Balance&
Coordination
Endurance
Mea
n C
S-P
FP
Dom
ains
Sco
re
Fig 4. (A) Mean CS-PFP total scores for community dwellers (CD);residents of congregate care facilities, dependent (LTC/D); and resi-dents of congregate care facilities, independent (LTC/I). Significantdifferences were found between groups within each domain(F=24.09). (B) Mean CS-PFP total scores for community dwellers(CD, N=78 [ ]); residents of congregate care facilities, dependent(LTC/D N=39 [ ]); and residents of congregate care facilities,independent (LTC/I N=31 [ ]). Significant differences were foundbetween groups within each domain (F=73 to 119).
8
7
6
5
4
3
2
1
0
A LTC/DN=39
LTC/IN=31
CDN=78
Mea
n C
S-P
FP
-tot
al S
core
Table 4: Reliability and Internal Consistency Correlation of the CS-PFP
Physical Domain Inter-rater* Test-Retest*Cronbach-a*Upper body strength .92 .95 .87Upper body flexibility .97 .85 .74Lower body strength .98 .94 .83Balance & Coordination .99 .96 .91Endurance .95 .93 .86CS-PFP-total .98 .97 .97* All correlations significant p < .01. (7)
SF36 TOT SF36 GH SF36 MH SF36 PF SF36 RP SF36 VIT SIP TOT SIP AM SIP MOB SIP PD SIP BMC SIP REC SIP MOODCS-PFP-TOT .75* -.30* -.15* .75* .48* -.08* -.58* -.62* -.52* -.63* -.54* -.51* -.15*CS-PFP-UBS .67* -.30* -.12 .67 .42 -.06 -.51* -.53* -.45* -.55* -.47* -.43* .11CS-PFP-LBS .70* -.26* -.14 .70* .42* -.07 -.53* -.58* -.48* -.59* -.50* -.48* -.06CS-PFP-UBF .72* -.27* -.21* .72* .49* -.08 -.63* -.63* -.54* -.66* -.58* -.50* -.19CS-PFP-B&C .68* -.25* -.18 .68* .43 -.10 -.57* -.60* -.49* -.61* -.54* -.49* -.08CS-PFP-END .77* -.37* -.11 .77* .51* -.06 -.59* -.64* -.52* -.64* -.54* -.52* -.19
Table 3: Correlation Coefficients Between CS-PFP Scores and Health Status Measures
On this CS-PFP a higher score represents higher function. On the SIP a lower score represents better perceived health. Abbreviations: CS-PFP-TOT, CS-PFP-total score; CS-PFP-UBS, CS-PFP upper body strength score; CS-PFP-LBS, CS-PFP lower body strength score; CS-PFP-UBF, CS-PFP upper body flex-ibility score; CS-PFP-B&C, CS-PFP balance and coordination score; CS-PFP-END, CS-PFP endurance score; SF#^, Short Form 36 Health Survey: TOT,total; GH, General Health; MH, Mental Health; PF, Physical Function; RP, Role Physical;; VIT, Vitality; SIP, Sickness Impact Profile Health Status: AM,Ambulation; MOB, Mobility; PD, Physical Dimension; BMC, Body Care Movement; REC, Recreation; MOOD, Mood. * Correlations significant p < .01.
4-26 CONTINUOUS-SCALE PHYSICAL FUNCTIONAL PERFORMANCE IN HEALTHY OLDER ADULTS
(8)
The ideal subject sample for testing this instrument wouldinclude some people with high muscular strength and low car-diovascular endurance, and visa versa; however in untrainedpeople, physical characteristics generally decline in concertwith age. We are currently testing the training response of theindividual domains to different physical interventions.
Continuous ScalingBy using a continuous scale for the, CS-PFP we can exam-ine relationships between CS-PFP scores and measures ofphysical performance capacity. Our data show a high degreeof correlation between CS-PFP physical domain scores andrelated physical performance capacity measures (Table 2).Each task was simplified to reduce the influence of morethan one domain. For instance, when putting on a jacket thesubject is asked to pull it together but not zip it up, in orderto minimize interference of sight, dexterity, and abdominalgirth. Selecting tasks and administering them to reflect thedominant physical trait involved in performance contributesto the significant correlation between the physical perform-ance and physical functional performance measures (Table2) and the high degree of internal consistency within thedomains (Table 4).
Standard ConditionsIt is recognized in the laboratory sciences that testing understandard conditions minimizes variance and enhances theability to detect significant differences. However, manyfunctional assessment tools lack adequate sensitivity todetect differences that may in part be due to ordinal ratherthan interval scaling but may also result from the variableconditions under which tests are administered.
Physical DomainsThe development of tests to assess function (eg, IADL,ADL) has emphasized quick administration (<10min) in aphysician’s office (nonstandard conditions) using a test thatdoes not require specific training to administer.23 Yet a needfor more accurate and comprehensive tests has grown withthe increased scope of disability and number of patients withdisabilities. Many measures of function include domainsother than the physical, eg, social, cognitive, and commu-nicative domains (SF36, FIM), which are important aspectsof overall function. However, we suggest that upper andlower body physical function and all other physical domainscannot be adequately assessed in 10min. They demand anin-depth assessment that carefully segregates the variousdomains of physical function. The need for a physiologicalapproach tofunctional tests is eloquently argued by Fried et
al.1 Serial presentation of the tasks provides greater insightinto physical function than do short tests because it simu-lates normal conditions. To function comfortably in the con-tinuum of life, a person must be able to complete manytasks, such as personal care, shopping, cooking, and clean-ing, with energy and time remaining for recreation.
The data yielded by the comprehensive physical func-tion test have critical and wide-ranging implications for thecare of the patient. Such data are needed to determine homecare or chore worker needs, types of physical intervention,eligibility for financial assistance, and the safety of homeplacement. Maximal physical performance (strength,Vo2max, etc) contribute uniquely to physical domains.
Isometric arm strength explains 40% (r=.63) of theCS-PFP-upper body strength domain, whereas it explains30% (r = .55) of overall physical functional performance(Table 2). Maximal leg strength and VO2max, on the other
hand, both explained similar amounts of the variance (42%and 46%, respectively) for the CS-PFP- total. How eachdomain contributes to an individuals CS -PFP total score canprovide insight into intervention strategies.
Although we hypothesized a physical domain for lowerbody flexibility, our final set of tasks did not include anytasks for which hip flexibility was the primary physicalcharacteristic required for performance. We initially expect-ed that getting in and out of the bathtub would be dependentprimarily on lower body flexibility. However, this task isprimarily a reflection of the balance between leg strengthand hip flexibility, and therefore it did not correlate primari-ly with degrees of hip flexion. This was the only task notperformed by all of the participants. Those participants whocould not perform it (n = 12; 9%) had significantly less hipflexion and knee extension strength than the other partici-pants. Ten (83%) of the 12 participants who could not per-form the bath tub task had musculoskeletal limitations(arthritis, low back pain, or a pulled muscle). Only one stat-ed that fear of falling was a consideration for not perform-ing the task. All other tasks were completed by all partici-pants. Other tasks requiring hip flexibility and less reliant onstrength, such as picking up scarves or closing a Velcro straparound a shoe being worn by the subject, might have pro-vided more insight into lower body flexibility as a physicaldomain of function.
Living StatusWe have established that the CS-PFP has the precision todetect differences in physical function among three groupsof participants, demonstrating the instrument’s constructvalidity. The maximum IADL score of 24 was attained by all

© BIODEX MEDICAL SYSTEMS, INC. 4-27
(9)
CD and LTC/I residents, and those participants who wereresidents of a congregate care facility and dependent(LTC/D) indicated some IADL functional deficits (meanscore 22.5), but there were no significant differences amongthe groups. Direct observation of physical functional per-formance using the CS-PFP total score indicates that ourparticipants represent three distinct groups physically: com-munity dwellers (CD) have the highest functional level,LTC/I residents retain 80% of the function of the CD, andLTC/D residents have 45% of the function of the CD (fig4A). Participants' ages ranged from the youngest in the CDgroup to the oldest in the LTC/D group (Table 1.) Age isassociated with many aspects of health that may also affectfunction, eg, multiple illnesses, loss of lean muscle mass,loss of strength, depression. Significant differences remainamong the three groups, on both CS-PFP total scores (fig4A) and scores within the physical domains (fig 4B) aftercorrecting for age. This is strong evidence that physicalfunction is a more important determinant of living statusthan age. In other words, just because a person is older doesnot mean that he or she will be physically dependent, butrather that strength, endurance, balance and coordination,and flexibility are better predictors of living status than age.In addition, the community dwellers worked at a signifi-cantly higher level of physical functional performance withsignificantly less effort (RPE = 10.8), between very lightand fairly light. As all of the participants functioned withintheir prescribed social roles, they were nondisabled accord-ing to the Nagi model of disability.24 For diagnostic andintervention purposes, however, physical changes need to berecognized at the impairment level before they begin toaffect social roles, ie, become disabilities. The CS-PFP maybe useful for the individual who is completing an inpatientrehabilitation program and is soon to he discharged to home.In such a case the CS-PFP may be able to predict success inthe home environment and indicate areas where assistanceor home modification may be required.
Self-Perceived FunctionCS-PFP total scores correlated significantly with scales ofself-defined health status, the SIP and self-perceived physi-cal function, the SF36 (Table 3). This indicates that theCS-PFP is tapping some of the same characteristics as theother two assessments. Equally important is the evidencethat the CS-PFP discriminates the physical aspects of func-tion from other aspects such as emotion or mental health(SIP mood and SF36 mental health r = -.1 5; p = 0.1). Thesefindings support other work that has found that physical dis-ability does not necessarily relate to social disability.25
CONCLUSIONThe CS-PFP is a unique, valid, and reliable test of physicalfunctional performance. For persons without cognitiveimpairment the CS-PFP offers a continuously scaled instru-ment that measures whole-body physical functional per-formance, comprising 5 physical domains that reflect upperand lower body strength, upper body flexibility, balance andcoordination, and endurance. Three groups of seniors werenot significantly different in dependence on the IADL scale;however, they differ significantly in CS-PFP total scores,CS-PFP domain scores, maximal physical performance, andhealth status scores, indicating construct validity. Eachphysical domain of the CS-PFP was significantly correlatedwith the physical performance measure it reflects, furtherdemonstrating construct validity. Measures of self-per-ceived physical function were significantly correlated withCS-PFP scores, and measures of nonphysical domains werenot. The CS-PFP does not show a floor effect for olderadults without ADL deficiencies or a ceiling effect in high-ly active community dwellers. Possible applications includeresearch into physical functional performance, interventionstrategies, and program outcomes, as well as use in occupa-tional and physical therapy evaluations.
Acknowledgment: The authors express appreciation toRoberta Wilkes for her editorial assistance in preparation ofthis manuscript. Barbara Inglin and Chris Mogadam for col-lection of the data. Dr. Robert Schoene for the use of thePulmonary Exercise Laboratory at Harborview MedicalCenter, and Northwest Hospital for the use of its Easy StreetEnvironments®, a rehabilitation facility designed and builtby Guynes Design Inc., Phoenix. AZ. for testing.
References
1. Fried LP, Ettinger WH, Lind B, Newman AB, Gardin J, CardiovascularHealth Study Research Group. Physical disability in older adults: a physio-logical approach J. Clin Epidemiol 1994;47:747-60.
2. Gerety MB, Mulrow CD, Ruley, MR, Hazuda HP, Lichtenstein MJ.Bohannon R. Development and validation of physical performance instru-ment for the functionally impaired elderly: The Physical Disability Index (PDI). J Gerontol 1993;48:M33-8.
3. Guralnik JM, Simonsick EM, Ferrucci L, Glynn RJ, Berkman LF,Blazer DG, et al. A short physical performance battery assessing lowerextremity function: association with self-reported disability and prediction ofmortality and nursing home admission, J Gerontol 1994;49:M85-94.
4. Keith RA, Granger CV, Hamilton BB, Sherwin FS. The functional inde-pendence measure: a new tool for rehabilitation. In: Eisenberg MG, GrzesiakRC, editors. Advances in clinical rehabilitation, Vol. 1. New York:Springer,1987: 6-18.
5. Reuben DB, Siu Al. An objective measure of physical function of eld-erly outpatients. J Am Geriatr Soc 1990;38:1105-12.
4-28 CONTINUOUS-SCALE PHYSICAL FUNCTIONAL PERFORMANCE IN HEALTHY OLDER ADULTS
(10)
6. Winograd CH, Lemsky CM, Nevitt MC. Nordstrom TM, Steward AL,Miller CJ, et al. Development of a physical performance and mobility exam-ination. J Am Geriatr Soc 1994;42:743-9.
7. Cress ME, Schwartz RS. Quantification of physical functional per-formance [abstract]. Clin Res 1992;40:19A.
8. Borg G. Perceived exertion an indicator of somatic stress. Scand JRehabil Med 1970;2:92-8.
9. Brook RH, Park RE, Chassin MR, Solomon DH, Keesey J, Kosecoff J.Predicating the appropriate use of carotid endarterectomy, upper gastroin-testinal endoscopy, and coronary angiography. N Engl J Med 1990; 323:1173-7.
10. Simonson E. Recovery and fatigue. In: Simonson E, editor. Physiologyof work and fatigue. Springfield (IL): Charles C. Thomas, 1971;440-8.
11. Buchner DM, DeLateur BJ. The importance of skeletal muscle strengthto physical function in older adults. Behav Med Annals 1991;13:91-8.
12. Jebsen RH, Taylor N, Tieschmann RB, Trotter MJ, Howard LA. Anobjective and standardized test of hand function. Arch Phys Med Rehabil1969;50:311-9
13. Anastasi A. Psychological testing. 5th ed. New York: MacMillan, 1982
14. American College of Sports Medicine, Guidelines for exercise testingand prescription, 4th ed. Philadelphia: Lea & Febiger, 1992.
15. Cress ME, Johnson J, Agre JC. Isokinetic strength testing in olderwomen: a comparison of two systems. J Orthop Sports Phys Ther1991;13:199-202.
16. Kendall FP, McCreary EK. Muscles testing and function. 3rd ed.Baltimore: Williams & Wilkins, 1983.
17. Norkin CC, White DJ. Goniometry: a guide to joint and range of motionmeasurement. Philadelphia: FA Davis, 1985.
18. Lehmann JF, deLateur BJ, Fowler RS, Warren CG, Arnhold R. SchertzerG. Stroke: does rehabilitation affect outcome? Arch Phys Med Rehabil1975;56:375-82.
19. Bergner M, Bobbitt RA, Pollard WE, Martin DP, Gilson BS. TheSickness Impact Profile: validation of health status measure. Med Care1976;14:57-67.
20. Ware JE, Sherbourne CD. The MOS 36-item Short Form Health Survey(SF-36). Med Care 1992;30:473-83.
21. Pfeiffer M. Multidimensional functional assessment: the OARSmethodology. Durham (NC): Duke University Center for the Study of Agingand Human Development, 1975.
22. Bernstein IH. Garbin CP, Teng GK. Applied multivariate analysis. NewYork: Springer-Verlag, 1988.
23. Wasson J. Keller A, Rubenstein L, Hays R, Nelson E, Johnson.Dartmouth Primary Care COOP Project. Benefits and obstacles of health sta-tus assessment in ambulatory settings. Med Care 1992;30 Suppl 5:MS42-199.
24. Institute of Medicine, National Academy of Sciences. Introduction. In:U.S. Department of Health, Education and Welfare. Healthy people: the sur-geon general’s report on health promotion and disease prevention, back-
ground papers, Washington (DC): National Academy Press, 1991;367-86.
25. Jette AM, Branch LG. Impairment and disability in the aged. J ChronDis 1985;38:59-65.
Suppliersa. Medgraphics, 350 Oak [)rive Parkway, St. Paul, MN 55127-8599.b. Quinton, 2121 Terry Avenue, Seattle, WA 98121c. Loredan Biomedical Corporation, Davis, CA.d. Diversified Products, 2625 Himes #9, Pueblo, CO 81004.
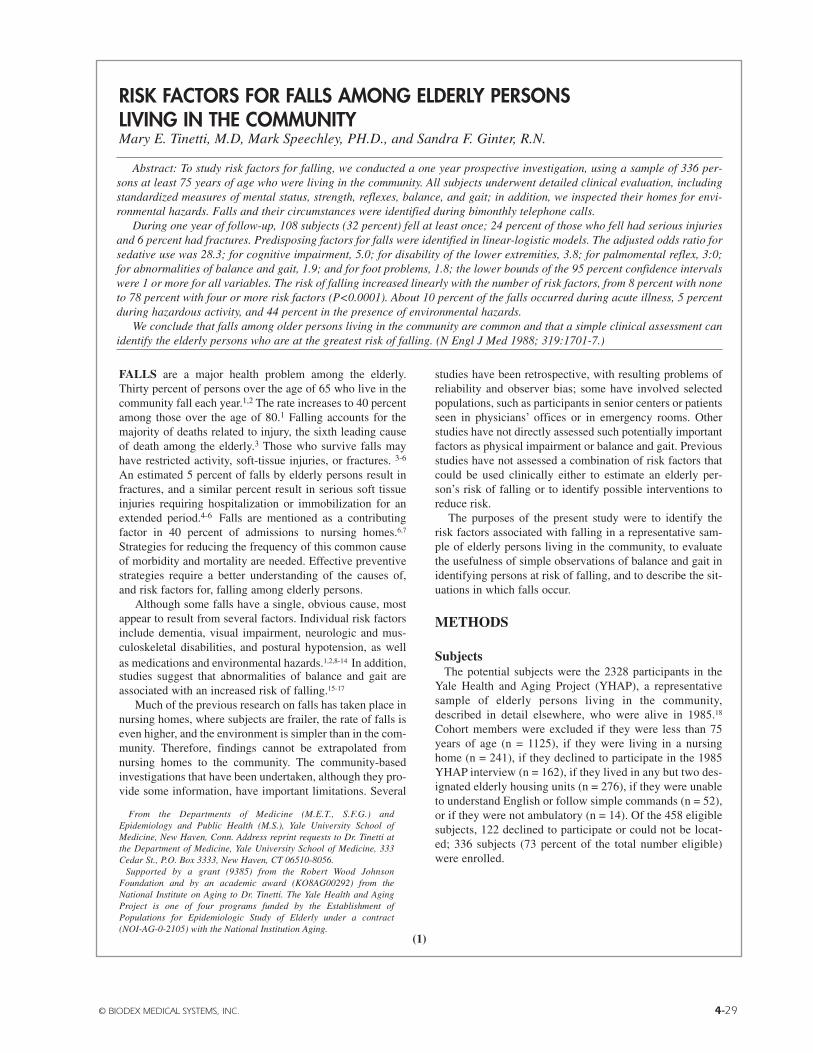
© BIODEX MEDICAL SYSTEMS, INC. 4-29
FALLS are a major health problem among the elderly.Thirty percent of persons over the age of 65 who live in thecommunity fall each year.1,2 The rate increases to 40 percentamong those over the age of 80.1 Falling accounts for themajority of deaths related to injury, the sixth leading causeof death among the elderly.3 Those who survive falls mayhave restricted activity, soft-tissue injuries, or fractures. 3-6
An estimated 5 percent of falls by elderly persons result infractures, and a similar percent result in serious soft tissueinjuries requiring hospitalization or immobilization for anextended period.4-6 Falls are mentioned as a contributingfactor in 40 percent of admissions to nursing homes.6,7
Strategies for reducing the frequency of this common causeof morbidity and mortality are needed. Effective preventivestrategies require a better understanding of the causes of,and risk factors for, falling among elderly persons.
Although some falls have a single, obvious cause, mostappear to result from several factors. Individual risk factorsinclude dementia, visual impairment, neurologic and mus-culoskeletal disabilities, and postural hypotension, as wellas medications and environmental hazards.1,2,8-14 In addition,studies suggest that abnormalities of balance and gait areassociated with an increased risk of falling.15-17
Much of the previous research on falls has taken place innursing homes, where subjects are frailer, the rate of falls iseven higher, and the environment is simpler than in the com-munity. Therefore, findings cannot be extrapolated fromnursing homes to the community. The community-basedinvestigations that have been undertaken, although they pro-vide some information, have important limitations. Several
studies have been retrospective, with resulting problems ofreliability and observer bias; some have involved selectedpopulations, such as participants in senior centers or patientsseen in physicians’ offices or in emergency rooms. Otherstudies have not directly assessed such potentially importantfactors as physical impairment or balance and gait. Previousstudies have not assessed a combination of risk factors thatcould be used clinically either to estimate an elderly per-son’s risk of falling or to identify possible interventions toreduce risk.
The purposes of the present study were to identify therisk factors associated with falling in a representative sam-ple of elderly persons living in the community, to evaluatethe usefulness of simple observations of balance and gait inidentifying persons at risk of falling, and to describe the sit-uations in which falls occur.
METHODS
SubjectsThe potential subjects were the 2328 participants in the
Yale Health and Aging Project (YHAP), a representativesample of elderly persons living in the community,described in detail elsewhere, who were alive in 1985.18
Cohort members were excluded if they were less than 75years of age (n = 1125), if they were living in a nursinghome (n = 241), if they declined to participate in the 1985YHAP interview (n = 162), if they lived in any but two des-ignated elderly housing units (n = 276), if they were unableto understand English or follow simple commands (n = 52),or if they were not ambulatory (n = 14). Of the 458 eligiblesubjects, 122 declined to participate or could not be locat-ed; 336 subjects (73 percent of the total number eligible)were enrolled.
Abstract: To study risk factors for falling, we conducted a one year prospective investigation, using a sample of 336 per-sons at least 75 years of age who were living in the community. All subjects underwent detailed clinical evaluation, includingstandardized measures of mental status, strength, reflexes, balance, and gait; in addition, we inspected their homes for envi-ronmental hazards. Falls and their circumstances were identified during bimonthly telephone calls.
During one year of follow-up, 108 subjects (32 percent) fell at least once; 24 percent of those who fell had serious injuriesand 6 percent had fractures. Predisposing factors for falls were identified in linear-logistic models. The adjusted odds ratio forsedative use was 28.3; for cognitive impairment, 5.0; for disability of the lower extremities, 3.8; for palmomental reflex, 3:0;for abnormalities of balance and gait, 1.9; and for foot problems, 1.8; the lower bounds of the 95 percent confidence intervalswere 1 or more for all variables. The risk of falling increased linearly with the number of risk factors, from 8 percent with noneto 78 percent with four or more risk factors (P<0.0001). About 10 percent of the falls occurred during acute illness, 5 percentduring hazardous activity, and 44 percent in the presence of environmental hazards.
We conclude that falls among older persons living in the community are common and that a simple clinical assessment canidentify the elderly persons who are at the greatest risk of falling. (N Engl J Med 1988; 319:1701-7.)
RISK FACTORS FOR FALLS AMONG ELDERLY PERSONS LIVING IN THE COMMUNITYMary E. Tinetti, M.D, Mark Speechley, PH.D., and Sandra F. Ginter, R.N.
From the Departments of Medicine (M.E.T., S.F.G.) andEpidemiology and Public Health (M.S.), Yale University School ofMedicine, New Haven, Conn. Address reprint requests to Dr. Tinetti atthe Department of Medicine, Yale University School of Medicine, 333Cedar St., P.O. Box 3333, New Haven, CT 06510-8056.
Supported by a grant (9385) from the Robert Wood JohnsonFoundation and by an academic award (KO8AG00292) from theNational Institute on Aging to Dr. Tinetti. The Yale Health and AgingProject is one of four programs funded by the Establishment ofPopulations for Epidemiologic Study of Elderly under a contract(NOI-AG-0-2105) with the National Institution Aging.
(1)

4-30 RISK FACTORS FOR FALLS AMONG ELDERLY PERSONS LIVING IN THE COMMUNITY
(2)
Base-Line Data
YHAP IntetviewThe 1985 interview elicited demographic data and infor-
mation on chronic conditions (e.g., arthritis and stroke), useof medications, functional disabilities, mental status,depression, height and weight, alcohol use, and physicalactivities. All data were obtained by means of standardinstruments.19-25
Clinical EvaluationA trained nurse-researcher carried out the initial evalua-
tions for the current study in the subjects’ homes one to threeweeks after the YHAP interview was conducted. Subjectswere asked about falls occurring during the previous twoyears, recent mobility, fear of falling, dizziness, unsteadi-ness, and musculoskeletal symptoms. The examinationassessed sitting-to-standing blood-pressure change at oneminute, near vision (with Jaeger’s test type) and distantvision (with Snellen’s test type), hearing (with the spokenword), foot problems, frontal reflexes, and position sense;muscle function in the shoulders, hands, hips, and knees wasalso tested manually and graded as normal or abnormal.26
The following standardized assessments of balance andgait were carried out: arising from and sitting in a chair;side-by-side standing with eyes opened and closed; with-standing a nudge on the sternum; turning the neck; turningin place; back extension; standing on one leg; reaching upand bending over; step length, height, symmetry, and conti-nuity; path deviation; trunk sway; walking stance; turning;and ability to walk faster. All items were scored as normalor abnormal. The balance-and-gait assessments and inter-rater reliability are discussed in detail elsewhere.27,28
The final component of the initial evaluation was a stan-dardized assessment of 30 potential hazards in the home,such as obstacles and poor lighting.
Outcome and Follow-upInformation on falls and their circumstances was obtained
during telephone calls made to participants every othermonth. A fall was defined as a subject’s unintentionallycoming to rest on the ground or at some other lower level,not as a result of a major intrinsic event (e.g., stroke or syn-cope) or overwhelming hazard.6 An overwhelming hazardwas defined as a hazard that would result in a fall by mostyoung, healthy persons, on the basis of a consensus of threephysicians and three physical therapists. A diary for record-ing falls, which included the same questions asked duringthe telephone interviews, was explained and left with eachsubject. A designated proxy was instructed in the use of thediary and contacted on follow-up as well as whenever thenurse-researcher doubted a subject’s reliability. Theresponse rate was over 90 percent for each telephone fol-low-up interview. If a follow-up interview had been missed,the subject was asked at the next interview about falls sincethe last contact. All but 7 of the 312 subjects (98 percent)who were still alive at 12 months were contacted for thefinal follow-up interview.
Definition of VariablesUsing a Guttman scale described elsewhere29 we divided
the subjects into five functional groups: (1) those with nofunctional disabilities, (2) those with a single gross impair-ment of mobility (e.g., the inability to walk up and downstairs without help), (3) those with a physical-performancedisability (e.g., difficulty in stooping or crouching), (4) thosewith both a gross impairment of mobility and a physical-per-formance disability, and (5) those with a disability in one ofthe basic activities of daily living (e.g., difficulty in bathing).The level of mobility was assessed in terms of a modifiedlife-space diameter, which groups subjects according to howfrequently they leave their neighborhood (daily, at least threetimes a week, or less than three times a week).30 Cognitiveimpairment was considered present if the subject made atleast five errors on the short portable mental-status question-naire.22 Sedatives listed as used by the subjects included ben-zodiazepines, phenothiazines, and antidepressants. Othermedications we listed were diuretics, antihypertensiveagents, and cardiac medications; these drugs were chosenbecause previous studies had suggested that the drugs had anassociation with falling. The percentage of near and distantbinocular-vision loss was calculated with use of a common-ly used formula, with impairment defined as at least a 20 per-cent loss.31 Serious foot problems included moderate orsevere bunions, toe deformities, ulcers, or deformed nails.Serious illnesses were defined as episodes that confined asubject to bed for at least 48 hours. Disabilities of the lowerextremities were any reported problems with strength, sensa-tion, or balance. The amount of displacement of the body’scenter of gravity outside the base of support in an activitywas classified as mild, moderate, or marked according to theconsensus of three physical therapists, who reviewed allactivities engaged in by subjects at the time of a fall. Thebody-mass index was calculated as the weight in kilogramsdivided by the square of the height in meters.24
Statistical AnalysisAfter using Student’s t-test to determine the mean differ-
ences between the subjects who fell and those who did not,we divided values for continuous variables into two groups ata pre-established point (as with results on the short portablemental status questionnaire or the Center for EpidemiologicStudies - Depression [CES-D]) or according to a clinical stan-dard when available (as for postural blood-pressure change).For the remaining continuous variables, we examined the dis-tribution of values among quartiles and divided the subjectsinto two groups only if there were two obvious levels of risk.We next estimated the relative risk of falling for each variable.These bivariate associations were used to select potential riskfactors for early linear-logistic models and also to select onevariable from a cluster of items that measured similar charac-teristics, such as disability of the lower extremities anddecreased knee strength.

Variables were sequentially deleted from the initial mod-els on the basis of a lack of significant change in the likeli-hood ratio. We then fitted log-linear models of allsecond-order interactions and main effects among the finalvariables. All multivariate models were fitted with use of thegeneralized linear iterative modeling computing package,which estimates the linear variables iteratively as maximumlikelihoods.32 Trends in falls according to risk score wereassessed by chi-square test for order in proportions.33 Theassociation between the balance-and-gait score and falls isdiscussed in Results below.
RESULTSThe average age (±SD) of the 336 subjects was 78.3±5.1
years; 55 percent were women; 87 percent were white. Theparticipants did not differ from the eligible nonparticipantsin the YHAP cohort in terms of age, sex, race, living situa-tion, or ability to perform basic activities of daily living.
One hundred eight subjects (32 percent; 95 percent confi-dence interval, 27 to 37 percent) had at least one fall duringthe one-year follow-up period. A total of 272 falls werereported. Fifty subjects (46 percent of those who fell) fellonce; 31 (29 percent) fell twice; and 27 (25 percent) fell atleast three times (range, 3 to 24). Nine subjects could notrecall the exact number of falls but reported more than three.The number of falls reported during each bimonthly fol-low-up period was similar. An additional 21 reported fallswere not included in the analyses described below becausethey occurred during a stroke (n = 1) or a syncopal episode(n = 10) or as a result of an overwhelming hazard (n = 10).The last group of falls occurred in four motor-vehicle acci-dents, when two folding chairs collapsed, and in four mis-cellaneous sets of circumstances.
The characteristics of the subjects who did and did not fallare shown in Table 1. Many demographic, psychological,functional, medical, and physical characteristics were asso-ciated with falling. Although only lower-extremity disabili-ties reported by the subjects are listed in Table 1, all signs ofdisability in the lower extremities found on examinationwere significantly associated with falling.
Assessment of Balance and GaitMost of the 20 balance-and-gait items we assessed wereassociated with falling (P<0.05, by chi-square). The 11 itemspertaining to balance were reduced first by an examinationof patterns of intercorrelation. For highly intercorrelatedclusters of items, the item with the highest association withfalling was retained and the others were eliminated from theanalysis. This procedure was also used for the nine itemspertaining to gait. We found that, with no reduction in rela-tive risk, we could further reduce the number of balance-andgait variables to a four-factor balance score and a three-fac-tor gait score by restricting the items to those with a preva-lence of over 40 percent (Table 2). Finally, we added thescores for balance and gait to yield a single summary scorewith a range of 0 to 7. The distribution of the subjects acrossthis range fell into three distinct categories, as shown inTable 2. The balance-and-gait score was moderately strong-ly associated with several of the characteristics listed in
Table 1, including age (y = 0.35), lower-extremity disability(y = 0.30), loss of near vision (y = 0.29), palmomental reflex(y = 0.34), and foot problems (y = 0. 16) (y is a measure ofassociation used for ordinal variables).
Table 1. Characteristics of Elderly Subjects Who Did and Did Not Fall.*
DID NOTFELL FALL
CHARACTERISTIC (N = 108) (N = 228) RR 95% CI
Sociodemographic characteristics
Age ≥80 yr (no.)† 63 101 1.5 1.1-2.0Mean age ±SD 79.5±5.6 77.9±4.8 – –Women 64 121 1.2 0.9-1.6White 98 194 1.6 0.9-2.8Living in housing for the elderly† 33 39 1.6 1.2-2.3
Environmental hazards
Mean no. ±SD† 13.6±5.2 14.4±5.2 – –≥ 1 Bedroom hazard 104 207 3.5§ 0.9-13.0≥-2 Living-room hazards 84 195 0.7 0.5-1.0
Psychological Functioning
Cognitive impairment†+ 16 8 2.3 1.5-3.5Depression†+ 28 32 1.7 1.2-2.3
Health and functioning
Mobility†Leaves neighborhood daily 23 81 1.0 –Leaves neighborhood 3-6 times/wk 25 50 1.1 0.9-2.4Leaves neighborhood < 3 times/wk 59 96 1.7 1.1-2.6
Functional level†+1 24 79 1.0 –2-3 24 67 1.1 0.7-1.84-5 60 102 1.8 1.1-2.9
Fell in previous two years 67 65 2.5 1.9-3.4Hospitalized in past year 22 44 1.0 0.7-1.5Episode of serious iflness†+ 37 49 1.5 1.1-2.1Urinary incontinence† 29 37 1.5 1.1-2.1Use of cane or walker† 41 45 1.8 1.3-2.4Weekly walk for exercise 33 92 0.7 0.5-1.0Other physical exercise weekly† 27 33 1.5 1.1-2.2
Medications and alcohol
Sedatives† 13 1 3.1 2.0-4.9Other medicationst†+ 74 124 1.5 1.1-2.1Alcohol intake
None 63 162 1.0 –<200 ml/mo 34 66 1.0 0.7-1.4>200 ml/mo 11 41 0.6 0.4-1.1
Physical symptoms or impairments
Any dizziness 54 102 1.2 0.8-1.6Any upper-extremity disability† 31 41 1.5 1.1-2.1Any lower-extremity disability†+ 73 85 2.4 1.7-3.2Serious foot problems†+ 48 79 1.4 1.0-1.8Palmomental reflex present† 34 26 2.1 1.5-2.9Near-vision loss >20%†+ 69 104 1.7 1.2-2.3Distant-vision loss >20%+ 76 142 1.4 0.9-2.0Postural blood-pressure drop >10% 12 32 0.8 0.5-1.4Body-mass index <125+ 48 92 1.2 0.8-1.6
*RR denotes relative risk, mid Cl confidence interval.†Included in initial multiple logistic-regression model.+See Methods for definition. §Data are, missing for four subjects.
(3)
© BIODEX MEDICAL SYSTEMS, INC. 4-31
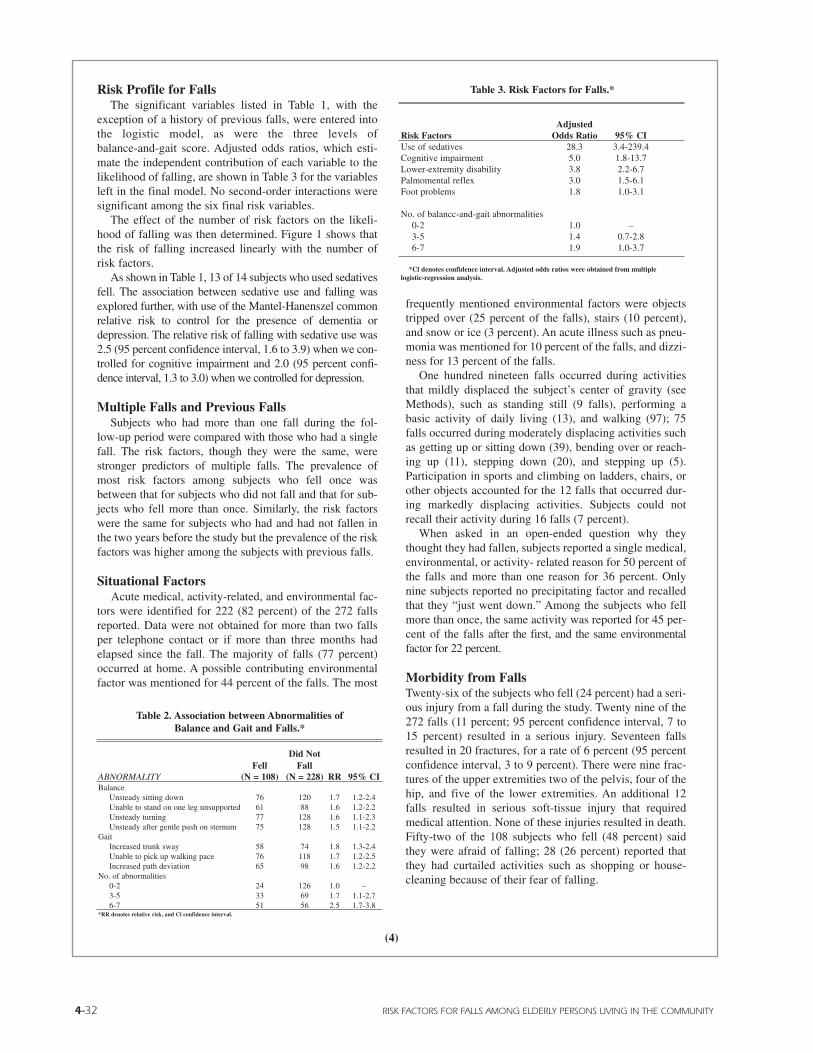
4-32 RISK FACTORS FOR FALLS AMONG ELDERLY PERSONS LIVING IN THE COMMUNITY
Risk Profile for FallsThe significant variables listed in Table 1, with the
exception of a history of previous falls, were entered intothe logistic model, as were the three levels ofbalance-and-gait score. Adjusted odds ratios, which esti-mate the independent contribution of each variable to thelikelihood of falling, are shown in Table 3 for the variablesleft in the final model. No second-order interactions weresignificant among the six final risk variables.
The effect of the number of risk factors on the likeli-hood of falling was then determined. Figure 1 shows thatthe risk of falling increased linearly with the number ofrisk factors.
As shown in Table 1, 13 of 14 subjects who used sedativesfell. The association between sedative use and falling wasexplored further, with use of the Mantel-Hanenszel commonrelative risk to control for the presence of dementia ordepression. The relative risk of falling with sedative use was2.5 (95 percent confidence interval, 1.6 to 3.9) when we con-trolled for cognitive impairment and 2.0 (95 percent confi-dence interval, 1.3 to 3.0) when we controlled for depression.
Multiple Falls and Previous FallsSubjects who had more than one fall during the fol-
low-up period were compared with those who had a singlefall. The risk factors, though they were the same, werestronger predictors of multiple falls. The prevalence ofmost risk factors among subjects who fell once wasbetween that for subjects who did not fall and that for sub-jects who fell more than once. Similarly, the risk factorswere the same for subjects who had and had not fallen inthe two years before the study but the prevalence of the riskfactors was higher among the subjects with previous falls.
Situational FactorsAcute medical, activity-related, and environmental fac-
tors were identified for 222 (82 percent) of the 272 fallsreported. Data were not obtained for more than two fallsper telephone contact or if more than three months hadelapsed since the fall. The majority of falls (77 percent)occurred at home. A possible contributing environmentalfactor was mentioned for 44 percent of the falls. The most
frequently mentioned environmental factors were objectstripped over (25 percent of the falls), stairs (10 percent),and snow or ice (3 percent). An acute illness such as pneu-monia was mentioned for 10 percent of the falls, and dizzi-ness for 13 percent of the falls.
One hundred nineteen falls occurred during activitiesthat mildly displaced the subject’s center of gravity (seeMethods), such as standing still (9 falls), performing abasic activity of daily living (13), and walking (97); 75falls occurred during moderately displacing activities suchas getting up or sitting down (39), bending over or reach-ing up (11), stepping down (20), and stepping up (5).Participation in sports and climbing on ladders, chairs, orother objects accounted for the 12 falls that occurred dur-ing markedly displacing activities. Subjects could notrecall their activity during 16 falls (7 percent).
When asked in an open-ended question why theythought they had fallen, subjects reported a single medical,environmental, or activity- related reason for 50 percent ofthe falls and more than one reason for 36 percent. Onlynine subjects reported no precipitating factor and recalledthat they “just went down.” Among the subjects who fellmore than once, the same activity was reported for 45 per-cent of the falls after the first, and the same environmentalfactor for 22 percent.
Morbidity from FallsTwenty-six of the subjects who fell (24 percent) had a seri-ous injury from a fall during the study. Twenty nine of the272 falls (11 percent; 95 percent confidence interval, 7 to15 percent) resulted in a serious injury. Seventeen fallsresulted in 20 fractures, for a rate of 6 percent (95 percentconfidence interval, 3 to 9 percent). There were nine frac-tures of the upper extremities two of the pelvis, four of thehip, and five of the lower extremities. An additional 12falls resulted in serious soft-tissue injury that requiredmedical attention. None of these injuries resulted in death.Fifty-two of the 108 subjects who fell (48 percent) saidthey were afraid of falling; 28 (26 percent) reported thatthey had curtailed activities such as shopping or house-cleaning because of their fear of falling.
Table 2. Association between Abnormalities of Balance and Gait and Falls.*
Did NotFell Fall
ABNORMALITY (N = 108) (N = 228) RR 95% CIBalance
Unsteady sitting down 76 120 1.7 1.2-2.4Unable to stand on one leg unsupported 61 88 1.6 1.2-2.2Unsteady turning 77 128 1.6 1.1-2.3Unsteady after gentle push on sternum 75 128 1.5 1.1-2.2
GaitIncreased trunk sway 58 74 1.8 1.3-2.4Unable to pick up walking pace 76 118 1.7 1.2-2.5Increased path deviation 65 98 1.6 1.2-2.2
No. of abnormalities0-2 24 126 1.0 –3-5 33 69 1.7 1.1-2.76-7 51 56 2.5 1.7-3.8
*RR denotes relative risk, and Cl confidence interval.
Table 3. Risk Factors for Falls.*
AdjustedRisk Factors Odds Ratio 95% CIUse of sedatives 28.3 3.4-239.4Cognitive impairment 5.0 1.8-13.7Lower-extremity disability 3.8 2.2-6.7Palmomental reflex 3.0 1.5-6.1Foot problems 1.8 1.0-3.1
No. of balancc-and-gait abnormalities0-2 1.0 –3-5 1.4 0.7-2.86-7 1.9 1.0-3.7
*Cl denotes confidence interval. Adjusted odds ratios were obtained from multiplelogistic-regression analysis.
(4)

© BIODEX MEDICAL SYSTEMS, INC. 4-33
(5)
DISCUSSIONIn this one-year prospective study of persons 75 years of
age and older living in the community, over 30 percent ofthe subjects fell at least once. Almost one quarter of thosewho fell had a serious injury; an approximately equal num-ber restricted their activities because of fear of falling. Therisk of falling increased linearly with the number of risk fac-tors, suggesting that the predisposition to fall may resultfrom the accumulated effect of multiple disabilities. Someof the factors, such as cognitive impairment and sedativeuse, although low in prevalence, were associated with a veryhigh risk of falling. The prevalence of such risk factorswould probably be higher in a clinical setting than in a com-munity sample.34
The principal clinical implication of our finding that therisk of falling increased with the number of disabilities isthat the risk may be reduced by modifying even a few fac-tors. Medical, surgical, rehabilitative, and environmentalinterventions may be effective in reducing the prevalence ofseveral risk factors.35(and Tinetti ME: unpublished data).Even risk factors that cannot be modified, such as palmo-mental reflex, identify elderly persons at risk who should beevaluated for the presence of other, modifiable, risk factors.
Most of the predisposing factors, including cognitiveimpairment, palmomental reflex, lower-extremity disability,foot problems, and balance-and-gait problems, indicate dif-ficulty with neurologic and musculoskeletal functions thatcontribute to physical stability. Poor vision was significant-ly associated with falling in a bivariate analysis but was notincluded in the final risk model, probably because of itsassociation with balance-and-gait abnormalities. Decreasedvision is an important risk factor, however, as other studieshave found, and should be included in any program to pre-vent falls. 6,11
We found, as have others, that cognitive impairment wasassociated with falling, even though potential subjects withsevere impairment were excluded from this study.10 Severeimpairment would have prevented the assessment of otherrisk factors and precluded the accurate reporting of falls.The exclusion of the severely impaired potential subjectsprobably resulted in an underestimate of the risk of fallingassociated with cognitive impairment.
The use of benzodiazepines, phenothiazines, and antide-pressants was associated with falling independently of otherrisk factors, including dementia and depression, the two dis-eases for which these drugs are most commonly prescribedin the elderly. The numbers in our sample were too small toexplore dose-response relations or the effects of individualsedatives. An increased risk of hip fracture has been foundwith the use of longer-acting medications.14
The absence of independent associations between fallingand the use of diuretics, antihypertensive agents, and cardiacmedications suggests that the use of such medications mayhave been a marker for the increased frailty associated withthe other risk factors. Unfortunately, we did not have infor-mation on dosages or individual drugs. Because of the
potential importance of medications in programs to preventfalls, the role of sedatives and nonsedative medications inpredisposing elderly persons to falls needs further clarification.
The palmomental reflex probably reflects central nervoussystem dysfunction, the role of which in gait disorders isbeing explored with the aid of computed axial tomographyand magnetic resonance imaging.36 The palmomental reflex,although nonspecific, is a simple test that may help to iden-tify elderly persons who require a more thorough clinicaland radiologic evaluation.
We were able to identify four items related to balance andthree related to gait that, in combination, predicted falls.However, the association with falling was not stronger forthese than for several other risk factors. There are severalpossible explanations for this finding. We may have sacri-ficed sensitivity and specificity for simplicity. A more pre-cise assessment of balance and gait, for example, with use ofcomputerized analysis, might have shown a stronger associ-
ation between balance-and-gait abnormalities and falling,although at the expense of clinical feasibility. The relationbetween gait and falling is complex. Elderly persons withgait problems may adapt over time or may avoid certainactivities, thus limiting their risk. Our findings suggest thatfalling has many causes and that balance and gait must beconsidered along with other risk factors.
We found no independent association between falling andany demographic characteristic, depression, alcohol con-sumption, postural hypotension, or environmental hazardsin the home. The bivariate associations of falling with age,living situation, and depression appeared to be related to theeffects of other risk factors.
100
80
60
40
20
0
Perc
ent F
allin
g
Number of Risk FactorsNo.Falling 4 20 30 35 18No.Subjects 51 106 94 58 23
0
8%
1
19%
2
32%
3
60%
4+
78%
Figure 1. Occurrence of Falls According to the Number of Risk Factors.
The risk factors included sedative use, cognitive impairment,lower-extrem-ity disability, palmomental reflex, foot problems, and balance-and-gaitabnormalities. There is a significant trend in the chi-square test for order inproportions (chi-square = 62.7;P<0.001). The denominator is 332 becauseof missing data on four subjects.
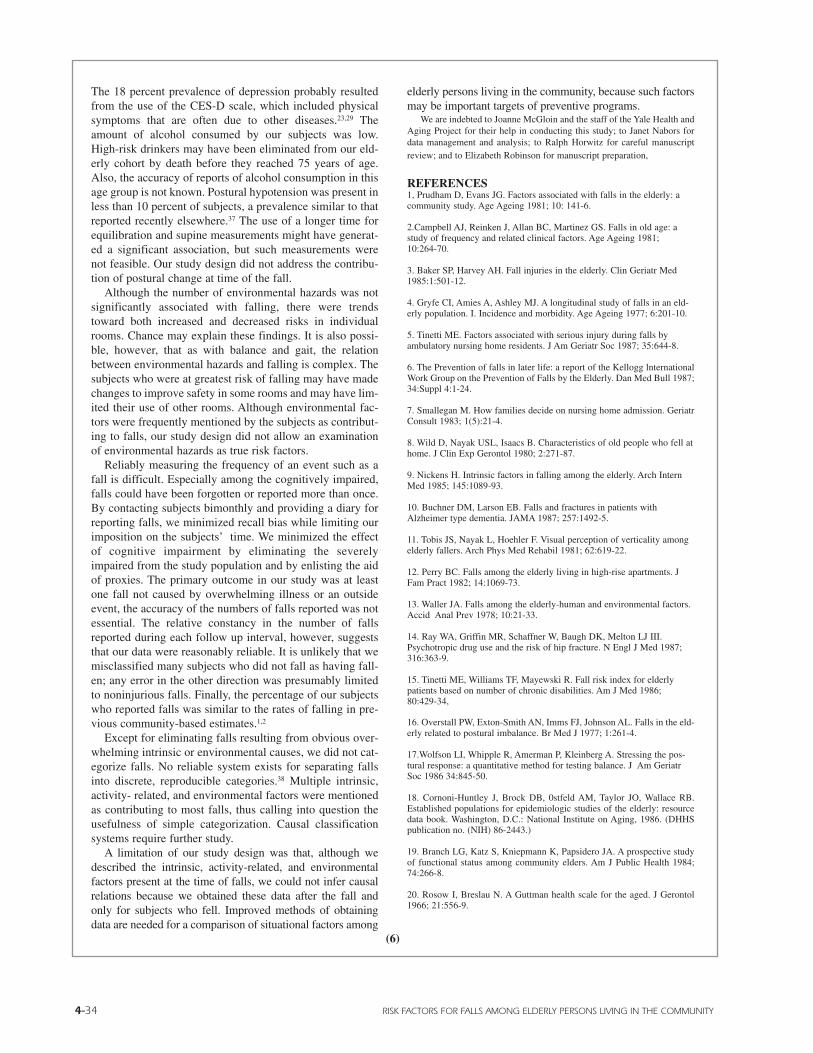
4-34 RISK FACTORS FOR FALLS AMONG ELDERLY PERSONS LIVING IN THE COMMUNITY
(6)
The 18 percent prevalence of depression probably resultedfrom the use of the CES-D scale, which included physicalsymptoms that are often due to other diseases.23,29 Theamount of alcohol consumed by our subjects was low.High-risk drinkers may have been eliminated from our eld-erly cohort by death before they reached 75 years of age.Also, the accuracy of reports of alcohol consumption in thisage group is not known. Postural hypotension was present inless than 10 percent of subjects, a prevalence similar to thatreported recently elsewhere.37 The use of a longer time forequilibration and supine measurements might have generat-ed a significant association, but such measurements werenot feasible. Our study design did not address the contribu-tion of postural change at time of the fall.
Although the number of environmental hazards was notsignificantly associated with falling, there were trendstoward both increased and decreased risks in individualrooms. Chance may explain these findings. It is also possi-ble, however, that as with balance and gait, the relationbetween environmental hazards and falling is complex. Thesubjects who were at greatest risk of falling may have madechanges to improve safety in some rooms and may have lim-ited their use of other rooms. Although environmental fac-tors were frequently mentioned by the subjects as contribut-ing to falls, our study design did not allow an examinationof environmental hazards as true risk factors.
Reliably measuring the frequency of an event such as afall is difficult. Especially among the cognitively impaired,falls could have been forgotten or reported more than once.By contacting subjects bimonthly and providing a diary forreporting falls, we minimized recall bias while limiting ourimposition on the subjects’ time. We minimized the effectof cognitive impairment by eliminating the severelyimpaired from the study population and by enlisting the aidof proxies. The primary outcome in our study was at leastone fall not caused by overwhelming illness or an outsideevent, the accuracy of the numbers of falls reported was notessential. The relative constancy in the number of fallsreported during each follow up interval, however, suggeststhat our data were reasonably reliable. It is unlikely that wemisclassified many subjects who did not fall as having fall-en; any error in the other direction was presumably limitedto noninjurious falls. Finally, the percentage of our subjectswho reported falls was similar to the rates of falling in pre-vious community-based estimates.1,2
Except for eliminating falls resulting from obvious over-whelming intrinsic or environmental causes, we did not cat-egorize falls. No reliable system exists for separating fallsinto discrete, reproducible categories.38 Multiple intrinsic,activity- related, and environmental factors were mentionedas contributing to most falls, thus calling into question theusefulness of simple categorization. Causal classificationsystems require further study.
A limitation of our study design was that, although wedescribed the intrinsic, activity-related, and environmentalfactors present at the time of falls, we could not infer causalrelations because we obtained these data after the fall andonly for subjects who fell. Improved methods of obtainingdata are needed for a comparison of situational factors among
elderly persons living in the community, because such factorsmay be important targets of preventive programs.
We are indebted to Joanne McGloin and the staff of the Yale Health andAging Project for their help in conducting this study; to Janet Nabors fordata management and analysis; to Ralph Horwitz for careful manuscriptreview; and to Elizabeth Robinson for manuscript preparation,
REFERENCES1, Prudham D, Evans JG. Factors associated with falls in the elderly: acommunity study. Age Ageing 1981; 10: 141-6.
2.Campbell AJ, Reinken J, Allan BC, Martinez GS. Falls in old age: astudy of frequency and related clinical factors. Age Ageing 1981;10:264-70.
3. Baker SP, Harvey AH. Fall injuries in the elderly. Clin Geriatr Med1985:1:501-12.
4. Gryfe CI, Amies A, Ashley MJ. A longitudinal study of falls in an eld-erly population. I. Incidence and morbidity. Age Ageing 1977; 6:201-10.
5. Tinetti ME. Factors associated with serious injury during falls byambulatory nursing home residents. J Am Geriatr Soc 1987; 35:644-8.
6. The Prevention of falls in later life: a report of the Kellogg lnternationalWork Group on the Prevention of Falls by the Elderly. Dan Med Bull 1987;34:Suppl 4:1-24.
7. Smallegan M. How families decide on nursing home admission. GeriatrConsult 1983; 1(5):21-4.
8. Wild D, Nayak USL, Isaacs B. Characteristics of old people who fell athome. J Clin Exp Gerontol 1980; 2:271-87.
9. Nickens H. Intrinsic factors in falling among the elderly. Arch InternMed 1985; 145:1089-93.
10. Buchner DM, Larson EB. Falls and fractures in patients withAlzheimer type dementia. JAMA 1987; 257:1492-5.
11. Tobis JS, Nayak L, Hoehler F. Visual perception of verticality amongelderly fallers. Arch Phys Med Rehabil 1981; 62:619-22.
12. Perry BC. Falls among the elderly living in high-rise apartments. JFam Pract 1982; 14:1069-73.
13. Waller JA. Falls among the elderly-human and environmental factors.Accid Anal Prev 1978; 10:21-33.
14. Ray WA, Griffin MR, Schaffner W, Baugh DK, Melton LJ III.Psychotropic drug use and the risk of hip fracture. N Engl J Med 1987;316:363-9.
15. Tinetti ME, Williams TF, Mayewski R. Fall risk index for elderlypatients based on number of chronic disabilities. Am J Med 1986;80:429-34,
16. Overstall PW, Exton-Smith AN, Imms FJ, Johnson AL. Falls in the eld-erly related to postural imbalance. Br Med J 1977; 1:261-4.
17.Wolfson LI, Whipple R, Amerman P, Kleinberg A. Stressing the pos-tural response: a quantitative method for testing balance. J Am GeriatrSoc 1986 34:845-50.
18. Cornoni-Huntley J, Brock DB, 0stfeld AM, Taylor JO, Wallace RB.Established populations for epidemiologic studies of the elderly: resourcedata book. Washington, D.C.: National Institute on Aging, 1986. (DHHSpublication no. (NIH) 86-2443.)
19. Branch LG, Katz S, Kniepmann K, Papsidero JA. A prospective studyof functional status among community elders. Am J Public Health 1984;74:266-8.
20. Rosow I, Breslau N. A Guttman health scale for the aged. J Gerontol1966; 21:556-9.
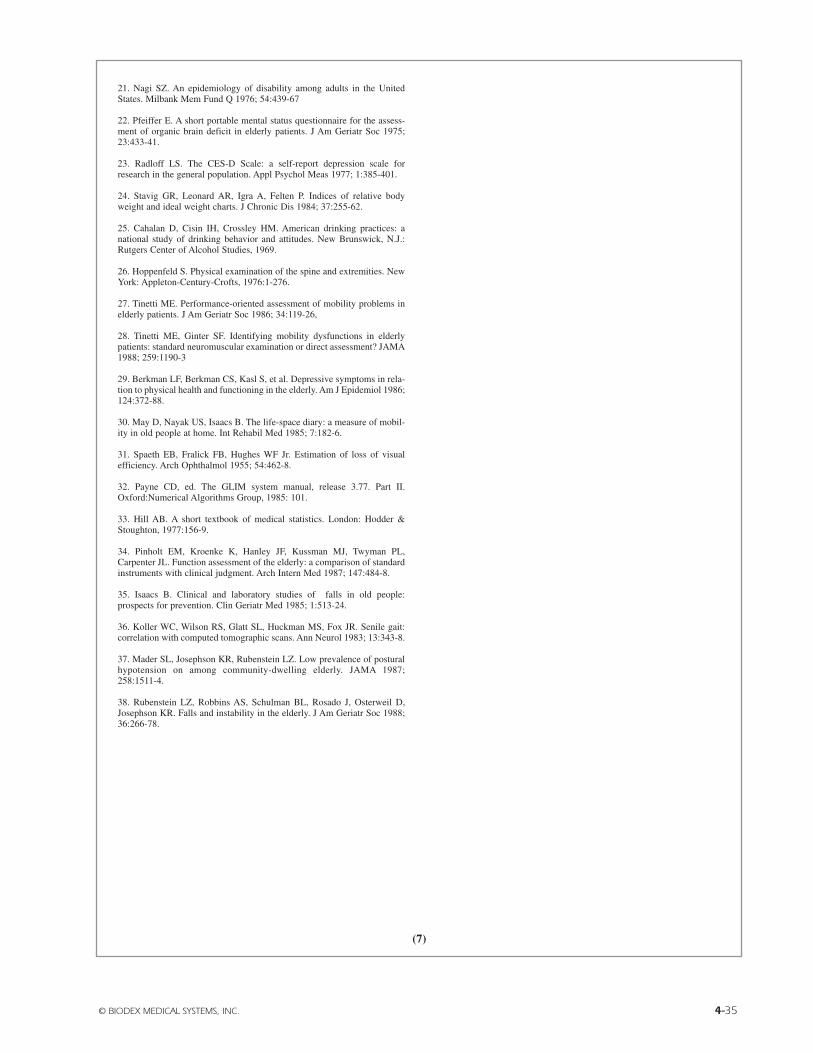
© BIODEX MEDICAL SYSTEMS, INC. 4-35
(7)
21. Nagi SZ. An epidemiology of disability among adults in the UnitedStates. Milbank Mem Fund Q 1976; 54:439-67
22. Pfeiffer E. A short portable mental status questionnaire for the assess-ment of organic brain deficit in elderly patients. J Am Geriatr Soc 1975;23:433-41.
23. Radloff LS. The CES-D Scale: a self-report depression scale forresearch in the general population. Appl Psychol Meas 1977; 1:385-401.
24. Stavig GR, Leonard AR, Igra A, Felten P. Indices of relative bodyweight and ideal weight charts. J Chronic Dis 1984; 37:255-62.
25. Cahalan D, Cisin IH, Crossley HM. American drinking practices: anational study of drinking behavior and attitudes. New Brunswick, N.J.:Rutgers Center of Alcohol Studies, 1969.
26. Hoppenfeld S. Physical examination of the spine and extremities. NewYork: Appleton-Century-Crofts, 1976:1-276.
27. Tinetti ME. Performance-oriented assessment of mobility problems inelderly patients. J Am Geriatr Soc 1986; 34:119-26,
28. Tinetti ME, Ginter SF. Identifying mobility dysfunctions in elderlypatients: standard neuromuscular examination or direct assessment? JAMA1988; 259:1190-3
29. Berkman LF, Berkman CS, Kasl S, et al. Depressive symptoms in rela-tion to physical health and functioning in the elderly. Am J Epidemiol 1986;124:372-88.
30. May D, Nayak US, Isaacs B. The life-space diary: a measure of mobil-ity in old people at home. Int Rehabil Med 1985; 7:182-6.
31. Spaeth EB, Fralick FB, Hughes WF Jr. Estimation of loss of visualefficiency. Arch Ophthalmol 1955; 54:462-8.
32. Payne CD, ed. The GLIM system manual, release 3.77. Part II.Oxford:Numerical Algorithms Group, 1985: 101.
33. Hill AB. A short textbook of medical statistics. London: Hodder &Stoughton, 1977:156-9.
34. Pinholt EM, Kroenke K, Hanley JF, Kussman MJ, Twyman PL,Carpenter JL. Function assessment of the elderly: a comparison of standardinstruments with clinical judgment. Arch Intern Med 1987; 147:484-8.
35. Isaacs B. Clinical and laboratory studies of falls in old people:prospects for prevention. Clin Geriatr Med 1985; 1:513-24.
36. Koller WC, Wilson RS, Glatt SL, Huckman MS, Fox JR. Senile gait:correlation with computed tomographic scans. Ann Neurol 1983; 13:343-8.
37. Mader SL, Josephson KR, Rubenstein LZ. Low prevalence of posturalhypotension on among community-dwelling elderly. JAMA 1987;258:1511-4.
38. Rubenstein LZ, Robbins AS, Schulman BL, Rosado J, Osterweil D,Josephson KR. Falls and instability in the elderly. J Am Geriatr Soc 1988;36:266-78.

4-36
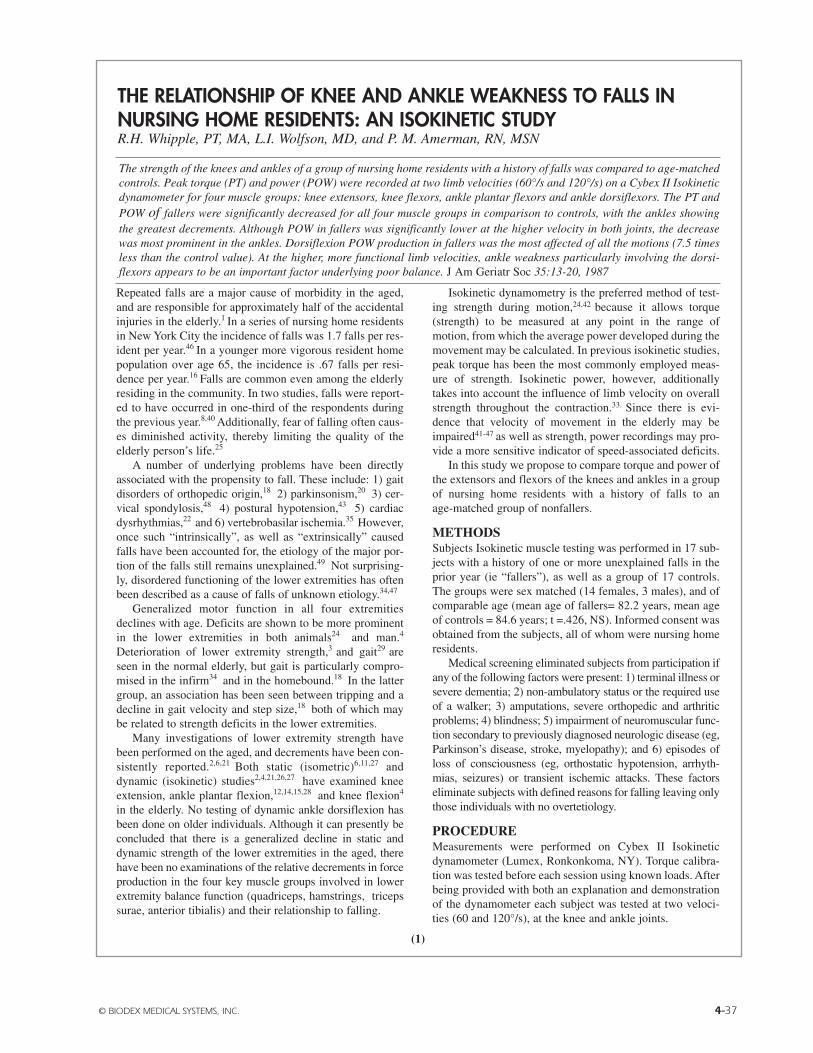
© BIODEX MEDICAL SYSTEMS, INC. 4-37
(1)
Repeated falls are a major cause of morbidity in the aged,and are responsible for approximately half of the accidentalinjuries in the elderly.1 In a series of nursing home residentsin New York City the incidence of falls was 1.7 falls per res-ident per year.46 In a younger more vigorous resident homepopulation over age 65, the incidence is .67 falls per resi-dence per year.16 Falls are common even among the elderlyresiding in the community. In two studies, falls were report-ed to have occurred in one-third of the respondents duringthe previous year.8,40 Additionally, fear of falling often caus-es diminished activity, thereby limiting the quality of theelderly person’s life.25
A number of underlying problems have been directlyassociated with the propensity to fall. These include: 1) gaitdisorders of orthopedic origin,18 2) parkinsonism,20 3) cer-vical spondylosis,48 4) postural hypotension,43 5) cardiacdysrhythmias,22 and 6) vertebrobasilar ischemia.35 However,once such “intrinsically”, as well as “extrinsically” causedfalls have been accounted for, the etiology of the major por-tion of the falls still remains unexplained.49 Not surprising-ly, disordered functioning of the lower extremities has oftenbeen described as a cause of falls of unknown etiology.34,47
Generalized motor function in all four extremitiesdeclines with age. Deficits are shown to be more prominentin the lower extremities in both animals24 and man.4
Deterioration of lower extremity strength,3 and gait29 areseen in the normal elderly, but gait is particularly compro-mised in the infirm34 and in the homebound.18 In the lattergroup, an association has been seen between tripping and adecline in gait velocity and step size,18 both of which maybe related to strength deficits in the lower extremities.
Many investigations of lower extremity strength havebeen performed on the aged, and decrements have been con-sistently reported.2,6,21 Both static (isometric)6,11,27 anddynamic (isokinetic) studies2,4,21,26,27 have examined kneeextension, ankle plantar flexion,12,14,15,28 and knee flexion4
in the elderly. No testing of dynamic ankle dorsiflexion hasbeen done on older individuals. Although it can presently beconcluded that there is a generalized decline in static anddynamic strength of the lower extremities in the aged, therehave been no examinations of the relative decrements in forceproduction in the four key muscle groups involved in lowerextremity balance function (quadriceps, hamstrings, tricepssurae, anterior tibialis) and their relationship to falling.
Isokinetic dynamometry is the preferred method of test-ing strength during motion,24,42 because it allows torque(strength) to be measured at any point in the range ofmotion, from which the average power developed during themovement may be calculated. In previous isokinetic studies,peak torque has been the most commonly employed meas-ure of strength. Isokinetic power, however, additionallytakes into account the influence of limb velocity on overallstrength throughout the contraction.33. Since there is evi-dence that velocity of movement in the elderly may beimpaired41-47 as well as strength, power recordings may pro-vide a more sensitive indicator of speed-associated deficits.
In this study we propose to compare torque and power ofthe extensors and flexors of the knees and ankles in a groupof nursing home residents with a history of falls to anage-matched group of nonfallers.
METHODSSubjects Isokinetic muscle testing was performed in 17 sub-jects with a history of one or more unexplained falls in theprior year (ie “fallers”), as well as a group of 17 controls.The groups were sex matched (14 females, 3 males), and ofcomparable age (mean age of fallers= 82.2 years, mean ageof controls = 84.6 years; t =.426, NS). Informed consent wasobtained from the subjects, all of whom were nursing homeresidents.
Medical screening eliminated subjects from participation ifany of the following factors were present: 1) terminal illness orsevere dementia; 2) non-ambulatory status or the required useof a walker; 3) amputations, severe orthopedic and arthriticproblems; 4) blindness; 5) impairment of neuromuscular func-tion secondary to previously diagnosed neurologic disease (eg,Parkinson’s disease, stroke, myelopathy); and 6) episodes ofloss of consciousness (eg, orthostatic hypotension, arrhyth-mias, seizures) or transient ischemic attacks. These factorseliminate subjects with defined reasons for falling leaving onlythose individuals with no overtetiology.
PROCEDUREMeasurements were performed on Cybex II Isokineticdynamometer (Lumex, Ronkonkoma, NY). Torque calibra-tion was tested before each session using known loads. Afterbeing provided with both an explanation and demonstrationof the dynamometer each subject was tested at two veloci-ties (60 and 120°/s), at the knee and ankle joints.
The strength of the knees and ankles of a group of nursing home residents with a history of falls was compared to age-matchedcontrols. Peak torque (PT) and power (POW) were recorded at two limb velocities (60°/s and 120°/s) on a Cybex II Isokineticdynamometer for four muscle groups: knee extensors, knee flexors, ankle plantar flexors and ankle dorsiflexors. The PT andPOW of fallers were significantly decreased for all four muscle groups in comparison to controls, with the ankles showingthe greatest decrements. Although POW in fallers was significantly lower at the higher velocity in both joints, the decreasewas most prominent in the ankles. Dorsiflexion POW production in fallers was the most affected of all the motions (7.5 timesless than the control value). At the higher, more functional limb velocities, ankle weakness particularly involving the dorsi-flexors appears to be an important factor underlying poor balance. J Am Geriatr Soc 35:13-20, 1987
THE RELATIONSHIP OF KNEE AND ANKLE WEAKNESS TO FALLS INNURSING HOME RESIDENTS: AN ISOKINETIC STUDYR.H. Whipple, PT, MA, L.I. Wolfson, MD, and P. M. Amerman, RN, MSN
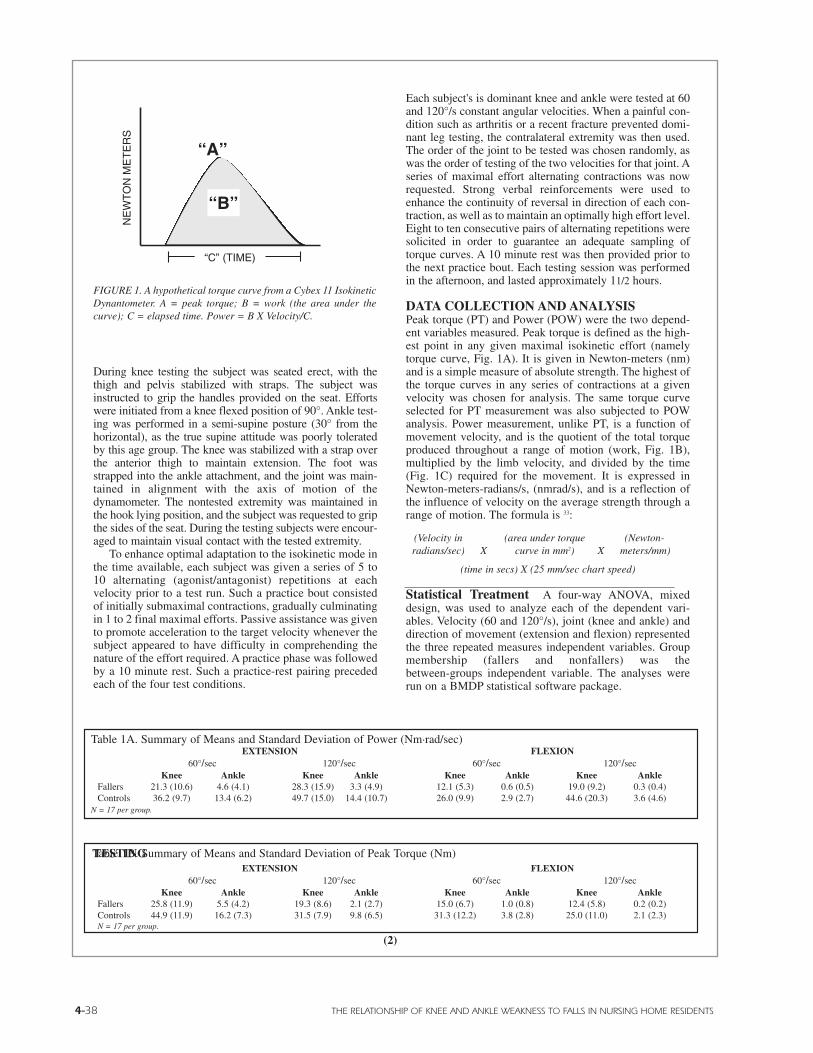
4-38 THE RELATIONSHIP OF KNEE AND ANKLE WEAKNESS TO FALLS IN NURSING HOME RESIDENTS
During knee testing the subject was seated erect, with thethigh and pelvis stabilized with straps. The subject wasinstructed to grip the handles provided on the seat. Effortswere initiated from a knee flexed position of 90°. Ankle test-ing was performed in a semi-supine posture (30° from thehorizontal), as the true supine attitude was poorly toleratedby this age group. The knee was stabilized with a strap overthe anterior thigh to maintain extension. The foot wasstrapped into the ankle attachment, and the joint was main-tained in alignment with the axis of motion of thedynamometer. The nontested extremity was maintained inthe hook lying position, and the subject was requested to gripthe sides of the seat. During the testing subjects were encour-aged to maintain visual contact with the tested extremity.
To enhance optimal adaptation to the isokinetic mode inthe time available, each subject was given a series of 5 to10 alternating (agonist/antagonist) repetitions at eachvelocity prior to a test run. Such a practice bout consistedof initially submaximal contractions, gradually culminatingin 1 to 2 final maximal efforts. Passive assistance was givento promote acceleration to the target velocity whenever thesubject appeared to have difficulty in comprehending thenature of the effort required. A practice phase was followedby a 10 minute rest. Such a practice-rest pairing precededeach of the four test conditions.
TESTING
Each subject's is dominant knee and ankle were tested at 60and 120°/s constant angular velocities. When a painful con-dition such as arthritis or a recent fracture prevented domi-nant leg testing, the contralateral extremity was then used.The order of the joint to be tested was chosen randomly, aswas the order of testing of the two velocities for that joint. Aseries of maximal effort alternating contractions was nowrequested. Strong verbal reinforcements were used toenhance the continuity of reversal in direction of each con-traction, as well as to maintain an optimally high effort level.Eight to ten consecutive pairs of alternating repetitions weresolicited in order to guarantee an adequate sampling oftorque curves. A 10 minute rest was then provided prior tothe next practice bout. Each testing session was performedin the afternoon, and lasted approximately 11/2 hours.
DATA COLLECTION AND ANALYSISPeak torque (PT) and Power (POW) were the two depend-ent variables measured. Peak torque is defined as the high-est point in any given maximal isokinetic effort (namelytorque curve, Fig. 1A). It is given in Newton-meters (nm)and is a simple measure of absolute strength. The highest ofthe torque curves in any series of contractions at a givenvelocity was chosen for analysis. The same torque curveselected for PT measurement was also subjected to POWanalysis. Power measurement, unlike PT, is a function ofmovement velocity, and is the quotient of the total torqueproduced throughout a range of motion (work, Fig. 1B),multiplied by the limb velocity, and divided by the time(Fig. 1C) required for the movement. It is expressed inNewton-meters-radians/s, (nmrad/s), and is a reflection ofthe influence of velocity on the average strength through arange of motion. The formula is 33:
(Velocity in (area under torque (Newton-radians/sec) X curve in mm2) X meters/mm)
(time in secs) X (25 mm/sec chart speed)
Statistical Treatment A four-way ANOVA, mixeddesign, was used to analyze each of the dependent vari-ables. Velocity (60 and 120°/s), joint (knee and ankle) anddirection of movement (extension and flexion) representedthe three repeated measures independent variables. Groupmembership (fallers and nonfallers) was thebetween-groups independent variable. The analyses wererun on a BMDP statistical software package.
EXTENSION FLEXION60°/sec 120°/sec 60°/sec 120°/sec
Knee Ankle Knee Ankle Knee Ankle Knee AnkleFallers 21.3 (10.6) 4.6 (4.1) 28.3 (15.9) 3.3 (4.9) 12.1 (5.3) 0.6 (0.5) 19.0 (9.2) 0.3 (0.4)Controls 36.2 (9.7) 13.4 (6.2) 49.7 (15.0) 14.4 (10.7) 26.0 (9.9) 2.9 (2.7) 44.6 (20.3) 3.6 (4.6)
N = 17 per group.
EXTENSION FLEXION60°/sec 120°/sec 60°/sec 120°/sec
Knee Ankle Knee Ankle Knee Ankle Knee AnkleFallers 25.8 (11.9) 5.5 (4.2) 19.3 (8.6) 2.1 (2.7) 15.0 (6.7) 1.0 (0.8) 12.4 (5.8) 0.2 (0.2)Controls 44.9 (11.9) 16.2 (7.3) 31.5 (7.9) 9.8 (6.5) 31.3 (12.2) 3.8 (2.8) 25.0 (11.0) 2.1 (2.3)N = 17 per group.
Table 1A. Summary of Means and Standard Deviation of Power (Nm.rad/sec)
Table 1B. Summary of Means and Standard Deviation of Peak Torque (Nm)
“C” (TIME)
NE
WT
ON
ME
TE
RS
FIGURE 1. A hypothetical torque curve from a Cybex 11 IsokineticDynantometer. A = peak torque; B = work (the area under thecurve); C = elapsed time. Power = B X Velocity/C.
“A”
“B”
(2)
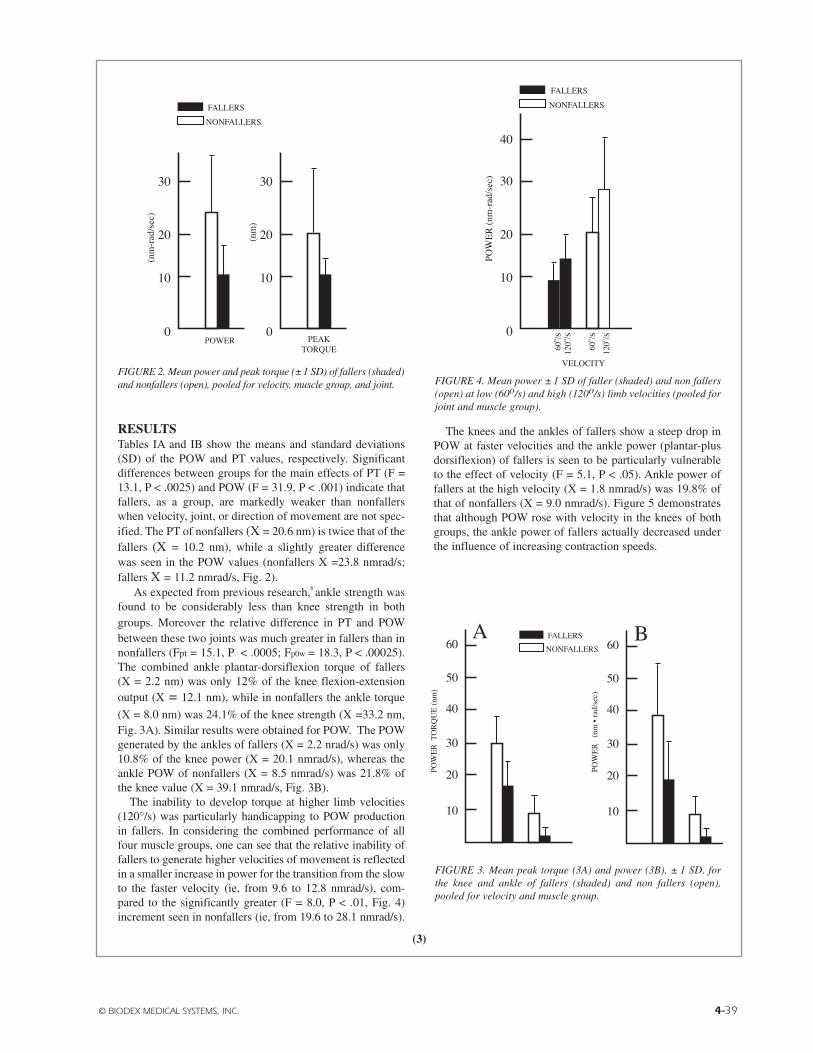
© BIODEX MEDICAL SYSTEMS, INC. 4-39
RESULTSTables IA and IB show the means and standard deviations(SD) of the POW and PT values, respectively. Significantdifferences between groups for the main effects of PT (F =13.1, P < .0025) and POW (F = 31.9, P < .001) indicate thatfallers, as a group, are markedly weaker than nonfallerswhen velocity, joint, or direction of movement are not spec-ified. The PT of nonfallers (X = 20.6 nm) is twice that of thefallers (X = 10.2 nm), while a slightly greater differencewas seen in the POW values (nonfallers X =23.8 nmrad/s;fallers X = 11.2 nmrad/s, Fig. 2).
As expected from previous research,6 ankle strength wasfound to be considerably less than knee strength in bothgroups. Moreover the relative difference in PT and POWbetween these two joints was much greater in fallers than innonfallers (Fpt = 15.1, P < .0005; Fp0w = 18.3, P < .00025).The combined ankle plantar-dorsiflexion torque of fallers(X = 2.2 nm) was only 12% of the knee flexion-extensionoutput (X = 12.1 nm), while in nonfallers the ankle torque
(X = 8.0 nm) was 24.1% of the knee strength (X =33.2 nm,Fig. 3A). Similar results were obtained for POW. The POWgenerated by the ankles of fallers (X = 2.2 nrad/s) was only10.8% of the knee power (X = 20.1 nmrad/s), whereas theankle POW of nonfallers (X = 8.5 nmrad/s) was 21.8% ofthe knee value (X = 39.1 nmrad/s, Fig. 3B).
The inability to develop torque at higher limb velocities(120°/s) was particularly handicapping to POW productionin fallers. In considering the combined performance of allfour muscle groups, one can see that the relative inability offallers to generate higher velocities of movement is reflectedin a smaller increase in power for the transition from the slowto the faster velocity (ie, from 9.6 to 12.8 nmrad/s), com-pared to the significantly greater (F = 8.0, P < .01, Fig. 4)increment seen in nonfallers (ie, from 19.6 to 28.1 nmrad/s).
The knees and the ankles of fallers show a steep drop inPOW at faster velocities and the ankle power (plantar-plusdorsiflexion) of fallers is seen to be particularly vulnerableto the effect of velocity (F = 5.1, P < .05). Ankle power offallers at the high velocity (X = 1.8 nmrad/s) was 19.8% ofthat of nonfallers (X = 9.0 nmrad/s). Figure 5 demonstratesthat although POW rose with velocity in the knees of bothgroups, the ankle power of fallers actually decreased underthe influence of increasing contraction speeds.
FIGURE 3. Mean peak torque (3A) and power (3B), ± 1 SD, forthe knee and ankle of fallers (shaded) and non fallers (open),pooled for velocity and muscle group.
FIGURE 2. Mean power and peak torque (±1 SD) of fallers (shaded)and nonfallers (open), pooled for velocity, muscle group, and joint. FIGURE 4. Mean power ± 1 SD of faller (shaded) and non fallers
(open) at low (60o/s) and high (120o/s) limb velocities (pooled forjoint and muscle group).
(3)

4-40 THE RELATIONSHIP OF KNEE AND ANKLE WEAKNESS TO FALLS IN NURSING HOME RESIDENTS
The ankle dorsiflexion power of fallers was the mostcompromised of all the motions tested. A significant3-way interaction (F = 5.9, P < .010) shows that fallersexerted less than 1 nmrad/s of dorsiflexion power (X = .42nmrad/s), 71/2 times less than in nonfallers (X = 3.21nmrad/sec). In none of the other three motions tested is thePOW of fallers as low as when compared to the nonfall-ers’ values. Figure 6 illustrates the means and SDs of fall-ers’ and nonfallers’ POW output for each of the fourmotions, and depicts the proportionately greater POWdeficits in the dorsiflexion of fallers, as well as the rela-tively greater ankle weakness in general for this group.
Despite the depressed dorsiflexion performance at thehigh velocity for the fallers, no statistically significant4-way interaction was attained (Fpt = .22, NS, Fpow, =1.77, NS). However, when mean values alone are consid-ered (Table 1) it is apparent from the ratios of theFallers/Nonfallers scores that the 120°/s (high velocity)POW values of fallers for ankle dorsiflexion are approxi-mately 1/10 (0.3/3.6) of the nonfaller equivalents.
DISCUSSIONLower Extremity Weakness in Fallers Althoughweakness and decreased mobility are associated withfalling,32 this study is the first to record a generalizeddecrease in lower extremity PT and POW in fallers. Thesefindings are compatible with a report of quadriceps weak-ness in elderly subjects scoring low in gait and stair climb-ing function,3 two ADL activities that have been shown tobe compromised in fallers.8-18
The generalized loss of muscle mass, and in particular,the progressive decrease in type II fiber diameter andnumber in the LE19-39 explain the decrease in leg strengthseen in aging.21,38 It may be inferred from the findings ofAniansson et al.5 that the pattern of type II fiber atrophy isincreased in fallers. They biopsied the quadriceps of 52patients undergoing hip surgery due to fall-induced frac-tures, and found a disproportionately greater increase intype II fiber atrophy in the fracture patients compared to acontrol group of comparable age. The fracture patientshad a history of decreased activity level along with athreefold increase in the use of walking aids by compari-son with controls.
Velocity Dependence in Fallers Fallers in the pres-ent study showed a markedly reduced POW output at thehigher velocity in all four motions when compared to con-trols. Although a decrease in speed of motion has beenreported41 during the aging process, there have been nolimb velocity studies performed on fallers to substantiatesuch a disproportionate decrease in POW for this group.However, suggestion of a decreased limb velocity can beinferred from a report of slower walking speed in fallers,18
even though individual joint velocities were not measured.The type II muscle atrophy observed in the elderly has
been associated with a greater decrease in torque at high-er isokinetic velocities38 and with lower maximal peakknee extension velocities.21 Adequate quadriceps contrac-tile speed may be an important factor in protecting againstfalls in view of the association of knee extensor strengthto walking and stair climbing ability,3 both of which arecompromised in fallers.
60
50
40
30
20
10
0
KNEE FLEX
ANKLE PL-FLX
KNEE EXTENSION
ANKLE DO-FLX
POW
ER
(nm
-rad
/sec
)
60
50
40
30
20
10
KNEE60o/s
KNEE120o/s
ANKLE60o/s
ANKLE120o/s
POW
ER
(nm
-rad
/sec
)
FALLERS
NONFALLERS
60
50
40
30
20
10
0
KNEE FLEX
ANKLE PL-FLX
KNEE EXTENSION
ANKLE DO-FLX
POW
ER
(nm
-rad
/sec
)
60
50
40
30
20
10
KNEE60o/s
KNEE120o/s
ANKLE60o/s
ANKLE120o/s
POW
ER
(nm
-rad
/sec
)
FALLERS
NONFALLERS
FIGURE 6. Mean power ± 1 SD of fallers (shaded) and nonfallers(open) for knee extension-flexion, and ankle plantar-dorsiflexion(pooled for velocity).
FIGURE 5. Mean power ± 1 SD of fallers (shaded) and nonfallers(open) for the knee and ankle at low, (60°/s) and high (120°/s) limbvelocities; (pooled for muscle group).
(4)
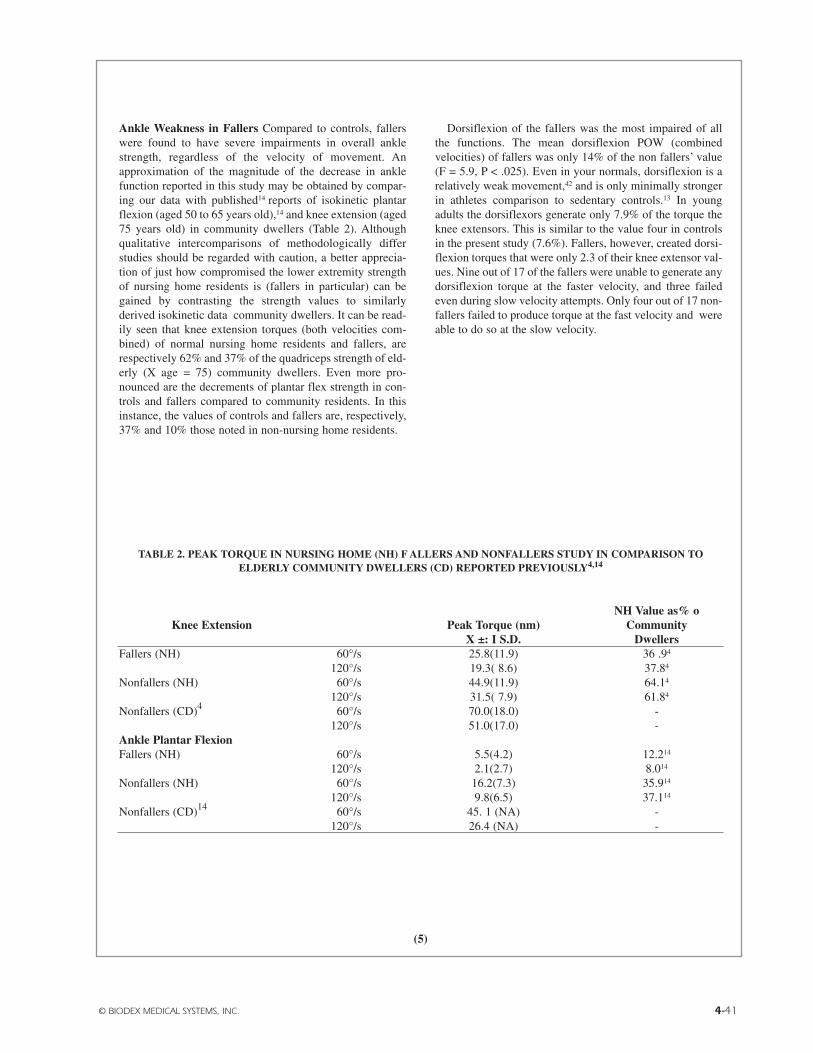
© BIODEX MEDICAL SYSTEMS, INC. 4-41
TABLE 2. PEAK TORQUE IN NURSING HOME (NH) F ALLERS AND NONFALLERS STUDY IN COMPARISON TOELDERLY COMMUNITY DWELLERS (CD) REPORTED PREVIOUSLY4,14
NH Value as% oKnee Extension Peak Torque (nm) Community
X ±: I S.D. DwellersFallers (NH) 60°/s 25.8(11.9) 36 .94
120°/s 19.3( 8.6) 37.84
Nonfallers (NH) 60°/s 44.9(11.9) 64.14
120°/s 31.5( 7.9) 61.84
Nonfallers (CD)4 60°/s 70.0(18.0) -120°/s 51.0(17.0) -
Ankle Plantar FlexionFallers (NH) 60°/s 5.5(4.2) 12.214
120°/s 2.1(2.7) 8.014
Nonfallers (NH) 60°/s 16.2(7.3) 35.914
120°/s 9.8(6.5) 37.114
Nonfallers (CD)14 60°/s 45. 1 (NA) -120°/s 26.4 (NA) -
Ankle Weakness in Fallers Compared to controls, fallerswere found to have severe impairments in overall anklestrength, regardless of the velocity of movement. Anapproximation of the magnitude of the decrease in anklefunction reported in this study may be obtained by compar-ing our data with published14 reports of isokinetic plantarflexion (aged 50 to 65 years old),14 and knee extension (aged75 years old) in community dwellers (Table 2). Althoughqualitative intercomparisons of methodologically differstudies should be regarded with caution, a better apprecia-tion of just how compromised the lower extremity strengthof nursing home residents is (fallers in particular) can begained by contrasting the strength values to similarlyderived isokinetic data community dwellers. It can be read-ily seen that knee extension torques (both velocities com-bined) of normal nursing home residents and fallers, arerespectively 62% and 37% of the quadriceps strength of eld-erly (X age = 75) community dwellers. Even more pro-nounced are the decrements of plantar flex strength in con-trols and fallers compared to community residents. In thisinstance, the values of controls and fallers are, respectively,37% and 10% those noted in non-nursing home residents.
Dorsiflexion of the faIlers was the most impaired of allthe functions. The mean dorsiflexion POW (combinedvelocities) of fallers was only 14% of the non fallers’ value(F = 5.9, P < .025). Even in your normals, dorsiflexion is arelatively weak movement,42 and is only minimally strongerin athletes comparison to sedentary controls.13 In youngadults the dorsiflexors generate only 7.9% of the torque theknee extensors. This is similar to the value four in controlsin the present study (7.6%). Fallers, however, created dorsi-flexion torques that were only 2.3 of their knee extensor val-ues. Nine out of 17 of the fallers were unable to generate anydorsiflexion torque at the faster velocity, and three failedeven during slow velocity attempts. Only four out of 17 non-fallers failed to produce torque at the fast velocity and wereable to do so at the slow velocity.
(5)

4-42 THE RELATIONSHIP OF KNEE AND ANKLE WEAKNESS TO FALLS IN NURSING HOME RESIDENTS
(6)
Evidence for a cause and effect relationship between weakdorsiflexion and an increased incidence of falls is currentlylacking. Sabin34 has suggested the view that many falls maybe due to a backward loss of balance attributable to a neu-ropathy that preferentially affects the longer and thereforemore vulnerable sensorimotor innervation of the tibialisanterior. This could affect the timely production of sufficientdorsiflexion force, which is of critical importance in thecontrol of backward sway,30 and therefore, in the preventionof falls to the rear. The activation of long-loop reflexes at theankle constitutes the first and most important event in thestabilization of posture.10 Since a greater dependence on thismechanism occurs with aging,47 the age-related loss of abil-ity to develop muscle tension,9 in conjunction with dimin-ished sensorimotor conduction,34 might produce significantdelays of adaptive long-loop reflexes in response to pertur-bations of posture.
In addition to the segmental mechanisms controlling bal-ance, suprasegmental organization and control of reflex bal-ance mechanisms occurs within the central nervous system.The ability to initiate and coordinate rapid effective move-ments is integrated in the frontal cortex,34 basal ganglia,44
and cerebellum.36 Dysfunction at these sites, or their inter-connections, compromises both gait and balance, and mayalso be related to the motor deficits37 we have demonstratedwith isokinetic testing.
During backwards perturbation of balance, we haveobserved that fallers show a relative absence of synergisticcorrective responses.45 Head, shoulders, trunk, hip, andankle flexion, the synergistic pattern responsible for thereestablishment of equilibrium,7 is either sluggishly activat-ed, or absent in fallers. Trunk and ankle dorsiflexion appearparticularly affected. In the elderly, trunk flexor strength andendurance decrease earlier and to a greater extent than thetrunk extensors.17 The significance of this deterioration ofventral surface motor ability, and its relationship to back-wards falls and the anteroflexed posture of the elderlyremains to be clarified.
In conclusion, this study has revealed that fallers show asignificant decrease in dynamic strength of the knees andankles when compared to nonfallers. The weakness is mostprominent in the ankles at higher velocities of motion. Ankledorsiflexion strength in fallers is markedly diminishedalthough decrements are seen in nonfallers as well. Ankleneuromuscular dysfunction in the elderly faller may accountfor postural instability in general for this group, and extremedorsiflexion weakness may be particularly responsible forbackwards falls. The recognition of a possible deficit in allof the components of the ventrally directed synergisms thatcontrol posterior sway and balance reactions could lead tothe development of interventions devoted to the strengthen-ing and retraining of coordinated function in this sphere, andto the identification of individuals at risk for falling.
REFERENCES
1. Accident Facts & Figures: 1978 Edition, Chicago National Safety Council,1978
2. Aniansson A, Grimby G, Hedberg A, et al: Muscle function in old age.Scand J Rehabil Med (Suppl) 6:43-49, 1978
3. Aniansson A, Rundgren A and Sperling L: Evaluation of functional capac-ity in activities of daily living in 70 year old men and women. Scand JRehabil Med 12:145, 1980
4. Aniansson A, Sperling L, Rundgren A et al: Muscle function in 75 vear oldmen and women. A longitudinal study. Scand J Rehabil Med (Supp) 90:92-102, 1983
5. Aniansson A, Zetterberg C, Hedberg M et al: Impaired muscle functionwith aging: A background factor in the incidence of fractures of the proximalend of the femur. Clin Orthop 191:192-210, 1984
6. Asmussen E, Heeboll-Nielsen K: Isometric muscle strength of adult menand women. Communic Danish Nat Assoc Infant Paral 1:3-44, 1961
7. Bobath B: Abnormal postural reflex activity caused by brain lesions. Wm.Heinemann, 1971
8. Campbell AJ, Reinken J, Allan BC et al: Fall is in old age: A study of fre-quency and related clinical factors. Age Ageing 10:264-270, 1981
9. Clarkson PM, Kroll W, Melchionda AM: Age, isometric strength, rate oftension development and fiber type composition. J Gerontol 6:648-653, 1981
10. Cordo PJ, Nashner LM: Properties of postural adjustments associatedwith rapid arm movements. J Neurophysiol 47:287-302, 1982
11. Cuddigan JHP: Quadriceps femoris strength. Rheumatology andRehabilit. 12:77-83, 1973
12. Falkel J: Plantar flexor strength testing using the Cybex isokineticdynamometer. Phys Ther 58:847-850, 1978
13. Fugl-Meyer AR: Maximum isokinetic ankle plantar flexion and dorsalflexion torques in trained subjects. Eur J Appi Physiol 47:393-404, 1981
14. Fugl-Meyer AR, Gustafsson L, Burstedt Y: Isokinetic and static plantarflexion characteristics. Eur J Appl Physiol 45:221-234, 1980
15. Gerdle B, Fugl-Meyer AR: Mechanical output and ¡EMG of isokineticplantar flexion in 40-64 year old subjects. Acta Physiol Scand 124:201-211,1985
16. Gryfe CL, Amies A, Ashley MU: A longitudinal study of falls in an eld-erly population. 1: Incidence and morbidity. Age Ageing 6:201, 1977
17. Hasue M, Fujiwara M, Kikuchi S: A new method of quantitative meas-urement of abdominal and back muscle strength. Spine 5:143-148, 1980
18. Imms FJ, Edholm OG: The assessment of gait and mobility in the elder-ly. Age Ageing 8(Supp):261-267, 1979
19 Jennekens FGI, Tomlinson BE, Walton JN: Histochemical aspects of limbmuscles in old age. J Neurol Sci. 14:259-276, 1971
20. Klawans HL, Topel JL: Parkinsonism as a falling sickness. JAMA230:1555-1557, 1974
21. Larsson L, Grimby G, Karlsson J: Muscle strength and speed of move-ment in relation to age and muscle morphology. J Appl Physiol 46:451-456,1979
22. Livesley B, Atkinson L: Repeated falls in the elderly. Mod Geriatr 4:458-461, 1974
23. Marshall JF: Sensorimotor disturbances in the aging. J Gerontol 37:548-554, 1982
24. Moffroid M, Whipple R, Hoffosh J, et al: A study of isokinetic exercise.Phys Ther 49:735-746, 1969
25. Murphy J, Isaacs B: The post-fall syndrome. Gerontology 28:265-270,1982
26. Murray MP, Duthie EH, Gambert SR, et al: Age-related differences inknee muscle strength in normal women. J Gerontol 40:275-280, 1985

© BIODEX MEDICAL SYSTEMS, INC. 4-43
(7)
27.Murray MP, Gardner GM, Mollinger LA, et al: Strength of isometric andisokinetic contractions: Knee muscles of men aged 20-86. Phys Ther60:412-419, 1980
28.Murray MP, Guten GN, Baldwin JM, et al: A comparison of plantar flex-ion torque with and without the triceps surae. Acta Orthop Scand 47:122-124,1976
29.Murray MP, Kory RC, Clarkson BH: Walking patterns in healthy old men.J Gerontol 24:169-178, 1969
30.Nashner LM: Adapting reflexes controlling human posture. Exp Brain Res26:59-72, 1976
31.Nashner LM: Fixed patterns of rapid postural responses among leg mus-cles during stance. Expt Brain Res 30:13-24, 1977
32.Prudham D, Evans JG: Factors associated with falls in the elderly: A com-munity study. Age Ageing 10:141-146, 1981
33.Rothstein JM, Delitto A, Sinacore DR, et al: Electromyographic peaktorque and power relationships during isokinetic movement. Phys Ther63:924-933, 1983
34.Sabin TD: Biologic aspects of falls and mobility: Limitations in the elder-ly. J Am Geriatr Soc 30:51-58, 1982
35.Sheehan S, Bauer RB, Meyer JS: Vertebral artery compression in cervicalspondylosis. Neurology 10:968-986, 1960
36.Sudarsky L, Ronthal M: Gait disorders among patients. Arch Neurol40:740-743, 1983
37.Teravainen H, Calne DB: Motor system in normal and Parkinson’s dis-ease, in Katzman R, Ter (eds): The Neurology of Aging. Philadelphia, DavisCo., 1983, pp 85-109
38.Thorstensson A, Grimby G, Karlsson J: Force relations and fiber compo-sition in human knee muscles. J Appl Physiol 40:12-16, 1976
39.Tomonaga M: Histochemical and ultrastructural in senile human skeletalmuscle.) J Am Geriatr 25:125-131, 1977
40.Waller JA: Falls among the elderly. Human and environmental factors.Accid Anal and Prev 10:2-1978
41.Welford AT: Motor skills and aging, in Mortimer Pirozzolo FJ, Maletta GJ(eds). The Aging Motor System New York, Praeger, 1982
42. Wickiewicz TL, Roy RR, Powell PL, et al: Muscular architecture andforce velocity relationships in human J Appl Physiol 57:435-443, 1984
43. Wild D, Nayak USL, Isaacs B: How dangerous are falls in old people? BrJ Med 282:266-268, 1981
44. Wolfson LI, Katzman R: The neurologic consulting at age 80, in:Katzman R, Terry R (eds). The Neurology of Aging, Philadelphia, F. A. DavisCo., 1983
45. Wolfson LI, Whipple R, Amerman P, et al: Stress the postural response: Aquantitative method for ageing balance. J Am Geriatr Soc 34:845-850, 1986
46.Wolfson Ll, Whipple RH, Amerman P: Unpublicated observations.
47. Woollacott MH, Shumway-Cook A, and Nashno Postural reflexes andaging. Mortimer JA, Pirozzolo FJ, Maletta GJ (eds). in: The Aging MotorSystem, New York, Praeger, 1982
48. Wyke B: Cervical articular contributions to posture and gait: Their rela-tion to senile disequilibrium. Age Ageing 8:251-258, 1979
49.Zetterbeg C, Elmerson S, Andersson GBJ: Epidermiology of hip fracturesin Goteborg, Sweden, 1940-1 Clin Orthop 191:43-52, 1984
From the department of Nuerology, Albert Einstein College of Medicine,Bronx, New York.
This work was supported by the Teaching Nursing Home Award of theNational Instsitute on Aging (PO1 AG03949-04).
Address correspondence and reprint requests to Mr. Robert Whipple,Department of Nuerology, Albert Einstein College of Medicine, 1300 MorrisPark Avenue, Bronx, New York 10461.

4-44
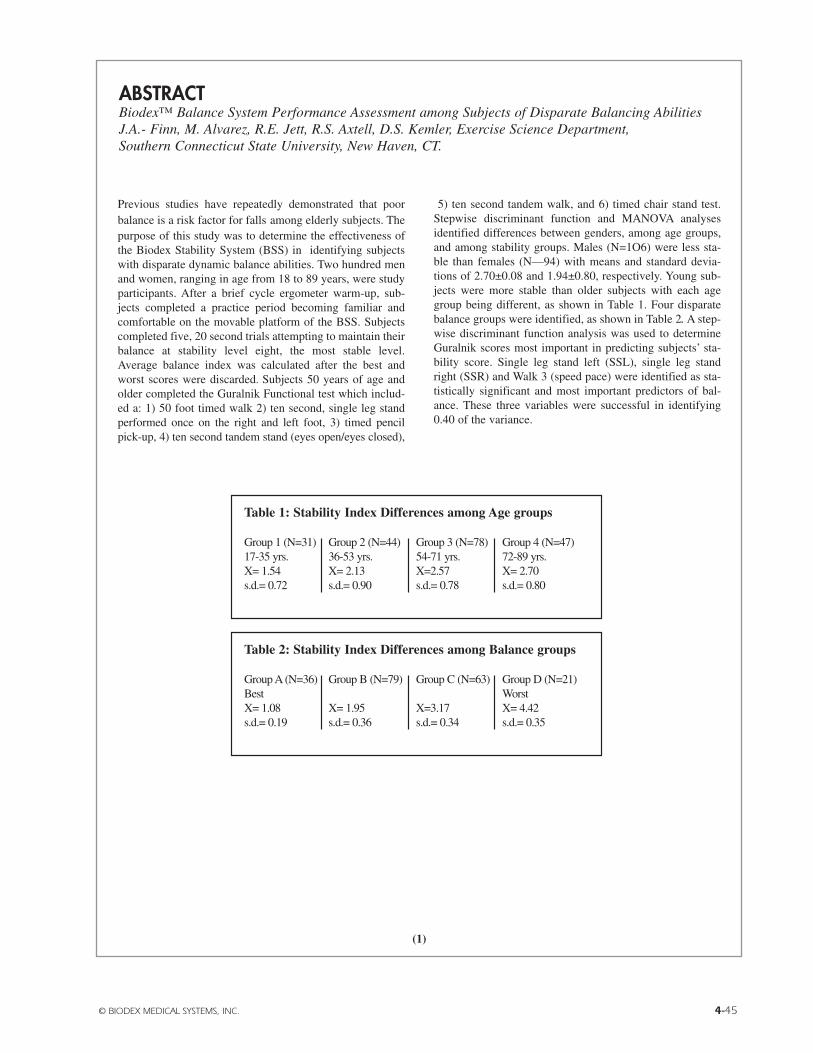
© BIODEX MEDICAL SYSTEMS, INC. 4-45
Previous studies have repeatedly demonstrated that poorbalance is a risk factor for falls among elderly subjects. Thepurpose of this study was to determine the effectiveness ofthe Biodex Stability System (BSS) in identifying subjectswith disparate dynamic balance abilities. Two hundred menand women, ranging in age from 18 to 89 years, were studyparticipants. After a brief cycle ergometer warm-up, sub-jects completed a practice period becoming familiar andcomfortable on the movable platform of the BSS. Subjectscompleted five, 20 second trials attempting to maintain theirbalance at stability level eight, the most stable level.Average balance index was calculated after the best andworst scores were discarded. Subjects 50 years of age andolder completed the Guralnik Functional test which includ-ed a: 1) 50 foot timed walk 2) ten second, single leg standperformed once on the right and left foot, 3) timed pencilpick-up, 4) ten second tandem stand (eyes open/eyes closed),
5) ten second tandem walk, and 6) timed chair stand test.Stepwise discriminant function and MANOVA analysesidentified differences between genders, among age groups,and among stability groups. Males (N=1O6) were less sta-ble than females (N—94) with means and standard devia-tions of 2.70±0.08 and 1.94±0.80, respectively. Young sub-jects were more stable than older subjects with each agegroup being different, as shown in Table 1. Four disparatebalance groups were identified, as shown in Table 2. A step-wise discriminant function analysis was used to determineGuralnik scores most important in predicting subjects’ sta-bility score. Single leg stand left (SSL), single leg standright (SSR) and Walk 3 (speed pace) were identified as sta-tistically significant and most important predictors of bal-ance. These three variables were successful in identifying0.40 of the variance.
ABSTRACTBiodex™ Balance System Performance Assessment among Subjects of Disparate Balancing Abilities J.A.- Finn, M. Alvarez, R.E. Jett, R.S. Axtell, D.S. Kemler, Exercise Science Department, Southern Connecticut State University, New Haven, CT.
(1)
Table 1: Stability Index Differences among Age groups
Group 1 (N=31) Group 2 (N=44) Group 3 (N=78) Group 4 (N=47)17-35 yrs. 36-53 yrs. 54-71 yrs. 72-89 yrs.X= 1.54 X= 2.13 X=2.57 X= 2.70s.d.= 0.72 s.d.= 0.90 s.d.= 0.78 s.d.= 0.80
Table 2: Stability Index Differences among Balance groups
Group A (N=36) Group B (N=79) Group C (N=63) Group D (N=21)Best WorstX= 1.08 X= 1.95 X=3.17 X= 4.42s.d.= 0.19 s.d.= 0.36 s.d.= 0.34 s.d.= 0.35
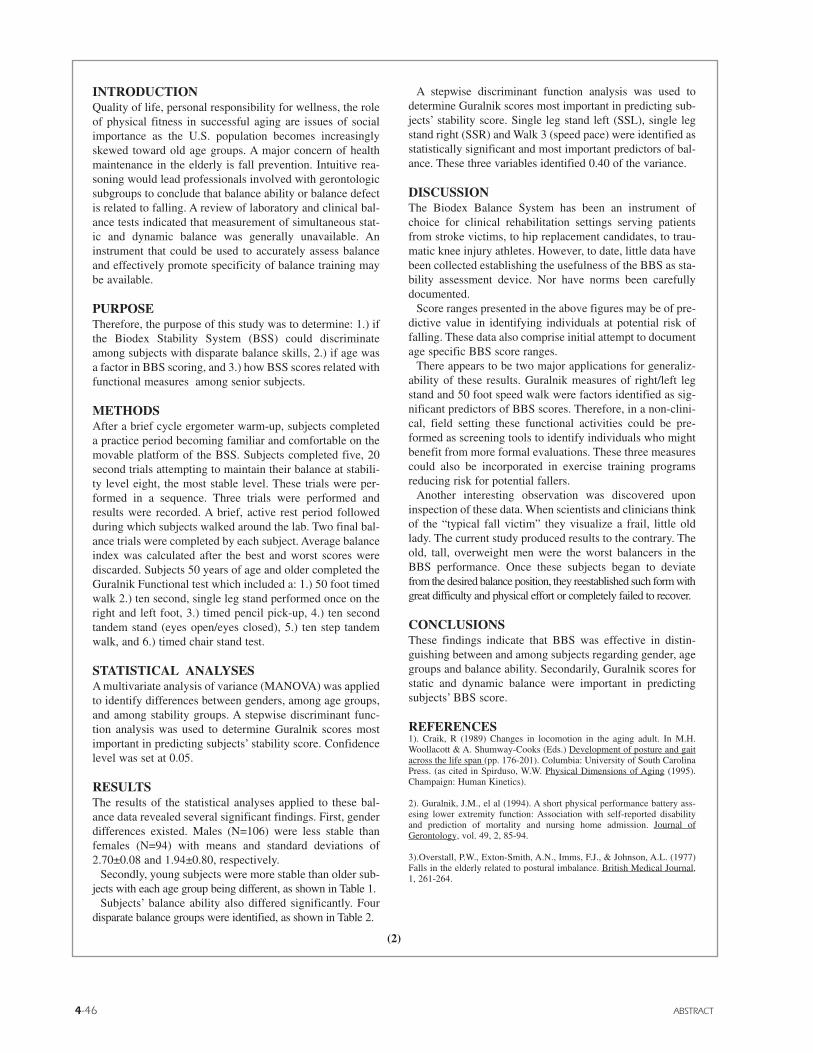
4-46 ABSTRACT
INTRODUCTIONQuality of life, personal responsibility for wellness, the roleof physical fitness in successful aging are issues of socialimportance as the U.S. population becomes increasinglyskewed toward old age groups. A major concern of healthmaintenance in the elderly is fall prevention. Intuitive rea-soning would lead professionals involved with gerontologicsubgroups to conclude that balance ability or balance defectis related to falling. A review of laboratory and clinical bal-ance tests indicated that measurement of simultaneous stat-ic and dynamic balance was generally unavailable. Aninstrument that could be used to accurately assess balanceand effectively promote specificity of balance training maybe available.
PURPOSETherefore, the purpose of this study was to determine: 1.) ifthe Biodex Stability System (BSS) could discriminateamong subjects with disparate balance skills, 2.) if age wasa factor in BBS scoring, and 3.) how BSS scores related withfunctional measures among senior subjects.
METHODSAfter a brief cycle ergometer warm-up, subjects completeda practice period becoming familiar and comfortable on themovable platform of the BSS. Subjects completed five, 20second trials attempting to maintain their balance at stabili-ty level eight, the most stable level. These trials were per-formed in a sequence. Three trials were performed andresults were recorded. A brief, active rest period followedduring which subjects walked around the lab. Two final bal-ance trials were completed by each subject. Average balanceindex was calculated after the best and worst scores werediscarded. Subjects 50 years of age and older completed theGuralnik Functional test which included a: 1.) 50 foot timedwalk 2.) ten second, single leg stand performed once on theright and left foot, 3.) timed pencil pick-up, 4.) ten secondtandem stand (eyes open/eyes closed), 5.) ten step tandemwalk, and 6.) timed chair stand test.
STATISTICAL ANALYSESA multivariate analysis of variance (MANOVA) was appliedto identify differences between genders, among age groups,and among stability groups. A stepwise discriminant func-tion analysis was used to determine Guralnik scores mostimportant in predicting subjects’ stability score. Confidencelevel was set at 0.05.
RESULTSThe results of the statistical analyses applied to these bal-ance data revealed several significant findings. First, genderdifferences existed. Males (N=106) were less stable thanfemales (N=94) with means and standard deviations of2.70±0.08 and 1.94±0.80, respectively.
Secondly, young subjects were more stable than older sub-jects with each age group being different, as shown in Table 1.
Subjects’ balance ability also differed significantly. Fourdisparate balance groups were identified, as shown in Table 2.
A stepwise discriminant function analysis was used todetermine Guralnik scores most important in predicting sub-jects’ stability score. Single leg stand left (SSL), single legstand right (SSR) and Walk 3 (speed pace) were identified asstatistically significant and most important predictors of bal-ance. These three variables identified 0.40 of the variance.
DISCUSSIONThe Biodex Balance System has been an instrument ofchoice for clinical rehabilitation settings serving patientsfrom stroke victims, to hip replacement candidates, to trau-matic knee injury athletes. However, to date, little data havebeen collected establishing the usefulness of the BBS as sta-bility assessment device. Nor have norms been carefullydocumented.
Score ranges presented in the above figures may be of pre-dictive value in identifying individuals at potential risk offalling. These data also comprise initial attempt to documentage specific BBS score ranges.
There appears to be two major applications for generaliz-ability of these results. Guralnik measures of right/left legstand and 50 foot speed walk were factors identified as sig-nificant predictors of BBS scores. Therefore, in a non-clini-cal, field setting these functional activities could be pre-formed as screening tools to identify individuals who mightbenefit from more formal evaluations. These three measurescould also be incorporated in exercise training programsreducing risk for potential fallers.
Another interesting observation was discovered uponinspection of these data. When scientists and clinicians thinkof the “typical fall victim” they visualize a frail, little oldlady. The current study produced results to the contrary. Theold, tall, overweight men were the worst balancers in theBBS performance. Once these subjects began to deviatefrom the desired balance position, they reestablished such form withgreat difficulty and physical effort or completely failed to recover.
CONCLUSIONSThese findings indicate that BBS was effective in distin-guishing between and among subjects regarding gender, agegroups and balance ability. Secondarily, Guralnik scores forstatic and dynamic balance were important in predictingsubjects’ BBS score.
REFERENCES1). Craik, R (1989) Changes in locomotion in the aging adult. In M.H.Woollacott & A. Shumway-Cooks (Eds.) Development of posture and gaitacross the life span (pp. 176-201). Columbia: University of South CarolinaPress. (as cited in Spirduso, W.W. Physical Dimensions of Aging (1995).Champaign: Human Kinetics).
2). Guralnik, J.M., el al (1994). A short physical performance battery ass-esing lower extremity function: Association with self-reported disabilityand prediction of mortality and nursing home admission. Journal ofGerontology, vol. 49, 2, 85-94.
3).Overstall, P.W., Exton-Smith, A.N., Imms, F.J., & Johnson, A.L. (1977)Falls in the elderly related to postural imbalance. British Medical Journal,1, 261-264.
(2)
© BIODEX MEDICAL SYSTEMS, INC. 4-47
WALKING comprises repetitive movements that are pro-grammed as coordinated patterns involving the extremitiesand trunk. The patterned ankle, knee, and hip movementsthat make up the swing (the foot is lifted and swings for-ward) and stance (the foot is planted and moves backwardsrelative to the trunk) phases of walking may be produced bya central pattern generator, which in cats is located in thespinal cord (1). This spinal cord activity is modulated bybrainstem, locomotor centers, basal ganglia, cerebellum,and motor cortex, as well as afferent input (proprioceptive,vestibular, and visual) (2). Locomotor control mechanismsand their connections, widely distributed throughout thenervous system, may be compromised at many sites by avariety of disease processes.
In normal aging many of these patterned movementsbecome less vigorous and, therefore, stride length shortensand walking speed slows (3). In healthy 80-year-old peoplethe changes are modest (20% decrease by comparison withyounger individuals), but in house-bound elderly the decre-ments in stride length and walking are more prominent (4).The gait of elderly with a history of falls is also compro-mised, with decreased walking speed, shorter stride lengths,and variability in the length of successive steps by compar-ison with others (5). The relationship of other gait abnor-malities to falling has, however, not been studied in a sys-tematic fashion. Furthermore, there is a need for a simplemethod of gait evaluation that is neither overly time-con-suming nor requires costly instrumentation. This studyassessed the validity of such a simplified Gait AbnormalityRating Scale (GARS) against the traditional indices of gaitquality (stride length and walking velocity) in a group ofnursing home residents with a history of falls, compared toa group of controls. We developed quantitative stride lengthand walking speed criteria that may serve as predictors offuture falls as well as demonstrating that the GARS is also avalid correlate of falls.
METHODSDefinition of Fall. - “Fallers” were defined as residents whohad experience at least two unexplained falls during the pre-vious year. Unexplained falls are defined as endogenous innature and not attributable to environmental hazards.Exogenous precipitants included environmental hazardssuch as surface, footwear, lighting, eyeglasses, and clothingThe details of an unexplained fall, which was almost invari-ably unwitnessed, were confirmed through the incident
report filled out by nursing staff on duty at the time of thefall. A research nurse facilitator then filled out a supplemen-tary form and further clarified the role that environmentalhazards might have had in promoting the fall.
Subjects. - Twenty of the fallers were enrolled over atwo-year period from Morningside House Nursing Home, afacility with 196 skilled nursing facility beds and 190 healthrelated facility beds. We reviewed all 1324 incident reportsfilled out by a research nurse facilitator at the time of a fallduring 1983 and 1984. A review of the reports indicated that607 falls were explainable in terms of environment or med-ical causes. The remaining 717 unexplained falls were cate-gorized according to person and date of occurrence.Subjects with two or more unexplained falls within one year(N = 137) were potentially eligible as cases. Of these, 117failed to qualify because they did not meet the selection cri-teria. The most frequent reasons for exclusion were:untestable due to dementia (31%) and nonambulatory status(13%). The remaining 20 subjects were recruited. In addi-tion, during the second year of the study another 7 subjectswere recruited from the Margaret Tietz skilled nursing andhealth-related facility, using the same selection criteria.Twenty-two nonfallers were recruited into the control groupfrom the Morningside House Nursing Home.
Residents (fallers and controls) were excluded from par-ticipation if they met one or more of the following exclusioncriteria: terminal illness; behavioral or comprehension prob-lem severe enough to prevent the subject from carrying outsimple test-related instructions (e.g., get up from the chairwalk, turn around, sit down, stand still, etc.); a nonambula-tory status, the required use of a wheelchair, walker, ororthosis; amputations; arthritis or orthopedic ailments ofposture or gait (e.g., scoliosis, leg length discrepancies), orpain of an intensity that compromised the ability to standunsupported, or to ambulate (antalgic gait); blindness (visu-al acuity worse than 20/70 or visual field defects); impair-ment of neurological function secondary to previously diag-nosed neurologic disease (e.g., Parkinson’s disease, stroke,myelopathy); history of orthostatic hypotension, seizures,transient ischemic attacks, syncope, or cardiac arrhythmiasby EKG.
Medical evaluation. - A comprehensive neurologic exami-nation was carried out by a neurologist who was part of theproject. The examination was a structured evaluation of neu-rologic functions including: basal ganglia (6), cerebellar (7),sensory and pyramidal systems. A 5-level rating scale of
We evaluated the gait of 49 nursing home residents (27 of whom had a history of recent falls), and 22 controls. Measures consisted of stride length and walk-ing speed, as well as a videotape-based analysis of l6 facets of gait. The study demonstrates that stride length, walking speed, and the assessment of video-taped gait correlated well with each other and were significantly impaired in fallers compared to controls. Arm swing amplitude, upper-lower extremity syn-chrony, and guardedness of gait were most impaired in fallers. Although subjects who fell were more often demented than controls, it is likely that this repre-sents a selection bias in nursing homes. Visual rating of gait features in the nursing home population is a simple and useful alternative to established meth-ods of gait analysis.
GAIT ASSESSMENT IN THE ELDERLY: A GAIT ABNORMALITY RATING SCALE AND ITS RELATION TO FALLSLeslie Wolfson,1 Robert Whipple,1 Paula Amerman,1 and Jonathan N. Tobin2
(1)
Departments of 1Neurology and 2Epidemiology and Social Medicine,Albert Einstein College of Medicine, Bronx, NY.

4-48 GAIT ASSESSMENT IN THE ELDERLY
of dysfunction (0 = normal, 1 = minimal, 2 = mild 3 = moder-ate, 4 = severe) was used, and those subtests that most reflect-ed each category of neurologic function were chosen for cate-gorical analysis (bradykinesia, Parkinsonian gait,heel-knee-shin, dysdiadokinesia, large toe joint position sense,and vibration perception at ankle). A general impression(Yes-No) was also given regarding the presence or absence of“extrapyramidal” findings. The Blessed Mental Status (8), ameasure of dementia severity, was also administered.
A detailed medical history was obtained by structuredinterviews administered to subjects and by review of themedical charts by a nurse researcher. Medication usage wasobtained from a review of the patient charts, which containedrecords of all medications taken by subjects. The types ofmedications coded included hypnotics, antihistamines, tran-quilizers. antidepressants, sedatives, and antihypertensives.
A detailed physical examination for the presence ofosteoarthritis was performed by a nurse practitioner trainedespecially for this evaluation by an orthopedic surgeon (9).
Stride length and gait velocity assessment. - The gait courseconsisted of a 10m x 1m length of hard-pile industrial car-peting with a slip-proof undersurfacing. The edges of thecarpet were marked with short sections of reference tape at0.5m intervals. Subjects were encouraged to wear theirmost comfortable pair of walking shoes, as long as heelheight did not exceed two inches. Subjects were then askedto walk the length of the course and return at their usualspeed. This was done twice in order to permit videotapingfrom both side and antero-posterior views. No cues wereprovided to subjects regarding the speed with which theywere expected to walk.
A cylindrical length of chalk (2” X 3”) was then attachedwith tape to the rear of each shoe (blue on the left and pinkon the right) so that the end of the chalk was in the plane ofthe heel, The subject was again videotaped when walkingthe course. For safety purposes one of the investigatorswalked behind the subject. Walking aids were not permittedduring the trial but physical assistance was extended, if nec-essary, in the form of contact guarding. Upon conclusion ofthe trial the chalk imprints on the carpeting were used as ref-erence points for the measurement of stride length.
The means of 10 left and 10 right strides were measured.Measurements were taken from the central three-quarters ofthe gait course in order to avoid inclusion of strides reflect-ing acceleratory and deceleratory phases. During a playbackof the tape, each rater independently timed the duration of asubject’s second gait trial with a stopwatch. The times wereaveraged and then divided by 10 meters (the distance tra-versed) in order to derive the gait velocity.
Gait Abnormality Rating Scale (GARS). An objective of thisstudy was to devise a gait rating system that could be easilyand quickly carried out in the clinic, and yet would require noadded instrumentation expense beyond a standard video cam-era and monitor. To that end, a rating system was developed
that entailed evaluating gait from the videotaped recordings.On replaying the tapes, two judges (a neurologist and a
physical therapist) independently rated the subjects’ gaitaccording to 16 variables (Table 1 A-C) using a 4-point scale(0 = normal, 1 = mildly impaired, 2 = moderately impaired,3 = severely impaired). The GARS was calculated by sum-ming each of the individual variables. A higher score signi-fies a more impaired gait. The choice of gait componentsincluded in the GARS was made on the basis of prior stud-ies describing gait in the elderly (3) and subjects withParkinsonism (10). The determinations of “normal” and of“severely impaired” were also derived from the above stud-ies, as well as from the personal clinical experiences of eachrater. These extreme scores were easier to formulate thanwere the intermediate grades of “mildly” and “moderatelyimpaired.” The scoring was based on ranking of the extentof dysfunction of a particular variable compared to the nor-mal. The criteria are defined in Table 1.
Using six pilot subjects, the two raters participated in aseries of video-rating training sessions in order to enhanceconsistency of scoring. The recordings were played backrepeatedly in slow-motion and frame-by-frame modes whilethe raters discussed the scoring system. Scores at the oppo-site ends of a variable (“0” and “3”) were easily agreedupon, while the intermediate grades were less clear-cut.Agreement was more difficult with gait components thatvaried along a continuum (e.g., variability or guardedness)than for those that were more easily distinguishable becauseof discernible reference points (foot contact, weaving, stag-gering). Once the study began, the raters were unaware ofeach other’s assessments during the tape reviews, as well asto group identity of the subject. One of the raters (LW) hadcontact with some of the subjects during clinically relevantneurologic evaluations.
Statistical analysis. - Comparisons of categorical data weredone using corrected chi square and/or Fisher’s exact tests.Continuous variables were compared by t-tests. Interraterreliability for the qualitative gait rating was assessed usingSpearman rank-order correlations. Although Kappa wasdesigned as an index of assessment, it is most appropriatefor nominal level data. Use of Kappa for ordinal and inter-val scale measures is inappropriate (11) and loses the order-ing information contained in the scale. The degree to whichrank order deviates from a perfect correlation (r = 1) demon-strates the rate of agreement and acknowledges “partialcredit” for independent ratings that fall near each other onthe ordinal scale. The Wilcoxon Signed Ranks Test was per-formed to compare ratings of items on the gait abnormality(GARS) between falters and controls. Validity of the quali-tative measure was assessed by Pearson correlations of thevideo summary scores against biological indices of gait.
(2)

© BIODEX MEDICAL SYSTEMS, INC. 4-49
A. General Categories1. Variability - a measure of inconsistency and
arrhythmicity of stepping and of arm movements.0 = fluid and predictably paced limb movements;1 = occasional interruptions (changes in velocity). approximately <25% of time;2 = unpredictability of rhythm approximately 25-75% of time;3 = random timing of limb movements.
2. Guardedness - hesitancy, slowness, diminished propulsion and lack of commitment in stepping andarm swing.
0 = good forward momentum and lack of apprehension in propulsion;1 = center of gravity of head, arms and trunk (HAT)
projects only slightly in front of push-off, but stillgood arm-leg coordination;
2 = HAT held over anterior aspect of foot, and somemoderate loss of smooth reciprocation;
3 = HAT held over rear aspect of stance-phase foot,and great tentativity in stepping.
3 Weaving - an irregular and wavering line of progression.0 = straight line of progression on frontal viewing;1 = a single deviation from straight (line of best fit)line of progression;2 = two to three deviations from line of progression:3 = four or more deviations from line of progression.
4. Waddling - a broad-based gait characterized by excessive truncal crossing of the midline and side-bending.
0 = narrow base of support and body held nearly vertically over feet;1 = slight separation of medial aspects of feet and just perceptible lateral movement of head and trunk;2 = 3-4” separation feet and obvious bending of trunk to side so that cog of head lies well over ipsilateral stance foot;3 = extreme pendular deviations of head and trunk (head passes lateral to ipsilateral stance foot), and further widening of base of support.
5. Staggering - sudden and unexpected laterally directed partial losses of balance.
0 = no losses of balance to side; 1 = a single lurch to side;2 = two lurches to side;3 = three or more lurches to side.
B. Lower Extremity Categories 1. % Time in Swing - a loss in the percentage of the gait
cycle constituted by the swing phase.0 = approximately 3:2 ratio of duration of stance to
swing phase;1 = a 1:1 or slightly less ratio of stance to swing;2 = markedly prolonged stance phase, but with some obvious swing time remaining;3 = barely perceptible portion of cycle spent in swing.
2. Foot Contact - the degree to which heel strikes the ground before the forefoot.
0 = very obvious angle of impact of heel on ground;1 = barely visible contact of heel before forefoot;2 = entire foot lands flat on ground;3 = anterior aspect of foot strikes ground before heel.
3. Hip ROM - the degree of loss of hip range of motionseen during a gait cycle.
0 = obvious angulation of thigh backwards during double support (10 deg);1 = just barely visible angulation backwards from vertical;2 = thigh in line with vertical projection from ground;3 = thigh angled forwards from vertical at maximum posterior excursion.
4. Knee Range of Motion - the degree of loss of knee rangeof motion seen during a gait cycle.
0 = knee moves from complete extension at heel-strike (and late-stance) to almost 90° @ 70°)
during swing phase;1 = slight bend in knee seen at heel-strike and
late-stance and maximal flexion at midswing iscloser to 45° than 90°;2 = knee flexion at late stance more obvious than at
heel-strike, very little clearance seen for toeduring swing; 3 = toe appears to touch ground during swing, knee flexion appears constant during stance, and knee angle during stance, and knee angle during swing appears 45° or less.
C. Trunk, Head, and Upper Extremity Category 1. Elbow Extension - a measure of the decrease of elbow
range of motion.0 = large peak-to-peak excursion of forearm (approximately 20 deg), with distinct maximal flexion at end of anterior trajectory;1 = 25% decrement of extension during maximal posterior excursion of upper extremity;2 = almost no change in elbow angle;3 = no apparent change in elbow angle (held in flexion).
2. Shoulder Extension - a measure of the decrease of shoulder range of motion.
0 = clearly seen movement of upper arm anterior (15 deg) and posterior (20 deg) to vertical axis of trunk; 1 = shoulder flexes slightly anterior to vertical axis; 2 = shoulder comes only to vertical axis, or
slightly posterior to it during flexion; 3 = shoulder stays well behind vertical axis during entire excursion.
Table 1. Components of the Gait Assessment Rating Score (GARS)
(3)
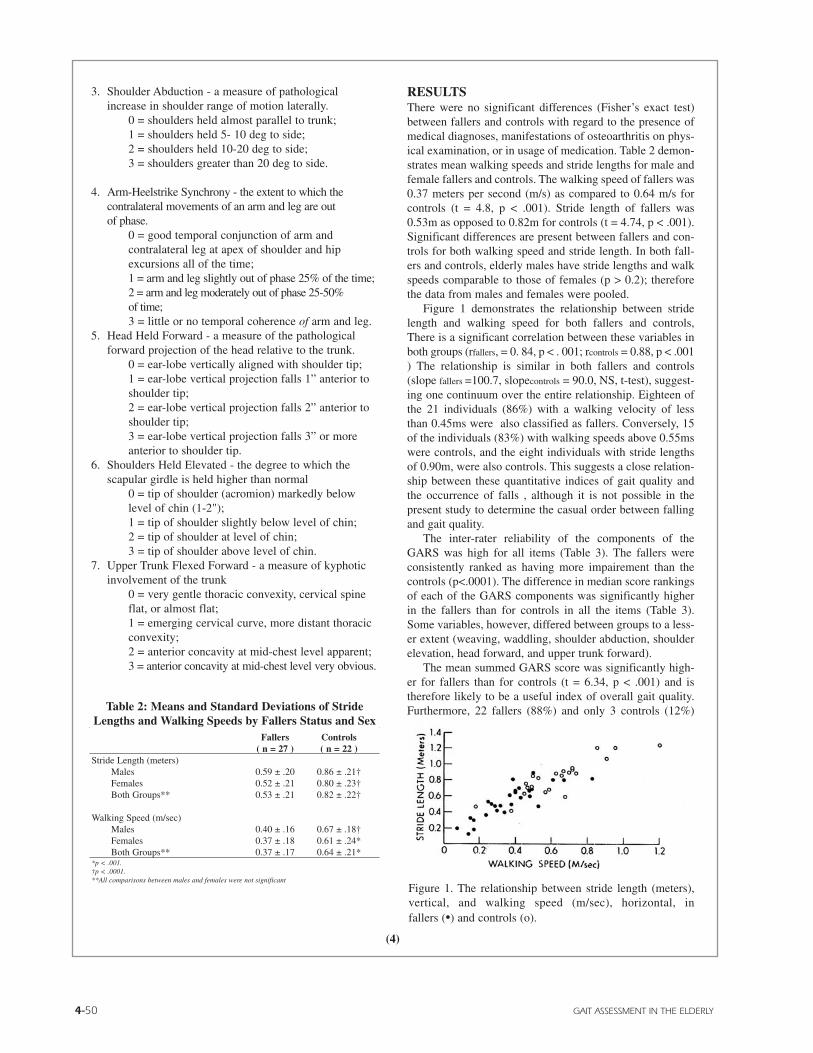
4-50 GAIT ASSESSMENT IN THE ELDERLY
3. Shoulder Abduction - a measure of pathological increase in shoulder range of motion laterally.
0 = shoulders held almost parallel to trunk;1 = shoulders held 5- 10 deg to side;2 = shoulders held 10-20 deg to side;3 = shoulders greater than 20 deg to side.
4. Arm-Heelstrike Synchrony - the extent to which the contralateral movements of an arm and leg are outof phase.
0 = good temporal conjunction of arm and contralateral leg at apex of shoulder and hip excursions all of the time;1 = arm and leg slightly out of phase 25% of the time;2 = arm and leg moderately out of phase 25-50%of time;3 = little or no temporal coherence of arm and leg.
5. Head Held Forward - a measure of the pathological forward projection of the head relative to the trunk.
0 = ear-lobe vertically aligned with shoulder tip;1 = ear-lobe vertical projection falls 1” anterior to shoulder tip;2 = ear-lobe vertical projection falls 2” anterior to shoulder tip;3 = ear-lobe vertical projection falls 3” or more anterior to shoulder tip.
6. Shoulders Held Elevated - the degree to which the scapular girdle is held higher than normal
0 = tip of shoulder (acromion) markedly below level of chin (1-2"); 1 = tip of shoulder slightly below level of chin; 2 = tip of shoulder at level of chin; 3 = tip of shoulder above level of chin.
7. Upper Trunk Flexed Forward - a measure of kyphotic involvement of the trunk
0 = very gentle thoracic convexity, cervical spine flat, or almost flat;1 = emerging cervical curve, more distant thoracic convexity;2 = anterior concavity at mid-chest level apparent;3 = anterior concavity at mid-chest level very obvious.
RESULTSThere were no significant differences (Fisher’s exact test)between fallers and controls with regard to the presence ofmedical diagnoses, manifestations of osteoarthritis on phys-ical examination, or in usage of medication. Table 2 demon-strates mean walking speeds and stride lengths for male andfemale fallers and controls. The walking speed of fallers was0.37 meters per second (m/s) as compared to 0.64 m/s forcontrols (t = 4.8, p < .001). Stride length of fallers was0.53m as opposed to 0.82m for controls (t = 4.74, p < .001).Significant differences are present between fallers and con-trols for both walking speed and stride length. In both fall-ers and controls, elderly males have stride lengths and walkspeeds comparable to those of females (p > 0.2); thereforethe data from males and females were pooled.
Figure 1 demonstrates the relationship between stridelength and walking speed for both fallers and controls,There is a significant correlation between these variables inboth groups (rfallers, = 0. 84, p < . 001; rcontrols = 0.88, p < .001) The relationship is similar in both fallers and controls(slope fallers =100.7, slopecontrols = 90.0, NS, t-test), suggest-ing one continuum over the entire relationship. Eighteen ofthe 21 individuals (86%) with a walking velocity of lessthan 0.45ms were also classified as fallers. Conversely, 15of the individuals (83%) with walking speeds above 0.55mswere controls, and the eight individuals with stride lengthsof 0.90m, were also controls. This suggests a close relation-ship between these quantitative indices of gait quality andthe occurrence of falls , although it is not possible in thepresent study to determine the casual order between fallingand gait quality.
The inter-rater reliability of the components of theGARS was high for all items (Table 3). The fallers wereconsistently ranked as having more impairement than thecontrols (p<.0001). The difference in median score rankingsof each of the GARS components was significantly higherin the fallers than for controls in all the items (Table 3).Some variables, however, differed between groups to a less-er extent (weaving, waddling, shoulder abduction, shoulderelevation, head forward, and upper trunk forward).
The mean summed GARS score was significantly high-er for fallers than for controls (t = 6.34, p < .001) and istherefore likely to be a useful index of overall gait quality.Furthermore, 22 fallers (88%) and only 3 controls (12%)
Fallers Controls( n = 27 ) ( n = 22 )
Stride Length (meters)Males 0.59 ± .20 0.86 ± .21†Females 0.52 ± .21 0.80 ± .23†Both Groups** 0.53 ± .21 0.82 ± .22†
Walking Speed (m/sec)Males 0.40 ± .16 0.67 ± .18†Females 0.37 ± .18 0.61 ± .24*Both Groups** 0.37 ± .17 0.64 ± .21*
*p < .001.†p < .0001.**All comparisons between males and females were not significant
Table 2: Means and Standard Deviations of StrideLengths and Walking Speeds by Fallers Status and Sex
Figure 1. The relationship between stride length (meters),vertical, and walking speed (m/sec), horizontal, in fallers (•) and controls (o).
(4)

© BIODEX MEDICAL SYSTEMS, INC. 4-51
had a GARS of greater than 18. We then examined theGARS in relation to stride length, a measurable biologicindex of gait quality (Figure 2). The correlation betweenstride length and GARS was highly significant for both fall-ers (r = .82, p < .001) and controls (r = .79, p < .001).
We considered the possibility that the observed differ-ences in gait as well as balance (12) are consequences ofother underlying neurological problems. Table 4 presentsfindings from the neurologic exam. No statistically signifi-cant differences were found in the prevalence of abnormali-ties in the specific subtests of basal ganglia, cerebellum,sensory systems or pyramidal tract function, nor in the gen-eral category of “extrapyramidal” findings (Fisher’s exacttest). Fallers, however, had a significantly higher Blessedscore as compared to controls, suggesting a greater preva-lence of dementia in this group.
DISCUSSIONThis study has demonstrated that stride length, walkingvelocity, and gait quality (as measured by the GARS) weresignificantly reduced in nursing home residents with a his-tory of falls, as compared to controls. Other investigators(4,5) have reported significant differences in stride lengthand walking speed between fallers and controls in commu-nity dwelling elderly. Table 5 allows us to place our findingsin perspective with stride length and gait velocity data col-lected from a healthy group of elderly controls (3), and froma group of aged community residents composed of fallersand controls (5). In comparing the two population it is notsurprising to note a deterioration in ambulatory functionattendant to the loss of independence and/or development ofdisabilities in nursing home residents. However given thewide-ranging options in criteria for subject selection in stud-ies of community dwellers (age, fitness level, medicalexclusions, etc.) it may be premature to conclude that theremust always be a significant difference in gait variables
between controls and fallers. For example in an ongoingstudy of stringently screened community dwelling elderly,we have been unable to discern distinctions in stride lengthor gait velocity between fallers and controls.
The present measurements of stride length and walkingspeed were performed without the benefit of formal gaittesting equipment and may be used by those wishing toobtain measurements of gait quality. While quantitativemeasures describe the gait in terms of speed and stridelength, the GARS additionally evaluates the use and inter-action of the trunk and the upper and lower extremities dur-ing walking.
Except for our own findings of correlations between theGARS and two accepted standards of gait - stride length andgait velocity - there has been no previous validation of a sys-tem of gait analysis in which measures of visually ratedcomponents of gait are used. In assessing the individualcomponents of the GARS, there appears to be no pattern to
Table 3. Reliability and Validity of Qualitative Gait Assessments (GARS)
Median Rank* Spearman MediansFallers Controls r* Fallers Controls
GARS item (n = 27) (n = 22) (n = 49) (n = 27) (n = 22)
Variability 17.2 31.9 0.803 2.00 1.0Guardedness 16.0 33.0 0.803 2.00 0.0Weaving 20.7 28.8 0.747 1.00 0.0Waddling 21.5 28.1 0.836 1.00 0.0Staggering 18.6 30.7 0.826 1.00 0.0Swing Time 18.4 30.8 0.798 2.00 0.0Foot contact 17.8 31.3 0.814 2.00 0.0Hip ROM 16.8 32.2 0.903 2.00 0.0Knee ROM 16.3 32.7 0.872 2.00 1.0Elbow extension 18.2 31.1 0.885 2.00 1.0Shoulder extension 15.8 33.1 0.841 2.00 1.0Shoulder abduction 20.8 28.7 0.730 1.00 0.0Arm-heelstrike synchrony 15.8 33.1 0.878 3.00 1.0Head forward 21.1 28.5 0.656 1.50 1.0Shoulder elevated 22.0 26.8 0.475† 0.00 0.0Upper trunk forward 21.2 28.4 0.609 1.00 0.0Total GARS 15.1 33.1 0.954 — —
*For all Spearman r (inter-rater reliability) and Wilcoxon Rank test (for differences between fallers and controls), p = .0001, except where noted. † p<.001.
GAIT ASSESSMENT RATING SCORE (GARS)
Figure 2. The relationship between stride length (meters), vertical, andcomposite gait score, horizontal, in fallers (•) and controls (o): greaterGARS indicate more abnormal gait.(5)

4-52 GAIT ASSESSMENT IN THE ELDERLY
the differences in scoring between the two groups. Fallerswere consistently worse than controls on all items.
The items showing the most significant differences inmedian rankings (Table 3) were shoulder extension, armheelstrike sychrony, and guardedness, while componentswith the highest inter-rater reliability were elbow extension,hip ROM and arm-heelstrike synchrony. Both groups havein common elements of upper extremity function. Theprominence of arm use items within the scale may accountfor an ease in visual detection not shared by other bodyparts. Decreased arm swing has already been noted in thegait of elderly persons (3). In so far as extrapyramidal signsincrease in frequency with aging (13), abnormal extremitysynchrony and restricted amplitude of arm swing duringlocomotion may among the earliest markers of age-associat-ed basal ganglia dysfunction (14).
No clear patterns or clusters of abnormal GARS itemsthat might aid in the classification of gait types could be dis-cerned. However, when most-demented versus leastdemented subjects were compared across GARS compo-nents, the measure of variability proved to be significantlygreater (p < .05) in the more demented individuals. Whetherdemented individuals can be characterized as having a morearrhythmical (variability) gait than fallers in general willawait larger-scale studies in the future.
A subset of six variables (weaving, waddling, shoulderabduction, shoulder elevation, head forward, and uppertrunk forward), however, showed considerably smaller dif-ferences between group medians. This may have been due tothe relatively low median ratings received by subjects forthese variables (range of medians of fallers = 0.0-1.50;non-fallers = 0.0-1.0, Table 3). Given that a score of “ 1 “signifies minimal to mild impairment, such ratings mayhave approached the lower limits of visually rateable differ-ences. Thus, these variables may be less useful for identify-ing fallers and may merely reflect generalized features ofaging shared by both groups. It should be noted that five outof these same six variables also had the lowest inter-raterreliabilities of the battery (Table 3).
There are other limitations of the present system that invitefuture modifications. For example, the present results indi-cate that at least one of the GARS items (shoulder elevated)is marginally reliable and could be deleted from the ratingsystem. In retrospect, a number of the variables appear to beredundant (e.g., head held forward with upper trunk flexedforward), while others seem to directly covary (hip ROMand knee ROM, elbow and shoulder extension). A future“streamlined” version of the GARS might consist of the fol-lowing seven items: variability, guardedness, staggering, hipROM, foot contact, shoulder extension, and arm-heelstrikesynchrony. In addition to abbreviating the number of itemsin the scale, a compression of the levels of rating from 4 to3 might also be considered (e.g., normal, partial involve-ment, severe involvement), at which time another reliabilityanalysis would need to be undertaken.
Although learning time for the GARS is significant, onceattained, the time entailed in camera setup, taping, and rat-ing of tapes is approximately equivalent to the time spent inassessing stride length (i.e., carpet setup, chalk attachmentchalk-mark measurement). Velocity assessment, on theother hand, despite being a briefer and simpler test to carryout, does not offer the opportunity to observe and assessmany of the actual features that compose the gait patternsince many of these items are already an integral part of thevisual gait assessment performed by neurologists and reha-bilitation professionals, the use of the GARS to simplify andsystematize this task could result in easier identification ofgait features and specific neuromuscular deficits.
Further validation and reliability testing of the GARS inother populations should strengthen it as a tool for the meas-urement of gait abnormalities and add to other systems ofrater-based analysis of functional aspects of movement inelderly fallers (4,15). There is now a clear need for the inclu-sion of a technically simple method of gait evaluation with-in the battery of tests currently available for the motorassessment of the elderly at risk for failing.
Fallers take smaller steps and have slower walking speedsthan those without a history of falls. The videotape analysisof gait (GARS) also indicates that fallers have poorer gaitthan those without a history of recent falls. These observa-tions are in agreement with published data that have relatedgait to both falls and limited mobility (4,5), as well as to poorbalance (12). We have previously reported abnormalities ofbalance in these same subjects, and have found a statistical-ly significant correlation (Spearman r = 0.4, p < .05) betweentotal GARS score and balance (Postural Stress Test) (12).
Table 4: Neurologic Examination*(% of Subjects With Positive Findings)
Fallers† ControlsStride Length (meters)
Nursing Home Residents .53 ± .21 .82 ± .22Community Residents .83 ± .245 .66 ± .273
Velocity (meters/sec)Nursing Home Residents .37 ± .17 .64 ± .21Community Residents 1.00 ± .275 1.23††
*Imms and Edholm, 1981 (5).†Murray et al., 1969 (3).††SD not reported.
Table 5: Stride Lengths and Walking Speeds of Nursing HomeResidents, Elderly Community Dwellers*, and Healthy Old Men.†
Fallers† Controls( n = 25 ) ( n = 22 )
Basal ganglia dysfunctionBradykinesia 12.0 9.1Extrapyramidal findings 28.0 18.2Parkinsonian gait 20.0 13.6
Cerebellar dysfunctionHeel-knee-shin 28.0 40.9Dysdiadokinesia 48.0 45.5
Sensory dysfunctionJoint position sense (large toe) 32.0 22.7Vibration (ankle) 80.0 86.4
Pyramidal tractHyperreflexia 52.0 50.0Babinski sign 12.0 9.1
Blessed mental status (M ± SD) 11.3 ± 8.7 4.5 ± 4.9††
*Fisher’s exact tests were not significant for all comparisons between fallers and controls.†Neurological examinations were missing for two fallers††p <.001.
(6)
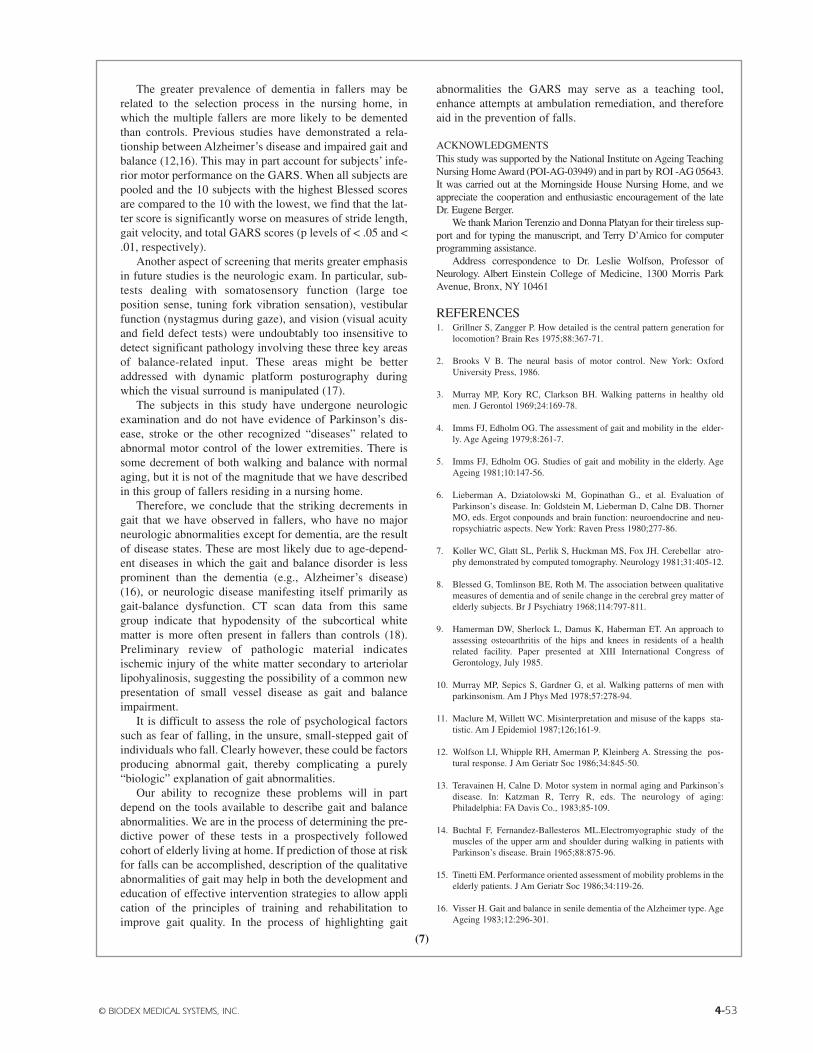
© BIODEX MEDICAL SYSTEMS, INC. 4-53
The greater prevalence of dementia in fallers may berelated to the selection process in the nursing home, inwhich the multiple fallers are more likely to be dementedthan controls. Previous studies have demonstrated a rela-tionship between Alzheimer’s disease and impaired gait andbalance (12,16). This may in part account for subjects’ infe-rior motor performance on the GARS. When all subjects arepooled and the 10 subjects with the highest Blessed scoresare compared to the 10 with the lowest, we find that the lat-ter score is significantly worse on measures of stride length,gait velocity, and total GARS scores (p levels of < .05 and <.01, respectively).
Another aspect of screening that merits greater emphasisin future studies is the neurologic exam. In particular, sub-tests dealing with somatosensory function (large toe position sense, tuning fork vibration sensation), vestibularfunction (nystagmus during gaze), and vision (visual acuityand field defect tests) were undoubtably too insensitive todetect significant pathology involving these three key areasof balance-related input. These areas might be betteraddressed with dynamic platform posturography duringwhich the visual surround is manipulated (17).
The subjects in this study have undergone neurologicexamination and do not have evidence of Parkinson’s dis-ease, stroke or the other recognized “diseases” related toabnormal motor control of the lower extremities. There issome decrement of both walking and balance with normalaging, but it is not of the magnitude that we have describedin this group of fallers residing in a nursing home.
Therefore, we conclude that the striking decrements ingait that we have observed in fallers, who have no majorneurologic abnormalities except for dementia, are the resultof disease states. These are most likely due to age-depend-ent diseases in which the gait and balance disorder is lessprominent than the dementia (e.g., Alzheimer’s disease)(16), or neurologic disease manifesting itself primarily asgait-balance dysfunction. CT scan data from this samegroup indicate that hypodensity of the subcortical whitematter is more often present in fallers than controls (18).Preliminary review of pathologic material indicatesischemic injury of the white matter secondary to arteriolarlipohyalinosis, suggesting the possibility of a common newpresentation of small vessel disease as gait and balanceimpairment.
It is difficult to assess the role of psychological factorssuch as fear of falling, in the unsure, small-stepped gait ofindividuals who fall. Clearly however, these could be factorsproducing abnormal gait, thereby complicating a purely“biologic” explanation of gait abnormalities.
Our ability to recognize these problems will in partdepend on the tools available to describe gait and balanceabnormalities. We are in the process of determining the pre-dictive power of these tests in a prospectively followedcohort of elderly living at home. If prediction of those at riskfor falls can be accomplished, description of the qualitativeabnormalities of gait may help in both the development andeducation of effective intervention strategies to allow application of the principles of training and rehabilitation toimprove gait quality. In the process of highlighting gait
abnormalities the GARS may serve as a teaching tool,enhance attempts at ambulation remediation, and thereforeaid in the prevention of falls.
ACKNOWLEDGMENTSThis study was supported by the National Institute on Ageing TeachingNursing Home Award (POI-AG-03949) and in part by ROI -AG 05643.It was carried out at the Morningside House Nursing Home, and weappreciate the cooperation and enthusiastic encouragement of the lateDr. Eugene Berger.
We thank Marion Terenzio and Donna Platyan for their tireless sup-port and for typing the manuscript, and Terry D’Amico for computerprogramming assistance.
Address correspondence to Dr. Leslie Wolfson, Professor ofNeurology. Albert Einstein College of Medicine, 1300 Morris ParkAvenue, Bronx, NY 10461
REFERENCES1. Grillner S, Zangger P. How detailed is the central pattern generation for
locomotion? Brain Res 1975;88:367-71.
2. Brooks V B. The neural basis of motor control. New York: OxfordUniversity Press, 1986.
3. Murray MP, Kory RC, Clarkson BH. Walking patterns in healthy oldmen. J Gerontol 1969;24:169-78.
4. Imms FJ, Edholm OG. The assessment of gait and mobility in the elder-ly. Age Ageing 1979;8:261-7.
5. Imms FJ, Edholm OG. Studies of gait and mobility in the elderly. AgeAgeing 1981;10:147-56.
6. Lieberman A, Dziatolowski M, Gopinathan G., et al. Evaluation ofParkinson’s disease. In: Goldstein M, Lieberman D, Calne DB. ThornerMO, eds. Ergot conpounds and brain function: neuroendocrine and neu-ropsychiatric aspects. New York: Raven Press 1980;277-86.
7. Koller WC, Glatt SL, Perlik S, Huckman MS, Fox JH. Cerebellar atro-phy demonstrated by computed tomography. Neurology 1981;31:405-12.
8. Blessed G, Tomlinson BE, Roth M. The association between qualitativemeasures of dementia and of senile change in the cerebral grey matter ofelderly subjects. Br J Psychiatry 1968;114:797-811.
9. Hamerman DW, Sherlock L, Damus K, Haberman ET. An approach toassessing osteoarthritis of the hips and knees in residents of a healthrelated facility. Paper presented at XIII International Congress ofGerontology, July 1985.
10. Murray MP, Sepics S, Gardner G, et al. Walking patterns of men withparkinsonism. Am J Phys Med 1978;57:278-94.
11. Maclure M, Willett WC. Misinterpretation and misuse of the kapps sta-tistic. Am J Epidemiol 1987;126;161-9.
12. Wolfson LI, Whipple RH, Amerman P, Kleinberg A. Stressing the pos-tural response. J Am Geriatr Soc 1986;34:845-50.
13. Teravainen H, Calne D. Motor system in normal aging and Parkinson’sdisease. In: Katzman R, Terry R, eds. The neurology of aging:Philadelphia: FA Davis Co., 1983;85-109.
14. Buchtal F, Fernandez-Ballesteros ML.Electromyographic study of themuscles of the upper arm and shoulder during walking in patients withParkinson’s disease. Brain 1965;88:875-96.
15. Tinetti EM. Performance oriented assessment of mobility problems in theelderly patients. J Am Geriatr Soc 1986;34:119-26.
16. Visser H. Gait and balance in senile dementia of the Alzheimer type. AgeAgeing 1983;12:296-301.
(7)

4-54

© BIODEX MEDICAL SYSTEMS, INC. 4-55
Objective: To determine the usefulness of the 6-minute walk test as an integratedmeasure of mobility in older adults.
Design: Observational study.Setting: Community centers and retirement homes
in the Los Angeles area.Patients: Eighty-six older adults without
significant disease.Interventions: None
Main Outcome Measures: Assessments included the6-minute walk, chair stands, standing balance, gait speed,body mass index, and self-reported physical functioning andgeneral health perceptions.
Results: One-week test-retest reliability of the 6-minutewalk was .95. As hypothesized, the 6-minute walk distancewas significantly greater for active than for inactive olderadults (P < .0001), moderately correlated with chair stands(r = .67), standing balance (r = .52), and gait speed (r =-.73). It had a low correlation with body mass index (r =-.07). The correlation of the 6-minute walk with self-report-ed physical functioning was .55 and its correlation with gen-eral health perceptions was .39. Self-report and performancemeasures explained 69% of the variance in 6-minute walkscores.
Conclusions: The 6-minute walk test is reliable and isvalid in relation to the performance and self-reported indi-cators of physical functioning tested in this study. It couldserve as a useful integrated measure of mobility.© 1999 by the American Congress of Rehabilitation Medicine andthe American Academy of Physical Medicine and Rehabilitation
TIMED WALKING TESTS are often used in clinical prac-tice and research to assess aspects of physical function.Several types of walking tests have been developed. Theyare administered by having the patient walk for a specifieddistance or a specified time. For example, the 50-foot walktest is conducted by timing how long it takes a patient to
walk a distance of 50 feet. It is often used by clinicians tomeasure walking velocity over a fixed distance.1 The 2-, 6-,and 12-minute walking tests measure the distance walkedwithin their respective time frames.2-6
Most studies of the 6-minute walk have found it to be avaluable measure of cardiovascular exercise capacity in eld-erly patients with congestive heart failure and chronic lungdisease.3,6-10 In these patients, the distance walked in 6 min-utes has a moderate to high correlation with cardiovascularrespiratory capacity as measured by maximum oxygenuptake during a treadmill or bicycle exercise test.6-10 Theadvantage of the 6-minute walk over treadmill tests of exer-cise capacity is that it is better tolerated by elderlypatients.6,8 Peeters and Mets6 found that 22% of elderlypatients with congestive heart failure were unable to per-form treadmill testing because of the speed of the treadmilland consequent fear of falling, whereas all patients wereable to complete the 6-minute walk.
The 6-minute walk has also been applied as a tool fordisease severity classification and assessment of prognosisin patients with chronic heart failure and as an outcomemeasure following an intervention.4,6,10-13 The 6-minutewalk can differentiate severely ill from less severely illpatients with chronic heart failure, according to the NewYork Heart Association functional classification4,6,7 It is astrong predictor of morbidity and mortality in patients withleft ventricular dysfunction and is therefore useful as a prog-nostic tool in identifying patients with a higher likelihood ofmorbidity and mortality events.4-10 It has been applied as anoutcome measure to determine the effectiveness of exerciseinterventions for elderly patients.11-13 These studies havefound the 6-minute walk to be sensitive to change after anexercise intervention.
In the clinical setting, the 6-minute walk could be usefulfor rehabilitation practitioners as an integrated measure ofmobility function. It measures a patient’s level of mobility,taking into account any limitations imposed by major bodysystems such as the musculoskeletal, cardiovascular, senso-ry, and neurologic systems.15-18 These impairments mayhave an additive or interactive effect on an individual’s levelof mobility. During clinical evaluation, the rehabilitationpractitioner conducts a personal interview and performsobjective tests to determine the specific impairments thatcause the patient’s difficulty with functional activities, andappropriate treatment strategies are subsequently devised.15
For example, an elderly patient may have difficulty walkingto the store. Further clinical testing may reveal impairmentsin strength and endurance, for which specific exercisesmight be prescribed. A patient’s score on the 6-minute walktest (either distance or gait speed) could summarize theeffects of the strength and endurance impairments on walk-ing and could also provide information about the functional
ABSTRACT. Harada ND, Chiu V, Stewart AL. Mobility related function in older adults: assessment with a 6-minute walk test. Arch Phys Med Rehabil 1999;80:837-41.
MOBILITY-RELATED FUNCTION IN OLDER ADULTS: ASSESSMENT WITH A 6-MINUTE WALK TESTNancy D. Harada, PhD, PT, Vicki Chiu, MS, Anita L. Stewart, PhD
From the Geriatric Research, Education, and Clinical Center of theDepartment of Veterans Affairs Medical Center, West Los Angeles (Di.Harada); the University of California Los Angeles School of Medicine (Di.Harada, Ms. Chiu) and the UCLA/VA/RAND MEDTEP Center for Asiansand Pacific Islanders (Dr. Harada, Ms. Chiu), Los Angeles; and theInstitute for Health and Aging of the University of California SanFrancisco, San Francisco (Dr. Stewart). CA. Submitted for publicationSeptember 1, 1998. Accepted in revised form December 23, 1998.Supported by National Institute on Aging grant AG09931 and Agency forHealth Care Policy and Research grant HS07370. Presented in part at the50th Annual Scientific Meeting of the Gerontological Society of America,November 14-18, 1997, Cincinnati, OH. No commercial party having adirect financial interest in the results of the research supporting this articlehas or will confer a benefit upon the authors or upon any organization withwhich the authors are associated. Reprint requests to Nancy Harada, PhD,PT, GRECC (I 11G), Department of Veterans Affairs Medical Center WestLos Angeles, 11301 Wilshire Boulevard, Los Angeles, CA 90073.© 1999 by the American Congress of Rehabilitation Medicine and the
American Academy of Physical Medicine and Rehabilitation
(1)

4-56 MOBILITY-RELATED FUNCTION IN OLDER ADULTS
ability to walk by comparison with established norms. Thus,by having the patient walk for 6 minutes, the rehabilitationpractitioner can obtain a global assessment of the extent towhich impairments affect mobility.
The aims of this study were to explore the usefulness ofthe 6-minute walk as an integrated performance-basedmeasure of mobility by (1) determining the 1-weektest-retest reliability, known-groups validity, and convergentvalidity of the 6-minute walk in a sample ofcommunity-dwelling older adults without significant dis-ease, and (2) determining the extent to which the 6-minutewalk summarizes information on performance measures andself-reported physical functioning. The hypotheses were: (1)the 6-minute walk is highly reliable over a 1-week period;(2) distance covered over 6 minutes is greater for olderadults living in community centers than for those living inretirement homes (known-groups validity); (3) distance cov-ered in 6 minutes is moderately correlated with chair stands,balance, gait speed, and self-reported physical functioningand general health perceptions (convergent validity); (4)distance walked in 6 minutes is negatively and moderatelycorrelated with body mass index (convergent validity); and(5) a large proportion of the variance in the 6-minute walkmeasure is determined by self-reported physical function-ing, strength, balance, and gait speed.
METHODS
SubjectsA convenience sample of 86 older adults was recruited fromtwo community centers and three retirement homes in LosAngeles. One community center and one retirement homeserved primarily the Japanese-American community. Thesize of the total sample was based on a statistical poweranalysis of the number of cases needed to detect correlationsof 0.3 with 80% power. The community centers and retire-ment homes were selected by design to obtain subjects whowere known to be more and less active. The sample wasstratified by age group (65 to 74yrs, and 75yrs and older)and gender. Older adults were recruited for the studythrough announcements, flyers, and word of mouth.
Performance-Based, Clinical, and Self-Report MeasuresEach subject was assessed on several performance, clinical,and self-report measures. These included (1) 6-minute walk,(2) chair stands, (3) tandem standing balance, (4) 8-footwalk, (5) weight and height, and (6) SF-36 physical func-tioning and general health perception scales.
6-Minute walk. The subject walked around a series oftraffic cones, which were placed to mark off a circular walk-ing area of about 40 feet in diameter that was measuredbefore the test. Subjects were instructed to attempt to walkfor 6 minutes, covering as much ground as possible at awork effort that allowed the person to talk without becom-ing short of breath. The tester walked alongside the subject,and timed the walk with a stop watch. Subjects were not
prompted by the tester because previous studies have foundthat encouragement provided by the tester affects perform-ance, with patients receiving encouragement walking greaterdistances than those who do not (p < .02).14 The subject waspermitted to stop and rest, but was instructed to resume walk-ing as soon as possible (if able). A counter was used to countthe number of laps completed by the subject. After 6 minutes,the subject was instructed to stop walking, a marker wasplaced on the ground, and the distance walked during the lastlap was measured by a rolling tape measure. The total dis-tance was derived by multiplying the number of laps by thecircumference of the walking circle, and adding the distancecovered on the last lap.
Chair stands. Chair stands are a performance-based test that measures quadriceps and lower bodystrength.19 Chair stands have been significantly correlatedwith walking speed and standing balance (Spearman coeffi-cients = .48 and .39, p < .001, respectively).20 Other studiesof chair stands indicate good reliability. In a study of frail hos-pitalized elders, the percent agreement among raters was93.3.21 The test also correlates well with published data on thestrength of knee flexor and extensor muscles in groups of menand women of various ages.22,23
Several methods of administering this test have beenreported.19,20 This study followed the method documented byGuralnik and colleagues20 for the Short Physical PerformanceBattery in the Established Populations for EpidemiologicStudies of the Elderly (EPESE). The subject stood up and satdown from a chair five times as quickly as possible with armscrossed over the chest. A tester used a stopwatch to time themaneuver. The stopwatch was started when the subject beganthe first rise from the chair, and stopped when the subjectstood on the fifth repetition and all body movement hadceased. Scoring was done according to the method used byGuralnik.20 The number of seconds to complete the test wasdivided into 4 categories based on a population-based quartilealgorithm; those who were unable to do the test or had to usetheir arms were assigned a score of zero. A higher score thusindicated better strength. Guralnik20 found chair stand per-formance to differ as hypothesized by age group and gender.
Tandem balance. The test of standing balance was alsoselected from the battery of physical performance measuresdeveloped by Guralnik20 for the EPESE studies. Guralnikdescribes a battery of three balance tests with the subjectstanding with feet side-by-side, semi-tandem, and tandem.The side-by-side position was first demonstrated by the tester,and the subject was then asked to stand in the position whilebeing timed with a stopwatch. The timing stopped when sub-jects moved their feet or lost their balance, or when 10 sec-onds had elapsed. This process was repeated for the semi-tan-dem and tandem positions. Although subjects performed allthree tests, only the tandem balance test was used in this analy-sis. The score used in these analyses was the number of sec-onds up to 10 that the subject could hold the tandem position.
(2)
© BIODEX MEDICAL SYSTEMS, INC. 4-57
8-Foot walk. Gait speed was measured by having thesubject walk a distance of 8 feet. An 8-foot walking line wasmarked off with an additional 2 feet at either end. Each sub-ject was instructed to walk along the line at their usual speedand timed for 2 trials. Scoring was the number of secondsrequired to walk 8 feet. Guralnik20 divides the number ofseconds into quintiles, with those people who are unable toperform the test receiving a zero. Since all our subjects wereable to perform the test, the number of seconds was used asa continuous measure. The average of the 2 trials was usedin the analysis.
Body mass index. Body mass index was calculatedusing the following formula: Body mass index = weight inkilograms/ height in meters squared (kg/m2).24 The subjectwas weighed using a portable digital scale. A tape measureattached to the wall was used to measure height. This meas-urement was obtained by alignment of a straight edge fromthe top of the head.
Self-reported physical functioning and general healthperceptions (SF-36 Health Survey). The SF-36 health sta-tus survey assesses several domains of health-related quali-ty of life, including physical functioning and general healthperceptions.25 Physical functioning refers to limitations in avariety of activities such as bathing, dressing, walking,bending, climbing stairs, and running. General health per-ceptions are personal beliefs about general health status. Thereliability of these two measures for adults older than 65years of age using internal consistency methods has beendetermined to be .92 for physical functioning and .78 forgeneral health perceptions.26
ProcedureParticipants were scheduled for two visits, spaced 1 weekapart. All visits were at either the community center orretirement home from which the subject was recruited.Approximately 1 week before the first scheduled visit, par-ticipants were mailed a packet that contained an informedconsent form and a questionnaire asking about demograph-ic and medical information. Participants were instructed toread the informed consent and to bring the completed ques-tionnaire to their first visit.
At the first scheduled visit, the study was described tothe participant by the research staff and the informed con-sent obtained. Each participant was screened for cognitivefunctioning using the Folstein Mini Mental StateExamination.27 Individuals who received a score of 24 orhigher then completed the two self-reported scales from theSF-36 health status survey, after which the 6-minute walktest was administered. At the end of the first visit, the par-ticipant received $10 for their participation and was sched-uled for the second visit 1 week later.
At the second visit, the participant performed the chairstands, gait speed, and standing balance tests. Weight andheight were recorded, and the second 6-minute walk testwas administered. At the end of the second visit, participantsagain received $10 for their participation.
Data AnalysisDescriptive statistics (distributions and measures of centraltendency) were examined for each measure using the SASstatistical software system.28 Pearson’s correlation coeffi-cients were calculated to assess the one-week test-retest reli-ability. The mean score of the two 6-minute walk trials wasused to assess convergent and known-groups validity.Convergent validity was determined by calculatingPearson’s or Spearman’s correlation coefficients betweenthe 6-minute walk and other performance-based orself-report measures. To examine known-groups validity, a ttest was conducted to determine whether the mean walkingdistances between the two sites were significantly different.Ordinary least squares regression with forward selectionwas used to determine the amount of variance in the mean6-minute walk score that was explained by self-reportedphysical functioning, chair stands, balance, and gait speed.Self-reported general health was not included in the regres-sion model because we wanted to test the amount of vari-ance accounted for by self-reported physical functioningand performance tests of impairments.
RESULTSDemographic and medical characteristics of the sample arepresented in table 1. The average age of the total sample was75 years; the average age of the retirement home partici-pants was 6 years older than community center participants.Sixty-three percent of the total sample were women. Theracial breakdown of the participants was 62% JapaneseAmerican, 33% white, and 5% African American.Thirty-three percent of the total sample were married; how-ever, there were large differences in marital status by site.Fifty-one percent of participants at the community centerswere married; only 6% at the retirement homes had spous-es. The mean Folstein cognitive status score in this samplethat scored above 24 was 28, indicating good cognitivefunctioning. The most common medical conditions werearthritis (41%), hypertension (38%), visual deficits (27%),and hearing deficits (26%).
Table 2 reports the 1-week test-retest reliability coeffi-cients for the total sample, by site, by gender, and by agegroup. For the total sample, 1-week test-retest reliability onthe 6-minute walk was high (r = .95). Test-retest reliabilitywas slightly higher for retirement home (r = .91) than com-munity center (r = .87) participants. Women demonstratedslightly higher 1-week test-retest reliability than men (r =.95 vs .94). Both age groups demonstrated the same reliability of .94.
Known-groups validity was tested by comparing walk-ing distances on the 6-minute walk between more and lessactive older adults. More active older adults (from the com-munity centers) covered significantly greater distances(1,629 feet) than less active older adults (living in retirementhomes) (901 feet, t = 10. 1, p < .0001) (table 3).
Convergent validity was tested by determining the cor-relation of 6-minute walk distances with performance-
(3)

4-58 MOBILITY-RELATED FUNCTION IN OLDER ADULTS
based, clinical, and self reported measures of physical func-tioning and general health perceptions (table 4). In the totalsample, the 6-minute walk distance was moderately correlat-ed with lower body strength (chair stands) (r = .67), tandembalance (r = .52), and gait speed (r = -.73) as hypothesized.Higher correlations were found for retirement home partici-pants than community center participants. In the total sample,low correlations were found with body mass index, which didnot confirm our hypothesis. The 6-minute walk distance wasmoderately correlated with the physical functioning subscale(r = .55) and the general health perceptions subscale (r = .39)of the SF-36. For self-report measures, higher correlationswere found in community center participants.
The amount of variance in the 6-minute walk distancethat was explained by the self-reported measure of physicalfunctioning, lower body strength, standing balance, and gaitspeed was 69% (R2 = .69, p = .0001). The forward selectionprocedure is summarized in table 5. Gait speed entered intothe model first, followed by self-reported physical function-ing, chair stands, and tandem standing balance. All variables,except tandem standing balance, were significant at p < .05.
DISCUSSIONWith the growth of the older adult population in the UnitedStates, there has been an increased demand for rehabilitationpractitioners to help these individuals maintain their highestlevel of functioning. Performance-based measures such asthe 6-minute walk can be incorporated into the evaluationprocess to assess the mobility of these patients.
The results of this study indicate that the 6-minute walktest is highly reliable; it conformed to our hypotheses in fiveout of six validity tests of older adults without significantdisease who live in community centers or retirement homes.The only measure that did not correlate as hypothesizedwith the 6-minute walk was body mass index. Of theself-reported measures, general health demonstrated a lowercorrelation. Unlike the other measures, general health is nota direct measure of physical function. The direction of thecorrelation, however, was in the hypothesized direction.
Higher correlations between 6-minute walk and per-formance measures were found for older adults in retirementhomes than in community centers. This could be partiallyexplained by the ceiling effects of some of the performancetests in the community sample. Older adults in the retire-ment homes were more likely to have their impairmentscaptured by the performance tests used in this study.
Our findings that 69% of the variance in the 6-minutewalk was explained by self-reported physical functioning,lower body strength, balance, and gait speed confirmed ourhypothesis. These findings indicate that the 6-minute walkcould act as an integrated measure of self-reported physicalfunctioning and performance tests of impairments. Althougha large proportion of the 6-minute walk variance wasaccounted for in our model, 31% is still unexplained. This31% may be partially explained by other impairments nottested in this study, such as cardiovascular capacity or rangeof motion limitations.
Our results are encouraging because they indicate thatthe 6-minute walk could be useful to rehabilitation practi-tioners. There are many potential clinical applications of the6-minute walk. The distance walked in 6 minutes can beused to assess an individual’s endurance. Gait velocity canbe averaged over the 6-minute interval and compared withfunctional gait speeds established in the literature. Forexample, the literature has defined independent communityambulation as the ability to walk at least 332 meters at a gaitvelocity of 80m/min.29 In another study of older pedestri-ans, Hoxie and coworkers30 found that 96% walked slowerthan a 1.22m/sec guideline used by city traffic engineers toset traffic signal timing. Therefore, an individual’s perform-ance on the 6-minute walk could be used as an indicator ofability to ambulate in the community.
Other studies have used the 6-minute walk as an outcomemeasure to determine a patient’s improvement following arehabilitation intervention. Gunnarsson and colleagues13
found an improvement of 11.6% from 373 meters to 421meters in community dwelling older adults with a mean ageof 78 years engaged in a 12-week moderate-intensity walk-ing program. In contrast, other shorter timed walking tests
(4)
Table 3: Known-Groups Validity: Distance Walked During 6-Minute Walk
Retirement CommunityHomes CentersInactive Active Total(n = 35) (n = 51) (n = 86)
Age, yrs.Mean (SD) 79 (6) 73 (5) 75 (6)Range 65-89 65-86 65-89
Gender, % Female 63 63 63Race, %
White 31 35 33African-American 9 2 5Japanese-American 60 63 62
Educational, mean (SD) yrs. 13 (3) 14 (3) 13 (3)Marital Status, % married 6 51 33Folstein score, mean (SD) 27 (2) 29 (1) 28 (2)Self-Reported medical conditions, %
Visual deficits 34 22 27Hearing deficits 29 24 26Arthritis 40 41 41Hypertension 50 29 38Asthma 14 4 8Diabetes 29 12 19Healing in last 12 months 26 24 25
Table 1: Demographic and Medical Characteristicsn r
Total 83 .95By Site
Retirement Home 34 .91Community center 49 .87
By GenderMale 29 .94Female 54 .95
By age group65 - 74 yrs 41 .94> 75 yrs 42 .94
Table 2: 1-Week Test-Retest Reliability of 6-Minute Walk
Retirement CommunityHomes Centers(n = 35) (n = 51) t Test
DistanceMean (SD), feet 901 (350) 1,629 (313) t = 10.1, p<.0001Range, feet 300-1,665 777-2,353

© BIODEX MEDICAL SYSTEMS, INC. 4-59
may not demonstrate sensitivity to change. Grace and col-leagues1 found that one 50-foot walk time was a poor out-come measure in rheumatic disease drug trials, based ontheir review of 51 published trials using this measure. Ascompared with other outcomes also employed in these 51trials, the 50-foot walk time was statistically significant inonly 21 trials (41% of the time) as compared with 81 % forthe best outcome measure, morning stiffness. In addition,the mean of the differences in the 50-foot walk time in the21 trials where statistically significant differences werefound was only 2 seconds.
The subjects in our study represent a convenience sam-ple of older adults drawn by design from community centersand retirement homes or the community at large. Therefore,the results cannot be generalized to older adults living inother settings such as nursing homes or to those not attend-ing community centers. Since all of the Asian participantswere English-speaking, it is improbable that ethnicity wouldlimit the generalizability of these results.
To improve the clinical usefulness of the 6-minute walk,further studies should be conducted to refine our under-standing of the relationship of the 6-minute walk withimpairments (limitations in range of motion, strength, pro-prioception, pain) and functional limitations involvingmobility (transfers, walking, shopping). By understandingthese relationships, rehabilitation practitioners will obtain afull understanding of how a performance-based measuresuch as the 6-minute walk can be used to evaluate the func-tional status of older adults.
References1. Grace EM, Gerecz EM, Kassam YB, Buchanan WW, TugwellPS. 50-foot walking time: a critical assessment of an outcome meas-ure in clinical therapeutic trials of antirheumatic drugs. Br JRhatoltol 1988;27:372-4.
2. McGavin CR, Gupta SP, McHardy. Twelve-minute walking testfor assessing disability in chronic bronchitis. BMJ 1976;1:822-3.
3. Butland RJA, Pang J, Gross ER, Woodcock AA, Geddes DM.Two-, six-, and twelve-minute walking tests in respiratory disease.BMJ 1982;284:1607-8.
4. Bittner V, Weiner DH, Yusuf S, Rogers WJ, McIntyre KM,Bangdiwala SI, et al. Prediction of mortality and morbidity with a6-minute walk test in patients with left ventricular dysfunction.JAMA 1993;270:1702-7.
5. Bernstein ML, Despars JA, Singh NP, Avalos K, StansburyDW, Light RW. Reanalysis of the 12-minute walk in patients withchronic obstructive pulmonary disease. Chest 1994;105:163-7.
6. Peeters P, Mets T. The 6-minute walk as an appropriate exercisetest in elderly patients with chronic heart failure. J Gerontol MedSci 1996;51A:M147-51.
7. Guyatt GH, Sullivan MJ, Thompson PJ, Fallen EL, PugsleySO, Taylor DW, et al. The 6-minute walk: a new measure of exer-cise capacity in patients with chronic heart failure. Can Med AssocJ 1985; 132:919-23.
8. Lipkin DP, Scriven AJ, Crake T, Poole-Wilson PA. Six minutewalking test for assessing exercise capacity in chronic heart failure.BMJ 1986;292:653-5.
9. Roomi J, Johnson MM, Waters K, Yohannes A, Helm A,Connolly MJ. Respiratory rehabilitation, exercise capacity andquality of life in chronic airways disease in old age. Age Ageing1996;25:12-6.
10. Cahalin LP, Mathier MA, Semigran MJ, Dec GW, DiSalvo TG. The six-minute walk test predicts peak oxygen uptake and survivalin patients with advanced heart failure. Chest 1996; 110:325-32.
11. Fitts, SS, Guthrie MR. Six-minute walk by people with chron-ic renal failure. Assessment of effort by perceived exertion. Am JPhys Med Rehabil 1995;74:54-8.
12. Hogue CC, Belyea M, DeVellis BM, Riegger-Krugh C,Rosemond C. Effects of an integrated exercises intervention onsedentary older adults with arthritis [abstract]. Gerontologist1997;37:125.
13. Gunnarsson OT, Judge JO, Earles DR, Marcella GR. A com-parison of walking programs for older adults: effects on six minutewalking distance [abstract]. Gerontologist 1997;37:126.
14. Guyatt GH, Pugsley SO, Sullivan MJ, Thompson PJ, BermanLB, Jones NL, et al. Effect of encouragement on walking test per-formance. Thorax 1984;39:818-22.
15. Sullivan PE. Ambulation: an integrated framework to achieve afunctional outcome. In: Guccione AA, editor. Geriatric physicaltherapy. St. Louis: Mosby; 1993. p. 253-68.
(5)
Table 4: Construct Validity: Correlation of Performance-Based,Clinical, and Self-Report Measures With 6-Minute Walk Distance
Retirement CommunityHome Center Total
(n = 35) (n = 51) (n = 86)Performance/Clinical Measures
Chair stands (+) .70 .53 .67Tandem balance (+) .59 .39 .528-Foot walk (-) -.68 -.45 -.73Body Mass index (-) -.28 -.21 -.07
Self-Report MeasuresPhysical Functioning (+) .46 .53 .55General Health Perceptions (+) .10 .24 .39
A (+) indicates that a higher score is better; (-) indicates lower score is better.
Table 5: Forward Regression of 6-Minute Walk Distance onSelf-Reported and Clinical Measures (n = 86)
ModelStep Variable R2 p
1 8-foot walk .54 .00012 Self-reported physical functioning .64 .00013 Chair Stands .67 .02224 Tandem standing balance .69 .0683
Model R2 = .69, p = .0001.

4-60 MOBILITY-RELATED FUNCTION IN OLDER ADULTS
16. Bendall MJ, Bassey EJ, Pearson MB. Factors affecting walkingspeed of elderly people. Age Ageing 1989;18:327-32.
17. Woo J, Ho SC, Lau J, Chan SG, Yuen YK. Age-associated gaitchanges in the elderly: pathological or physiological?Neuroepidemiology 1995;14:65-71.
18. Giuliani CA. Adult hemiplegic gait. In: Smidt G, editor. Gait inrehabilitation. New York: Churchill Livingstone; 1990. p. 253-66.
19. Csuka M, McCarty DJ. Simple method for measurement oflower extremity muscle strength. Am J Med 1985;78:77-81.
20. Guralnik JM, Simonsick EM, Ferrucci L, Glynn RJ, BerkmanLF, Blazer DG, et al. A short physical performance battery assess-ing lower extremity function: association with self-reported disabil-ity and prediction of mortality and nursing home admission. JGerontol Med Sci 1994;49:M85-94.
21. Winograd C, Lemsky CM, Nevitt MC, Nordstrom TM, StewartAL, Miller CJ, et al. Development of a physical performance andmobility examination. J Am Geriatr Soc 1994;42:743-9.
22. Murray MP, Gardner GM, Mollinger LA, Sepic SB. Strength ofisometric and isokinetic contractions. Phys Ther 1980;60:413-9.
23. Murray MP, Duthie EH Jr, Gambert SR, Sepic SB, MollingerLA. Age-related decline in knee muscle strength in normal women.J Gerontol 1985;40:275-80.
24. Garrow JS, Webster J. Quetelet’s Index (W/H2) as a measure of
fatness. Int J Obesity 1985;9:147-53.
25. Ware JE. SF-36 Health Survey - Manual and interpretationguide. Boston: The Health Institute, New England Medical Center;1993.
26. McHorney CA. Ware UE, Rachel Lu JF, Sherbourne C. ThcMOS 36-Item Short-Form Health Survey (SF-36): III. Tests of dataquality, scaling assumptions, and reliability across diverse patientgroups. Med Care 1994;32:40-66.
27. Folstein MF, Folstein SE, McHugh PR. “Mini-mental state” apractical method for grading the cognitive state of patients for theclinician. J Psychiatr Res 1975; 12:189-98.
28. SAS Institute Inc. SAS/STAT User’s Guide, Version 6. 4th ed.Cary (NC): SAS Institute; 1993.
29. Menard-Rothe K, Sobush DC, Bousamra M, Haasler GB,Lipchik RJ. Self-selected walking velocity for functional ambula-tion in patients with end-stage emphysema. J Cardiopulm Rehabil1997;17:85-91.
30. Hoxie RE, Rubenstein LZ, Hoenig H, Gallagher BR. The olderpedestrian. J Am Geriatr Soc 1994;42:444-50.
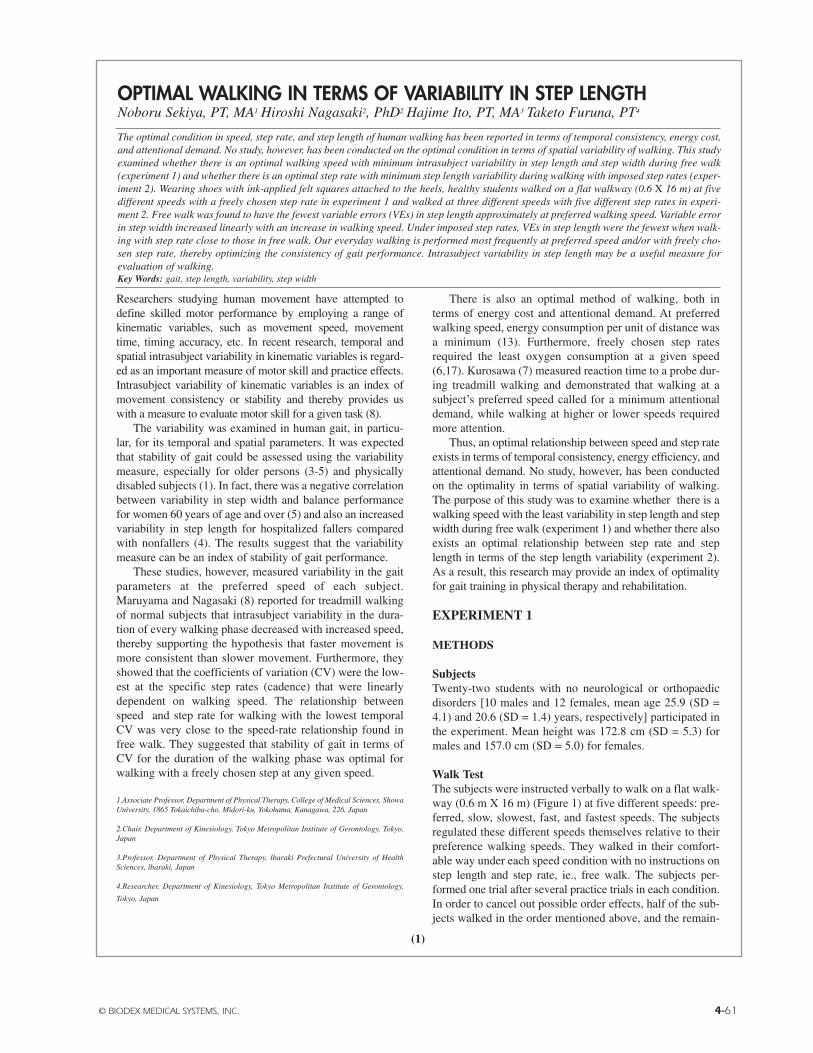
© BIODEX MEDICAL SYSTEMS, INC. 4-61
(1)
Researchers studying human movement have attempted todefine skilled motor performance by employing a range ofkinematic variables, such as movement speed, movementtime, timing accuracy, etc. In recent research, temporal andspatial intrasubject variability in kinematic variables is regard-ed as an important measure of motor skill and practice effects.Intrasubject variability of kinematic variables is an index ofmovement consistency or stability and thereby provides uswith a measure to evaluate motor skill for a given task (8).
The variability was examined in human gait, in particu-lar, for its temporal and spatial parameters. It was expectedthat stability of gait could be assessed using the variabilitymeasure, especially for older persons (3-5) and physicallydisabled subjects (1). In fact, there was a negative correlationbetween variability in step width and balance performancefor women 60 years of age and over (5) and also an increasedvariability in step length for hospitalized fallers comparedwith nonfallers (4). The results suggest that the variabilitymeasure can be an index of stability of gait performance.
These studies, however, measured variability in the gaitparameters at the preferred speed of each subject.Maruyama and Nagasaki (8) reported for treadmill walkingof normal subjects that intrasubject variability in the dura-tion of every walking phase decreased with increased speed,thereby supporting the hypothesis that faster movement ismore consistent than slower movement. Furthermore, theyshowed that the coefficients of variation (CV) were the low-est at the specific step rates (cadence) that were linearlydependent on walking speed. The relationship betweenspeed and step rate for walking with the lowest temporalCV was very close to the speed-rate relationship found infree walk. They suggested that stability of gait in terms ofCV for the duration of the walking phase was optimal forwalking with a freely chosen step at any given speed.
1.Associate Professor, Department of Physical Therapy, College of Medical Sciences, ShowaUniversity, 1865 Tokaichiba-cho, Midori-ku, Yokohama, Kanagawa, 226, Japan
2.Chair, Department of Kinesiology, Tokyo Metropolitan Institute of Gerontology, Tokyo,Japan
3.Professor, Department of Physical Therapy, lbaraki Prefectural University of HealthSciences, lbaraki, Japan
4.Researcher, Department of Kinesiology, Tokyo Metropolitan Institute of Gerontology,
Tokyo, Japan
There is also an optimal method of walking, both interms of energy cost and attentional demand. At preferredwalking speed, energy consumption per unit of distance wasa minimum (13). Furthermore, freely chosen step ratesrequired the least oxygen consumption at a given speed(6,17). Kurosawa (7) measured reaction time to a probe dur-ing treadmill walking and demonstrated that walking at asubject’s preferred speed called for a minimum attentionaldemand, while walking at higher or lower speeds requiredmore attention.
Thus, an optimal relationship between speed and step rateexists in terms of temporal consistency, energy efficiency, andattentional demand. No study, however, has been conductedon the optimality in terms of spatial variability of walking.The purpose of this study was to examine whether there is awalking speed with the least variability in step length and stepwidth during free walk (experiment 1) and whether there alsoexists an optimal relationship between step rate and steplength in terms of the step length variability (experiment 2).As a result, this research may provide an index of optimalityfor gait training in physical therapy and rehabilitation.
EXPERIMENT 1
METHODS
SubjectsTwenty-two students with no neurological or orthopaedicdisorders [10 males and 12 females, mean age 25.9 (SD =4.1) and 20.6 (SD = 1.4) years, respectively] participated inthe experiment. Mean height was 172.8 cm (SD = 5.3) formales and 157.0 cm (SD = 5.0) for females.
Walk TestThe subjects were instructed verbally to walk on a flat walk-way (0.6 m X 16 m) (Figure 1) at five different speeds: pre-ferred, slow, slowest, fast, and fastest speeds. The subjectsregulated these different speeds themselves relative to theirpreference walking speeds. They walked in their comfort-able way under each speed condition with no instructions onstep length and step rate, ie., free walk. The subjects per-formed one trial after several practice trials in each condition.In order to cancel out possible order effects, half of the sub-jects walked in the order mentioned above, and the remain-
The optimal condition in speed, step rate, and step length of human walking has been reported in terms of temporal consistency, energy cost,and attentional demand. No study, however, has been conducted on the optimal condition in terms of spatial variability of walking. This studyexamined whether there is an optimal walking speed with minimum intrasubject variability in step length and step width during free walk(experiment 1) and whether there is an optimal step rate with minimum step length variability during walking with imposed step rates (exper-iment 2). Wearing shoes with ink-applied felt squares attached to the heels, healthy students walked on a flat walkway (0.6 X 16 m) at fivedifferent speeds with a freely chosen step rate in experiment 1 and walked at three different speeds with five different step rates in experi-ment 2. Free walk was found to have the fewest variable errors (VEs) in step length approximately at preferred walking speed. Variable errorin step width increased linearly with an increase in walking speed. Under imposed step rates, VEs in step length were the fewest when walk-ing with step rate close to those in free walk. Our everyday walking is performed most frequently at preferred speed and/or with freely cho-sen step rate, thereby optimizing the consistency of gait performance. Intrasubject variability in step length may be a useful measure forevaluation of walking.Key Words: gait, step length, variability, step width
OPTIMAL WALKING IN TERMS OF VARIABILITY IN STEP LENGTHNoboru Sekiya, PT, MA1 Hiroshi Nagasaki2, PhD2 Hajime Ito, PT, MA3 Taketo Furuna, PT4
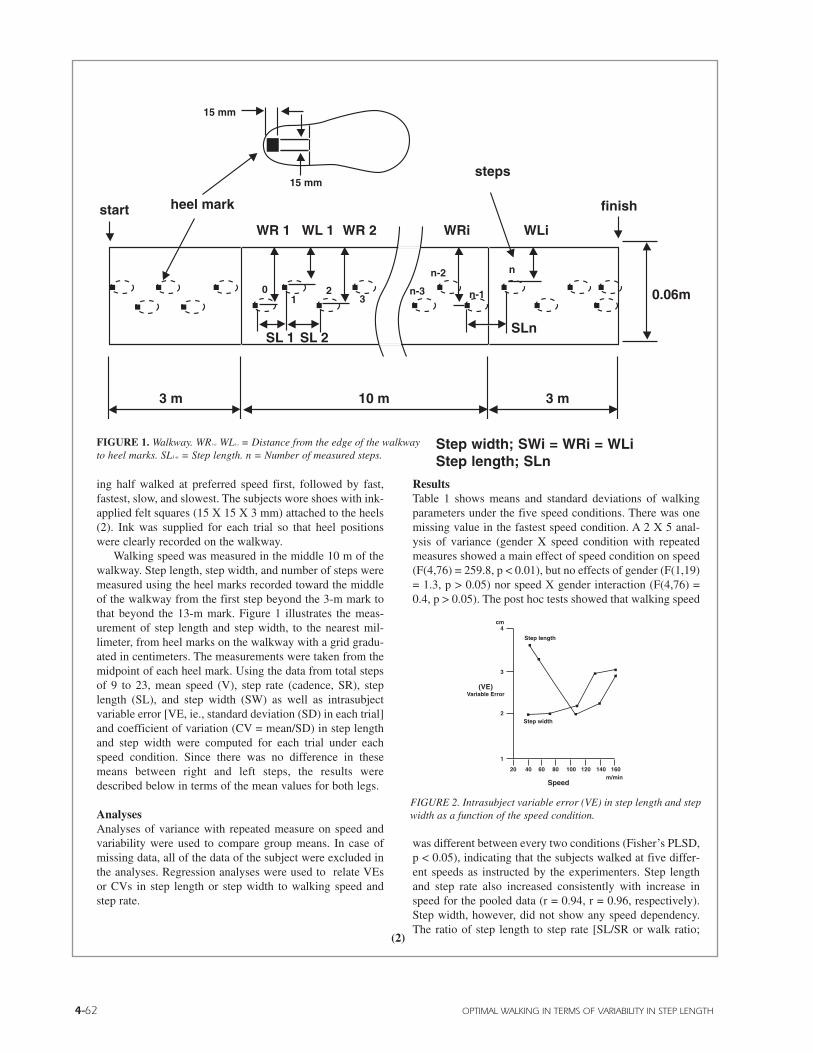
4-62 OPTIMAL WALKING IN TERMS OF VARIABILITY IN STEP LENGTH
(2)
ing half walked at preferred speed first, followed by fast,fastest, slow, and slowest. The subjects wore shoes with ink-applied felt squares (15 X 15 X 3 mm) attached to the heels(2). Ink was supplied for each trial so that heel positionswere clearly recorded on the walkway.
Walking speed was measured in the middle 10 m of thewalkway. Step length, step width, and number of steps weremeasured using the heel marks recorded toward the middleof the walkway from the first step beyond the 3-m mark tothat beyond the 13-m mark. Figure 1 illustrates the meas-urement of step length and step width, to the nearest mil-limeter, from heel marks on the walkway with a grid gradu-ated in centimeters. The measurements were taken from themidpoint of each heel mark. Using the data from total stepsof 9 to 23, mean speed (V), step rate (cadence, SR), steplength (SL), and step width (SW) as well as intrasubjectvariable error [VE, ie., standard deviation (SD) in each trial]and coefficient of variation (CV = mean/SD) in step lengthand step width were computed for each trial under eachspeed condition. Since there was no difference in thesemeans between right and left steps, the results weredescribed below in terms of the mean values for both legs.
AnalysesAnalyses of variance with repeated measure on speed andvariability were used to compare group means. In case ofmissing data, all of the data of the subject were excluded inthe analyses. Regression analyses were used to relate VEsor CVs in step length or step width to walking speed andstep rate.
ResultsTable 1 shows means and standard deviations of walkingparameters under the five speed conditions. There was onemissing value in the fastest speed condition. A 2 X 5 anal-ysis of variance (gender X speed condition with repeatedmeasures showed a main effect of speed condition on speed(F(4,76) = 259.8, p < 0.01), but no effects of gender (F(1,19)= 1.3, p > 0.05) nor speed X gender interaction (F(4,76) =0.4, p > 0.05). The post hoc tests showed that walking speed
was different between every two conditions (Fisher’s PLSD,p < 0.05), indicating that the subjects walked at five differ-ent speeds as instructed by the experimenters. Step lengthand step rate also increased consistently with increase inspeed for the pooled data (r = 0.94, r = 0.96, respectively).Step width, however, did not show any speed dependency.The ratio of step length to step rate [SL/SR or walk ratio;
FIGURE 1. Walkway. WR1-ir WL1-i = Distance from the edge of the walkwayto heel marks. SL1-n = Step length. n = Number of measured steps.
finish
steps
WLiWRiWR 2WL 1WR 1
start heel mark
3 m 10 m 3 m
SLnSL 2SL 1
0.06mn-3
n-2
15 mm
15 mm
01
23 n-1
n
Step width; SWi = WRi = WLiStep length; SLn
Walk ratio(m/steps/min)
speed(m/min)
Step rate
Step length
X; preferred walk
VE; variable error in step length
Walk Ratio; step length devided by step rate
1.50.007
0.006
0.005
160
120
80
40
VE
m
(cm)5.04.54.03.5
3.0
2.5
1.0
0.5
0 50 100 150 200 steps/min
80 100
1.0
2.0
3.0
4.0
120 140 160steps/min
cm
VEin
step length
Step rate
fast
preferred
slow
40 16020 60
1
2
3
4
80 100 120 140m/min
cm
(VE)Variable Error
Speed
Step length
Step width
FIGURE 2. Intrasubject variable error (VE) in step length and stepwidth as a function of the speed condition.
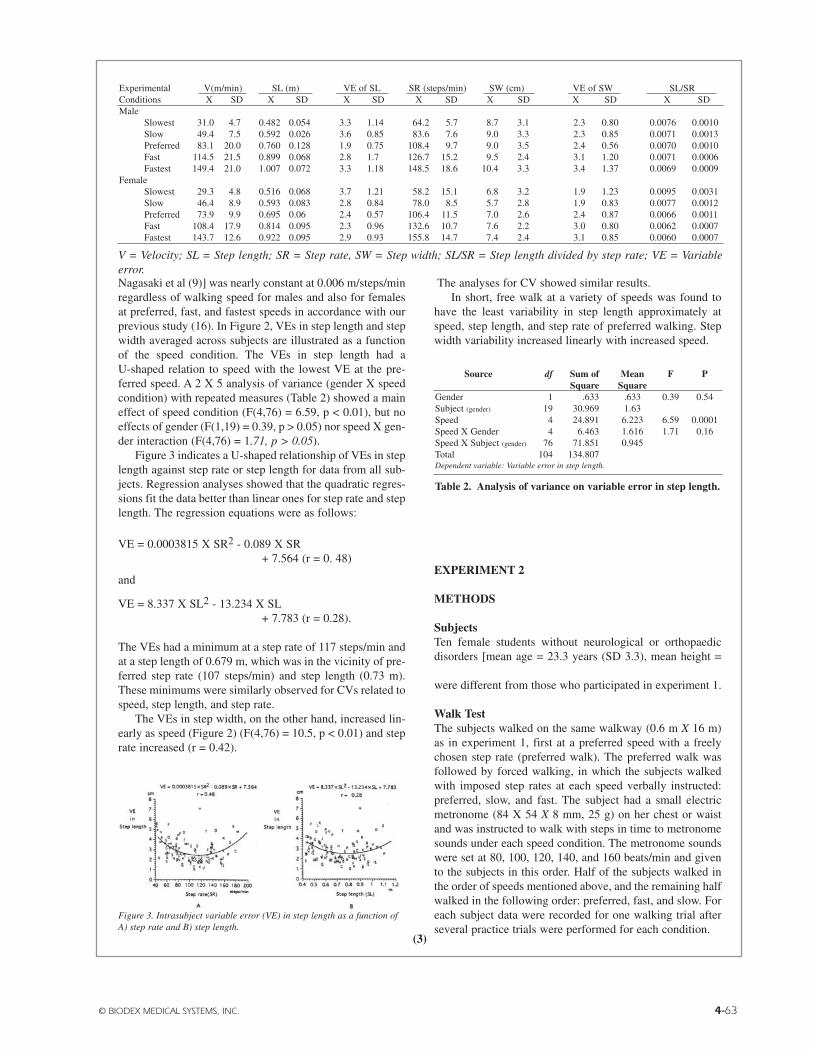
© BIODEX MEDICAL SYSTEMS, INC. 4-63
Nagasaki et al (9)] was nearly constant at 0.006 m/steps/minregardless of walking speed for males and also for femalesat preferred, fast, and fastest speeds in accordance with ourprevious study (16). In Figure 2, VEs in step length and stepwidth averaged across subjects are illustrated as a functionof the speed condition. The VEs in step length had aU-shaped relation to speed with the lowest VE at the pre-ferred speed. A 2 X 5 analysis of variance (gender X speedcondition) with repeated measures (Table 2) showed a maineffect of speed condition (F(4,76) = 6.59, p < 0.01), but noeffects of gender (F(1,19) = 0.39, p > 0.05) nor speed X gen-der interaction (F(4,76) = 1.71, p > 0.05).
Figure 3 indicates a U-shaped relationship of VEs in steplength against step rate or step length for data from all sub-jects. Regression analyses showed that the quadratic regres-sions fit the data better than linear ones for step rate and steplength. The regression equations were as follows:
VE = 0.0003815 X SR2 - 0.089 X SR+ 7.564 (r = 0. 48)
and
VE = 8.337 X SL2 - 13.234 X SL+ 7.783 (r = 0.28).
The VEs had a minimum at a step rate of 117 steps/min andat a step length of 0.679 m, which was in the vicinity of pre-ferred step rate (107 steps/min) and step length (0.73 m).These minimums were similarly observed for CVs related tospeed, step length, and step rate.
The VEs in step width, on the other hand, increased lin-early as speed (Figure 2) (F(4,76) = 10.5, p < 0.01) and steprate increased (r = 0.42).
The analyses for CV showed similar results.In short, free walk at a variety of speeds was found to
have the least variability in step length approximately atspeed, step length, and step rate of preferred walking. Stepwidth variability increased linearly with increased speed.
EXPERIMENT 2
METHODS
SubjectsTen female students without neurological or orthopaedicdisorders [mean age = 23.3 years (SD 3.3), mean height =156.9 cm (SD 4.6)] participated in the experiment. Theywere different from those who participated in experiment 1.
Walk TestThe subjects walked on the same walkway (0.6 m X 16 m)as in experiment 1, first at a preferred speed with a freelychosen step rate (preferred walk). The preferred walk wasfollowed by forced walking, in which the subjects walkedwith imposed step rates at each speed verbally instructed:preferred, slow, and fast. The subject had a small electricmetronome (84 X 54 X 8 mm, 25 g) on her chest or waistand was instructed to walk with steps in time to metronomesounds under each speed condition. The metronome soundswere set at 80, 100, 120, 140, and 160 beats/min and givento the subjects in this order. Half of the subjects walked inthe order of speeds mentioned above, and the remaining halfwalked in the following order: preferred, fast, and slow. Foreach subject data were recorded for one walking trial afterseveral practice trials were performed for each condition.
Experimental V(m/min) SL (m) VE of SL SR (steps/min) SW (cm) VE of SW SL/SRConditions X SD X SD X SD X SD X SD X SD X SDMale
Slowest 31.0 4.7 0.482 0.054 3.3 1.14 64.2 5.7 8.7 3.1 2.3 0.80 0.0076 0.0010Slow 49.4 7.5 0.592 0.026 3.6 0.85 83.6 7.6 9.0 3.3 2.3 0.85 0.0071 0.0013Preferred 83.1 20.0 0.760 0.128 1.9 0.75 108.4 9.7 9.0 3.5 2.4 0.56 0.0070 0.0010Fast 114.5 21.5 0.899 0.068 2.8 1.7 126.7 15.2 9.5 2.4 3.1 1.20 0.0071 0.0006Fastest 149.4 21.0 1.007 0.072 3.3 1.18 148.5 18.6 10.4 3.3 3.4 1.37 0.0069 0.0009
FemaleSlowest 29.3 4.8 0.516 0.068 3.7 1.21 58.2 15.1 6.8 3.2 1.9 1.23 0.0095 0.0031Slow 46.4 8.9 0.593 0.083 2.8 0.84 78.0 8.5 5.7 2.8 1.9 0.83 0.0077 0.0012Preferred 73.9 9.9 0.695 0.06 2.4 0.57 106.4 11.5 7.0 2.6 2.4 0.87 0.0066 0.0011Fast 108.4 17.9 0.814 0.095 2.3 0.96 132.6 10.7 7.6 2.2 3.0 0.80 0.0062 0.0007Fastest 143.7 12.6 0.922 0.095 2.9 0.93 155.8 14.7 7.4 2.4 3.1 0.85 0.0060 0.0007
V = Velocity; SL = Step length; SR = Step rate, SW = Step width; SL/SR = Step length divided by step rate; VE = Variableerror.
Source df Sum of Mean F PSquare Square
Gender 1 .633 .633 0.39 0.54Subject (gender) 19 30.969 1.63Speed 4 24.891 6.223 6.59 0.0001Speed X Gender 4 6.463 1.616 1.71 0.16Speed X Subject (gender) 76 71.851 0.945Total 104 134.807Dependent variable: Variable error in step length.
Table 2. Analysis of variance on variable error in step length.
Figure 3. Intrasubject variable error (VE) in step length as a function ofA) step rate and B) step length.
(3)
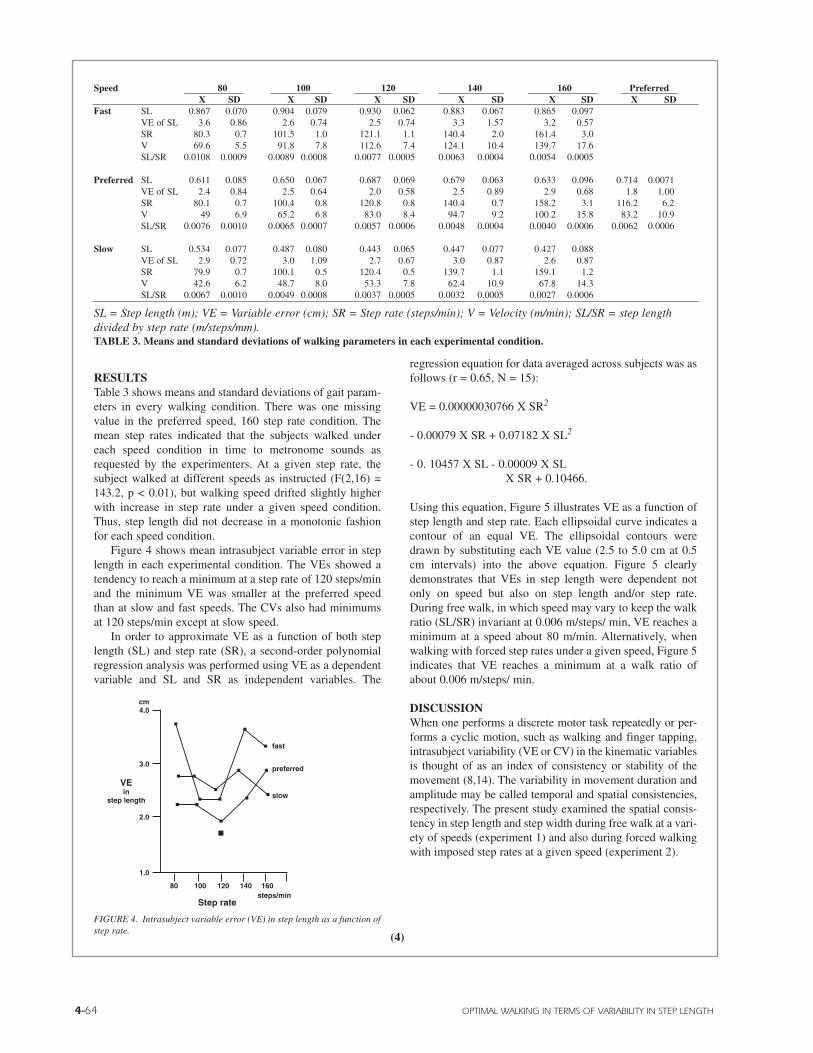
4-64 OPTIMAL WALKING IN TERMS OF VARIABILITY IN STEP LENGTH
RESULTSTable 3 shows means and standard deviations of gait param-eters in every walking condition. There was one missingvalue in the preferred speed, 160 step rate condition. Themean step rates indicated that the subjects walked undereach speed condition in time to metronome sounds asrequested by the experimenters. At a given step rate, thesubject walked at different speeds as instructed (F(2,16) =143.2, p < 0.01), but walking speed drifted slightly higherwith increase in step rate under a given speed condition.Thus, step length did not decrease in a monotonic fashionfor each speed condition.
Figure 4 shows mean intrasubject variable error in steplength in each experimental condition. The VEs showed atendency to reach a minimum at a step rate of 120 steps/minand the minimum VE was smaller at the preferred speedthan at slow and fast speeds. The CVs also had minimumsat 120 steps/min except at slow speed.
In order to approximate VE as a function of both steplength (SL) and step rate (SR), a second-order polynomialregression analysis was performed using VE as a dependentvariable and SL and SR as independent variables. The
regression equation for data averaged across subjects was asfollows (r = 0.65, N = 15):
VE = 0.00000030766 X SR2
- 0.00079 X SR + 0.07182 X SL2
- 0. 10457 X SL - 0.00009 X SLX SR + 0.10466.
Using this equation, Figure 5 illustrates VE as a function ofstep length and step rate. Each ellipsoidal curve indicates acontour of an equal VE. The ellipsoidal contours weredrawn by substituting each VE value (2.5 to 5.0 cm at 0.5cm intervals) into the above equation. Figure 5 clearlydemonstrates that VEs in step length were dependent notonly on speed but also on step length and/or step rate.During free walk, in which speed may vary to keep the walkratio (SL/SR) invariant at 0.006 m/steps/ min, VE reaches aminimum at a speed about 80 m/min. Alternatively, whenwalking with forced step rates under a given speed, Figure 5indicates that VE reaches a minimum at a walk ratio ofabout 0.006 m/steps/ min.
DISCUSSIONWhen one performs a discrete motor task repeatedly or per-forms a cyclic motion, such as walking and finger tapping,intrasubject variability (VE or CV) in the kinematic variablesis thought of as an index of consistency or stability of themovement (8,14). The variability in movement duration andamplitude may be called temporal and spatial consistencies,respectively. The present study examined the spatial consis-tency in step length and step width during free walk at a vari-ety of speeds (experiment 1) and also during forced walkingwith imposed step rates at a given speed (experiment 2).
Speed 80 100 120 140 160 PreferredX SD X SD X SD X SD X SD X SD
Fast SL 0.867 0.070 0.904 0.079 0.930 0.062 0.883 0.067 0.865 0.097VE of SL 3.6 0.86 2.6 0.74 2.5 0.74 3.3 1.57 3.2 0.57SR 80.3 0.7 101.5 1.0 121.1 1.1 140.4 2.0 161.4 3.0V 69.6 5.5 91.8 7.8 112.6 7.4 124.1 10.4 139.7 17.6SL/SR 0.0108 0.0009 0.0089 0.0008 0.0077 0.0005 0.0063 0.0004 0.0054 0.0005
Preferred SL 0.611 0.085 0.650 0.067 0.687 0.069 0.679 0.063 0.633 0.096 0.714 0.0071VE of SL 2.4 0.84 2.5 0.64 2.0 0.58 2.5 0.89 2.9 0.68 1.8 1.00SR 80.1 0.7 100.4 0.8 120.8 0.8 140.4 0.7 158.2 3.1 116.2 6.2V 49 6.9 65.2 6.8 83.0 8.4 94.7 9.2 100.2 15.8 83.2 10.9SL/SR 0.0076 0.0010 0.0065 0.0007 0.0057 0.0006 0.0048 0.0004 0.0040 0.0006 0.0062 0.0006
Slow SL 0.534 0.077 0.487 0.080 0.443 0.065 0.447 0.077 0.427 0.088VE of SL 2.9 0.72 3.0 1.09 2.7 0.67 3.0 0.87 2.6 0.87SR 79.9 0.7 100.1 0.5 120.4 0.5 139.7 1.1 159.1 1.2V 42.6 6.2 48.7 8.0 53.3 7.8 62.4 10.9 67.8 14.3SL/SR 0.0067 0.0010 0.0049 0.0008 0.0037 0.0005 0.0032 0.0005 0.0027 0.0006
SL = Step length (m); VE = Variable error (cm); SR = Step rate (steps/min); V = Velocity (m/min); SL/SR = step lengthdivided by step rate (m/steps/mm).TABLE 3. Means and standard deviations of walking parameters in each experimental condition.
Walk ratio(m/steps/min)
speed(m/min)
Step rate
Step length
X; preferred walk
VE; variable error in step length
Walk Ratio; step length devided by step rate
1.50.007
0.006
0.005
160
120
80
40
VE
m
(cm)5.04.54.03.5
3.0
2.5
1.0
0.5
0 50 100 150 200 steps/min
80 100
1.0
2.0
3.0
4.0
120 140 160steps/min
cm
VEin
step length
Step rate
fast
preferred
slow
40 16020 60
1
2
3
4
80 100 120 140m/min
cm
(VE)Variable Error
Speed
Step length
Step width
FIGURE 4. Intrasubject variable error (VE) in step length as a function ofstep rate.
(4)
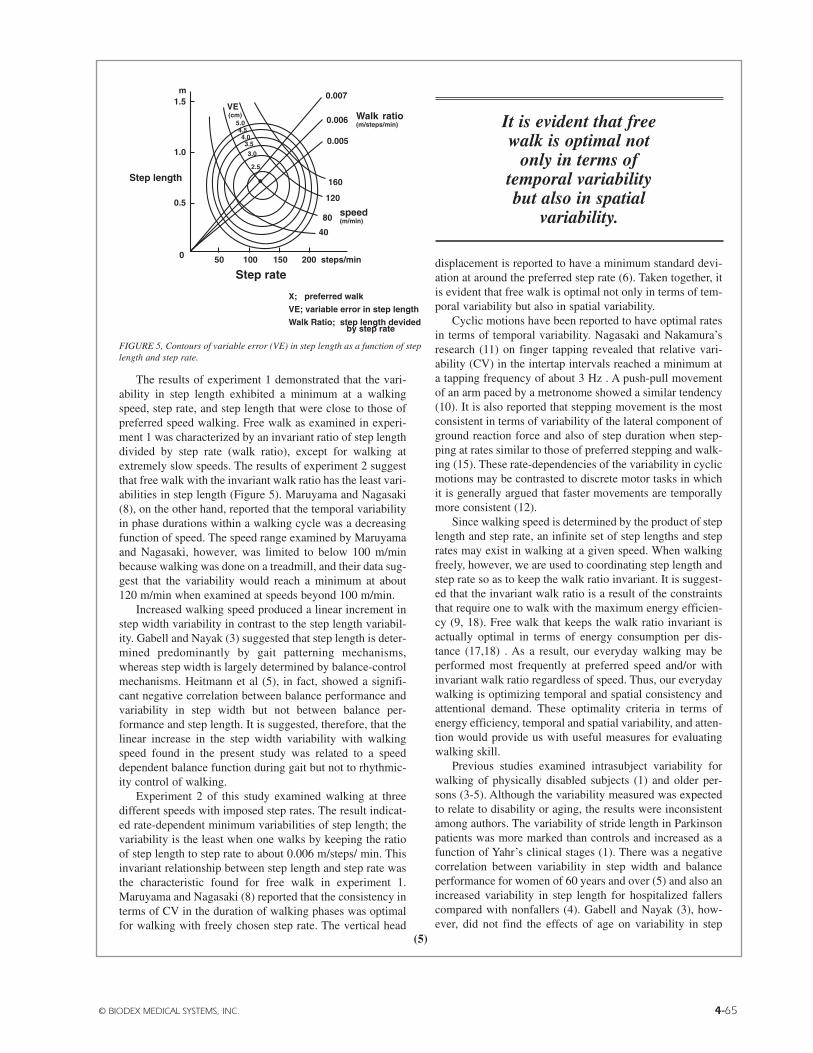
© BIODEX MEDICAL SYSTEMS, INC. 4-65
(5)
The results of experiment 1 demonstrated that the vari-ability in step length exhibited a minimum at a walkingspeed, step rate, and step length that were close to those ofpreferred speed walking. Free walk as examined in experi-ment 1 was characterized by an invariant ratio of step lengthdivided by step rate (walk ratio), except for walking atextremely slow speeds. The results of experiment 2 suggestthat free walk with the invariant walk ratio has the least vari-abilities in step length (Figure 5). Maruyama and Nagasaki(8), on the other hand, reported that the temporal variabilityin phase durations within a walking cycle was a decreasingfunction of speed. The speed range examined by Maruyamaand Nagasaki, however, was limited to below 100 m/minbecause walking was done on a treadmill, and their data sug-gest that the variability would reach a minimum at about120 m/min when examined at speeds beyond 100 m/min.
Increased walking speed produced a linear increment instep width variability in contrast to the step length variabil-ity. Gabell and Nayak (3) suggested that step length is deter-mined predominantly by gait patterning mechanisms,whereas step width is largely determined by balance-controlmechanisms. Heitmann et al (5), in fact, showed a signifi-cant negative correlation between balance performance andvariability in step width but not between balance per-formance and step length. It is suggested, therefore, that thelinear increase in the step width variability with walkingspeed found in the present study was related to a speeddependent balance function during gait but not to rhythmic-ity control of walking.
Experiment 2 of this study examined walking at threedifferent speeds with imposed step rates. The result indicat-ed rate-dependent minimum variabilities of step length; thevariability is the least when one walks by keeping the ratioof step length to step rate to about 0.006 m/steps/ min. Thisinvariant relationship between step length and step rate wasthe characteristic found for free walk in experiment 1.Maruyama and Nagasaki (8) reported that the consistency interms of CV in the duration of walking phases was optimalfor walking with freely chosen step rate. The vertical head
displacement is reported to have a minimum standard devi-ation at around the preferred step rate (6). Taken together, itis evident that free walk is optimal not only in terms of tem-poral variability but also in spatial variability.
Cyclic motions have been reported to have optimal ratesin terms of temporal variability. Nagasaki and Nakamura’sresearch (11) on finger tapping revealed that relative vari-ability (CV) in the intertap intervals reached a minimum ata tapping frequency of about 3 Hz . A push-pull movementof an arm paced by a metronome showed a similar tendency(10). It is also reported that stepping movement is the mostconsistent in terms of variability of the lateral component ofground reaction force and also of step duration when step-ping at rates similar to those of preferred stepping and walk-ing (15). These rate-dependencies of the variability in cyclicmotions may be contrasted to discrete motor tasks in whichit is generally argued that faster movements are temporallymore consistent (12).
Since walking speed is determined by the product of steplength and step rate, an infinite set of step lengths and steprates may exist in walking at a given speed. When walkingfreely, however, we are used to coordinating step length andstep rate so as to keep the walk ratio invariant. It is suggest-ed that the invariant walk ratio is a result of the constraintsthat require one to walk with the maximum energy efficien-cy (9, 18). Free walk that keeps the walk ratio invariant isactually optimal in terms of energy consumption per dis-tance (17,18) . As a result, our everyday walking may beperformed most frequently at preferred speed and/or withinvariant walk ratio regardless of speed. Thus, our everydaywalking is optimizing temporal and spatial consistency andattentional demand. These optimality criteria in terms ofenergy efficiency, temporal and spatial variability, and atten-tion would provide us with useful measures for evaluatingwalking skill.
Previous studies examined intrasubject variability forwalking of physically disabled subjects (1) and older per-sons (3-5). Although the variability measured was expectedto relate to disability or aging, the results were inconsistentamong authors. The variability of stride length in Parkinsonpatients was more marked than controls and increased as afunction of Yahr’s clinical stages (1). There was a negativecorrelation between variability in step width and balanceperformance for women of 60 years and over (5) and also anincreased variability in step length for hospitalized fallerscompared with nonfallers (4). Gabell and Nayak (3), how-ever, did not find the effects of age on variability in step
Walk ratio(m/steps/min)
speed(m/min)
Step rate
Step length
X; preferred walk
VE; variable error in step length
Walk Ratio; step length devided by step rate
1.50.007
0.006
0.005
160
120
80
40
VE
m
(cm)5.04.54.03.5
3.0
2.5
1.0
0.5
0 50 100 150 200 steps/min
80 100
1.0
2.0
3.0
4.0
120 140 160steps/min
cm
VEin
step length
Step rate
fast
preferred
slow
40 16020 60
1
2
3
4
80 100 120 140m/min
cm
(VE)Variable Error
Speed
Step length
Step width
FIGURE 5, Contours of variable error (VE) in step length as a function of steplength and step rate.
It is evident that freewalk is optimal not
only in terms oftemporal variabilitybut also in spatial
variability.

4-66 OPTIMAL WALKING IN TERMS OF VARIABILITY IN STEP LENGTH
(6)
length and step width in walking. The inconsistency in theprevious studies may be due to the fact, at least in part, thatnone of the studies considered that the variability of walkingis speed and rate dependent.
Our present study showed in healthy subjects that thevariability of walking is clearly dependent both on walkingspeed and rate and thereby provided speed-and rate-depend-ent optimality criterion for spatial variability of walking. Itis thus suggested that the criterion of spatial consistency ofwalking is useful for evaluating gait in clinical and practicalsettings.
CONCLUSIONThe present study found that the variability in step lengthwas minimum at a preferred walking speed and also at freewalking with the invariant ratio of step length divided bystep rate (walk ratio). Together with findings in previousstudies, it is suggested that free walk with the invariant walkratio is optimized in terms of energy efficiency, temporaland spatial consistency, and attentional demand. Thus, steplength variability, determined at a variety of walking speedsand step rates, may provide a criterion for evaluating walk-ing skills in clinical and practical settings. JOSPT
REFERENCES
1. Blin 0, Ferrandez AM, Serratrice G: Quantitative analysis ofgait in Parkinson patients: Increased variability of stride length. JNeurol Sci 98:91-97, 1990
2. Boenig DD: Evaluation of a clinical method of gait analysis.Phys Ther 57: 795-798, 1977
3. Gabell A, Nayak USL: The effect of age on variability in gait. JGerontol 39: 662-666, 1984
4. Guimaraes RM, Isaacs B: Characteristics of the gait in old peo-ple who fall. Int Rehabil Med 2:177-180, 1980
5. Heitmann DK, Gossman MR, Shaddeau SA, Jackson JR: Balanceperformance and step width in noninstitutionalized, elderly, femalefallers and nonfallers. Phys Ther 69:923-931, 1989
6. Holt K, Jeng SF, Ratcliffe R, Hamill J: Energetic cost and sta-bility during human walking at the preferred stride frequency. J MotBehav 27:164-178, 1995
7. Kurosawa K: Effects of various walking speeds on probe reac-tion time during treadmill walking. Percept Mot Skills 78:768-770,1994
8. Maruyama H, Nagasaki H: Temporal variability in the phasedurations during treadmill walking. Human Move Sci 11:1-14, 1992
9. Nagasaki H, Ito H, Hashizume K, Furuna T, Maruyama H,Kinugasa T: Walking patterns and finger rhythm of older adults.Percept Mot Skills 82:435-447, 1996
10. Nagasaki H, Nakamura R: Rhythmic control of a push-pullmovement. Percept Mot Skills 51:747-751, 1980
11. Nagasaki H, Nakamura R: Rhythm formation and its distur-bances; A study based upon periodic response of a motor output sys-tem. J Human Ergol 11:127-142, 1982
12. Newell KM: The speed-accuracy paradox in movement control:Errors of time and space. In: Stelmach GE, Requin J (eds), Tutorialsin Motor Behavior, pp 501-509. Amsterdam: North HollandPublishing Company, 1980
13. Ralston HJ: Energy-speed relation and optimal speed duringlevel walking. Int Z Physiol Arbeitsphysiol 7:277-283, 1958
14. Schmidt RA: Motor Control and Learning (2nd Ed),Champaign, IL: Human Kinetics Publishers, 1988
15. Sekiya N, Nagasaki H, Ito H, Furuna T: The rate-dependency offorce variability in stepping movement. In: Proceedings of the FifthGeneral Assembly of the Asian Confederation for Physical Therapy,Taipei, Taiwan, R.O.C., September, 1993, pp 226-230. Taipei,Taiwan: Physical Therapy Association of The Republic of China,1993
16. Sekiya N, Nagasaki H, Ito H, Furuna T: The invariant relation-ship between step length and step rate during free walking. J HumMov Stud 30:241-257, 1996
17. Zarrugh MY, Radcliffe CW: Predicting metabolic cost of levelwalking. Eur J Appl Physiol 38:215-223, 1978
18. Zarrugh MY, Todd FN, Ralston HJ: Optimization of energyexpenditure during level walking. Eur J Appl Physiol 33:293-306,1974
Fall RiskAssessment &ConditioningProgram Manual
5) Marketing Support Material
A Listing of Available Marketing Aids

FALL RISK ASSESSMENT &CONDITIONING PROGRAM
Referring Physician Brochure
Patient Education Brochure
Sample Letters.............................................................................................................................................................5-1 thru 5-5
Sample Press Release ...............................................................................................................................................................5-7
Sample Advertisement .............................................................................................................................................................5-9
Sample Balance Screening Questionnaire ...........................................................................................................................5-11
Price List of additional marketing support materials .........................................................................................................5-13
PowerPoint Clinical Presentation CD (inside pocket, back cover)
© BIODEX MEDICAL SYSTEMS, INC.
table of contents
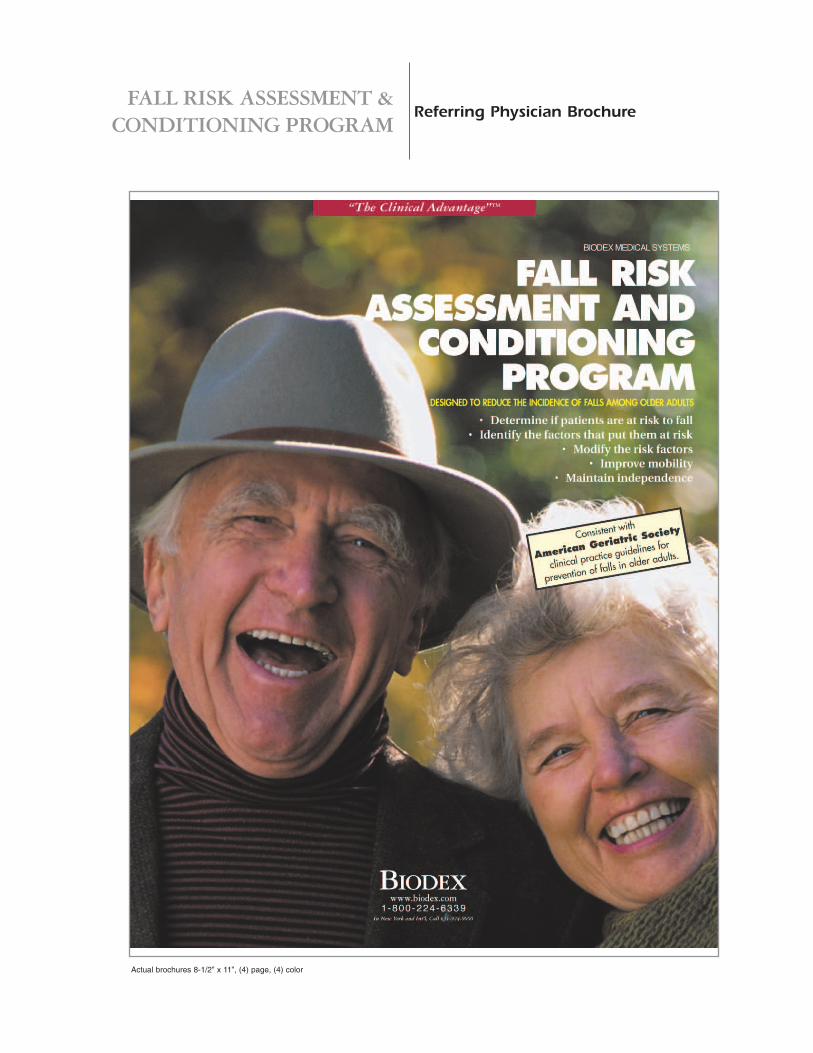
FALL RISK ASSESSMENT &CONDITIONING PROGRAM
Referring Physician Brochure
© BIODEX MEDICAL SYSTEMS, INC. V
Actual brochures 8-1/2” x 11”, (4) page, (4) color

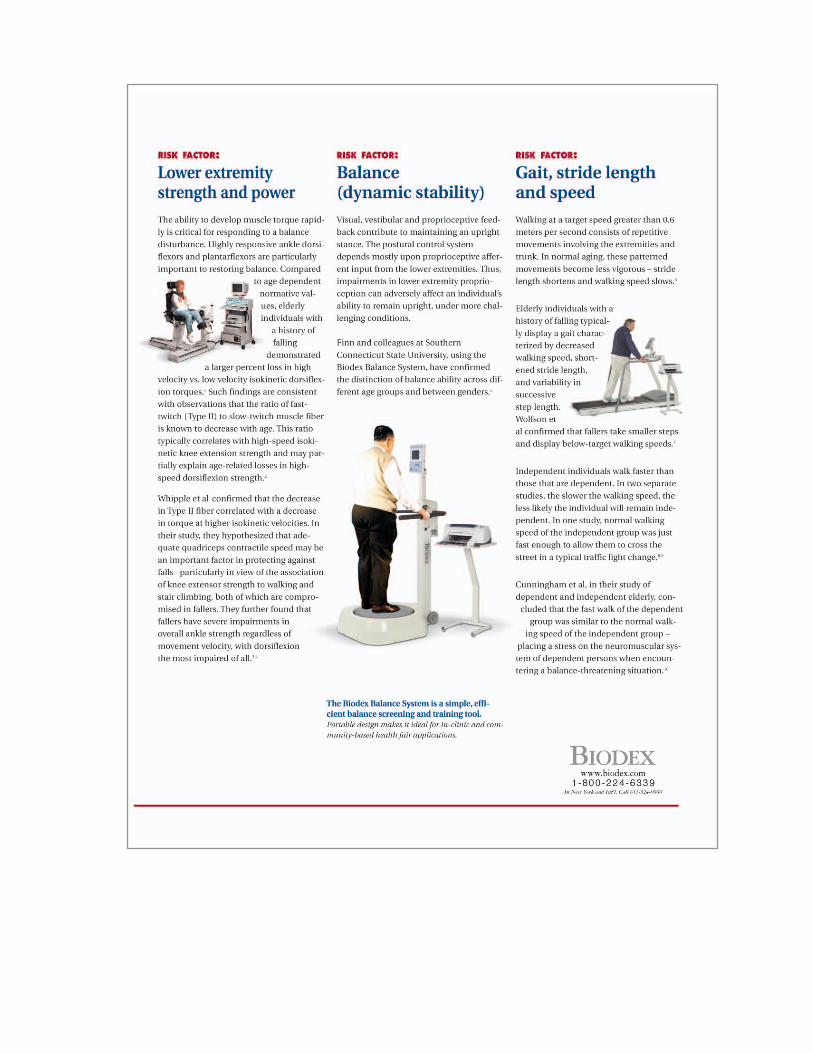

VIII PHASE I
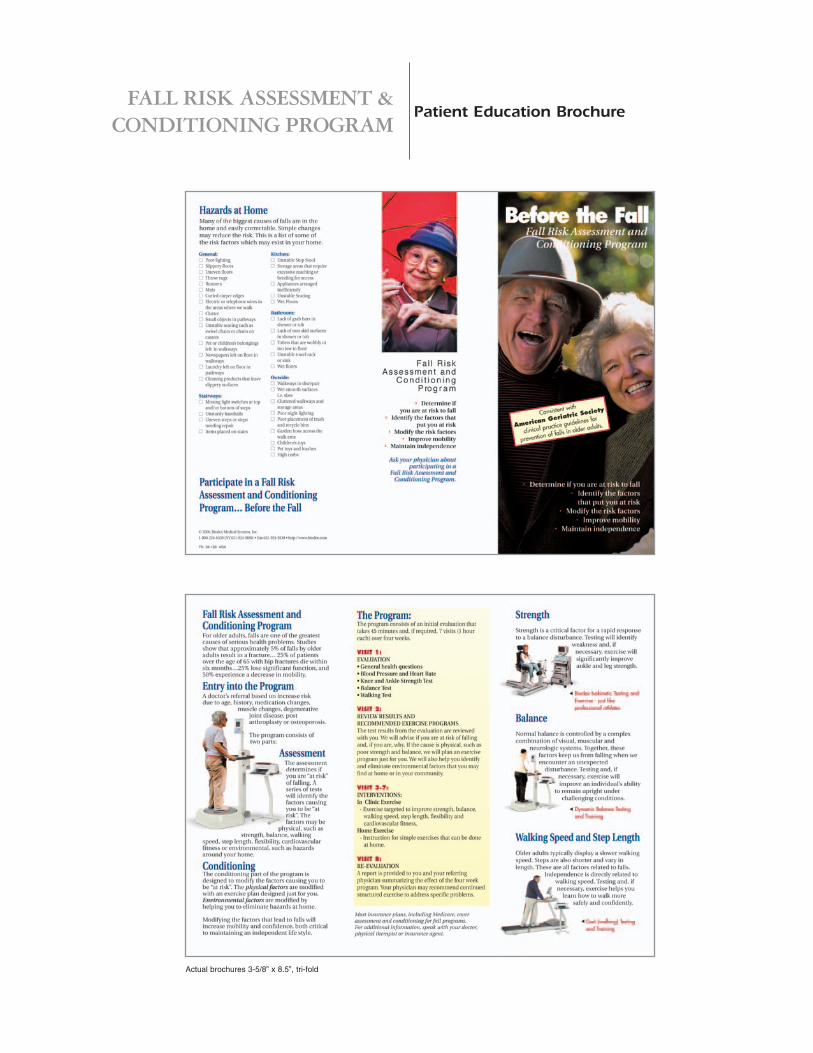
FALL RISK ASSESSMENT &CONDITIONING PROGRAM
© BIODEX MEDICAL SYSTEMS, INC. IX
Patient Education Brochure
Actual brochures 3-5/8” x 8.5”, tri-fold
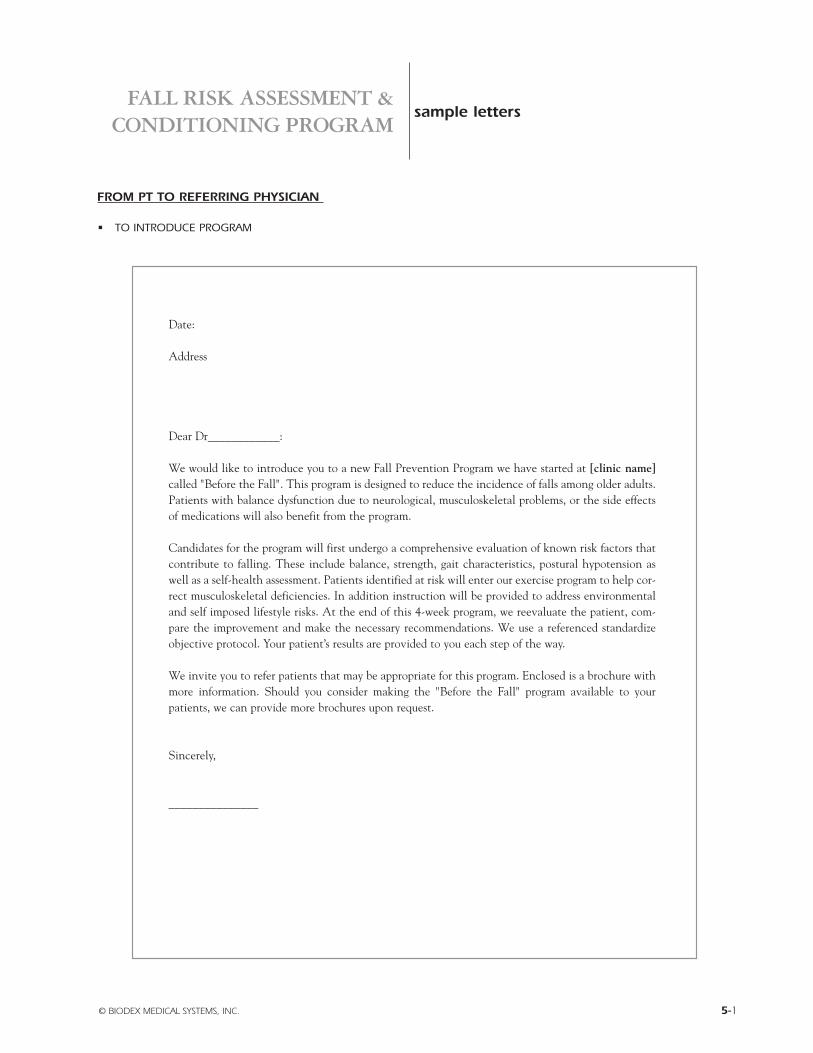
FROM PT TO REFERRING PHYSICIAN
• TO INTRODUCE PROGRAM
FALL RISK ASSESSMENT &CONDITIONING PROGRAM
© BIODEX MEDICAL SYSTEMS, INC. 5-1
sample letters
Date:
Address
Dear Dr____________:
We would like to introduce you to a new Fall Prevention Program we have started at [clinic name]called "Before the Fall". This program is designed to reduce the incidence of falls among older adults.Patients with balance dysfunction due to neurological, musculoskeletal problems, or the side effectsof medications will also benefit from the program.
Candidates for the program will first undergo a comprehensive evaluation of known risk factors thatcontribute to falling. These include balance, strength, gait characteristics, postural hypotension aswell as a self-health assessment. Patients identified at risk will enter our exercise program to help cor-rect musculoskeletal deficiencies. In addition instruction will be provided to address environmentaland self imposed lifestyle risks. At the end of this 4-week program, we reevaluate the patient, com-pare the improvement and make the necessary recommendations. We use a referenced standardizeobjective protocol. Your patient’s results are provided to you each step of the way.
We invite you to refer patients that may be appropriate for this program. Enclosed is a brochure withmore information. Should you consider making the "Before the Fall" program available to yourpatients, we can provide more brochures upon request.
Sincerely,
_______________

FROM PT TO REFERRING PHYSICIAN
• FOLLOWING INITIAL EVALUATION
5-2 SAMPLE LETTERS
Date:
Address
Re: Patient Name, Age ______, FALL RISK ASSESSMENT
Dear Dr____________:
Thank you for referring ________________ for a fall risk assessment. The attached report indicates theresults of the assessment.
Self-Assessment: ____________considers (himself, herself) to be (independent, in need of assistance, dependent). (He,she) also considers (himself, herself) to be (active, somewhat active, inactive). ____________’s self-assessment of general health was consistent with someone who is (long term dependent, communitydweller). Mental heath was consistent with that of someone who is (long term dependent, communitydweller). Physical function was consistent with that of someone who is (long term dependent, communitydweller).
____________ indicated (a, no) history of falling as (he, she) (has, has not) fallen (___ times) this past year.
Attention (should, need not be) directed to ___________’s medications and (should, need not) be notedfor the presence of postural hypotension.
Physical assessments noted the following.
Lower Extremity: • Index of ankle to knee strength was consistent with (fallers, non fallers)• Index of ankle to knee power was consistent with (fallers, non fallers)
____________’s Balance score was (within, outside) normal limits
Gait results indicate _____________ (was, was not) able to complete the 6 minute walk test.• The distance covered (was, was not) sufficient for independence.• Velocity was consistent with that of (fallers, non fallers)• Stride length was consistent with that of (fallers, non fallers)• Step length variability was (within, outside) normal limits.
Based on the above evaluation, ________________ (has, does not have) specific functional deficits thatincrease the risk of a fall.
Sincerely,
__________________

FROM PT TO REFERRING PHYSICIAN
• FOLLOWING COMPLETION OF 4 WEEK PROGRAM
© BIODEX MEDICAL SYSTEMS, INC. 5-3
Date:
Address
Re: Patient name, Age ______, fall risk assessment
Dear Dr____________:
_______________ has completed four weeks of rehabilitation to address identified functional deficits andto receive cognitive training as part of a fall prevention program. The attached report indicates theresults of the re-evaluation.
Self-Assessment: _____________ indicates (improvement) in (general health, mental health and physical function) and (noimprovement) in (general health, mental health and physical function). ____________’s self-assessmentscore for general health was consistent with someone who is (long term dependent, community dweller).Mental health was consistent with that of someone who is (long term dependent, community dweller).Physical function was consistent with that of someone who is (long term dependent, community dweller).
Attention (should, need not be) directed to ______________’s medications and (should, need not be)noted for the presence of postural hypotension.
Physical assessments noted the following changes.
Lower extremity strength and power: • Index of ankle to knee strength (improved, did not improve). It was consistent with (fallers, non fallers)• Index of ankle to knee power (improved, did not improve). It was consistent with (fallers, non fallers)
_____________’s Balance score (improved, did not improve) It was (within, outside) normal limits.
Gait results indicate ______________ (was, was not) able to complete the 6 minute walk test.• The distance covered (improved, did not improve). It (was, was not) sufficient for independence.• Velocity (improved, did not improve). It was consistent with that of (fallers, non fallers).• Stride length (improved, did not improve) It was consistent with that of (fallers, non fallers)• Step length variability (improved, did not improve) It was (within, outside) normal limits.
Based on the above re-evaluation, ________________ (has, has not) corrected specific functional deficitsthat increase the risk of a fall. It is recommended that ___________ (continue a rehabilitation programto further reduce specific functional deficits, follow the recommended home exercise program and be re-evaluated in one year or following any changes to his or her health).
Sincerely,
__________________

FROM PT TO REFERRING PHYSICIAN
• SUGGESTING ADDITIONAL TESTING
5-4 SAMPLE LETTERS
Date:
Address
Re: Patient name, Age ______, fall risk assessment
Dear Dr____________:
_______________ is currently receiving therapy to address identified functional deficits as well as cognitivetraining as part of a fall prevention program. The attached report indicates the results of the re-evaluation.
_____________ has made progress in addressing the previously identified functional deficits. However,______________ continues to experience (a lack of confidence, difficulty with activities of daily living,and poor balance). This can be noted in (his her) self-assessment and balance score.
Self-Assessment: _____________ indicates (improvement) in (general health, mental health and physical function) and (noimprovement) in (general health, mental health and physical function). ____________’s self-assessmentscore for general health was consistent with someone who is (long term dependent, community dweller).Mental health was consistent with that of someone who is (long term dependent, community dweller).Physical function was consistent with that of someone who is (long term dependent, community dweller).
Physical assessments noted the following.
Lower extremity strength and power: • Index of ankle to knee strength was consistent with (fallers, non fallers)• Index of ankle to knee power was consistent with (fallers, non fallers)
_____________’s Balance score remained outside normal limits.
Gait results indicate ______________ (was, was not) able to complete the 6 minute walk test.• The distance covered (was, was not) sufficient for independence.• Velocity was consistent with that of (fallers, non fallers).• Stride length was consistent with that of (fallers, non fallers)• Step length variability was (within, outside) normal limits.
Based on these findings in which specific functional deficits have been addressed, a history of falling, andthe ongoing problems, It is recommended that ___________ be referred for more specific testing consis-tent with sensory motor problems, (i.e., Neurocom Equitest)
Sincerely,
__________________
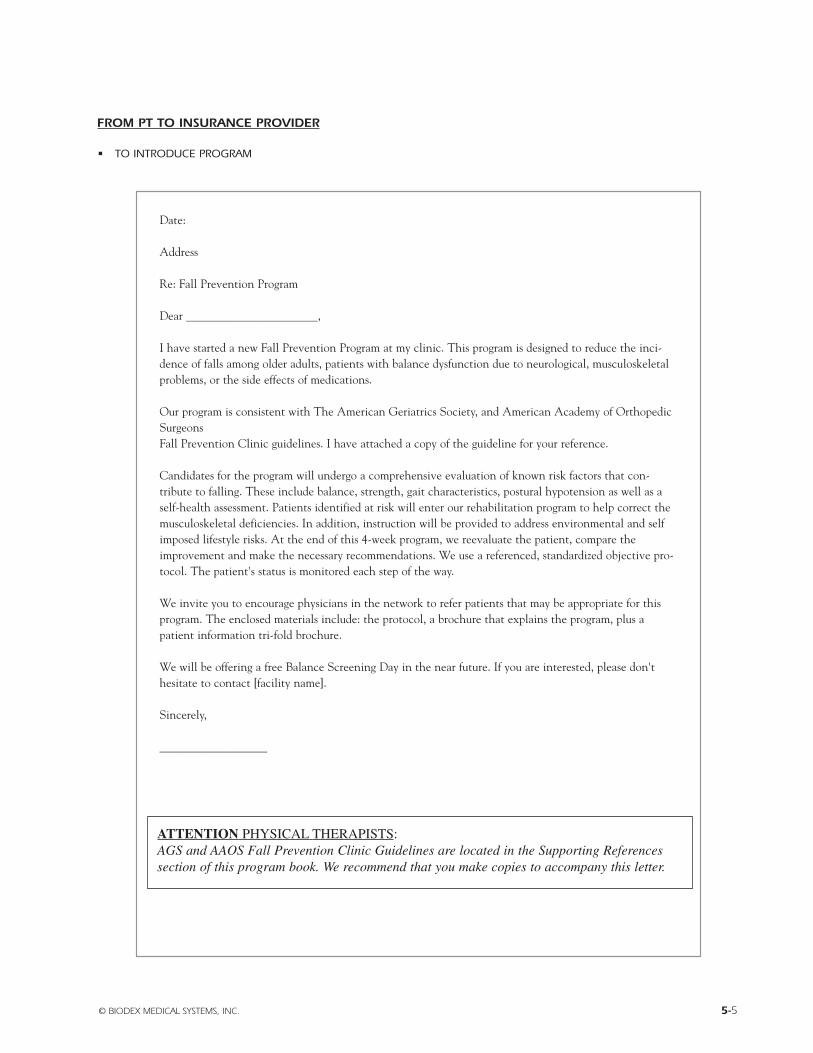
FROM PT TO INSURANCE PROVIDER
• TO INTRODUCE PROGRAM
© BIODEX MEDICAL SYSTEMS, INC. 5-5
Date:
Address
Re: Fall Prevention Program
Dear ______________________,
I have started a new Fall Prevention Program at my clinic. This program is designed to reduce the inci-dence of falls among older adults, patients with balance dysfunction due to neurological, musculoskeletalproblems, or the side effects of medications.
Our program is consistent with The American Geriatrics Society, and American Academy of OrthopedicSurgeons Fall Prevention Clinic guidelines. I have attached a copy of the guideline for your reference.
Candidates for the program will undergo a comprehensive evaluation of known risk factors that con-tribute to falling. These include balance, strength, gait characteristics, postural hypotension as well as aself-health assessment. Patients identified at risk will enter our rehabilitation program to help correct themusculoskeletal deficiencies. In addition, instruction will be provided to address environmental and selfimposed lifestyle risks. At the end of this 4-week program, we reevaluate the patient, compare theimprovement and make the necessary recommendations. We use a referenced, standardized objective pro-tocol. The patient's status is monitored each step of the way.
We invite you to encourage physicians in the network to refer patients that may be appropriate for thisprogram. The enclosed materials include: the protocol, a brochure that explains the program, plus apatient information tri-fold brochure.
We will be offering a free Balance Screening Day in the near future. If you are interested, please don'thesitate to contact [facility name].
Sincerely,
__________________
ATTENTION PHYSICAL THERAPISTS:AGS and AAOS Fall Prevention Clinic Guidelines are located in the Supporting References section of this program book. We recommend that you make copies to accompany this letter.

5-6
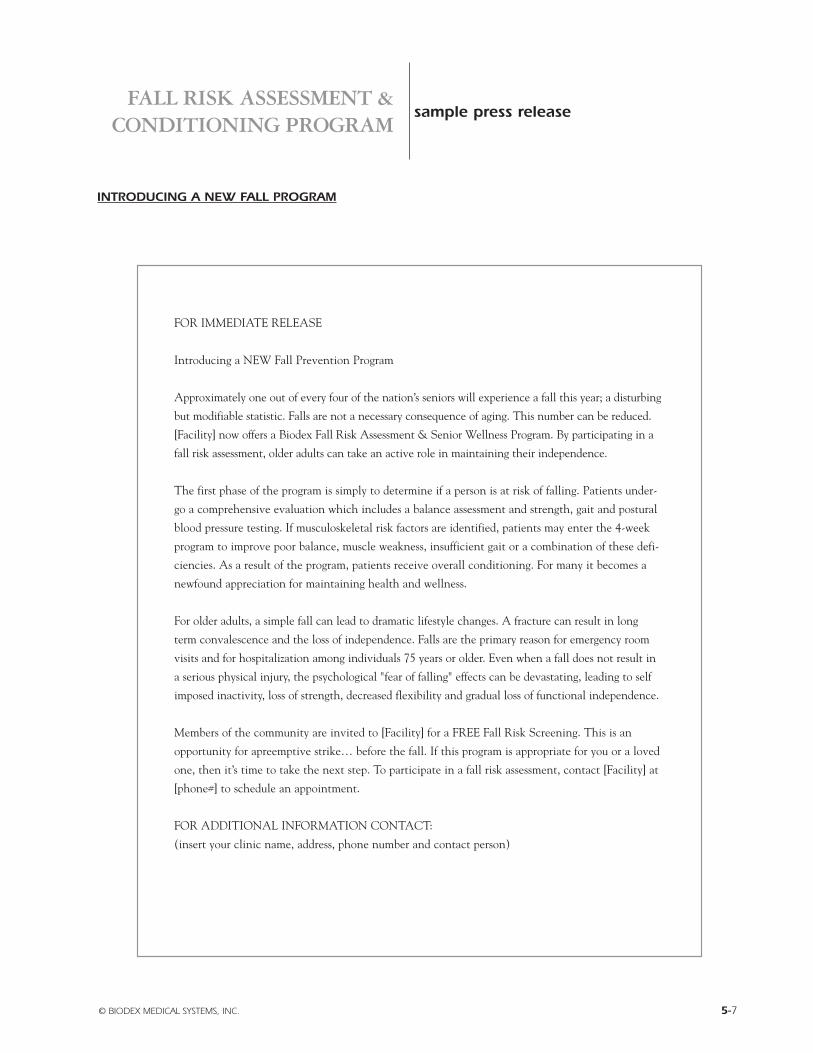
FALL RISK ASSESSMENT &CONDITIONING PROGRAM
INTRODUCING A NEW FALL PROGRAM
© BIODEX MEDICAL SYSTEMS, INC. 5-7
sample press release
FOR IMMEDIATE RELEASE
Introducing a NEW Fall Prevention Program
Approximately one out of every four of the nation’s seniors will experience a fall this year; a disturbing
but modifiable statistic. Falls are not a necessary consequence of aging. This number can be reduced.
[Facility] now offers a Biodex Fall Risk Assessment & Senior Wellness Program. By participating in a
fall risk assessment, older adults can take an active role in maintaining their independence.
The first phase of the program is simply to determine if a person is at risk of falling. Patients under-
go a comprehensive evaluation which includes a balance assessment and strength, gait and postural
blood pressure testing. If musculoskeletal risk factors are identified, patients may enter the 4-week
program to improve poor balance, muscle weakness, insufficient gait or a combination of these defi-
ciencies. As a result of the program, patients receive overall conditioning. For many it becomes a
newfound appreciation for maintaining health and wellness.
For older adults, a simple fall can lead to dramatic lifestyle changes. A fracture can result in long
term convalescence and the loss of independence. Falls are the primary reason for emergency room
visits and for hospitalization among individuals 75 years or older. Even when a fall does not result in
a serious physical injury, the psychological "fear of falling" effects can be devastating, leading to self
imposed inactivity, loss of strength, decreased flexibility and gradual loss of functional independence.
Members of the community are invited to [Facility] for a FREE Fall Risk Screening. This is an
opportunity for apreemptive strike… before the fall. If this program is appropriate for you or a loved
one, then it’s time to take the next step. To participate in a fall risk assessment, contact [Facility] at
[phone#] to schedule an appointment.
FOR ADDITIONAL INFORMATION CONTACT:
(insert your clinic name, address, phone number and contact person)

5-8
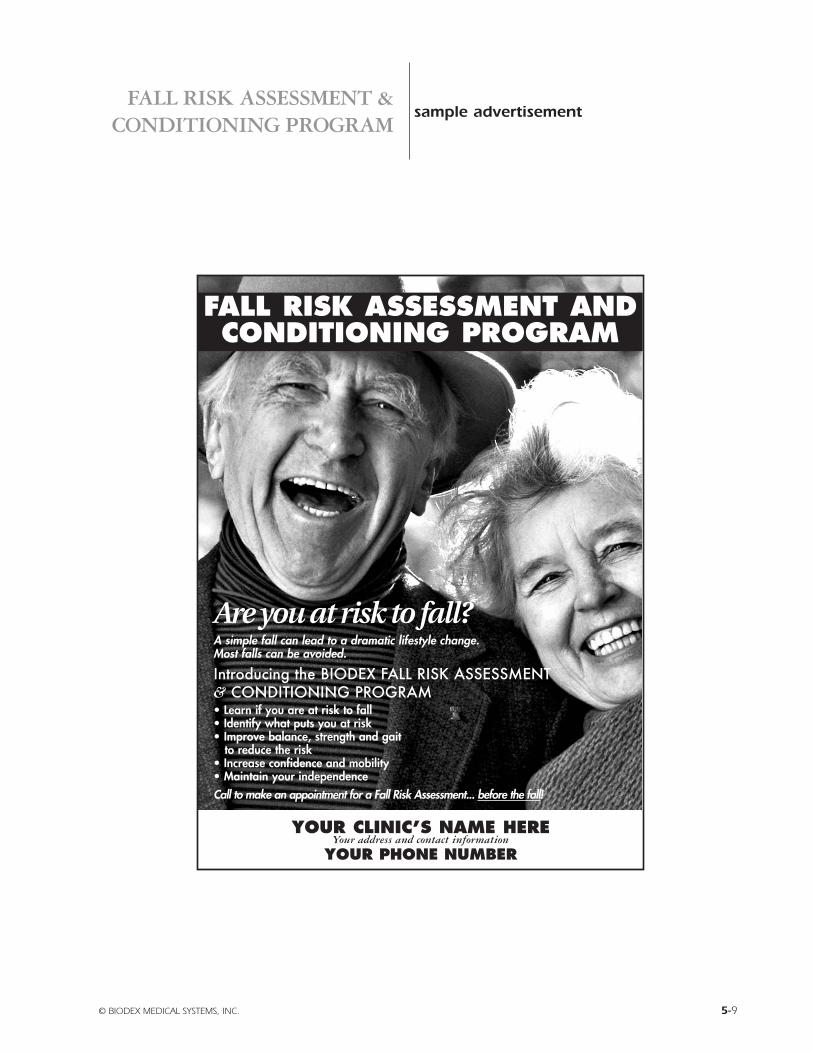
FALL RISK ASSESSMENT &CONDITIONING PROGRAM
© BIODEX MEDICAL SYSTEMS, INC. 5-9
sample advertisement
YOUR CLINIC’S NAME HEREYour address and contact information
YOUR PHONE NUMBER
Are you at risk to fall?A simple fall can lead to a dramatic lifestyle change. Most falls can be avoided.
Introducing the BIODEX FALL RISK ASSESSMENT & CONDITIONING PROGRAM• Learn if you are at risk to fall • Identify what puts you at risk • Improve balance, strength and gait
to reduce the risk• Increase confidence and mobility• Maintain your independenceCall to make an appointment for a Fall Risk Assessment... before the fall!
FALL RISK ASSESSMENT ANDCONDITIONING PROGRAM

5-10
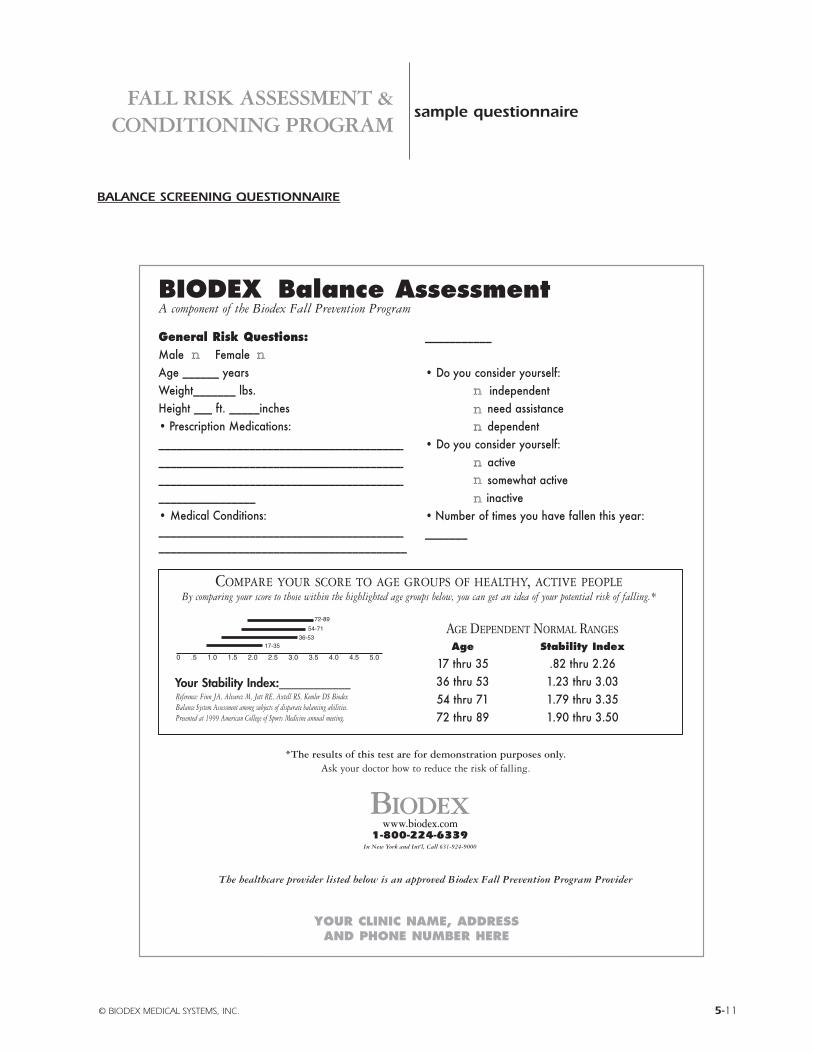
FALL RISK ASSESSMENT &CONDITIONING PROGRAM
BALANCE SCREENING QUESTIONNAIRE
© BIODEX MEDICAL SYSTEMS, INC. 5-11
sample questionnaire
BIODEX Balance AssessmentA component of the Biodex Fall Prevention Program
General Risk Questions:Male nn Female nnAge ______ yearsWeight_______ lbs.Height ___ ft. _____inches• Prescription Medications:___________________________________________________________________________________________________________________________________________• Medical Conditions: __________________________________________________________________________________
___________
• Do you consider yourself: nn independentnn need assistancenn dependent
• Do you consider yourself: nn activenn somewhat activenn inactive
• Number of times you have fallen this year:_______
Your Stability Index:____________
*The results of this test are for demonstration purposes only. Ask your doctor how to reduce the risk of falling.
The healthcare provider listed below is an approved Biodex Fall Prevention Program Provider
COMPARE YOUR SCORE TO AGE GROUPS OF HEALTHY, ACTIVE PEOPLEBy comparing your score to those within the highlighted age groups below, you can get an idea of your potential risk of falling.*
Reference: Finn JA, Alvarez M, Jett RE, Axtell RS, Kemler DS BiodexBalance System Assessment among subjects of disparate balancing abilities.Presented at 1999 American College of Sports Medicine annual meeting.
AGE DEPENDENT NORMAL RANGES
Age Stability Index
17 thru 35 .82 thru 2.2636 thru 53 1.23 thru 3.0354 thru 71 1.79 thru 3.3572 thru 89 1.90 thru 3.50
0 .5 1.0 1.5 2.0 2.5 3.0 3.5 4.0 4.5 5.0
72-89
54-71
36-5317-35
YOUR CLINIC NAME, ADDRESS AND PHONE NUMBER HERE
1-800-224-6339In New York and Int’l, Call 631-924-9000
www.biodex.comBIODEX

5-12

FALL RISK ASSESSMENT &CONDITIONING PROGRAM
© BIODEX MEDICAL SYSTEMS, INC. 5-13
marketing support materials
1-800-224-6339In New York and Int’l, Call 631-924-9000
www.biodex.comBIODEX
Fall Risk Assessment & Conditioning Protocol One protocol manual is included with theClinical/Marketing Support Book. Additionalcopies are available separately.
• Photocopy and complete the forms includ-ed
in the protocol
945-341 Protocol, Fall Risk Assessment and Conditioning .......$15.00
Program ManualIncludes:• Fall Risk Assessment & ConditioningProtocol • PowerPoint Clinical Presentation on CD• Sample Reports• Sample Balance Screening Questionnaire• Clinical References• Sample letter to referring physicians• Sample letter for third party reimburse-ment• Sample press release
• Sample advertisement
945-340............Program Manual, Fall Risk Assessement &Conditioning ......................................................$70.00
Patient Education Brochure - 4 colorThis brochure is designed to educate older persons andfamily members on the factors that put them at risk to falland details the steps of the Biodex Fall Risk Assessment &Conditioning Program. ...Space is provided for a stamp orsticker of clinic address and phone number. This tri-foldbrochure is used to fill the Referring Physician DisplayStand and is an excellent
handout for community programs.
945-348 ............Brochure, Patient Education,100/pkg..........................................$75.00
Referring Physician Brochure -4 colorTo enlist local referring physicians, this brochuredetails the Fall Risk Assessment & ConditioningProgram. Distribute as a handout when making the PowerPoint presentation or use for directmail to local referring physicians. A sample
cover letter is included in the Clinical/Marketing Support Book.
945-344.........Brochure, ReferringPhysician, 50/pkg ............$75.00
Fall Risk Assessment & Conditioning Program Starter Kit• 2 Customized Referring Physician Display Stands w/100 brochures• 1 Customized Fall Prevention Awareness Poster • 1 Clinical/Marketing Support Book• 1 Balance Assessment Index Poster945-351 Fall Risk Assessment & Conditioning Program Starter Kit