fairness, efficiency and flexibility in organ allocation for...
TRANSCRIPT
Fairness, E!ciency and Flexibility in Organ Allocation for
Kidney Transplantation
Dimitris Bertsimas Vivek F. Farias Nikolaos Trichakis
July 12, 2012
Abstract
We propose a scalable, data-driven method for designing national policies for the allocationof deceased donor kidneys to patients on a waiting list, in a fair and e!cient way. We focuson policies that have the same form as the one currently used in the U.S. In particular, weconsider policies that are based on a point system, which ranks patients according to somepriority criteria, e.g., waiting time, medical urgency, etc., or a combination thereof. Ratherthan making specific assumptions about fairness principles or priority criteria, our method o"ersthe designer the flexibility to select his desired criteria and fairness constraints from a broadclass of allowable constraints. The method then designs a point system that is based on theselected priority criteria, and approximately maximizes medical e!ciency, i.e., life year gainsfrom transplant, while simultaneously enforcing selected fairness constraints.
Among the several case studies we present employing our method, one case study designsa point system that has the same form, uses the same criteria and satisfies the same fairnessconstraints as the point system that was recently proposed by U.S. policymakers. In addition,the point system we design delivers an 8% increase in extra life year gains. We evaluate theperformance of all policies under consideration using the same statistical and simulation toolsand data as the U.S. policymakers use. Other case studies perform a sensitivity analysis (forinstance, demonstrating that the increase in extra life year gains by relaxing certain fairnessconstraints can be as high as 30%), and also pursue the design of policies targeted specificallyat remedying criticisms leveled at the recent point system proposed by U.S. policymakers.
We emphasize that our methodology is not a mechanistic replacement for professional medicalor ethical judgment but rather serves as a tool to circumvent exhaustive experimentation withpoint systems given such input.
1. Introduction
Renal or kidney transplantation and maintenance dialysis are the only treatments for end-stage re-
nal disease (ESRD), a terminal disease a"ecting over 500, 000 people currently in the United States,
see USRDS (2009). Despite being a major surgical procedure, transplantation is the treatment of
choice for ESRD patients, as a successful transplantation improves their quality of life. In particular,
dialysis treatment requires that the patient visits a dialysis center for at least 12 hours each week,
1

whereas transplantation typically allows the patient to resume regular life activities. Furthermore,
a multitude of research and clinical studies have statistically demonstrated that transplantation
also reduces the mortality risk for patients, see Suthanthiran and Strom (1994), Schnuelle et al.
(1998), Port et al. (1993), Ojo et al. (1994). Thus, a kidney transplant is considered by many as a
potentially life-saving gift.
The two sources of kidneys for transplantation are living donors (e.g., family members or friends
of the patient) and deceased or cadaveric donors. The majority of patients are unsuccessful in finding
living donors, and thus join a pool of patients waiting for a deceased donor organ. Of course, while
in the living donor case the donation is typically made to a specific patient, in the deceased donor
case an important allocation problem arises. In particular, once an organ is procured from a
deceased donor, there can be thousands of medically compatible and available recipients the organ
can be allocated to. The problem becomes even more significant, if one accounts for the organ
shortage and the size of the pool of waiting patients in the United States: On October 20th 2010,
86, 391 patients were waiting for a kidney transplant. In 2009, there were 33, 671 new additions, but
only 16, 829 transplantations were performed, from which 10, 442 transplants were from deceased
donors. For more information and statistical details we refer the reader to UNOS (2010).
In recognition of the aforementioned allocation problem and the growing di!culty of matching
supply and demand, the U.S. Congress passed the National Organ Transplant Act (NOTA) in 1984.
According to this legislation, deceased donor organs are viewed as national resources in the U.S.,
and as such, their allocation has to be based on fair and equitable policies. Moreover, the sale of
organs as well as money transfers of any nature in the acquisition of organs are strictly prohibited.
Instead, the policy for allocating the organs should utilize waiting lists and have the form of a
priority method. That means that patients in need of a transplant register on waiting lists. Then,
once an organ is procured, all medically compatible patients are ranked according to some priority
rules and the organ is successively o"ered to them according to their ranking, until it is accepted by
a patient. Subsequent to the NOTA, the U.S. Congress established in 1984 the Organ Procurement
and Transplantation Network (OPTN) in order for it to maintain a national registry for organ
matching and develop allocation policies
Naturally, the aforementioned allocation policies are of central importance and have to accom-
plish major objectives in alleviating human su"ering, prolonging life and providing nondiscrimina-
2

tory, fair and equal access to organs for all patients, independent of their race, age, blood group
or other peculiar physiological characteristics. Some of the main challenges in designing a kidney
allocation policy are the following:
• Fairness constraints: What does fair and equal access to organs mean? Due to the subjective
nature of fairness, there is no single fairness criterion that is universally accepted by policy-
makers and academics alike. As such, a great challenge lies in identifying the appropriate
fairness constraints that the allocation outcomes of a policy should ideally satisfy. An exam-
ple of such a constraint could be a lower bound on the percentage of organs allocated to a
particular group of patients – say, requiring that at least 47% of all transplants are received by
recipients of blood type O. In the absence of such a constraint these groups would otherwise
be handicapped and not have access to organs because of their physiological characteristics.
A number of such criteria have been studied by OPTN policymakers, see RFI (2008).
• E!ciency: As a successful transplantation typically prolongs the life of a patient, while also
improving his quality of life, the policy needs to ensure that the number of quality adjusted
life year gains garnered by transplantation activities is as high as possible. This is also in
line with the view of organs as national resources. Again, this objective is of paramount
importance to the current policy design, see OPTNKTC (2008).
• Prioritization criteria: The policy needs to be based on medically justified criteria and phys-
iological characteristics of patients and organs. However, ethical rules disallow the use of
criteria that can be deemed as discriminatory (e.g., race, gender, etc.).
• Simplicity: Patients need to make important decisions about their treatment options, together
with their physicians. To this end, they need to be able to estimate the probability of receiving
an organ, or at least understand the allocation mechanism. For that reason, the priority
method that is used needs to be simple and easy to communicate.
• Implementation: Suppose that one has selected the desired fairness constraints, prioritization
criteria and a simple priority method. How does he then balance the emphasis put on the
di"erent prioritization criteria, so as to design a policy whose allocation outcomes would
maximize e!ciency, while satisfying the fairness constraints?
3

All the above challenges were faced by the OPTN policymakers in 2004, when they initiated
the development of a new national allocation policy that will eventually replace the current one. In
2008, the OPTN released a concrete proposal in a Request for Information publication (RFI (2008))
that is currently under consideration by the U.S. Department of Health and Human Services.
In this work, we deal with the implementation challenge in designing a national allocation
policy, while accounting for all the other challenges above. In particular, we focus on perhaps the
simplest, most common and currently in use priority method, namely a point system. We make
the following contributions:
1. We present a novel method for designing allocation policies based on point systems in a
systematic, data-driven way. Our method o"ers the flexibility to the policymaker to select
the fairness constraints he desires, as well as the prioritization criteria on which the point
system will be based on. The method then outputs a conforming point system policy that
approximately maximizes medical e!ciency, while satisfying the fairness constraints.
2. To validate our method, we use it to design policies under di"erent scenarios of interest to
policymakers. Under a particular scenario, we design a policy that (a) matches the fairness
constraints of the recently proposed policy by U.S. policymakers, and (b) is based on the
same criteria and simple scoring rule format. Critically though, it achieves an 8% increase in
anticipated extra life year gains, as demonstrated by numerical simulations, which are based
on the statistical and simulation tools currently in use by U.S. policymakers (see below).
3. We use our method to perform a sensitivity analysis that explores the consequences from
relaxing or introducing fairness constraints – for instance, what is the impact of reducing the
percentage of transplants to patients on dialysis for greater than 15 years by 1%? In the
case of some constraints, relaxations of fairness constraints can result in life year gains on the
order of 30%. As such, we believe this is a valuable tool in the policy design process.
4. We develop a means of designing approximately optimal policies in problems of dynamic
allocation that are massively high dimensional. In particular, these are allocation problems
where the number of “classes” of objects being allocated, and the number of “bins” these
objects may be allocated to are themselves intractably large. To the best of our knowledge,
this approach is novel.
4

Performance in all our numerical studies is evaluated using the same statistical and simulation tools,
as well as data, as the U.S. policymakers use. Those tools and datasets were obtained directly from
their developers, namely the United Network for Organ Sharing (UNOS), which is the non-profit
organization that operates the OPTN, and the Scientific Registry of Transplant Recipients (SRTR).
1.1. Literature Review
The model-based analysis of the organ allocation process has attracted significant interest in the
academic literature. One of the first papers in this vein is by Ruth et al. (1985), in which the
authors develop a simulation model to study the problem. Shechter et al. (2005) also introduce
a discrete event simulation model for the evaluation of potential changes to the liver allocation
process. In this work, we utilize the simulation model developed by the SRTR, see KPSAM (2008).
The organ allocation process was also analyzed by Righter (1989) and David and Yechiali (1995)
via a stochastic assignment problem formulation. In their work, they analyze stylized models that
fit into that framework. In this work, we also utilize an assignment problem formulation, but only
for the training phase of our methodology: the output allocation policies of our framework are
rather simple, based on scoring rules and in full compliance with policies that U.S. policymakers
consider, unlike the above referenced work. In a similar vein, Zenios et al. (2000) introduce a fluid
model approximation of the organ allocation process that allows them to explicitly account for
fairness and medical e!ciency in the allocation. Our framework accounts for fairness in accordance
with the considerations of policymakers. Zenios (2002), Roth et al. (2004), Segev et al. (2005) and
Ashlagi et al. (2011) study the problem of living donation and the allocation of kidneys. Kong et al.
(2010), Sandikci et al. (2008) and Akan et al. (2011) also tackle the problem of liver allocation.
Another stream of research focuses on the decision-making behavior of patients, by dealing with
organ acceptance policies. David and Yechiali (1985) model the candidate’s problem as an opti-
mal stopping problem. Similar acceptance policies are developed by Ahn and Hornberger (1996),
Howard (2002), Alagoz (2004) and Alagoz et al. (2007). The present paper will test policies on a
simulator developed by SRTR for OPTN; this simulator assumes a specific, exogenous acceptance
model for patients built from historical data. While the acceptance model ignores endogeneity, it
allows us to simulate outcomes in precisely the manner policy makers currently do.
Recent work by Su and Zenios (2005, 2004) attempts to combine the above streams of research
5

by explicitly accounting for the acceptance behavior of patients in the development of an allocation
policy. In a similar vein, Su and Zenios (2006) propose an allocation mechanism that elicits the
utilities of the patients. For more details, we refer the reader to the review by Zenios (2005).
In all the above referenced work dealing with organ allocation policies, the authors design
general near optimal dynamic policies. These papers take the important perspective of designing
a fundamentally new allocation system from the ground up. In our work, we restrict our attention
to policies that comply with the precise constraints imposed by current practice. That is, we focus
our attention on policies based on simple point systems of the precise format as the ones currently
in use and proposed by U.S. policymakers. Moreover, instead of designing a particular policy, we
develop a framework that admits various fairness constraints and prioritization criteria. In other
words, we design a mechanism that can fit directly in the current decision-making process of the
U.S. policymakers.
2. Distribution and Allocation Policies
In this section, we briefly review the distribution process and the operation of the UNOS/OPTN
as coordinators and developers of national policies for the allocation of deceased donor kidneys to
patients. We then discuss the requirements such policies need to meet, and focus on policies that
are based on point systems or scoring rules. Finally, we review the current policy in use in the U.S.
(which itself is based on a scoring rule), as well as updates on the development of a new scoring
rule based national policy.
In the U.S., the non-profit Organ Procurement Organizations (OPOs) are directly responsible
for evaluating, procuring and allocating donated organs within their respective designated service
area. Once consent is obtained and an organ is procured by an OPO, the OPTN computerized
national registry automatically generates a list of patients, who are medically compatible with the
procured organ. Medical compatibility of patients is determined by their physiological character-
istics and those of the procured organ (e.g., accounting for ABO incompatibility,1 weight and size,
unacceptable antigens, etc.). Subsequently, the priority method used by the OPO determines the
order in which the organ will be o"ered to patients. Once a kidney is procured, it can be typically
1ABO incompatibility is a reaction of the immune system that occurs if two di!erent and not compatible bloodtypes are mixed together, see http://www.nlm.nih.gov/medlineplus/ency/article/001306.htm.
6
preserved for up to 36-48 hours, after which the organ can no longer be used for transplantation.
For that reason, priority is given to local patients, although there are rules that determine when
priority should be given to non local patients. After an o"er is being made to a patient, he has
to decide with his surgeon whether to accept it or not within a limited amount of time. In case
of rejection, the organ is o"ered to the next patient according to the specified order and so on. In
case no patient accepts the organ within 36-48 hours, the organ is discarded.
In addition to using the OPTN national registry, the activities of the OPOs, and their allocation
policies in particular, are coordinated and regulated by the OPTN. That is, the OPTN provides
general guidelines and lays out a national allocation policy that is suggested to all OPOs. The
allocation policy of every OPO then needs to be consistent with the national policy, although
minor alterations are possible subject to approval by the OPTN.
2.1. National Allocation Policies
National policies for the allocation of the deceased donor kidneys are developed by the OPTN
Kidney Transplantation Committee (KTC), and are approved by the U.S. Department of Health &
Human Services. Policies need to account for numerous legal, economic, institutional, ethical, and
other societal factors; the requirements for an allocation policy are included in the OPTN Final
Rule (DHHS (2000)). Below we summarize the most important guidelines that policies have to
conform to as per the OPTN Final Rule. In particular, the allocation
(a) shall seek to achieve the best use of donated organs, and avoid organ wastage;
(b) shall set priority rankings based on sound medical judgment;
(c) shall balance medical e!ciency (extra life years) and equity (waiting time), without discrim-
inating patients based on their race, age and blood type;
(d) shall be reviewed periodically and revised as appropriate.
Additionally, the priority method in place needs to be simple and easy to communicate, as
discussed in the Introduction. As such, the ranking of patients is typically achieved by means of a
point system or scoring rule: all national allocation policies that have been used in practice have
been based on scoring rules. We formally define next the notion of a scoring rule based policy and
then discuss the current national policy and suggested revisions.
7

Point system or Scoring rule based policies. Under a policy based on a scoring rule, patients
are ranked according to a calculated score, commonly referred to in this context as the Kidney
Allocation Score (KAS). Specifically, a scoring rule consists of score components and scalar constant
score weights. A score component can be any function of the characteristics of a patient and/or an
organ. Then, once an organ is procured and needs to be allocated, one calculates the individual
score components for each patient and the particular procured organ. The KAS for each patient
is evaluated as the weighted sum of his score components (using the score weights). To introduce
some notation, given a patient p and an organ o, we denote the jth score component with fj,(p,o),
and the jth score weight with wj . The KAS of patient p for receiving organ o, KAS(p, o), is then
calculated as
KAS(p, o) =!
j
wjfj,(p,o).
For instance, examples of score components can be the number of years the patient has been
registered on the waiting list for, the life expectancy of the patient in case he remained on dialysis,
or the life expectancy in case he received the procured organ, etc.
One can think of a scoring rule based policy as a priority method that awards points to patients
based on di"erent criteria (the score components); patients are also potentially awarded di"erent
amounts of points per criterion, based on the score weights. The ranking is then achieved based
on the number of points collected by each patient. The current policy in use and the one recently
proposed by U.S. policymakers are both examples of scoring rule based policies and are discussed
next.
Current allocation policy. The current policy has been in existence for more than 20 years.
It is based on a scoring rule that utilizes waiting time, a measure of the patient’s sensitization2
and tissue matching3 of the organ and the patient as score components. The rationale behind
this rule is as follows. Points are given for waiting time and sensitization in order to serve the
fairness objective of the allocation and to provide equal access to organs to all patients (note that
2Potential recipients are “sensitized” if their immune system makes antibodies against potential donors. Sensitiza-tion usually occurs as a consequence of pregnancy, blood transfusions, or previous transplantation. Highly sensitizedpatients are more likely to reject an organ transplant than are unsensitized patients. For more information, seehttp://www.ustransplant.org/
3When two people share the same human leukocyte antigens (abbreviated as HLA), they are said to be a“match”, that is, their tissues are immunologically compatible with each other. HLA are proteins that arelocated on the surface of the white blood cells and other tissues in the body. For more information, seehttp://www.stanford.edu/dept/HPS/transplant/html/hla.html
8

highly sensitized patients have reduced medical compatibility with donors). On the other hand,
since tissue matching is an indication for a successful transplantation, the points given to matched
patients serve the medical e!ciency objective of the allocation. For more details we refer the reader
to ODADK (2010).
Recent advances in medicine and changes in patients’ needs however, have rendered the current
policy inappropriate. More specifically, these changes have rendered the current policy inconsistent
with the OPTN Final Rule, see Norman (2009) and RFI (2008). For instance, the long waiting
times experienced by the patients, coupled with advances in medicine that have prolonged the
survivability of patients on dialysis, have resulted in the accumulation of points for waiting time
by the patients. This accumulation of points has then created an imbalance between the e!ciency
and fairness objectives of the allocation, see OPTNKTC (2007). In response to that, and in line
with the requirement of the OPTN Final Rule for periodic review of the policy, the KTC has been
reviewing the policy for the past few years and is currently in the process of developing a new
policy, see OPTNKTC (2007).
Development of a new policy. Since 2004, the KTC has considered more than 40 di"erent
scoring rules, which involve various score components, see OPTNKTC (2010). We first discuss
the criteria upon which the score components are based, and then discuss the components. For a
patient p and an organ o, the criteria are
1. Tissue matching or HLA matches, i.e., the number of HLA shared by patient p and organ o;
2. Age of patient p and/or donor of organ o, denoted by AGE(p) and AGE(o);
3. Wait time, which is equal to the number of years patient p has been registered at the waitlist;
4. Dialysis time, which is equal to the years patient p has spent on dialysis, denoted by DT(p);
5. Blood group of patient and/or donor;
6. Expected post transplant survival of patient p from receiving organ o;
7. Expected waitlist survival of patient;
8. Life years from transplant, denoted by LYFT(p, o), which is equal to the expected incremental
quality-adjusted life years gain of patient p from receiving organ o, compared to remaining
on dialysis (for a precise definition, we refer the reader to Wolfe et al. (2008));
9

9. Donor profile index, denoted by DPI(o), which is a number between 0 and 1, indicating the
quality of the donated organ (0 corresponds to an organ of highest quality);
10. Calculated panel reactive antibody, denoted by CPRA(p), which is a number between 0 and
100, measuring the sensitization of the patient (0 corresponds to the lowest level).
A typical scoring rule proposed by the KTC includes 3-5 score components that are functions of
(some of) the above criteria. In most cases, the components are either linear functions (e.g., points
are awarded per year on dialysis, or per life year from transplant, etc.), or nonlinear functions
of one or more criteria (e.g., for patient p and organ o, points are awarded according to (1 !
DPI(o)) " LYFT(p, o), or DPI(o) " DT(p), or |AGE(p) ! AGE(o)|, etc.), including stepwise or
indicator functions (e.g., points are awarded if patient p is highly sensitized, CPRA(p) # 80, or if
he is aged less than 18 or 35, AGE(p) $ 18 or 35, etc). For more details, we refer the reader to
OPTNKTC (2007), OPTNKTC (2008).
As mentioned above, the KTC considered more than 40 di"erent scoring rules, each of which
utilizes a subset of the score components above. Furthermore, based on simulation experiments,
the KTC evaluated the performance of the proposed scoring rules and identified weights that were
deemed appropriate (see OPTNKTC (2008)). The dominant proposal up to this point, published in
2008 in a Request For Information document (RFI (2008)), entails the following score components:
LYFT " (1 ! DPI), DT " DPI, DT and CPRA. The associated score weights are 0.8, 0.8, 0.2 and
0.04. That is, the Kidney Allocation Score under the dominant proposal is
KAS(p, o) = 0.8 LYFT(p, o) " (1 ! DPI(o))
+ 0.8 DT(p) " DPI(o)
+ 0.2 DT(p)
+ 0.04 CPRA(p).
The first two components are the life years from transplant and dialysis time, scaled by the donor
profile index. The scaling ensures that in case of a high quality organ (DPI close to 0), emphasis
is given on life years from transplant, whereas in case of a low quality organ (DPI close to 1),
emphasis is given on dialysis time. The last two components are the dialysis time and calculated
10

panel reactive antibody score of the patient. More information and motivating aspects can be found
within the Request For Information document (RFI (2008)). As an example, consider an organ o of
medium quality, with DPI(o) = 0.55. Then, patients are awarded 0.8 " (1 ! 0.55) = 0.36 points for
every quality adjusted incremental life year they would gain in expectation, 0.8 " 0.55 + 0.2 = 0.64
points for every year they have spent on dialysis, and 0.04 points for every point of their CPRA
score.
While medical expertise and the OPTN Final Rule can guide the identification of the score
components of clinical validity, the task of finding the right selection or subset of these components
and the appropriate weights is more involved, as the experimentation of the OPTN KTC with
more than 40 di"erent rules suggests. A natural question in response to the proposed scoring rule
is whether this is the best we can do. In particular, does there exist another scoring rule of the same
format, based on the criteria and score components considered by policymakers, that dominates
the proposed one, i.e., is equally or more fair and more e!cient? Admittedly, this is an involved
question to answer; to illustrate this, consider only changing the weights in the proposed scoring rule
above. The outcomes by such a change can perhaps be evaluated only via simulation; simulating
a single specific scoring rule takes hours. This severely curtails the e!cacy of a search for a policy
that while possessing the requisite fairness properties is also e!cient. Our proposed methodology
provides a valuable tool in this search and takes a step towards answering the questions posed
above.
3. Designing Allocation Policies
We propose a method for designing scoring rule based policies for the allocation of deceased donor
kidneys to patients. Specifically, we propose a data-driven method that computes in a systematic
way score weights associated to pre-specified score components, so that the resulting policy achieves
a near-optimal medical utility (measured by life years from transplant gains). In other words,
after one has decided upon the components he wishes to include in a scoring rule, our method
utilizes historical data to e!ciently compute associated weights, so as to maximize the e!ciency
of the policy. In addition, our method can also take as input fairness constraints on the allocation
outcomes; while we defer the precise definition of the class of admissible constraints for Section 3.1,
we note here that our method captures a multitude of important and commonly studied constraints
11

score weights
historical data
score components
fairness constraints
Figure 1: An illustration of the functionality of the proposed method.
of interest to policymakers. Then, the method computes the score weights, so that the resulting
policy is as e!cient as possible, and the fairness constraints are approximately satisfied.
Figure 1 illustrates the functionality of the proposed method. Typically, policymakers select
their desired score components that would feature in the scoring rule and constraints that the
allocation outcomes need to satisfy. Our method provides an e!cient, scalable and systematic
way of striking the right balance between the selected score components by designing a policy that
approximately maximizes medical e!ciency, subject to the selected constraints.
As an application of our method, we use historical data from 2008, to construct multiple scoring
rule based policies that utilize the same criteria for components as the ones considered by the OPTN
Kidney Transplantation Committee. Within the di"erent case studies we present, we also design a
policy that possesses similar fairness characteristics with the KTC dominant proposal. Numerical
studies then suggest that this policy constructed by our method achieves an 8% improvement
in life years from transplant, using the same statistical and simulation tools and data as U.S.
policymakers use. Furthermore, we perform a trade-o" analysis by considering deviations from the
fairness constraints of the proposed policy. In particular, we study the e"ect in life year gains,
in case of emphasizing or deemphasizing the priority given to patients who have been waiting for
a long time or are sensitized. Our method e!ciently redesigns policies accordingly. The results
indicate that the performance gain in life years from transplant can be as high as 30%. Details on
the case studies are included in Section 4. We next present our proposal in full detail.
3.1. Methodology
Given a list of n score components, related historical data of patients’ and donated organs’ charac-
teristics, and constraints on the allocation outcomes (precisely defined below), we calculate score
12
weights w1, . . . , wn, such that the resulting scoring rule policy satisfies the constraints approxi-
mately, while maximizing life years from transplant.
Consider a fixed time period over which we have complete (ex facto) information about all
patients registered in the waitlist (pre-existing and arriving) in that time period. In particular,
we know their physiological characteristics, the time of their initial registration, as well as the
evolution of their medical status and availability for a transplant during that time period. Suppose
we also have complete information about the organs that are procured during the period, that is
the time at which they are procured and their physiological characteristics. We index the patients
by p = 1, . . . , P and the organs by o = 1, . . . , O. We say that patient p is eligible to receive organ
o, or equivalently that the patient-organ pair (p, o) is eligible for transplantation, if at the time of
the organ procurement all conditions below are met:
1. The patient is registered at the waitlist for a transplant;
2. The patient is actively waiting for a transplant and his medical status is appropriate for
transplantation;
3. The patient is medically compatible with the organ.
Let C be the set of patient-organ pairs eligible for transplantation, i.e.,
C = {(p, o) : patient p is eligible to receive o} .
Note that one can construct C simply by using the arrival information and characteristics of the
organs and the patients, and the evolution of the availability and medical status of the patients.
Additionally, one can also compute the score components for each eligible patient-organ pair,
as well as the life years from transplant. Let fj,(p,o) be the value of the jth component score,
j = 1, . . . , n, and LYFT(p, o) the life years from transplant for pair (p, o) % C.
We now define the class of admissible constraints on the allocation outcomes, alluded to thus
far. First, let x(p,o) be defined for every eligible patient-organ pair (p, o) as
x(p,o) =
"
#
$
#
%
1, if organ o is assigned to patient p,
0, otherwise.
13

A constraint is admissible for our method if it is linear, that is if it can be modeled as a linear
constraint with respect to variable x. To the best of our knowledge, all fairness constraints con-
sidered by policymakers thus far in the U.S. are of that form; in fact, they correspond to lower
bounds on the percentage distributions of transplant recipients across di"erent groups of patients
(see RFI (2008) and Section 4.2 for more details). However, the class of constraints that can be
modeled in this way is broader; for instance, one can also impose lower bounds for a specific group
of patients on the average life years from transplant gained among the actual transplant recipients,
the average time spent on dialysis among the actual transplant recipients, etc. As an example, a
lower bound L on the number of organs allocated to a specific group of patients G & {1, . . . , P},
can be expressed as!
p!G
!
o:(p,o)!C
x(p,o) # L.
For instance, setting G to be the set of all patients of blood type O could enforce a lower bound on
transplants for patients of this blood type.
We denote the input fairness constraints with Ax $ b, for some matrix A and vector b. We now
present our method which consists of three steps:
Step 1 (An Idealized Matching Problem): Consider a social planner with foresight who has
knowledge of the set of all eligible pairs C and the life years from transplant score for every pair in
the set. Suppose also that patients accept all organs o"ered to them. In this setup, the problem of
allocating organs to patients so as to maximize medical e!ciency, i.e., life years from transplant,
subject to fairness constraints Ax $ b, can be formulated as a linear optimization problem:
maximize!
(p,o)!C
LYFT(p, o)x(p,o)
subject to!
o:(p,o)!C
x(p,o) $ 1, 'p
!
p:(p,o)!C
x(p,o) $ 1, 'o
Ax $ b
x # 0.
(1)
Note that a fractional value for x(p,o) can be interpreted as the probability of assigning organ o
to patient p in a randomized policy. Its solution suggests an allocation with perfect hindsight
14

(as opposed to an implementable policy). The next two steps will use this idealized solution to
construct an implementable policy in a unique way.
Step 2 (Dual Information): By linear optimization duality, if y is the vector of optimal dual
multipliers associated with the constraints Ax $ b for problem (1), then problem (1) is equivalent
with the one below:
maximize!
(p,o)!C
LYFT(p, o)x(p,o) ! yT Ax + yT b
subject to!
o:(p,o)!C
x(p,o) $ 1, 'p
!
p:(p,o)!C
x(p,o) $ 1, 'o
x # 0.
(2)
Note that problem (2) is a matching problem. We equivalently rewrite the objective of (2) as
cT x + yT b, utilizing the cost vector c defined as
c(p,o) = LYFT(p, o) !&
yT A'
(p,o), '(p, o) % C.
We next use this dual information to construct an implementable policy.
Step 3 (Approximate Dynamic Programming): Note that our goal is to design a policy that
approximately solves the above matching problem online, i.e., a policy that sequentially matches
organs at their time of procurement to available patients without utilizing any future information.
An implementable policy will require the following:
1. An estimate of the value of assigning a particular organ, o to a particular patient, p (tech-
nically, one may think of this as a di"erential value function for the associated stochastic
optimization problem).
2. An interpretable formula for the above di"erential value that uses permissible features of the
patient and organ in a clinically acceptable way. Our goal is to rank patients not by any
artificial score coe!cients, but rather based on the selected score components.
One possible policy is scoring potential allocations on the basis of the coe!cients c(p,o) computed
above. Unfortunately, the c(p,o) coe!cients are calculated for patients on the waiting list and
15
received organs from some historical data set and as such it is likely that we will not have access
to c(p,o) for all pairs (p, o) moving forward. More importantly, a scoring policy based on these
coe!cients will not satisfy the second requirement above. As such, we consider using the coe!cients
to inform the calibration of an acceptable scoring rule. In particular we find acceptable score weights
w by solving the optimization problem
minimize!
(p,o)!C
(
)c(p,o) ! w0 !n
!
j=1
wjfj,(p,o)
*
+
2
subject to w % S,
where the set S enforces clinical and ethical requirements (for instance, by requiring that the
resulting policy be continuous or monotone in certain score components, etc.).
The method is summarized as Procedure 1.
Procedure 1 Computation of score weights
Input: list of n score components, data for linear constraints (A, b), historical data: set of eligiblepatient-organ pairs C, life years for transplant LYFT(p, o) and values of score components,fj,(p,o), j = 1, . . . , n, for every eligible pair (p, o).
Output: weights for scoring rule, w1, . . . , wn.1: solve problem (1)2: y ( vector of optimal dual multipliers associated with constraints Ax $ b
3: c(p,o) ( c(p,o) = LYFT(p, o) !&
yT A'
(p,o), '(p, o) % C
4: use (potentially constrained) linear regression to find w0, w1, . . . , wn, such that for all (p, o) % C
c(p,o) ) w0 + w1f1,(p,o) + . . . + wnfn,(p,o).
3.2. Discussion
In this section, we discuss (a) why and when one should expect the proposed method to perform
well in practice and (b) the relative merits of our contribution
Consider the airline network revenue management setting analyzed in Talluri and van Ryzin
(1998). In that setting, an airline is operating flights and is selling di"erent itinerary tickets to
incoming customers, so as to maximize net expected profits from sales subject to capacity con-
straints (which correspond to the numbers of seats on the di"erent aircraft operating the flights).
The authors analyze a simple control policy that decides whether to sell an itinerary ticket to a
16

passenger or not, and demonstrate that the policy is asymptotically optimal under some condi-
tions. For the organ allocation problem, a simplified version of the policy that we described in the
previous section can be cast in the same framework as in Talluri and van Ryzin (1998); one can
then derive a similar result of asymptotic optimality, following the same procedure. In particu-
lar, in Talluri and van Ryzin (1998), the authors analyze the performance of the following simple
bid-price control policy: one first solves a capacity allocation problem assuming that demand is
deterministic and equal to the mean demand. Based on the optimal dual multipliers associated
with the resource capacity constraints in that problem, one then calculates a “bid price” for every
unit of a particular resource. An itinerary ticket is then sold to a customer if the money o"ered
by the customer exceed the sum of prices of the resources he would consume. In our procedure, if
we ignore the regression step, we also assume deterministic demand and solve a similar allocation
problem4. We then calculate “bid prices” y associated to the fairness constrains and assign the
organ to the patient who achieves the highest profit (LYFT), adjusted for the “bid prices”. For
more details, we refer the reader to the paper by Talluri and van Ryzin (1998). Finally, note that
in our procedure we eventually use the score components to make decisions instead of the “bid
prices,” as per policy design requirements. If the selected score components are correlated with
the “bid prices” and the fairness constraints those correspond to, we expect our procedure to work
well. However, this would not be the case if the selected score components have limited explanatory
power and are uncorrelated with the fairness constraints. As we emphasized above, our method-
ology is not a replacement for professional medical judgment; the selection of score components is
precisely one of the steps where medical judgment is required to guide our procedure.
Apart from the above discussion regarding the performance of our method in practice, we next
provide numerical evidence. Before that, we summarize the relative merits of our contribution.
1. The proposed method uses detailed historical medical data to extract near optimal score
weights in an e!cient manner. In particular, the method is highly scalable and can learn
the parameters from potentially highly detailed and complicated historical datasets, with no
need for simplifications, clustering or grouping of patients’ and/or organs’ characteristics.
4Specifically, consider the deterministic linear optimization model analyzed in Talluri and van Ryzin (1998), wherethe di!erent customer classes correspond to patient classes, the profits correspond to life years from transplant andthe network capacity constraints correspond to the fairness constraints. If we instead use historical samples ratherthan averages, we recover formulation (1).
17

2. The method o"ers the flexibility and allows policymakers to focus only on identifying score
components and desired fairness properties of allocation outcomes in the design of a new
policy. The method undertakes the more involved part of finding the appropriate weights
and balancing the score components. Although medical intuition can help in making edu-
cated guesses for the weights, there is little guarantee that a policy designed in such way
would yield the desired results. Furthermore, even if a set of weights yields a policy with
the desired outcomes, there can be another policy delivering a superior performance. Due to
the computational intensity of simulations, one simply cannot explore all possible combina-
tions of weights. Our contribution is towards this direction, by using mathematical tools to
automatically extract near-optimal weights from historical data.
3. The failure of the current kidney allocation policy in place to keep up with advances in
medicine and the changes in patients’ needs throughout the years, has demonstrated that in
such a dynamic and complex environment, revisions to policies are likely to be required in the
future as well, a fact that is also recognized by the OPTN Final Rule. Furthermore, even in
the current process of developing a new policy, there is no guarantee that the O!ce of Civil
Rights will approve the criteria of life years from transplant, dialysis time, etc., suggested by
the OPTN policymakers. In both cases, our method will expedite the development of a new
policy, as it would require only an updated list of score components and fairness properties
to be specified.
4. Our method allows for sensitivity analysis; specifically, one can e!ciently evaluate the out-
comes of relaxing some or introducing new fairness constraints. In the next section, we provide
such an analysis that reveals the dependence of medical e!ciency on fairness concepts, and
illustrate how it can be used in practice by policymakers. In particular, note that one of the
main goals that the OPTN policymakers have set for a new national policy is to deempha-
size the role of waiting time and increase medical e!ciency (see Section 2.1). Our analysis
provides a characterization of the trade-o"s involved.
In the next section, we provide numerical evidence of the usefulness of the described method. In
particular, we use historical data to design multiple new scoring policies under di"erent scenarios
and also perform a sensitivity analysis.
18

4. Numerical Evidence and the Design of New Allocation Policies
We utilize the method described in the previous section to design new scoring-rule based policies
for kidney allocation that have di"erent fairness requirements and/or are based on di"erent score
components. Specifically, we consider di"erent fairness requirements and score components derived
from policies that have been proposed by the OPTN Kidney Transplantation Committee (see
Section 2.1), to set up 3 realistic case studies. Briefly, the intent and outcomes of these case studies
are as follows:
• Case Study 1: Here we design policies that are based on all score components considered
by policymakers, discussed in Section 2.1. Using the methodology of the previous section
we require the approach to preserve the fairness properties of the current dominant proposal
considered by the KTC (referred to also as the KTC policy or proposal in this section).
Furthermore, we impose constraints on our methodology to guarantee that the resulting
scoring rule is clinically valid. Our methodology produces a policy that in addition to being
clinically valid and exhibiting similar fairness properties as the dominant proposal provides
an 8% increase in life year gains relative to that proposal. This demonstrates the value of the
approach in designing policies given requirements on fairness, as well as, vis-a-vis the task of
guiding the selection of a small but appropriate set of score components from a large family
of potential score components.
• Case Studies 2 and 3: Similar to the previous study, this study requires fairness criteria
that correspond to a perhaps more balanced allocation of organs among di"erent age groups
of patients (as opposed to the dominant proposal which has been criticized as providing too
few transplants to older age groups). Surprisingly, we develop a clinically acceptable policy
that allays these criticisms of the dominant proposal while providing essentially the same
life years gains as the dominant proposal. This demonstrates the value of our methodology
vis-a-vis designing policies that must satisfy stringently specified fairness criteria. We further
consider various relaxations of the fairness criteria and construct corresponding policies to
show how our approach allows policy makers to perform a sensitivity analysis relative to
fairness requirements.
19

To ensure a fair comparison, we evaluate the performance of all policies we study by using the
same statistical models and tools, as well as datasets with the OPTN KTC policymakers. We first
provide details about the data and models, and then present our methodology and results.
4.1. Data, Statistical Models and Tools
This work uses highly detailed historical data from the Scientific Registry of Transplant Recipients
(SRTR). The SRTR data system includes data on all donor, wait-listed candidates, and transplant
recipients in the U.S., submitted by the members of the OPTN, and has been described elsewhere.
The Health Resources and Services Administration (HRSA), U.S. Department of Health and Human
Services provides oversight to the activities of the OPTN and SRTR contractors. The datasets
include all the various physiological and demographic characteristics of wait-listed patients and
donors that are needed for our study, as well as the evolution of the medical status of the patients,
and the arrival process of the donated organs.
In addition, the SRTR has developed sophisticated survivability models for ESRD patients
using historical survival rates. The models provide an estimate for the anticipated lifespan of a
patient in case he remained on dialysis, or in case he received a particular kidney, based on a
plethora of physiological attributes (e.g., the patient’s age, body mass index, diagnosis, as well
as tissue matching, the donor’s age, cause of death, etc.). For more information and a detailed
study of the statistical performance of the models, we refer the reader to Wolfe et al. (2008) and
Wolfe et al. (2009). The SRTR has also developed an acceptance model that predicts the probability
of a particular patient accepting a particular organ o"ered to him, based on the physiological
characteristics of the patient and the donor, the distance, etc.
The above datasets and statistical models have also been utilized by the SRTR in the devel-
opment of the Kidney-Pancreas Simulated Allocation Model (KPSAM). The KPSAM is an event-
driven simulator that simulates the entire allocation process using historical data, for di"erent
allocation policies. It was developed in order to support studies of alternative policies. The KP-
SAM is the platform that the OPTN KTC is utilizing to evaluate the performance of their proposed
policies, see OPTNKTC (2007). For more details on the data and the simulator, we refer the reader
to Waisanen et al. (2004) and KPSAM (2008).
For the purposes of this study, we obtained the KPSAM and used its simulation engine in order
20

to obtain realistic allocation outcomes of the policies we consider. The life years from transplant
gains are estimated using the aforementioned survivability models, embedded in the KPSAM.
4.2. Methodology
We perform 3 case studies of designing scoring rules that have di"erent fairness requirements
and/or are based on di"erent score components. In all studies we design allocation policies using
our method described in Section 3. Recall that our method outputs scoring rules, given as input
historical data, fairness requirements and score components. We discuss the specific fairness re-
quirements and score components of each case study separately (see below). For historical data, we
use the first 6 months of data of the 2008 SRTR database as input to our method (training data).
To evaluate the performance of a policy, we use the KPSAM to simulate the allocation outcomes
of that policy 100 times, over the remaining 6 months of the 2008 dataset that were not used as
training data. To evaluate e!ciency, we record the average number of transplantations occurring
and the average net expected life years from transplant (along with sample standard deviation).
To compare fairness properties across di"erent policies, we compare the percentage distribution of
transplant recipients across di"erent races, age groups, blood types, sensitization groups, as well as
diagnosis types and years spent on dialysis. Note that this practice is in line with the comparison
criteria studied by the OPTN policymakers (see OPTNKTC (2008), RFI (2008)). As such, we also
record the average aforementioned percentage distributions for the 100 simulation runs (along with
sample standard deviations). We next present the case studies and discuss our results.
4.3. Case Study 1
We design a policy that has the same fairness properties as the dominant KTC policy and is based
on criteria and score components considered by the KTC. Specifically, we allow the policy to use any
(small) subset of those criteria and components. In addition by imposing the appropriate constraints
in the third (regression) phase of our methodology we ensure that the resulting policies are clinically
valid (i.e., they conform qualitatively to features of past KTC policies/ recommendations).
Score components. Rather than pre-selecting specific score components, we feed the regression
step of our method with virtually all score components considered by the KTC (see Section 2.1).
However, in accordance with the format of KTC policies, we eventually pick only the 4 most
21
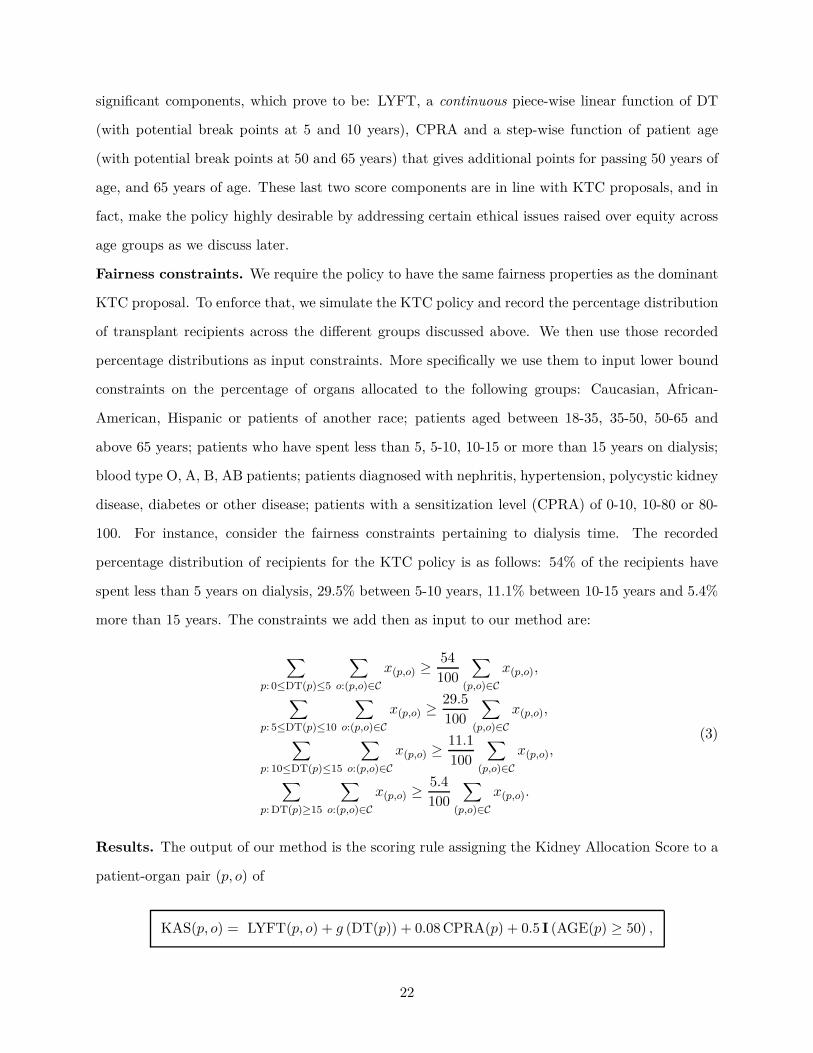
significant components, which prove to be: LYFT, a continuous piece-wise linear function of DT
(with potential break points at 5 and 10 years), CPRA and a step-wise function of patient age
(with potential break points at 50 and 65 years) that gives additional points for passing 50 years of
age, and 65 years of age. These last two score components are in line with KTC proposals, and in
fact, make the policy highly desirable by addressing certain ethical issues raised over equity across
age groups as we discuss later.
Fairness constraints. We require the policy to have the same fairness properties as the dominant
KTC proposal. To enforce that, we simulate the KTC policy and record the percentage distribution
of transplant recipients across the di"erent groups discussed above. We then use those recorded
percentage distributions as input constraints. More specifically we use them to input lower bound
constraints on the percentage of organs allocated to the following groups: Caucasian, African-
American, Hispanic or patients of another race; patients aged between 18-35, 35-50, 50-65 and
above 65 years; patients who have spent less than 5, 5-10, 10-15 or more than 15 years on dialysis;
blood type O, A, B, AB patients; patients diagnosed with nephritis, hypertension, polycystic kidney
disease, diabetes or other disease; patients with a sensitization level (CPRA) of 0-10, 10-80 or 80-
100. For instance, consider the fairness constraints pertaining to dialysis time. The recorded
percentage distribution of recipients for the KTC policy is as follows: 54% of the recipients have
spent less than 5 years on dialysis, 29.5% between 5-10 years, 11.1% between 10-15 years and 5.4%
more than 15 years. The constraints we add then as input to our method are:
!
p: 0"DT(p)"5
!
o:(p,o)!C
x(p,o) #54
100
!
(p,o)!C
x(p,o),
!
p: 5"DT(p)"10
!
o:(p,o)!C
x(p,o) #29.5
100
!
(p,o)!C
x(p,o),
!
p: 10"DT(p)"15
!
o:(p,o)!C
x(p,o) #11.1
100
!
(p,o)!C
x(p,o),
!
p: DT(p)#15
!
o:(p,o)!C
x(p,o) #5.4
100
!
(p,o)!C
x(p,o).
(3)
Results. The output of our method is the scoring rule assigning the Kidney Allocation Score to a
patient-organ pair (p, o) of
KAS(p, o) = LYFT(p, o) + g (DT(p)) + 0.08 CPRA(p) + 0.5 I (AGE(p) # 50) ,
22
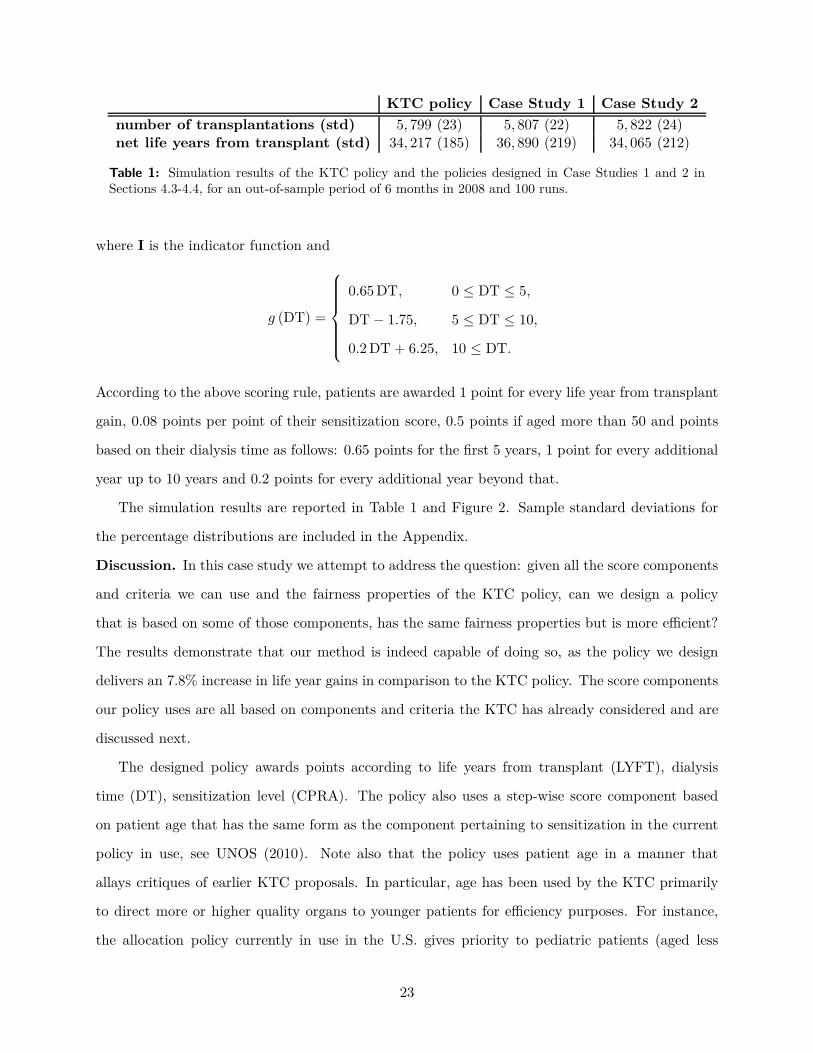
KTC policy Case Study 1 Case Study 2
number of transplantations (std) 5, 799 (23) 5, 807 (22) 5, 822 (24)net life years from transplant (std) 34, 217 (185) 36, 890 (219) 34, 065 (212)
Table 1: Simulation results of the KTC policy and the policies designed in Case Studies 1 and 2 inSections 4.3-4.4, for an out-of-sample period of 6 months in 2008 and 100 runs.
where I is the indicator function and
g (DT) =
"
#
#
#
#
#
$
#
#
#
#
#
%
0.65 DT, 0 $ DT $ 5,
DT ! 1.75, 5 $ DT $ 10,
0.2 DT + 6.25, 10 $ DT.
According to the above scoring rule, patients are awarded 1 point for every life year from transplant
gain, 0.08 points per point of their sensitization score, 0.5 points if aged more than 50 and points
based on their dialysis time as follows: 0.65 points for the first 5 years, 1 point for every additional
year up to 10 years and 0.2 points for every additional year beyond that.
The simulation results are reported in Table 1 and Figure 2. Sample standard deviations for
the percentage distributions are included in the Appendix.
Discussion. In this case study we attempt to address the question: given all the score components
and criteria we can use and the fairness properties of the KTC policy, can we design a policy
that is based on some of those components, has the same fairness properties but is more e!cient?
The results demonstrate that our method is indeed capable of doing so, as the policy we design
delivers an 7.8% increase in life year gains in comparison to the KTC policy. The score components
our policy uses are all based on components and criteria the KTC has already considered and are
discussed next.
The designed policy awards points according to life years from transplant (LYFT), dialysis
time (DT), sensitization level (CPRA). The policy also uses a step-wise score component based
on patient age that has the same form as the component pertaining to sensitization in the current
policy in use, see UNOS (2010). Note also that the policy uses patient age in a manner that
allays critiques of earlier KTC proposals. In particular, age has been used by the KTC primarily
to direct more or higher quality organs to younger patients for e!ciency purposes. For instance,
the allocation policy currently in use in the U.S. gives priority to pediatric patients (aged less
23

Targets for CS1
Results for CS1
Targets for CS2
Results for CS2
percentage of transplant recipients
<18 yr
18-35 yr
35-50 yr
50-65 yr
>65 yr
nephritis
hypertension
polycystic
other
diabetes
CPRA 0-10
CPRA 10-80
CPRA 80-100
A
AB
B
O
0-5 yr
5-10 yr
10-15 yr
>15 yr
african american
hispanic
caucasian
other
0 20 40 60
Figure 2: Simulated average percentage distributions of recipients across di"erent race, dialysis time,blood type, sensitization, diagnosis and age candidate groups for the policies designed in Case Study1 (cyan) and Case Study 2 (red). The corresponding specified targets are also depicted (blue for CaseStudy 1 and yellow for Case Study 2). The results are for an out-of-sample period of 6 months in 2008.
24

than 18 years) for organs procured from donors aged less than 35, whereas proposals suggest to
extend priority to patients aged less than 35 as well. This may be perceived as providing an undue
advantage to younger patients. In contrast, the way our policy utilizes age is in the other direction.
That is, to impose fairness, the policy awards points to patients aged more than 50 to compensate
for the fact that they typically obtain smaller LYFT scores.
Furthermore, note that the score component pertaining to DT is continuous piece-wise linear.
We present here the use of a piece-wise linear function for the following reasons: (a) to illustrate
how our method can deal with a variety of functions for score components, and (b) the preference of
some members of the KTC for continuous functions,5 due to the concern that discontinuities might
grant patients who are slightly above a particular threshold (or breakpoint) a disproportionate
advantage compared with patients slightly below that threshold, see OPTNKTC (2007). Note
however, we found that in all policies presented in this work, one can interchangeably use step-wise
and piece-wise functions (delivering statistically indistinguishable performance).
Finally, this case study demonstrates that our method reliably designs policies that perform
well based on input that is directly related to outcomes (fairness constraints) and permissible score
components. In contrast, the approach of policymakers in designing policies has traditionally been
to first select a subset of score components, identify weights and then observe (simulation based)
outcomes; and then go through those steps multiple times if necessary. This is obviously not ideal;
a fact demonstrated amply by our numerical results. Thus, our contribution enables the design
of policies in a more natural and powerful way by considering the desired outcomes directly. Our
method is capable of calibrating multiple score components simultaneously and distilling the ones
that are important. In the absence of an algorithmic method, such a task might be strenuous or
even impossible to carry out.
4.4. Case Study 2
We present a case study similar to Case Study 1, but with di"erent fairness requirements. We
enforce the same fairness properties with the KTC policy, but require the percentages of recipients
aged 50-65 and above 65 to be equal to the percentages of patients at the waitlist aged 50-65 and
above 65 respectively. This requirement results in an (additive) increase of around 17 percentage
5However, note that step-wise score components are utilized in the current allocation policy.
25

points for organs allocated to patients aged 50 and above. This increase is balanced by a pro-rata
decrease in the number of organs allocated to recipients aged between 18 and 50. We require
this at the outset in response to comments made by a UNOS Ethics Committee in OPTNKTC
(2008) that observed that the dominant KTC proposal resulted in a decrease in the proportion of
transplants among patients in the 50-65 and 65 and older age groups. The question that remains
is whether the life year gains provided by the dominant proposal can be retained using a clinically
acceptable policy that unlike the dominant proposal, does not result in a large change in the fraction
of transplants among older age groups.
Score components. As in Case Study 1, we use LYFT, a piece-wise linear function of DT (with
break points at 5 and 10 years), CPRA and a step-wise function of patient age (with break points
at 50 and 65 years).
Fairness constraints. We enforce the policy to have the same fairness properties as the domi-
nant KTC policy, but with a di"erent age distribution requirement. In particular, the percentage
distribution of patients according to age for the KTC policy is: 5% for patients aged less than 18,
20.4% for patients aged 18-35, 32.4% for patients aged 35-50, 30.7% for patients aged 50-65 and
11.5% for patients aged above 65. For our policy, we require the percentages of organs allocated
to patients aged 50-65 and above 65 to be 41% and 17.8% respectively (note that those were pre-
cisely the percentages of patients aged 50-65 and above 65 in the waitlist in 2008). Accordingly, we
require the percentages of organs allocated to patients aged 18-35 and 35-50 to be 14% and 22.2%
respectively.
Results. The output of our method is the scoring rule assigning the Kidney Allocation Score to a
patient-organ pair (p, o) of
KAS(p, o) = LYFT(p, o) + h (DT(p)) + 0.12 CPRA(p) + 2.5 I (AGE(p) # 50) + I (AGE(p) # 65) ,
where
h (DT) =
"
#
#
#
#
#
$
#
#
#
#
#
%
0.75 DT, 0 $ DT $ 5,
DT ! 1.25, 5 $ DT $ 10,
0.5 DT + 3.75, 10 $ DT.
The simulation results are reported in Table 1 and Figure 2. Sample standard deviations for the
26

percentage distributions are included in the Appendix.
Discussion. This case study, alongside the next one, illustrates how our method deals with
alternative fairness constraints. In particular, we consider the same setup as in Case Study 1,
but introduce a change in the required age percentage distribution of recipients. Our method
successfully redesigns a conforming policy.
The change in the age distribution we consider is motivated by comments made by a UNOS
Ethics Committee in OPTNKTC (2008). Based on the fact that, in comparison with current
practice, the new KTC policy would direct a higher number of organs, or organs of higher quality, to
younger patients, the committee argued that the KTC policy might have an unintended consequence
of a decrease in living donor transplants for younger patients, who typically have higher LYFT
scores. In response to that, in this case study we design a policy that has a more balanced age
distribution, which actually resembles the age distribution of patients in the waitlist. Perhaps this
consideration is just only one plausible way of addressing the concern raised by the committee.
Nevertheless, it is presented here only to illustrate the flexibility of our method, rather than tackle
this particular issue.
Finally, note that in comparison with the KTC policy our policy allocates more organs to elder
patients, a fact that could significantly undermine e!ciency. However, both policies deliver almost
identical life year gains (see Table 1), which again illustrates that our method is capable of designing
e!cient policies.
4.5. Case Study 3
In our final case study we demonstrate how our method can be used to perform a sensitivity analysis
with respect to imposed fairness constraints. Specifically, we explore the dependence of life years
from transplant gains on the priority given for dialysis time and sensitization.
To this end, we consider a similar setup as in Case Study 1, but we relax the constraints
pertaining to patient groups of di"erent dialysis time, i.e., constraints (3), as well as to patient
groups of di"erent sensitization level. The relaxation is controlled by a slack parameter. We then
study the dependence of life year gains on that parameter.
Score components. As in Case Study 1, we use LYFT, a piece-wise linear function of DT (with
break points at 5 and 10 years), CPRA and a step-wise function of patient age (with break points
27

at 50 and 65 years).
Fairness constraints. We use the same fairness properties with the dominant KTC policy, but
we first relax only the constraints pertaining to dialysis time. The relaxation is performed by
introducing a slack parameter s in the percentage requirements of recipients of di"erent groups,
that is, the relaxed constraints take the form
!
p: 0"DT(p)"5
!
o:(p,o)!C
x(p,o) #54 ! s
100
!
(p,o)!C
x(p,o),
!
p: 5"DT(p)"10
!
o:(p,o)!C
x(p,o) #29.5 ! s
100
!
(p,o)!C
x(p,o),
!
p: 10"DT(p)"15
!
o:(p,o)!C
x(p,o) #11.1 ! s
100
!
(p,o)!C
x(p,o),
!
p: DT(p)#15
!
o:(p,o)!C
x(p,o) #5.4 ! s
100
!
(p,o)!C
x(p,o).
(4)
Clearly, for s = 0 one would recover the policy that was designed in Case Study 1. For s > 0,
the requirement on matching the percentage distribution (with regard to patient groups of di"erent
dialysis time) achieved by the KTC policy is relaxed. Thus one should expect that policies designed
with such relaxed requirements would achieve higher life years from transplant gains. Using our
method, we design policies for various values of the slack parameter s and quantify how the gains
in medical e!ciency depend on deviations from the selected fairness constraints. Secondly, we
follow the same procedure to examine the dependence of medical e!ciency on the priority given to
sensitized patients. We again use all the constraints as in Case Study 1, but this time relax only
the constraints pertaining to patient groups of di"erent sensitization levels. The relaxation is again
performed using a slack parameter s. Note that one can potentially perform a sensitivity analysis
through many other di"erent ways of relaxing the constraints; for illustration purposes we focus
here only on the described method of uniformly relaxing the constraints by a slack parameter.
Results. The results we obtain in the aforementioned scenarios are depicted in Figure 3. The
figure shows the life years from transplant gains (for the 6 month period we consider) of policies
designed with relaxed constraints on patient groups of di"erent dialysis time or sensitization, for
various values of the slack parameter s. The figures also depicts the operational point of the KTC
policy, that is for s = 0.
Discussion. Comparing the two scenarios we considered, one can observe that the dependence of
28

Slack parameter s(in %)
Lif
eye
ars
from
tran
spla
ntga
ins
(in
thou
san
ds
ofye
ars)
500
10
10 15
20
20 25
30
40
50
Figure 3: Simulated life years from transplant gains for policies (designed by our method) with relaxedconstraints on all patient groups of di"erent dialysis time (solid) or sensitization (dashed), for variousvalues of the slack parameter s; for more details see Section 4.5. The results are for an out-of-sampleperiod of 6 months in 2008. The marker corresponds to the operational point of the policy proposed bythe UNOS policymakers.
medical e!ciency is stronger on dialysis time. Also, the life years from transplant gains can be as
high as 44, 300 years, which are 30% larger than the gains of the KTC policy. Note that although
such a policy might not be implementable, the analysis can provide insights to policymakers and
facilitate their decision process.
Nevertheless, this case study illustrates how our method can be used to perform a trade-o"
analysis that could assist policymakers in quantifying the impact of certain fairness requirements.
5. Discussion and Future Directions
We dealt with the important problem of allocating deceased donor kidneys to waitlisted patients,
in a fair and e!cient way. We focused on national allocation policies in the United States and the
recent e"ort to revise the current policy in place.
Particularly, we studied allocation policies that are based on point systems; under those policies
patients are awarded points according to some priority criteria, and patients are then prioritized by
the number of points awarded. We identified the challenges in designing a point system, specifically
29

the relative emphasis put on each criterion such that the resulting policy strikes the right balance
between e!ciency and fairness.
Our main contribution was a scalable, data-driven method of designing point system based
allocation policies in an e!cient and systematic way. The method does not presume any particular
fairness scheme, or priority criterion. Instead, it o"ers the flexibility to the designer to select his
desired fairness constraints and criteria under which patients are awarded points. Our method then
balances the criteria and extracts a near-optimal point system policy, in the sense that the policy
outcomes yield approximately the maximum number of life years gains (medical e!ciency), while
satisfying the fairness constraints.
To validate our method and demonstrate its usefulness, we presented 3 case studies in which
we designed new policies under di"erent scenarios. In one of them, we designed a new policy
that matches in fairness properties the one that was recently proposed by the U.S. policymakers,
while being based on a format and criteria already considered by policymakers. Critically, our
policy delivers an 8% relative increase in life years gains. The performance gain was established
via simulation, utilizing the same statistical tools and data as the U.S. policymakers.
Finally, we presented a trade-o" analysis that revealed the dependence of medical e!ciency on
the important fairness concepts of prioritizing patients who have either spent a lot of time waiting,
or are medically incompatible with the majority of donors.
As a pointer for future work, consider the policies that OPTN policymakers have proposed in
which patients and/or organs are categorized into di"erent groups according to some criteria and
then specific groups receive priority in the allocation, see Section 2.1. For instance, a proposal
presented in OPTNKTC (2007) suggests to categorize patients in 5 di"erent groups according to
their expected life year gains: top 20% goes to the first group, bottom 20% goes to the last group,
etc. Similarly, organs are categorized according to their quality (DPI). In the allocation then,
group 1 patients are given priority for group 1 organs, groups 2 patients are given priority for group
2 organs and so on. Ranking within those groups is again achieved via a scoring rule, so our model
would again be applicable and useful. Another interesting question however is, how can should
one decide on the “right” categorization? In the example we gave, how does one exactly partition
patients into those 5 groups? As an extension and future work, one can potentially use modified
versions of our framework to guide such decisions. We present a related case study in the Appendix.
30

Disclaimer
The data reported here have been supplied by the Minneapolis Medical Research Foundation
(MMRF) as the contractor for the Scientific Registry of Transplant Recipients (SRTR). The inter-
pretation and reporting of these data are the responsibility of the authors and in no way should be
seen as an o!cial policy of or interpretation by the SRTR or the U.S. Government.
References
J. Ahn and J. C. Hornberger. Involving patients in the cadaveric kidney transplant allocation process: Adecision-theoretic perspective. Management Science, 42(5):pp. 629–641, 1996.
M. Akan, O. Alagoz, B. Ata, and F. S. Erenay. Optimizing liver allocation system incorporating diseaseevolution. Submitted to Operations Research, 2011.
O. Alagoz. Optimal policies for the acceptance of living and cadaveric-donor livers. Ph.D. dissertation,University of Pittsburgh, Pittsburgh, 2004.
O. Alagoz, L. M. Maillart, A. J. Schaefer, and M. S. Roberts. Determining the acceptance of cadaveric liversusing an implicit model of the waiting list. Operations Research, 55(1):24–36, 2007.
I. Ashlagi, D. S. Gilchrist, A. E. Roth, and M. A. Rees. Nonsimultaneous chains and dominos in kidneypaired donation — revisited. American Journal of Transplantation, 11(5):984–994, May 2011.
I. David and U. Yechiali. A time-dependent stopping problem with application to live organ transplants.Operations Research, 33(3):pp. 491–504, 1985.
I. David and U. Yechiali. One-attribute sequential assignment match processes in discrete time. OperationsResearch, 43(5):pp. 879–884, 1995.
DHHS. Organ Procurement and Transplantation Network Final Rule. 2000. Electronic Code of FederalRegulations, Title 42–Public Health, Chapter I–Public Health Service, Department of Health andHuman Services, Subchapter K–Health Resources Development, Part 121.
D. H. Howard. Why do transplant surgeons turn down organs?: A model of the accept/reject decision.Journal of Health Economics, 21(6):957 – 969, 2002.
N. Kong, A. J. Schaefer, B. Hunsaker, and M. S. Roberts. Maximizing the e!ciency of the u.s. liver allocationsystem through region design. Management Science, 56(12):2111–2122, 2010. doi: 10.1287/mnsc.1100.1249.
KPSAM. Kidney-Pancreas Simulated Allocation Model. 2008. Arbor Research Collaborative for Health.Scientific Registry of Transplant Recipients.
S. Norman. Update on the development of a new kidney transplant allocation system. Dial Transpl, 38:400–406, 2009.
ODADK. Organ Distribution: Allocation of Deceased kidneys. 3(5):1–13, June 2010. United Network forOrgan Sharing Policies.
A.O. Ojo, F.K Port, R.A. Wolfe, E.A. Mauger, L. Williams, and D.P. Berling. Comparative mortality risksof chronic dialysis and cadaveric transplantation in black end-stage renal disease patients. Am J KidneyDis, 24(1):59–64, 1994.
OPTNKTC. Report of the OPTN/UNOS Kidney Transplantation Committee to the Board of Directors.2007. September 17-18, Los Angeles, California.
OPTNKTC. Report of the OPTN/UNOS Kidney Transplantation Committee to the Board of Directors.2008. February 20-21, Orlando, Florida.
OPTNKTC. Report of the OPTN/UNOS Kidney Transplantation Committee to the Board of Directors.2010. June 21-22, Richmond, Virginia.
31

F.K. Port, R.A. Wolfe, E.A. Mauger, D.P. Berling, and K. Jiang. Comparison of survival probabilities fordialysis patients versus cadaveric renal transplant recipients. JAMA, 270(11):1339–1343, 1993.
RFI. Kidney Allocation Concepts: Request for Information. 2008. OPTN/UNOS Kidney TransplantationCommittee.
R. Righter. A resource allocation problem in a random environment. Operations Research, 37(2):pp. 329–338,1989.
A. E. Roth, T. Sonmez, and M. U. Unver. Kidney exchange. Quart. J. Econom, 119(2):457–488, 2004.
R. J. Ruth, L. Wyszewianski, and G. Herline. Kidney transplantation: A simulation model for examiningdemand and supply. Management Science, 31(5):pp. 515–526, 1985.
B. Sandikci, L. M. Maillart, A. J. Schaefer, O. Alagoz, and M. S. Roberts. Estimating the patient’s price ofprivacy in liver transplantation. Operations Research, 56(6):1393–1410, 2008.
P. Schnuelle, D. Lorenz, M. Trede, and F.J. Van Der Woude. Impact of renal cadaveric transplantation onsurvival in end-stage renal failure: Evidence for reduced mortality risk compared with hemodialysisduring long-term follow-up. J Am Soc Nephrol, 9:2135–2141, 1998.
D. L. Segev, S. E. Gentry, D. S. Warren, B. Reeb, and R. A. Montgomery. Kidney paired donation andoptimizing the use of live donor organs. JAMA, 293(15):1883–1890, 2005.
S. M. Shechter, C. L. Bryce, O. Alagoz, J. E. Kreke, J. E. Stahl, A. J. Schaefer, D. C. Angus, and M. S.Roberts. A clinically based discrete-event simulation of end-stage liver disease and the organ allocationprocess. Medical Decision Making, 25(2):199–209, 2005.
X. Su and S. A. Zenios. Patient choice in kidney allocation: A sequential stochastic assignment model.Operations Research, 53(3):443–445, May-June 2005.
X. Su and S. A. Zenios. Recipient Choice Can Address the E!ciency-Equity Trade-o" in Kidney Transplan-tation: A Mechanism Design Model. Management Science, 52(11):1647–1660, 2006.
X. Su and S.A. Zenios. Patient choice in kidney allocation: The role of the queueing discipline. ManufacturingService Operations Management, 6(4):280–301, 2004. doi: 10.1287/msom.1040.0056.
M. Suthanthiran and T.B. Strom. Renal transplantation. N Engl J Med, page 331:365, 1994.
K. Talluri and G. van Ryzin. An analysis of bid-price controls for network revenue management. ManagementScience, 44(11):1577–1593, November 1998.
UNOS. United Network for Organ Sharing. 2010. http://www.unos.org/.
USRDS. U.S. Renal data system, annual data report: Atlas of chronic kidney disease and end-stage renaldisease in the united states. 2009. National Institutes of Health, National Institute of Diabetes andDigestive and Kidney Diseases, Bethesda, MD.
L. Waisanen, R.A. Wolfe, R.M. Merion, K. McCullough, and A. Rodgers. Simulating the allocation of organsfor transplantation. Health Care Management Science, 7(4):331–338, 2004.
R.A. Wolfe, K.P. McCullough, D.E. Schaubel, J.D. Kalbfleisch, S. Murray, M.D. Stegall, and A.B. Leichtman.2007 SRTR report on the state of transplantation: Calculating life years from transplant (LYFT):Methods for kidney and kidney-pancreas candidates. Am J Transplant, 8(2):997–1011, 2008.
R.A. Wolfe, K.P. McCullough, and A.B. Leichtman. Predictability of survival models for waiting list andtransplant patients: Calculating LYFT. Am J Transplant, 9(7):1523–1527, 2009.
S. A. Zenios. Models for kidney allocation. In Margaret Brandeau, François Sainfort, and William Pierskalla,editors, Operations Research and Health Care, volume 70 of International Series in Operations Researchand Management Science, pages 537–554. Springer New York, 2005.
S. A. Zenios. Optimal control of a paired-kidney exchange program. Management Science, 48(3):328–342,2002.
S. A. Zenios, G. M. Chertow, and L. M. Wein. Dynamic allocation of kidneys to candidates on the transplantwaiting list. Operations Research, 48(4):pp. 549–569, 2000.
32
Appendix
A. Simulation Results
Table 2 includes the simulated average percentage distributions (and sample deviations) of recipients
across di"erent race, dialysis time, blood type, sensitization, diagnosis and age patient groups for
the policies designed in the case studies in Section 4, alongside the KTC proposed policy. The
results are for an out-of-sample period of 6 months in 2008.
B. Category-based Policies
As discussed in Section 5, OPTN policymakers have proposed policies in which patients and/or
organs are categorized into di"erent groups according to some criteria. Then, specific groups
receive priority in the allocation of kidneys. For instance, a proposal presented in OPTNKTC
(2007) suggests to categorize patients in 5 di"erent groups according to their expected life year
gains (LYFT): top 20% goes to the first group, bottom 20% goes to the last group, etc. Similarly,
organs are categorized according to their quality (DPI). In the allocation then, group 1 patients
are given priority for group 1 organs, groups 2 patients are given priority for group 2 organs and
so on. In this section we illustrate how one can use a modified version of the framework developed
in Section 3 to decide how one should partition patients and/or organs to such groups.
Suppose we want to design a policy that categorizes patients and organs into groups A and
B, according to their (average) LYFT and DPI scores. Specifically, the top q% of patients are
categorized into group A and the remaining into group B, where q is a policy parameter that needs
to be determined. Similarly we categorize the top q% of organs into group A and the remaining
into group B. Then, once an organ of group A is procured, patients from group A have priority
over group B patients. Patients are then ranked by the time they have spent on dialysis (DT).
If q = 0, the allocation policy is essentially a first-come first-serve policy (FCFS), with respect
to dialysis time. As q increases and we depart from a pure FCFS policy, more emphasis is given
to e!ciency as high quality organs are first o"ered to patients who are likely to benefit more from
them (in terms of life year gains). Thus, one expects higher LYFT gains. As q approaches 100
however, we again recover FCFS. Below we discuss a way of guiding the selection of q based on our
33
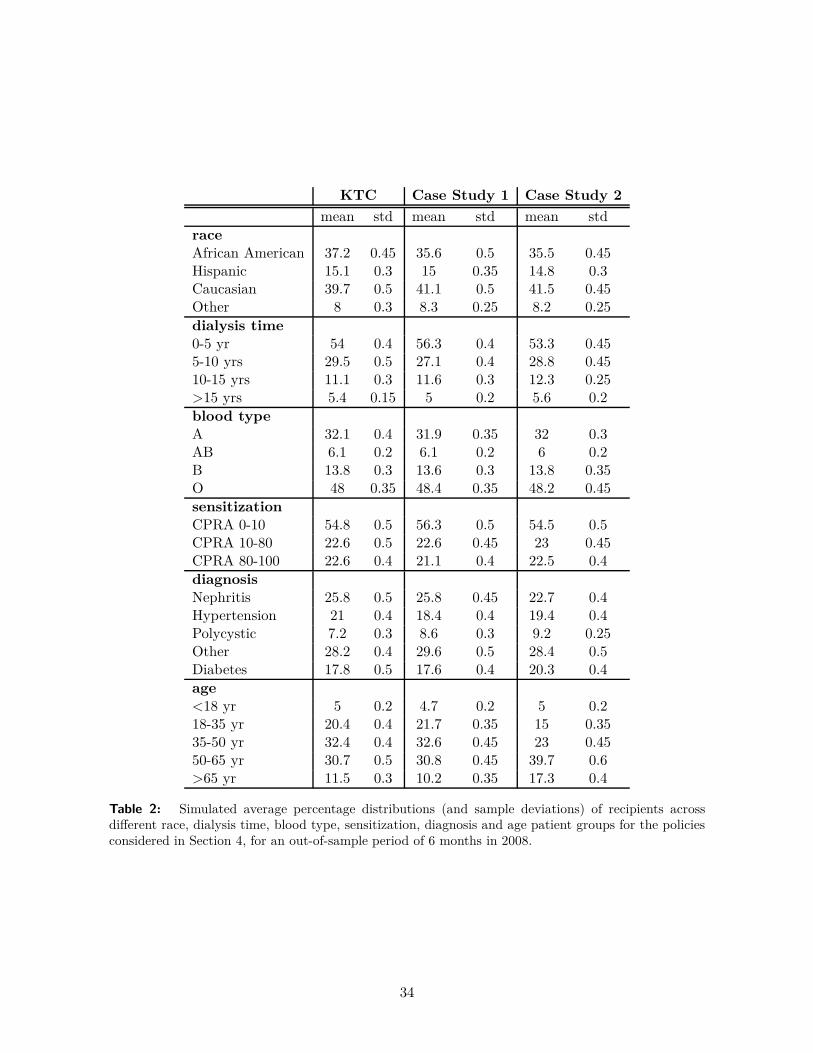
KTC Case Study 1 Case Study 2
mean std mean std mean stdraceAfrican American 37.2 0.45 35.6 0.5 35.5 0.45Hispanic 15.1 0.3 15 0.35 14.8 0.3Caucasian 39.7 0.5 41.1 0.5 41.5 0.45Other 8 0.3 8.3 0.25 8.2 0.25dialysis time0-5 yr 54 0.4 56.3 0.4 53.3 0.455-10 yrs 29.5 0.5 27.1 0.4 28.8 0.4510-15 yrs 11.1 0.3 11.6 0.3 12.3 0.25>15 yrs 5.4 0.15 5 0.2 5.6 0.2blood typeA 32.1 0.4 31.9 0.35 32 0.3AB 6.1 0.2 6.1 0.2 6 0.2B 13.8 0.3 13.6 0.3 13.8 0.35O 48 0.35 48.4 0.35 48.2 0.45sensitizationCPRA 0-10 54.8 0.5 56.3 0.5 54.5 0.5CPRA 10-80 22.6 0.5 22.6 0.45 23 0.45CPRA 80-100 22.6 0.4 21.1 0.4 22.5 0.4diagnosisNephritis 25.8 0.5 25.8 0.45 22.7 0.4Hypertension 21 0.4 18.4 0.4 19.4 0.4Polycystic 7.2 0.3 8.6 0.3 9.2 0.25Other 28.2 0.4 29.6 0.5 28.4 0.5Diabetes 17.8 0.5 17.6 0.4 20.3 0.4age<18 yr 5 0.2 4.7 0.2 5 0.218-35 yr 20.4 0.4 21.7 0.35 15 0.3535-50 yr 32.4 0.4 32.6 0.45 23 0.4550-65 yr 30.7 0.5 30.8 0.45 39.7 0.6>65 yr 11.5 0.3 10.2 0.35 17.3 0.4
Table 2: Simulated average percentage distributions (and sample deviations) of recipients acrossdi"erent race, dialysis time, blood type, sensitization, diagnosis and age patient groups for the policiesconsidered in Section 4, for an out-of-sample period of 6 months in 2008.
34
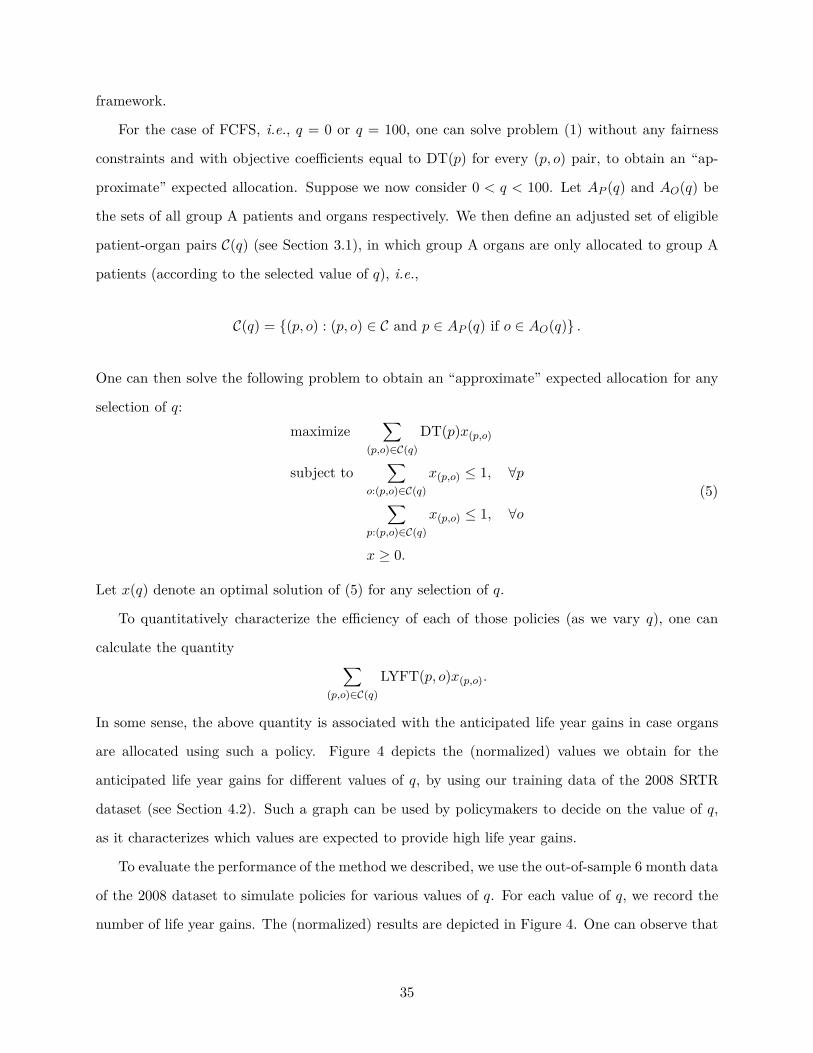
framework.
For the case of FCFS, i.e., q = 0 or q = 100, one can solve problem (1) without any fairness
constraints and with objective coe!cients equal to DT(p) for every (p, o) pair, to obtain an “ap-
proximate” expected allocation. Suppose we now consider 0 < q < 100. Let AP (q) and AO(q) be
the sets of all group A patients and organs respectively. We then define an adjusted set of eligible
patient-organ pairs C(q) (see Section 3.1), in which group A organs are only allocated to group A
patients (according to the selected value of q), i.e.,
C(q) = {(p, o) : (p, o) % C and p % AP (q) if o % AO(q)} .
One can then solve the following problem to obtain an “approximate” expected allocation for any
selection of q:
maximize!
(p,o)!C(q)
DT(p)x(p,o)
subject to!
o:(p,o)!C(q)
x(p,o) $ 1, 'p
!
p:(p,o)!C(q)
x(p,o) $ 1, 'o
x # 0.
(5)
Let x(q) denote an optimal solution of (5) for any selection of q.
To quantitatively characterize the e!ciency of each of those policies (as we vary q), one can
calculate the quantity!
(p,o)!C(q)
LYFT(p, o)x(p,o).
In some sense, the above quantity is associated with the anticipated life year gains in case organs
are allocated using such a policy. Figure 4 depicts the (normalized) values we obtain for the
anticipated life year gains for di"erent values of q, by using our training data of the 2008 SRTR
dataset (see Section 4.2). Such a graph can be used by policymakers to decide on the value of q,
as it characterizes which values are expected to provide high life year gains.
To evaluate the performance of the method we described, we use the out-of-sample 6 month data
of the 2008 dataset to simulate policies for various values of q. For each value of q, we record the
number of life year gains. The (normalized) results are depicted in Figure 4. One can observe that
35
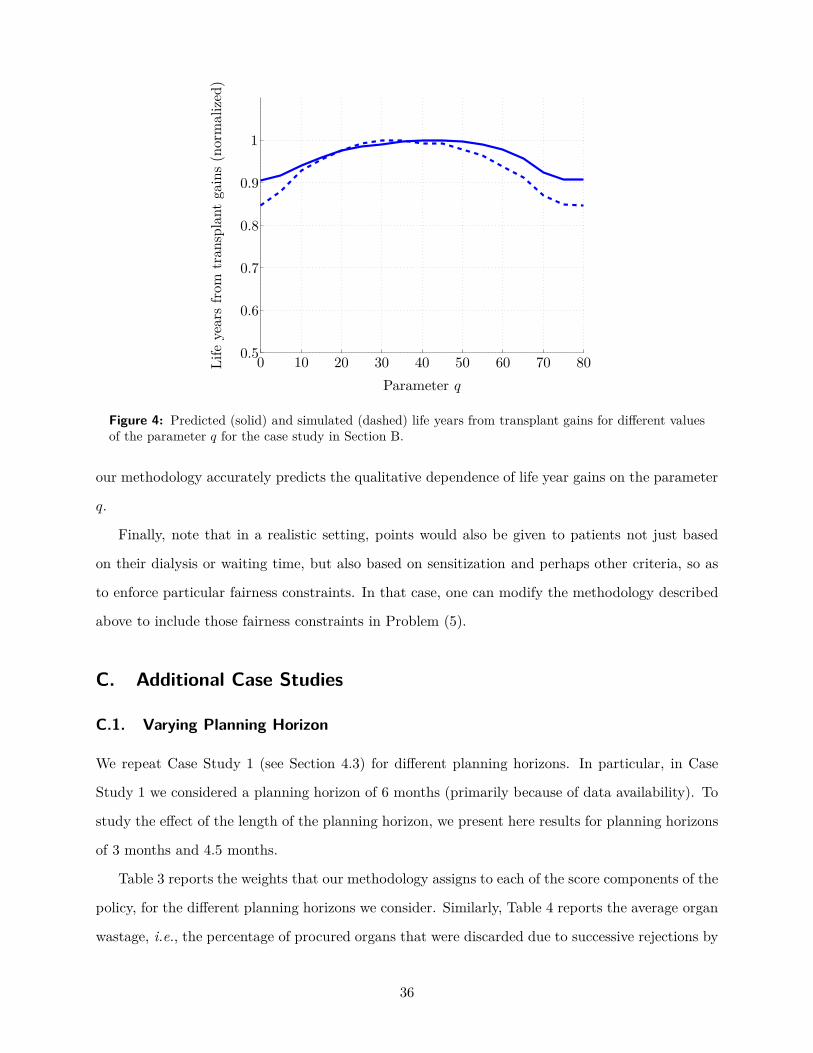
Parameter q
Lif
eye
ars
from
tran
spla
ntga
ins
(nor
mal
ized
)
0.5
0.6
0.7
0.8
0.9
1
0 10 20 30 40 50 60 70 80
Figure 4: Predicted (solid) and simulated (dashed) life years from transplant gains for di"erent valuesof the parameter q for the case study in Section B.
our methodology accurately predicts the qualitative dependence of life year gains on the parameter
q.
Finally, note that in a realistic setting, points would also be given to patients not just based
on their dialysis or waiting time, but also based on sensitization and perhaps other criteria, so as
to enforce particular fairness constraints. In that case, one can modify the methodology described
above to include those fairness constraints in Problem (5).
C. Additional Case Studies
C.1. Varying Planning Horizon
We repeat Case Study 1 (see Section 4.3) for di"erent planning horizons. In particular, in Case
Study 1 we considered a planning horizon of 6 months (primarily because of data availability). To
study the e"ect of the length of the planning horizon, we present here results for planning horizons
of 3 months and 4.5 months.
Table 3 reports the weights that our methodology assigns to each of the score components of the
policy, for the di"erent planning horizons we consider. Similarly, Table 4 reports the average organ
wastage, i.e., the percentage of procured organs that were discarded due to successive rejections by
36

3 months 4.5 months 6 months
points per lyft 1 1 1points per year on dialysis 0-5 0.6 0.65 0.65points per year on dialysis 5-10 0.9 0.95 1points per year on dialysis 10-15 0.1 0.15 0.2points per year cpra score 0.08 0.08 0.08points if aged above 50 0.5 0.5 0.5
Table 3: Output weights for the policies designed as in Case Study 1 in Section 4.3, for di"erent planninghorizons; see Section C.1.
KTC policy 3 months 4.5 months 6 months
organ wastage (std) 14.6% (0.3%) 22.2% (0.4%) 15% (0.3%) 14.5% (0.3%)avg lyft (std) 5.9 (0.03) 6.48 (0.06) 6.38 (0.04) 6.35 (0.04)
Table 4: Simulation results for the KTC policy and policies designed as in Case Study 1 in Section 4.3,for di"erent planning horizons; see Section C.1.
patients, and the average life years from transplant. Finally, the distributions of recipients among
di"erent groups are depicted in Figure 5 and reported in Table 5.
37

Percentage of transplant recipients
<18 yr
18-35 yr
35-50 yr
50-65 yr
>65 yr
Nephritis
Hypertension
Polycystic
Other
Diabetes
CPRA 0-10
CPRA 10-80
CPRA 80-100
A
AB
B
O
<5 yr
5-10 yr
10-15 yr
>15 yr
African American
Hispanic
Caucasian
Other
0 20 40 60
Figure 5: Simulated average percentage distributions of recipients across di"erent race, dialysis time,blood type, sensitization, diagnosis and age patient groups for the policies designed in Section C.1, fordi"erent planning horizons: 3 months (green) and 4.5 months (red). The target distributions of theKTC policy are also depicted (blue). The results are for out-of-sample periods of 3 (or 4.5) months in2008.
38

KTC 3 months 4.5 months
mean std mean std mean stdraceAfrican American 37.2 0.45 34.9 0.75 35.5 0.5Hispanic 15.1 0.3 15.4 0.5 15.3 0.35Caucasian 39.7 0.5 41.2 0.8 41.1 0.6Other 8 0.3 8.5 0.4 8.1 0.3dialysis time0-5 yr 54 0.4 55.9 0.75 55.8 0.65-10 yrs 29.5 0.5 26.5 0.75 27 0.510-15 yrs 11.1 0.3 12.3 0.5 12 0.4>15 yrs 5.4 0.15 5.3 0.3 5.2 0.25blood typeA 32.1 0.4 32.6 0.6 32.2 0.45AB 6.1 0.2 5.6 0.35 6 0.25B 13.8 0.3 13.6 0.5 13.5 0.35O 48 0.35 48.2 0.6 48.3 0.45sensitizationCPRA 0-10 54.8 0.5 55.9 0.9 55.8 0.6CPRA 10-80 22.6 0.5 22.9 0.75 22.8 0.55CPRA 80-100 22.6 0.4 21.2 0.75 21.4 0.45diagnosisNephritis 25.8 0.5 25.5 0.75 25.8 0.55Hypertension 21 0.4 17.7 0.75 18.1 0.45Polycystic 7.2 0.3 8.6 0.4 8.6 0.35Other 28.2 0.4 31.4 0.75 30.2 0.5Diabetes 17.8 0.5 16.8 0.65 17.3 0.5age<18 yr 5 0.2 5 0.3 4.7 0.218-35 yr 20.4 0.4 22.8 0.6 22.1 0.4535-50 yr 32.4 0.4 32.7 0.8 32.9 0.650-65 yr 30.7 0.5 29.5 0.75 30.3 0.55>65 yr 11.5 0.3 10 0.5 10 0.35
Table 5: Simulated average percentage distributions (and sample deviations) of recipients acrossdi"erent race, dialysis time, blood type, sensitization, diagnosis and age patient groups for the policiesconsidered in Section C.1, for di"erent planning horizons.
39