fairness and redistribution - mit opencourseware. alesina and g.m. angeletos: fairness and...
TRANSCRIPT

Fairness and Redistribution
Alberto AlesinaHarvard University, NBER and CEPR
George-Marios AngeletosMIT and NBER

MOTIVATION / INTRODUCTION
S Inequality much higher in the United States than in Europe
... yet, redistribution much lower in the United States than in Europe
S Perhaps small differences in (unobserved) fundamentals
... yet, large differences in perceptions, attitudes, and outcomes
S People concerned about fairness, not just equality!
A. Alesina and G.M. Angeletos: Fairness and Redistribution p. 2

Figure 1 Reproduced from Alesina, Gleaser and Sacerdote (2001). This scatterplot illustrates the positive cross-country correlation between the percentage of GDP allocated to social spending and the fraction of respondents to the World Value Survey who believe that luck determines income.
.2 .4 .6 .8
0
5
10
15
20
U.S.A
United Kingdom
Austria
Belgium
Denmark
France
GermanyItaly
Netherlands
Norw ay
Sw eden
Sw itzerlandCanadaJapan
Finland
Iceland
Ireland
Portugal
Spain
Turkey
Australia
Argentina
Brazil
Chile
Dominican RepublicPeru
Uruguay
Venezuela
Philippines
soci
al sp
endi
ng a
s pe
rcen
tage
of G
DP
20%
15%
10%
5%
0
20% 40% 60% 80%
percentage who believe that luck determines income
Courtesy of Alberto Alesina, George_Marios Angeletos, and the American Economic Association. Used with permission.

THIS PAPER
S Evidence suggests that
gov policies � F fairness of econ outcomes
S But, why do beliefs about fairness differ so much across countries?
S Who is right, the Americans who think that effort determines success,
or the Europeans who think that it is mostly luck?
A. Alesina and G.M. Angeletos: Fairness and Redistribution p. 4

THIS PAPER
S Evidence suggests that
gov policies � F fairness of econ outcomes
S But, why do beliefs about fairness differ so much across countries?
S Who is right, the Americans who think that effort determines success,
or the Europeans who think that it is mostly luck?
S Beliefs are endogenous
fairness in equilibrium � G gov policies
A. Alesina and G.M. Angeletos: Fairness and Redistribution p. 5

MAIN RESULT
interaction between redistributive policies and fairness
¶ ¶
a politico-economic complementarity
¶ ¶
amplifies the effect of exogenous differences
or even leads tomultiple equilibria
A. Alesina and G.M. Angeletos: Fairness and Redistribution p. 6

LAYOUT
1. Introduction
2. Evidence
inequality – redistribution – fairness
3. Basic Model
static economy – multiple equilibria
4. History Dependence
dynamic economy – multiple steady states
5. Corruption and Rent-Seeking
reinterpreting luck – novel multiplicity
6. Concluding Remarks
A. Alesina and G.M. Angeletos: Fairness and Redistribution p. 7

Table 1 Effect of belief that luck determines income on aggregate social spending (cross-country data)
Source: Total social spending is social spending as a percentage of GDP, from Persson and Tebellini (2000); original source: IMF. Majoritarian, presidential, and age structure are from Persson and Tabellini (2002). Ethnic fractionalization is from Alesina et al (2002). Mean belief that luck determines income is constructed using World Value Survey data for 1981-97 from the Institute for Social Research, University of Michigan. This variable corresponds to the response to the following question: “In the long run, hard work usually brings a better life. Or, hard work does not generally bring success; it’s more a matter of luck and connections.” The answers are coded 1 to 10. We recoded on a scale 0 to 1, with 1 indicating the strongest belief in luck. Robust t statistics in parentheses. * significant at 10%; ** significant at 5%; *** significant at 1%.
Dependent variable: Social spending as percent of GDP
1 2 3 4
Mean belief that luck determines income
32.728*** (2.925)
32.272*** (3.064)
36.430*** (3.305)
31.782** (2.521)
Gini coefficient -0.306*
(1.724) -0.238* (1.739)
-0.115 (0.613)
GDP per capita 3.148
(1.348) 4.754
(1.548)
Majoritarian 0.493
(0.184) 0.031
(0.011)
Presidential -4.24
(1.392)
Latin America -6.950*** (3.887)
-4.323 (1.472)
-2.992 (0.941)
0.413 (0.098)
Asia -9.244*** (6.684)
-6.075** (2.153)
-0.808 (0.142)
4.657 (0.618)
Constant -3.088 (0.590)
7.907 (1.396)
-25.207 (1.152)
-41.401 (1.425)
Observations Adjusted R-squared
29 0.431
26 0.494
26 0.495
26 0.496
Courtesy of Alberto Alesina, George_Marios Angeletos, and the American Economic Association. Used with permission.

Table 2 The effect of belief that luck determines income on individual political orientation (individual data)
Dependent variable: Being left on the political spectrum
1 2 3
Individual belief that luck determines income
0.541*** (3.69)
0.607***
(3.78)
Income -0.01*** (7.20)
-0.009*** (3.31)
-0.009*** (3.88)
Years of education -0.004***
(3.79) -0.002 (0.74)
0.000 (0.07)
City population 0.01*** (7.43)
0.01***
(4.29) 0.009*** (4.40)
White 0.036 (4.83)
0.051***
(3.13) 0.033**
(2.11)
Married -0.026***
(3.22) -0.03*** (2.97)
-0.032***
(3.11)
No. of children -0.009***
(3.63) -0.01***
(3.09) -0.013***
(3.59)
Female -0.044***
(6.93) -0.043***
(3.43) -0.039***
(3.39)
US resident -0.125*** (12.14)
-0.096*** (3.31)
-0.051 (1.37)
Age group 18-24 0.11***
(6.19) 0.078***
(3.41) 0.007*** (3.11)
Age group 25-34 0.131***
(11.73) 0.116***
(7.23) 0.114*** (7.00)
Age group 35-44 0.126***
(12.03) 0.117***
(8.96) 0.12***
(9.27)
Age group 45-54 0.085***
(7.98) 0.081*** (6.37)
0.08***
(6.03)
Age group 55-64 0.039*** (3.55)
0.038*** (3.25)
0.037*** (3.00)
Constant 0.347*** (16.15)
0.045 (0.62)
0.218 (1.64)
Observations 20269 16478 14998 R-squared 0.03 0.03 0.04
Source: The dependent variable is constructed using data from the World Value Survey. It is a 0 to 1 indicator for whether the respondent classifies himself/herself as being on the left of the political spectrum. The question is formulated as follows: “In political matters, people talk of left and right. How would you place your views on this scale, generally speaking?” The respondent is given a scale 1 to 10, 1 being the most leftist. We classified as leftist anyone who answered with a score of 5 or below. All other individual characteristics are also from World Value Survey. Absolute value of t statistics in parentheses. * significant at 10%; ** significant at 5%; *** significant at 1%.
Courtesy of Alberto Alesina, George_Marios Angeletos, and the American Economic Association. Used with permission.
EXPERIMENTAL EVIDENCE
S Ferh and Schmidt (2001) etc:
dictator games� altruism
ultimatum games� negative reciprocity
gift-exchange games� positive reciprocity
public-good games� cooperation on punishment
S Hoffman and Spitzer (1985), Hoffman et al (1998), Ball et al (1996), Clark (1998):
outcomes sensitive on whether role/status is random or earned
redistribution sensitive on whether initial incomes random or earned
S Psychologists, sociologist, political scientists:
belief in a just world, demand for fairness
“one should deserve what he gets, and get what he deserves”
A. Alesina and G.M. Angeletos: Fairness and Redistribution p. 9

BASIC MODEL
S No intergenerational links (static economy)
S Large number of agents �i � ¡0,1¢
S Heterogeneity in willingness to work �*i or talent �Ai
� justified variation in income
S Heterogeneity in luck �1i
� unjustified variation in income
S Utility from both own consumption �ci and fairness of economic outcomes �(
S Government � median voter
A. Alesina and G.M. Angeletos: Fairness and Redistribution p. 10

INCOME AND TIMING
S Pre-tax income or wealth:
yi � Ai¡)ki � �1 " ) ei ¢ � 1i
S Two periods of life
born with given Ai,*i and 1i1st period decide investment ki (ex ante)
vote on tax/redistribution policy A
2nd period decide effort ei (ex post)
consume net-of-tax income and die
A. Alesina and G.M. Angeletos: Fairness and Redistribution p. 11

PREFERENCES AND BUDGETS
S Preferences
Ui � ui " + (
ui � utility from own choices (private good)
ui � ui� 1ci,k ) 2 1") 2i,ei � ci " * 2 ki � 2 eii
( � disutility from social injustice (public good)
A. Alesina and G.M. Angeletos: Fairness and Redistribution p. 12

PREFERENCES AND BUDGETS
S Preferences
Ui � ui " + (
ui � utility from own choices (private good)
1u � u �c ,k ,e � c " ) k2 � 1") e2i i i i i i * 2 i 2 ii
( � disutility from social injustice (public good)
S Household and government budgets
ci � �1 " A yi � G
G � A ; yii
A. Alesina and G.M. Angeletos: Fairness and Redistribution p. 13

FAIR OUTCOMES AND SOCIAL INJUSTICE
S Fair or ideal outcomes§ §c i q y i q Ai¡)ki � �1 " ) ei ¢ � yi " 1i
§ §ui q u�c i,ki,ei
S Common measure of social injustice
( q ; § §¡u " u ¢2 � ; ¡c " c ¢2i i i ii i
A. Alesina and G.M. Angeletos: Fairness and Redistribution p. 14

FAIR OUTCOMES AND SOCIAL INJUSTICE
S Fair or ideal outcomes§ §c i q y i q Ai¡)ki � �1 " ) ei ¢ � yi " 1i
§ §ui q u�c i,ki,ei
S Common measure of social injustice
( q ; §¡ui " ui ¢2 � ; §¡ci " c 2i ¢
i i
§S Assuming that y i and 1i are independent
( � A2 §Var�y i � �1 " A 2Var�1i
S If income distribution was exogenous and min( was the only policy goal
§ optimal1 " A Var�y� i tax decreases with
ªA Var�1i signal-to-noise ratio
A. Alesina and G.M. Angeletos: Fairness and Redistribution p. 15

INCOME DISTRIBUTION
S Optimal investment/effort choices
ki � �1 " Ae Ai*iei � �1 " A Ai*i
where Ae � expected, A � actual tax rate.
A. Alesina and G.M. Angeletos: Fairness and Redistribution p. 16

INCOME DISTRIBUTION
S Optimal investment/effort choices
ki � �1 " Ae Ai*iei � �1 " A Ai*i
where Ae � expected, A � actual tax rate.
S Fair and actual income§y i � *iA2 e
i ¡1 " )A " �1 " ) A¢
§yi � y i � 1i
S Equilibrium income distribution
§Var�y i @2 signal-to-noise ratio� ¡ e " �1 " 2
2 1 " )A ) A¢ ªVar�1i v decreases with tax distortion
where @2 � Var�*iA2i and v2 � Var�1i .
A. Alesina and G.M. Angeletos: Fairness and Redistribution p. 17

OPTIMAL REDISTRIBUTION
S The optimal tax
A � arg mAax¡median£Ui¤¢
® A � F Ae ; ),+,@,v, o � � " � �
where
q mean£*iA2i ¤ " median£*iA2i ¤
A. Alesina and G.M. Angeletos: Fairness and Redistribution p. 18

GENERAL EQUILIBRIUM
S A politico-economic equilibrium is a (stable) fixed point
A' � F A' ; � with FA � 1
S Fairness is necessary and sufficient for multiplicity:
� 0 � + ´ unique equilibrium with A' � 0
� 0 � + ´ unique equilibrium with A' � 0
+ � 0 ´ possiblymultiple equilibria with A' � 0
A. Alesina and G.M. Angeletos: Fairness and Redistribution p. 19

0 0.2 0.4 0.6 0.8 1
0
0.2
0.4
0.6
0.8
1
Figure 2 The figure depicts the relation between the tax rate that agents anticipate ex ante (horizontal axis), and the tax rate that the society finds optimal ex post (vertical axis). The solid curve represents an economy where the effect of luck is moderate as compared to talent and effort. An equilibrium corresponds to any intersection of this curve with the 45-degree line. There are two stable equilibria, one with low taxation, high inequality, and low injustice (US), and one with high taxation, low inequality, and high injustice (EU). The lower dashed line represents an economy where the effect of luck is very small, in which case only the low-tax regime survives. Finally, the upper dashed line represents an economy where luck dominates, in which case only the high-tax regime survives.
ex-ante anticipated policy IJe
ex-p
ost o
ptim
al p
olic
y IJ =
f(IJ e
)
US
EU
Courtesy of Alberto Alesina, George_Marios Angeletos, and the American Economic Association. Used with permission.

EXTENSION I: HISTORY DEPENDENCE
S Non-overlapping generations t � £. . . ,"1,0,1, . . .¤
S Each generation lives one period and chooses its own tax policy
S Altruistic intergenerational transfers (bequests, parental investment, etc)
A. Alesina and G.M. Angeletos: Fairness and Redistribution p. 21

EXTENSION I: HISTORY DEPENDENCE
S Non-overlapping generations t � £. . . ,"1,0,1, . . .¤
S Each generation lives one period and chooses its own tax policy
S Altruistic intergenerational transfers (bequests, parental investment, etc)
S Preferences
Uit � uit " +( t
ui � � 1ci 1")�ki ) " �ei 2t t t t*it
S Wealth and budgets
yit � kit"1 � Aiteit � 1it
cit � kit � �1 " At yit � Gt
G � A it t ; yt
i
A. Alesina and G.M. Angeletos: Fairness and Redistribution p. 22

SOCIAL INJUSTICE
S In the absence of redistribution
yit � kit"1 � Aiteit � 1i s"t i i s"t it � ! ) Ases �! ) 1s
stt stt
S Fair component of wealth
§y i q ! )s"t it Aises
stt
S Social injustice
( t � A2 § §tVar�y it � �1 " At 2Var�yit " y
it
S History £As¤stt matters
§Var�y it Var ! )s"t�s " A *is sAs§ � tt 1 i2
Var�yi " it y t Var ! )s"t1istt s
A. Alesina and G.M. Angeletos: Fairness and Redistribution p. 23
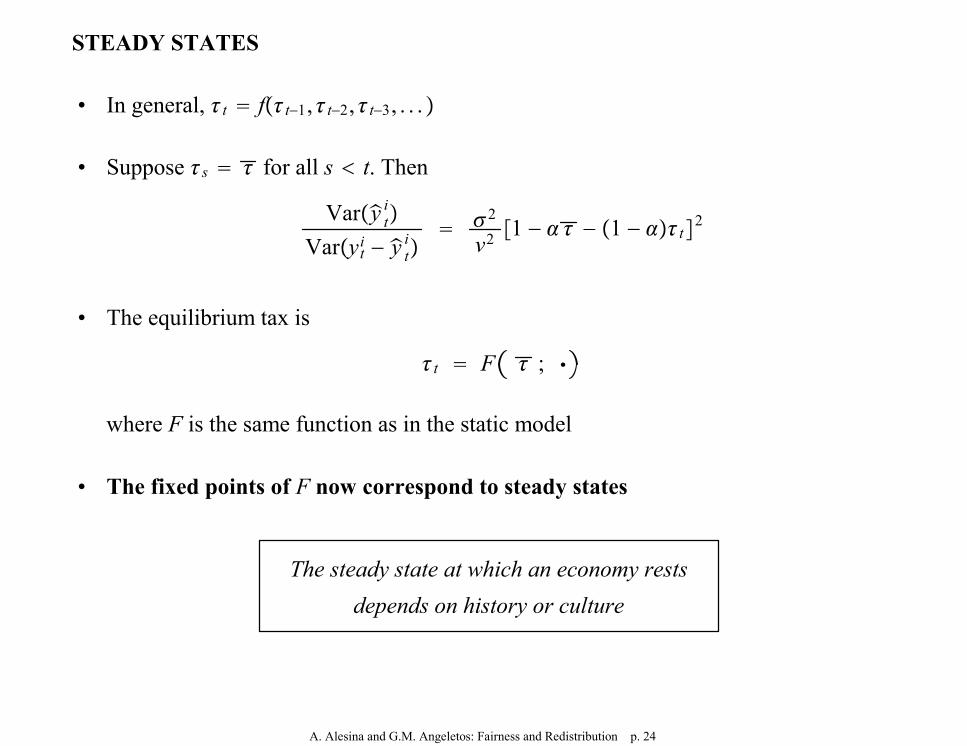
STEADY STATES
S In general, At � f�At"1,At"2,At"3, . . .
S Suppose As � A for all s � t. Then§Var�y it @2� ¡ " �§ 1 " ) A 1 " ) A t ¢2
Var�yi " y i 2t t v
S The equilibrium tax is
At � F A ; �
where F is the same function as in the static model
S The fixed points of F now correspond to steady states
The steady state at which an economy rests
depends on history or culture
A. Alesina and G.M. Angeletos: Fairness and Redistribution p. 24

EXTENSION II: CORRUPTION
S Agents can engage in two kinds of activities:
a productive activity (work)
a rent-seeking activity (corruption)
S Larger governments� more room for corruption
S Heterogeneity in both productive and rent-seeking abilities
S Fairness: income is justifiable only if from work
A. Alesina and G.M. Angeletos: Fairness and Redistribution p. 25

CORRUPTION
S Reinterpreting “luck” as corruption:
with a desire for fairness, multpiple steady states
S Novel result: self-sustained corruption
multpile steady states even without a desire for fairness,
provided skewness in distribution of rent-seeking abilities
S Contrust with Meltzer-Richard:
unique steady state if there is neither a concern for fairness
nor skewness in the distribution of rent-seeking abilities
A. Alesina and G.M. Angeletos: Fairness and Redistribution p. 26

CONCLUDING REMARKS
S Observed versus unobserved luck
S Importance of (new) fairness concept for both normative and positive analysis
S Endogenize preference for fairness
S Amador, Angeletos, Werning (2004): Mirrlees with two types of inequality
A. Alesina and G.M. Angeletos: Fairness and Redistribution p. 27

MIT OpenCourseWarehttp://ocw.mit.edu
14.05 Intermediate MacroeconomicsSpring 2013
For information about citing these materials or our Terms of Use, visit: http://ocw.mit.edu/terms.