failures related to heat treating operations - ge totten ... · pdf filefailures related to...
TRANSCRIPT

Failures Related toHeat Treating OperationsG.E. Totten, G.E. Totten & Associates, LLCM. Narazaki, Utsunomiya University (Japan)R.R. Blackwood and L.M. Jarvis, Tenaxol Inc.
101
Seconds1
0
100
800
200
300
400
500
600
700
Time
Tem
pera
ture
, °C
102
1 2 4 8Minutes
15 30 60
1 2 4 6 8 16 24
103 104 105
Hours
Martensite
Pearlite start
Pearlite endBainite endBainite start
A1
A3
Pearlite start
Pearlite end
Bainite end
Bainite start
A1
A3
Fig. 1 Time-temperature-transformation diagram of an unalloyed steel containing 0.45% C. Austenitization tempera-ture, 880 �C (1620 �F). The temperature A1 is where transformation to austenite begins, and temperature A3 is
where the transformation to austenite is complete. Courtesy of Verlag Stahlessen mbH Dusseldorf
HEAT TREATING—of all the various steelprocessing methods—has the greatest overallimpact on control of microstructure, properties,residual stresses, and dimensional control. Thisarticle provides an overview of the effects ofvarious material and process-related parameterson residual stress, distortion control, cracking,and microstructure/property relationships as theyrelate to various types of failure. The subjectsthat are discussed include:
● Phase transformations during heat treating● Metallurgical sources of stress and distortion
during heating and cooling● Effect of materials and quench-process design
on distortion and cracking● Quenchant selection● Effect of cooling characteristics on residual
stress and distortion● Methods of minimizing distortion● Tempering● Effect of the heat treatment process on micro-
structure/property-related failures, such ascracking
Phase Transformationduring Heating and Cooling
Steel Transformation
Properties such as hardness, strength, ductil-ity, and toughness are dependent on the micro-structural products that are present in steel. Thefirst step in the transformation process is to heatthe steel to its austenitizing temperature. Thesteel is then cooled rapidly to avoid the forma-tion of pearlite, which is a relatively soft trans-formation product; to maximize the formation ofmartensite, a relatively hard transformationproduct; and to achieve the desired as-quenchedhardness.
The most common transformational productsthat may be formed from austenite in quench-hardenable steels are, in order of formation with
decreasing cooling rate: martensite, bainite,pearlite, ferrite, and cementite. The formation ofthese products and the proportions of each aredependent on the time and temperature coolinghistory of the particular alloy and the elementalcomposition of that alloy. The transformationproducts formed are typically illustrated with theuse of transformation diagrams, which show thetemperature-time dependence of the microstruc-ture formation process for the alloy beingstudied. Two of the most commonly used trans-formation diagrams are time-temperature-trans-formation (TTT) and continuous cooling trans-formation (CCT) diagrams.
Time-temperature-transformation dia-grams, also called isothermal transformation di-
agrams, are developed by heating small samplesof steel to the temperature where austenite trans-formation structure is completely formed, that is,the austenitizing temperature (TA), and then rap-idly cooling to a temperature intermediate be-tween the austenitizing and the martensite start(Ms) temperature and then holding for a fixedperiod of time until the transformation is com-plete, at which point the transformation productsare determined. This is done repeatedly until aTTT diagram is constructed, such as that shownfor an unalloyed steel (American Iron and SteelInstitute, or AISI, 1045) in Fig. 1. Time-tem-perature-transformation diagrams can only beread along the isotherms. The temperature A1 iswhere transformation to austenite begins, and

1Seconds
0.70
100
800
200
300
400
500
600
700
Time
Tem
pera
ture
, °C
10
1 2 4 8Minutes
15 30 60
1 2 4 6 8 16 24
10260 103 105104
Hours
Martensite
Pearlite startPearlite end
A1
A3
Pearlite startPearlite end
A1
A3
Bainite endBainite end
Bainite startBainite start
Fig. 2 Continuous cooling transformation diagram of an unalloyed steel containing 0.45% C. Austenitization tem-perature, 880 �C (1620 �F). Courtesy of Verlag Stahlessen mbH Dusseldorf
(a)
(b)
(c)
Fig. 3 Crystal structures. (a) Austenite (fcc). (b) Ferrite(bcc). (c) Martensite (bct)
temperature A3 is where the transformation toaustenite is complete.
Continuous Cooling Transformation Dia-grams. Alternatively, samples of a given steelmay be continuously cooled at different specifiedrates, and the proportion of transformation prod-ucts formed after cooling to various temperaturesintermediate between the austenitizing tempera-ture and the Ms may be determined in order toconstruct a CCT diagram, such as the one shownfor an unalloyed carbon steel (AISI 1045) in Fig.2. Continuous cooling transformation curvesprovide data on the temperatures for each phasetransformation, the amount of transformationproduct obtained for a given cooling rate withtime, and the cooling rate necessary to obtainmartensite. The critical cooling rate is dictatedby the time required to avoid formation of pearl-ite for the particular steel being quenched. As ageneral rule, a quenchant must produce a coolingrate equivalent to, or faster than, that indicatedby the “nose” of the pearlite transformationcurve in order to maximize martensite transfor-mation product. Continuous cooling transfor-mation diagrams can only be read along thecurves of different cooling rates.
Caution: Although it is becoming increas-ingly common to see cooling curves (tempera-ture-time profiles) for different quenchants, suchas oil, water, air, and others, superimposed oneither TTT or CCT diagrams, this is not a rig-orously correct practice, and various errors areintroduced into such analysis due to the inher-ently different kinetics of cooling used to obtainthe TTT or CCT diagrams (described previously)versus the quenchants being represented. If acooling curve is to be superimposed on a trans-formation diagram, a CCT, not a TTT, diagramshould be used.
Metallurgical Crystal Structure
When steel is slowly cooled, it undergoes acrystal structure (size) change as it transformsfrom a less densely packed austenite (face-cen-tered cubic, or fcc) to a more densely packedbody-centered cubic (bcc) structure of ferrite. Atfaster cooling rates, the formation of ferrite issuppressed, and martensite, which is an even lessdensely packed body-centered tetragonal (bct)structure than austenite, is formed. Illustrationsof these crystal structures are provided in Fig. 3.This results in a volumetric expansion at the Ms
temperature, as shown in Fig. 4.Figure 5 shows that the crystal lattice of aus-
tenite expands with increasing carbon content(Ref 1). It has been reported that, typically, whena carbide-ferrite mixture is converted to marten-site, the resulting expansion due to increasingcarbon content is approximately 0.002 in./in. at0.25% C and 0.007 in./in. at 1.2% C (Ref 1). Thefractional increase in size when austenite is con-verted to martensite is approximately 0.014 in./in. for eutectoid compositions. This illustratesthe effect of carbon structure and steel transfor-mation on residual stresses and distortion lead-ing to dimensional changes.
Estimation of VolumetricChange due to Steel Transformation
In the previous discussion, it has been shownthat there are various microstructures possible onheating and cooling of steel, and that the poten-tial microstructural transformations that are pos-sible for a given steel are illustrated by their CCTor TTT diagrams. Furthermore, dimensionalchanges are possible, depending on the carbon
content and microstructural transformation prod-uct formed. Table 1 summarizes the atomic vol-umes of different microstructural components asa function of carbon content (Ref 2). Table 2provides an estimate of volumetric changes as afunction of carbon content for different metal-lurgical transformations (Ref 3, 4).
Volumetric expansion occurring as a result ofquenching can be estimated from (Ref 5):
DV/V � 100 � (100 � Vc � Va) � 1.68C� Va(�4.64 � 2.21C) (Eq 1)
where (DV/V) � 100 equals the percentagechange in volume, Vc equals the percentage byvolume of undissolved cementite, (100 � Vc �Va) equals the percentage by volume of marten-site, Va equals the percentage by volume of aus-tenite, and C equals the percentage by weight ofcarbon dissolved in austenite and martensite.
If the value of (DV/V) is known or can be com-puted, then internal stresses that are developedin a part due to temperature differences (DT)arising from either one-dimensional heating orcooling can be estimated from (Ref 6):
Failures Related to Heat Treating Operations / 193

00
3.59
1.020
1.000
1.040
1.060
1.0803.61
3.57
3.55
3.04
2.96
2.88
Carbon, wt%
Mar
tens
ite, A
Aus
teni
te, A
c/a
c/a
a
a
c
0.4 1.60.8 1.2
°
°
Fig. 5 Carbon content versus lattice parameters of (re-tained) austenite and martensite at room tem-
perature. a at the top of the graph is the lattice parameterof fcc austenite. a and c in the lower half of the graph arethe lattice parameters for tetragonal martensite. The ratioof c/a for martensite as a function of carbon content is alsogiven.
Ms
1000
0
1400 1600120010008006004002000
200 300 400 500 600 700 800 900
0.2
0.4
0.6
0.8
1.0
1.2
1.4
Line
ar e
xpan
sion
, %
Temperature, °C
Temperature, °F
Austenite
High-temperaturetransformation
Very slowcooling
Pearlite Rapidquenching
Martensiteforms Austenite
AusteniteAustenite
High-temperaturetransformation
Very slowcooling
Pearlite Rapidquenching
Martensiteforms
Fig. 4 Steel expansion and contraction on heating andcooling
Table 1 Atomic volumes of selectedmicrostructural constituents of ferrousalloys
Phase Apparent atomic volume, A3
Ferrite 11.789Cementite 12.769Ferrite � carbides 11.786 � 0.163 C(a)Pearlite 11.916Austenite 11.401 � 0.329 C(a)Martensite 11.789 � 0.370 C(a)
(a) C � % carbon
r � E • e � E • 1⁄3(DV/V) � E • � • DT (Eq 2)
where r is stress, e is strain, E (modulus of elas-ticity) � 2 � 105 N/mm2, and � (coefficient ofthermal expansion) � 1.2 � 10�5. Relative vol-ume changes due to phase transformation are il-lustrated in Fig. 6 (Ref 6).
Figure 7 shows that stresses, such as an in-crease in hydrostatic pressure, accelerate phasetransformations (Ref 7). This occurs whether thestresses are tensile or compressive and results inaccelerated austenite decomposition and in-creased Ms temperature. The strain of this pro-cess is often estimated as being equal to the vol-umetric expansion divided by 3 (Ref 8).Transformation plasticity is a process whereby astress affects linear strain. This is illustrated inFig. 8, where the effect of applied stress on mar-tensitic transformation strain is shown (Ref 8).Generally, the Ms temperature is increased bytensile stress and decreased by hydrostatic pres-sure. Figure 9 shows that stress exhibits verylarge effects on the start and stop times for pear-litic transformation (Ref 7).
Cooling and SteelMetallurgical Transformation
Cooling without Transformation (Ref 6, 7).If steel is cooled sufficiently fast, cooling is notaccompanied with microstructural transforma-tion changes. Under these conditions, the surfaceof the component cooled much more quicklythan the core at first, as illustrated in Fig. 10 (Ref
9). At this point, the specific volume in the coreis greater than that of the surface, and the reduc-tion in volume at the surface (due to lower tem-perature) is resisted by the greater volume in thecore, resulting in the surface being in tension andthe core in compression.
At the point of maximum temperature differ-ence between the surface and the core (point T),the core cools (shrinks) more quickly than thesurface, leading to an elastic dimensional reduc-tion of the surface until a point of stress conver-sion is obtained, at which point the surface is incompression relative to the core. After the cool-ing processes have been completed, the residualstress distribution between the surface and thecore, shown at the bottom right in Fig. 10 (Ref9), is obtained. If the surface stresses exceed thehot yield strength of the material, it plasticallydeforms, resulting in thermally induced dimen-sional changes.
Cooling with Transformation (Ref 6, 7).When steels that may undergo transformationalchanges are quenched, the possibility of the for-mation of both thermal and transformationalstresses must be considered. Figure 11 illustratesthree different examples of this process (Ref 8).
Example 1, illustrated in Fig. 11(a), occurswhen phase transformation of both the surfaceand the core occurs before the thermal stresseschange sign. Above the Ms transformation tem-perature, the stresses that are formed are thermal.On further cooling, the stresses in the core ex-ceed the yield strength, and plastic deformation(elongation) occurs. Subsequent martensitictransformation at the core provides a substantialstress component, due to volumetric increasesfrom martensitic phase transformation. Thiscauses the core to be in compression and the sur-face to be in tension simultaneously.
Example 2 (Fig. 11b) illustrates the case thatbegins after the thermal stresses change sign.The transformation-induced volume increase ofthe surface layer adds to the compressive stressesat the surface. Because the stresses are balanced,there is a corresponding increase in the tensilestresses in the core.
Example 3 is a case where, although the trans-formation of the core starts later, it finishes be-fore the surface (Fig. 11c). During the coolingprocess, the sign of the stresses changes threetimes. There are important consequenceswhether the core transforms before or after thestress reversal, because thermal stresses may becounteracted, and tensile surface residualstresses may result when the core transforms af-ter the surface and before the stress reversal (Ref8).
This is illustrated, in Fig. 12. If the steel trans-formation occurs before the thermal stress max-imum (sequence 4 in Fig. 12), the ferrite/pearlitestructure of a cylindrical test specimen is dis-torted into a barrel shape (Ref 6). If the trans-formation occurs after the thermal stress maxi-mum (sequence 1 in Fig. 12), the austenite ispressed into a barrel shape, followed by a volu-metric increase due to martensitic transforma-tion. This results in high tensile residual stresseson the surface. If the steel transformation occurssimultaneously with the maximum thermalstresses, transformation in the core occurs priorto surface transformation (sequence 3 in Fig. 12),and a barrel shape appears with high compres-sive stresses on the surface. If the surface istransformed prior to the core (sequence 2 in Fig.12), the transformational stresses decrease orpossibly even reverse the thermal stresses. If thisoccurs, a spool shape is formed.
These data show that the position of coolingcurves for both the surface and the core for thequenching process must be considered with theappropriate TTT curve for the steel of interest,and that there are numerous mixtures of thermaland transformational stresses possible. Table 3provides a summary of these processes (Ref 6).
In some steels, those with higher carbon con-tent and alloy steels, the Mf temperature is below32 �F (0 �C), which means that it is likely that atthe conclusion of the heat treating process thereis as much as 5 to 15% of austenite remaining(Ref 10). The amount of retained austenite ex-hibits significant effects on the magnitude ofcompressive stresses formed and, ultimately, on
194 / Manufacturing Aspects of Failure and Prevention

Spe
cific
vol
ume,
cm
3 /g
0.1200
0.122
0.124
0.126
0.128
0.130
0.132
Carbon content, %
0.4 2.00.8 1.2 1.6
Austenite
Ferrite + carbide
Retainedaustenite
Martensite
Austenite
Ferrite + carbide
Retainedaustenite
Martensite
Temperedmartensite
Fig. 6 Specific volume (DV/V) of carbon steels relativeto room temperature. Tempered martensite,
�200 �C (390 �F)
Table 2 Size changes during hardening of carbon tool steels
Reaction Volume change, % Dimensional change, in./in.
Spheroidite r austenite �4.64 � 2.21 (%C) 0.0155 � 0.0074 (%C)Austenite r martensite 4.64 � 0.53 (%C) 0.0155 � 0.00118 (%C)Spheroidite r martensite 1.68 (%C) 0.0056 (%C)Austenite r lower bainite (a) 4.64 � 1.43 (%C) 0.0156 � 0.0048 (%C)Spheroidite r lower bainite (a) 0.78 (%C) 0.0026 (%C)Austenite r aggregate of ferrite and cementite (b) 4.64 � 2.21 (%C) 0.0155 � 0.0074 (%C)Spheroidite r aggregate of ferrite and cementite (b) 0 0
(a) Lower bainite is assumed to be a mixture of ferrite and epsilon carbide. (b) Upper bainite and pearlite are assumed to be mixtures of ferrite andcementite.
dimensional changes to be expected. Some of thefactors affecting retaining austenite formation in-clude chemical composition (which dictates theMs temperature), quenching temperature,quenching cooling rates, austenitizing tempera-ture, grain size, and tempering.
Tempering
Steel parts are often tempered by reheating af-ter quench hardening to obtain specific values ofmechanical properties. Tempering of steel in-creases ductility and toughness of quench-hard-ened steel and also relieves quench stresses andensures dimensional stability. The temperingprocess involves heating hardened steel to sometemperature below the eutectoid temperature forthe purposes of decreasing hardness and increas-ing toughness. In general, the tempering processis divided into four stages, which are summa-rized in Table 4 (Ref 9). These include (Ref 11,12):
1. Tempering of martensite structure2. Transformation of retained austenite to mar-
tensite3. Tempering of the decomposition products of
martensite and at temperatures above 480 �C(900 �F)
4. Decomposition of retained austenite to mar-tensite
Figure 13 illustrates the effect of microstruc-tural variation during tempering on the volumechanges occurring during the tempering of hard-ened steel (Ref 9).
Figure 14 illustrates the effect of dimensionalvariation and retained austenite content of abearing steel (100Cr6) as a function of temperingtemperature (Ref 10). Tempering may also lead
to dimensional variation due to relaxation of re-sidual stresses and plastic deformation, which isdue to the temperature dependence of yieldstrength (Ref 11).
In addition to dimensional change by micro-structural variation, tempering may also lead todimensional variation due to relaxation of resid-ual stresses and plastic distortion, which is dueto the temperature dependence of yield strength(Ref 13). Figure 15 shows the distortion of roundsteel bars (200 mm, or 8 in., in diameter and 500mm, or 20 in., in length) by quenching and bystress relieving by tempering. A medium-carbonsteel bar (upper diagrams) and a hardenable steelbar (lower diagrams) are used in this experiment.Figures 15(a) and (d) are the results of quenchingfrom 650 �C (1200 �F) without phase transfor-mation. The distortion in each case is almost thesame, regardless of the different quenchants andthe different chemical compositions. These con-vex distortions are caused by nonuniform ther-mal contraction and resultant thermal stress dur-ing cooling. Figures 15(b) and (e) are the resultsof quenching from 850 �C (1560 �F) with phasetransformation. The distortion in Fig. 15(e) (har-denable steel) shows a convex configuration, butthe distortion in Fig. 15(b) (medium-carbon steelof poor hardenability) shows a configuration thatcombines convex and concave distortion. In ad-dition, water quenching has a greater effect ondistortion than oil quenching. Figures 15(c) and(f) show the configurations after tempering.These results show that tempering after quench-ing results in not only volumetric changes butalso convex distortions. Such distortions seem tobe related to relieving of residual stresses bytempering.
Figure 16 and 17 (Ref 14) show the exampleof stress relief by tempering. A solid cylinder,40 mm (1.6 in.) in diameter and 100 mm (4 in.)in length, was examined for analyses and exper-iments of tempering performed after waterquenching. Calculated residual stress distribu-tions after water quenching are illustrated in Fig.16. Open and solid circles in the figure corre-spond to measured stresses on the surface of thecylinder by x-ray diffraction technique. Residualstress distributions after tempering at 400 �C(750 �F) are shown in Fig. 17(a) and (b) for typ-ical elapsed times of 2 and 50 h, with measuredvalues on the surface. These results show thatthe stresses in all directions decrease withelapsed time in tempering.
The following are recommendations with re-spect to the tempering process (Ref 4):
● Generally, the higher the tempering tempera-ture, the greater the resulting ductility andtoughness. However, this is at the expense ofstrength and hardness.
● High-carbon steels that contain appreciableamounts of retained austenite undergo an in-crease in hardness when tempered at approx-imately 230 �C (450 �F) as a result of decom-position of the austenite.
● Steel tempered at approximately 260 �C (500�F) undergoes a loss of toughness (Fig. 18)that is associated with the formation of car-bide films around prior martensite plates.
● Alloy steels undergo temper brittleness or areduction in toughness that occurs when thesteel is tempered in (or slowly cooledthrough) the temperature range of 510 to 593�C (950 to 1100 �F). This phenomenon doesnot occur in plain carbon steels, but the de-gree of embrittlement is enhanced by nickel,manganese, and chromium content. Temper-ing should be carried out below this range forsteels susceptible to this embrittlement orabove the range, followed by rapid quenchingthrough the range. Molybdenum additionsminimize the susceptibility of steels to thisform of embrittlement.
● Highly alloyed steels, for example, high-speed steels, many contain large amounts ofretained austenite that is stable during tem-pering but transforms to brittle martensite oncooling from tempering. A second temper isthen necessary to temper this brittle second-ary martensite.
Metallurgical Sources ofStress and Distortion duringReheating and Quenching
Basic Distortion Mechanism. Shape andvolume changes during heating and cooling canbe attributed to three fundamental causes (Ref15):
● Residual stresses that cause shape changewhen they exceed material yield strength.This occurs on heating when the strengthproperties decline.
Failures Related to Heat Treating Operations / 195

00
1
3
2
Temperature, °CS
trai
n (∆
L/L o
), %
100 200 300
285 MPa
209 MPa
107 MPa
18 MPa
285 MPa
209 MPa
107 MPa
18 MPa
Fig. 8 Dilatometer curves for a 0.6% carbon steel(60NCD11) for different applied stresses
10Time, s
01
100
200
300
400
500
600
700
800
900
1000
102 103 104 105
Tem
pera
ture
, °C
Ms = 1 atm
1 atm
F.P. = 12 kbarF.P. = 23 kbar
Ms = 12 kbar
Ms = 23 kbar
B = 1 atm
B = 12 kbar
B = 23 kbar
Ms (1 atm)
1 atm
F.P. (12 kbar)F.P. (23 kbar)
Ms (12 kbar)
Ms (23 kbar)
B (1 atm)
B (12 kbar)
B (23 kbar)
Fig. 7 Effect of hydrostatic pressure on the transformation kinetics of 50CV4 steel. B, bainite; F. P., ferrite-pearlitetransformation; Ms, martensite start temperature. Source: Ref 7
Tim
e (
t),
s
t F
t D
Tensile stress (σ), MPa
00
100
200
20 40 60 80
Fig. 9 Effect of tensile stress on pearlite transformationstarting and ending times. Isothermal transfor-
mation at 673�C (1243 �F), eutectoid steel. The tD and tFtimes are transformation starting and ending times, respec-tively.
● Stresses caused by differential expansion dueto thermal gradients. These stresses increasewith the thermal gradient and cause plasticdeformation as the yield strength is exceeded.
● Volume changes due to transformationalphase change. These volume changes are con-tained as residual stress systems until theyield strength is exceeded.
Relief of Residual Stresses. If a part haslocked-in residual stresses, these stresses can berelieved by heating the part until the locked-instresses exceed the strength of the material. Atypical stress-strain curve obtained from a ten-sion test is shown in Fig. 19 (Ref 15). Initialchanges in shape are elastic, but under increasedstress, they occur in the plastic zone and are per-manent. On heating, the stresses are graduallyrelieved by changes in the shape of the part dueto plastic flow. This is a continuous process, andas the temperature of the part is increased, thematerial yield stress decreases, as shown in Fig.20 (Ref 16). It is a function not only of tem-perature but also of time, because the materialcreeps under lower applied stresses. It is appar-ent that the stresses can never be reduced to zero,because the material always possesses somelevel of yield strength below which residualstresses cannot be reduced.
Volume Changes during Phase Transfor-mations. When a steel part is heated, it trans-forms to austenite, with an accompanying reduc-tion in volume, as shown in Fig. 21 (Ref 17).When it is quenched, the structure transformsfrom austenite to martensite, and its volume in-creases. If these volume changes cause stressesto be set up that are constrained within thestrength of the material, a residual stress systemis created. If the stresses cannot be contained,then material movement occurs, which causescracking under extreme conditions. The expan-sion is related to the composition of the steel.
Figure 21 shows the relative volume increase oftwo steels as a function of austenitizing tem-perature and specimen dimensions.
While these physical changes are well known,the situation is made more complex when allthree events occur simultaneously. In addition,other events, such as heating rate, quenching,and inconsistent material composition, furthercomplicate the process.
When parts are heated during heat treatment,a thermal gradient exists across the cross sectionof the component. If a section is heated so thata portion of the component becomes hotter thanthe surrounding material, the hotter material ex-pands and occupies a greater volume than theadjacent material and is thus exposed to appliedstresses that cause a shape change when they ex-ceed material strength. These movements can berelated to heating rate and section thickness ofthe component.
Effect of Materials andProcess Design on Distortion
Quenchant selection and quenching condi-tions are critically important parameters inquench system design. For example, one studycompared the distortion obtained when a 0.4%medium-carbon plain steel bar 200 mm (8 in.) indiameter by 500 mm (20 in.) long is quenchedin water or oil from 680 �C (1260 �F) (Ref 18,19). The results, Fig. 22(a) and (c), show thatessentially equivalent variation in diameter andlength with both cooling processes was obtained,which was due to thermal strains within the steel.Interestingly, the well-known diameter varia-tions at the end of the bar, known as the “end-effect,” were observed, which is attributable toheat extraction from both the sides and ends ofthe bar.
If the same steel bars of the same dimensionsare heated to 850 �C (1560 �F) to austenitize thesteel and then quenched in water or oil, the re-sults shown in Fig. 22(b) and (d), respectively,were obtained (Ref 18, 19). Considerably greaterdimensional variation and lengthening of the bar(for the oil quench) was obtained due to boththermal and transformational strains with thesteel.
The dimensional changes of a 70 mm (2.75in.) steel (0.15% C, 1% Mn, 0.75% Cr, 0.85%Ni) cube were modeled after austenitizing andthen quenching in water and oil (Ref 18, 20). Theresults of this work are shown in Fig. 23. As seenin the figure, the edges and faces shrink (becom-ing concave), and the effects are greater when
196 / Manufacturing Aspects of Failure and Prevention

(a) (b) (c)
Str
ess,
σz
Tem
pera
ture
TA
t u t u t u
Ms
TA
Ms
TA
Ms
RT
Core Core Core
+
−
Surface SurfaceSurface Surface
Time
Thermal stress
Total stress
Surface Core
Time Time
Surface
Fig. 11 Comparison of thermal and transformational stresses for three different quenching conditions. See text fordetails. tu, time instant of stress reversal
00
500
1000
Tem
pera
ture
, °C
10
Center
Center
T
0
Time, s
1000100
Surface
Surface
Surface
Residual stress TensionTension
Compression SurfaceCenterCompression
00
A
B
B
C
Fig. 10 Development of thermal stresses within steel on cooling. T, time instant at maximum temperature difference;0, time instant of stress reversal; curve A, stress variation at the surface under elastic conditions. B and C are
actual thermal stress variations at the surface and the core under elastic-plastic conditions.
R
∆Tmax
∆Tmax UR UK
∆TmaxUR UK
∆Tmax URUK
∆TmaxUR UK
Tem
pera
ture
, °C
K
P
B
M1
1
2
3
4
Transformation for 2
2
Barrel Spool
3 4
log t, s(a)
(b) (c)
Fig. 12 Size change due to thermal changes and phasetransformation. K, core; R, surface
the steel is quenched in water than when it isquenched in oil.
There are various factors that can affect dis-tortion and growth of steel in heat treating. Theseinclude component design, steel grade and con-dition, machining, component support and load-ing, surface condition, heating and atmospherecontrol, retained austenite, and the quenchingprocess (Ref 21).
Component Design. One of the overwhelm-ing causes of steel cracking and unacceptabledistortion control is component design. Poor
component design promotes distortion andcracking by accentuating nonuniform and non-symmetrical heat transfer during heating andcooling. Component design characteristics thatare common to distortion and cracking problemsinclude (Ref 22, 23):
● Parts that are long, with thin cross sections.Long and thin parts are defined as thosegreater than L � 5d for water quenching, L� 8d for oil quenching, and L � 10d foraustempering, where L is the length of the
parts, and d is the thickness or diameter. Longand thin parts may be quenched using a sup-port mechanism, such as that illustrated inFig. 24.
● Parts that possess large cross-sectional area(A) and are thin (t), which are defined as A �50t.
Parts that exceed these dimensions often mustbe straightened or press quenched to maintaindimensional stability (Ref 23). If possible, ma-terials with sufficient hardenability should be oilor salt quenched. A schematic illustration of apress quenching system is provided in Fig. 25.
The following are additional guidelines (Ref4):
● Balance the areas of mass.● Avoid sharp corners and reentrant angles.● Avoid sharp corners between heavy and thin
sections.● Avoid single internal or external keys, key-
ways, or splines.● Provide adequate fillet or radius at the base
of gear teeth, splines, and serrations.● Do not have holes in direct line with the sharp
angles of cutouts.● Avoid a sharp corner at the bottom of small
openings, such as in drawing or piercing dies,because spalling or flaking is likely to resultat these points.
● Keep hubs of gears, cutters, and so on as nearthe same thickness as possible, because dish-ing is likely to occur.
Additional design considerations to reduce theprobability of distortion, cracking, and soft spotsinclude (Ref 4):
Failures Related to Heat Treating Operations / 197

Table 4 Metallurgical reactions occurring at various temperature ranges and relatedphysical changes of steel during tempering
Stage
Temperature range
Metallurgical reaction Expansion/contraction�C �F
1 0–200 32–392 Precipitation of e-carbide. Loss of tetragonality Contraction2 200–300 392–572 Decomposition of retained austenite Expansion3 230–350 446–662 e-carbides decompose to cementite Contraction4 350–700 662–1292 Precipitation of alloy carbides. Grain coarsening Expansion
Source: Ref 9
Incr
ease
in v
olum
e
1000 600 800 900
Tempering temperature, °C
200 300 400 500 700
Retained austeniteto bainite
Retained austeniteto martensite
Carbideprecipitation
Decomposition ofmartensite to
ferrite and cementite
Retained austeniteto bainite
Retained austeniteto martensite
Carbideprecipitation
Decomposition ofmartensite to
ferrite and cementite
Fig. 13 Effect of microstructural constitutional variation on volume changes during tempering
800 °C850 °C910 °C
Austenitizing temperature
Ret
aine
d au
sten
iteD
imen
sion
al a
ltera
tion
−0.4
0
0.4
−0.8
−1.2
−1.6
20
16
12
8
4
0220 240180RT
Tempering temperature, °C
Fig. 14 Dimensional variation and retained austenitecontent of 100Cr6 steel as a function of tem-
pering temperature
● Order stock large enough to allow for ma-chining to remove decarburized surfaces andsurface imperfections, such as laps andseams.
● Do not drill screw holes closer than 6.35 mm(0.25 in.) from edges of die blocks or largeparts, where possible. Cracking may beavoided by using steel that may be hardenedby using lower quench severity, or if possible,pack the bolt hole to reduce thermal stressesarising due to quenching.
● Avoid blind holes, if possible.● All parts should be designed with round cor-
ners and fillets wherever possible.● Use air-hardening or high-carbon (oil- and
air-hardening) tool steel on unbalanced andintricately shaped dies.
● Add extra holes, if possible, on heavy, un-balanced sections to allow for faster and moreuniform cooling when quenched.
● Do not machine knife blades to a sharp cut-ting edge before hardening.
● Avoid deep scratches and tool marks.● On long, delicate parallels, shafts, and so on,
rough out and have pieces annealed to removestresses before finish machining.
● Always use the grade or composition of steelmost suitable for the work that the part has toperform.
A well-designed part is the best ensuranceagainst breakage in hardening.
Design symmetry is also an important variableto minimize distortion. For example, the unsym-metrical gear design shown in the upper diagramof Fig. 26 typically may undergo distortion, asshown in the lower diagram of Fig. 26 (Ref 22).(The load on a gear tooth increases as a power
of 4.3 with the taper [Ref 22]). The solution tothe gear design problem shown in Fig. 26 is toprovide greater symmetry, as shown in Fig. 27.If this is not possible, press quenching or tooth-by-tooth induction hardening may be the best al-ternative (Ref 22, 23).
Another common design problem occurs withparts having holes, deep keyways, and grooves.One illustration of this problem is hardening ofa shaft over a lubrication cross hole, as illustratedin Fig. 28 (Ref 22). Preferred alternative designsare also shown in Fig. 28. If a radial cross holeis mandatory, the use of carburized steel with oilquenching would be preferred.
The distortion encountered when quenching anotched part, such as a shaft with a milled slot,is illustrated in Fig. 29 (Ref 23). In this case,nonuniform heat transfer results. The metalwithin the notch is affected by the shrinkage ofthe metal around it, due to slower cooling withinthe slot caused by vaporization of the quenchant.Therefore, on cooling, the metal on the side withthe shaft is “too short,” pulling the shaft out ofalignment. A general rule for solving suchquench distortion problems is that the “short sideis the hot side,” which means that the inside ofthe bowed metal was quenched more slowly thanthe opposite side (Ref 23).
Figure 30 provides an illustration of recom-mended design corrections that reduce the pos-sibility of quench-cracking (Ref 4). If it is un-avoidable that quench crack-sensitive designs beused, then two possible design modificationsshould be considered. The first is to consider atwo-piece assembly that is mechanically joined
Table 3 Size change and residual stress caused by heat treatment of prismatic parts
(DT)(a) (DV/V)(b)Dimensionaldependency (D�)(c) (rE)(d) Example
Change of microstructure Small �0 e1 � e11 � e111 0 0 Tempering, precipitationhardening, isotropicmaterial
Thermal stress Big 0 e1 � e11 � e111 �0 �0 Quenching of austeniticsteels
Thermal and transformationstress
Transformation R � K afterthermal stress maximum
Small �0 e1 � e11 � e111 0 k0 In air; full hardnesspenetration
Big k0 e1 � e11 � e111 �0 k0 In water; full hardnesspenetration
Transformation R before K afterthermal stress maximum
Big �0 e1 � e11 � e111 �0 �0 Medium hardness penetration
Transformation R before K afterthermal stress maximum
Big �0 e1 K e11 K e111 k0 K0 Shallow hardness penetration(shell hardening)
Transformation before R � Kthermal stress maximum
Small �0 e1 � e11 � e111 0 �0 Normalizing, quenchingwithout hardeningBig �0 e1 � e11 � e111 �0 �0
R, surface; K, core. (a) DT � (TK � TR). (b) DV/V, relative volume change. (c) Convexity De � ek � em; em, ek, dimensional change in middleof the plane. (d) rE, residual stress at the surface (remaining stress)
198 / Manufacturing Aspects of Failure and Prevention

−50
−100
−150
0
150
50
100
0 5 10
Radius (r ), mm
15 20
Str
ess
(σ),
kg/
mm
2
σzσθσr
Fig. 16 Stress distribution in a cylinder after quenching
Fig. 15 Deformation of medium-carbon and hardenable steel bars by quenching from below and above the transformation temperature and by stress relieving. lc, change of length;WQ, water quench; OQ, oil quench. (a) to (c) JIS S38C steel (0.38% C). (d) to (f) JIS SNCM 439 steel (0.39% C, 1.8% Ni, 0.8% Cr, 0.2% Mo). (a) and (d) Quenched from
650 �C (1200 �F). (b) and (e) Quenched from 850 �C (1560 �F). (c) and (f) Tempered at 650 �C (1200 �F)
(a)
−50
−100
−150
0
150
50
100
0 5 10
Radius (r ), mm
15 20
Str
ess
(σ),
kg/
mm
2
σzσθσr
(b)
−50
−100
−150
0
150
50
100
0 5 10
Radius (r ), mm
15 20
Str
ess
(σ),
kg/
mm
2
σzσθσr
T = 400 °Ct = 2 h
T = 400 °Ct = ∞
Fig. 17 Stress distribution in a cylinder after tempering. (a) t � 2 h. (b) Assume t � �.
or shrunk-fitted together. The second is to man-ufacture the part from steel that can be hardenedby martempering or by air cooling. These alter-native design strategies produce lower stress andminimize cracking.
Steel Grade and Condition. Although steelcracking is most often due to nonuniform heat-ing and cooling, material problems may be en-countered. Some typical material problems in-clude (Ref 22):
● The compositional tolerances should bechecked to ensure that the alloy is withinspecification.
● Some alloys are particularly problematic. Forexample, some steel grades must be waterquenched when the alloy composition is onthe low side of the specification limit. Con-
versely, if the alloy composition is on the highside, cracking is more common. Steel gradesthat exhibit this problem include: 1040, 1045,1536, 1541, 1137, 1141, and 1144. As a rule,steels with carbon contents and hardenabilitygreater than 1037 are difficult to water quench(Ref 22).
● Some steel grades with high manganese areprone to microsegregation of manganese,gross segregation of chromium, and thus areprone to cracking. These include 1340,1345, 1536, 1541, 4140, and 4150. If pos-sible, it is often a good choice to replacethe 4100 series with the 8600 series ofsteels (Ref 24).
● “Dirty” steels, those containing greater than0.05% S (such as 1141 and 1144), are moreprone to cracking. One reason for this is the
greater alloy segregation in dirty steels, lead-ing to alloy-rich and alloy-lean regions. An-other reason is that these steels typically havea greater number of surface seams, which actas stress raisers. Also, dirty steels and steelswith higher sulfur levels are often manufac-tured to coarse-grain practice for improvedmachinability; this also imparts greater brit-tleness and propensity for cracking.
● Decarburization of up to 0.06 mm (0.0025in.) per 1.6 mm (1/16 in.) diameter may bepresent.
It is well known that cracking propensity in-creases with carbon content. Therefore, the car-bon content of the steel is one of the determiningfactors for quenchant selection. Table 5 sum-marizes some average carbon-content concentra-
Failures Related to Heat Treating Operations / 199

Ultimatetensile
strength
Yieldstress
Ao
P
FractureNecking
Offset
Uniformelongation
PlasticElastic
Stress, σ = −−−−
Lo
L − LoStrain, ε = −−−−−−−
Fig. 19 Various features of a typical stress-strain curveobtained from a tension test
0
30
60
90
120
150
Impa
ct, f
t · lb
f
70
60
50
40
30Roc
kew
ell h
ardn
ess,
C
200 400 600 800As-quenched
Tempering temperature, °F
1450 °F
1550 °F
1500 °F
Fig. 18 The 260 to 315 �C (500 to 600 �F) impairmentin torsion toughness in very hard steels. Note:
Reduction in toughness is not detected by hardness mea-surements. Source: Ref 4
0.2
0
0.4
0.6
50 × 50 × 10 50 × 50 × 20
Specimen dimension, mm
50 × 50 × 50 50 × 50 × 250
760 °C90MnV8
145CrV6
800 °C
870 °C830 °C
Vol
ume
incr
ease
, %
Fig. 21 Volume increase of steels 90MnV8 and 145CrV6 as a function of austenitization temperature and specimendimensions
12001000800600400200
50
40
30
20
100.2%
pro
of s
tres
s, M
Pa
0.2%
pro
of s
tres
s, ts
i
00
400
800
200
600
Temperature, °C
Temperature, °F
100 700200 300 400 500 600
Low-alloy steel
Carbon-managanese steel
Creep-resistantaustenitic steel
Low-alloy steel
Carbon-manganese steel
Creep-resistantaustenitic steel
Fig. 20 Variation of yield strength with temperature for three generic classes of steel
tion limits for quenching steel into water, brine,or caustic (Ref 24).
Higher-carbon steels undergo greater expan-sion on hardening, and because the Ms tempera-ture decreases with carbon content, expansionthat does occur during martensitic transforma-tion does so at a lower temperature, where thecracking of the steel is more likely than distor-tion. Therefore, cracking is more likely whenhardening high-carbon steels than when heattreating low- or medium-carbon steels. As a ruleof thumb, plain carbon steels with less than0.35% C rarely crack on hardening, even undersevere quenching conditions (Ref 4). The carboncontent of a steel should never be greater thannecessary for the specific application of the part.
It is well known that regions containing highconcentrations of coarse carbide microstructureas a result of improper forging may become theinitiation point for subsequent quench cracking,particularly with parts of complex shape (Ref25). It is important to provide a sufficient forgingreduction ratio to allow the carbide formation tobecome fine and uniform (Ref 26).
Because part manufacture, such as gear pro-duction, often requires machining, the conditionof the steel that is going to be machined is crit-ically important. Some workers have recom-mended that normalized and subcritical annealedsteel is the ideal condition (Ref 21). Subcriticalannealing is performed to relieve stresses in-curred during normalization without softening orhomogenizing the steel. The subcritical anneal-ing process reduces the carbon content and alloycarbide content in the austenite, allowing theproduction of more lath martensite in the micro-structure, which provides higher fracture tough-ness and higher impact toughness (Ref 25).
Improper Steel Chemistry. Steel hardenabil-ity is determined by its chemistry. The quenchconditions required to obtain the desired prop-erties are a function of the hardenability. There-fore, if the steel chemistry is incorrect, the se-lected quench process conditions may, if too
severe, lead to cracking. Unfortunately, thisproblem is not uncommon.
An example of this problem is quench crack-ing that occurred in AISI 1070 steel bearing race-ways. Metallographic analysis confirmed thepresence of quench cracking. However, the steelchemistry (Table 6) was incorrect for a plainAISI 1070 steel (Ref 27). The higher-carbon,higher-hardenability steel with a high manga-nese content, which was found in this example,would be more susceptible to quench cracking,using the normally specified quenchant for the1070 steel bearing raceways.
Prior Steel Structure. The structure of thesteel prior to hardening, for example, extruded,cast, forged, cold formed, and so on, may en-hance the potential for cracking during thequench. Each as-formed structure requires a spe-cific time and temperature cycle to condition thematerial for proper hardening. For example, caststructures must be homogeneous, cold-formedstructures require normalization and annealing,and forged structures must be grain-refined bynormalization.
Cracking may be caused by microstructures,resulting in nonuniform heating or cooling. InFig. 31 (Ref 27), microstructures obtained onforged AISI 403 stainless steel valve stems ex-
200 / Manufacturing Aspects of Failure and Prevention

Oilquench
Waterquench
0.1 mm
0.3 mm
Change acrossmidsection (A-A)
Outer-facechange
A
A
A
A
Fig. 23 Dimensional changes in a 70 mm (2.75 in.)steel (0.15% C, 1% Mn, 0.75% Cr, 0.85% Ni)
bar after austenitizing and then quenching in water or oil(a)
0
+0.1
−0.1
0
+0.1
−0.1
0
+0.1
−0.1
0
+0.1
−0.1
250
Change in length: −0.17 mm
Change in length: −0.15 mm
WQ − change in length: +0.17 mm
OQ − change in length: +0.8 mm
WQ − change in length: −2.45 mm
Distance from end of barfirst into quench, mm
5000
680°C/water quench.No transformation.Thermal strain only.
Dia
met
er c
hang
e, m
m
(b)
250
Distance from end of barfirst into quench, mm
5000
Dia
met
er c
hang
e, m
m
(c)
250
Distance from end of barfirst into quench, mm
5000
Dia
met
er c
hang
e, m
m
(d)
250
Distance from end of barfirst into quench, mm
5000
Dia
met
er c
hang
e, m
m
850°C/quench.Thermal andtransformation strain.
Fig. 22 Dimensional variation of a medium-carbon (0.4%) steel bar (200 mm, or 8 in., diam � 500 mm, or 20 in.)after the indicated heat treatments. These bars were quenched vertically with one end down (marked “0” in
the figure). (a) and (c) show no transformation, thermal strain only after water quenching from 680 �C (1260 �F). (b) and(d) show thermal and transformation strains after quenching from 850 �C (1560 �C). OQ, oil quench; WQ, water quench
Fig. 24 Die quenching system. Courtesy of GleasonTooling Products Group
hibited longitudinal cracking after quenching.Microstructural analysis suggested that crackingwas caused by thermal stresses during forging orduring heating prior to forging. Figure 31 alsoshows a coarse-grain condition associated withhigh-temperature surface oxidation. Further ex-amination revealed evidence of high- and low-thermal oxidation within the crack profile. Thepresence of this condition suggests cracking oc-curred prior to or during forging.
Excessive overheating is called “burning,”which refers to incipient melting of low-meltingconstituents into liquid films that concentrateembrittling components in the grain boundaries,as illustrated in Fig. 32 (Ref 4). The problem ofthe brittle nature of these films is exacerbated byaccompanying void formation, which is causedby contraction shrinkage when the liquid filmcools. Although burning usually occurs duringrolling or forging, it may not be observed untilafter heat treatment.
A mixed-grain-size microstructure may beformed when a steel was heated in its coarseningrange during austenitization. The hardening re-sponse of this mixed microstructure, which is il-lustrated in Fig. 33, is unpredictable (Ref 4).
When the carbon content of a steel is greaterthan the eutectoid concentration, it is usuallyquenched from below the Accm temperature (thetemperature at which cementite completes solu-tion in austenite), resulting in the presence ofundissolved carbides just prior to quenching.This reduces the amount of retained austenitethat often accompanies excessive heating tem-
peratures. As is shown subsequently, problemsof increased distortion and cracking increasewith the retained austenite content. It is impor-tant that undissolved carbides be in the dispersedform of spheroids and not in the form of grain-boundary films, which produce a brittle structureafter tempering (Ref 4).
The steel austenitizing temperature is a com-promise between achieving rapid solution anddiffusion of carbon, and minimizing graingrowth. A fine-grained steel may be heated to atemperature for rapid austenitization with littledanger of grain growth. However, quenchedstructures formed from large austenite grains ex-hibit poor toughness and are crack sensitive. Thequench cracking illustrated in Fig. 34 occurredbecause of excessively large austenite grains dueto an excessively high austenitizing temperature(Ref 4).
The optimal austenitizing time is determinedby dividing the total time in the furnace betweenheating time (time necessary to bring the part tothe austenitizing temperature) and transforma-tion time (the time required to produce the de-sired microstructural transformation or to com-plete the desired diffusion process). Excessiveheating times to provide for transformation mayresult in undesirable grain growth.
Heating and Atmosphere Control. Local-ized overheating is particularly a potential prob-lem for inductively heated parts (Ref 28, 29).Subsequent quenching of the part leads toquench cracks at sharp corners and areas withsudden changes in cross-sectional area (stress
raisers). Cracking is due to increases of residualstresses at the stress raisers during the quenchingprocess. The solution to the problem is to in-crease the heating speed by increasing the powerdensity of the inductor. The temperature differ-ence across the heated zone is decreased by con-tinuous heating or scanning of several pistonstogether on a single bar (Ref 29).
For heat treating problems related to furnacedesign and operation, it is usually suggested that(Ref 28):
● The vestibules of atmosphere-hardening fur-naces should be loaded and unloaded withpurging. Load transfer for belt and shakerhearth furnaces should only occur with thor-ough purging to minimize atmosphere con-tamination.
● Hardening furnaces typically contain exces-sive loads prior to quenching. If the steel atquenching temperature is greater than 20% of
Failures Related to Heat Treating Operations / 201

A satisfactory design ifhub must be offset
Solution: the ideal design
Fig. 27 Design solutions to the distortion problemshown in Fig. 26
Gear before heat treating
The problem: gear tapers or warps
Fig. 26 Schematic of a gear that is difficult to hardenwithout the distortion shown
Fig. 25 Schematic of a press quench system. Courtesy of Gleason Tooling Products Group
Shallow roundbottom groove
Usual design(poor)
Better
Design for hardeningover holes
Hardenthis
length
Fig. 28 Design solutions to the quench-cracking prob-lem often encountered in shaft hardening over
a cross hole
the distance from discharge to charge door, itis too much. Either the production rate can beincreased or some of the burners can beturned off.
One source of cracking, which may appearsimilar to quench cracking, can also occur dueto excessive heating rate to the austenitizing tem-perature. This is illustrated for AISI 4140 steelin Fig. 35 (Ref 27). In this case, surface oxida-tion and decarburization within the crack, whichwould not have been obtained if the crackingoccurred during the quench, was observed.
Cracking may also be due to localized over-heating (nonuniform heating), shown in Fig. 36,which is a microstructure of AISI 4140 tube endsections (Ref 27). Circumferential cracking at amid-thickness location of the sample was re-ported on the tube end. The tubes were report-edly austenitized and then spray quenched. Mi-crostructural examination of the steel revealed acoarse-grain condition due to overheating duringaustenitization prior to quenching. The crackingoccurred along the coarse-grain boundary, as il-lustrated in Fig. 36. However, microstructuralanalysis of samples from other regions of thetube indicated fine-grain martensite. Taken to-gether, these data suggest that the austenitizationfurnace contained hot spots that caused localizedoverheating and grain coarsening. The over-heated locations cracked in the presence ofquench stresses. Cracking occurred in the mid-thickness locations due to the inherent weakness
of the material centers carried over from theoriginal billet or casting.
An important source of steel distortion andcracking is nonuniform heating and not using theappropriate protective atmosphere. For example,if steel is heated in a direct-gas-fired furnace withhigh moisture content, the load being heated mayadsorb hydrogen, leading to hydrogen embrittle-ment and subsequent cracking, which would notnormally occur with a dry atmosphere (Ref 22,28).
Component Support and Loading. Manyparts may sag and creep under their own weightwhen heat treated, which is an important causeof distortion. An example of a type of compo-nent that is susceptible to such distortion is a ringgear. The dimension limits by which ring gearsare classified are provided in Fig. 37 (Ref 21).(A general dimensional classification of variousdistortion-sensitive shapes is provided in Fig. 38[Ref 21].) Proper support when heating is re-quired to minimize out-of-flatness and ovalityproblems, which may result in long grindingtimes, excessive stock removal, high scraplosses, and loss of case depth (Ref 21). Toachieve adequate distortion control, custom sup-ports or press quenching may be required.
Pinion shafts, as defined in Fig. 39, are sus-ceptible to banding along their length, if they areimproperly loaded into the furnace, as shown inFig. 40 (Ref 21). When this occurs, the pinionshafts must then be straightened, which adds toproduction cost.
Surface Condition. Quench cracking may bedue to various steel-related problems that areonly observable after the quench, but the rootcause is not the quenching process itself. Theseprior conditions include prior steel structure,stress raisers from prior machining, laps andseams, alloy inclusion defects, grinding cracks,chemical segregation (bonding), and alloy de-pletion (Ref 27).
One prior-condition problem is tight scale,which is encountered with forgings hardenedfrom direct-fired gas furnaces with high-pressureburners (Ref 23, 24). The effect of tight scale onthe quenching properties of two steels, 1095 car-bon steel and 18-8 stainless steel, is illustratedin Fig. 41 (Ref 25). These cooling curves wereobtained by still quenching into fast oil. A scaleof not more than 0.08 mm (0.003 in.) increasesthe rate of cooling of 1095 steel as compared tothe rate obtained on a specimen without scale.However, a heavy scale (0.13 mm, or 0.005 in.)
Before heat treatment
After heat treatment
Fig. 29 Distortion often encountered when quenchinga notch
202 / Manufacturing Aspects of Failure and Prevention

Fig. 30 Part design recommendations for minimal internal stresses. Source: Ref 4
deep retards the cooling rate. A very light scale,0.013 mm (0.0005 in.) deep, also increased thecooling rate of the 18-8 steel over that obtainedwith the specimen without scale.
In practice, the formation of tight scale variesin depth over the surface of the part, resulting inthermal gradients due to differences in coolingrates. This problem may yield soft spots and un-controlled distortion and is particularly a prob-lem with nickel-containing steels. Surface oxideformation can be minimized by the use of anappropriate protective atmosphere.
The second surface-related condition is decar-burization, which may lead to increased distor-tion or cracking (Ref 26). At a given depthwithin the decarburized layer, the part does notharden as completely as it would at the samepoint below the surface if there were no decar-burization. This leads to nonuniform hardness,which may contribute to increased distortion andcracking, because (Ref 23):
● The decarburized surface transforms at ahigher temperature than the core (the Ms tem-
perature decreases with carbon content). Thisleads to high residual tensile stresses at thedecarburized surface or a condition of unbal-anced stresses and distortion.
● Because the surface is decarburized, it exhib-its lower hardenability than the core. Thiscauses the upper transformation products toform early, nucleating additional undesirableproducts in the core. The decarburized side issofter than the side that did not undergo de-carburizing, which is harder. The greateramount of martensite leads to distortion.
Failures Related to Heat Treating Operations / 203
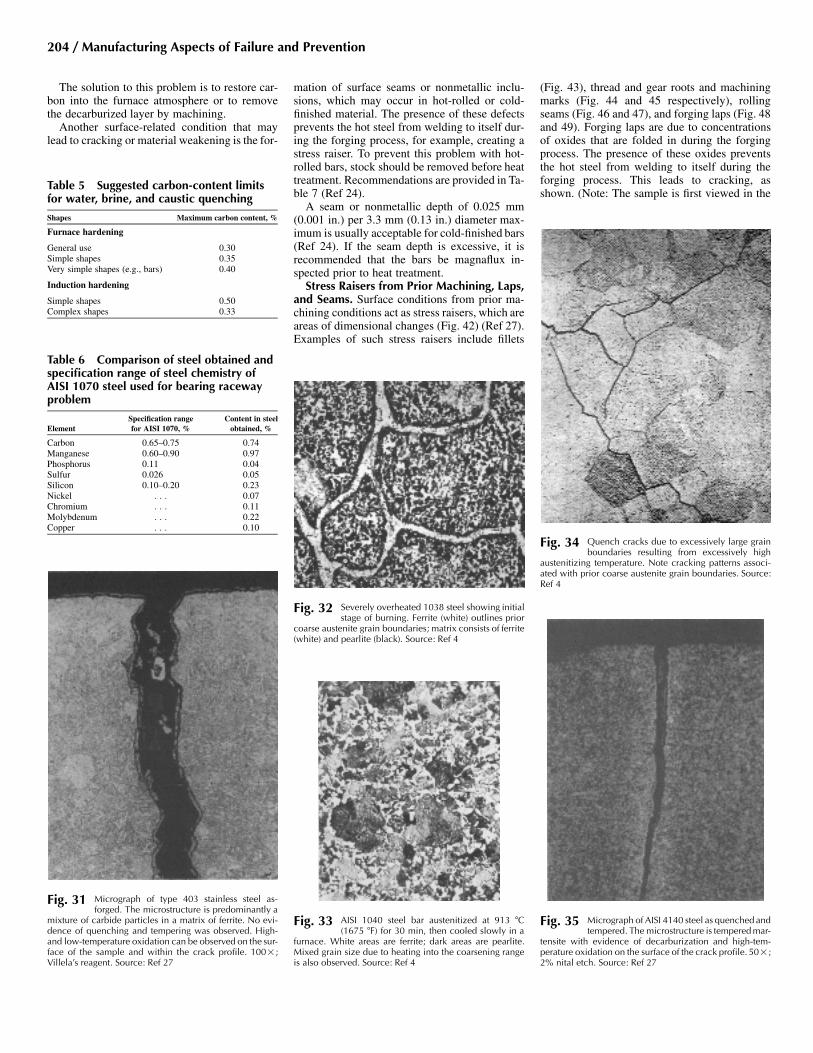
Fig. 31 Micrograph of type 403 stainless steel as-forged. The microstructure is predominantly a
mixture of carbide particles in a matrix of ferrite. No evi-dence of quenching and tempering was observed. High-and low-temperature oxidation can be observed on the sur-face of the sample and within the crack profile. 100�;Villela’s reagent. Source: Ref 27
Table 6 Comparison of steel obtained andspecification range of steel chemistry ofAISI 1070 steel used for bearing racewayproblem
ElementSpecification rangefor AISI 1070, %
Content in steelobtained, %
Carbon 0.65–0.75 0.74Manganese 0.60–0.90 0.97Phosphorus 0.11 0.04Sulfur 0.026 0.05Silicon 0.10–0.20 0.23Nickel . . . 0.07Chromium . . . 0.11Molybdenum . . . 0.22Copper . . . 0.10
Table 5 Suggested carbon-content limitsfor water, brine, and caustic quenching
Shapes Maximum carbon content, %
Furnace hardening
General use 0.30Simple shapes 0.35Very simple shapes (e.g., bars) 0.40
Induction hardening
Simple shapes 0.50Complex shapes 0.33
Fig. 33 AISI 1040 steel bar austenitized at 913 �C(1675 �F) for 30 min, then cooled slowly in a
furnace. White areas are ferrite; dark areas are pearlite.Mixed grain size due to heating into the coarsening rangeis also observed. Source: Ref 4
Fig. 32 Severely overheated 1038 steel showing initialstage of burning. Ferrite (white) outlines prior
coarse austenite grain boundaries; matrix consists of ferrite(white) and pearlite (black). Source: Ref 4
Fig. 35 Micrograph of AISI 4140 steel as quenched andtempered. The microstructure is tempered mar-
tensite with evidence of decarburization and high-tem-perature oxidation on the surface of the crack profile. 50�;2% nital etch. Source: Ref 27
Fig. 34 Quench cracks due to excessively large grainboundaries resulting from excessively high
austenitizing temperature. Note cracking patterns associ-ated with prior coarse austenite grain boundaries. Source:Ref 4
The solution to this problem is to restore car-bon into the furnace atmosphere or to removethe decarburized layer by machining.
Another surface-related condition that maylead to cracking or material weakening is the for-
mation of surface seams or nonmetallic inclu-sions, which may occur in hot-rolled or cold-finished material. The presence of these defectsprevents the hot steel from welding to itself dur-ing the forging process, for example, creating astress raiser. To prevent this problem with hot-rolled bars, stock should be removed before heattreatment. Recommendations are provided in Ta-ble 7 (Ref 24).
A seam or nonmetallic depth of 0.025 mm(0.001 in.) per 3.3 mm (0.13 in.) diameter max-imum is usually acceptable for cold-finished bars(Ref 24). If the seam depth is excessive, it isrecommended that the bars be magnaflux in-spected prior to heat treatment.
Stress Raisers from Prior Machining, Laps,and Seams. Surface conditions from prior ma-chining conditions act as stress raisers, which areareas of dimensional changes (Fig. 42) (Ref 27).Examples of such stress raisers include fillets
(Fig. 43), thread and gear roots and machiningmarks (Fig. 44 and 45 respectively), rollingseams (Fig. 46 and 47), and forging laps (Fig. 48and 49). Forging laps are due to concentrationsof oxides that are folded in during the forgingprocess. The presence of these oxides preventsthe hot steel from welding to itself during theforging process. This leads to cracking, asshown. (Note: The sample is first viewed in the
204 / Manufacturing Aspects of Failure and Prevention

0.20
00 1 2 3
Tube
4Ratio length/wall thickness, L/WT
5 6 7 8 9
0.40
0.60
0.80
1.00
Rat
io ID
/OD
PinionWheel
Ring
Boundary A
Thin-walled tube(annulus)
Boundary A
Thin-walled tube(annulus)
WT ID
L
OD
Fig. 38 Classification of distortion-sensitive shapes
1
0
5
2
3
4
Ben
ding
, mm
22601775385
80 diam
140 diam
100 diam
Fig. 39 Distortion of JIS SCM 440 (0.4% C, 1.05% Cr,0.22% Mo) steel pinion shafts after oil quench-
ing from 850 �C (1560 �F) while vertically suspended andtempering at 600 �C (1110 �F)
WT ID
L
OD
Fig. 37 Dimensions of a ring gear shape. Shape limi-tation: length/wall thickness � 1.5; inside di-
ameter (ID)/outside diameter (OD) � 0.4. Minimum wallthickness (WT) is defined by WT � 2.25 � module � [0.4� 5 (mod � L � OD3)1/2]
Fig. 36 Micrograph of AISI 4140 steel as quenched andtempered. The microstructure is tempered mar-
tensite with intergranular quench cracking along the prioraustenite grain boundaries. 100�; 2% nital etch. Source:Ref 27
ExampleOutsidediameter: 200 mmLength: 1500 mm
Typical distortionsand growths
Out-of-straightness:1000-2000 µm
OD shrinkage atcenter: 300-500 µm
Increase in length:1000-1500 µm
Retortwall
Retortwall
Centerpole
Fig. 40 Example of pinion shaft distortion due to fur-nace loading
unetched condition to locate the crack. Then, thesample is etched, if desired, for microstructuralidentification.)
Several types of internal voids may be presentin steel. The first type is known as a pipe void,which is an imperfection formed after castingand cooling (see the article “Failures Related toMetal Working and Machining Operations”, inthis volume). The pipe void is a cavity formed
by contraction during solidification of the lastportion of liquid metal in the ingot and may evensurvive rolling or forging, but, because the endsof the ingot are closed, it is not detected until thebar stock is cut, at which time it is readily visible.
Another type of internal void is a forge or rollburst. The pipe void is readily distinguishablefrom the forge or roll burst by the more roundednature of the pipe void compared to the thin,cracklike appearance of the forge or roll burst.Steel porosity also produces voids in steel cast-ings. These voids are caused by trapped gases.Porosity is another source of potential steelcracking. This is illustrated in Fig. 50 (Ref 27).
Nonmetallic Inclusions. All steels containnumerous nonmetallic inclusions, but the cleanergrades have fewer large or significant inclusionsthan do the conventional grades. There are twotypes of nonmetallic inclusions. Exogenous non-metallic inclusions occur when particles or largelumps of refractory fall into the molten steel dur-ing the steelmaking process. These contaminantsprovide surfaces in which indigenous inclusionsmay nucleate and grow. Indigenous inclusionsarise from reactions, such as deoxidation prod-ucts Al2O3 and SiO2 or desulfurization productssuch as MnS (Ref 30).
Nonmetallic inclusions may exhibit degradedtransverse toughness and ductility. They mayalso reduce fatigue strength, although soft inclu-sions are less harmful than are hard inclusionsof the same size. In carburized parts, althoughnonmetallic inclusions may not significantly af-fect the fatigue limit, they could result. Figure51 illustrates a combination of nonmetallic in-clusions and banding due to microsegregation(discussed subsequently) (Ref 30). If a void ispresent at the site of a nonmetallic inclusion,possibly due to forging, the degree that the defectacts as a stress raiser increases. However, bysome mechanism, such as shearing, the stress-raising effect may decrease, as illustrated by Fig.52, where the nonmetallic inclusion appears as a“butterfly” after etching (Ref 30).
Machining. Material removal during machin-ing can result in high residual stress levels and,ultimately, unacceptable distortion (Ref 21).When excessive machining stresses are im-parted, the process may require modification toinclude a rough machining stress relieving fol-lowed by fine machining. Tables 8 and 9 are thesuggested AISI design minimum allowable tol-erances for machining (Ref 4).
Quenching
Quenchant Selection and Severity
Quenchants must be selected to provide cool-ing rates capable of producing acceptable micro-structure in the section thickness of interest.However, it is not desirable to use quenchantswith excessively high heat-removal rates. Typi-cally, the greater the quench severity, the greaterthe propensity to increased distortion or crack-
Failures Related to Heat Treating Operations / 205

Fig. 42 Micrograph of AISI 4140 steel as quenched andtempered. The microstructure is tempered mar-
tensite with quench cracking in the area of dimensionalchange. 91�; 2% nital etch. Source: Ref 27
Table 7 Minimum recommended materialremoval from hot-rolled steel products toprevent surface seam and nonmetallicstringer problems during heat treatment
Condition
Minimum material removal per side(a)
Nonresulfurized Resulfurized
Turned on centers 3% of diameter 3.8% of diameterCenterless turned
or ground2.6% 3.4%
(a) Based on bars purchased to special straightness, i.e., 3.3 mm (0.13in.) in 1.5 m (5 ft) maximum
(a)
200
0 10
200
400
600
800
1000
1200
1400
1600
20
Time, s
30 40 50
400
600
800
1000
0
Tem
pera
ture
, °C
Tem
pera
ture
, °F
Tem
pera
ture
, °C
Tem
pera
ture
, °F
(b)
200
0 10
200
400
600
800
1000
1200
1400
1600
20
Time, s
30 40 50
400
600
1000
0
800
1095 1B-B strainless steel
Heavy scale0.13 mm (0.005 in.)
Medium scale0.08 mm (0.003 in.)
Light scale0.013 mm (0.0005 in.)
No scale
1095 18-8 strainless steel
Heavy scale0.13 mm (0.005 in.)
Medium scale0.08 mm (0.003 in.)
Light scale0.013 mm (0.0005 in.)
No scale
No scaleNo scale
Fig. 41 Centerline cooling curves showing the effect of scale on the cooling curves of two different steels quenchedin fast oil without agitation. (a) 1095 steel; oil temperature, 50 �C (125 �F). (b) 18-8 stainless steel; oil tem-
perature, 25 �C (75 �F). Test specimens were 13 mm (0.5 in.) diam by 64 mm (2.5 in.) long
Fig. 43 Micrograph of AISI 4142 steel as quenched andtempered. The microstructure is tempered mar-
tensite with quench cracking at the fillet radius. 100�; 3%nital etch. Source: Ref 27
Fig. 45 Micrograph of AISI 4118 carburized steel asquenched and tempered. The microstructure is
tempered martensite (unetched) with a quench crack prop-agating from a machining burr. 200�. Source: Ref 27
Fig. 44 Micrograph of AISI 4140 steel as quenched andtempered. The microstructure is tempered mar-
tensite with quench cracking initiating from a machinegroove. 100�; 2% nital etch. Source: Ref 27
ing. Although a reduction of quench severityleads to reduced distortion, it may also be ac-companied by undesirable microstructures.Therefore, it is difficult to select an optimalquenchant and agitation. Cooling power (quench
severity) of quenchant should be as low as pos-sible while maintaining a sufficiently high cool-ing rate to ensure the required microstructure,hardness, and strength in critical sections of thesteel parts.
Quench severity is defined as the “ability of aquenching medium to extract heat from a hotsteel workpiece, expressed in terms of the Gross-mann number (H)” (Ref 31). A typical range ofGrossmann H-values (numbers) for commonlyused quench media are provided in Table 10, andFig. 53 provides a correlation between the H-value and the ability to harden steel, as indicatedby the Jominy distance (J-distance) (Ref 23). Al-though Table 10 is useful to obtain a relativemeasure of the quench severity offered by dif-ferent quench media, it is difficult to apply inpractice, because the actual flow rates for “mod-
erate,” “good,” “strong,” and “violent” agitationare unknown.
Alternatively, the measurement of actual cool-ing rates or heat fluxes provided by a specificquenching medium does provide a quantitativemeaning to the quench severity provided. Someillustrative values are provided in Table 11 (Ref32).
Typically, the greater the quench severity, thegreater the propensity of a given quenching me-dium to cause distortion or cracking. This usu-ally is the result of increased thermal stress, nottransformational stresses. Specific recommen-dations for quench media selection for use with
206 / Manufacturing Aspects of Failure and Prevention

Fig. 48 Micrograph of AISI 1030 steel as direct-forgequenched and tempered. The microstructure is
tempered martensite (unetched) with forged-in scale adja-cent to cracking. 100�. Source: Ref 27
Fig. 49 Micrograph of AISI 1045 as-forged steel illus-trating a forging lap. 27�; 2% nital etch.
Source: Ref 27
Fig. 47 Micrograph of type 403 stainless steel asquenched and tempered. The microstructure is
predominantly tempered martensite, with cracking pro-moted by the seam. 100�; Vilella’s reagent. Source: Ref27
Fig. 46 Micrograph of AISI 8630 steel as quenched.The microstructure is martensite, where crack-
ing initiated from a rolling seam. Source: Ref 27 Fig. 50 Micrograph of AISI 8630 cast steel asquenched and tempered. The microstructure is
tempered martensite, pearlite, and ferrite, showing a po-tential cracking condition. 91�; 3% nital etch. Source: Ref27
Fig. 51 Nonmetallic inclusions and banding in a mi-crosegrated 1% C alloy steel showing retained
austenite. Source: Ref 30
various steel alloys is provided by standardssuch as Aerospace Material Specification (AMS)2759. Figure 54 illustrates a quench crack due toan excessively high cooling rate (Ref 27).
Some additional general comments regardingquenchant selection include (Ref 23, 28):
● Most machined parts made from alloy steelsare oil quenched to minimize distortion. Mostsmall parts or finish-ground larger parts are“free” quenched. Larger gears, typically thosegreater than 20 cm (8 in.), are fixture (die)quenched to control distortion. Smaller gearsand parts, such as bushings, are typically plug
tenite is most pronounced where manganeseand nickel are major components. The beststeels for austempering are plain carbon steelsand chromium and molybdenum alloy steels(Ref 23).
● Aqueous polymer quenchants may often beused to replace quench oils, but quench se-verity is still of primary importance and ap-propriate quench system design is necessary.
● Gas or air quenching provides the least dis-tortion and may be used if the steel has suf-ficient hardenability to provide the desiredproperties.
● Low-hardenability steels are quenched inbrine or vigorously agitated oil. However,even with a severe quench, undesirable mi-crostructures, such as ferrite, pearlite, or bain-ite, can form.
Quenchant Uniformity
Quench nonuniformity is one of the greatestcontributors to quench cracking. Quench non-uniformity can arise from nonuniform flow fields
quenched on a splined plug, which is usuallyconstructed from carburized 8620 steel.
● Although a reduction of quench severity leadsto reduced distortion, it may also be accom-panied by undesirable microstructures, suchas the formation of upper bainite (quenchedpearlite) with carburized parts.
● Quench speed may be reduced by quenchingin hot (570 to 750 �C, or 1060 to 1380 �F) oil.When hot oil quenching is used for carburizedsteels, lower bainite, which exhibits proper-ties similar to martensite, is formed.
● Excellent distortion is typically obtained withaustempering, quenching into a medium justabove the Ms temperature. The formation ofretained austenite is a significant problemwith austempering processes. Retained aus-
Failures Related to Heat Treating Operations / 207
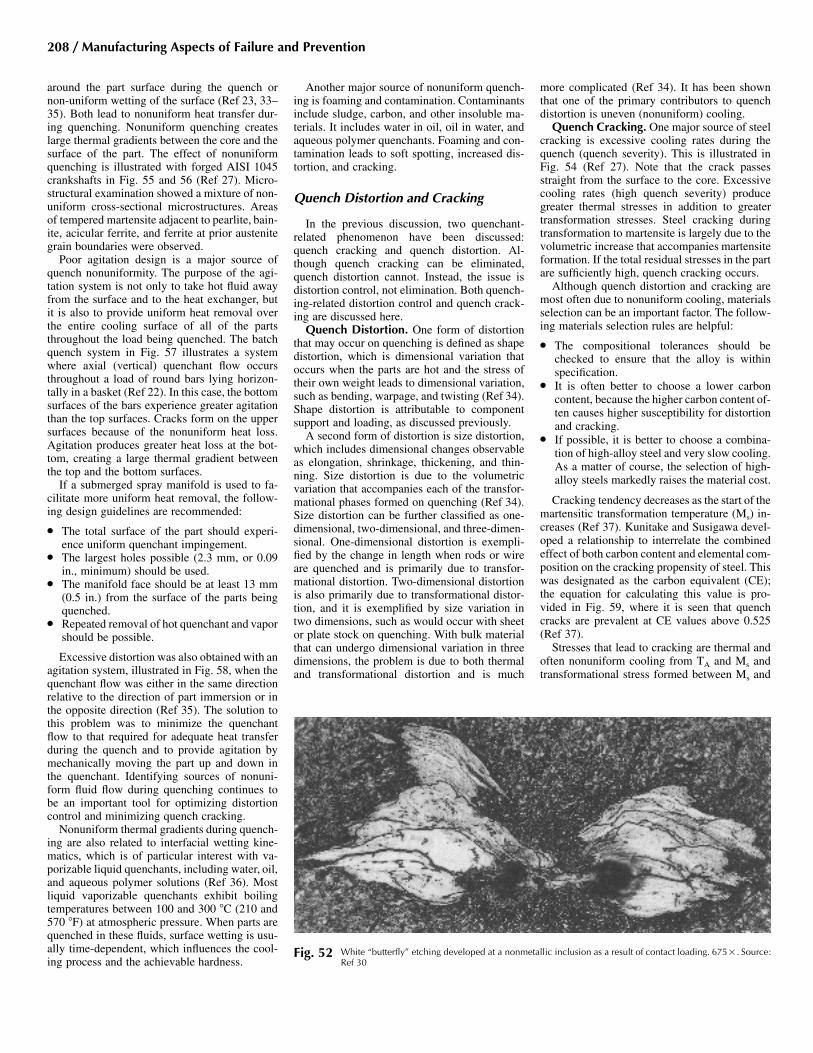
Fig. 52 White “butterfly” etching developed at a nonmetallic inclusion as a result of contact loading. 675�. Source:Ref 30
around the part surface during the quench ornon-uniform wetting of the surface (Ref 23, 33–35). Both lead to nonuniform heat transfer dur-ing quenching. Nonuniform quenching createslarge thermal gradients between the core and thesurface of the part. The effect of nonuniformquenching is illustrated with forged AISI 1045crankshafts in Fig. 55 and 56 (Ref 27). Micro-structural examination showed a mixture of non-uniform cross-sectional microstructures. Areasof tempered martensite adjacent to pearlite, bain-ite, acicular ferrite, and ferrite at prior austenitegrain boundaries were observed.
Poor agitation design is a major source ofquench nonuniformity. The purpose of the agi-tation system is not only to take hot fluid awayfrom the surface and to the heat exchanger, butit is also to provide uniform heat removal overthe entire cooling surface of all of the partsthroughout the load being quenched. The batchquench system in Fig. 57 illustrates a systemwhere axial (vertical) quenchant flow occursthroughout a load of round bars lying horizon-tally in a basket (Ref 22). In this case, the bottomsurfaces of the bars experience greater agitationthan the top surfaces. Cracks form on the uppersurfaces because of the nonuniform heat loss.Agitation produces greater heat loss at the bot-tom, creating a large thermal gradient betweenthe top and the bottom surfaces.
If a submerged spray manifold is used to fa-cilitate more uniform heat removal, the follow-ing design guidelines are recommended:
● The total surface of the part should experi-ence uniform quenchant impingement.
● The largest holes possible (2.3 mm, or 0.09in., minimum) should be used.
● The manifold face should be at least 13 mm(0.5 in.) from the surface of the parts beingquenched.
● Repeated removal of hot quenchant and vaporshould be possible.
Excessive distortion was also obtained with anagitation system, illustrated in Fig. 58, when thequenchant flow was either in the same directionrelative to the direction of part immersion or inthe opposite direction (Ref 35). The solution tothis problem was to minimize the quenchantflow to that required for adequate heat transferduring the quench and to provide agitation bymechanically moving the part up and down inthe quenchant. Identifying sources of nonuni-form fluid flow during quenching continues tobe an important tool for optimizing distortioncontrol and minimizing quench cracking.
Nonuniform thermal gradients during quench-ing are also related to interfacial wetting kine-matics, which is of particular interest with va-porizable liquid quenchants, including water, oil,and aqueous polymer solutions (Ref 36). Mostliquid vaporizable quenchants exhibit boilingtemperatures between 100 and 300 �C (210 and570 �F) at atmospheric pressure. When parts arequenched in these fluids, surface wetting is usu-ally time-dependent, which influences the cool-ing process and the achievable hardness.
Another major source of nonuniform quench-ing is foaming and contamination. Contaminantsinclude sludge, carbon, and other insoluble ma-terials. It includes water in oil, oil in water, andaqueous polymer quenchants. Foaming and con-tamination leads to soft spotting, increased dis-tortion, and cracking.
Quench Distortion and Cracking
In the previous discussion, two quenchant-related phenomenon have been discussed:quench cracking and quench distortion. Al-though quench cracking can be eliminated,quench distortion cannot. Instead, the issue isdistortion control, not elimination. Both quench-ing-related distortion control and quench crack-ing are discussed here.
Quench Distortion. One form of distortionthat may occur on quenching is defined as shapedistortion, which is dimensional variation thatoccurs when the parts are hot and the stress oftheir own weight leads to dimensional variation,such as bending, warpage, and twisting (Ref 34).Shape distortion is attributable to componentsupport and loading, as discussed previously.
A second form of distortion is size distortion,which includes dimensional changes observableas elongation, shrinkage, thickening, and thin-ning. Size distortion is due to the volumetricvariation that accompanies each of the transfor-mational phases formed on quenching (Ref 34).Size distortion can be further classified as one-dimensional, two-dimensional, and three-dimen-sional. One-dimensional distortion is exempli-fied by the change in length when rods or wireare quenched and is primarily due to transfor-mational distortion. Two-dimensional distortionis also primarily due to transformational distor-tion, and it is exemplified by size variation intwo dimensions, such as would occur with sheetor plate stock on quenching. With bulk materialthat can undergo dimensional variation in threedimensions, the problem is due to both thermaland transformational distortion and is much
more complicated (Ref 34). It has been shownthat one of the primary contributors to quenchdistortion is uneven (nonuniform) cooling.
Quench Cracking. One major source of steelcracking is excessive cooling rates during thequench (quench severity). This is illustrated inFig. 54 (Ref 27). Note that the crack passesstraight from the surface to the core. Excessivecooling rates (high quench severity) producegreater thermal stresses in addition to greatertransformation stresses. Steel cracking duringtransformation to martensite is largely due to thevolumetric increase that accompanies martensiteformation. If the total residual stresses in the partare sufficiently high, quench cracking occurs.
Although quench distortion and cracking aremost often due to nonuniform cooling, materialsselection can be an important factor. The follow-ing materials selection rules are helpful:
● The compositional tolerances should bechecked to ensure that the alloy is withinspecification.
● It is often better to choose a lower carboncontent, because the higher carbon content of-ten causes higher susceptibility for distortionand cracking.
● If possible, it is better to choose a combina-tion of high-alloy steel and very slow cooling.As a matter of course, the selection of high-alloy steels markedly raises the material cost.
Cracking tendency decreases as the start of themartensitic transformation temperature (Ms) in-creases (Ref 37). Kunitake and Susigawa devel-oped a relationship to interrelate the combinedeffect of both carbon content and elemental com-position on the cracking propensity of steel. Thiswas designated as the carbon equivalent (CE);the equation for calculating this value is pro-vided in Fig. 59, where it is seen that quenchcracks are prevalent at CE values above 0.525(Ref 37).
Stresses that lead to cracking are thermal andoften nonuniform cooling from TA and Ms andtransformational stress formed between Ms and
208 / Manufacturing Aspects of Failure and Prevention

Table 8 Minimum allowance for machining flat and square bars
Specified thickness,in., incl(a)
Specified width, in., incl
0 to 1⁄2 Over 1⁄2 to 1 Over 1 to 2 Over 2 to 3 Over 3 to 4 Over 4 to 5 Over 5 to 6 Over 6 to 7 Over 7 to 8 Over 8 to 9 Over 9 to 12
Hot-rolled square and flat bars
0 to 1⁄2 A 0.025 0.025 0.030 0.035 0.040 0.045 0.050 0.055 0.060 0.060 0.060B 0.025 0.035 0.040 0.050 0.065 0.080 0.095 0.105 0.120 0.130 0.140
Over 1⁄2 to 1 A . . . 0.045 0.045 0.050 0.055 0.060 0.065 0.070 0.075 0.075 0.075B . . . 0.045 0.050 0.060 0.075 0.095 0.115 0.130 0.150 0.155 0.155
Over 1 to 2 A . . . . . . 0.065 0.065 0.070 0.070 0.075 0.080 0.080 0.095 0100B . . . . . . 0.065 0.070 0.085 0.105 0.125 0.145 0.165 0.170 0.170
Over 2 to 3 A . . . . . . . . . 0.085 0.085 0.085 0.085 0.090 0.100 0.100 0.100B . . . . . . . . . 0.085 0.100 0.120 0.135 0.155 0.170 0.190 0.190
Over 3 to 4 A . . . . . . . . . . . . 0.115 0.115 0.115 0.115 0.125 0.125 0.125B . . . . . . . . . . . . 0.115 0.125 0.140 0.170 0.190 0.190 0.190
Cold-drawn square and flat bars
0 to 1⁄2 A 0.025 0.025 0.030 0.035 0.040 0.045 . . . . . . . . . . . . . . .B 0.025 0.035 0.040 0.050 0.065 0.080 . . . . . . . . . . . . . . .
Over 1⁄2 to 1 A . . . 0.045 0.045 0.050 0.055 0.060 . . . . . . . . . . . . . . .B . . . 0.045 0.050 0.060 0.075 0.095 . . . . . . . . . . . . . . .
Over 1 to 2 A . . . . . . 0.065 0.065 0.070 . . . . . . . . . . . . . . . . . .B . . . . . . 0.065 0.070 0.085 . . . . . . . . . . . . . . . . . .
Forged square and flat bars
Over 1⁄2 to 1 A . . . . . . 0.060 0.065 0.065 0.075 0.080 0.085 0.090 0.100 0.110B . . . . . . 0.072 0.084 0.100 0.120 0.144 0.168 0.200 0.200 0.200
Over 1 to 2 A . . . . . . 0.090 0.090 0.090 0.100 0.110 0.115 0.125 0.140 0.150B . . . . . . 0.090 0.100 0.108 0.124 0.148 0.172 0.200 0.200 0.200
Over 2 to 3 A . . . . . . . . . 0.120 0.120 0.125 0.130 0.135 0.150 0.160 0.175B . . . . . . . . . 0.120 0.136 0.140 0.148 0.172 0.200 0.200 0.200
Over 3 to 4 A . . . . . . . . . . . . 0.150 0.150 0.160 0.180 0.200 0.210 0.225B . . . . . . . . . . . . 0150 0.150 0.160 0.180 0.200 0.210 0.225
Over 4 to 5 A . . . . . . . . . . . . . . . 0.180 0.180 0.190 0.210 0.225 0.250B . . . . . . . . . . . . . . . 0.180 0.180 0.190 0.210 0.225 0.250
Over 5 to 6 A . . . . . . . . . . . . . . . . . . 0.210 0.225 0.125 0.250 0.250B . . . . . . . . . . . . . . . . . . 0.210 0.225 0.225 0.250 0.250
Over 6 to 7 A . . . . . . . . . . . . . . . . . . . . . 0.250 0.250 0.250 0.250B . . . . . . . . . . . . . . . . . . . . . 0.250 0.250 0.250 0.250
(a) Minimum allowance, inches per side, for machining prior to heat treatment. A, allowance on thickness, in. per side; B, allowance on width, in. per side
martensite finish temperature (Mf). Nonuniformthermal stresses occur when nonuniform surfacecooling occurs. In this case, there is a deferredcontraction in the slower cooling areas, creatinga pull stress resulting in pull cracking (Ref 36).This is illustrated in Fig. 60(a) (Ref 36), whererapid but nonuniform surface cooling to point Ahas occurred, at which time it affects adjacentpoint B, which is cooling more slowly, causinga deferred contraction at point B�—both ofwhich occur while the martensitic transforma-tion occurs at the Ms point. As a result, point A,which cooled rapidly, undergoes compression,and point B�, which cooled more slowly, under-goes pulling. This means that pull stress is a ten-
sile stress, and if this stress becomes largeenough, cracking occurs in areas where coolingis delayed.
When there is nonuniform cooling within thepart between the Ms and Mf, there is a stretchingor elongation in areas where the cooling is slow,which acts as a push stress, leading to pushcracking (Ref 38). This is illustrated by Fig.60(b) (Ref 36), where point A, which cooled rap-idly, stretches point B (which cooled moreslowly) to point B� below the Ms temperature,which is a state that undergoes the expansion dueto martensitic transformation. As a result, therapidly cooled point A (exterior) undergoes pull-ing, and the slowly cooled point B� (interior) un-
dergoes compression. This results in interiorpoint B� causing pushing and cracking at pointA, which occurs in areas where quenching oc-curs rapidly.
Therefore, pull cracking, which occurs withnonuniform surface cooling between TA and Ms,and push cracking, which occurs with nonuni-form cooling within the part between Ms and Mf,are the opposite of each other, although thecracking event takes place for both between theMs and Mf. Figure 61 provides illustrations ofboth push and pull cracking (Ref 36).
For cracking to occur, the presence of a stressraiser (points of stress concentration) is typicallynecessary. Two types of stress raisers may be
Table 9 Minimum allowance per side for machining rounds, hexagons, and octagonsprior to heat treatment
Ordered size,in., incl
Minimum allowance per side, in.
Hot rolled Forged Rounds rough turned Cold drawn
Up to 1⁄2 0.016 . . . . . . 0.016Over 1⁄2 to 1 0.031 . . . . . . 0.031Over 1 to 2 0.048 0.072 . . . 0.048Over 2 to 3 0.063 0.094 0.020 0.063Over 3 to 4 0.088 0.120 0.024 0.088Over 4 to 5 0.112 0.145 0.032 . . .Over 5 to 6 0.150 0.170 0.040 . . .Over 6 to 8 0.200 0.200 0.048 . . .Over 8 to 10 0.200 0.072 . . . . . .
Table 10 Grossmann H-values for typicalquenching conditions
Quenching mediumGrossmann value
(H)
Poor (slow) oil quench, no agitation 0.20Good oil quench, moderate agitation 0.35Very good oil quench, good agitation 0.50Strong oil quench, violent agitation 0.70Poor water quench, no agitation 1.00Very good water quench, strong agitation 1.50Brine quench, no agitation 2.00Brine quench, violent agitation 5.00Ideal quench (a)
(a) It is possible, with high-pressure impingement, to achieve H-valuesgreater than 5.00.
Failures Related to Heat Treating Operations / 209

0.35
0.206 9 12 15
Quench severity in terms of H value
18 21 24
0.50
0.70
1.0
1.5
2.0
5.0
x
161/J distance ( in.)
H v
alue
Fig. 53 Quench severity in terms of Grossman (H) val-ues. J, Jominy distance. Source: Ref 23
Fig. 55 Micrograph of AISI 1045 steel as quenched andtempered. Microstructure shows bands with
banded tempered martensite and some bainite. The crackprofile revealed evidence of tempering oxide and second-ary cracking. 200�; 2% nital etch. Source: Ref 27
Fig. 56 Micrograph of AISI 1045 steel as quenched andtempered; representative of underheated mi-
crostructure adjacent to cracking. 376�; 2% nital etch.Source: Ref 27
Table 11 Comparison of typical heattransfer rates for various quenching media
Quench mediumHeat transfer rate(W • m�2 K�1)
Still air 50–80Nitrogen (1 bar) 100–150Salt bath or fluidized bed 350–500Nitrogen (10 bar) 400–500Helium (10 bar) 550–600Helium (20 bar) 900–1000Still oil 1000–1500Hydrogen (20 bar) 1250–1350Circulated oil 1800–2200Hydrogen (40 bar) 2100–2300Circulated water 3000–3500
Fig. 54 Micrograph of AISI 4340 quenched and tem-pered steel illustrating a macroetched pure
quench crack. Source: Ref 27
Quench cracks
Tray
Quenchant flow
Fig. 57 Harmful effects of impeded vertical quenchantflow through the load of a batch quench system
found. One is a geometric notch, which includescutting tool marks, sharp corner angles, and ar-eas with rapid section thickness changes. Theother type of stress raiser commonly found is anotch in the material, which may include inter-granular effects, carbide segregation, and aggre-gates of impurities (Ref 36).
Although it would be desirable to eliminateall stress raisers to facilitate quench processingwithout any potential for cracking, this is notpossible, in most cases. Instead, methods ofquenching to minimize potential cracking oftenmust be developed. Polyakov provided immer-sion recommendations for parts with complexshapes, where cracking potential is minimumand maximum, and these are summarized in Fig.62 (Ref 39). The Polyakov rules for quenchingsuch parts include (Ref 39):
● Conditions for quench cracking are most fa-vorable if parts are immersed into the quen-
chant, so the perimeter of the stress raiser(PSC) simultaneously touches the liquid alongthe entire length.
● In the case where the perimeter of the stressraiser slowly touches the quenchant at themoment of immersion in individual regions,quench cracking is reduced substantially.
Retained Austenite
The austenitic structure that remains in steelafter quenching is called retained austenite. Theamount of retained austenite is dependent on theMs and Mf temperatures. To obtain complete
transformation, steel must be quenched into themartensitic transformation region for sufficienttime for austenite to transform to martensite. Ifthe Mf temperature is below ambient tempera-ture, the transformation to martensite is incom-plete, and some austenite is retained in the as-quenched structure. In these cases, to obtaincomplete transformation, the steel must bequenched directly into a refrigerant to a tem-perature below the Mf. However, if steel is firstquenched to ambient temperature and then cry-ogenically cooled, additional austenite is trans-formed to martensite, but there is still a smallfraction of retained austenite (Ref 30).
Increasing carbon content of steel increasesthe potential for retained austenite on quenching,as illustrated in Fig. 63 (Ref 30). This is becausethe Ms temperature decreases with increasingcarbon content. The effect of carbon content onthe Ms temperature can be calculated using theSteven and Haynes equation for steels contain-ing up to 0.5% C (Ref 40):
Ms(�C) � 561 � 474C � 33Mn � 17Ni � 17Cr� 21Mo
where carbon, manganese, nickel, chromium,and molybdenum are concentrations of these ele-ments in percent. For carbon concentrationsgreater than 0.5%, corrections must be made us-ing Fig. 64 (Ref 30).
The Mf temperature is typically approximately215 �C (385 �F) below the Ms (Ref 40). Typi-
210 / Manufacturing Aspects of Failure and Prevention
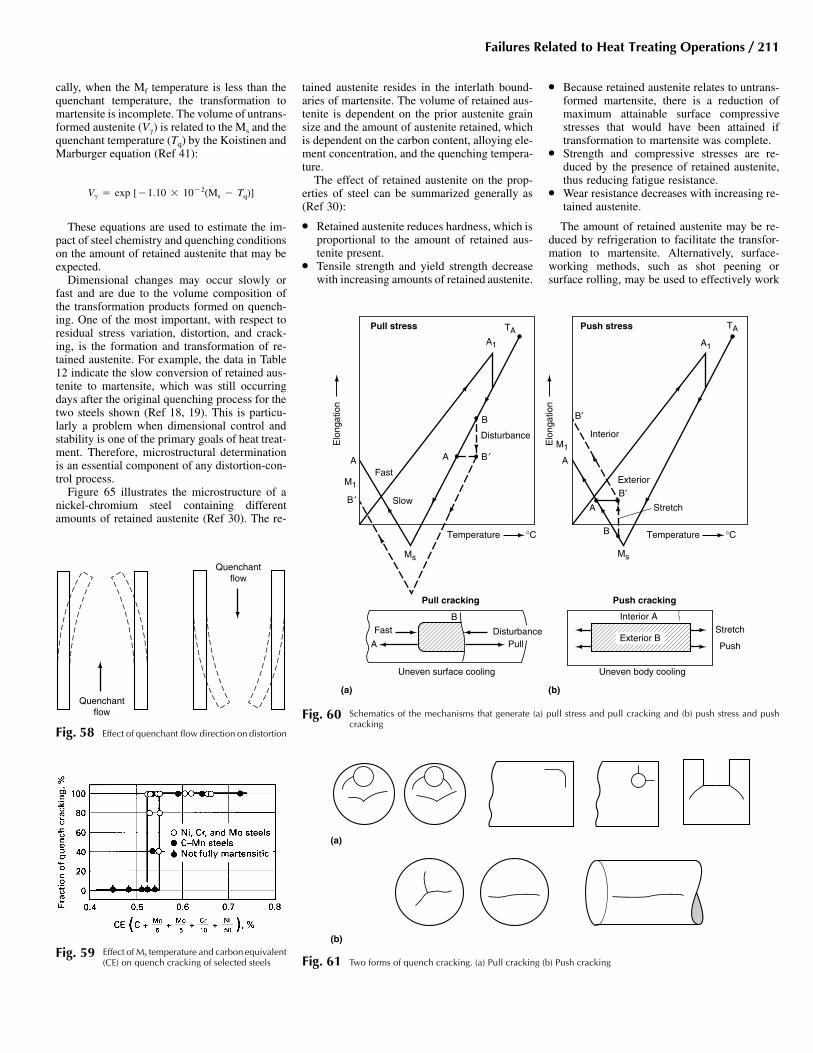
Fig. 59 Effect of Ms temperature and carbon equivalent(CE) on quench cracking of selected steels
Quenchantflow
Quenchantflow
Fig. 58 Effect of quenchant flow direction on distortion
(a)
(b)
Fig. 61 Two forms of quench cracking. (a) Pull cracking (b) Push cracking
(a) (b)
TATA
A1 A1
Ms Ms
B
B
A
A
A
Fast
Slow
Disturbance
Disturbance
Temperature °C Temperature °C
Pull
Fast
Pull stress
Pull cracking Push cracking
Elo
ngat
ion
Push stress
Elo
ngat
ion
B ′
M1
A
B
M1
A
Stretch
Stretch
Push
Uneven body coolingUneven surface cooling
Exterior
Interior
Interior A
Exterior B
B ′
B′
B′
Fig. 60 Schematics of the mechanisms that generate (a) pull stress and pull cracking and (b) push stress and pushcracking
cally, when the Mf temperature is less than thequenchant temperature, the transformation tomartensite is incomplete. The volume of untrans-formed austenite (Vc) is related to the Ms and thequenchant temperature (Tq) by the Koistinen andMarburger equation (Ref 41):
Vc � exp [�1.10 � 10�2(Ms � Tq)]
These equations are used to estimate the im-pact of steel chemistry and quenching conditionson the amount of retained austenite that may beexpected.
Dimensional changes may occur slowly orfast and are due to the volume composition ofthe transformation products formed on quench-ing. One of the most important, with respect toresidual stress variation, distortion, and crack-ing, is the formation and transformation of re-tained austenite. For example, the data in Table12 indicate the slow conversion of retained aus-tenite to martensite, which was still occurringdays after the original quenching process for thetwo steels shown (Ref 18, 19). This is particu-larly a problem when dimensional control andstability is one of the primary goals of heat treat-ment. Therefore, microstructural determinationis an essential component of any distortion-con-trol process.
Figure 65 illustrates the microstructure of anickel-chromium steel containing differentamounts of retained austenite (Ref 30). The re-
tained austenite resides in the interlath bound-aries of martensite. The volume of retained aus-tenite is dependent on the prior austenite grainsize and the amount of austenite retained, whichis dependent on the carbon content, alloying ele-ment concentration, and the quenching tempera-ture.
The effect of retained austenite on the prop-erties of steel can be summarized generally as(Ref 30):
● Retained austenite reduces hardness, which isproportional to the amount of retained aus-tenite present.
● Tensile strength and yield strength decreasewith increasing amounts of retained austenite.
● Because retained austenite relates to untrans-formed martensite, there is a reduction ofmaximum attainable surface compressivestresses that would have been attained iftransformation to martensite was complete.
● Strength and compressive stresses are re-duced by the presence of retained austenite,thus reducing fatigue resistance.
● Wear resistance decreases with increasing re-tained austenite.
The amount of retained austenite may be re-duced by refrigeration to facilitate the transfor-mation to martensite. Alternatively, surface-working methods, such as shot peening orsurface rolling, may be used to effectively work
Failures Related to Heat Treating Operations / 211

Fig. 63 Influence of carbon content on the formationof retained austenite. Source: Ref 30
Cracks are not formed
Cracks are formed
φ
PSC
PSC
PSC
PSC
PSC
PSC
A
A
A AB Rotate
View A
B
A − A
A − A
B − B
Fig. 62 Polyakov rules for immersion of cylindricalparts into a quenchant. The dashed horizontal
lines indicate the level of the liquid; the vertical arrowsindicate the direction of immersion of the part. PSC indi-cates the perimeter of the stress concentrator.
Carbon, %
0.5 0.7 0.9 1.1
Add
ition
nec
essa
ry to
cor
rect
the
Ms
tem
pera
ture
val
uede
rived
from
Ste
ven
and
Hay
nes
form
ula,
°C 160
120
80
40
0
180
Incompletely austenitized steelstreated from Ac1 + 100 °C (±30)
Steels with>1.1% (Cr + Mo)
Steels with<1.1% (Cr + Mo)
Fully austenitized steels
Fig. 64 Correction curves for use with the Steven andHaynes equation, with Parrish modifications
indicated by dashed lines (see Ref 30). When the carboncontent is less than 0.9%, an 830 �C (1530 �F) soak forgreater than 2 h should produce a fully austenitic structure.Source: Ref 30
harden the surface, resulting in higher compres-sive stresses.
Quenching Methods
Part design, materials selection, quenchant se-lection, and so on are important factors for sup-pressing quench distortion and cracking of steelparts. In addition, several methods for minimiz-ing distortion and eliminating cracking may alsobe used, for example, interrupted quenching andpress quenching.
Interrupted Quenching Techniques. Inter-rupted quenching refers to the rapid cooling ofthe steel parts from the austenitizing temperatureto a temperature where it is held for a specifiedperiod of time, followed by slow cooling. Thereare several different types of interrupted quench-ing: austempering, marquenching (martemper-ing), time quenching, and so on. The temperatureat which the quenching is interrupted, the lengthof time the steel is held at temperature, and therate of cooling can vary, depending on the typeof steel and workpiece thickness.
Marquenching (martempering) is a term usedto describe an interrupted quenching from theaustenitizing temperature of steels. The purposeis to delay the cooling just above the martensitictransformation temperature until temperatureequalization is achieved throughout the steel
part. This minimizes the distortion, cracking, andresidual stress. The term martempering is some-what misleading, and the process is better de-scribed as marquenching. Figures 66(a) and (b)(Ref 42) show the significant difference betweenconventional quenching and marquenching. Themarquenching of steel consists of:
● Quenching from the austenitizing tempera-ture into a hot quenching medium (hot oil,molten salt, molten metal, or a fluidized par-ticle bed) at a temperature usually above themartensite range (Ms point)
● Submerging in the quenching medium untilthe temperature throughout the steel work-piece is substantially uniform
● Cooling (usually in air) at a moderate rate toprevent large differences in temperature be-tween the outside and the core of the work-piece
The formation of martensite occurs fairly uni-formly throughout the workpiece during thecooling to room temperature, thereby avoidingexcessive amounts of residual stress. Straight-ening or forming is also easily accomplished onremoval from the marquenching bath while thepart is still hot. The marquenching can be ac-complished in a variety of baths, including hotoil, molten salt, molten metal, or a fluidized par-ticle bed. Cooling from the marquenching bathto room temperature is usually conducted in stillair. Deeper hardening steels are susceptible tocracking while martensite forms, if the coolingrate is too rapid. Marquenched parts are tem-pered in the same manner as conventionalquenched parts. The time lapse before temperingis not as critical, because the stress is greatlyreduced.
The advantage of marquenching lies in the re-duced thermal gradient between surface and coreas the part is quenched to the isothermal tem-perature and then is air cooled to room tempera-ture. Residual stresses developed during mar-quenching are lower than those developedduring conventional quenching, because thegreatest thermal variations occur while the steelis in the relatively plastic austenitic condition,and because the final transformation and thermalchanges occur throughout the part at approxi-mately the same time. Marquenching also re-duces susceptibility to cracking.
Modified marquenching differs from standardmarquenching only in that the temperature of thequenching bath is below the Ms point (Fig. 66c)(Ref 42). The lower temperature increases theseverity of quenching. This is important forsteels of lower hardenability that require fastercooling in order to harden to sufficient depth.Therefore, modified marquenching is applicableto a greater range of steel compositions than isthe standard marquenching.
Austempering consists of rapidly cooling thesteel part from the austenitizing temperature toa temperature above that of martensite forma-tion, holding at a constant temperature to allowisothermal transformation, followed by air cool-ing. The steel parts must be cooled fast enoughso that no transformation of austenite occurs dur-ing cooling and then held at bath temperaturelong enough to ensure complete transformationof austenite to bainite. Molten salt baths are usu-ally the most practical for austempering appli-cations. Parts can usually be produced with lessdimensional change by austempering than byconventional quenching and tempering. In ad-dition, austempering can decrease the likelihoodof cracking and can improve ductility, notchtoughness, and wear resistance. However, aus-tempering is applicable to a limited steel andparts size. Important considerations for the se-lection of steel parts for austempering are:
● The location for the nose of the time-temperature-transformation (TTT) curve andthe speed of the quenching
212 / Manufacturing Aspects of Failure and Prevention

Fig. 65 Retained austenite (white) and martensite in the surfaces of carburized and hardened nickel-chromium steeltestpieces. (a) Approximately 40% retained austenite. (b) Approximately 15% retained austenite. Both 550�.
Source: Ref 30
Table 12 Dimensional variation in hardened high-carbon steel with time at ambienttemperature
Steel type
Temperingtemperature Hardness, Change in length, % � 103
�C �F HRC After 7 days After 30 days After 90 daysAfter 365 days
1.1% C tool steel (790 �C, or1450 �F, quench)
None 66 �9.0 �18.0 �27.0 �40.0120 250 65 �0.2 �0.6 �1.1 �1.9205 400 63 0.0 �0.2 �0.3 �0.7260 500 61.5 0.0 �0.2 �0.3 �0.3
1% C/Cr (840 �C, or 1540�F, quench)
None 64 �1.0 �4.2 �8.2 �11.0120 250 65 0.3 0.5 0.7 0.6205 400 62 0.0 �0.1 �0.1 �0.1260 500 60 0.0 �0.1 �0.1 �0.1
● The time required for complete transforma-tion of austenite to bainite at the austemperingtemperature
● The location of the Ms point● Maximum thickness of section that can be
austempered to a fully bainite structure
Carbon steels of lower carbon content are re-stricted to a lesser thickness. For 1080 steel, themaximum section thickness is approximately 5mm (0.2 in.). Low-alloy steels are usually re-stricted to approximately 10 mm (3⁄8 in.) or thin-ner sections, while more hardenable steels canbe austempered in sections up to 25 mm (1 in.)thick. Nevertheless, sections of carbon steelthicker than 5 mm (0.2 in.) are regularly austem-pered in production, when some pearlite is per-missible in the microstructure (Ref 43).
Time quenching is one of the interruptedquenching methods and is used when the coolingrate of the part being quenched needs to beabruptly changed during the cooling cycle. Theusual practice is to lower the temperature of thepart by quenching in a medium with high heat-removal characteristics (for example, water) un-til the part has cooled below the nose of the TTTcurve and then to transfer the part to a secondmedium (for example, oil, air, an inert gas), sothat it cools more slowly through the martensiteformation range. Time quenching is most oftenused to minimize distortion, cracking, and di-mensional changes.
Restraint Quenching Techniques. Restraintquenching refers to quenching under restraint ofdistortion of steel, for example, quenching byusing restraint fixtures, press quenching, cold diequenching, plague quenching, and so on. Thereare many round, flat, or cylindrical parts that dis-tort to an unacceptable degree by conventionalimmersion quenching. Under such conditions, itis necessary to resort to special techniques. How-ever, the equipment for those special techniquesis expensive, and production rates are slow. Con-sequently, the resulting cost of heat treatment isrelatively high. Therefore, use of these tech-niques should be considered only when minimaldistortion is mandatory. Press quenching isclosely related to intense quenching, which isdiscussed elsewhere in this article.
Restraint fixturing is costly and is used pri-marily for highly specialized applications. Rep-resentative examples are the quenching of rocketand missile casings or other large componentswith thin wall sections.
Press Quenching and Plug Quenching. Prob-ably the most widely used special technique ispress quenching. To minimize distortion causedby the quenching cycle, press and plug quench-ing dies must be made to provide the properquenchant flow and hold critical dimensions ofthe part being quenched. In quenching, the dieor plague contacts the heated part, and the pres-sure of the press restrains the part mechanically.This occurs before quenching begins, while thepart is hot and plastic. The machine and dies thenforce the quenching medium into contact withthe part in a controlled manner.
Cold Die Quenching. Thin disks, long thinrods, and other delicate parts that distort exces-sively by conventional immersion quenching canoften be quenched between cold dies with nodistortion. Cold die quenching is limited to partswith a large surface area and small mass, suchas washers, rods of small diameter, thin blades,and so on. Large, thin thrust washers have to beflat after quench hardening, but considerable dis-tortions are developed as a result of blanking andmachining stresses. To ensure the required flat-ness, the washers are squeezed between a pair ofwater-cooled dies immediately after leaving thefurnace.
Other quenching methods include selectivequenching, spray quenching, and intensivequenching.
Selective quenching is used when it is desir-able for certain areas of a part to be relativelyunaffected by the quenching medium. This canbe accomplished by insulating an area to be moreslowly cooled, so the quenchant contacts onlythose areas of the part that are to be rapidlycooled. A clay-coating method may be employedfor selective quenching, as in, for example, thewater quenching of Japanese swords. The dis-tortion and microstructure of Japanese swords iscontrolled by the thickness distribution of theclay layer. A thick clay layer (�0.1 mm, or 0.004in.) suppresses the cooling rate by its insulating
effect, and a thin clay layer increases the coolingrate during water quenching by its cooling ac-celerating effect (Fig. 67). Selective quenchingis often effective for suppressing excessive dis-tortion or cracking.
Spray quenching involves directing high-pres-sure streams of liquid onto the surfaces of steelparts. Spray quenching is often useful for mini-mizing distortion and cracking, because it canrealize a uniform quenching by selecting optimalspray condition and the sprayed surfaces wherehigher cooling rates are desired. The cooling ratecan be faster, because the quenchant dropletsformed by the high-intensity spray impact thepart surface and remove heat very effectively.
Fog quenching uses a fine fog or mist of liquiddroplets in a gas carrier as the cooling agent.Although similar to spray quenching, fogquenching produces lower cooling rates becauseof the relatively low liquid content of the stream.
Intensive quenching (Ref 44) involves forced-convection heat exchange both during high-tem-perature cooling and also during the transfor-mation of austenite into martensite. Intensivequenching promotes temperature uniformityduring cooling through the cross section of thepart. Cooling intensity should be sufficient topromote maximum surface compressive stresses.This occurs when the Biot number �18. The sec-ond criterion of intensive quenching is that the
Failures Related to Heat Treating Operations / 213

Fig. 66 Comparison of cooling curves as a workpiece cools into and through the martensite transformation range for a conventional quenching and tempering process and forinterrupted quenching processes. (a) Conventional quenching and tempering. (b) Marquenching. (c) Modified marquenching. Ae1, austenite start transformation under
equilibrium conditions
00
200
400
600
1000
800
Time, s
1 2 3 4 5 6 7 8 9 10
Tem
pera
ture
, °C
Without coating
Clay coating15 µm thick
15 µm
25 µm40 µm
80 µm
Without coating
Clay coating5 µm thick
15 µm
25 µm40 µm
80 µm
Fig. 67 Effect of clay coating on cooling curves of steel test specimen quenched into still water at 30 �C (86 �F). Testspecimen, JIS S45C steel cylinder (10 mm, or 0.40 in., diam � 30 mm, or 1.2 in., long)
Fig. 68 Oxidation potential of alloying elements andiron in steel heated in endothermic gas with an
average composition of 40% H2, 20% CO, 1.5% CH4,0.5% CO2, 0.28% H2O (dewpoint, 10 �C, or 50 �F), and37.72% N2. Source: Ref 30
intensive cooling be stopped at the moment thatmaximum surface compressive stresses areformed.
Steel TransformationProducts and Properties
Internal oxidation, also called subscale for-mation, is the formation of corrosion productparticles below the surface of the metal. Internaloxidation has a deleterious effect on hardness,bending fatigue strength, residual stresses, andwear resistance.
Internal oxidation occurs preferentially withcertain alloy constituents, primarily manganese,chromium, and silicon, by inward diffusion ofoxygen, sulfur, and other gases to the site of ox-idation during carburizing using an endothermicatmosphere at 900 to 950 �C (1650 to 1740 �F).
The oxygen content and depth of oxygen pen-etration increase with increasing oxygen poten-tial (concentration) at a particular temperature.However, the depth of penetration increases withboth temperature and time, as shown in Fig. 69(Ref 30). Because the oxygen potential decreaseswith increasing carbon potential, the amount ofinternal oxidation is less at higher-carbon-poten-tial carburizing processes, depending on the car-burizing time.
Metallographically, there are two commonforms of internal oxidation observed. The firsttype appears as globular particles of approxi-mately 0.5 lm in diameter from nearest to thesurface to a depth of approximately 8 lm. Al-though these oxides may occur along the surface,they usually are found in the grain and subgrainboundaries and possibly within the grain. If theoxidation occurs on the surface, the grains aretypically 0.5 to 1 lm, although they may be aslarge as 2 to 4 lm (Ref 38).
The second type of internal oxides occurs atgreater depths, typically 5 to 25 lm and appear
An endothermic atmosphere (endogas) is pro-duced by the controlled combustion of a hydro-carbon gas, such as natural gas and propane, withair. The oxygen required for internal oxidation isderived primarily from carbon dioxide and watervapor, the by-products of the combustion pro-cess. Figure 68 shows the oxidation potential ofvarious alloying elements in an endothermic gas(Ref 30).
It is essentially impossible to eliminate inter-nal oxidation when carburizing using an endo-thermic atmosphere. The presence of approxi-mately 0.25% Si in carburizing grades of steelfar exceeds the amount necessary to produce in-ternal oxidation. In addition, the presence of sil-icon also reduces the threshold concentrations ofmanganese and chromium that produce internaloxidation. However, the sensitivity to internaloxidation may be decreased by the presence ofalloying elements with atomic numbers greaterthan iron, such as nickel and molybdenum.
214 / Manufacturing Aspects of Failure and Prevention

0
0.004
20 4Carburizing time, h
Dep
th o
f oxi
datio
n, m
m
6 8 10
0.008
0.012
0.016
0.020
1000 °C
850 °C
Fig. 70 Depth of oxidized zones as a function of car-burizing time at different carburizing tempera-
tures for SAE 1015. Source: Ref 30
Fig. 69 Internal oxidation of a nickel-chromium steelcarburized in a laboratory furnace, showing
both grain-boundary oxides and oxide precipitates withingrains. 402�. Source: Ref 30
Fig. 71 Micrograph of AISI 4140 steel as quenched andtempered; microstructure is tempered marten-
site, where cracking is promoted by alloy depletion. 91�;2% nital etch. Source: Ref 27
Table 13 American National Standards Institute/American Gear ManufacturersAssociation (ANSI/AGMA) 2001-C95 standard values for acceptable depth of internaloxidation for carburized gears relative to case depth (tooth size)
Grade 2 Grade 3 Case depth
mm in. mm in. mm in.
0.0178 0.0007 0.0127 0.0005 �0.75 �0.0300.0254 0.0010 0.0203 0.0008 0.75–1.50 0.030–0.0590.0381 0.0015 0.0203 0.0008 1.50–2.25 0.059–0.0890.0508 0.0020 0.0254 0.0010 2.25–3.00 0.089–0.1180.0610 0.0024 0.0305 0.0012 �3.00 �0.118
as a dark phase at prior austenite grain bound-aries, as illustrated in Fig. 70 (Ref 30, 45). Thus,surface grain size also influences the amount ofinternal oxidation. As the grain size increases,the potential for internal oxidation within thegrains increases (Ref 30).
Internal oxidation is also affected by the sur-face condition of the material being carburized,because organic impurities, such as lubricants,can contaminate the furnace atmosphere, and thepresence of oxides due to scale or corrosion af-fect the formation and depth of penetration ofinternal oxidation. Although surface oxides maybe removed by electropolishing, electrochemicalmachining, honing, grinding, shot blasting, orpeening, these methods must be selected withcare, because they may induce such negative ef-fects as increased tensile stresses, risk of induc-ing decarburization during subsequent reheatingprocesses, or these processes may not allow pre-cise control.
Table 13 provides the maximum acceptabledepth of internal oxidation relative to the casedepth for carburized gears. (See also Interna-tional Organization for Standardization (ISO)6336-5.2; the equivalent grades are ML, MQ,and ME.) Note that grade 1 has no specificationvalue. Also, recovery by shot peening is accept-able, with agreement of the customer.
Alloy Depletion. Another source of nonho-mogeneous steel composition is alloy depletion.As with nonmetallic inclusions, alloy depletionleads to greater stresses and cracking, as illus-trated in Fig. 71 (Ref 27). Examples of alloysparticularly susceptible to alloy depletion areAISI 4100, 4300, and 8600 series.
High-temperature transformation prod-ucts (HTTP) are products that form on the sur-face of a carburized part within the same areawhere internal oxidation occurs. High-tempera-ture transformation products are nonmartensiticmicrostructures that include pearlite, upper andlower bainite, or mixtures of two or more ofthese products. A lean-alloy steel or large crosssection favors pearlite at the surface, whereashigher-alloy steel or thinner cross section favorsthe formation of bainitic microstructures whenquenched. However, if the cooling rate is suffi-
ciently fast or if sufficient quantities of reducingelements, such as nickel and molybdenum, arewithin the oxide-forming region, it is possiblethat no HTTP is formed (Ref 30, 46).
The formation of internal oxidation productseffectively results in localized depletion of theelements that are preferentially oxidized, such asmanganese and chromium. When HTTP arepresent, they often extend deeper than the inter-nal oxidation, especially with leaner steel grades.The occurrence of HTTP results in lower hard-ness, reduction of surface compressive stresses,reduction of bending fatigue, and reduction ofwear resistance.
The effects of HTTP can be controlled by (Ref30):
● Using a steel grade with sufficient alloy con-tent in the depleted layer to give martensiteon quenching
● Reducing the amount of HTTP in the surfacelayer by a late increase of carbon potential ora late addition of ammonia to the furnacechamber
● Using a faster quench to suppress HTTP for-mation; however, beware of possible in-creased distortion
● Removing HTTP by grinding, grit blasting,and/or shot peening
Decarburization is defined as “a loss of car-bon atoms from the surface of a workpiece,thereby producing a surface with a lower carbongradient than at some short distance below thesurface” (Ref 30). This is important, because the
strength of steel is dependent on carbon content(carbides) within the steel structure. If surfacecarbon is greater than 0.6%, the surface hardnessshould be acceptable. If surface carbon is ap-proximately 0.6% or less, all the main propertiesare adversely affected; for example, bending fa-tigue could be reduced by 50%.
The depth of decarburization is defined as “thethickness of the layer in which the structure dif-fers significantly from that of the core.” Com-plete decarburization results in a completely fer-ritic microstructure within the surface layer. Thedepth of decarburization is the thickness of thislayer. In the zone of partial decarburization, thereis a gradual increase of carbon content within theferritic layer to the core. Decarburization is ob-served metallographically. Figure 72(a) illus-trates complete decarburization on the surface of1018 steel. Figure 72(b) illustrates partial decar-burization (Ref 30).
Carbon may also be oxidized under the sameconditions leading to metallic oxidation (scal-ing). Therefore, although decarburization mayoccur independently of scaling, they typicallyoccur simultaneously. During carbon oxidation,gaseous by-products (CO and CO2) are formed.Usually, the most important factor controllingthe rate of decarburization is the diffusion rateof carbon within the metal that must replace thecarbon lost due to volatilization.
Although decarburization may occur at tem-peratures above 700 �C (1290 �F), decarburiza-tion is typically most severe when steel is heatedto temperatures above 910�C (1670 �F) (Ref 47).
Failures Related to Heat Treating Operations / 215
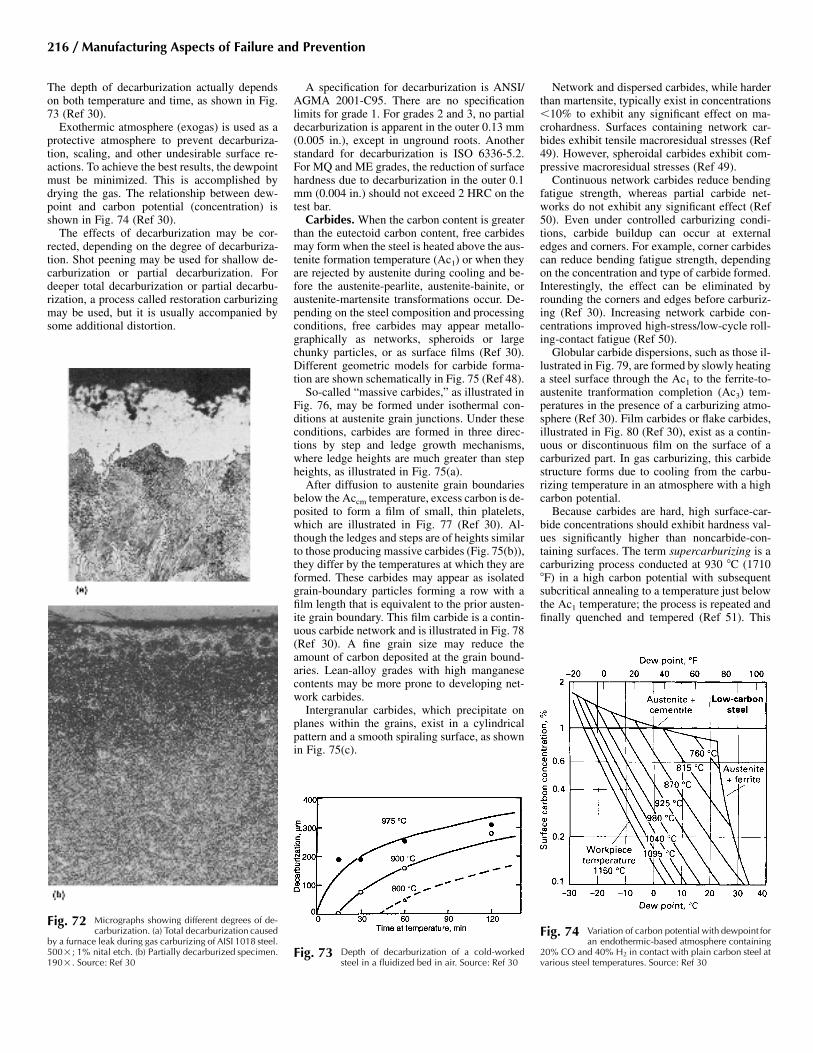
Fig. 73 Depth of decarburization of a cold-workedsteel in a fluidized bed in air. Source: Ref 30
Fig. 72 Micrographs showing different degrees of de-carburization. (a) Total decarburization caused
by a furnace leak during gas carburizing of AISI 1018 steel.500�; 1% nital etch. (b) Partially decarburized specimen.190�. Source: Ref 30
Fig. 74 Variation of carbon potential with dewpoint foran endothermic-based atmosphere containing
20% CO and 40% H2 in contact with plain carbon steel atvarious steel temperatures. Source: Ref 30
The depth of decarburization actually dependson both temperature and time, as shown in Fig.73 (Ref 30).
Exothermic atmosphere (exogas) is used as aprotective atmosphere to prevent decarburiza-tion, scaling, and other undesirable surface re-actions. To achieve the best results, the dewpointmust be minimized. This is accomplished bydrying the gas. The relationship between dew-point and carbon potential (concentration) isshown in Fig. 74 (Ref 30).
The effects of decarburization may be cor-rected, depending on the degree of decarburiza-tion. Shot peening may be used for shallow de-carburization or partial decarburization. Fordeeper total decarburization or partial decarbu-rization, a process called restoration carburizingmay be used, but it is usually accompanied bysome additional distortion.
A specification for decarburization is ANSI/AGMA 2001-C95. There are no specificationlimits for grade 1. For grades 2 and 3, no partialdecarburization is apparent in the outer 0.13 mm(0.005 in.), except in unground roots. Anotherstandard for decarburization is ISO 6336-5.2.For MQ and ME grades, the reduction of surfacehardness due to decarburization in the outer 0.1mm (0.004 in.) should not exceed 2 HRC on thetest bar.
Carbides. When the carbon content is greaterthan the eutectoid carbon content, free carbidesmay form when the steel is heated above the aus-tenite formation temperature (Ac1) or when theyare rejected by austenite during cooling and be-fore the austenite-pearlite, austenite-bainite, oraustenite-martensite transformations occur. De-pending on the steel composition and processingconditions, free carbides may appear metallo-graphically as networks, spheroids or largechunky particles, or as surface films (Ref 30).Different geometric models for carbide forma-tion are shown schematically in Fig. 75 (Ref 48).
So-called “massive carbides,” as illustrated inFig. 76, may be formed under isothermal con-ditions at austenite grain junctions. Under theseconditions, carbides are formed in three direc-tions by step and ledge growth mechanisms,where ledge heights are much greater than stepheights, as illustrated in Fig. 75(a).
After diffusion to austenite grain boundariesbelow the Accm temperature, excess carbon is de-posited to form a film of small, thin platelets,which are illustrated in Fig. 77 (Ref 30). Al-though the ledges and steps are of heights similarto those producing massive carbides (Fig. 75(b)),they differ by the temperatures at which they areformed. These carbides may appear as isolatedgrain-boundary particles forming a row with afilm length that is equivalent to the prior austen-ite grain boundary. This film carbide is a contin-uous carbide network and is illustrated in Fig. 78(Ref 30). A fine grain size may reduce theamount of carbon deposited at the grain bound-aries. Lean-alloy grades with high manganesecontents may be more prone to developing net-work carbides.
Intergranular carbides, which precipitate onplanes within the grains, exist in a cylindricalpattern and a smooth spiraling surface, as shownin Fig. 75(c).
Network and dispersed carbides, while harderthan martensite, typically exist in concentrations�10% to exhibit any significant effect on ma-crohardness. Surfaces containing network car-bides exhibit tensile macroresidual stresses (Ref49). However, spheroidal carbides exhibit com-pressive macroresidual stresses (Ref 49).
Continuous network carbides reduce bendingfatigue strength, whereas partial carbide net-works do not exhibit any significant effect (Ref50). Even under controlled carburizing condi-tions, carbide buildup can occur at externaledges and corners. For example, corner carbidescan reduce bending fatigue strength, dependingon the concentration and type of carbide formed.Interestingly, the effect can be eliminated byrounding the corners and edges before carburiz-ing (Ref 30). Increasing network carbide con-centrations improved high-stress/low-cycle roll-ing-contact fatigue (Ref 50).
Globular carbide dispersions, such as those il-lustrated in Fig. 79, are formed by slowly heatinga steel surface through the Ac1 to the ferrite-to-austenite tranformation completion (Ac3) tem-peratures in the presence of a carburizing atmo-sphere (Ref 30). Film carbides or flake carbides,illustrated in Fig. 80 (Ref 30), exist as a contin-uous or discontinuous film on the surface of acarburized part. In gas carburizing, this carbidestructure forms due to cooling from the carbu-rizing temperature in an atmosphere with a highcarbon potential.
Because carbides are hard, high surface-car-bide concentrations should exhibit hardness val-ues significantly higher than noncarbide-con-taining surfaces. The term supercarburizing is acarburizing process conducted at 930 �C (1710�F) in a high carbon potential with subsequentsubcritical annealing to a temperature just belowthe Ac1 temperature; the process is repeated andfinally quenched and tempered (Ref 51). This
216 / Manufacturing Aspects of Failure and Prevention

Fig. 76 Micrograph of 4% Ni-C-Cr carburized steelshowing massive carbides produced during
carburizing with surface carbon above Accm carbon.Source: Ref 30
LedgeLedge
StepStep
Grain C
Grain AGrain B
(a) (b) (c)
Fig. 75 Geometric models of carbides formed during case hardening. (a) Massive carbide grain, 4000�. (b) Filmcarbide, 2000�. (c) Intergranular carbide, 4000�. Source: Ref 30
process results in surface carbon contents of 1.8to 3% and greater than 25% carbides. Supercar-burized parts exhibit up to 15% better bendingfatigue properties. Coarse carbide structure mayresult in significantly reduced contact fatigue(Ref 30). Wear resistance generally increaseswith increasing carbide concentration.
Carbide particles may be unavoidably formedduring reheat-quenched carburized alloy steels.These dispersed, fine particles generally do notproduce detrimental effects and may even be un-avoidable in reheat-quenched carburized alloysteels. However, massive carbides, which maybe formed at grain boundaries in the outer 0.05mm (0.002 in.) at corners and edges, may bedetrimental. Network carbides, which are formedduring posthardening processes, can be detri-mental to properties.
Influential Microstructural Features
Grain Size. The mechanical properties andtoughness of steel, both in the case and core ifthe steel is carburized, are not only affected by
carbon and alloying element concentration andmicrostructure but also by the grain size. Typi-cally, finer grain sizes are preferred. The ASTM
grain size characterization comparison is illus-trated in Fig. 81 (Ref 30).
Figure 82 illustrates the effect of increasingtemperature on grain size (Ref 47). The follow-ing are reasons for grain growth when the tem-perature was increased from 850 to 1250 �C(1560 to 2280 �F) (Ref 52):
● Grain resorption occurs at 50 to 100 �C (90to 180 �F) above Ac3
● New boundaries and grains are formed at 250to 300�C (450 to 540 �F) above Ac3
● Although boundary migration occurs at alltemperatures, it only affects grain growthabove 1100 �C (2010 �F).
If the fractured surface of a steel tool or ma-chine component is coarse grained, this often in-dicates the use of excessively high austenitizingtemperatures during heat treatment, or that anincorrect heat treatment for a given steel grade
Fig. 77 Direct quenching from carburizing temperature. (a) Phase diagram schematic. (b) Continuous cooling trans-formation curve for a high-carbon surface. (c) Micrograph of direct quenched 3% Ni-Cr carburized steel.
280�. Source: Ref 30
Failures Related to Heat Treating Operations / 217
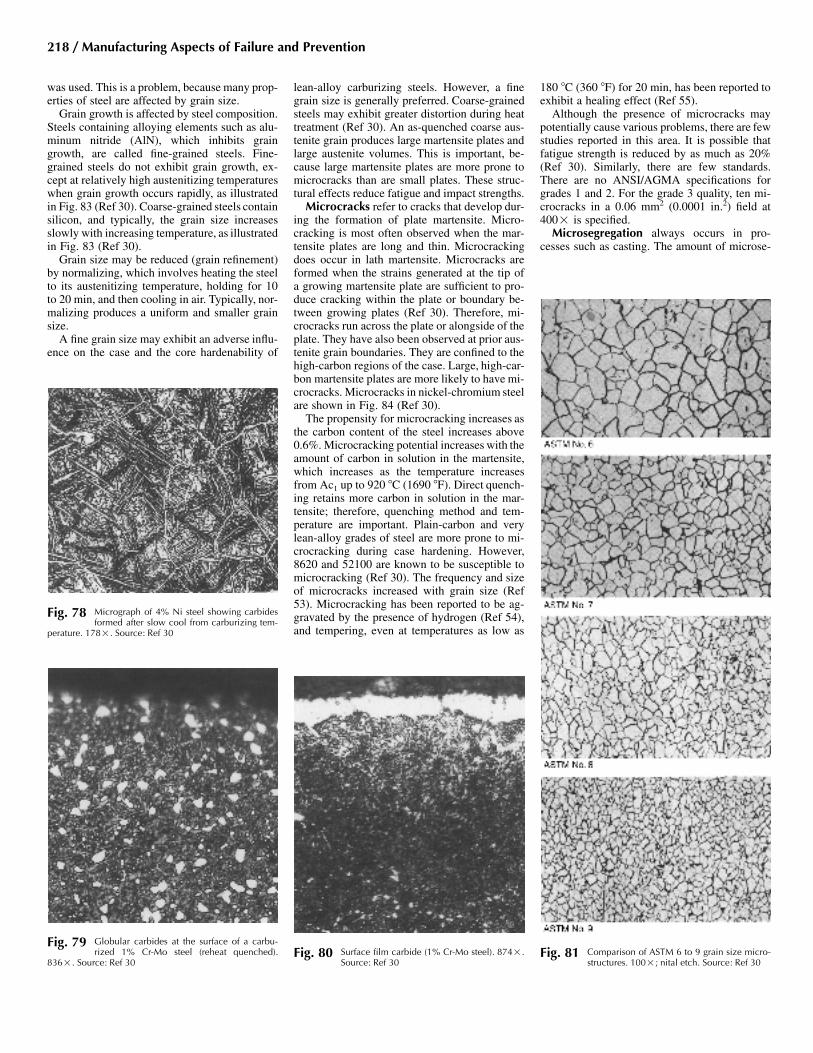
Fig. 78 Micrograph of 4% Ni steel showing carbidesformed after slow cool from carburizing tem-
perature. 178�. Source: Ref 30
Fig. 79 Globular carbides at the surface of a carbu-rized 1% Cr-Mo steel (reheat quenched).
836�. Source: Ref 30
180 �C (360 �F) for 20 min, has been reported toexhibit a healing effect (Ref 55).
Although the presence of microcracks maypotentially cause various problems, there are fewstudies reported in this area. It is possible thatfatigue strength is reduced by as much as 20%(Ref 30). Similarly, there are few standards.There are no ANSI/AGMA specifications forgrades 1 and 2. For the grade 3 quality, ten mi-crocracks in a 0.06 mm2 (0.0001 in.2) field at400� is specified.
Microsegregation always occurs in pro-cesses such as casting. The amount of microse-
was used. This is a problem, because many prop-erties of steel are affected by grain size.
Grain growth is affected by steel composition.Steels containing alloying elements such as alu-minum nitride (AlN), which inhibits graingrowth, are called fine-grained steels. Fine-grained steels do not exhibit grain growth, ex-cept at relatively high austenitizing temperatureswhen grain growth occurs rapidly, as illustratedin Fig. 83 (Ref 30). Coarse-grained steels containsilicon, and typically, the grain size increasesslowly with increasing temperature, as illustratedin Fig. 83 (Ref 30).
Grain size may be reduced (grain refinement)by normalizing, which involves heating the steelto its austenitizing temperature, holding for 10to 20 min, and then cooling in air. Typically, nor-malizing produces a uniform and smaller grainsize.
A fine grain size may exhibit an adverse influ-ence on the case and the core hardenability of
lean-alloy carburizing steels. However, a finegrain size is generally preferred. Coarse-grainedsteels may exhibit greater distortion during heattreatment (Ref 30). An as-quenched coarse aus-tenite grain produces large martensite plates andlarge austenite volumes. This is important, be-cause large martensite plates are more prone tomicrocracks than are small plates. These struc-tural effects reduce fatigue and impact strengths.
Microcracks refer to cracks that develop dur-ing the formation of plate martensite. Micro-cracking is most often observed when the mar-tensite plates are long and thin. Microcrackingdoes occur in lath martensite. Microcracks areformed when the strains generated at the tip ofa growing martensite plate are sufficient to pro-duce cracking within the plate or boundary be-tween growing plates (Ref 30). Therefore, mi-crocracks run across the plate or alongside of theplate. They have also been observed at prior aus-tenite grain boundaries. They are confined to thehigh-carbon regions of the case. Large, high-car-bon martensite plates are more likely to have mi-crocracks. Microcracks in nickel-chromium steelare shown in Fig. 84 (Ref 30).
The propensity for microcracking increases asthe carbon content of the steel increases above0.6%. Microcracking potential increases with theamount of carbon in solution in the martensite,which increases as the temperature increasesfrom Ac1 up to 920 �C (1690 �F). Direct quench-ing retains more carbon in solution in the mar-tensite; therefore, quenching method and tem-perature are important. Plain-carbon and verylean-alloy grades of steel are more prone to mi-crocracking during case hardening. However,8620 and 52100 are known to be susceptible tomicrocracking (Ref 30). The frequency and sizeof microcracks increased with grain size (Ref53). Microcracking has been reported to be ag-gravated by the presence of hydrogen (Ref 54),and tempering, even at temperatures as low as
Fig. 81 Comparison of ASTM 6 to 9 grain size micro-structures. 100�; nital etch. Source: Ref 30
Fig. 80 Surface film carbide (1% Cr-Mo steel). 874�.Source: Ref 30
218 / Manufacturing Aspects of Failure and Prevention

Fig. 82 Schematic illustration of the effect of austeni-tizing temperature on grain size of a eutectoid
steel after normalizing. Source: Ref 47
gregation in steel castings is affected by the alloycontent of the steel, including tramp elements.The propensity for microsegregation is alloy-de-pendent. Silicon and manganese affect the mi-crosegregation of molybdenum, and manganeseaffects the microsegregation of sulfur. In addi-tion to microstructural analysis, elemental anal-ysis may also provide an invaluable insight intopotential for inclusion formation. For example,sulfide inclusions may be obtained if insufficientmanganese is present. Generally, the manganesecontent should be approximately five times thesulfur content to convert sulfur to manganese
sulfide. The order of microsegregation suscepti-bility (from most to least) is sulfur, niobium,phosphorus, tin, molybdenum, chromium, sili-con, manganese, and nickel (Ref 30). Figure 85illustrates dendritic microsegregation of a frac-tured gear tooth (Ref 30).
Steel cracking may result from chemical seg-regation, which may be evident in the form ofbanding, as shown in Fig. 86 (Ref 27) Micro-structural analysis showed that bands of tem-pered martensite were associated with bands oftempered martensite and bainite. The bainite ap-peared to originate from carbon and manganesesegregation within the material, which wouldlead to increased internal stresses. Both surfaceand subsurface cracking was observed. Figure 87shows subsurface cracking, which appeared tobe intergranular (Ref 27).
In a similar case, AISI 1144, a resulfurizedsteel, pins with subsequent cracking at the pintips were accompanied with soft spotting. (Thepins were through-hardened prior to inductionhardening of the pin tip.) Microstructural anal-ysis showed that the cracking and soft spottingcondition was due to stringer inclusions, withbands of gross chemical segregation signifi-cantly greater than normally observed with thisgrade of steel. The stringers act as stress concen-tration sites for crack initiation in the presenceof quenching stresses.
Mechanical and thermal treatments may sub-stantially affect the distribution and directional-ity of microsegregation, and, in some cases, itmay be reduced significantly. However, because
of the long soaking times required to completelyhomogenize the steel, it is generally recom-mended that nothing be done.
Microsegregation may lead to machiningproblems, and severe cracking in the more al-loyed carburizing grades of steel may occur dur-ing slow cooling from the carburizing tempera-ture. In carburized and quenched steels,microsegregation may lead to unsatisfactoryzones of martensite and austenite. Austenite-martensite or martensite-bainite banding proba-bly reduces fatigue resistance, especially if bain-ite is present. Microsegregation may alsoinfluence the growth and distortion of a part dur-ing heat treatment. Microsegregation, along withnonmetallic inclusions, influences the transversetoughness and ductility of wrought steels.
Fig. 83 Relationship between austenitization processing parameters and grain size for a grain-refined and non-grain-refined AISI 1060 steel. (a) Effect of austenitization temperature and 2 h soaking time. (b) Effect of austenitizing
time. Source: Ref 30
Fig. 84 Microcracking in a nickel-chromium steel thatalso exhibits microsegregation. 910�. Source:
Ref 30
Fig. 85 Dendritic microsegregation in a fractured geartooth. 2�. Source: Ref 30
Failures Related to Heat Treating Operations / 219

Fig. 87 Micrograph of AISI 4140 steel as quenched andtempered. Microstructure shows banded mar-
tensite and tempered martensite/bainite. Subsurface crack-ing is illustrated. 100�; 2% nital etch. Source: Ref 27
Fig. 86 Micrograph of AISI 4140 steel as quenched andtempered, showing bands of tempered marten-
site and tempered martensite/bainite. 50�; 2% nital etch.Source: Ref 27
Effects of Grinding. A properly designedcase-hardening process should produce surfacemicrostructures containing essentially fine, tem-pered martensite with minimal part-to-part andbatch-to-batch variation. However, grinding maybe performed to achieve the desired dimensionsand surface finish. It is also performed to removeundesired metallurgical products resulting fromheat treatment, such as carbide films and internaloxidation. However, the grinding process canunacceptably heat a surface, leading to grindingburns and even cracking. A grinding burn occurswhen the part becomes sufficiently hot, as a re-sult of the grinding action, to cause discolorationor to exhibit a microstructural change due totempering or hardening. The temperature distri-bution and associated microstructure productsduring grinding are illustrated in Fig. 88 (Ref30).
There are different types of grinding burns.One type results in localized tempering and is
called overtemper burning. This occurs whenheat is not transferred from the grinding surfacesufficiently to prevent induced tempering of themartensitic surface. This results in a loss of hard-ness on the burned surface and possibly a lossof compressive stresses.
If the surface temperature during grinding ex-ceeds the Ac3, a thin layer of austenite is formedthat is cooled by the mass of the part to form alight-etching martensite. This is called a rehar-dening burn. Because of the thermal process, therehardened material is surrounded by overtem-
Fig. 88 Temperature distribution within a ground surface, as indicated by microstructural modifications. The Ac tem-perature indicated is for slow heating; at high heating rates, such as encountered in grinding, the Ac tem-
peratures are elevated. 500�. Source: Ref 30
220 / Manufacturing Aspects of Failure and Prevention

pered steel and reduced hardness, as illustratedin Fig. 88 (Ref 30).
Grinding cracks, such as those illustrated inFig. 89 and 90 are often accompanied by grind-ing burns (Ref 30). Grinding cracks typicallyform perpendicular to the grinding direction andpenetrate at right angles to the surface. It is pos-sible for the crack to penetrate substantiallydeeper than the depth of the burn.
When grinding, the grinding wheel grade,wheel speed, and depth of cut are important pro-cess considerations. Generally, it is recom-mended to locate the high spots and then proceedwith light cuts. If wet grinding is done, ensurethat coolant feed is adequate and correctly di-rected. The part should be inspected for grindingburns, cracks, and steps in gear tooth fillets.Ground surfaces vary from good quality (withcompressive residual stresses) to poor quality(with burns or even cracks). Bending fatiguestrength is improved or seriously impaired, de-pending on the quality of the ground surface.Because grinding improves the contact accuracy
and surface smoothness, the quality of this pro-cess affects lubrication and contact fatigue. Tem-pering and peening may be used to improve thequality of ground surfaces.
The following example illustrates the poten-tial impact of grinding cracks. An AISI G-3500gray iron camshaft was induction hardened to adepth of 1.5 to 3.8 mm (0.060 to 0.150 in.) anda lobe hardness of 45 HRC. Cracking was ob-served by magnetic-particle inspection of thecam lobe after subsequent machining. Elementalanalysis showed that the carbon content of thesteel was higher than the specification value(3.56% C versus 3.10 to 3.45% C). The surfacehardness was 52 HRC versus a specificationvalue of 45 HRC. The hardness was 94 HRB.Microstructural evidence suggested quenchingfrom an excessively high austenitizing tempera-
ture, which contributed to the formation of ex-cessive amounts of retained austenite at the corelobe surface and within the induction-hardenedcase. Grinding stresses, apparently caused dur-ing machining of the cam lobe surface, appar-ently caused localized martensitic transforma-tion of the retained austenite. Cracking thatoccurred due to the martensitic conversion isshown in Fig. 91 (Ref 27).
Effects of Shot Peening. Shot peening im-proves surface hardness and induces compres-sive stresses. This is essentially a cold working
Fig. 89 Micrograph of grinding cracks in case-hardened 8620 steel showing small cracks (see small arrows) thatpassedthrough the hardened case to the core, and the burned layer on the surface (dark band with arrow at the left)
that resulted in grinding burns. (Note: Nital and acidic ferric chloride are suitable etchants for grinding burns.) Source:Ref 30
Fig. 90 Grinding cracks on the flanks of a small spurgear wheel. Source: Ref 30
Fig. 91 Micrograph of induction-hardened AISI G-3500 gray iron illustrating crack propagation
into the hardened case. 88�; 3% nital etch. Source: Ref27
Fig. 92 Effect of hardening by plastic deformation. (a) Case-hardened surface. (b) Non-case-hardened surface. Both243�. Source: Ref 30
Failures Related to Heat Treating Operations / 221

process that plastically deforms the surface, pro-ducing increased surface compressive stresses.Figure 92 illustrates the formation of a case-hardened surface by shot peening (Ref 30).
Shot peening may also be used to remove di-rectional machining marks. By masking, it ispossible to localize this process to affect only themost critically stressed areas. The benefits maybe lost if the initial surface is rough, and raggedsurfaces may lead to folded-in defects.
Prior to conducting the peening process, thetype of shot and the appropriate process param-eters for the material and hardness must be de-termined. This may be done experimentally us-ing an Almen strip. It is important that the shotare round, and the process must be precisely con-trolled to ensure complete coverage of the de-sired area.
Fatigue cracks generally initiate at the surfaceunder bending conditions. Shot peening inducessurface compressive residual stresses. Therefore,the possibility of fatigue crack initiation at thesurface is reduced. A 20% improvement in fa-tigue limit or high-cycle fatigue life and contact-fatigue resistance has been quoted (Ref 30).
REFERENCES
1. S. Mocarski, Carburizing and Its Control,Part I: Basic Considerations, Ind. Heat., Vol41 (No. 5), 1974, p 58–70
2. A. Bavaro, Heat Treatments and Deforma-tion, Trait. Therm., Vol 240, 1990, p 37–41
3. F. Legat, Why Does Steel Crack duringQuenching, Kovine Zlitine Technol., Vol 32(No. 3–4), 1998, p 273–276
4. R.W. Bohl, Difficulties and ImperfectionsAssociated with Heat Treated Steel, Lesson13, Heat Treatment of Steel, Materials En-gineering Institute Course 10, ASM Inter-national, 1978
5. K.E. Thelning, Steel and Its Heat Treatment,Butterworths, London, U.K., 1985
6. H. Berns, “Distortion and Crack Formationby Heat Treatment of Tools,” RadexRundsch., Vol 1, 1989, p 40–57
7. G. Beck, Internal Stresses Associated withHeat Treatment of Alloys, Mem. Etud. Sci.Rev. Metall., June 1985, p 269–282
8. T. Ericsson and B. Hildenwall, Thermal andTransformational Stresses, Sagamore ArmyMater. Res. Conf., 28th Proc., 1981, p 19–38
9. C. Jensen, Dimensional Changes duringHeat Treatment of Hot Work Steel, Ind.Heat., March 1993, p 33–38
10. P. Mayr, “Dimensional Alteration of Partsdue to Heat Treatment,” Residual Stressesin Science and Technology, Vol 1, Gar-misch-Partenkirschen, FRG, 1986, DGMInformationsgesellschaft mbH, Adenauer-allee 21, D-6370, Oberursel, FRG 1987,p 57–77
11. R.W. Edmonson, Dimensional Changes inSteel during Heat Treatment, Met. Treat.,Vol 20 (No 6), 1969, p 3–19
12. M. Wisti and M. Hingwe, Tempering ofSteel, Heat Treating, Vol 4, ASM Handbook,ASM International, 1991, p 121–136
13. Y. Toshioka, Heat Treatment Deformationof Steel Products, Mater. Sci. Technol., Vol1, 1985, p 883–892
14. T. Inoue, K. Haraguchi, and S. Kimura,Analysis of Stresses due to Quenching andTempering of Steel, Trans. Iron Steel Inst.Jpn., Vol 18, 1978, p 11–15
15. G.E. Totten and M.A.H. Howes, Distortionof Heat Treated Components, Steel HeatTreatment Handbook, G.E. Totten andM.A.H. Howes, Ed., Marcel Dekker Inc.,1997, p 292
16. D.A. Canonico, Stress-Relief in Heat Treat-ing of Steel, Heat Treating, Vol 4, ASMHandbook, ASM International, 1991, p 33–34
17. C.E. Bates, G.E. Totten, and R.L. Brennan,Quenching of Steel, Heat Treating, Vol 4,ASM Handbook, ASM International, 1991,p 67–120
18. W.T. Cook, A Review of Selected Steel-Re-lated Factors Controlling Distortion in Heat-Treatable Steels, Heat Treat. Met., Vol 26(No. 2), p 27–36
19. Y. Toshioka, Heat Treatment Deformationof Steel Products, Mater. Sci. Technol., Vol1, Oct 1985, p 1883–1892
20. A. Thuvander and A. Melander, Calculationof Distortion during Quenching of a LowCarbon Steel, First ASM Heat Treatmentand Surface Engineering Conference in Eu-rope (Proc.), Trans Tech Publications, Part2, 1992, p 767–782
21. P.C. Clarke, Close-Tolerance Heat Treat-ment of Gears, Heat Treat. Met., Vol 25 (No.3), 1998, p 61–64
22. R.F. Kern, Thinking Through to SuccessfulHeat Treatment, Met. Eng. Q., Vol 11 (No.1), 1971, p 1–4
23. R. Kern, Distortion and Cracking, Part II:Distortion from Quenching, Heat Treat.,March 1985, p 41–45
24. R. Kern, Distortion and Cracking, Part III:How to Control Cracking, Heat Treat., April1985, p 38–42
25. H.-J. Chen and Z.W. Jiang, MicrostructureImprovement and Low-TemperatureQuenching of Dies Made of Cr12-TypeSteel, Jinshu Rechuli, No. 8, 1992, p 39–41
26. H.-H. Shao, Analysis of the Causes ofCracking of a 12% Cr Steel Cold Die duringHeat Treatment, Jinshu Rechuli, No. 11,1995, p 43
27. R.R. Blackwood, L.M. Jarvis, D.G. Hoff-man, and G.E. Totten, Conditions Leadingto Quench Cracking other than Severity ofQuench, Heat Treating, Including the LiuDai Memorial Symposium, Proc. of the 18thConf., R.A. Wallis and H.W. Walton, Ed.,ASM International, 1998, p 575–585
28. F. Legat, “Why Does Steel Crack duringQuenching,” Kovine Zlitine Technol., Vol 32(No. 3–4), 1998, p 273–276
29. X. Cheng and S. He, Analysis of QuenchingCracks in Machine-Tool Pistons under Su-personic Frequency Induction Hardening,Heat Treat. Met. (China), No. 4, 1991, p 51–52
30. G. Parrish, Carburizing: Microstructure andProperties, ASM International, 1999
31. J.R. Davis, Ed., ASM Materials EngineeringDictionary, ASM International, 1992, p 407
32. P.F. Stratton, N. Saxena, and R. Jain, Re-quirements for Gas Quenching Systems,Heat Treat. Met., Vol 24 (No. 3), 1997, p60–63
33. H.M. Tensi, G.E. Totten, and G.M. Webster,Proposal to Monitor Agitation of ProductionQuench Tanks, Heat Treating: Including the1997 International Induction Heat TreatingSymposium, Proc. of the 17th Conf., D.L.Milam, D.A. Poteet, G.D. Pfaffmann, V.Rudnev, A. Muehlbauer, and W.B. Albert,Ed., ASM International, 1997, p 423–441
34. S. Owaku, Quench Distortion of Steel Parts,Netsu Shori (J. Jpn. Soc. Heat Treat.), Vol32 (No. 4), 1992, p 198–202
35. R.T. Von Bergen, The Effects of QuenchantMedia Selection on the Distortion of Engi-neered Steel Parts, Quenching and Distor-tion Control, G.E. Totten, Ed., ASM Inter-national, 1992, p 275–282
36. H.M. Tensi, A. Stich, and G.E. Totten, Fun-damentals of Quenching, Met. Heat Treat.,Mar/Apr 1995, p 20–28
37. T. Kunitake and S. Susigawa, SumitomoSearch, May 1971, p 16–25
38. V.D. Kalner and S.A. Yurasov, Internal Ox-idation during Carburizing, Met. Sci. HeatTreat. (USSR), Vol 12 (No. 6), June 1970, p451–454
39. A.A. Polyakov, Quenching Properties ofParts Having Stress Concentrators, Met. Sci.Heat Treat., Vol 37 (No.7–8), 1995, p 324-325
40. A.G. Haynes, Interrelation of Isothermaland Continuous-Cooling Heat Treatments ofLow-Alloy Steels and Their Practical Sig-nificance, Heat Treat. Met., Special Report95, The Iron and Steel Institute, 1966, p 13–23
41. D.P. Koistinen and R.E. Marburger, A Gen-eral Equation Prescribing the Extent of theAustenite-Martensite Transformation inPure Iron-Carbon Alloys and Plain CarbonSteels, Acta. Metall., Vol 7, 1959, p 59–60
42. H. Webster and W.J. Laird, Jr., Martemper-ing of Steel, Heat Treating, Vol 4, ASMHandbook, ASM International, 1991, p 137
43. J.R. Keough, W.J. Laird, Jr., and A.D. God-ding, Austempering of Steel, Heat Treating,Vol 4, ASM Handbook, ASM International,1991, p 152–163
44. N.I. Kobasko, M.A. Arpnov, G.E. Totten,and A.V. Sverdlin, Method and Equipmentfor Implementation of Intensive Quenching,Heat Treating, Including the Liu Dai Me-morial Symposium, Proc. of the 18th Conf.,R.A. Wallis and H.W. Walton, Ed., ASM In-ternational, 1998, p 616–621
222 / Manufacturing Aspects of Failure and Prevention

45. I.Y. Arkhipov, V.A. Batyreva, and M.S. Po-lotskii, Internal Oxidation of the Case onCarburized Alloy Steels, Met. Sci. HeatTreat. (USSR), Vol 14 (No. 6), 1972, p 508–512
46. W.E. Dowling, W.T. Donlon, W.B. Copple,and C.V. Darragh, Fatigue Behavior of TwoCarburized Low-Alloy Steels, Proc. of Sec-ond International Conference on Carburiz-ing and Nitriding with Atmospheres, ASMInternational, 1995, p 55–60
47. B. Liscic, Heat Treatment of Steel, SteelHeat Treatment Handbook, G.E. Totten andM.A.H. Howes, Ed., Marcel Dekker, 1997,p 527–662
48. R. Ruxanda and E. Florian, MicroscopicObservations of the Carbide/Matrix Inter-phasic Interface in a Low-Alloyed Hyper-carburized Steel, Proc. of Second Interna-
tional Conference on Carburizing andNitriding with Atmospheres, ASM Interna-tional, 1995, p 117–121
49. J. Wang, Z. Qin, and J. Zhou, Formation andProperties of Carburized Case with Sphe-roidal Carbides, 5th International Congresson the Heat Treatment of Materials, (Bu-dapest), International Federation for HeatTreating and Surface Engineering (ScientificSociety for Mechanical Engineering), 1986,p 1212–1219
50. J.G. Wang, Z. Feng, and J.C. Zhou, Ef-fect of the Morphology of Carbides inthe Carburizing Case on the Wear Resis-tance and the Contact Fatigue of Gears,J. Mat. Eng. (China), Vol 6, Dec 1989,p 35–40
51. R. Kern, Supercarburizing, Heat Treat., Oct1986, p 36–38
52. M.I. Vinograd, I.Y. Ul’Yanina, and G.A.Faivilevich, Mechanism of AusteniteGrain Growth in Structural Steel, Met.Sci. Heat Treat. (USSR), Vol 17 (No. 1–2), 1975
53. R.P. Brobst and G. Krauss, The Effect ofAustenite Grain Size on Microcracking inMartensite of an Fe-1.2C Alloy, Metall.Trans., Vol 5, Feb 1974, p 457–462
54. J. Hewitt, The Study of Hydrogen in LowAlloy Steels by Internal Friction Tech-niques, Hydrogen in Steel, Special Report73, The Iron and Steel Institute, 1962, p 83–89
55. T.A. Balliet and G. Krauss, The Effect of theFirst and Second Stages of Tempering ofMicrocracking in Martensite of an Fe-1.2CAlloy, Metall. Trans. A, Vol 7, Jan 1976, p81–86
Failures Related to Heat Treating Operations / 223
