fadn accountancy framework and cost...
TRANSCRIPT

FACEPA Farm Accountancy Cost Estimation and Policy Analysis of European Agriculture
FADN Accountancy Framework and Cost Definitions
FACEPA Deliverable No. D1.1.1 – July 2009
Levente Barkaszi, AKI
Szilárd Keszthelyi,AKI
Eszter Kis Csatári, AKI
Csaba Pesti, AKI
The research leading to these results has received funding from the European Community’s Seventh Framework Programme (FP7/2007-2013) under grant agreement no 212292.
1
Executive Summary
The aim of this deliverable is to provide a theoretical background to the development of a general cost of production model and to examine the usefulness and appropriateness of the Farm Accountancy Data Network (FADN) data system.
The report consists of two main parts. In the first part an overview of the general methodology of the EU FADN system is given, clarifying the basic definitions (universe of farms, commercial farms, SGM and so on). The selection of farms, the weighting system and the collection of data as well as the procedure of data verification are briefly described. In addition, major differences between the Member States are highlighted.
For elaborating the production cost model, several aspects should be taken into consideration. The problem of missing variables also needs to be examined. The model must take into account the national distinctions (for example Table N, Details of purchase and sales of livestock is not recorded by all Member States) which can influence the results strongly.
The second part of the report, on the one hand, focuses on the different valuation methods of FADN and International Financial Reporting Standards (IFRS), on the other hand, tries to reveal the different interpretation of FADN regulations applied by Member States. This part concerns many topics and tries to focus on the main differences which can be important regarding production cost model.
The accounting system of the FADN is quite different from the one used in financial accounting. In financial accounting the key characteristic is reliability. The aim of the FADN is to serve the decision making process in the EU, so the relevance, the comparability and the usefulness are important requirements. The information served by the FADN is less reliable than the data from financial accounting, because many times estimation has to be made and information has to be updated in order to meet the requirements of the FADN. Additionally, the comparability is strongly influenced by national distinctions.
Compared to IFRS, investment subsidies increase income in FADN and profit tax is not deducted from the income in FADN. Concerning assets, according to FADN, only operational resources are considered whereas according to IFRS the total assets of an enterprise (for example including financial assets) are to be indicated in the financial statement.
The requirements of FADN regulations are realised in different ways in the Member States. Data delivery in the Member States for FADN purposes is not totally harmonised. In FADN the valuation of quotas and delivery rights in the Member States is entirely different due to the very heterogeneous national rules. The valuation of biological assets is also very diverse.
Direct EU payments are separated from complementary national payments, while decoupled payments are registered under one heading in the farm return. In this way the connection of subsidies to production and products is very difficult.
The problem of contract rearing also should be mentioned. The model should separate farms with receipts from contract rearing and also consider national distinctions regarding the recording of contract rearing.
Despite the high level of harmonisation there are several differences concerning FADN data collection and the interpretation of FADN regulations which are very important to keep in mind while constructing the cost of production model.
2
Contents
EXECUTIVE SUMMARY................................................................................................................................... 2
CONTENTS........................................................................................................................................................... 3
ABBREVIATIONS AND ACRONYMS ............................................................................................................. 4
LIST OF FIGURES AND TABLES.................................................................................................................... 5
Figures ........................................................................................................................................................... 5 Tables ............................................................................................................................................................. 5
INTRODUCTION................................................................................................................................................. 6
1. DESCRIPTION OF THE FADN ACCOUNTANCY FRAMEWORK........................................................ 7
1.1 GENERAL METHODOLOGY ...................................................................................................................... 7 1.2. DEFINING THE FIELD OF OBSERVATION................................................................................................... 8
1.2.1. The universe of farms.................................................................................................................... 8 1.2.2. The economic size of farms ........................................................................................................... 8 1.2.3. Farm types .................................................................................................................................... 9
1.3. WEIGHTING SYSTEM............................................................................................................................... 9 1.4. SELECTING THE SAMPLE FARMS ........................................................................................................... 10 1.5. COLLECTION OF DATA .......................................................................................................................... 11 1.6. ENSURING HIGH QUALITY..................................................................................................................... 12 1.7. MISSING VARIABLES............................................................................................................................. 13 1.8. LEGAL BASIS ........................................................................................................................................ 16
2. CHARACTERISTICS OF FADN ACCOUNTANCY FRAMEWORK ACCORDING TO EU REGULATIONS ................................................................................................................................................. 17
2.1. CALCULATION OF STANDARD RESULTS ................................................................................................ 17 2.2. PRODUCTION VALUE............................................................................................................................. 19 2.3. COST ACCOUNTING PRINCIPLES ............................................................................................................ 21
2.3.1. Intermediate consumption........................................................................................................... 21 2.3.2. External factors........................................................................................................................... 26
2.4. VALUATION OF ASSETS......................................................................................................................... 27 2.5. OTHER SPECIAL ACCOUNTING PRINCIPLES............................................................................................ 31
2.5.1. Depreciation ............................................................................................................................... 31 2.5.2. Taxes and subsidies .................................................................................................................... 33 2.5.3. VAT ............................................................................................................................................. 36 2.5.4. Milk quota................................................................................................................................... 36 2.5.5. Calendar year/bookkeeping year ................................................................................................ 37 2.5.6. Contract rearing ......................................................................................................................... 38
2.6. OTHER GAINFUL ACTIVITIES................................................................................................................. 39
CONCLUSION.................................................................................................................................................... 42
REFERENCES.................................................................................................................................................... 45
ANNEX ................................................................................................................................................................ 46
3
Abbreviations and Acronyms EC European Commission EU European Union ESU European Size Unit FACEPA Farm Accountancy Cost Estimation and Policy Analysis of European Agriculture FADN Farm Accountancy Data Network FFI Family Farm Income FGM Farm Gross Margin FNVA Farm Net Value Added GFI Gross Farm Income IAS International Accounting Standards IFRS International Financial Reporting Standards SGM Standard Gross Margin SO Standard Output UAA Utilised Agricultural Area US GAAP Generally Accepted Accounting Principles (United States)
4

List of Figures and Tables
Figures
................................................................................................ 7 Figure 1. Selection of the FADN sample
....................................................................................... 10 Figure 2: Schematic description of weighting
................................................. 12 Figure 3:Steps of data flow from farms to the European Commission
..................................................................... 18 Figure 4: Output, balance of subsidies and taxes, income
.................................................................................................... 21 Figure 5: Structure of costs in FADN
Figure 6: Schematic description of farm and production level cost calculation in case of a winter wheat producing farm ...................................................................................................................................... 37
Tables
............................................................................... 9 Table 1: Time series according to the new typology
........................................................................................ 14 Table 2: Data availability for Member States
...................................................................... 14 Table 3: Data availability in Table D by Member States
........................................................................ 15 Table 4: Data availability in table E by Member States
....................................................................... 15 Table 5: Data availability in table N by Member States
........................................................................................................................... 22 Table 6: Specific costs
.................................................................................................................. 24 Table 7: Farming overheads
...................................................... 28 Table 8: Differences in the valuation of assets in FADN and IFRS
Table 9: Direct EU decoupled payments or based on area and animal production under Council Regulation (EC) No 1782/2003............................................................................................................. 34
Table 10: Direct payments related to Rural Development or Article 69 of Council Regulation (EC) No 1782/2003.............................................................................................................................................. 35
5

Introduction
The FADN of the European Union was created as an instrument to provide more information to support the Commission’s proposals and to assess the impacts of the agricultural policy of EU by evaluating the income of agricultural holdings. The aim of the network is to gather accountancy data from farms in order to determine their financial performance, for business analysis of agricultural holdings and to support the decision making process in the EU.
Information systems that are relevant to farmers and decision makers in agricultural policy should be adapted from time to time to the changes in the economic environment of their users. Otherwise the information and its sources lose their relevance and become obsolete. In this sense FADN is subject to constant changes especially in the last couple years after the accession of New Member States that take effect in an accelerated manner.
A growing need has arisen from policy makers, researchers and other stakeholders to determine the unit costs of production. At present, FADN collects data at farm level which are not suitable for directly estimating the cost of production. The direct collection of enterprise-level information is difficult and would require costly farm surveys. However with appropriate econometric techniques it is possible to use existing FADN data for estimating enterprise-level production costs at a significantly lower expense.
In the framework of this deliverable we intend to give a clear description of the concepts used for the interpretation of accountancy principles in the FADN. We present in fine detail the main cost elements of agricultural production applied in the EU FADN database. We took the effort to highlight the main differences that exist among the FADN systems of the Member States.
In the first chapter an overview of the general methodology of the EU FADN system is given, clarifying the basic definitions. The selection of farms, the weighting system and the collection of data as well as the procedure of data verification are briefly described.
The second chapter of the report focuses on the different valuation methods of FADN and International Financial Reporting Standards (IFRS), and tries to reveal the different interpretation of FADN regulations applied by Member States.
6

1. Description of the FADN accountancy framework
FADN is the only source of micro-economic data for agriculture that is harmonised within the EU. Therefore, the cost model developed in the project can use FADN data, so it is crucial to examine the usefulness and appropriateness of FADN data systems to measure the cost of production for agricultural commodities.
FADN basically serves two objectives: On the one hand it serves as a basis for agricultural sector analyses whereby the profitability of agricultural holdings is in the focus. On the other hand it is an instrument for agricultural policy analyses. In the Member States, the data are collected according to EU-wide standardised guidelines. However, there are national distinctions concerning data availability. Chapter 1 briefly describes the FADN framework, where possible, trying to reveal the differences among Member States.
1.1 General methodology In each Member State a Liaison Agency is responsible for collecting and submitting the data to the Commission.
The number of agricultural farms in each country is determined by either a census or a Farm Structural Survey (FSS). According to preset criteria out of the universe of farms the so-called “commercial” farms (see the definition below) are selected providing the field of observation of the FADN. From this field of observation a predetermined number of farms are selected, according to a selection plan, as sample farms to represent a number of similar farms in a given region of a country. To ensure that the sample of farms reflects the heterogeneity of farming Liaison Agencies stratify the field of observation according to three criteria: region, economic size and type of farming. It can be represented as a three-dimension matrix of cells (Figure1).
Figure 1. Selection of the FADN sample
Source: DG. Agri EU FADN
7

1.2. Defining the field of observation The field of observation is a certain well-defined group of farms out of the total number of farms that are in the scope of the FADN system. In each Member State there is a lower threshold of agricultural production measured in Economic Size Units (ESU) that has to be passed in order to get into the field of observation which varies from Member State to Member State. In some Member States even upper thresholds are determined as well.
1.2.1. The universe of farms
The term "universe" is a statistical term used to define the set of units under enquiry. In the present context, the universe of farms is that set of farms which:
• have at least one hectare • have less than one hectare but provide a certain proportion of their output to the market • have less than one hectare but produce more than a specified amount of output
In the universe there are some farms which produce little output and from this point of view do not warrant inclusion in the FADN sample. Thus, in defining FADN's field of observation, the European Commission (EC) follows the guidelines specified in Regulation 79/65/EEC of 15 June 1965 and subsequent amendments and adopts a pragmatic approach by including only those farms deemed to be commercial.
A commercial farm is defined as a farm which is large enough to provide a main activity for the farmer and a level of income sufficient to support his or her family. In practical terms, in order to be classified as commercial, a farm must exceed a minimum economic size that provides a threshold to farms for inclusion. Annex 1 presents the number of farms in the field of observation and economic size thresholds applied by the Member States.
1.2.2. The economic size of farms
The concept of Standard Gross Margin (SGM) is used to determine the economic size of farms, which is expressed in terms of ESU. The value of one ESU is defined as a fixed amount of EUR/ECU of Farm Gross Margin (FGM). The amount of EUR/ECU per ESU was changed to reflect inflation untill 1984. From this time the rate is constant. This concept is also used in the FSS organised by Eurostat. The SGM of a crop or livestock item is defined as the value of output from one hectare or from one animal less the cost of variable inputs required to produce that output. Specific SGM values are calculated for all crop and livestock items in every region. The Liaison Agencies calculate the SGMs themselves on the basis of empirical data collected from farms. To avoid bias caused by fluctuations, e.g. in production (due to bad weather) or in input/output prices, three year averages are taken.
SGMs are updated every two years and are calculated on a regional basis for more than 90 separate crop and livestock items. This large number of items not only reflects the diversities of agriculture within the European Union but also indicates the level of detail that is required to ensure that the results of FADN and other surveys are both comprehensive and reliable. In the future, Standard Output (SO) will replace SGM in calculation of farm sizes. SO means the standard value of gross production. The implementation of the new typology should be an opportunity to improve the coverage in order to increase the comparability of the results among Member States. New thresholds shall be set up in Euro. The coverage in terms of number of holdings and Utilised Agricultural Area (UAA) for Austria, Latvia, Lithuania, and Malta, for which the Commission considers the current coverage not satisfactory, shall increase reasonably, using the FSS 2007 classified according to the new typology and the SO 2004.
8

No additional national criteria restricting the field of survey shall be applied according to the new typology. In particular the criteria of minimum annual work unit shall be removed considering the high distortion it creates in the results among Member States.
After June 2012, when FADN 2010 and FSS 2010 population are available, the new typology will be calculated for FADN 2010. Time series will be then calculated according to the following plan:
Table 1: Time series according to the new typology New typology Current typology
FADN FSS SO FADN FSS SGM
2010 2010 2007
2009 2010 2007 2009 2007 2004
2008 2007 2004 2008 2007 2004
2007 2007 2004 2007 2007 2004
2006 2007 2004 2006 2007 2004
2005 2005 2004 2005 2005 2002
2004 2005 2004 2004 2005 2002
2003 2003 2004 2003 2003 2000
2002 2003 2004 2002 2003 2000
2001 2000 2004 2001 2000 1996
2000 2000 2004 2000 2000 1996
Source: EC Document RICC 1519
1.2.3. Farm types
The unit responsible for FADN within the EC has established a set of standard groupings for which for each accounting year the Standard Results are computed.
All farms in FADN's field of observation are classified into economic size classes and type of farming.
A detailed typology has been created for use by various bodies at European Union level. It is sufficiently broad to encompass the many different types of farming that are found in the European Union. This typology is described in Commission Decision 85/377/EEC of 7 June 1985.
Typology identifies the principal types of farming, which are then further broken down.
Types of farming are defined in terms of the relative importance of the different enterprises on the farm. Relative importance is itself measured quantitatively as a proportion of each enterprise's SGM to the farms' total SGM.
1.3. Weighting system A special weighting system is used in the calculation of EU-FADN results. It is based on the principle of "free expansion": a weight calculated for a sample farm applies to each holding represented by that farm (extrapolating factor). In order to calculate this individual weight, holdings in the sample and in the field of survey are stratified according to the same three criteria: FADN region, type of farming
9
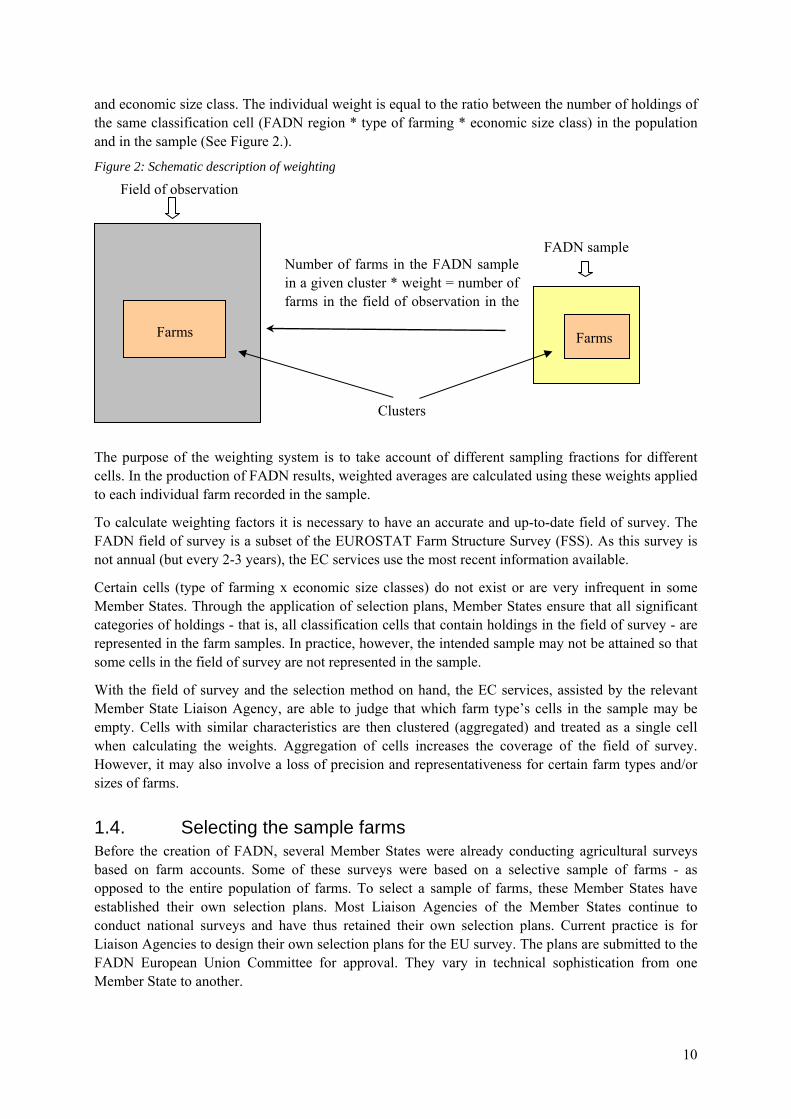
and economic size class. The individual weight is equal to the ratio between the number of holdings of the same classification cell (FADN region * type of farming * economic size class) in the population and in the sample (See Figure 2.).
Figure 2: Schematic description of weighting
Field of observation
Clusters
Farms
FADN sample
Farms
Number of farms in the FADN sample in a given cluster * weight = number of farms in the field of observation in the
l l
The purpose of the weighting system is to take account of different sampling fractions for different cells. In the production of FADN results, weighted averages are calculated using these weights applied to each individual farm recorded in the sample.
To calculate weighting factors it is necessary to have an accurate and up-to-date field of survey. The FADN field of survey is a subset of the EUROSTAT Farm Structure Survey (FSS). As this survey is not annual (but every 2-3 years), the EC services use the most recent information available.
Certain cells (type of farming x economic size classes) do not exist or are very infrequent in some Member States. Through the application of selection plans, Member States ensure that all significant categories of holdings - that is, all classification cells that contain holdings in the field of survey - are represented in the farm samples. In practice, however, the intended sample may not be attained so that some cells in the field of survey are not represented in the sample.
With the field of survey and the selection method on hand, the EC services, assisted by the relevant Member State Liaison Agency, are able to judge that which farm type’s cells in the sample may be empty. Cells with similar characteristics are then clustered (aggregated) and treated as a single cell when calculating the weights. Aggregation of cells increases the coverage of the field of survey. However, it may also involve a loss of precision and representativeness for certain farm types and/or sizes of farms.
1.4. Selecting the sample farms Before the creation of FADN, several Member States were already conducting agricultural surveys based on farm accounts. Some of these surveys were based on a selective sample of farms - as opposed to the entire population of farms. To select a sample of farms, these Member States have established their own selection plans. Most Liaison Agencies of the Member States continue to conduct national surveys and have thus retained their own selection plans. Current practice is for Liaison Agencies to design their own selection plans for the EU survey. The plans are submitted to the FADN European Union Committee for approval. They vary in technical sophistication from one Member State to another.
10
Within FADN's field of observation, there is a great diversity of farming. Some farms are very large (in terms of their economic size) while others may be very small. Some farms concentrate on crop production, others specialise in livestock rearing while yet others practice mixed farming, that is, both crop and livestock production. On these two criteria alone i.e. economic size and type of farming, the field of observation of EU farms is highly heterogeneous.
To ensure that the sample of farms adequately reflects this heterogeneity, Liaison Agencies stratify the field of observation before the sample of farms is selected. The selection rate and sample size chosen for each stratum are determined in different ways (Annex 2). If the stratification was not done, there would be a greater risk that particular categories of farms (large dairy farms in one region, or small fruit farms in another region) would not be represented adequately (or at all) by the sample. The EC makes extensive use of this technique and uses three criteria for stratification: region, economic size and type of farming, as described in the following sections.
For FADN purposes the European Union is divided into FADN regions. All farms in FADN's field of observation are classified into economic size classes and type of farming.
The three-way stratification of the universe allows it to be represented as a three-dimensional matrix of cells. The number of farms in each cell is derived from the FSS organised by Eurostat. This survey employs the same typology as that used for FADN.
The Commission and the Liaison Agencies select the sample of farms not from the field of observation as a whole but from the cells which make up the field of observation. Sample farms are thus selected from each cell - in this way all the cells are, in principle, represented in the sample. Thus the FADN sample of farms reflects the heterogeneity in the field of observation. The procedures of selecting the sample farms are also different in the Member States (Annex 3).
Certain Member States apply additional criteria that restrict their actual field of survey (minimum number of annual work unit, maximum economic size…). To have this type of additional national criteria is not clearly allowed by the FADN regulations. However, article 20 of Regulation N°79/65 indicates that "the Community Committee shall be consulted for the purpose of verifying that the plans for the selection of returning holdings are in conformity with the provisions of Article 4", i.e. the article defining the field of survey of FADN. Additional national criteria by Member States can be seen in Annex 4.
According to article 6 of Regulation No. 79/65, the selection plan "shall be drawn up on the basis of the most recent statistical data", i.e. for 2008-accounting year the population census / survey 2005 and the SGM 2002 (in theory average of 2001, 2002, 2003).
Annex 5 displays the years of the statistical reference sources used by the Member States. A large majority of the Member States used a 2005 population census or survey and the SGM 2002. Spain used older statistical references, respectively 1999 population census and SGM 2000.
The objective of the selection plan is to ensure the representativeness of the field of observation of FADN. The representativeness of 2005 FADN data is presented in Annexes 6, 7 and 8.
1.5. Collection of data The responsibility for FADN data collection rests with the Liaison Agencies, often together with agricultural research institutes. These either employ their own staff to visit the sample farms and to collect the data, or they contract this work out to accountants, universities, farmers' cooperatives or other organisations. The data collection from farm level to EU level (Figure 3).
11

Council Regulation 79/65/EEC of 15 June 1965 – the basic legal instrument establishing FADN – clearly states that data supplied to the EC is treated in the strictest confidence. The Community FADN Farm Return covers a period of twelve months. Member States have accounting years starting on different dates.
The Farm Return is specified in COMMISSION REGULATION (EC) No 868/2008 and subsequent amendments. These regulations contain detailed instructions on how the Farm Return should be completed and provides definitions of the terms used.
The required data are extracted from the appropriate inventory, cash book, ledger or journal kept by the farmer or field officer. In some Member States, the Liaison Agencies have drawn up special entry books to be completed periodically by the farmers.
National committees comprise representatives of both the Liaison Agency and the bodies responsible for completing the Farm Return. They give guidance on the methodological aspects of the survey, such as the application of the European Union typology of farms, the selection of farms from the field of observation and the interpretation of terms. In some Member States, equivalent committees also exist at regional level.
Figure 3:Steps of data flow from farms to the European Commission
Farms
National data
Universities Accounting
offices Other
Liaison Agencies
Conversion of national data to EU format
National control procedure
Dg. Agri
Quality control procedures implemented by the Commission
Standard results Other analyses Forecasts
1.6. Ensuring high quality Decisions regarding agricultural policy in the European Union must be based on sound and accurate analyses. This means that FADN data themselves must be as accurate as possible. The Liaison Agencies and the EC take great care to ensure that any errors in FADN data are identified and corrected.
The procedures used by the Liaison Agencies are outlined before the data are transmitted to the EC. This is followed by a description of the procedures implemented by the EC.
12

Liaison Agencies invariably use one or more regional or national farm returns rather than the Community FADN Farm Return. Many Member States were already running farm business/management surveys before the creation of a European network and designed their own farm returns. Over time, the original farm returns may have been improved and adapted to suit the changing needs of users. Data on the one hand serve the Member States' own needs, and the other hand serve FADN purposes. The objectives of the Member States may be different from those of the EC. The Community FADN Farm Return is more limited in its coverage of farming activities than many of the regional and national farm returns.
Liaison Agencies use their own control procedures to maintain a level of data quality that may be higher or lower than the standard required by the Commission. When the data are considered error-free, the Liaison Agencies convert their national data to the Community FADN Farm Return as specified in COMMISSION REGULATION (EC) No 868/2008 and subsequent amendments. These procedures are summarised in a specific annex. Having done this, Liaison Agencies transmit the data to the Commission and submit it for inclusion with the quality procedures implemented by the Commission.
Quality control procedures implemented by the Commission
To ensure high quality data the Commission has implemented a series of test for checking the quality of data. Some of these tests, like the coherence and homogeneity tests are run right after the reception of data from the Liaison Agencies. There are different types and levels of tests (initial, critical, typology, severe, anomaly, and warning) aimed at finding the errors in the database. Some of them like the warnings and anomalies may be justified while the rest has to be corrected. Only when all the errors are corrected or justified can data be confirmed ready and submitted to the EC for further checks.
After Liaison Agency confirms that data are ready, the EC starts more in-depth analyses. During the continuity test data series of different years are checked and unlikely deviations are monitored. Arising questions are sent back to Liaison Agencies for clarification.
Once the data are accepted as error-free, the EC can produce the Standard Results, perform other analyses and make forecasts.
The completion of all the procedures needed to produce the Standard Results should take no more than 15 months from the end of an accounting year. In practice, some participants of the FADN have not always been capable of respecting the timetable set out in the legislation. This causes delays in the publication of aggregates for the European Union as a whole. Efforts are made to follow the timeliness of FADN operation.
1.7. Missing variables It is important to examine data availability of the different Member States that can influence the data series implemented by the model. Data for each MS are available from the year of accession to the Community (See Table 2.).
In the Farm Return there are some variables which are voluntary: for example in table G the subheadings of ‘Agricultural land, buildings and rights’ and in table K the subheadings of ‘Contract rearing’. Concerning cost of production model it is crucial to detect which are those tables, headings and subheadings that are not recorded by Member States. The structure of the model is influenced mainly by Table D (Number and value of livestock), Table E (Livestock purchases and sales), Table F (Costs) and Table K (Production).
13

In some cases Member States do not deliver a variable although it is compulsory. A reason might be that the data is not available in the Member State. These are exceptions, however.
Table 2: Data availability for Member States
1Source: Kleinhanss vTI
The following tables show those cells in tables D, E and N of the Farm Return, which are not recorded by some of the Member States. Value 1 means that at least one holding’s data is available in the given heading, while zero means that there is no data at all in that category. It is very difficult to detect missing variables when a 0 can either be 0 or a missing variable.
Table 3: Data availability in Table D by Member States
Source: Kleinhanss vTI For example heifers for fattening are not recorded by the Netherlands, cull dairy cows are not recorded by France and there are no rabbits in Belgium and Germany.
1 Based on the calculation of Werner Kleinhanss, Johann Heinrich von Thünen-Institut Heading number and description can be seen in Annex 12
14

Table 4: Data availability in table E by Member States
Source: Kleinhanss vTI
In Table E goats are not recorded by Sweden at all and other animals are not recorded by Belgium.
Table 5: Data availability in table N by Member States
Source: Kleinhanss vTI
Details of purchases and sales of livestock (table N) are not recorded by Italy from 2002 to 2005 (Table 5). The model must take into account these national distinctions which can influence the results strongly.
In Table F all compulsory data are available. Only the details of interest and financial charges, which are voluntary, are not recorded by the Netherlands. However it is not of great importance concerning the cost of production model. In the case of Table F the different interpretation of FADN regulations
15

can cause problems. For example the valuation of farm produced feedingstuffs, hay or grass used as feedingstuffs for livestock can be registered in different ways by the Member States.
1.8. Legal basis The initial Regulation for FADN has been set up in 1965. The Regulation No79/65/EEC of the Council of June 1965 standardizes ’the setting up of a network for the collection of accountancy data on the incomes and business operation of agricultural holdings in the European Economic Community’ (EEC). This regulation was published in the Official Journal no. 109 in 1965. Since then, a number of amendments have been available to adjust the FADN rules to take account of the enlargements of the EEC or changes in policy. The Commission is in a position to propose any necessary amendments to the Regulations.
Commission Regulation (EEC) No 1859/82 of 12 July 1982 concerning the selection of returning holdings for the purpose of determining incomes of agricultural holdings.
Commission Regulation (EEC) No 1915/83 of 13 July 1983 on certain detailed implementing rules concerning the keeping of accounts for the purpose of determining the incomes of agricultural holdings.
85/377/EEC: Commission Decision of 7 June 1985 establishing a Community typology for agricultural holdings.
Conclusion
FADN data collection has many differences across Member States. Thus special care must be taken to define harmonised European data for the production cost model.
• Firstly, the lower thresholds to get into the sample vary from 1 to 16 ESU. In some Member States upper thresholds are determined, as well (e.g. Netherlands).
• Secondly, the FADN's representativeness is largely different. In seven Member States of the EU-25 FADN farms represent less than 90 per cent in terms of Standard Gross Margin.
• Thirdly, Member States use different additional criteria for farms to get into the field of survey and the methods for defining the sample are also different.
• Fourthly, the year of FSS varies from MS to MS between 1999 and 2006. It has great importance, as there was a large structural change in CEE countries in recent years. We can generally state that the later is the FSS the better is the selection plan.
Additionally, the model should take great care of missing variables. Input data must be examined and it must be determined which are those headings that are not recorded by Member States. All these circumstances influence the statistical usefulness of FADN data and must be taken into consideration regarding the cost of production model.
16
2. Characteristics of FADN accountancy framework according to EU regulations
The most important widely used accounting standards are International Financial Reporting Standards (IFRS) and Generally Accepted Accounting Principles (United States) (US GAAP or simply GAAP). Many of the standards forming part of IFRS are known by the older name of International Accounting Standards (IAS). IFRS has now been adopted by more than 100 countries across the world, while there is a trend that even US companies will switch to IFRS over the next few years.
FADN has its own “standards” for accounting with some peculiarities for agricultural production, where calculating income is rather similar to the agricultural part of national accounts. Therefore it is important to describe the FADN accountancy features and to reveal the differences from IFRS, where possible.
The accounting standards in FADN for calculating output, costs, depreciation and income differ from the International Accounting Standards (IAS) and International Financial Reporting Standards (IFRS) in many ways. In the following part the most important features of FADN accountancy framework are introduced focusing on production value, cost accounting, valuation of assets and depreciation on the basis of the referenced legislation and studies.
2.1. Calculation of standard results In this section we look through the FADN output and income calculation, because there are some features of FADN cost calculation that are based on output calculation.
FADN uses accrual basis accounting method, which reports income when earned and expenses when incurred, as opposed to cash basis accounting, which reports income when received and expenses when paid.
FADN uses the “Standard Results” for calculating output and income. Standard Results are calculated from the Farm Return and make it possible to compare the farm results in different EU countries with different national legislation procedures. Figure 4 shows the calculation of Standard Results.
17

Figure 4: Output, balance of subsidies and taxes, income
Source: Definition of variables used in FADN standard results RI/CC 882
18
An important feature of theFADN income calculation is that only Gross Farm Income (GFI) and Farm Net Value Added (FNVA) can be compared in EU-27 countries. Family Farm Income (FFI) is different in EU-15 and EU-10. In the New Member States the corporate farms play an important role in production, in some Member States they produce more than 50 per cent of the output and the income. However, calculating Family Farm Income for corporate farms causes problems, because they have no family labour, so they pay a lot more wages than family farms in the same size and type of farming, therefore they have a lower FFI. Due to this fact FFI is not appropriate for comparing results in EU-10 because the proportion of corporate farms is different in each size and type of farming category. If the cost of family work units was deducted from individual farms' income, their income could be compared to corporate farms'.
Conclusion
Two important features of FADN income calculation differ from the income calculated according to IFRS: investment subsidies increase income (Family Farm Income, Figure 4) in FADN and profit tax is not deducted from the income in FADN. However, these differences have little influence on the cost of production.
2.2. Production value Several items of production value in Standard Results are detailed below.
Output
The most important feature of FADN total output is that it is cumulative output, some outputs are accounted twice as outputs and some inputs are accounted twice as inputs. The production value of crops used for feeding livestock on the farm is duplicated in output because it is accounted in total output of crops (farm use) at farm-gate value and it is a part of total output of livestock and livestock products (sales). This cumulative nature of FADN output does not influence income because production costs of feedingstuffs are also duplicated. Firstly they are recorded in specific crop costs (seeds, fertilizers, crop protection costs etc.), secondly they are accounted in specific livestock costs (feedingstuffs produced on the farm).
There is no such duplication in IAS, the value of fodder produced and used on farm is only recorded in the costs of crop production, and the output is only recorded as the output of animal products (the output of fodder crops used on the farm is realised in the output of animal products).
Sales: All returns received and due to be paid from product sale transactions during the accounting year. Products sold off the farm and repurchased by the farm (e.g. sugar beet pulp) are accounted in sales and costs. Sales are accounted without addition of any grants and subsidies, and without deduction of marketing costs and taxes. Any compensation payments for loss of production are accounted in the total for sales of the product concerned. If it cannot be allocated to any particular crop or livestock, it is accounted in the sales of 'Other products and receipts'.
Farm use: The farm-gate value of the holding's products in stock (storage) at the beginning of the accounting year and/or produced during the year, used as inputs on the holding. Includes: feedingstuffs, seeds and seedlings. Excludes: Straw for livestock (unless it is a marketable product in the region).
Farmhouse consumption: Value of products consumed by the holder's household (including those used for farm tourism). Value of products used for payment in kind for labour and other goods and services. Products are valued at farm-gate prices current at the time of transaction.
19
Closing valuation:
Value of stocks of crop and livestock products at the end of the accounting year valued at farm-gate prices current at that time. For young plantations only the increase (growth) in value of the plantation is accounted.
Opening valuation: Value of stocks of crop and livestock products at the beginning of the accounting year valued at farm-gate prices current at that time. Excludes stocks of forage crops purchased as animal feed.
Total output of livestock and livestock products = livestock production + change in livestock value + livestock products.
Livestock production = sales + farmhouse consumption – purchases
It is calculated for equines, cattle, sheep, goats, pigs, poultry and other animals.
Change in livestock value = value at closing valuation – value at opening valuation.
For animals which are present on the holding for more than one year, the value corresponding to the increase in volume is estimated (for equines, cattle other than under one year old, cull cows, goats, ewes, breeding sows). The estimation makes it possible not to include in the value of annual output short-term price changes affecting animals which will be sold only in the medium or long term.
Livestock products = sales + household consumption + farm use + closing valuation – opening valuation.
Livestock products are milk and milk products from cows, ewes, goats, wool, hens' eggs, other animal products (stud fees, manure, other eggs, etc.), receipts from animals reared under a service contract (animals not owned by the farmer) and honey. Farm use exludes milk suckled by calves.
Other output: Leased land ready for sowing, receipts from occasional letting of fodder areas, agistment, forestry products, contract work for others, hiring out of equipment, interest on liquid assets necessary for running the holding, receipts of tourism, receipts relating to previous accounting years, other products and receipts.
Conclusions
From the point of cost calculation the most important feature of FADN output is that it is a cumulative output because feedingstuffs produced and used on the farm are recorded twice as outputs and twice as inputs.
As outputs they are recorded in crop output and livestock output. As inputs firstly, they are accounted in the total specific costs of crop production (fertiliser, crop protection etc.). Secondly, they are accounted in the feedingstuffs produced on the farm valued at market prices. Seeds and seedlings have the same characteristics.
From the point of the cost of production model the valuation may cause problems. In livestock production feedingstuffs produced on farm are accounted at market prices, while their production cost may be lower than the market price. It may influence the unit cost of livestock production.
The valuation of seeds and seedlings produced on farm may cause similar problems.
20

2.3. Cost accounting principles Before we can do a cost of production model based on the FADN data we first need to determine the accountancy and cost definitions used as is described in the RICC 1256 Farm Return. Based on the available information we collected the cost definitions and focused on those cost items which can be important regarding to the project.
It should be emphasised that the aim of FADN is to determine farm incomes not cost of different activities. The cost items cover various activities and there are no data showing the division of the costs.
In FADN the general rule for recording the costs is to take into account the value of all non-capital inputs used in the production of non-capital products during the accounting year. Items are recorded at current values. If the costs do not correspond to the production of the accounting year, changes in stocks of inputs should be indicated in ‘Circulating capital’. When certain expenditure relates partly to private use and partly to farm costs (e.g. electricity, water, heating fuels, private cars, etc.) only the proportion of the expenditures corresponding to the use for farm purposes should be included in the farm return. The structure of costs is displayed in the following figure:
Figure 5: Structure of costs in FADN
Costs
Intermediate consumption External factors
Specific costs
Farming overheads
Wages paid Rent paid
Interest paid
2.3.1. Intermediate consumption
Total specific costs (including inputs produced on the holding) and overheads arising from production in the accounting year.
21

Table 6: Specific costs Seeds and seedlings Fertilizers and soil improvers
Specific crop costs
Crop protection products Other specific crop costs Specific forestry costs Purchased feedingstuffs Feedingstuffs produced on the farm
Specific costs
Specific livestock costs
Other specific livestock costs
Seeds and seedlings purchased
All purchased seeds and seedlings, including bulbs, corms and tubers. The costs of young trees and bushes for new plantations considered as investments. The costs of processing the seeds (sorting, disinfection) are also included under this heading.
Seeds and seedlings produced and used on the farm
All seeds and seedlings (including bulbs, corms and tubers) produced and used on the farm.
Fertilizers and soil improvers
All purchased fertilizers and soil improvers including lime, compost, peat and manure (excluding manure produced on the holding). Fertilizers and soil improvers used for forests of the holding are to be entered under heading ‘Specific forestry costs’.
Crop protection products
All materials used for the protection of crops and plants against pests, diseases and bad weather, etc. (insecticides, fungicides, herbicides, poisoned baits, bird scarers, anti-hail shelters, frost protection, etc.).
Other specific crop costs (including permanent meadows and grassland)
All costs having a direct connection with crop production for which there is no separate provision in the other cost headings:
• Packing and binding materials,
• String and rope,
• Cost of soil analysis,
• Crop competition costs,
• Plastic coverings (e.g. for strawberry growing),
• Supplies for the preservation and processing of crops,
• Storage and market preparation of crops done outside the farm,
• Cost of marketing the crop products of the farm,
• Sums paid for the purchase of marketable standing crops or to rent land for a period of less than one year to grow marketable crops,
• Occasional purchases (complementary to the production of the holding) of crop products (e.g. grapes), processed on the holding,
22
• Short-term rental of buildings used for storing or packing of products.
Specific forestry costs
Includes fertilizers, crop protection materials, miscellaneous specific costs. Cost of labour, contract work and machinery are not included; these should be entered under the appropriate cost headings.
Purchased feedingstuffs
Include:
• Feedingstuffs purchased as standing crops (grass and fodder plants).
• Cost of use of pasture land not included in the UAA (short-term land rental) as for example, common land.
• Purchased litter and straw for bedding.
• Additives for storage and preservation.
• Costs of agistment.
Feedingstuffs produced on the farm
Include:
• Forage crops when marketable. Valuation is at farm-gate price current at that time.
• The value of litter and straw produced on the holding when they are marketable in the region and year in question.
Excludes milk suckled by calves.
The costs of products (produced on the farm) used as inputs on the holding appear in the relevant headings of crop costs as well (e.g. Current upkeep of machinery and equipment, Specific crop costs, etc.). This cost-duplication causes no problem in the derivation of results (as it was highlighted earlier).
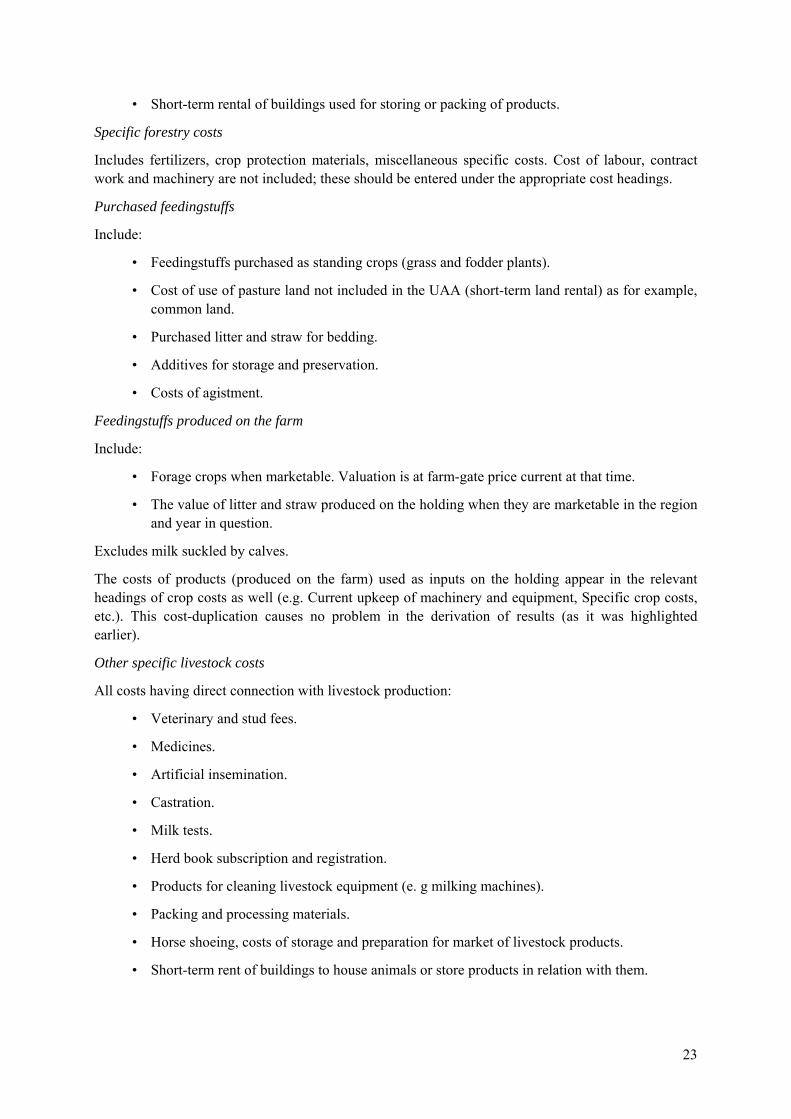
Other specific livestock costs
All costs having direct connection with livestock production:
• Veterinary and stud fees.
• Medicines.
• Artificial insemination.
• Castration.
• Milk tests.
• Herd book subscription and registration.
• Products for cleaning livestock equipment (e. g milking machines).
• Packing and processing materials.
• Horse shoeing, costs of storage and preparation for market of livestock products.
• Short-term rent of buildings to house animals or store products in relation with them.
23

Table 7: Farming overheads Contract work Current upkeep of machinery and equipment
Machinery
Motor fuels and lubricants Car expenses Upkeep of land improvements and buildings Electricity Heating fuels Water Insurance Taxes and other dues
Farming overheads
Other farming overheads
Other farming overheads
Contract work
To help analyse farm incomes better the importance of contract work is growing and for this reason this element of costs should be analysed in more detail. The EC has requested the separation of seed’s, fertiliser’s and crop protection product’s costs since the accounting year of 2008. Isolating information on material costs from the value of contract work causes considerable difficulties in many Member States. According to the updated version of farm return (RI/CC 1256 rev.5) contracted operations include:
• Total cost of services carried out by agricultural contractors. Materials used other than fuel (e.g. crop protection products) is excluded when the amount in question is known. This amount should be deduced from this heading and entered (if necessary by estimation) under the corresponding cost item (e.g. 'Crop protection products').
• Cost of hiring machines operated by the farm's labour. If it is possible to identify separately the fuel costs related to the use of the rented machinery, they should be recorded in 'Motor fuels and lubricants'.
• Cost of leasing machines operated by the farm's labour. The fuel and maintenance costs of leased machines should be recorded under the relevant headings (‘Current upkeep of machinery and equipment' and 'Motor fuels and lubricants').
Current upkeep of machinery and equipment
Includes:
• Cost of upkeep and minor repairs of machinery and equipments.
• Costs and purchases of small equipments, forcing frames, tyres, protective clothing, proportion of the cost of private cars corresponding to their use for farm purposes and detergents for general cleaning (those used for livestock cleaning are to be entered in 'Other specific livestock costs'; those used for crops are to be entered in 'Other specific crop costs').
Excludes:
• Major repairs or conversions which increase the value of machinery and/or equipment. They are considered as investments.
Motor fuels and lubricants
Includes: proportion of fuel costs of private cars used for business purposes (determined by estimation if necessary).
24

Excludes: heating fuel
When heating fuel is used both as motor fuel and heating fuel, the sum should be divided into two headings: 'Motor fuels and lubricants' and 'Heating fuels'.
Car expenses
Costs of the share for business use of private cars (by estimation if necessary). This concerns those cars that are not in the list of fixed assets.
Upkeep of land improvements and buildings
Maintenance of buildings (minor repairs) and land improvements financed by the holder (including greenhouses and horticultural frames).
Includes: purchase of necessary building materials, also felled timber used for maintenance.
Excludes:
• The purchase of building materials for new investments. To be entered as 'Investment'.
• Investment costs (including major repairs which increase the value of buildings), even if the cost of such work is made by the tenant.
Electricity
Total consumption of electricity for farm business use.
Heating fuels
Total consumption of heating fuels for farm business use. Firewood is also included.
Water
Includes: cost of connection to the mains and consumption of water for all farm purposes, including irrigation.
Excludes: costs of using irrigation equipment.
Insurance
Includes: all premiums covering farm risks (third-party liability, fire, flood, loss of crops and livestock).
Excludes: employee accident insurance (to be recorded in 'Wages paid and social security costs'). Insurances paid by the holder for farm buildings can be entered under this heading if they are not already in 'Insurances for farm buildings'.
Other farming overheads
All other farm costs not covered by preceding headings (e.g. non-specific short-term renting of land/buildings, accountants' fees, secretarial services, office expenses, telephone charges, subscriptions).
Insurance for farm buildings
Includes: insurance premiums (e.g. fire, flood) for the buildings in owner-occupation, which in the case of tenant farming are normally paid by the landlord. In the case of insurance payments covering buildings shared by several holdings, the holding share is to be estimated. If all the insurances are covered by a single policy, the farm business share is to be estimated.
25
2.3.2. External factors
Remuneration of inputs which are not in the property of the holder.
Wages and social security
Includes: all payments to employees in return for work done.
Excludes: holder’s and employer’s social security and insurance costs which are not recorded here or elsewhere in the farm return (they are regarded as being taken out of the financial return of the holding). The amounts that could be received by the unpaid workers. They should not appear in the farm return. The allowances (in cash or in kind) paid to retired paid workers no longer employed on the holding to be recorded under ‘Other farming overheads’.
Rent paid
Includes:
• Rent paid, including in kind, for land, buildings, quotas and other rights for the farm business. If necessary, an estimate of the business share of farmhouses and other rented buildings should be entered.
• Taxes (e.g. land tax) which are paid by the tenant on behalf of the owner. Rental and leasing costs of quotas not attached to land.
Excludes:
• Cost of short-term land rental for use of pasture land not included in the UAA. To be registered in 'Purchased feedstuffings'.
• Cost of short-term renting of buildings to house animals or store products in relation with them. To be registered in 'Other specific livestock costs'.
• Cost of short-term renting of buildings and/or land used for processing and marketing crops. To be registered in 'Other specific crop costs'.
• Cost of non-specific short-term renting of land/buildings. To be registered in 'Other farming overheads'.
Interest paid: Interest and financial charges on loans for the farm business. The subsidies on interest are not deducted.
Conclusion
The cost accounting principles of IFRS and FADN are basically the same. Differences can be found in the process of recording costs of farm-produced feedingstuffs. Not only the purchased, but feedingstuffs produced on the farm have to be recorded. It is very important since the latter is included in the relevant headings of crop costs, as well (e.g. Current upkeep of machinery and equipment, Specific crop costs, etc.). This cost-duplication causes no problem in the derivation of results, but should be taken into consideration in the cost of production model.
Regarding the recording of costs we have very little information about the practice of the Member States, but we assume that contract work and farm-produced feedingstuffs are treated differently.
Most farms have more than one enterprise. The cost items cover various activities and there are no data showing the division of the costs. The division of cost among activities can be difficult.
26

27
2.4. Valuation of assets Valuation of assets regards intangibles (quotas and delivery rights), tangibles (land, buildings, machinery and equipment) and biological assets (breeding animals, growing timber, permanent crops) as well as circulating capital. The basic principle of FADN valuation is to value assets at their current real market or fair value.
Details of the valuation of the different assets and differences between FADN and IFRS can be found in the following tables.

Table 8: Differences in the valuation of assets in FADN and IFRS
Continued on the next page
Affected indicators according to FADN division
Balance sheet items (order according to order in the data sheet)
Valuation according to FADN Valuation according to IFRS and relevant Standards
Affected parts of the data sheet
Income indicators Balance sheet indicators
Financial indicators
Livestock Initial valuation and secondary adjustments to market value. For determination of SE 206 only the change in value corresponding of the increase in volume of the animals present in the holding for more than one year are taken into consideration
Valuation of livestock at Fair Value (market value). Changes in value have to be shown as profit or loss in the period in which they occur.
Total output, Gross farm income; farm net value added, Family farm income
Breeding livestock; Total fixed assets; Non breeding livestock; Total assets; Net worth
Change in net worth; Average farm capital
Number and value of livestock (Table D)
Relevant Standard: IAS 41
Land Valuation at net selling price. Quotas bound at land are balanced together with the land. No depreciation
Initial Valuation at original costs. Secondary adjustments at continued costs or at revaluation (eligibility)
In general no differences. But diminution in value in some circumstances affect income indicators
Only little differences within Land, permanent crops and quotas
No differences Land and buildings, deadstock, circulating capital (Table G)
Relevant Standards: IAS 16, IAS 40, IFRS 5; IAS 36; IAS 2. IAS 16 is most important.
Buildings Valuation and depreciation at replacement value.
Initial valuation at original costs. Secondary adjustments at continued costs or at revaluation
SE 360; SE 415; SE 420
Buildings; Total fixed assets; Total assets;Net worth; average farm capital
Change in net worth
Land and buildings, deadstock, circulating capital (Table G)
Relevant Standards: IAS 16, IAS 40, IFRS 5; IAS 36; IAS 2. IAS 16 is most important.
Machineries Valuation and depreciation at replacement value.
Initial valuation at original costs. Secondary adjustments at continued costs or at revaluation
SE 360; SE 415; SE 420
Machinery; Total fixed assets; Total assets; Net worth; Average farm capital
Change in net worth
Land and buildings, deadstock, circulating capital (Table G)
Relevant Standards: IAS 16, IAS 2, IAS 36, IFRS 5. IAS 16 is most important.
28

Differences in the valuation of assets in FADN and IFRS
Affected indicators according to FADN division
Balance sheet items (order according to order in the data sheet)
Valuation according to FADN Valuation according to IFRS and relevant Standards
Affected parts of the data sheet
Income indicators Balance sheet indicators
Financial indicators
Permanent crops Valuation and depreciation at replacement value.
Valuation of permanent crops at Fair Value (market value). Changes in value have to be shown as profit or loss in the period in which they occur.
Total output; Gross farm income; Depreciation; Family farm income
Land, permanent crops; Total fixed assets; Total assets; Net worth; Average farm capital
Change in net worth
Land and buildings, deadstock, circulating capital (Table G)
Relevant Standard: IAS 41 Standing timber Valuation at original costs.
No depreciation Valuation of standing timber at Fair Value (market value). Changes in value have to be shown as profit or loss in the period in which they occur.
Total output, Gross farm income; farm net value added, Family farm income
Land, permanent crops; Total fixed assets; Total assets; Net worth; Average farm capital
Change in net worth
Land and buildings, deadstock, circulating capital (Table G)
Relevant Standard: IAS 41 Unfinished cultivation
Valuation with the costs of fertilizers, seeds/seedlings; soil improvers.
Valuation of unfinished cultivation at Fair Value (market value). Changes in value have to be shown as profit or loss in the period in which they occur.
Compare standing timber
Total current assets; Total assets; Net worth
Change in net worth
Land and buildings, deadstock, circulating capital (Table G)
Average farm capital
Relevant Standard: IAS 41 Liabilities Outstanding parts of liabilities
have to be balanced. Debenture bonds have to be valued with cash value.
In principle cash value. Use off effective loan rate. If no loan discount or other transaction costs exist it is repayment amount.
Interest paid; Total external factor; Family farm income. Differences can arise when big loan discounts exist.
Total liabilities; Net worth
Change in net worth
Debts (Table H)
Relevant Standard: IAS 32; IAS 39; IAS 37
Continued on the next page
29
30
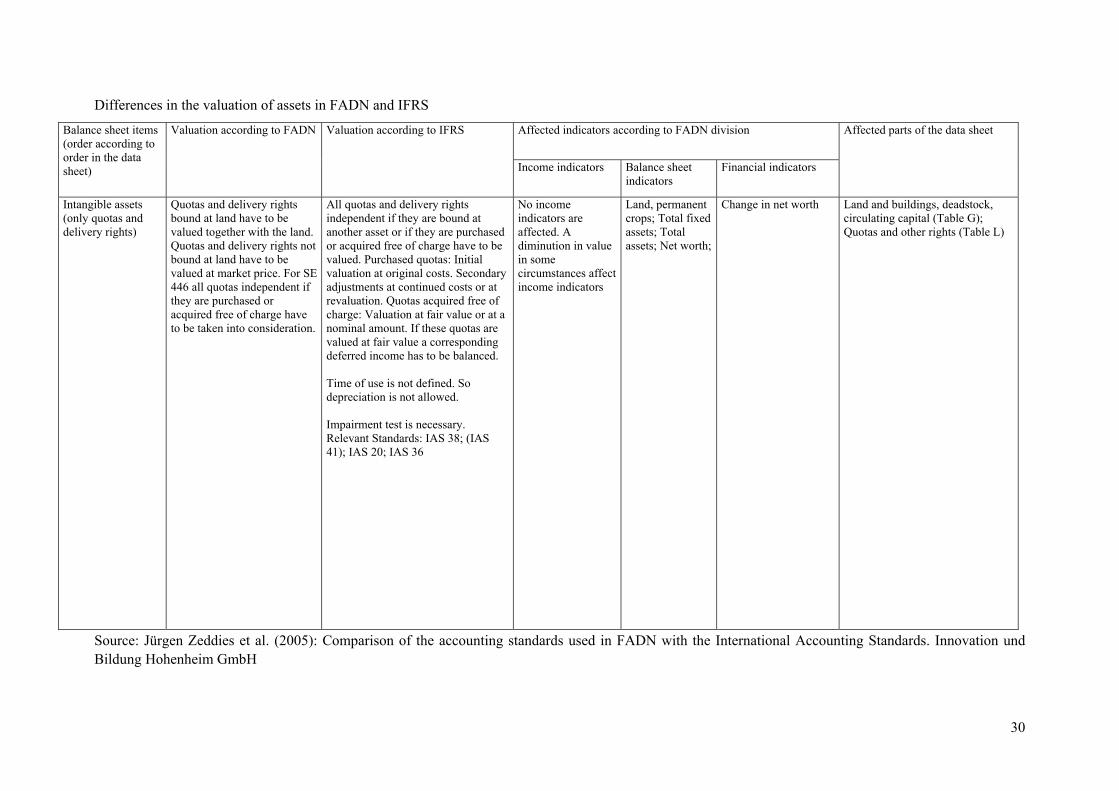
Differences in the valuation of assets in FADN and IFRS
Affected indicators according to FADN division Balance sheet items (order according to order in the data sheet)
Valuation according to FADN Valuation according to IFRS
Income indicators Balance sheet indicators
Financial indicators
Affected parts of the data sheet
Intangible assets (only quotas and delivery rights)
Quotas and delivery rights bound at land have to be valued together with the land. Quotas and delivery rights not bound at land have to be valued at market price. For SE 446 all quotas independent if they are purchased or acquired free of charge have to be taken into consideration.
All quotas and delivery rights independent if they are bound at another asset or if they are purchased or acquired free of charge have to be valued. Purchased quotas: Initial valuation at original costs. Secondary adjustments at continued costs or at revaluation. Quotas acquired free of charge: Valuation at fair value or at a nominal amount. If these quotas are valued at fair value a corresponding deferred income has to be balanced. Time of use is not defined. So depreciation is not allowed. Impairment test is necessary. Relevant Standards: IAS 38; (IAS 41); IAS 20; IAS 36
No income indicators are affected. A diminution in value in some circumstances affect income indicators
Land, permanent crops; Total fixed assets; Total assets; Net worth;
Change in net worth Land and buildings, deadstock, circulating capital (Table G); Quotas and other rights (Table L)
Source: Jürgen Zeddies et al. (2005): Comparison of the accounting standards used in FADN with the International Accounting Standards. Innovation und Bildung Hohenheim GmbH

Conclusion
It can be stated that the objectives of accounting according to FADN and IFRS are not identical. Concerning assets, according to FADN only operational resources are considered whereas according to IFRS the total assets of an enterprise (for example including financial assets) are to be indicated in the financial statement.
In general, that the theoretical requirements of FADN are realised in a different way in the Member States. The data delivery in the member states for FADN purposes is not totally harmonised. For example: FADN requires a valuation of agricultural land at net selling prices. Some of countries follow this requirement and the other countries value agricultural land different from these FADN specifications. These countries often distinguish between purchased land and other land.
The valuation of quotas and delivery rights in the Member States is entirely different. Against the background of very heterogeneous national rules this different treatment is comprehensible. But it has to be mentioned that the valuation of quotas and delivery rights in the Member States is treated in a very different way and that these assets are in some member states not taken into consideration at all.
The valuation of biological assets is also very different.
2.5. Other special accounting principles In the following part of the report all those topics are listed which should have importance regarding to the cost of production model and need to be discussed in more detailed. Some of the below mentioned issues have direct impact (e.g.: depreciation) on the cost model while others influence the cost model in indirect way.
2.5.1. Depreciation
In FADN the calculation of depreciation is based on the replacement value (purchase price of a similar asset at current prices) before deducting subsidies and including major repairs. Determination of the replacement value may vary in the different Member States. Traditionally depreciation is calculated by the historical cost method on which the replacement value calculation is based. The following example shows the calculation of replacement value based depreciation from historical cost:
1. Rate of depreciation (%) = 100% / Service life
2. Accumulated depreciation = Acquisition value – Book value
3. Average age = Accumulated depreciation * Annual depreciation-1
4. Replacement value = Acquisition value RVF The acquisition value needs to be raised to the RVF (Replacement Value Factor) power. The suitable RVF is determined on the basis of the machinery price indices by the average age of the asset.
5. Accumulated depreciation on replacement value = Replacement value * rate of depreciation * age of the asset
6. Closing value = Replacement value – accumulated depreciation on replacement value
7. Depreciation of actual year = replacement value * rate of depreciation
8. Opening value = Closing value + depreciation of actual year + reductions (e.g. sale) - increase (e.g. purchase of new assets)
31

More information about depreciation systems in different Member States can be found in Annex 9.
Depreciation is not applicable to land, forest land, circulating capital and quotas.
The depreciation rates can be set locally. (See also document RI/CC 1439 Rev 1). The general rules for calculating the depreciation of plantation, buildings and machinery are detailed below.
Depreciation of plantations
The costs of young trees and bushes for a new plantation are regarded as capital assets subject to depreciation.
Only plantations which are the property of the holder (irrespective of the type of occupation of the land) are subject to depreciation.
Depreciation of farm buildings, fixed equipment and land improvements
FADN requires valuation and depreciation of buildings on the basis of replacement values. Buildings, fixed equipment (including glasshouses and frames) and land improvements belonging to the holder, irrespective of the type of occupation of the land, are subject to deprecation.
In IFRS buildings are subject to valuation according to IAS 16 or IAS 40 depending on their classification. For buildings it is usually impossible to identify their fair value on the basis of market data which means in many cases there is no active market according to the definition of IAS 16. In the case of a non-existent active market however, IAS 16 allows the implementation of a capitalized earnings value procedure or the replacement value.
Depreciation of Machinery
In FADN machinery and equipment subject to depreciation is defined as that having a value when new greater than about EUR 100. The depreciation of minor equipment of lower value should not be calculated; purchases of such equipment are to be treated directly as costs for the accounting year (heading 61 ‘Current upkeep of machinery and equipment’). Major repairs which effectively increase the value of the machinery and equipment compared to their value before repair, are also included under this heading, either as an integral part of the machinery or equipment depreciation, which, as appropriate, will be adjusted to take account of the extended life (due to the repairs) of the item in question or by spreading the cost of the major repairs over several successive years.
The amount of annual depreciation may be calculated according to the linear or diminishing balance method.
The rate of depreciation is determined by various factors, which depend for the most part on the particular conditions of the region and of the production in question (amount of use in each year) but also on technical progress.
In view of the resulting differences in depreciation from one region to another, and even from one holding to another, accountancy offices may choose rates for each item of machinery or equipment appropriate to the region or holding, the aim being to keep as closely as possible to the actual depreciation in value of the machinery.
In IFRS machinery is subject to valuation according to IAS 16. See remarks given for buildings
32

2.5.2. Taxes and subsidies
Taxes and other dues
Includes taxes and other dues relating to the farm business, environmental taxes and additional levy on milk.
Excludes VAT, taxes on land and buildings, taxes on hired labour (to be recorded in „Wages paid and social security costs”), direct income tax which is not recorded at all in the farm return. Subsidies on taxes are deducted.
Taxes on land and buildings
Includes taxes, rates and other dues paid in relation to the ownership or use of farmland, woodland and buildings in owner-occupation and sharecropping.
Excludes taxes (e.g. land tax) which are paid by the tenant on behalf of the owner (to be entered in „Rent paid”).
Grants and Subsidies
Grants and subsidies cover:
• Direct National and/or EU payments decoupled or based on area or animal production
• Direct payments related to Rural Development or Art. 69 of Council Regulation (EC) No 1782/2003.
• Direct payments on costs and on livestock purchases
• Other direct payments
All direct payments recorded concerning production, areas or livestock are related to the current accounting year, even if not yet received. For Rural Development Payments, only the amounts received during the accounting year should be entered. If necessary, these amounts can be estimated on the basis of crop areas, livestock, entitlements and/or production. If there is a difference between the claimed and the actually received subsidies – that may occur frequently – than the differences should be corrected in the following year.
Subsidies on investments are not included among subsidies, however they are considered in the derivation of family farm income. According to IFRS subsidies on investments have no effects on farm results.
Pillar 1 and Pillar 2
Detailed direct EU decoupled payments are represented in Table 8. For Member States joining the EU since 2004, the funds available for direct payments under Pillar I of the CAP are being phased in over a period of nine years.
All New Member States were given the option of allocating direct payments using the Single Area Payment Scheme (SAPS) rather than the Single Payment Scheme (SPS) used by the EU-15. Under the SAPS, subsidies are allocated on the basis of uniform payments per hectare of agricultural land. All new Member States except Malta and Slovenia use the SAPS, but are currently required to make the transition to the SPS by 2010 (for 2004 entrants) or 2011 (for 2007 entrants).
33

Table 9: Direct EU decoupled payments or based on area and animal production under Council Regulation (EC) No 1782/2003 Table J - Detail of heading 113 (Grants and subsidies except those on costs and purchase of animals) (►see also RI/CC 1314) Grants and subsidies Code
600 Total amount of area payments for certain arable crops, based on Council Regulations (EC) No 1782/2003, including area payments for set aside and aid for energy crops. Single Payment Scheme based on Council Regulation (EC) No 1782/2003. . 670 Single Area Payment Scheme, based on Council Regulation (EC) No 1782/2003. 680 Total amount of direct payments in the common organisation of the market in beef and veal, based on Council Regulation. (EC) No 1782/2003.
700
Dairy Premium and additional payments, based on Council Regulation (EC) No 1782/2003. 770 Source: RICC 1256 Rev 5
The registration of direct payments related to Rural Development can be seen in Table 9. Rural development policy has emerged in a piecemeal way, as a result of successive reforms of the CAP. In 2005, however, existing programmes and budget lines were pulled together into a single funding and programming instrument known as the European Agricultural Fund for Rural Development (EAFRD). The fund supports projects across three 'axes':
• Axis 1 covers measures designed to improve the competitiveness of the farming and forestry industry,
• Axis 2 covers environmental and land-management schemes,
• Axis 3 covers initiatives aimed at improving quality of life and the diversification of the rural economy.
A fourth, separate, element of the fund is reserved for LEADER initiatives, whereby local action groups in rural areas can secure funding for local development projects.
Rural development policy under the EAFRD is implemented through national strategy plans prepared by each Member State on the basis of domestic priorities. These plans must be approved by the Commission, and are subsequently delivered through rural development programs in each Member State. In drawing up their plans, Member States must respect certain minimum spending requirements in each of the four categories. Once plans are approved, spending must be co-financed according to fixed percentages, meaning that Member States must contribute national resources in addition to the funds provided by the EU.
34
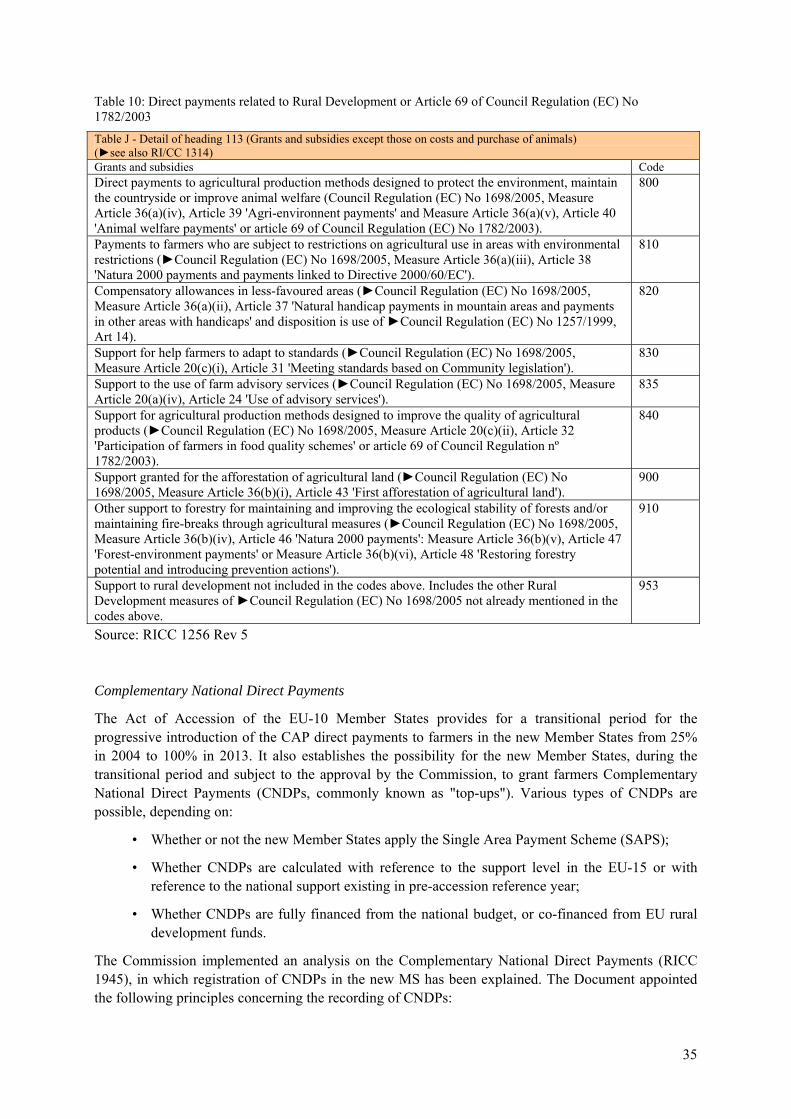
Table 10: Direct payments related to Rural Development or Article 69 of Council Regulation (EC) No 1782/2003Table J - Detail of heading 113 (Grants and subsidies except those on costs and purchase of animals) (►see also RI/CC 1314) Grants and subsidies Code Direct payments to agricultural production methods designed to protect the environment, maintain the countryside or improve animal welfare (Council Regulation (EC) No 1698/2005, Measure Article 36(a)(iv), Article 39 'Agri-environnent payments' and Measure Article 36(a)(v), Article 40 'Animal welfare payments' or article 69 of Council Regulation (EC) No 1782/2003).
800
Payments to farmers who are subject to restrictions on agricultural use in areas with environmental 810 restrictions (►Council Regulation (EC) No 1698/2005, Measure Article 36(a)(iii), Article 38 'Natura 2000 payments and payments linked to Directive 2000/60/EC'). Compensatory allowances in less-favoured areas (►Council Regulation (EC) No 1698/2005, Measure Article 36(a)(ii), Article 37 'Natural handicap payments in mountain areas and payments in other areas with handicaps' and disposition is use of ►Council Regulation (EC) No 1257/1999, Art 14).
820
Support for help farmers to adapt to standards (►Council Regulation (EC) No 1698/2005, Measure Article 20(c)(i), Article 31 'Meeting standards based on Community legislation').
830
Support to the use of farm advisory services (►Council Regulation (EC) No 1698/2005, Measure Article 20(a)(iv), Article 24 'Use of advisory services').
835
Support for agricultural production methods designed to improve the quality of agricultural products (►Council Regulation (EC) No 1698/2005, Measure Article 20(c)(ii), Article 32 'Participation of farmers in food quality schemes' or article 69 of Council Regulation nº 1782/2003).
840
Support granted for the afforestation of agricultural land (►Council Regulation (EC) No 1698/2005, Measure Article 36(b)(i), Article 43 'First afforestation of agricultural land').
900
Other support to forestry for maintaining and improving the ecological stability of forests and/or maintaining fire-breaks through agricultural measures (►Council Regulation (EC) No 1698/2005, Measure Article 36(b)(iv), Article 46 'Natura 2000 payments': Measure Article 36(b)(v), Article 47 'Forest-environment payments' or Measure Article 36(b)(vi), Article 48 'Restoring forestry potential and introducing prevention actions').
910
Support to rural development not included in the codes above. Includes the other Rural Development measures of ►Council Regulation (EC) No 1698/2005 not already mentioned in the codes above.
953
Source: RICC 1256 Rev 5
Complementary National Direct Payments
The Act of Accession of the EU-10 Member States provides for a transitional period for the progressive introduction of the CAP direct payments to farmers in the new Member States from 25% in 2004 to 100% in 2013. It also establishes the possibility for the new Member States, during the transitional period and subject to the approval by the Commission, to grant farmers Complementary National Direct Payments (CNDPs, commonly known as "top-ups"). Various types of CNDPs are possible, depending on:
• Whether or not the new Member States apply the Single Area Payment Scheme (SAPS);
• Whether CNDPs are calculated with reference to the support level in the EU-15 or with reference to the national support existing in pre-accession reference year;
• Whether CNDPs are fully financed from the national budget, or co-financed from EU rural development funds.
The Commission implemented an analysis on the Complementary National Direct Payments (RICC 1945), in which registration of CNDPs in the new MS has been explained. The Document appointed the following principles concerning the recording of CNDPs:
35

• The top-ups should be recorded as much as possible separated from the EU basic payments and from the other national aids to allow analyzing them separately.
• The decoupled top-ups have to be registered under one code and clearly separated from the coupled top-ups. This separation is crucial for analytical purpose.
• The coupled top-ups should be recorded as specifically as possible, i.e. according to the product or the animal to which it is linked.
• The top-ups have to be registered according to the same rules within each Member State.
• They shall not be double-counted in the farm return.
2.5.3. VAT
The farm return distinguishes four type of VAT system:
• A. Normal: VAT collected on sales and paid on purchases are paid and recovered respectively from the VAT authority.
• B. Agricultural with lump sum repayment: VAT is paid on purchases but not recovered on sales. Instead, the farmer receives an overall compensation from the VAT authority.
• C. Agricultural with fixed rate reimbursement on sales: VAT is paid on purchases and the farmer recovers a fix rate share of VAT on sales
• D. VAT on sales and purchases not separately identifiable: Purchases and sales in the farm return are entered with VAT included.
VAT system used in different Member State can be found in: RI/CC 1256. rev.5 Table 2.9.4
The general rule is for all entries to be made exclusive of VAT; this poses no problems when the holder is subject to the normal VAT system. When the special agricultural system applies, different VAT amounts should be recorded so that when the results are calculated any advantages of national agricultural VAT systems can be taken into account.
VAT balance on current operations = VAT on sales + flat-rate refund of VAT - VAT on purchases
2.5.4. Milk quota
Recognition and measurement of quotas and delivery rights is treated in the Member States in different ways. This is true for milk quota as well. That is partly understandable as different quota systems exist in the different Member States (Annex 10.).
Only quotas and delivery rights are registered as intangible assets according to FADN. Quotas and delivery rights related to land recorded in conjunction with land (Table G of farm return). Quotas and delivery rights which are not bound to land area are to be registered in table L of the farm returns. All quotas and delivery rights are to be recorded at least hypothetically. This holds true regardless whether they have been acquired free of charge or in return for payment. Quotas and delivery rights which are registered in table L are valued at current market values. Quotas and delivery rights which are bound to agricultural area (registered in Table G) are subject to valuation at net sales price. Indeed, those quotas and delivery rights are not shown separately in Table G but in combination with the corresponding agricultural area.
Theoretically all quotas and delivery rights independent if they are bound at another asset or if they are purchased or acquired free of charge have to balance according to FADN as well as IFRS. Since the
36
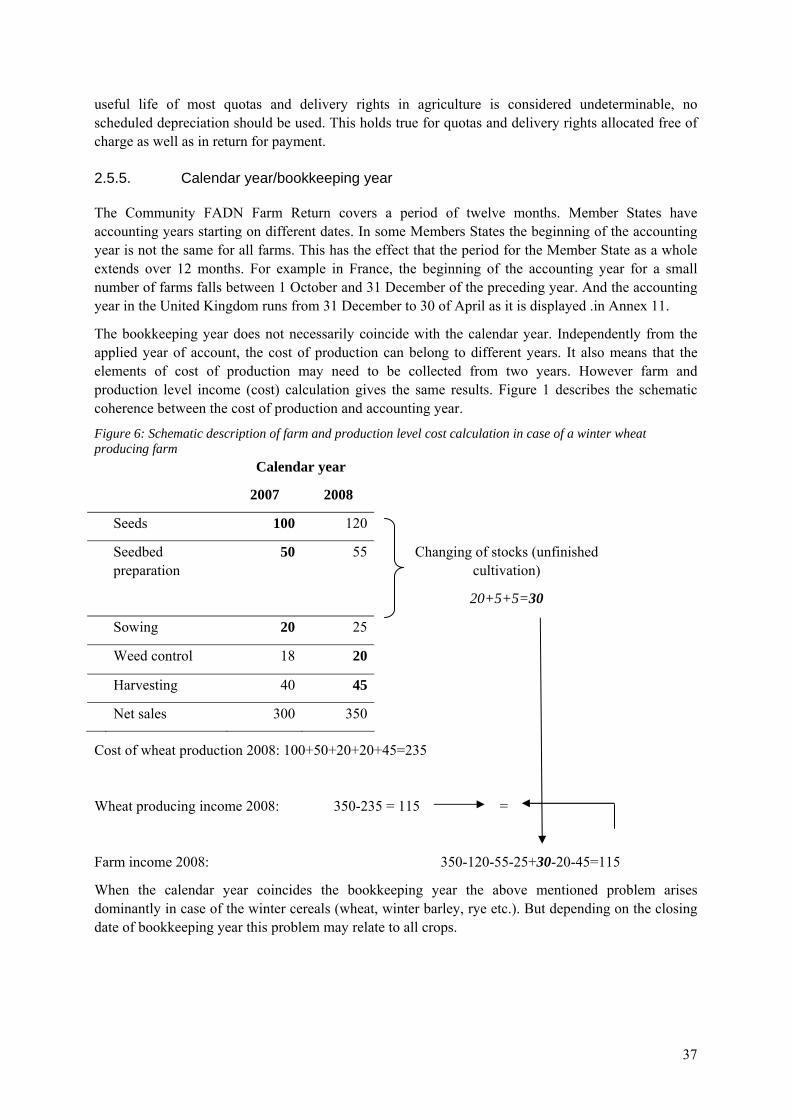
useful life of most quotas and delivery rights in agriculture is considered undeterminable, no scheduled depreciation should be used. This holds true for quotas and delivery rights allocated free of charge as well as in return for payment.
2.5.5. Calendar year/bookkeeping year
The Community FADN Farm Return covers a period of twelve months. Member States have accounting years starting on different dates. In some Members States the beginning of the accounting year is not the same for all farms. This has the effect that the period for the Member State as a whole extends over 12 months. For example in France, the beginning of the accounting year for a small number of farms falls between 1 October and 31 December of the preceding year. And the accounting year in the United Kingdom runs from 31 December to 30 of April as it is displayed .in Annex 11.
The bookkeeping year does not necessarily coincide with the calendar year. Independently from the applied year of account, the cost of production can belong to different years. It also means that the elements of cost of production may need to be collected from two years. However farm and production level income (cost) calculation gives the same results. Figure 1 describes the schematic coherence between the cost of production and accounting year.
Figure 6: Schematic description of farm and production level cost calculation in case of a winter wheat producing farm Calendar year
2007 2008
100 Seeds 120
Seedbed preparation
50 55 Changing of stocks (unfinished cultivation)
20+5+5=30
Sowing 20 25
Weed control 18 20
Harvesting 40 45
Net sales 300 350
Cost of wheat production 2008: 100+50+20+20+45=235
Wheat producing income 2008: 350-235 = 115 =
Farm income 2008: 350-120-55-25+30-20-45=115
When the calendar year coincides the bookkeeping year the above mentioned problem arises dominantly in case of the winter cereals (wheat, winter barley, rye etc.). But depending on the closing date of bookkeeping year this problem may relate to all crops.
37
2.5.6. Contract rearing
The results of cost of production model can be strongly influenced by those farms which have receipts from contract rearing (in which the holder does not assume the economic risk in rearing or fattening animals). In this way it is of great importance to examine how the cost of production model can take into account the costs and receipts of contract rearing. According to the FADN regulation the accounting of contract rearing is as follows: The number of animals raised or fattened under contract should be recorded only in Table D, column 5 - average number. When the farmer has his own animals in the same category, the average number is increased by average number of animals under contract. It is not possible to distinguish between owned animals and animals under contract. The production (value) coming from animals under contract is separated and registered in Table K, heading 171 - Contract rearing. The purchases and sales of the animals owned by the farmer have to be recorded in Table E and Table N.
So the receipts appear in different headings but the costs concerning contract rearing has no division therefore the separation of these costs is difficult. The importance of contract rearing varies from Member State to Member State. What is more the type of contracts is also very different which can influence the recording and separation of costs. In some cases the owner of the animals ensures all the inputs (feedingstuffs, medicines) while in other cases the farmer has to cover all the expenditures. For instance in Hungary the importance of contract rearing decreases and concerns mainly the poultry sector. In general, in Hungary the owner of the animals covers all the expenditures (feedingstuff costs, veterinary fees, etc.), in order to ensure the quality. Thus at farm level these costs do not appear in the farm return. While in other cases when the farmer has to buy the feedingstuffs, medicines, etc., the costs must be recorded in the relevant heading of the farm return. The calculation of cost of production model is even more complicated when the farm has its own animals. Neither the costs nor the average number of the livestock are possible to determine exactly. On the other hand, neither the production nor output can be calculated, because only the receipts (equivalent value of service rendered) are recorded in Table K.
To use only farms without receipts from contract rearing for the model is not a possible solution since, for example, in the Netherlands 70-90% of fattening calves are under contract. But it must be taken into account to separate these farms and to treat them differently. The cost of production model should consider the national distinctions concerning the practice of contract rearing, as well.
Conclusion
In general, the theoretical requirements of FADN are realised in different ways in the Member States. To understand why recording of data varies from Member State to Member State we should make enquire about the historical background, the taxation system, the subsidies and the VAT system of the given country. All this information influences the availability and the recording of data. For instance, in Hungary the age of machinery causes problems. The calculation of replacement value for very old harvesters and tractors is difficult. This is not a problem for old Member States where the average age of machinery is lower. There are heterogeneous national rules also for milk quota, taxes and subsidies.
Regarding depreciation in many cases IFRS also allows the application of replacement value even if there is no active market. The accounting of subsidies and quota is different from the principles of IFRS. According to IFRS subsidies on investments have no effects on farm results.
Direct EU payments are separated from complementary national payments, while decoupled payments are registered under one heading in the farm return. In this way the connection of subsidies to production and products is very difficult.
38

The problem of contract rearing also should be mentioned. The model should separate farms with receipts from contract rearing and also consider national distinctions regarding to recording of contract rearing.
In spite of the trend towards increased specialization, most farms still have more than one enterprise. It must be taken into consideration that the distribution of common costs like depreciation among activities is difficult.
2.6. Other gainful activities An important matter that needs to be taken into consideration is how other gainful activities are recorded in the FADN data and how they are affecting the calculation of costs of production and farmers’ returns. This information is important to determine how the FADN data should be used in the cost of production model. First of all it needs to be clarified what is meant to be “other gainful activities” in the framework of EU FADN. According to the Commission Regulation establishing a Community typology (RICC 1492 rev. 1) the gainful activities directly related to the holding other than the agricultural activities of the holding comprise all activities other than farm work, directly related to the holding and having an economic impact on the holding. Those are activities where either the resources of the holding (area, buildings, machinery, agricultural products, etc.) or the products of the holdings are used.
A Commission study on the question of other income was performed in 2006. It has concluded that the inclusion of ”Other gainful activity” varies from Member State to Member State. There are several reasons for that:
• Most MS use limits to decide when “Other gainful activity” should be included in FADN or not. When the income exceeds the upper limit, the receipts and costs regarding the income are excluded and, if the income is below the limit, the receipts and costs are included in FADN.
• The construction and value of the limit varies between MS due to technical and legal prerequisites.
• Some MS that do not use limits for when to exclude “Other gainful activity”, instead do not include holdings with large proportions of “Other gainful activity” in the FADN sample. As the holdings are excluded in this way, the sample cannot be used to estimate the importance of “Other gainful activity” for the FADN population.
• The division of agricultural and non-agricultural activities and resources may theoretically be good but it does not work in practice. MS also have different rules for which activities to include and exclude. These rules seem to be based on the availability of data depending on national prerequisites.
The results of the questionnaire sent to the MS concerning “Other income on the holding” collected in EU-FADN show the follows:
• Twelve of 23 MS have not introduced any limitations (BE, CZ, ES, IE, IT, CY, LV, HU, NL, PL, PT and SK). Restrictions have been introduced in nine Member States. If “Other income on the holding” exceeds a certain amount or a proportion of total gross output, it is not included under “Other activities” in EUFADN.
• In FR, the limit is € 50 000 (in 2005) or 30 percent of revenue. In FI, only agricultural activities are included in FADN. If “Other income” is less than € 8 400 per farm (influenced by the tax system), it will be included if other activities cannot be separated from agriculture.
39
• In AT, “Other income” must be subordinated to the agricultural activities and be carried out with the resources of the company. In SE, a thumb rule says that a holding is excluded if gross output from “Other income” exceeds € 60 000 or 50 percent of total gross output. In DK, there is no exact limit, but if income from contractual work is large compared to agricultural income, it can be moved to non-agricultural activities.
• In DE, entities with more than 50 percent of the gross output from non-agricultural activities will be excluded from EU-FADN. In EE, “Other income on the holding” should be included under “Other activities” when it is used or will be used for purposes of the holding. When the other income contributed to more than 50 percent of the total turnover of the holding, it has been excluded from the sample.
• In LT, the principle is that if “Other income” exceeds € 1 000, detailed information has to be presented to the liaison agency, which decides if the holding should be included in the sample. In addition to that, other activities should be less than 50 per cent of agricultural income. In the UK, there is no upper limit but a condition for inclusion in FADN is that these activities must utilise farm resources. Some enterprises reach a size where they become self-sufficient and either no longer use farm resources or pay a commercial price for them. At this stage, they are no longer included in EUFADN
The other incomes in FADN are included with the aim of making it possible to get as good an idea as possible of the receipts and costs for agricultural activities. Having this purpose in mind, the current way of including different types of activities in MS with different prerequisites could be fairly suitable. It should also be noted that the FADN regulations offer different possibilities for including, for example, tourism and forestry.
Compared to other areas, the regulation is also fairly vague on which activities to include or exclude. The reasons for the differences between MS seem to be:
• Different farm structures between MS
• Different interpretations of the EU Farm Return in the MS.
The technical feasibility of specifying receipts and costs by activity is rather low. The main reasons for this are:
• Many cost items cover various activities and there is no data showing the division of these costs
• Separate accountancy systems are used for agricultural activities and for other activities, normally due to taxation purposes and other legal reasons
• Farmers are not willing to carry out a division of the costs.
The possibilities of changing definitions were discussed. In general, the MS are reluctant to do this because of the practical problems with national legislation, for example, the difficulties in separating receipts and costs between agricultural activities and other activities on the holding.
At national level, additional information about “Other gainful activity” is collected that is not included in EU-FADN. However, it should be noted that the definitions vary (Ann-Marie K. et al., 2006).
Conclusion
FADN is a highly EU- harmonised survey. Much time and effort is spent in the Member States and at the EC in order to produce comparable and reliable information for agricultural activities. The
40
conditions in the MS vary especially regarding activities other than agricultural activities on the holding. This means that it has to be taken into consideration that harmonization in the area of “Other income on the holding” is difficult. The inclusion of ”Other gainful activity” varies from Member State to Member State. Member States decide in different ways whether a holding which has other gainful activity should be included in FADN or not. Regarding to the “general” cost of production model the most important problem is that the cost items cover various activities and there is no data showing the division of the costs. And due to the different interpretation of other gainful activities it is difficult to determine whether a cost connects to an agricultural or non-agricultural activity.
41

Conclusion
FADN is the only source of micro-economic data for agriculture that is harmonised within the EU. Therefore, the production cost model developed in the project will use FADN data, so it is crucial to examine the usefulness and appropriateness of FADN data systems to measure the cost of production for agricultural commodities. In the Member States, the data are collected according to EU-wide standardised guidelines. However, there are national distinctions concerning data availability.
The report consists of two main parts. In the first part an overview of the general methodology of the EU FADN system was given, clarifying the basic definitions (universe of farms, commercial farms, SGM and so on). The selection of farms, the weighting system and the collection of data as well as the procedure of data verification were briefly described. In addition, major differences between the Member States were highlighted.
It can be stated that FADN data collection has many differences in the Member States, thus special care must be taken to define harmonised European data for the cost model.
• The lower thresholds to get into the sample vary from 1 to 16 ESU. In some Member States upper thresholds are determined, as well (E.g. Netherlands).
• The FADN's representativeness is considerably different. In seven Member States of EU25 FADN farms represent less than 90 per cent in terms of Standard Gross Margin.
• Member States use different additional criteria for farms to get into the field of survey and the methods for defining the sample are also different.
• The year of FSS varies from Member State to Member State between 1999 and 2006. It has great importance, as there was a large structural change in CEE countries in recent years. The later is the FSS the better is the selection plan.
For elaborating the production cost model several aspects should be taken into consideration. It needs to be examined:
• from which year data series are available in each Member State.
• which are those compulsory headings that are not recorded by Member States
• which are those voluntary headings that are not recorded by Member States
It is very difficult to detect missing variables when a 0 can either be a 0 or a missing variable. The model must take into account the national distinctions (for example Table N is not recorded by Italy) which can influence the results strongly. All these circumstances influence the statistical usefulness of FADN data and must be taken into consideration regarding the cost of production model.
The second part of the report, on the one hand, focuses on the different valuation methods of FADN and IFRS, on the other hand, tries to reveal the different interpretation of FADN regulations applied by Member States. In particular the report examines the following topics:
• Calculation of standard results
• Cost accounting principles
• Valuation of assets
• Other special accounting principles
42

Two important features of FADN income calculation differ from the income calculated according to IFRS: investment subsidies increase income in FADN and profit tax is not deducted from the income in FADN. However, these differences have little influence on the cost of production.
The cost accounting principles of IFRS and FADN are basically the same. Differences can be found at the recording of the cost of farm produced feedingstuffs due to the diverse valuation methods (on farm cost-farm gate price) of costs. The costs of products (produced on the farm) used as inputs on the holding appear in the relevant headings of crop costs, as well (e.g. Current upkeep of machinery and equipment, Specific crop costs, etc.). This cost-duplication causes no problem in the derivation of results, but should be taken into consideration in the cost of production model.
Regarding to recording of costs our information about the practice of the Member States is limited. Nevertheless we assume that contract work and farm-produced feedingstuffs are treated in different ways.
Most farms have more than one enterprise. The cost items cover various activities and there is no data about the division of the costs. Therefore the distribution of cost among activities is difficult.
It can be stated that the objectives of accounting, according to FADN and IFRS, are not identical. Concerning assets, according to FADN, only operational resources are considered whereas according to IFRS the total assets of an enterprise (for example including financial assets) are to be indicated in the financial statement.
The requirements of FADN regulations are realised in different ways in the Member States. Data delivery in the Member States for FADN purposes is not totally harmonised. For example: FADN requires a valuation of agricultural land at net selling prices. Some countries follow this requirement while other countries value agricultural land different from these FADN specifications. These countries often distinguish between purchased land and other land.
In FADN the valuation of quotas and delivery rights in the Member States is entirely different. This different treatment is comprehensible thanks to the very heterogeneous national rules.
The valuation of biological assets is also very diverse.
There are other special accounting principles influencing the cost model:
• Taxes and subsidies
• VAT
• Milk quota
• Calendar year/bookkeeping year
• Contract rearing
• Other gainful activities
In order to understand why recording of data varies from Member State to Member State we should make enquire about the historical background, the taxation system, the subsidies and the VAT system of the given country. All this information influences the availability and the recording of data. There are heterogeneous national rules for milk quota, taxes and subsidies.
Regarding to depreciation in many cases IFRS also allows the application of replacement value even if there is no active market. The accounting of subsidies and milk quota is different from the principles of IFRS. According to IFRS subsidies on investments have no effects on farm results.
43

Direct EU payments are separated from complementary national payments, while decoupled payments are registered under one heading in the farm return. In this way the connection of subsidies to production and products is very difficult.
The problem of contract rearing also should be mentioned. The model should separate farms with receipts from contract rearing and also consider national distinctions regarding to recording of contract rearing.
In spite of the trend towards increased specialisation, most farms still have more than one enterprise. The distribution of common costs like depreciation among activities is difficult.
The conditions in the Member States vary especially regarding activities other than agricultural activities on the holding. This means that harmonisation in the area of “Other income on the holding” is difficult. The inclusion of ”Other gainful activity” varies from Member State to Member State. Member States decide in different ways whether a holding which has other gainful activity should be included in FADN or not. Regarding the cost of production model the most important problem is that the cost items cover various activities and there are no data showing the division of the costs. And due to the different interpretation of other gainful activities it is difficult to determine whether a cost connects to an agricultural or non-agricultural activity.
FADN is a highly EU harmonised survey. Much time and effort is spent in the Member States and at the EC in order to produce comparable and reliable information for agricultural activities. Despite the high level of harmonisation there are several differences concerning FADN data collection and the interpretation of FADN regulation which are very important to keep in mind while constructing the cost of production model.
44
References
RICA Homepage (http://ec.europa.eu/agriculture/rica/index_en.cfm)
COMMISSION REGULATION (EC) No 868/2008)
FADN Farm Return RI/CC 1256 http://circa.europa.eu/Public/irc/agri/rica/library?l=/fadn_committees/ricc/ricc_1256_2008pdf/_EN_1.0_&a=d
Definition of variables used in FADN standard results RI/CC 882. http://circa.europa.eu/Public/irc/agri/rica/library?l=/fadn_committees/ricc/definitions_variables_1/_EN_1.0_&a=d
Jürgen Zeddies et al. (2005) Comparison of the accounting standards used in FADN with the International Accounting Standards. Innovation und Bildung Hohenheim GmbH
Ann-Marie Karlsson et al. (2006): Feasibility study on collection of off-farm income data and data on other income. Commission document. Final report. Contract reference NO AGRI-2005-401
Commission Document RI/CC 1503 Report on 2008 Selection Plans and Progress
Commission Document RI/CC 1519 Implementation New Typology
Claudia Kirchner (2000) The Farm Accountancy Data Network of the European Union – Commitment or Opportunity for Hungary? Humboldt-University of Berlin
Ildikó Csajbók (2008) Specific evaluation methods in FADN University of Debrecen
European Commission (2001). Analysis of the situation of agricultural holdings. FADN. http://europa.eu.int/comm/agriculture/rica. Online. 26. March 2002.
45

Annex
Annex 1: The field of observation and economic size thresholds applied by the Member States
Farms FSS Member State
Total Field FADN
Economic size thresholds applied by the Commission (in ESU) 2007
Belgium 51540 34730 16 Bulgaria 534610 118070 1 Czech Republic 42250 14370 4 Denmark 48270 36670 8 Germany 389880 251710 16 Ireland 132670 115700 2 Estonia 27750 6730 2 Greece 833590 534080 2 Spain 1079420 827740 2 France 567140 398520 8 Italy 1728530 748410 4 Cyprus 45170 29900 2 Latvia 128670 19200 2 Lithuania 252950 52390 2 Luxembourg 2450 1840 8 Hungary 714790 95930 2 Malta 11070 1400 8 The Netherlands 81830 62990 16 Austria 170640 75950 8 Poland 2476470 757670 2 Portugal 323920 142450 2 Romania 4256150 1235970 1 Slovenia 77170 39860 2 Slovakia 68490 3220 8 Finland 70620 44740 8 Sweden 75810 28910 8 United Kingdom 286750 94070 16
Source: DG Agri EU FADN
46

Annex 2: The procedures for determining the selection rate and sample size chosen for each stratum
Member State Procedures used for the selection rate and sample size
Optimal allocation Belgium Proportional allocation Bulgaria Optimal allocation (Neyman-Tschuprow) Cyprus Proportional allocation
Optimal allocation (Neyman-Tschuprow) Czech Republic Proportional allocation Denmark Optimal allocation Germany Optimal allocation
Normal distribution over each stratum (Proportional allocation) ? Greece Minimum variance allocation - Optimal allocation? Spain Proportional allocation Optimal allocation (Neyman-Tschuprow) Estonia Proportional allocation Fact-Sheet not delivered until 29/05/2008 France
Hungary Optimal allocation (Neyman-Tschuprow) Ireland Statistical sampling optimisation program - Optimal allocation? Italy Optimal allocation (Neyman-Tschuprow)
Optimal allocation (Neyman-Tschuprow) Lithuania Proportional allocation Luxembourg Optimal allocation (Neyman-Tschuprow) and proportional allocation
Optimal allocation (Neyman-Tschuprow) Latvia Proportional allocation Malta
Optimal allocation The Netherlands Proportional allocation Optimal allocation Austria Proportional allocation
Poland Optimal allocation (Neyman-Tschuprow) Portugal Square root method in each region sub-sample
Optimal allocation (Neyman-Tschuprow) Romania Proportional allocation Optimal allocation (Neyman-Tschuprow) Finland Proportional allocation
Sweden Optimal allocation Slovakia Optimal and proportional allocation Slovenia Proportional allocation
The United Kingdom England and Wales A basic common reliability criterion? Northern Ireland Proportional allocation Scotland Proportional allocation
Source: DG Agri EU Fadn
47

Annex 3: The procedures for selecting the sample farms
Member State Procedures for selection of returning holdings
Belgium Partial replacement of farms – mix of random and non-random selection Bulgaria Non-random selection
? Cyprus Czech Republic Non-random selection Denmark Mix of panel and random selection Germany Non-random selection Greece Mix of panel and random selection Spain Non-random selection Estonia Random selection France Non-random selection
Practical selection done by accountancy offices based on their local contacts. Non-random selection. Hungary
Ireland Random selection Italy Random selection (with constant sub-sample and partial replacement of farms) Lithuania Mix of non-random selection and random selection Luxembourg Random selection Latvia Random selection Malta Non-random selection The Netherlands Random selection Austria Random selection Poland Random selection Portugal Non-random selection Romania Mix of panel and random selection Finland Random selection Sweden Random selection Slovakia Random selection
Non-random selection? Slovenia The United Kingdom England and Wales Constant sub-sample and partial replacement of farms randomly selected Northern Ireland Non-random selection Scotland Non-random selection Source: DG Agri EU FADN
48
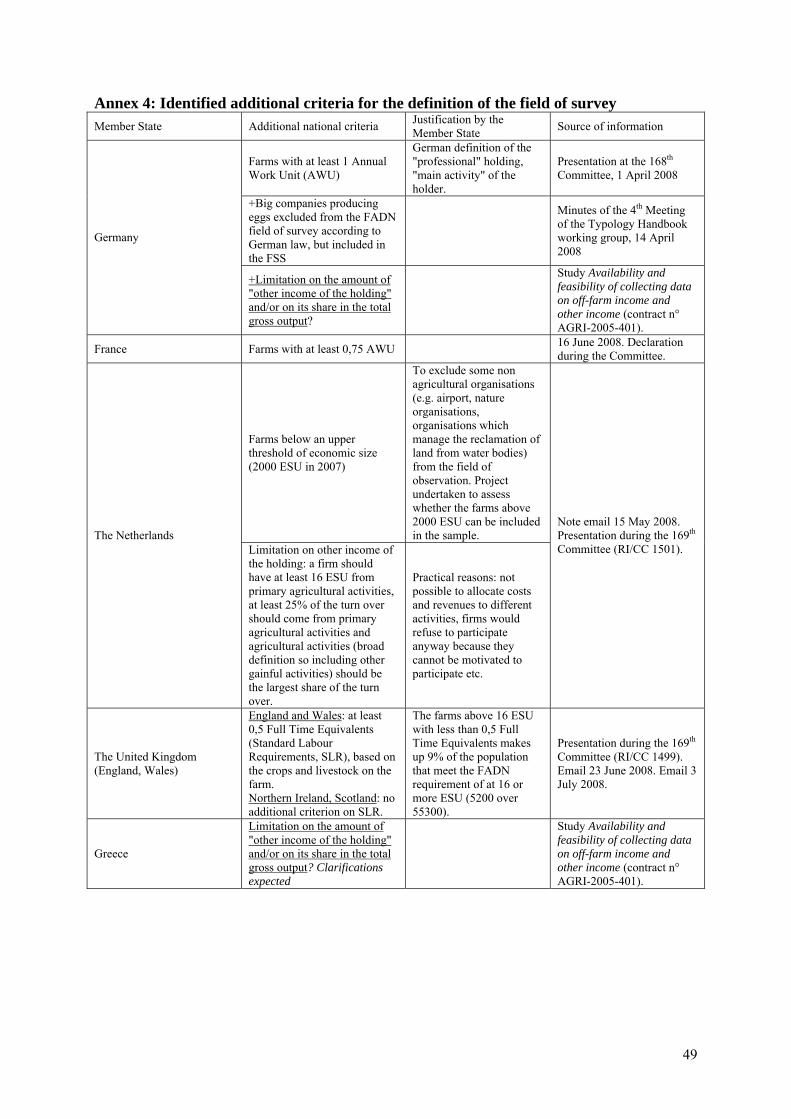
Annex 4: Identified additional criteria for the definition of the field of survey Justification by the Member State Member State Additional national criteria Source of information
German definition of the "professional" holding, "main activity" of the holder.
Farms with at least 1 Annual Work Unit (AWU)
Presentation at the 168th Committee, 1 April 2008
+Big companies producing eggs excluded from the FADN field of survey according to German law, but included in the FSS
Minutes of the 4th Meeting of the Typology Handbook working group, 14 April 2008
Germany
Study Availability and feasibility of collecting data on off-farm income and other income (contract n° AGRI-2005-401).
+Limitation on the amount of "other income of the holding" and/or on its share in the total gross output?
16 June 2008. Declaration during the Committee. France Farms with at least 0,75 AWU
To exclude some non agricultural organisations (e.g. airport, nature organisations, organisations which manage the reclamation of land from water bodies) from the field of observation. Project undertaken to assess whether the farms above 2000 ESU can be included in the sample.
Farms below an upper threshold of economic size (2000 ESU in 2007)
Note email 15 May 2008. Presentation during the 169thThe Netherlands Committee (RI/CC 1501). Limitation on other income of
the holding: a firm should have at least 16 ESU from primary agricultural activities, at least 25% of the turn over should come from primary agricultural activities and agricultural activities (broad definition so including other gainful activities) should be the largest share of the turn over.
Practical reasons: not possible to allocate costs and revenues to different activities, firms would refuse to participate anyway because they cannot be motivated to participate etc.
The farms above 16 ESU with less than 0,5 Full Time Equivalents makes up 9% of the population that meet the FADN requirement of at 16 or more ESU (5200 over 55300).
England and Wales: at least 0,5 Full Time Equivalents (Standard Labour Requirements, SLR), based on the crops and livestock on the farm.
Presentation during the 169th Committee (RI/CC 1499). Email 23 June 2008. Email 3 July 2008.
The United Kingdom (England, Wales)
Northern Ireland, Scotland: no additional criterion on SLR.
Study Availability and feasibility of collecting data on off-farm income and other income (contract n° AGRI-2005-401).
Limitation on the amount of "other income of the holding"
Greece and/or on its share in the total gross output? Clarifications expected
49

Annex 4/B: Identified additional criteria for the definition of the field of survey Additional national criteria for the stratification of the field of survey Source of
information Justification by the Member State Member State Used for
the selection
Used for the national weighting
Nature
Organic/non-organic farms X X Agriculture/Horticulture X X Type of business (full-time/part-time business) X X
Farmer's age classes X X Regions (different from EU FADN regions) X X
Precautions taken that "the additional national criteria used for making the Danish sample are not adding to possible biases of the sample, but rather reducing the bias concerning the criteria involved."
Email 14 May 2008 Denmark
Utilised agricultural area classes X X
Impact analysis does not show great differences with sample stratified with ESU/SGM (but impact of the use of minimum 0,5 Full Time Equivalents).
England, Wales: Standard Labour Requirements classes (SLR)
X X Northern Ireland: no SLR. Scotland: no used for selection but SLR bands used for analyses.
England, Wales: separate sample for organic farms. Northern Ireland, Scotland: no separate sample for organic farms.
X X
The extra number of organic farms is an addition to the normal number required for FADN. Proportion of organic farms submitted is small.
Presentation during the 169th Committee (RI/CC 1499). Email 23 June 2008. Email 3 July 2008.
The United Kingdom
England, Wales, Northern Ireland: separate sample for LFA/ non LFA livestock farms.
Impact analysis does not show great differences with hypothetical stratification without LFA criteria.
X X Scotland: the variable LFA/ non LFA not used in the sample selection. Sub-types of farming including organic/non-organic sub-types of farming
X X Discrepancies between EU and National FADN goals. Solution proposed by the Netherlands: "Using all available information from the selection procedure to overcome this problem is a better solution."
Note email 15 May 2008. Presentation during the 169
The Netherlands Economic size classes different by
sub-types of farming and therefore different within some types of farming.
th Committee (RI/CC 1501).
X X
Email 25 June 2008 Greece Less favoured areas classes X X
Presentation to PACIOLI workshop 2007. Emails 2 July 2008, 14 July 2008.
VGE classes wrongly used for stratification for the accounting year 2008. It will be corrected from 2009 onwards.
Use of three classes of "VGE" (4-15 Belgium (Flanders) VGE, 15-26VGE, 26-100 VGE), 1 X X
VGE = 5755€.
2008 Selection plan fact-sheet Hungary Legal form of the enterprise (legal
person yes or no) X
The criterion is only for defining the weights, not for the selection plan, thus there is no
50

Additional national criteria for the stratification of the field of survey Source of
information Justification by the Member State Member State Used for
the selection
Used for the national weighting
Nature
consequence for the sample.
Email 19 June 2008 Lithuania Legal form of the enterprise (family
farms and companies) X
The criterion is only for defining the weights, not for the selection plan, thus there is no consequence for the sample.
Source: DG Agri EU Fadn
51
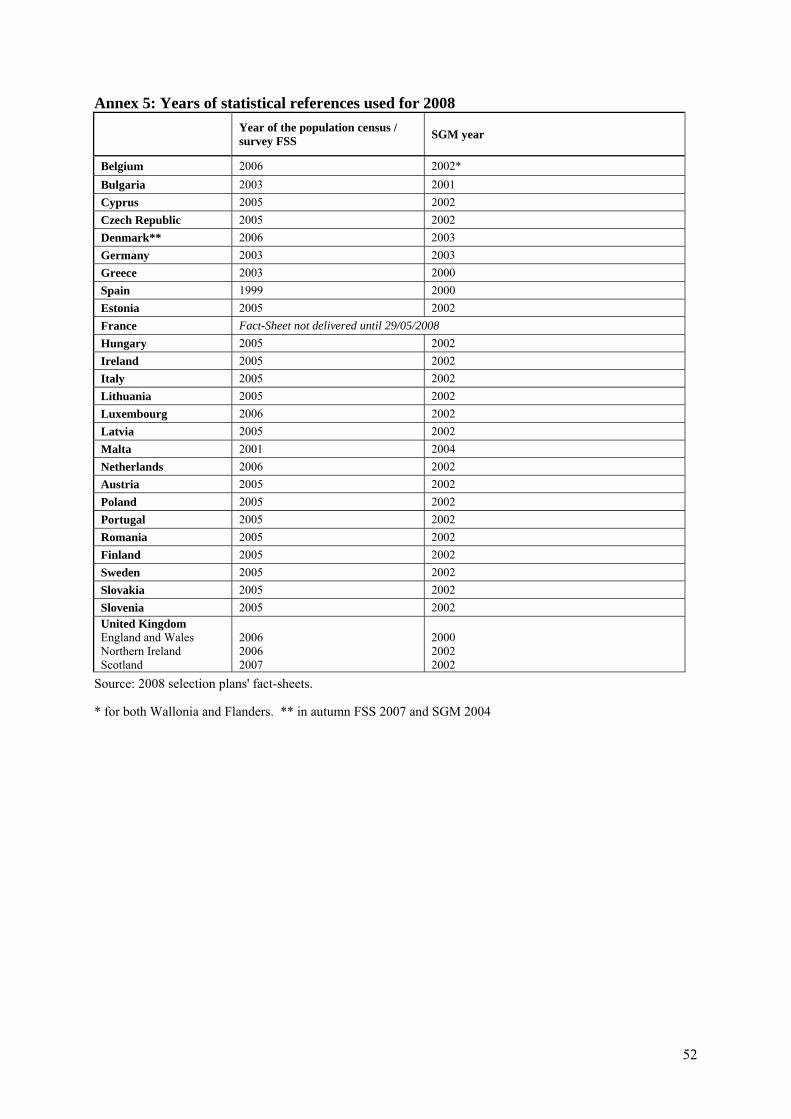
Annex 5: Years of statistical references used for 2008 Year of the population census / survey FSS SGM year
2006 2002* Belgium 2003 2001 Bulgaria 2005 2002 Cyprus 2005 2002 Czech Republic 2006 2003 Denmark** 2003 2003 Germany 2003 2000 Greece 1999 2000 Spain 2005 2002 Estonia Fact-Sheet not delivered until 29/05/2008 France 2005 2002 Hungary 2005 2002 Ireland 2005 2002 Italy 2005 2002 Lithuania 2006 2002 Luxembourg 2005 2002 Latvia 2001 2004 Malta 2006 2002 Netherlands 2005 2002 Austria 2005 2002 Poland 2005 2002 Portugal 2005 2002 Romania 2005 2002 Finland 2005 2002 Sweden 2005 2002 Slovakia 2005 2002 Slovenia United Kingdom
England and Wales 2006 2000 Northern Ireland 2006 2002 Scotland 2007 2002
Source: 2008 selection plans' fact-sheets.
* for both Wallonia and Flanders. ** in autumn FSS 2007 and SGM 2004
52

Annex 6: Representativeness of 2005 data in terms of SGM 2005
Threshold (ESU) (A)
Theoretical coverage (B)
Actual coverage (C)
Difference (practice)-(theory) (D)
16 97% 97% 0% Belgium 1 97% 94% -3% Cyprus 4 98% 104% 6% Czech Republic 8 98% 98% -1% Denmark 8 98% 94% -3% Germany 2 95% 96% 2% Greece 2 99% 84% -15% Spain 2 Estonia 87% 80% -7% 8 98% 94% -4% France 2 Hungary 86% 82% -4% 2 99% 93% -6% Ireland 4 93% 95% 2% Italy 2 Lithuania 68% 66% -2% 8 98% 96% -2% Luxembourg 2 Latvia 73% 78% 5% 8 Malta 63% 58% -6% 16 98% 103% 5% The Netherlands 8 91% 89% -2% Austria 2 Poland 89% 93% 4% 2 92% 79% -13% Portugal 8 94% 101% 7% Finland 8 92% 109% 17% Sweden 6* 92% 89% -3% Slovakia 2 Slovenia 88% 80% -9% 16** 95% 101% 6% The United Kingdom 95% 94% -1% UE-25 1*** n.a. n.a. 83% Bulgaria 1*** n.a. n.a. 76% Romania
Sources: FADN 2005, FSS 2005.
*The Slovak 2004-2005 threshold was 6 ESU, but the calculation has been done with 8 ESU, threshold from 2007 onwards (6 ESU not available). **Threshold 16 was used for whole United Kingdom (threshold 8 ESU for Northern Ireland was not considered). *** 2007 thresholds. n.a.: no data available.
53
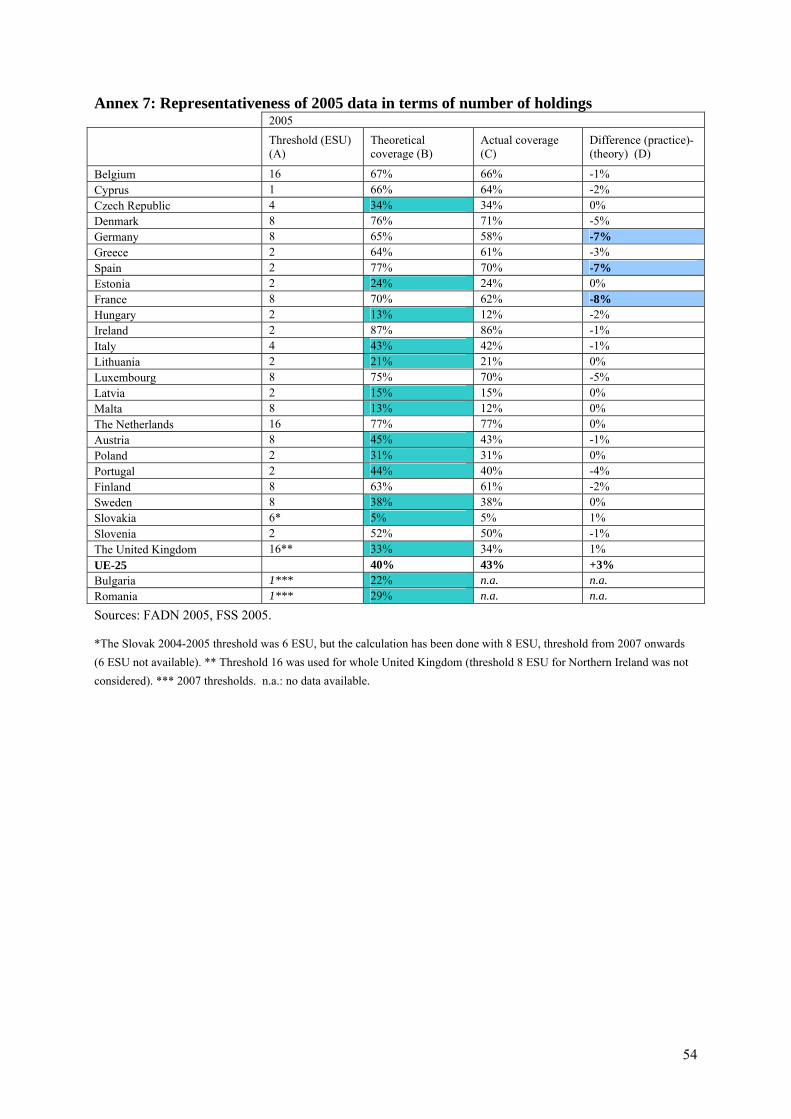
Annex 7: Representativeness of 2005 data in terms of number of holdings 2005
Threshold (ESU) (A)
Theoretical coverage (B)
Actual coverage (C)
Difference (practice)-(theory) (D)
16 67% 66% -1% Belgium 1 66% 64% -2% Cyprus 4 Czech Republic 34% 34% 0% 8 76% 71% -5% Denmark 8 65% 58% -7% Germany 2 64% 61% -3% Greece 2 77% 70% -7% Spain 2 Estonia 24% 24% 0% 8 70% 62% -8% France 2 Hungary 13% 12% -2% 2 87% 86% -1% Ireland 4 Italy 43% 42% -1% 2 Lithuania 21% 21% 0% 8 75% 70% -5% Luxembourg 2 Latvia 15% 15% 0% 8 Malta 13% 12% 0% 16 77% 77% 0% The Netherlands 8 Austria 45% 43% -1% 2 Poland 31% 31% 0% 2 Portugal 44% 40% -4% 8 63% 61% -2% Finland 8 Sweden 38% 38% 0% 6* Slovakia 5% 5% 1% 2 52% 50% -1% Slovenia 16** The United Kingdom 33% 34% 1% 40% 43% +3% UE-25 1*** n.a. n.a. 22% Bulgaria 1*** n.a. n.a. 29% Romania
Sources: FADN 2005, FSS 2005.
*The Slovak 2004-2005 threshold was 6 ESU, but the calculation has been done with 8 ESU, threshold from 2007 onwards (6 ESU not available). ** Threshold 16 was used for whole United Kingdom (threshold 8 ESU for Northern Ireland was not considered). *** 2007 thresholds. n.a.: no data available.
54
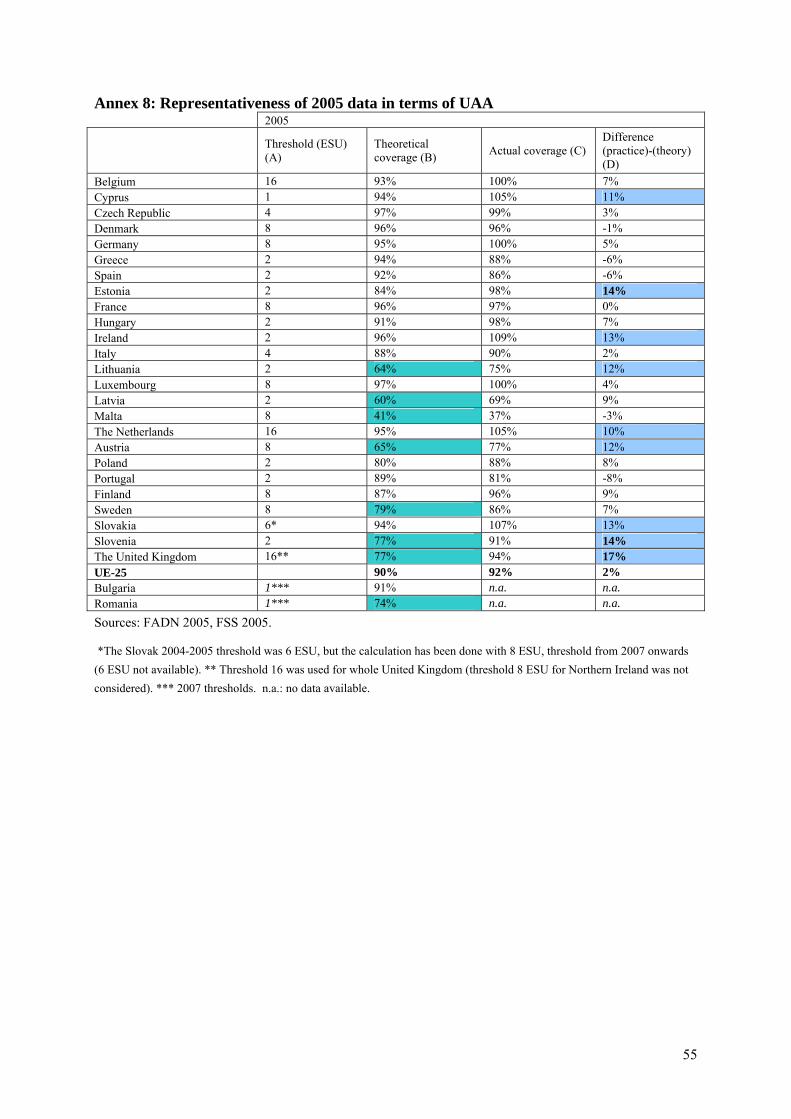
Annex 8: Representativeness of 2005 data in terms of UAA 2005
Difference (practice)-(theory) (D)
Threshold (ESU) (A)
Theoretical coverage (B) Actual coverage (C)
16 93% 100% 7% Belgium 1 94% 105% 11% Cyprus 4 97% 99% 3% Czech Republic 8 96% 96% -1% Denmark 8 95% 100% 5% Germany 2 94% 88% -6% Greece 2 92% 86% -6% Spain 2 84% 98% 14% Estonia 8 96% 97% 0% France 2 91% 98% 7% Hungary 2 96% 109% 13% Ireland 4 88% 90% 2% Italy 2 Lithuania 64% 75% 12% 8 97% 100% 4% Luxembourg 2 Latvia 60% 69% 9% 8 Malta 41% 37% -3% 16 95% 105% 10% The Netherlands 8 Austria 65% 77% 12% 2 80% 88% 8% Poland 2 89% 81% -8% Portugal 8 87% 96% 9% Finland 8 Sweden 79% 86% 7% 6* 94% 107% 13% Slovakia 2 Slovenia 77% 91% 14% 16** The United Kingdom 77% 94% 17% 90% 92% 2% UE-25 1*** n.a. n.a. 91% Bulgaria 1*** n.a. n.a. 74% Romania
Sources: FADN 2005, FSS 2005.
*The Slovak 2004-2005 threshold was 6 ESU, but the calculation has been done with 8 ESU, threshold from 2007 onwards (6 ESU not available). ** Threshold 16 was used for whole United Kingdom (threshold 8 ESU for Northern Ireland was not considered). *** 2007 thresholds. n.a.: no data available.
55

Annex 9: Depreciation: systems and recording in different Member states Table G – Depreciation: systems and recording in different Member States
Belgium Replacement value. Bulgaria
A linear or diminishing method of depreciation can be applied in combination with the holding. In compliance with the national accounting legislation the different types of fixed assets are divided into so-called depreciation classes. Agricultural buildings are divided into two classes, machinery in three classes. A depreciation period (service life) is fixed for each depreciation class. Depreciation rates are given according to the method and depreciation period to each item.
Czech Republic
Denmark For buildings and equipment diminishing balance. The rate of depreciation for buildings varies from 2 % on some arable farms to 8 % for glasshouses. For equipment the rate is usually 12-18 %.
Germany Linear depreciation at replacement value and acquisition value in buildings. Some cases of diminishing balance method. Service life fixed by legal regulations. Linear depreciation at replacement value. Service life for buildings 50 years, machinery 8-12 years, plantations 5-10 years, land improvements 10-30 years, IT equipment 5 years. In case of special need the different number of years of service life can be calculated.
Estonia
Greece Linear depreciation at replacement value. Spain Linear depreciation at replacement value. France Linear depreciation at replacement value. Ireland Replacement value, declining balance (?); 10% for machinery, 5% for building and improvements Italy Replacement value, linear depreciation. Cyprus Linear depreciation at replacement value. Service life is individually estimated for each asset. Latvia
Linear depreciation. Acquisition value. Service life: 8-40 years for farming buildings and 5-10 years for machinery and equipment. The value of fully depreciated assets may be either 1 Litas (usually for old assets) or 10 per cent of acquisition cost (new assets).
Lithuania
Luxembourg Linear depreciation: Depreciation Rate: 5 % for buildings, 8,5 % for installations and equipment, 10 % for machines and 12,5 % for vehicles.
Hungary Linear depreciation at replacement value except for farm buildings, permanent crops and land improvements where it is used the current market price for further calculations.
Malta Linear depreciation at replacement value. Accelerated depreciation system at replacement value. The amount of depreciation is higher during the earlier years of an asset’s life. The replacement value is revalued every year.
Netherlands Three different percentages are applied to obtain the replacement values: one for buildings, one for greenhouses and one for machinery and equipment. The percentages change each year. .Service life is individually estimated for each asset. The deprecation rate differs per type of asset and ranges between 4% for buildings to 25% for certain kinds of equipment. For all fixed assets, the residual value is 10% of the replacement value.
Austria Depreciation at replacement value (?); linear depreciation. Poland Linear depreciation at replacement value. Normative valuation for land and forest. Portugal Linear depreciation at replacement value; according to the RICA legislation and the national fiscal legislation. Romania Slovenia
Linear depreciation at replacement value. Coefficients for obtaining the replacement value come from official statistical sources. Service life for machinery and equipment – 4 or 6 years, Farm buildings and land improvements – 20 years. Permanent crops – 12 years.
Slovakia
Diminishing balance method at replacement value. The rates of depreciations are: Machinery and equipments 18 %, except for tractors 14, 18 or 22 %. The percent depends on the usage of the machine (<400 h/year -> 14%, 400-700 -> 18% and >700 -> 22%), and harvesters 12, 14, 18 % (<75, 75-125 and >125 h/year). Finland
Farm buildings 9 %. Land improvements 5 %. Plantations from 10 to 35 % (depending on the age of the plantation, last year 100 %). Depreciation calculation is done separately for each machine and building.
Sweden Diminishing balance method. Replacement value is used for buildings. Acquisition value for machinery and land equipment. Service life: 45 years for buildings, 15 years for building equipment and 9-15 years for machinery. E&W uses the diminishing balance method for machinery and glasshouses and the linear method for buildings, plantations and fixed equipments. Service life is individually estimated for each asset for machinery, glasshouses and plantations but for most buildings and lands improvements is 10 years.
U.K.
Source: RI/CC 1256 rev. 5
56

57
Annex 10: Quotas systems and recording in different Member States Country National system Belgium Marketable (purchase and lease). Purchase and sale
controlled by the regional central public authorities. Only purchased quotas or quotas acquired together with a holding are valued and depreciated (free quotas are neither valued nor depreciated). Depreciation rates: 8% (15% for single payment rights) in Wallonia, and 7.14% in Vlaanderen for all rights.
Denmark Marketable (purchase and lease). Purchase and sale through central dairy organisation.
Germany Marketable Greece Marketable (purchase and lease). Spain Marketable (purchase and lease). France Quotas are linked to land and not marketable.
Individual quotas can neither be transferred nor let. Ireland Marketable (purchase and lease). Transactions are
through the co-operatives only. Italy The quotas are owned by dairies. Cyprus Cow milk quotas are owned by farmers. There is
also a national reserve provided free of charge to new farmers. Milk quotas are marketable (purchased or leased).
Luxembourg Marketable (purchase and lease). Leasing is linked to land.
Netherlands Marketable (purchase and lease) without link land. Austria Marketable (purchase and lease). Portugal Marketable (purchase and lease) without link to
land. Leasing only for a maximum of 2 campaigns and to another farm having yet an own quota.
Slovakia Slovakia has three types of quotas: milk, sugar and tobacco. Quotas are not owned by the farmers. The quota manager is Agricultural Paying Agency. APA allocates the quotas to farmers based on their application form.
Finland Marketable (purchase and lease). Sweden Marketable; purchase and lease only with land U.K. Marketable (purchase and lease)
Source: RI/CC 1256 rev. 5


59
Annex 11: The beginning and the end of accounting year by Member States 2007 2008 2009
OCT NOV DEC JAN FEB MAR APR MAY JUN JUL AUG SEP OCT NOV DEC JAN FEB MAR APR MAY JUN
Belgium OCT NOV DEC JAN FEB MAR APR MAY JUN JUL AUG SEP OCT NOV DEC JAN FEB MAR APR MAY JUN
Bulgaria OCT NOV DEC JAN FEB MAR APR MAY JUN JUL AUG SEP OCT NOV DEC JAN FEB MAR APR MAY JUN
Czech Republic OCT NOV DEC JAN FEB MAR APR MAY JUN JUL AUG SEP OCT NOV DEC JAN FEB MAR APR MAY JUN
Denmark OCT NOV DEC JAN FEB MAR APR MAY JUN JUL AUG SEP OCT NOV DEC JAN FEB MAR APR MAY JUN
Germany (*) (Specialist horticulture) OCT NOV DEC JAN FEB MAR APR MAY JUN JUL AUG SEP OCT NOV DEC JAN FEB MAR APR MAY JUN
Germany (*) OCT NOV DEC JAN FEB MAR APR MAY JUN JUL AUG SEP OCT NOV DEC JAN FEB MAR APR MAY JUN
Germany (*) (Specialist horticulture) OCT NOV DEC JAN FEB MAR APR MAY JUN JUL AUG SEP OCT NOV DEC JAN FEB MAR APR MAY JUN
Ireland OCT NOV DEC JAN FEB MAR APR MAY JUN JUL AUG SEP OCT NOV DEC JAN FEB MAR APR MAY JUN
Estonia OCT NOV DEC JAN FEB MAR APR MAY JUN JUL AUG SEP OCT NOV DEC JAN FEB MAR APR MAY JUN
Greece OCT NOV DEC JAN FEB MAR APR MAY JUN JUL AUG SEP OCT NOV DEC JAN FEB MAR APR MAY JUN
Spain (*) OCT NOV DEC JAN FEB MAR APR MAY JUN JUL AUG SEP OCT NOV DEC JAN FEB MAR APR MAY JUN
France( OCT NOV DEC JAN FEB MAR APR MAY JUN JUL AUG SEP OCT NOV DEC JAN FEB MAR APR MAY JUN
Italy OCT NOV DEC JAN FEB MAR APR MAY JUN JUL AUG SEP OCT NOV DEC JAN FEB MAR APR MAY JUN
Cyprus OCT NOV DEC JAN FEB MAR APR MAY JUN JUL AUG SEP OCT NOV DEC JAN FEB MAR APR MAY JUN
Latvia OCT NOV DEC JAN FEB MAR APR MAY JUN JUL AUG SEP OCT NOV DEC JAN FEB MAR APR MAY JUN
Lithuania OCT NOV DEC JAN FEB MAR APR MAY JUN JUL AUG SEP OCT NOV DEC JAN FEB MAR APR MAY JUN
Luxembourg OCT NOV DEC JAN FEB MAR APR MAY JUN JUL AUG SEP OCT NOV DEC JAN FEB MAR APR MAY JUN
Hungary OCT NOV DEC JAN FEB MAR APR MAY JUN JUL AUG SEP OCT NOV DEC JAN FEB MAR APR MAY JUN
Malta (*) OCT NOV DEC JAN FEB MAR APR MAY JUN JUL AUG SEP OCT NOV DEC JAN FEB MAR APR MAY JUN
The Netherlands (*) OCT NOV DEC JAN FEB MAR APR MAY JUN JUL AUG SEP OCT NOV DEC JAN FEB MAR APR MAY JUN
Austria OCT NOV DEC JAN FEB MAR APR MAY JUN JUL AUG SEP OCT NOV DEC JAN FEB MAR APR MAY JUN
Poland OCT NOV DEC JAN FEB MAR APR MAY JUN JUL AUG SEP OCT NOV DEC JAN FEB MAR APR MAY JUN
Portugal OCT NOV DEC JAN FEB MAR APR MAY JUN JUL AUG SEP OCT NOV DEC JAN FEB MAR APR MAY JUN
Romania OCT NOV DEC JAN FEB MAR APR MAY JUN JUL AUG SEP OCT NOV DEC JAN FEB MAR APR MAY JUN
Slovenia OCT NOV DEC JAN FEB MAR APR MAY JUN JUL AUG SEP OCT NOV DEC JAN FEB MAR APR MAY JUN
Slovakia OCT NOV DEC JAN FEB MAR APR MAY JUN JUL AUG SEP OCT NOV DEC JAN FEB MAR APR MAY JUN
Finland OCT NOV DEC JAN FEB MAR APR MAY JUN JUL AUG SEP OCT NOV DEC JAN FEB MAR APR MAY JUN
Sweden OCT NOV DEC JAN FEB MAR APR MAY JUN JUL AUG SEP OCT NOV DEC JAN FEB MAR APR MAY JUN
United Kingdom OCT NOV DEC JAN FEB MAR APR MAY JUN JUL AUG SEP OCT NOV DEC JAN FEB MAR APR MAY JUN
OCT NOV DEC JAN FEB MAR APR MAY JUN JUL AUG SEP OCT NOV DEC JAN FEB MAR APR MAY JUN
Source: DG Agri EU FADN
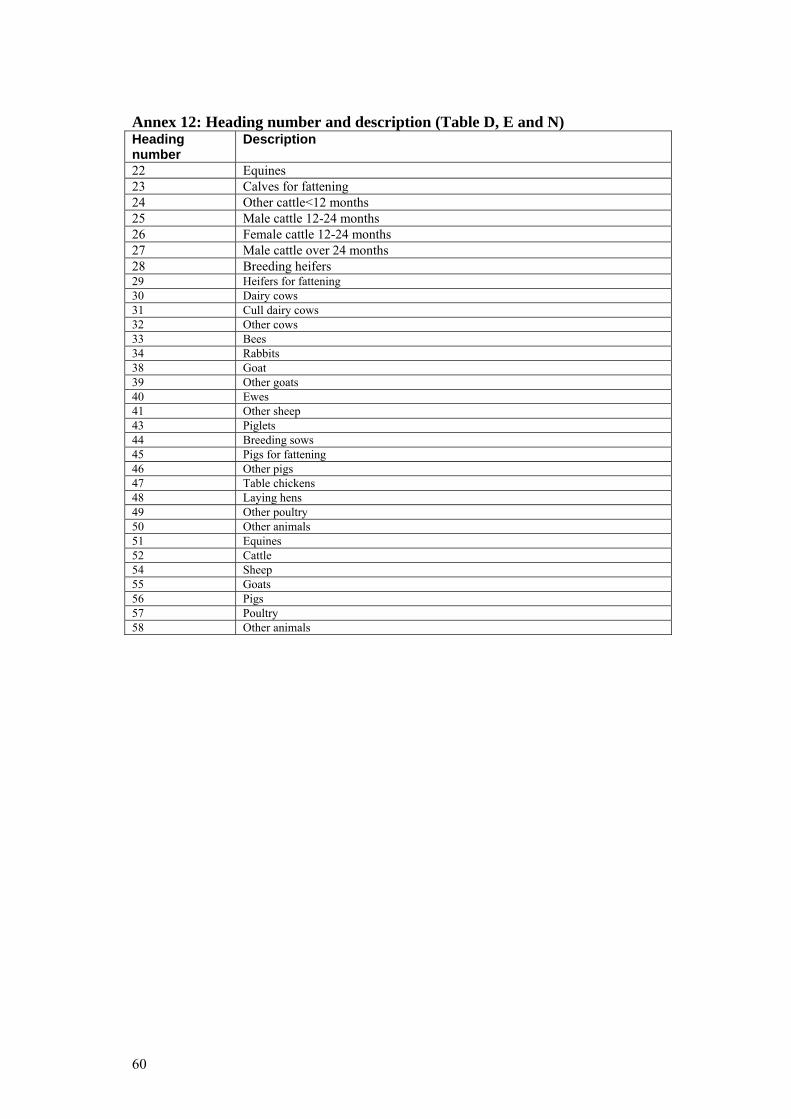
Annex 12: Heading number and description (Table D, E and N) Heading number
Description
22 Equines 23 Calves for fattening 24 Other cattle<12 months 25 Male cattle 12-24 months 26 Female cattle 12-24 months 27 Male cattle over 24 months 28 Breeding heifers 29 Heifers for fattening 30 Dairy cows 31 Cull dairy cows 32 Other cows 33 Bees 34 Rabbits 38 Goat 39 Other goats 40 Ewes 41 Other sheep 43 Piglets 44 Breeding sows 45 Pigs for fattening 46 Other pigs 47 Table chickens 48 Laying hens 49 Other poultry 50 Other animals 51 Equines 52 Cattle 54 Sheep 55 Goats 56 Pigs 57 Poultry 58 Other animals
60


Farm Accountancy Cost Estimation andPolicy Analysis of European Agriculture www.ekon.slu.se/facepa