factors influencing speed and sprint performance...estimation of mechanical cost during sprint races...
TRANSCRIPT

Factors Influencing Speed and
Sprint Performance
Elio Locatelli

Consiglio Federale
Presidente Alfio Giomi
Direttore Tecnico Giovanile e
Sviluppo Stefano Baldini
Direttore Tecnico Alto Livello (“AEC”)*
Elio Locatelli
Assistente D.T.G. e Sviluppo Antonio Andreozzi
Capitano Squadre Giovanili
Gabriella Dorio
SALTI Advisor – Mazzaufo
Advisor – Giannini Tutor – Del Forno Tutor – Lazzarin Tutor – Paolino
Tutor – Pilori
MEZZOFONDO Advisor – Ghidini
Advisor – Cito Tutor – Endrizzi Tutor – Gigliotti
VELOCITA’ Advisor – Di Mulo
Assistente – Frinolli
Assistente – Pisani Tutor – Cosso
Tutor – Biagetti
OSTACOLI Advisor – Tozzi
Tutor – Mori Tutor – Morandi
LANCI Advisor – Vizzoni
Advisor – Coslovich
Tutor – Angius Tutor – Roverato
PROVE MULTIPLE Advisor – Camellini Tutor – Andreatta
MARCIA Advisor – Gandellini
Tutor – Sala
Referente
Fiduciari Tecnici Regionali
Stefano Ruggeri
Assistente Alto Livello
Roberto Pericoli
SSTS** Velocità / Ostacoli
Filippo Di Mulo Collaboratori
Giorgio Frinolli Riccardo Pisani
SSTS** Mezzofondo Gianni Ghidini
SSTS** Fondo e Marcia Antonio La Torre
CONSULTANTS
Tecnici Personali (“AEC”)*
Medico Federale Andrea Billi
Segretario Generale Fabio Pagliara
Capo Area Tecnica
Riccardo Ingallina
* Atleti Elite Club ** Squadra di Supporto Tecnico Scientifico
Modello Tecnico Federale 2017-2020
Responsabile Tecnico Corsa in Montagna, Trail e
Ultradistanze Paolo Germanetto

Definition
• In sport, Speed is the ability to react to a stimulus or signal in the shortest possible time, and to perform cyclyc and/or acyclic movements at the highest tempo at various levels of resistance.
• Speed becomes mesurable by specifying velocity as the ratio of distance covered and unit of time: V= s/t

Estimation of mechanical cost during sprint races
• Example of 100m
The total energetic cost(E tot) of an athlete in100m, run at a constant velocity, without wind and at sea level, can be measured, following Prof. Di Prampero, additioning the following parametres :
- The cost to win the air resistance,(Ca)
- The non-aerodynamic cost
- The cost for accelerating the athlete mass

Estimation of the metabolic cost in 100 metres
• We can estimate the total métabolic cost « C » by measuring:
- the glycolytic energie
- the phosphagenes energie
- the cinetic of the utilisation oxygene

Bioenergetic models of the muscles work in sprint
Energetic Sources How it works the uptake process
Time of the uptake process
Max utilisation time of the process
Max time of utilization at
maximum speed
Anaerobic Alactic
reaction by CPK + MK, ATP of the
muscles 0 Up to 20" Up to 3-4"
Anaerobic Lactic Glycolisis with
lactate production Starting from 4" from 30“ to 5'-6' From 30" to 40"
Aerobic oxygen / glycogen Krèbs Cycle Not for sprint From 40” to20'

• Bioenergetic Model
-Green= glycolysis
- Red= ATP/CP
- Jellow= aerobic

Factors influencing sprint performance
• Reaction Time
• Explosive strength and Power
• Muscle Stiffness
• Technique
• Efficiency of the anaerobic system
Practically, these factors, (excluding reaction time) are those that influence the length and the frequency of the strides; the athlete shall try to optimize these two parameters to improve his/her performance.

Sprint Performance
• Sprint performance:
- Is determined by the length and frequency of the strides. To increase the speed of a subject is necessary to increase one or both parameters.
- Practically the coach should build an individual optimal model for each athlete, taking into consideration his/her neuromuscular capacities and his/her anthropometric data.
- To modify one or both the above parameters the sprint training should include special exercises which can affect them (C. Vittori 1982).

Measuring Speed
• Average Speed= S/T; Measured in m/sm.
Example: 100m in 10” = 10m/s, that means 36 km/hour
(10s x 3600s divided 10mx100m)
• Average Frequency = number of strides done in a certain time; is measured in hertz.
Example: 100m in 9.58s with 41 strides; frequency = 41 : 9.58 = 4,28 hertz.
• Average Length: to obtain it we should divide the race distance by the number of strides measured in cm
Example: 41strides in 100m. = 243,9cm

Fastest performances
• The faster race:
- 4x100m (JAM) 36.84s = 39.08km/hour
• The top flying speed measured:
- Usain Bolt in Berlin: in the100m final, he
covered the space between 60 and 80m
in 1.61s that means 44.72km/hour

SPRINT MODELS
• Usain Bolt: 100m 9.58 41.0 strides
• Tim Montgomery: 100m 9.78 49.1 strides
• Frankie Frederiks: 100m 9.87 46.2 strides
• Asafa Powell: 100m 9.74 43.5 strides
• Ekaterini Thanou : 100m 10.82 53.0 strides
• Marlene Ottey (1): 100m 10.85 46.3 strides
• Marlene Ottey (2): 100m 10.74 46.9 strides
• Florence Griffith: 100m 10.54 47.6 strides
• N.B. -Marlene Ottey, after 1 year of specific exercises, did 10.74 with 46.9 strides (Milano: 1996).

Special Exercises Affecting Stride Lenght
• Strength exercises with overloads to improve explosive strength (quadricep extensors)
• Strength exercises with light overloads: tight belts or heavy shoes (for the leg flexors)
• Long alternated bounces over 100m, recording time and number of bounces.
• Skipping exercises with and without ankle weight (200/250 gr.); 200 contacts.
• 30 – 60m sprints with ankle weights (150 gr.)
• 100 runs with longer strides, recording time and number of strides.

Special Exercises Affecting Stride Frequency
• Strength exercises for reactive strength (Plyometric)
• Pacing exercises forfeet reativity
• Verical two legs jumps over hurdles (different heights)
• Fast skipping with low knees over 30m (calculating the rate)
• Kick-back run over 50 contacts, recording the time
• Skipping exercises with weighted belt (4 – 5 kg) over 50 contacts, recording the time
• Sprint over 30m with harness (time difference about: 0.6s)
• Sprint runs with weighted belt over 60 – 80m
• Fast circular short strides over 60m, recording time and number of srides

• Maximal speed (hand time and N. of strides)
6’’ 30 28,5 (N. strides)
Shorter strides Longer strides
6’’43 30,5 6’’41 27,5
6’’70 35,2 6’’72 25,7
6’’94 38,0 6’’89 25,0
Relations between running time and stride lenghts in 60m

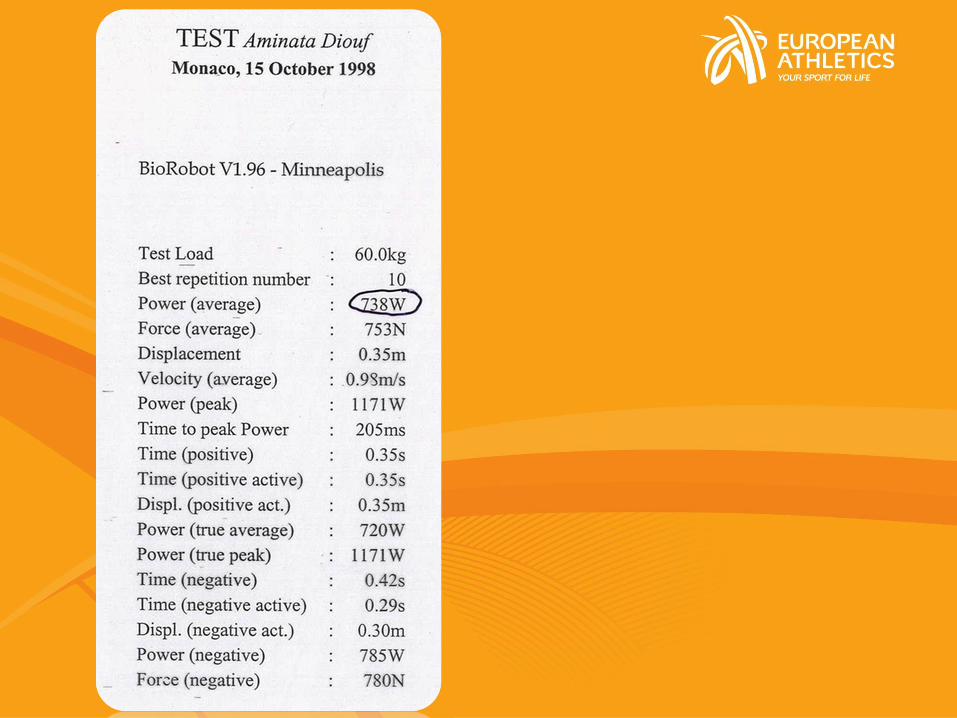
BOSCO TEST
Using Bosco apparatus and Biorobot

BOSCO TEST
Data So Scm ∆
So /Scm Sbw ∆ F/V
REACTIVITY
h ct Watt
EVANGELISTI G. 27/1/8
4 52.6 57.6 5.0 23.6 0.448 70.5 155 89.2
CAMPUS M. 30/5/9
4 47.9 55.2 7.3 20.4 0.425 61.8 124 98.7
BUTTIGLIONE D. 15/5/9
4 48.1 54.8 6.7 22.9 0.476 63.5 159 78.4
MAY F. 15/5/9
4 44.2 51.1 6.9 17.6 0.398 55.8 154 71.1
CAPRIOTTI A. 15/5/9
4 42.9 46.1 3.2 16.8 0.392 52.0 159 64.2

Middle / Long Distances and Walking

Aerobic Test • Aerobic Test: (K4)
a) Energetic Cost (running at 13Km/h)
(in mmol. O²/ml/kg):
- Carabelli G. 0,193
- Galletti L. 0,183
- Pirovano W. 0,229
b) VO²max:
- Carabelli: 60ml/kg/min
- Galletti: 56ml/kg/min
- Pirovano: 64 ml/kg/min
c) MAV (Km/h)
- Carabelli: 17,9
- Galletti: 17,6
- Pirovano: 18,2

Aerobic Test (using K4)

Anaerobic Test
• Anaerobic Tests:
a) Measurement of lactic acid after speed endurance
training: different sets of 60m runs.
b) After a 100 or 200 or 400m in competition.
Data collected after a 400m indoor:
- Aimar (47.15) 25.10 mmol. (après 6’)
- Grossi (47.55) 20.70 mmol. (après 8’)
- Nuti (46.59) 23.11 mmol. (après 4’)

Lactic Acid level after a series of 60m runs
• The athletes were asked to run four different sets of 60m at 95% of max
- 2x60m with 1’30’’ recovery
4’ pause
- 3x60m with 1’30’’ recovery
4’pause
- 4x60m with 1’30’’ recovery
4’ PAUSE
- 5x60m with 1’30’’ recovery


Standards for Aerobic Endurance Capacity
General Endurance Evaluation (Men)
• 2,5 - 3,5 m/sec normal [untrained]
• 3,5 - 4,0 m/sec low endurance level
• 4,0 - 4,7 m/sec medium endurance level
• 4,8 - 5,2 m/sec high endurance level
• 5,3 - 5,6 m/sec TOP ATHLETE
Hollmann, W.

ZERSENAY TADESE / ERI (21.03.2010)
20 KM / 55:21
• 6.0 M/SEC
FLORENCE KIPLAGAT / KEN (16.02.2014)
20 km / 61:56
• 5.4 M / SEC

distance ATP / CRPH
%
anaerobic-lac
%
aerobic
%
30 m 80 19 1
60 m 55 43 2
100 m 25 70 5
200 m 15 60 25
400 m 12 43 45
800 m 10 30 60
1500 m 8 20 72
3000 m 5 15 80
5000 m 4 10 86
10000 m 3-2 12-8 85-90
marathon 0 5-2 95-98
Share of energy supply mechanism
during different track and field events
MADER / HARTMANN):

Event Specific Standards for General Endurance
(At END of General Phase)
Event Standard Threshold MALE
(m/s)
Standard Threshold FEMALE
(m/s)
800m 4.7 – 5.1 4.5 – 4.9
1500m 5.0 – 5.4 4.8 – 5.2
5000m 5.1 – 5.6 4.9 – 5.4
10000m/ 42.195m >5.4 >5.2
Lange & Pohlitz 1985
Updated 2014

Performance profile & special topics in the 20 km Men

20km men World Championship: Rome to Osaka
ROME
1987
TOKYO
1991
GOTEBORG
1995
ATHENS
1997
SEVILLE
1999
EDMONTON
2001
PARIS
2003
HELSINKY
2005
OSAKA
2007
1 1.20.45 1.19.37 1.19.59 1.21.43 1.23.34 1.20.31 1.17.21 1.18.35 1.22.20
2 1.21.07 1.19.46 1.20.23 1.21.53 1.24.19 1.20.33 1.18.00 1.19.36 1.22.40
3 1.21.24 1.20.22 1.20.48 1.22.01 1.24.31 1.20.36 1.18.07 1.19.44 1.22.41
4 1.21.53 1.20.29 1.21.28 1.22.57 1.24.43 1.20.55 1.18.14 1.20.00 1.23.36
5 1.22.53 1.20.29 1.21.39 1.23.03 1.24.51 1.21.09 1.19.35 1.20.19 1.23.39
6 1.23.01 1.20.52 1.22.16 1.23.10 1.25.15 1.22.05 1.19.40 1.20.25 1.23.42
7 1.23.38 1.21.01 1.22.21 1.23.14 1.25.26 1.22.11 1.19.46 1.20.34 1.23.52
8 1.23.42 1.21.15 1.22.30 1.23.33 1.25.33 1.22.20 1.20.14 1.20.45 1.24.10
9 1.23.51 1.21.22 1.23.24 1.23.49 1.25.54 1.22.42 1.20.15 1.21.01 1.24.35
10 1.24.14 1.21.32 1.23.34 1.23.53 1.26.00 1.23.14 1.20.24 1.21.43 1.24.39
1987-
2007
0.01.35
0.01.33
0.01.17
0.01.43
0.00.46
0.00.41
0.00.14
0.00.28
0.00.44
0.00.25
1-
10 0.03.29 0.01.55 0.03.35 0.02.10 0.02.26 0.02.43 0.03.03 0.03.08 0.02.19
01:14:53
01:16:19
01:17:46
01:19:12
01:20:38
01:22:05
01:23:31
01:24:58
01:26:24
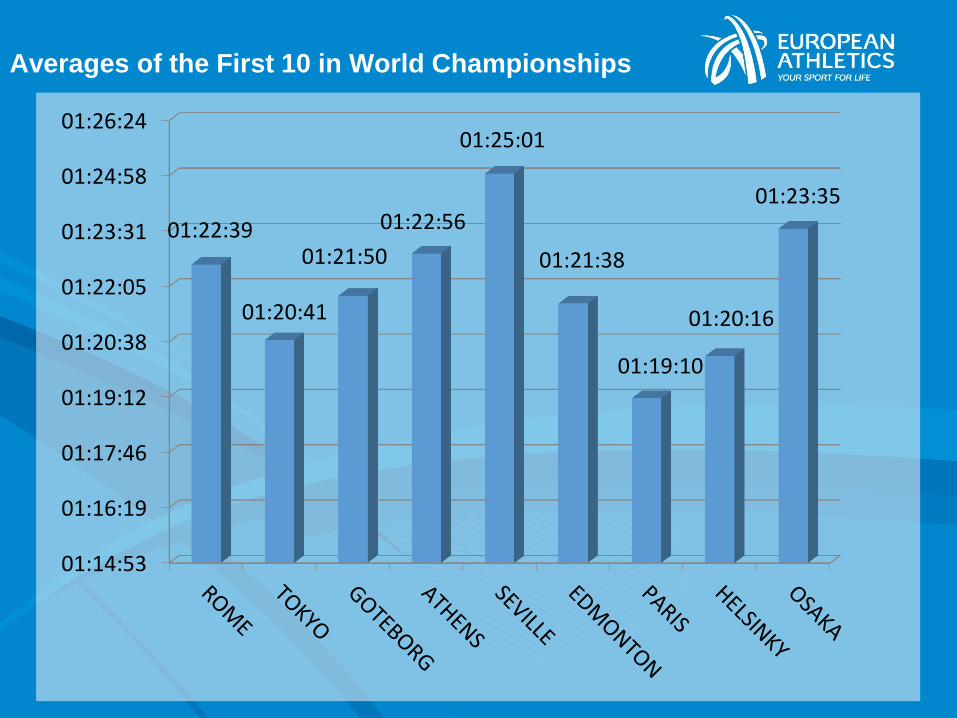
01:22:39
01:20:41
01:21:50
01:22:56
01:25:01
01:21:38
01:19:10
01:20:16
01:23:35
Averages of the First 10 in World Championships

01:12:00
01:13:26
01:14:53
01:16:19
01:17:46
01:19:12
01:20:38
01:22:05
01:23:31
01:24:58
01:26:24
01:19:37 01:19:59
01:21:43
01:23:34
01:20:31
01:17:21
01:18:35
01:22:20
01:21:15
01:22:30
01:23:33
01:25:33
01:22:20
01:20:14 01:20:45
01:24:10
Relationship of 1st to 8th in World
Championships

20km men Olympic Games: Seoul to Beijing
SEOUL
1988
BARCELONA
1992
ATLANTA
1996
SYDNEY
2000
ATHENS
2004
BEIJING
2008
1 1.19.57 1.21.45 1.20.07 1.18.59 1.19.40 1.19.01
2 1.20.00 1.22.25 1.20.16 1.19.01 1.19.45 1.19.15
3 1.20.14 1.23.11 1.20.23 1.19.27 1.20.02 1.19.42
4 1.20.34 1.23.39 1.20.31 1.20.18 1.20.38 1.19.47
5 1.20.43 1.24.06 1.20.41 1.20.25 1.20.55 1.19.51
6 1.20.47 1.25.16 1.20.47 1.20.57 1.21.40 1.19.57
7 1.20.53 1.25.35 1.21.09 1.21.01 1.21.53 1.20.32
8 1.21.14 1.26.08 1.21.13 1.21.13 1.21.56 1.20.36
9 1.21.16 1.26.23 1.21.16 1.21.14 1.22.08 1.20.59
10 1.21.29 1.26.38 1.21.56 1.21.34 1.23.33 1.21.17
1988-
2008
0.00.56
0.00.45
0.00.32
0.00.47
0.00.52
0.00.50
0.00.21
0.00.38
0.00.17
0.00.12
1-10 0.01.32 0.04.53 0.01.49 0.02.35 0.03.53 0.02.16

01:17:46
01:18:29
01:19:12
01:19:55
01:20:38
01:21:22
01:22:05
01:22:48
01:23:31
01:24:14
01:24:58
SEOUL BARCELONA ATLANTA SYDNEY ATHENS BEIJING
01:20:43
01:24:31
01:20:50 01:20:25
01:21:13
01:20:06
Averages of the First 10 in
Olymipic Games

01:14:53
01:16:19
01:17:46
01:19:12
01:20:38
01:22:05
01:23:31
01:24:58
01:26:24
SEOUL BARCELONA ATLANTA SYDNEY ATHENS BEIJING
01:19:57
01:21:45
01:20:07
01:18:59
01:19:40
01:19:01
01:21:14
01:26:08
01:21:13 01:21:13
01:21:56
01:20:36
Relationship of 1st to 8th in
Olympic Games

01:14:53
01:16:19
01:17:46
01:19:12
01:20:38
01:22:05
01:23:31
01:24:58
01:26:24
01:22:39
01:20:43
01:20:41
01:24:31
01:21:50
01:20:50
01:22:56
01:25:01
01:20:25
01:21:38
01:19:10
01:21:13
01:20:16
01:23:35
01:20:06
Average of First 10 in World
Championships and Olympic Games

All-Time Performances
(updated as at 16/08/2008)
1.16.43 Sergey Morozov
1.16.53 Vladimir Kanaykin
1.17.16 Vladimir Kanaykin
1.17.21 Jefferson Pérez
1.17.22 Francisco Javier Fernández
1.17.23 Vladimir Stankin
1.17.33 Nathan Deakes
1.17.36 Vladimir Kanaykin
1.17.41 Hongjun Zhu
1.17.46 Julio René Martínez

01:22:39
01:20:43
01:20:41
01:24:31
01:21:50
01:20:50
01:22:56
01:25:01
01:20:25
01:21:38
01:19:10
01:21:13
01:20:16
01:23:35
01:20:06
01:17:21
01:13:26
01:14:53
01:16:19
01:17:46
01:19:12
01:20:38
01:22:05
01:23:31
01:24:58
01:26:24
MEANS W.C. & O.G.
Comparison of the averages of the first 10 performances all-time vs
World Championship and Olympic Games

Biomechanics in the Race Walking events

Race walking is the agonistic expression
of the brisk, or better, fast walking:
• From a biomechanics view, it’s a complex
movement;
• It’s fixed by the strictly observance of rules;
• A correct race walking technique permits to
improve the performance.

Race Walking is a technical discipline:
• Learning of a correct race walking technique is a
fundamental prerequisite to develop and to get top-
level performance;
• A correct race walking technique permits to integrate
physiological aspects with energy cost (economy
race walking).
Why is necessary a correct
race walking technique ?

Technique Violations
• Loss of contact “Race Walking is a progression of steps so taken
that the walker makes contact with the ground, so
that no visible (to the human eye) loss of contact
occurs”.
- IAAF Handbook [Rule 230]
• Bent knee “The advancing leg shall be straightened (i.e. not
bent at the knee) from the moment of first contact
with the ground until the vertical upright position”.
- IAAF Handbook [Rule 230]

Inefficient Technique
Inefficient technique depends on:
• Poor neuromuscular coordination;
• Dominance of muscular districts causes inefficacy;
• Inadequate flexibility.
reflect unfavorable biomechanics

Race Walking Sequence
Double
Support Single
Support
Double
Support
Single
Support

Race Walking Sequence
Double
Support Single
Support
Double
Support
Single
Support

Double support phase
Double
Support Double
Support

Double Support Phase

Take Home Message (1)
• Continuous contact with the ground;
• Double contact clearly visible (to the human eye);
• Support leg should be straightened from the moment of the
first contact with the ground until the vertical upright position;
• Emphasize the push off phase;
• Grazing step;
• Right stride (correlated to the anthropometry of the athlete,
his/her speed, his/her technical “maturity”);
• Harmonious movements of arms, shoulder and trunk;

Take Home Message (2)
• Rotations of the hips;
• Upright trunk;
• Relaxed head position;
• The advancing leg makes contact with the ground not too far
from the perpendicular projection of the centre of gravity;
• Progressive foot approaching to the ground;
• Complete push-off.