factors influencing research outputs in kenya: …
TRANSCRIPT

i
FACTORS INFLUENCING RESEARCH OUTPUTS IN KENYA: THE CASE OF SELECTED
PUBLIC UNIVERSITIES
BY
ADOYO CLARIS AWUOR
A Research Project Report Submitted in Partial Fulfillment of the Requirements for the Award
of the Degree of Master of Arts in Project Planning and Management of the University of
Nairobi
2015
ii
DECLARATION
This research report is my original work and has not been presented for any award in any other
University.
Signature------------------------------- Date---------------------------------------------------------------
Adoyo Claris Awuor
REG. No. L50/82433/2012
This research report has been submitted for examination with our approval as University Supervisors.
Signature-----------------------------------------Date-------------------------------------------------------
Dr. Onditi Kodhiambo Maurice
Lecturer, Department of Pharmacy
Kenyatta University
Signature-----------------------------------------Date-------------------------------------------------------
Dr. Charles Wafula
Lecturer, Centre for Open and Distance Learning
University of Nairobi

iii
DEDICATION
This research report is dedicated to my mother, Mrs. Elsa Auma Adoyo who taught me that with hard
work and patience, I can achieve anything in the world.

iv
ACKNOWLEDGEMENTS
I thank my Supervisors, Dr. Onditi Kodhiambo and Dr. Charles Wafula for their guidance through the
research study right from the identification of the topic to the compilation of the final report. His
invaluable suggestions and contributions helped me to improve this research report. I also thank my
Lecturers at the University of Nairobi including Prof. Harriet Kidombo, Prof. Christopher Gakuu and
Professor Pokaryal for their instruction in the different disciplines that enabled me to have the
foundation necessary to write this research report.
I thank the National Commission for Science, Technology and Innovation both for availing
information and mentorship to be able to effectively carry out this research study. Special thanks go to
Prof. Shaukat Abdulrazak and Dr. Moses Rugutt who are my mentors and for time off to attend my
classes. I am also grateful to Mr. David Ngigi, Team Leader of the Research Endowment Fund
division who provided research material for the study. Special thanks also to my workmates who
provided moral support and encouragement to move on when the journey got too hard.
I am grateful to my family; my brothers Frederick Otieno and Collins Omondi for their encouragement
and great support while I was studying. I also thank my sister Jackline Amondi for her great insight
and advice. I am also indebted to the encouragement from my friends; Serah Ogama, Beth Kathuo,
Florence Mbula, Ruth Wangari, Peninah Akinyi, Collins Obiero, Kennedy Otieno, Beatrice
Gachambi, Loyce Koros and Patricia Mbogo, who were there to spur me on and followed up to make
sure that I completed this research report. I thank you for the moral support and your understanding.
Last but not least, I thank God the source of all wisdom and power for seeing me through my studies
and throughout the writing of this research report.

v
TABLE OF CONTENTS Page
DECLARATION........................................................................................................................... ii
DEDICATION.............................................................................................................................. iii
ACKNOWLEDGEMENTS ........................................................................................................ iv
TABLE OF CONTENTS ............................................................................................................. v
LIST OF FIGURES ................................................................................................................... viii
LIST OF TABLES ..................................................................................................................... viii
ABBREVIATIONS AND ACRONYMS ..................................................................................... x
ABSTRACT .................................................................................................................................. xi
CHAPTER ONE: INTRODUCTION ......................................................................................... 1
1.1 Background of the Study .................................................................................................. 1
1.2 Statement of the Problem ................................................................................................. 4
1.3 Purpose of the Study ........................................................................................................ 6
1.4 Objectives of the Study .................................................................................................... 6
1.5 Research Questions .......................................................................................................... 6
1.6 Significance of the Study ................................................................................................. 6
1.7 Assumptions of the Study ................................................................................................ 7
1.8 Limitations of the Study ................................................................................................... 7
1.9 Delimitations of the Study................................................................................................ 7
1.10 Definitions of Significant Terms used in the Study ......................................................... 7
1.11 Organization of the Study ................................................................................................ 8
CHAPTER TWO: LITERATURE REVIEW .......................................................................... 10
2.1 Introduction .................................................................................................................... 10
2.2 University Research Outputs .......................................................................................... 10
2.3 Research Funding and Research Outputs ...................................................................... 11
2.4 University Researcher Characteristics and Research Outputs ....................................... 13

vi
2.5 Industrial Involvement and Research Outputs ............................................................... 14
2.6 Institutional Administrative Structures and Research Outputs ...................................... 16
2.7 Theoretical Framework ................................................................................................... 17
2.8 Conceptual Framework ................................................................................................... 19
2.9 Knowledge Gap .............................................................................................................. 20
CHAPTER THREE: RESEARCH METHODOLOGY ......................................................... 21
3.1 Introduction .................................................................................................................... 21
3.2 Research Design ............................................................................................................. 21
3.3 Target population ........................................................................................................... 21
3.4 Sampling size and Sampling Procedure ......................................................................... 21
3.4.1 Sample size ............................................................................................................. 21
3.4.2 Sampling Procedure ................................................................................................ 22
3.5 Data Collection Instruments ........................................................................................... 23
3.5.1 Pilot testing of the Research Instruments................................................................ 23
3.5.2 Validity of Research Instruments............................................................................ 23
3.5.3 Reliability of Research Instrument ......................................................................... 24
3.6 Data Collection Procedure ............................................................................................. 24
3.7 Data Analysis Techniques .............................................................................................. 25
3.8 Ethical Considerations.................................................................................................... 25
3.9 Operationalization of Variables ..................................................................................... 26
CHAPTER FOUR: DATA ANALYSIS, PRESENTATION, INTERPRETATION AND
DISCUSSION ....................................................................................................................... 27
4.1 Introduction .................................................................................................................... 27
4.2 Questionnaire return rate ................................................................................................ 27
4.3 Demographic Characteristics of the Respondents .......................................................... 27
4.4 Research Outputs of Selected Universities in Kenya ..................................................... 27
4.5 Measure of Commercialization ...................................................................................... 29

vii
4.6 Research Funding and Research Outputs ....................................................................... 33
4.7 University Researchers Characteristics .......................................................................... 34
4.8 Industrial Involvement and Research Outputs in Universities ....................................... 36
4.9 Institutional Administrative Structures and Research Outputs ...................................... 38
CHAPTER FIVE: SUMMARY OF THE FINDINGS, CONCLUSIONS AND
RECOMMENDATIONS .................................................................................................... 41
5.1 Introduction .................................................................................................................... 41
5.2 Summary of the Findings ............................................................................................... 41
5.3 Conclusions .................................................................................................................... 43
5.4 Recommendations .......................................................................................................... 44
5.4.1 Suggestions for Further Studies ..................................................................................... 44
REFERENCES ............................................................................................................................ 45
APPENDICES ............................................................................................................................. 52
APPENDIX I: Letter of Transmittal of Data Collection Instrument ........................................... 52
APPENDIX II: Questionnaire....................................................................................................... 53
APPENDIX III: Research Permit ................................................................................................. 60

viii
LIST OF FIGURES
Figure 1: Triple Helix........................................................................................................18
Figure 2: Conceptual Framework......................................................................................19

ix
LIST OF TABLES
Table 3.1: Sampling frame……………………………………………………………………….. 22
Table 3.2: Sample size…………………………………………………………………………..... 22
Table 3.3: Reliability Results………………………………………………………………….... 24
Table 3.4: Operationalization of variables………………………………………………………... 26
Table 4.1: Research Outputs of University in Kenya………..…………………………………… 28
Table 4.2: Level of Commercialization of University Research Results………………………..... 29
Table 4.3: Measure of Commercialization and Highest Degree of Researcher ………………..... 30
Table 4.4: Measure of Commercialization and Age of Researcher ……………………………… 31
Table 4.5: Measure of Commercialization and University of Researcher ……………………….. 32
Table 4.6: Research Funding and Research Outputs……………… ……..………………………. 33
Table 4.7: Coordination of Funding…………………………………………………………………..34
Table 4.8: Previous Experience and Research Outputs……………………………………………….34
Table 4.9: University Researcher Motivation…………………………………………………………35
Table 4.10: Knowledge and Entrepreneurial skills and Research Outputs ………………………… 36
Table 4.11: Researchers who partnered with Industry during their Research ……………………… 36
Table 4.12: University-Industry Linkage and Research Outputs ……………………………………...37
Table 4.13: University Incubation Centres and Research Outputs ……………………………....37
Table 4.14: MoUs between University and Industry……………............................................... 38
Table 4.15: University Policy and Research Outputs…………………………..……………….... 38
Table 4.16: University to establish well managed Technology Transfer Offices……………………...39
Table 4.17:University training and sensitization on IPR and Research Outputs ……………………39

x
ABBREVIATIONS AND ACRONYMS
AAU: Association of African Universities
GCR: Global Competitiveness Report
IP: Intellectual Property
IPR: Intellectual Property Rights
JKUAT: Jomo Kenyatta University of Agriculture and Technology
KBE: Knowledge Based Economies
KIPI: Kenya Intellectual Property Institute
KU: Kenyatta University
M&E: Monitoring and Evaluation
MoU: Memorandum of Understanding
MMUST: Masinde Muliro University of Science and Technology
NACOSTI: National Commission for Science, Technology and Innovation
OECD: Organization for Economic Co-operation and Development
PCT: Patent Cooperation Treaty
R&D: Research and Development
R4D: Research for Development
SPSS: Statistical Package for Social Sciences
ST&I: Science, Technology and Innovation
TTO: Technology Transfer Office
UNECA: United Nations Economic Commission for Africa
UNESCO: United Nations Educational, Scientific and Cultural Organization
UoN: University of Nairobi
USA: United States of America
USPTO: United States Patent Transfer Office
WIPO: World Intellectual Property Organization
xi
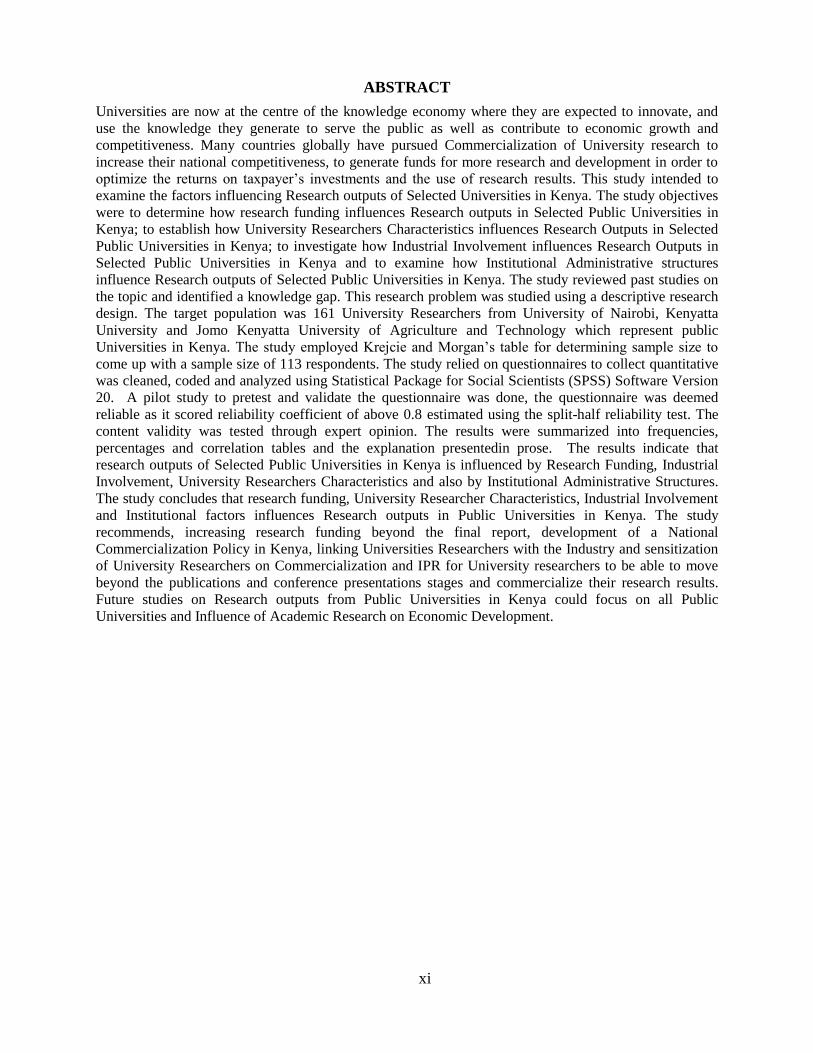
ABSTRACT
Universities are now at the centre of the knowledge economy where they are expected to innovate, and
use the knowledge they generate to serve the public as well as contribute to economic growth and
competitiveness. Many countries globally have pursued Commercialization of University research to
increase their national competitiveness, to generate funds for more research and development in order to
optimize the returns on taxpayer’s investments and the use of research results. This study intended to
examine the factors influencing Research outputs of Selected Universities in Kenya. The study objectives
were to determine how research funding influences Research outputs in Selected Public Universities in
Kenya; to establish how University Researchers Characteristics influences Research Outputs in Selected
Public Universities in Kenya; to investigate how Industrial Involvement influences Research Outputs in
Selected Public Universities in Kenya and to examine how Institutional Administrative structures
influence Research outputs of Selected Public Universities in Kenya. The study reviewed past studies on
the topic and identified a knowledge gap. This research problem was studied using a descriptive research
design. The target population was 161 University Researchers from University of Nairobi, Kenyatta
University and Jomo Kenyatta University of Agriculture and Technology which represent public
Universities in Kenya. The study employed Krejcie and Morgan’s table for determining sample size to
come up with a sample size of 113 respondents. The study relied on questionnaires to collect quantitative
was cleaned, coded and analyzed using Statistical Package for Social Scientists (SPSS) Software Version
20. A pilot study to pretest and validate the questionnaire was done, the questionnaire was deemed
reliable as it scored reliability coefficient of above 0.8 estimated using the split-half reliability test. The
content validity was tested through expert opinion. The results were summarized into frequencies,
percentages and correlation tables and the explanation presentedin prose. The results indicate that
research outputs of Selected Public Universities in Kenya is influenced by Research Funding, Industrial
Involvement, University Researchers Characteristics and also by Institutional Administrative Structures.
The study concludes that research funding, University Researcher Characteristics, Industrial Involvement
and Institutional factors influences Research outputs in Public Universities in Kenya. The study
recommends, increasing research funding beyond the final report, development of a National
Commercialization Policy in Kenya, linking Universities Researchers with the Industry and sensitization
of University Researchers on Commercialization and IPR for University researchers to be able to move
beyond the publications and conference presentations stages and commercialize their research results.
Future studies on Research outputs from Public Universities in Kenya could focus on all Public
Universities and Influence of Academic Research on Economic Development.

1
CHAPTER ONE
INTRODUCTION
1.1 Background of the Study
Many countries have encouraged University to generate outputs from their research efforts to
increase their national competitiveness, to generate funds for more research and development in
order to optimize the returns on taxpayer’s investments and the use of research.
In Australia, Researchers are often rewarded based on their rate of publication and success in
achieving research grants. The Australian Government has designed programmes to improve
links with the Universities and some Universities have established Commercialization units
which enable their researchers to commercialize their research results and facilitate technology
transfer to the industry (Collier & Gray, 2010). The Australian Government also recognizes that
support arrangements and educating researchers on Commercialization goes a long way to assist
individual researchers to commercialize their own research. University commercialization offices
have also played an important role in bridging the gap between innovation and progression, once
a major weakness in the Australian innovation system.
The USA highly supports and effectively finances commercialization of University research
results; the country has a high technology entrepreneurship financing system, more technology
orientated early stage venture capitalists and business angels. The Bayh-Dole Act of 1980 has
been regarded as one of the most influential legislation which stimulates commercialization of
University research. Academia-Industry cooperation was a major driver of Universities towards
entrepreneurship largely facilitated by University-Industry collaboration network approach
(Guenther & Wagner, 2008). The Bayh-Dole Act enabled University researchers to gain rights
over any invention they developed while undertaking research funded by their Government. The
Country awards research students encouraging them to be entrepreneurial and actively pursue
commercialization from their research projects (Mowery & Sampat, 2007).

2
The UK Government has established the National Intellectual Property Management Office to
support capacity building in technology transfer and commercialization of Intellectual Property.
Through an IP fund the UK provides financial support to institutions for the statutory protection
and maintenance of intellectual property rights. In Russia, the bulk of University Research and
Development funding is provided by the Government. Through an innovation policy, the Russian
Government introduced incentives to commercialize research results, including reform of legal
framework for Intellectual Property Rights, providing public funds for venture capital, as well as
increasing overall public participation in Research and Development expenditures. The Russian
innovation policy is largely focused on Commercialization of research from higher education
Institutions (Gutierrez & Correa, 2012).
Many Universities in Japan are able to link with the Industry through Government policies that
promote University-Industry collaboration. Through these linkages Japanese Universities are
able to generate outputs from their research results as well as commercialization
(Tantiyaswasdikul, 2013). The country has made huge strides since the late 80s, in exploiting
Intellectual properties through technology licensing and contractual Research and Development
projects with the industry. Many spin-off companies created through seed funding and increased
availability of commercial venture capitalists has enabled many Universities to commercialize
their research results.
University legislation and policies influence University Commercialization practices in New
Zealand. Technology transfer offices have played an important role in educating and promoting
awareness of Intellectual Property processes and requirements among researchers with IP
protection (Collier & Gray, 2010). Identifying potential industry partners and collaborators,
negotiating license agreement, forming start-up companies, funding investors and industry
partners have also been identified as some of the factors that greatly encourage
Commercialization of University research.
The South African Government recognizes that exploitation of Intellectual Property through
Commercialization must be carried out by publicly funded research institutions in order to
achieve a knowledge based economy. A case study by the Association of African Universities
(AAU) on University-Industry linkage in Africa shows that South Africa has the most developed
University-Industry linkages, yet only a few patents are held by the Universities in South Africa.

3
This is because most patents accruing from research commissioned by industry are owned by
industry and also because there are many barriers and risks involved in patents acquisition
(AAU, 2012).
In Nigeria, the management of IPR and the technology transfer are handled by the National
Office for Technology Acquisition and Promotion which has established Intellectual Property
and TTOs in tertiary institutions across the country to assist innovators prepare and file for IPR
(Ogunwusi & Ibrahim, 2014). A legislative and administrative framework as well as incentives
for researchers in Universities to disclose their ideas and inventions through both monetary and
non-monetary mechanisms have been found to be effective towards promoting
commercialization of research results. A case study on University lecturers in Ilorin University in
Nigeria indicate that less than 60% of the academic staff disseminate their research results and
that commercialization takes a back seat with only about 28% of University lecturers developing
research products that can be put into use for societal development, less than 10% of the
University lecturers commercialized the outcomes of their research (Oduwaiye, Onasanya, &
Shehu, 2010). The study concludes that Research thrives in many Universities yet the rate of
commercialization of research results is still low (OECD, 2014).
The National Commission for Science, Technology and Innovation (NACOSTI) formerly known
as the National Council for Science and Technology is mandated to advice, coordinate, promote
and regulate on matters of Science and Technology in Kenya (ST&I Act, 2013). NACOSTI
administers the Research Endowment Fund created by the Ministry of Higher Education, Science
and Technology now known as the Ministry of Education, Science and Technology on behalf of
the Government of Kenya since 2008. The aim of the Fund is to support research and innovation
projects by Kenyans in the country. Through the promotion of research, science and technology
in higher education institutions, it is expected that the learning institutions translate their research
findings into products and services, generate new ideas and adopt innovation to achieve an
innovation-driven economy for Kenya’s prosperity (NACOSTI, 2014). NACOSTI coordinates
the ST&I desks programme in Universities and Research Institutions in the country to enhance
dissemination of research findings and partnerships with institutions. NACOSTI also organizes
fora for dissemination of Research products including an annual Science Week in the month of
May. The Science, Technology and Innovation (ST&I) Act, 2013 advocates for the
commercialization of research outputs through the Kenya National Innovation Agency which is

4
established through the Act, but is yet to be operational. The University Act, 2012 also mandates
Kenyan Universities to advance knowledge through teaching, scholarly research and scientific
investigation and also dissemination of the outcomes of their research work to the public.
Governments and Institutions involved in funding research all over the world are becoming
increasingly keen on the effectiveness of research towards benefiting the society as research
money mainly comes from the taxpayers. Therefore they have focused their efforts on
conducting evaluations and assessing returns on any research efforts they fund (Sutherland,
Goulson, Potts, & Dicks, 2011; Mutz, Bornmann, & Daniel, 2013). The findings from this
research study attempts to establish Research outputs of Selected Public Universities in Kenya.
1.2 Statement of the Problem
Universities are now at the centre of the knowledge economy where they are expected to
innovate, and use the knowledge they generate to serve the public, contribute to economic
growth and competitiveness (Allen, 2012). Research actually shows that University research
plays a great role in contributing to a country’s economic growth; studies done by Salter and
Martin (2001) show that there is a positive correlation between academic research and economic
growth.
Globally, it has been realized that many University research ideas are not taken to the next stage
and are left to gather dust in shelves whilst they would have been used to transform many
economies despite involving huge Government funding. A report compiled by OECD
Directorate for Science, Technology and Industry in 2013 on commercializing public research
shows that very few Universities are engaged in Commercialization of inventions from their
research efforts. In Europe for instance, a region which represents the majority of Universities in
the World, only about 10% of universities account for 85% of the total income generated by
inventions (OECD, 2013). Again, despite Government spending on Research and Development
being the highest (about 90%) in developing countries, R&D Institutions including Universities
have not being able to show outputs that meet the expectations of industry and society needs
(Ukiwoma, Amade, & Moghalu, 2013).

5
Some of the reasons proposed for low rates of Commercialization of University research results
include lack of funding to commercialize, lack of business expertise; low understanding on
commercialization, lack of human-capital to build startup companies when appropriate and lack
of mentoring and educational support for new entrepreneurs (Holy, 2010). Research can only be
beneficial to society if the results can be converted into products and services; in other words,
commercialized (Bornmann, 2013). Concerns have been echoed since 1997 about the importance
of translating publicly funded research to benefit the society in Kenya. A study carried out to
investigate into factors that influence the diffusion and adoption of Inventions from Research
Institutes and Universities in Kenya in 1999 revealed that lack of adequate funding mechanisms,
lack of appropriate institutional arrangements and lack of capabilities to transfer knowledge and
technologies are some of the reasons that inhibit the Commercialization of research results
(Bwisa & Gachui, 1999).
Several studies have been carried out on Research Outputs in Universities in Kenya, they
include; factors affecting research productivity in Public Universities of Kenya, a case of Moi
University (Kendagor, Kosgei, Tuitoek, & Chelangat, 2012); approaches that can increase
Commercialization of University Research in Kenya (Ondimu, 2012); reasons for low
publications of research (Migosi, 2012) and Evaluation of strategies and mobilizing resources for
research and enhancing outputs in Public and Private Universities in Kenya (Mathooko, 2010).
These studies focused on gathering perceptions and views from University top managers
(Migosi, 2012; Kendagor, Kosgei, Tuitoek, & Chelangat, 2012; Mathooko, 2010) on Research
outputs in Universities in Kenya. This research study however gathered perceptions from
University researchers funded by a public Institution in order to determine research outputs from
the research results demonstrate their experience in Commercialization of their Research results
and also gathered their views on how Commercialization of University Research can be
enhanced to benefit the society. Again, University knowledge transfer channels including
patenting and licensing, recruiting graduates’, collaborations in research and publication have
been widely researched on yet commercialization has received little focus, Mowery and Sampat
(2007). Therefore, Rothaermel, Agung, and Jiang, (2007) in their recommendations proposed
further studies in this area as University entrepreneurship is an under-researched yet very
important topic.
6
1.3 Purpose of the Study
The purpose of this study was to examine the factors influencing research outputs in Selected
Public Universities in Kenya.
1.4 Objectives of the Study
The study was guided by the following objectives:
i. To determine how research funding influence Research Outputs in Selected Public
Universities in Kenya
ii. To establish how University Researchers Characteristics influence Research Outputs in
Selected Public Universities in Kenya
iii. To investigate how Industrial involvement influence Research Outputs in Selected Public
Universities in Kenya
iv. To examine how Institutional Administrative Structures influence Research Outputs in
Selected Public Universities in Kenya
1.5 Research Questions
The study answered the following questions:
i. How does Research funding influence Research Outputs in Selected Public Universities
in Kenya?
ii. How do University Researcher Characteristics influence Research Outputs in Selected
Public Universities in Kenya?
iii. How does Industrial Involvement influence Research Outputs in Selected Public
Universities in Kenya?
iv. How do Institutional Administrative Structures influence Research Outputs in Selected
Public Universities in Kenya?
1.6 Significance of the Study
It is hoped that the results from this study will be important to demonstrate the economic value
of University research and why the country needs to continue supporting investments in research
and development as earmarked by the Vision 2030 (GoK, 2013). It is hoped that the results from
this study will form baseline information on the extent of social impact from the Government
support through NACOSTI’s Research Endowment Fund.
It is also hoped that the results from this study will prompt Public Universities in Kenya to
encourage their Researchers to generate outputs from their research efforts and exploit them to

7
benefit the society. It is hoped that the results from this study would also increase the wealth of
knowledge available regarding Commercialization of Universities research in Kenya as they will
be published in Academic Journals.
1.7 Assumptions of the Study
The research study was designed on the premise that NACOSTI would provide information on
the University researchers they funded to enable the research study to be undertaken. It was also
assumed that a research permit would be obtained in good time to facilitate field visit and data
collection. It was also assumed that the respondents would be truthful and give accurate
information to inform the conclusions of the study.
1.8 Limitations of the Study
Many University researchers had moved from the Universities from which they were when they
received the research funding from NACOSTI. The challenge was overcome by crosschecking to
confirm that the data collected from each researcher was from the appropriate University. Some
of the University researchers who agreed to participate in the study travelled in the course of the
field study and this posed a challenge on collection of the research questionnaires. This was
overcome by developing an online survey which enabled them to fill up the questionnaire online
then submit it back.
1.9 Delimitations of the Study
The study only focused on research projects in Public Universities targeting the University of
Nairobi, Kenyatta University and Jomo Kenyatta University of Agriculture and Technology.
JKUAT is a Public university in Kenya situated in Juja, 36 kilometres northeast of Nairobi, along
the Nairobi-Thika Super Highway. The University of Nairobi is situated in Nairobi’s city centre
along the Uhuru Highway while Kenyatta University’s is located in Kahawa, about 20 kilometres
from Nairobi’s city centre.
1.10 Definitions of Significant Terms used in the Study
Research outputs: products from research and includes publications in refereed
journals, conference presentations, policy briefs, text book, patents,
utility model, copy right, industrial design, trademark and business
startup
Research Funding: money disbursed to University researchers to carry out research

8
Researchers Characteristics: University researchers personal drive towards commercialization
Industrial Involvement: refers to University researcher networks with the Industry
Institutional Administrative Structures: established institutional cultures and the kind of
environment that encourages researchers to commercialize their
work, includes University policy, training and sensitization and
technology transfer organizations
Disbursement Process: release of research funds to University researchers
Collaborative Research: joint Research effort between University and Industry
Commercialization: process by which researchers in the University convert their
research results into products that can be promoted for economic
gain both for the researcher and the University too. The products
include, patents, trademarks, utility models, business startups
among others
Publicly funded research: research activity in University funded by central Government or
Government agency or donors
Entrepreneurial University: University that has embraced Commercialization of its research
for economic gain
Research and Development: economic activities concerned with applying results of scientific
research to develop new products or improve existing ones.
Technology Transfer: uptake of technologies developed by University Researchers
by the Industry for economic development
1.11 Organization of the Study
The study is organized from the first Chapter to the last as follows; Chapter one covers
Introduction, background of the study, statement of the problem, purpose of the study, objectives
of the study, basic assumptions of the study, limitations of the study and delimitation of the
study. Chapter two covers literature review; it includes a brief introduction on how the literature
review is laid out, the second section is concerned with Research Funding as one of the factors
influencing Research Outputs in Public Universities in Kenya; the third section focuses on
University Researcher Characteristics; the fourth section looks at Industrial Involvement and
how it influences Research Outputs in Selected Public Universities; the fifth part examines how
Institutional Administrative Structures influence Research Outputs in Selected Public
Universities. Chapter three describes the research methodology used in the research study. It
includes a brief introduction, the research design, target population, sampling procedure,

9
methods of data collection, validity of the data collection instrument, reliability of the data
collection instrument, methods of data analysis, operationalization of variables, ethical issues
considered during the research study and a brief summary at the end.
Chapter four describes data analysis methods employed to summarize the data collected from the
respondents through questionnaire, interpretation and discussion of their meaning as it relates to
the research topic. Chapter five provides a summary of the findings, conclusions and
recommendations of the research study.

10
CHAPTER TWO
LITERATURE REVIEW
2.1 Introduction
The reviewed literature follows the empirical works of five authors per variable. The themes
were developed from the theoretical and empirical works that are relevant to the variables being
studied. The chapter is structured into empirical reviews on dependent and independent variable
and relates the variables with theoretical framework that facilitated the development of a
conceptual framework and knowledge gap.
2.2 University Research Outputs
University education plays an important role in growth and development. This is largely because
of the research carried out in these institutions that is capable of driving economic development
through innovations and new technologies (Bloom, Canning & Chan ,2006).
Dissemination is part of the research process and an important one because it is what makes
research work important and valid (Crosswaite & Curtise, 1994). Research findings can only be
utilized if they are effectively disseminated (a process which must be timely with the researcher
knowing which media to use depending on their end-users). It is also the duty of a researcher to
share knowledge generated from their research to the wider society (Crosswaite & Curtise,
1994). Lack of dissemination creates a gap between research and practice (Wilson, Petticrew,
Calnan, & Nazareth, 2010). Universities have an obligation to disseminate any information
which can benefit society and this includes findings from research they conduct (AAU, 2009;
Kenyan Constitution, 2010; Awuor, 2013). Effective dissemination of research findings also
enables researchers to make their input into policy decisions that can influence behavior of the
target population under study by encouraging them to generate outputs from their research.
University Research is expected to increase the existing stock of knowledge through
publications. Publications may be in form of papers published in refereed journals or Academic
text books. Formal publications include books or book chapter, peer-reviewed journals
monographs preprint. Digital publications include academic repositories, blogs and websites.
The World share of scientific publications in 2008 indicate that Africa had 2% with South Africa
alone accounting for 0.5% of the world’s publications in referred journals.

11
Other regions performed as follows; Asia 30.7%, America 35.3%, and Europe 42.5% (UNESCO,
2010). Publishing positively correlates with commercialization (Trencher, Yarime, McCormick,
Doll, & Kraines, 2013) and permits the fastest and open diffusion of research results.
Copyrights gives authors exclusive rights to reproduce copyright material which can either be
published or unpublished work. Trademarks on the other hand may either be logo, word, slogan
symbol or design that distinguishes a product or service. Patents provide inventors with exclusive
rights for a limited time to prevent anyone from making , using or selling the invention and can
reinforce a competitive advantage. Spin-offs or business start-ups are new companies founded to
exploit intellectual property from Universities (Adams, Graham, Gray, Purcell, & De Fazekas,
2005).
2.3 Research Funding and Research Outputs
Research and Development (R&D) funding is one of the indicators of a country’s economic
position (OECD, 2014). Investments in R&D form the foundation of new knowledge generation
through research which ultimately leads to generation of products and services through applied
research. Research is an expensive venture which constantly requires funding mechanisms and
commercialization leads to alternative income to fund more research activities. An estimated
60% of R&D expenditure in most African countries comes from Governments, donors and
public Institutions as reported by African Union.
There are several reasons attributed to rise in entrepreneurial Universities in the developed world
which include the fact that these countries have increased their venture capital and also adopted
favorable legislation (like the Bayh-Dole Act in the USA) which makes it possible for
Universities to patent their work using public funds, develop incubation centres, build science
parks and University spinoff companies (Rothaermel, Agung, & Jiang, 2007).
Exploitation of publicly funded research by Universities is important to demonstrate and justify
public investment and therefore commitments to commercialize research needs to be prioritized
right from the funding stage (Narayan & Hooper, 2010). This is so much so since about 70% of
Research activities are funded by Governments in developing countries. While it is true that
many Governments are the greatest funders for University research, little or no funds are set

12
aside for Commercialization of the research results. A study carried out in New Zealand
Universities to determine the role of Governments towards encouraging development of
academic research indicate that lack of funding coupled with lack of foresight into
commercialization leads to few academic research moving past the research results (Narayan &
Hooper, 2010).
Some of the reasons in literature given for the need to evaluate basic research include the need
for accountability, effectiveness and efficiency of public money by many Governments all over
the world and importantly, the need for society to understand the role of research towards
economic development (Grant, 2006).
There is an increasing role for Universities in the twenty-first (21st) Century towards wealth
creation and increasing employment opportunities by molding job creators rather than seekers
(WIPO, 2007). The University’s mission is no longer only focused on teaching and research but
is expanded to also include its contribution to the society by promoting economic development
through the knowledge it generates (Yaakub, et al., 2011; AAU report 2012; Bonaccorsi, Daraio,
& Geuna, 2010). Again, the push towards knowledge based economies has reinforced the link
between academics and economic needs putting Universities in a place where they need to
respond more to their environment (Martin, 2012).
Knowledge societies or economies are characterized by their agility in knowledge creation,
dissemination and application to improve the well-being of their societies. Universities have
become the foundation on which knowledge economy is built due to their role in education and
training and innovation systems pillars (Gorasson & Brundenius, 2011). An Innovation system
comprises of Universities, research institutions, industrial sector, think tanks and other
organizations that can tap into the available knowledge, adapt it into local needs and create
solutions to its people (World Bank, 2012). Korea, Malaysia and China top the list of Knowledge
based economies as highlighted by World Bank Knowledge Economy Index (KEI) Rankings in
2012 which focused on 146 countries all over the world. Many African countries however trail
the list (Kefela, 2010).
13
University entrepreneurship is recognized as the third mission of a University, a mission greater
than research and teaching (Allen, 2012). The conversion of research results into products,
services and processes that can be the object of commercial transactions (Downie & Herder,
2007), helps avail benefits of publicly funded research to the public WIPO( 2007); Bloom,
Canning and Chan (2006). Gutierrez and Correa (2012) reiterate the vital role of research in
development, knowledge dissemination and contribution to knowledge and the need for
Universities to bring out more from their research to meet socioeconomic challenges.
Universities constantly churn out new knowledge from the research they undertake and through
human resource as students who graduate from these institutions every year. This is critical to
spur on production processes and innovations leading to increased economic performance
(Power & Malmberg, 2003).
Strong knowledge bases can be exploited to achieve sustained economic growth (Dosi & Nelson,
2013). Universities are uniquely placed to address knowledge gaps in the society, address
challenges facing society and to provide mitigation to ever pressing socioeconomic challenges.
Research benefits come in different forms, economic if they can create products that can be
commercialized to improve the quality of life and also add on existing knowledge.
Commercialization was foreign to many Universities in 1980s yet today many countries have
introduced policies that have given Universities the impetus to come up and market their
research (Students, 2007).
Financial support to University researchers is important to provide them with funds not only to
carry out their research successfully but also to generate outputs and commercialize them.
However, many University Research Results cannot be exploited further due to lack of funds.
The research funding given is not enough to support further development of the research ideas
(Khademi, Ismail, Lee, & Shafaghat, 2015). External funding such as business angels or venture
capital funds are not readily available in many developing countries making them lag behind.
2.4 University Researcher Characteristics and Research Outputs
Researcher motives, expectations and perceptions towards research outputs and economic
benefits through commercialization are very important. Internal factors that may trigger
researchers to commercialize their research results include individual skills, age and career,
industrial experience, social and personal rewards, networks, interests (Ambos, Makela, Julian,

14
& D'Este, 2008). These factors are different from one researcher to another. Intrinsic factors
refers to an internal drive by the researcher, maybe for more money, academic entrepreneurship,
an interest or awareness and is different from one researcher to another (Keerati-angkoon,
Pichyangkura, & Chandrachai, 2012). Researcher personal factors like lack of time, knowledge
of entrepreneurship, and understanding of University IP policies influence their
commercialization tendencies (Amanor-Boadu & Metla, 2008).
Researchers can be motivated in three key ways; recognition among their peers including
promotion, monetary reward, availing resources or funding or through encouragement to
increase their productivity through publications and patents (Goktepe-Hultein, 2008).
Researcher’s motivation towards generating research outputs is key for them to develop
exploitative behavior. To boast their motivation; training by university on importance of
transferring knowledge is a crucial element as well as setting up a reward program for
researchers involved in commercialization. Reputation and recognition has been found to
supersede any financial or economic profits researchers may accrue from the commercialization
process (Goktepe-Hultein, 2008). Lam, (2010) categorizes factors which motivate researchers in
commercializing research outputs into three concepts which she names “ribbon”
(reputational/career rewards); “puzzle” (intrinsic satisfaction) and “gold” (financial rewards).
She concludes that researchers who are entrepreneurial by nature are driven by “puzzle” and
“gold” factors while traditional researchers who cannot link research and business more often are
motivated by “ribbon” factors. Acs, Audretsch, Braunerhjelm, & Carlsson, (2008) proposes that
new knowledge is commercialized; first when the researcher sees the personal benefits of
engaging in commercialization, secondly, if they can identify the commercial value of their
research and thirdly when someone else demonstrates value in their research and invests in the
knowledge.
2.5 Industrial Involvement and Research Outputs
Collaboration between Universities and the Industry is able to harness knowledge generated
through research and use it to drive economic development. Measurable benefits of this
collaboration include funding for Research and Development; source of employment for
graduates leaving Universities; collaborative research; experience and equipment for teaching
and learning but most importantly the ability to offer solutions of many societal challenges
through exploitation of research results. University- Industry linkage is a strategic partnership
that when well coordinated is able to connect the discovery culture of the University to meet with
innovation culture of industry resulting into economic development. It works better when there is

15
a shared vision between the two players and moreover University’s strong leadership is
identified as very important to make this collaboration work (Link & Siegel, 2007).
University-industry partnership is a major concern as pertains to innovation and economic
development yet appropriate incentive mechanisms; organizations form and implications for a
research policy still remain a challenge (D'Este & Patel, 2007). University–industry partnership
enables the University to fulfill its entrepreneurship role, also known as the third mission
(Leisyte, 2011). The term Entrepreneurial University describes Universities that are responsive
to socioeconomic challenges and are important to regional economic development, (Etzkowitz &
Leydesdorff, 2000). Entrepreneurial Universities have been known to pursue and initiate
partnerships with industry. Indicator of University-Industry collaboration is co-publication. This
indicator has been used to study University- Industry partnerships in many countries.
Commercialization is itself an expensive venture requiring huge financial investments not in the
immediate disposal of researchers hence there is need for a strategy for collaboration with
Industry to help take research results into the products level (Yaakub, et al., 2011). University-
industry partnerships are considered as one of the frameworks that can promote
commercialization of research results from higher education institutions (Ondimu, 2012; WIPO,
2007). In the recent past, it is strongly asserted that University linking with Industry,
Government and Civil Society provides them with a more sustainable mission required and
necessary to survive in the new era (Trencher, Yarime, McCormick, Doll, & Kraines, 2013).
For publicly funded research, motivation by creating conducive research environments and
incentives to industry are ways of generating outputs from research and pushing them into the
markets through commercialization (Grimshaw, Eccles, Lavis, Hill, & Squires, 2012).Promoting
collaboration between three co-actors in research that is Government, University and industry is
important towards creating a knowledge based economy and enhancing a country’s development
in the international arena. This partnership is commonly known as triple-helix (Narayan &
Hooper, 2010). This has been extended to include the private sector and venture capitalists in
recent years. Some of the ways through which researchers in industrialized countries have
promoted University-Industry is through incentives that allow them to earn from their ingenuity
including retaining up to 50% from income earned as their research outputs are commercialized
(WIPO, 2007; Nordfors, Sandred, & Wessner, 2003).

16
Universities form strategic partnerships with the industrial sector based on an understanding of
their strengths and areas of expertise for the collaboration to be mutually beneficial (shared
vision). Economic development is linked to the process of translating knowledge into business
ventures which can generate jobs and create wealth. Through their Industrial linkages, many
Universities in industrialized nations also have established enterprises which employ thousands
of people/ wealth creation. The industrial sector in these countries is also very vibrant and most
of them are ready to take up research results from University and commercialize them as is
depicted by some Chinese companies who give up to 40% to fund University Research and
development (WIPO, 2007).
2.6 Institutional factors and Research Outputs
University policies that govern research activity must inspire and encourage researchers to
generate outputs from their research results. University policies must also enable the researchers
to transfer knowledge from their research into goods and services to benefit society (Farsi,
Modarresi, & Zarea, 2011). Universities keen to promote generation of research outputs among
its faculty must pay attention to its research policies and training as this affects researchers.
Friendly legislation like Bahy- Dole Act in the United States of America encouraged Universities
to patent their research findings and later transfer and commercialize them in business played a
great role in commercialization of University research results, (Guenther & Wagner, 2008).
Many of the commercialization efforts in USA have been accredited to the enactment of the
Bahy-Dole Act of 1980 which enabled academic research to be interlinked with industrial needs.
Universities conduct basic research which is important to provide understanding and discovery
necessary for innovation (Science Coalition, 2010). Innovation increasingly plays an important
role in economic growth which has driven Governments in the recent past to demand more from
research and development investments they make (WIPO, 2007). Researchers are encouraged
that as they come up with inventions and innovations, they need to protect them by filing for
patents (WIPO, 2007). Intellectual property as a product of research can promote technology
transfer from University to Industry. IP Policies in Universities must provide rules and guidelines
on IP exploitation. Through patenting, knowledge produced by research in University can
increase economic productivity (Svensson, 2008). Training and sensitization can help University
researchers understand how they can exploit their linkages with the Industry to help them
commercialize their research outputs (Fletcher & Bourne, 2012).
17
Commercialization is posited as a function of University Technology Transfer Offices which
have the responsibility to turn research inputs into products that can be commercialized
(Weckowska, 2010). Technology Transfer Offices link Universities with Industry mainly by
matching what Universities supply with the demand of the business world (Gutierrez & Correa,
2012). While academic researchers may identify entrepreneurial opportunities, in their research
work, exploitation of these opportunities is driven by their collaboration with industry to a large
extent. Technology transfer Offices are important as knowledge brokers between academia and
industry as they provide expertise and management of commercialization process including
technology transfer, patenting, licensing and business start-ups creation (Ambos, Makela, Julian,
& D'Este, 2008). Commercialization is possible through academia industry linkages into
technology transfer mechanism that benefits the two, in one hand the industry accesses research
from academia while on the other hand; academia who develops innovations and technologies
can obtain resources in form of skills and expertise to commercialize their work (Henderson &
Smith, 2002).
2.7 Theoretical Framework
This research study is based on the Triple Helix Theory. The Triple Helix Theory was first put
forward in 1983 by Etzkowitz(1998); Etzkowitz and Leydesdoff (2000). The Theory highlights
the relationship between University, Industry and Governments towards development of
Knowledge societies. The Triple Helix theory (Breznitz & Ram, 2011), has also been referred
to as a model (Etzkowitz, 2003; Etzkowitz & Leydesdorff, 2000; Rieu, 2011) and also as a
concept (Ranga & Etzkowitz, 2013).
The Triple Helix theory advocates for increased interaction between three actors; University,
Industry and Government (Rieu, 2011) which in the case of University- Industry linkage, leads
to changes in culture and values within Universities that drive them towards more
entrepreneurial tendencies (Mowery & Sampat, 2007). In the Triple Helix Theory, the
Government’s role is critical not only as a funder of the Research and Development in
Universities but also as main financier for the technology transfer and commercialization of
products from the funded University Research activities (Rao, Piccaluga, & Meng, 2011) and in
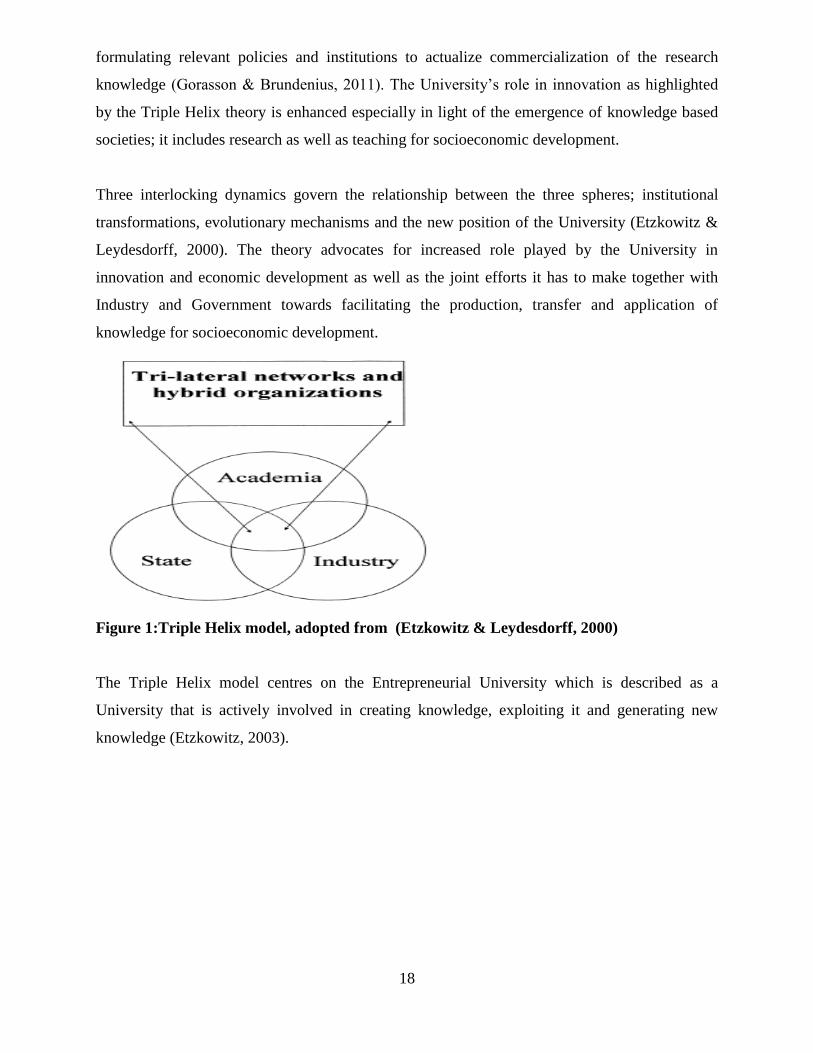
18
formulating relevant policies and institutions to actualize commercialization of the research
knowledge (Gorasson & Brundenius, 2011). The University’s role in innovation as highlighted
by the Triple Helix theory is enhanced especially in light of the emergence of knowledge based
societies; it includes research as well as teaching for socioeconomic development.
Three interlocking dynamics govern the relationship between the three spheres; institutional
transformations, evolutionary mechanisms and the new position of the University (Etzkowitz &
Leydesdorff, 2000). The theory advocates for increased role played by the University in
innovation and economic development as well as the joint efforts it has to make together with
Industry and Government towards facilitating the production, transfer and application of
knowledge for socioeconomic development.
Figure 1:Triple Helix model, adopted from (Etzkowitz & Leydesdorff, 2000)
The Triple Helix model centres on the Entrepreneurial University which is described as a
University that is actively involved in creating knowledge, exploiting it and generating new
knowledge (Etzkowitz, 2003).

19
2.8 Conceptual Framework
Conceptual framework explains the relationship between the interlinked concepts and variables,
matches the set objectives and assists researchers make meaning of their research findings
(Kombo & Tromp, 2009; Smyth, 2004).
---
_
Figure 2: Conceptual Framework
Research Funding
Amount of Funding
Conditions for Funding
Research Outputs
Publications
Conference
Presentations
Textbooks
Utility model
Copyright
Patents
Business
startups
Institutional Administrative
Structures
University Research Policies
Technology Transfer Offices
Training and Sensitization on
IPR
University Researchers
Characteristics
Previous Experience
Motivation
Knowledge on
Commercialization
Industrial Involvement
Collaborative Research
Incubation Centers
MoUs between University
and Industry
Independent Variables
Dependent Variable Government
Policy
Intervening Variable

20
2.9 Knowledge Gap
Chapter Two reviewed literature of the empirical works of authors on the variables under study.
All the authors in the reviewed literature seem to agree that research funding influences Research
outputs in Universities. All the authors also emphasize that University researchers’ motivation
towards commercialization is largely driven by benefits they will accrue. Only (Amanor-Boadu
& Metla, 2008) looks at researcher knowledge and understanding of Commercialization and IP
policies. All the authors seem to agree that University-Industry linkages are important to promote
generation of research outputs and commercialization of University research results. All authors
also seem to agree that University Research policies and Technology Transfer Offices influence
University Researchers to generate research outputs. The literature reviewed however does not
cover the University research projects funded by NACOSTI in Kenya through the Research
Endowment Fund started in 2008. This research study therefore examines the research outputs of
Selected Public Universities in Kenya who were funded under the Research Endowment Fund.

21
CHAPTER THREE
RESEARCH METHODOLOGY
3.1 Introduction
This chapter includes the research design adopted in the study, the target population, sample size and
sample selection method, data collection tools, reliability and validity of the research instruments,
data collection procedure, data analysis techniques and ethical considerations taken into account
when carrying out the research study.
3.2 Research Design
Kombo and Tromp (2009) describe research design as the scheme or plan that is used to generate
answers to research problems. This study employed a descriptive survey research design to describe
the factors influencing research outputs in selected Public Universities in Kenya as factual and
accurately as possible.
3.3 Target population
This refers to the entire group that the researchers wish to study and draw conclusions on (Borg &
Gall, 1996). In this study the target population was 161 University researchers from University of
Nairobi, Kenyatta University and Jomo Kenyatta University who received research funding from
NACOSTI between the years 2008 and 2012.
3.4 Sampling size and Sampling Procedure
This section discusses how the sample size of University Researchers was determined as well as the
sampling procedure.
3.4.1 Sample size
The research study focuses on the research projects in Selected Public Universities. The three
Universities; University of Nairobi, Kenyatta University and Jomo Kenyatta University of
Agriculture and Technology were selected from the other Public Universities in Kenya. The total
number of Researchers from the sampled Universities was 161 as shown in Table 3.1.

22
Table 3.1 Sampling frame
2008/2009 2009/2010 2010/2011 2011/2012 Totals
UoN 13 9 19 22 63
KU 8 5 16 19 48
Maseno 6 6 5 6 23
Egerton 7 5 16 8 36
Moi 7 6 12 5 30
JKUAT 7 7 19 17 50
MMUST 2 4 2 10 18
Source: NACOSTI Annual Reports
3.4.2 Sampling Procedure
The three Universities were considered for the sample because they received the largest share of the
Research Endowment Fund between the years 2008 and 2012 as shown in Table 3.1. The sample
size was determined from the population of University researchers using the Krejcie and Morgan
Table (Krejcie & Morgan, 1970). Calculations were then done to get the proportion of University
researchers included into the sample size as indicated in Table 3.2. The individual University
Researchers were then selected through systematic random sampling where every 3rd
Researcher was
selected from a list of Researchers from each University provided by NACOSTI.
Table 3.2: Sample size
Population size Sample size
UoN 63 44
KU 48 34
JKUAT 50 35
Total 161 113

23
3.5 Data Collection Instruments
This research study used questionnaires as the main tool for data collection (Jackson, 2009). The
questionnaire consisted of open and closed ended questions organized in five sections according to
the variables identified in the research proposal. The first section of the questionnaire had close
ended questions which concentrated on demographic details including age, gender, highest academic
qualification, research experience and institutional affiliation of the University researchers. The
second section of the questionnaire consisted of a set of questions based on Research funding and
how it influences research outputs in Selected Public Universities in Kenya, the third section
consisted of a set of questions based on University Researchers Characteristics and how they
influence Research Outputs in selected Public Universities in Kenya, the fourth section consisted of
a set of questions based on Industrial Involvement and how it influences Research Outputs in
Selected Public Universities in Kenya and lastly the fifth section consisted of a set of questions
based on Institutional Administrative Structures and how they influence Research outputs in
Selected Public Universities in Kenya. The questions were set using Likert five- point scale of
measurement on a continuum ranging from 1-5 where 1 corresponded to least possibility of
occurrence while 5 corresponded to highest possibility of occurrence. The questionnaire is attached
to this report as Appendix II. Secondary data was obtained from NACOSTI Monitoring and
Evaluation reports as well as progress reports submitted by the researchers during the life of the
research project. Triangulation was possible through multiple sources of data including
questionnaires and literature reviews.
3.5.1 Pilot testing of the Research Instruments
A pilot study was carried out among 10% of the sample size to refine the questionnaires and remove
ambiguity (Simon, 2011). This was done two weeks prior to the actual administration of the
questionnaire to the respondents. The questionnaires were self administered through email to the
respondents and appointments sought on when to collect them.
3.5.2 Validity of Research Instruments
A research instrument is valid if its measures what it is supposed to measure when the data collected
through it accurately represents the respondent’s opinions. The validity of the research instrument in
this study was ascertained by conducting a pilot study in Moi and Egerton University. This erased
any ambiguity and tailored the questions to the responses expected before the questionnaire was
administered. Content validity of the research instrument was determined by seeking advice from the
research supervisor and other experts.

24
3.5.3 Reliability of Research Instrument
The reliability of the research instrument was determined using the Split-half test in which 11
questionnaires were randomly distributed to two groups of University Researchers; from Moi and
Egerton Universities. The scores from each of the 11 questionnaires were recorded. The
questionnaires were grouped using the odd and even number approach. The split half reliability test
was then carried out using SPSS. From the results, the research instrument was deemed to be
reliable as the Spearman’s Brown coefficient score was 0.941, the value of the Cronbach’s Alpha
was 0.839 for the 6 questionnaires and 0.917 for the 5 questionnaires, and the value for the Guttman
Split- Half Coefficient was 0.920. Lance, Butts, and Michelis, (2006) recommend a reliability score
of 0.8 and above. The results are presented in Table 3.3.
Table 3.3: Reliability Results
Cronbach’s Alpha Part 1 Value .839
N of items 6a
Part 2 Value .917
N of items 5b
Total N of items 11
Correlation between forms .888
Spearman-Brown Coefficient Equal Length .941
Unequal Length .941
Guttmann Split-Half Coefficient .920
3.6 Data Collection Procedure
The questionnaires were administered to the researchers via emails then follow-up was done by
telephone and personal visits. The respondents were given a period of two (2) weeks to fill in the
questionnaires. After the questionnaires were received, data was cleaned then keyed in the computer
before analysis. Desk top review of the Researchers final reports and monitoring and evaluation
reports was carried out to obtain secondary data and also helped in verification through triangulation
of data.

25
3.7 Data Analysis Techniques
The collected data was cleaned, organized into variables then coded and analyzed using Statistical
Package for Social Sciences (SPSS) version 20 using descriptive statistics and organized into
frequency tables and percentage tables which show finer details that can be viewed at a glance.
3.8 Ethical Considerations
The approval to carry out the research was sought from the University of Nairobi which facilitated
application for a research permit from the National Commission for Science, Technology and
Innovation. Request to use data on University researchers funded by NACOSTI was made through a
letter written to the Chief Executive Officer, NACOSTI. An invitation to the sampled University
researchers was made to seek their informed consent to participate in the research study with an
assurance that every information they gave was to be treated with confidentiality and only used for
the research study. There was no manipulation of data which may mislead conclusions and
recommendations of the study. All quotes and references used in the research study were well cited.
26
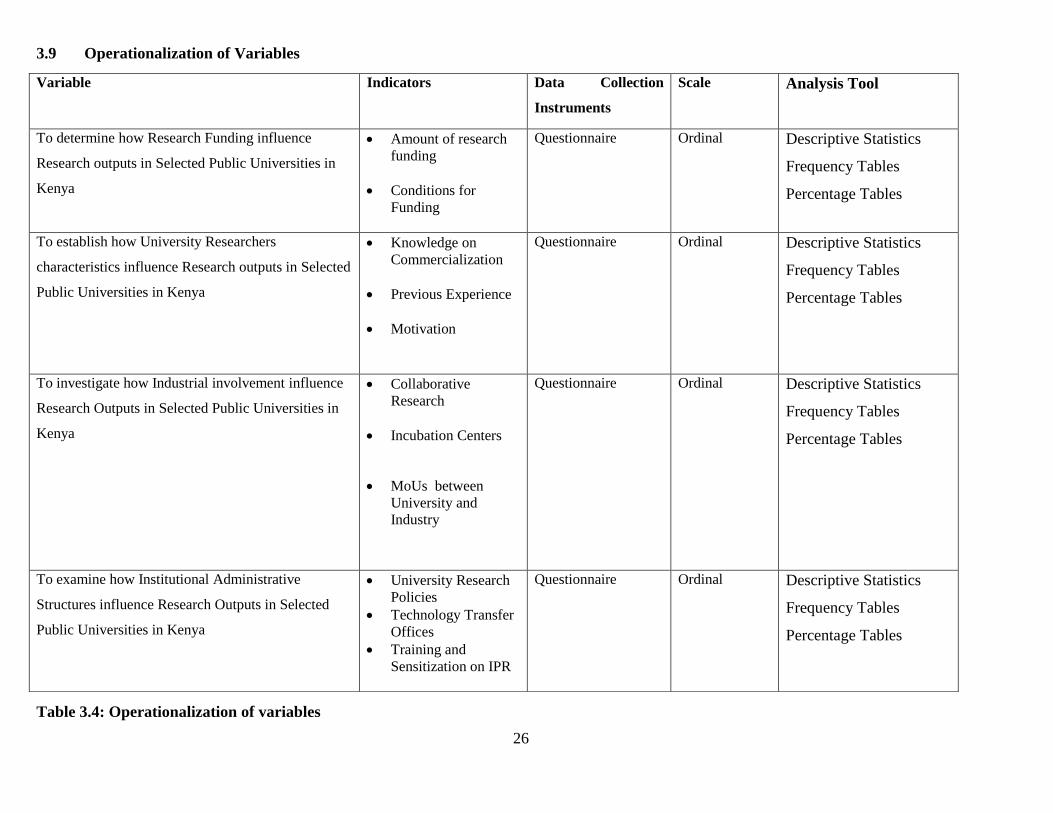
3.9 Operationalization of Variables
Table 3.4: Operationalization of variables
Variable Indicators Data Collection
Instruments
Scale Analysis Tool
To determine how Research Funding influence
Research outputs in Selected Public Universities in
Kenya
Amount of research
funding
Conditions for
Funding
Questionnaire Ordinal Descriptive Statistics
Frequency Tables
Percentage Tables
To establish how University Researchers
characteristics influence Research outputs in Selected
Public Universities in Kenya
Knowledge on
Commercialization
Previous Experience
Motivation
Questionnaire Ordinal Descriptive Statistics
Frequency Tables
Percentage Tables
To investigate how Industrial involvement influence
Research Outputs in Selected Public Universities in
Kenya
Collaborative
Research
Incubation Centers
MoUs between
University and
Industry
Questionnaire Ordinal Descriptive Statistics
Frequency Tables
Percentage Tables
To examine how Institutional Administrative
Structures influence Research Outputs in Selected
Public Universities in Kenya
University Research
Policies
Technology Transfer
Offices
Training and
Sensitization on IPR
Questionnaire Ordinal Descriptive Statistics
Frequency Tables
Percentage Tables

27
CHAPTER FOUR
DATA ANALYSIS, PRESENTATION, INTERPRETATION AND DISCUSSION
4.1 Introduction
This chapter presents the results and discussions of the findings of the research study. It includes the
questionnaire response rate, demographic characteristics of the respondents, Research outputs of
Selected Universities in Kenya, measure of commercialization, Research Funding and
commercialization, University Researchers Characteristics and Research outputs, Industrial
Involvement and Research outputs and Institutional Administrative Structures and Research outputs
4.2 Questionnaire Return Rate
The study realized a response rate of 66%; Nulty (2008) found response rates of 60% and above to be
adequate for surveys. The data was analyzed using SPSS version 20 to produce the descriptive
statistics. Frequency tables and percentage tables were used to describe the data.
4.3 Demographic Characteristics of the Respondents
The male respondents were 39 representing 52% of the respondents while the female respondents were
(36) representing 48% of the respondents. Respondents within the age group 30-34 years were 6.7%
(n=5), the group within 35-40 years of age were 24% (n=18), the age group 40-44 years represented
32.0% (n=24) while the age group 45 years and above were 37.3% (n=28). According to the study
findings, 20% (n=15) of the respondents had research experience of between 1 to 5 years, 33.3 %
(n=25) of the University researchers had research experience between 5-10 years while 46.7% (n=35)
had research experience of over 10 years. Responses from University Researchers who were PhD
holders accounted for 61.3% (n=46), Master’s degree holders were 27 (36%) while Post doctorate
degree holders were 2(2.7%) of the respondents. The respondents who received their funding from
NACOSTI in 2009 were 18.7 % (n=14), those who received funding in 2010 were 16 %( n=12), those
who received funding in 2011 were 42.7 %( n=32), while those who received funding in 2012 were
21.3 %( n=16).
4.4 Research Outputs of Selected Universities in Kenya
The research outputs studied include publications in refereed journals, conference presentations, policy
briefs, text books, patents, utility model, copy right, industrial design, trademark and business startup.
28
Table 4.1: Research Outputs of Selected Universities in Kenya
Frequency Percentage
Publication in Refereed Journal 15 20.0
Business Start up 2 2.7
Conference Presentation, Publication 26 34.7
in Refereed Journal
Publication in Refereed Journal, 1 1.3
Copyright
Conference Presentation, Publication 4 5.3
in Refereed Journal, Utility model
Publication in Refereed Journal, Textbook, 1 1.3
Policy Brief, Conference Presentation, Utility
Business start-up
Publication in Refereed Journal, Textbook, 5 6.7
Conference Presentation
Policy Brief, Conference 1 1.3
Policy brief 3 4.0
Conference presentation 11 14.7
Trademark 1 1.3
Conference presentation, Publication in Refereed 1 1.3
Journal, Patent
No response 4 5.3
Total 75 100
Table 4.1 shows frequencies of respondents’ response on the outputs of their Research Results. Most of
the University researchers, 34.7% (n=26) had made conference presentations and published in Refereed
Journals the findings of their research, 20% (n=15) of the respondents had only published in refereed
Journals, 2.7% (n=2) had a business startup, 1.3% (n=1) had published in refereed journals and had a
copyright, 5.3% (n=4) had published in refereed journal, had made conference presentation and had a

29
utility model, 1.3% (n=1) had Published in refereed journal, had published a text book, policy brief, had
made conference presentation, developed a utility model and had a business startup, 6.7% (n=5) had
published in refereed journals, had a textbook and had made conference presentation, 1.3% (n=1) had
developed a policy brief and made conference presentation. 4.0 %( n=3) had developed a policy brief,
14.7 % (n=11) had only made conference presentation of their research results; 1.3 %( n=1) had a
trademark, 1.3 %( n=1) had made conference presentation, had published in refereed journals and had a
patent, 5.3 %( n=4) gave no response to this question.
The results agree with results of study done by Mathooko (2010) on evaluation of strategies and
mobilizing resources for research and enhancing outputs in Public and Private Universities in Kenya
who realized that between 2004-2008, over 90% of lecturers in Public Universities had not patented
any research outputs and that many of the R&D institutions in the country, Universities included, carry
out research with no end user benefit in mind.
4.5 Measure of Commercialization
According to the research study, Commercialization was measured by the following research outputs;
utility model, patent, copyright, industrial design, trademark and business start up. University
researchers who had utility model, patent or copyright were considered to have semi-commercialized
their research results while University researchers who had Industrial design, Trademark or Business
startup were considered to have fully commercialized their research results. This is because utility
model, patent and copyright are IP protection made in the early stages of the Commercialization
process while industrial design and trademark protect commercial products whereas business startups
are well established income generating ventures.
Table 4.2: Level of Commercialization of University Research Results
Frequency Percentage Cumulative Percentage
Fully Commercialized 4 5.3 5.3
Semi-Commercialized 4 5.3 10.7
No 65 86.7 97.3
No response 2 2.7 100.0
Total 75 100.0

30
Table 4.2 shows the frequency of the respondents and the level of commercialization of their research
results. 4 University Researchers had fully commercialized their research results while 4 University
Researchers had semi-commercialized their research results.
Further comparison was made between the Measure of Commercialization and the Highest Degree of
University Researcher.
Table 4.3: Measure of Commercialization and Highest Degree of Researcher
Highest Degree of Researcher Masters PhD Post Doc Total
Fully Commercialized 2 2 0 4
Semi-Commercialized 1 3 0 4
None 23 40 2 65
No response 1 1 0 2
Total 27 46 2 75
Table 4.3 shows frequencies of responses on relationship between Highest Degree of University
researchers and the Level of Commercialization of their Research Results. 2 University Researchers
with Masters Degree had fully commercialized, 2 Researchers with PhD Degree had fully
commercialized while no researcher with Post Doctorate Degree had fully commercialized. 1
Researcher with Masters Degree had semi-commercialized, 3 Researchers with PhD Degree had semi-
commercialized while no Researcher with Post-Doctorate Degree had semi-commercialized. This
indicates that University Researchers with Masters and PhD degrees were more prone to
commercialization efforts than University Researchers who had Post Doctorate degrees. This may
indicate that research productivity declines as an individual’s academic experience increases as
indicated by Migosi (2012). The decline may be caused by decline of extrinsic motivation as a result of
attainment of tenure, promotion and proximity to retirement.

31
Further comparison was made between the Measure of Commercialization and the Age of the
University Researcher.
Table 4.4: Measure of Commercialization and Age of University Researcher
Frequency
Age of University Researcher 30-34 years 35-40 years 40-44 years 45 years and above Total
Fully Commercialized 1 0 1 2 4
Semi-Commercialized 0 1 2 1 4
None 3 17 20 25 65
No response 1 0 1 0 2
Total 5 18 24 28 75
Table 4.4 shows the relationship between the age of University Researchers and their Level of
Commercialization. In the age group 30-34 years, 1 University Researcher had fully commercialized
their research results and none had semi commercialized. In the age group 35-40 years, no University
researcher had fully commercialized while 1 University researcher had semi-commercialized. Under
the 40-44 years age group, 1 researcher had fully commercialized while 2 had semi-commercialized.
Under the 45 years and above age group, 2 University researchers had fully commercialized their
research while 1 researcher had semi-commercialized. This indicates that older University researchers
are more likely to commercialize their research results as compared to younger University researchers.
This may be due to the experience and a network established by older University Researchers as
compared to their junior counterparts and agrees with findings of study by Migosi (2012) that older
University researchers perceive research more positively than junior researchers.
Further comparison was made between the Measure of Commercialization and the University of
Researcher.

32
Table 4.5: Measure of Commercialization and University of Researcher
Frequency
University of Researcher UoN KU JKUAT Total
Fully Commercialized 2 2 0 4
Semi-Commercialized 2 0 2 4
None 25 20 20 65
No response 2 0 0 2
Total 31 22 22 75
Table 4.5 shows the relationship between University of the Researcher and their level of
Commercialization. 2 researchers from UoN had fully commercialized their research while 2 had semi-
commercialized. 2 researchers from Kenyatta University had fully commercialized their research while
none had semi-commercialized. JKUAT had no researcher who had fully commercialized their
research results while 2 researchers had semi-commercialized their research results. The latest
Webometric ranking of World Universities, January 2015 results places the University of Nairobi (7th
)
ahead of Kenyatta University (38th
) and JKUAT (44th
) out of 855 Universities in Africa.
Commercialization of University Research Results is one of the indicators measured by the
Webometric ranking and this agrees with the results of the study.
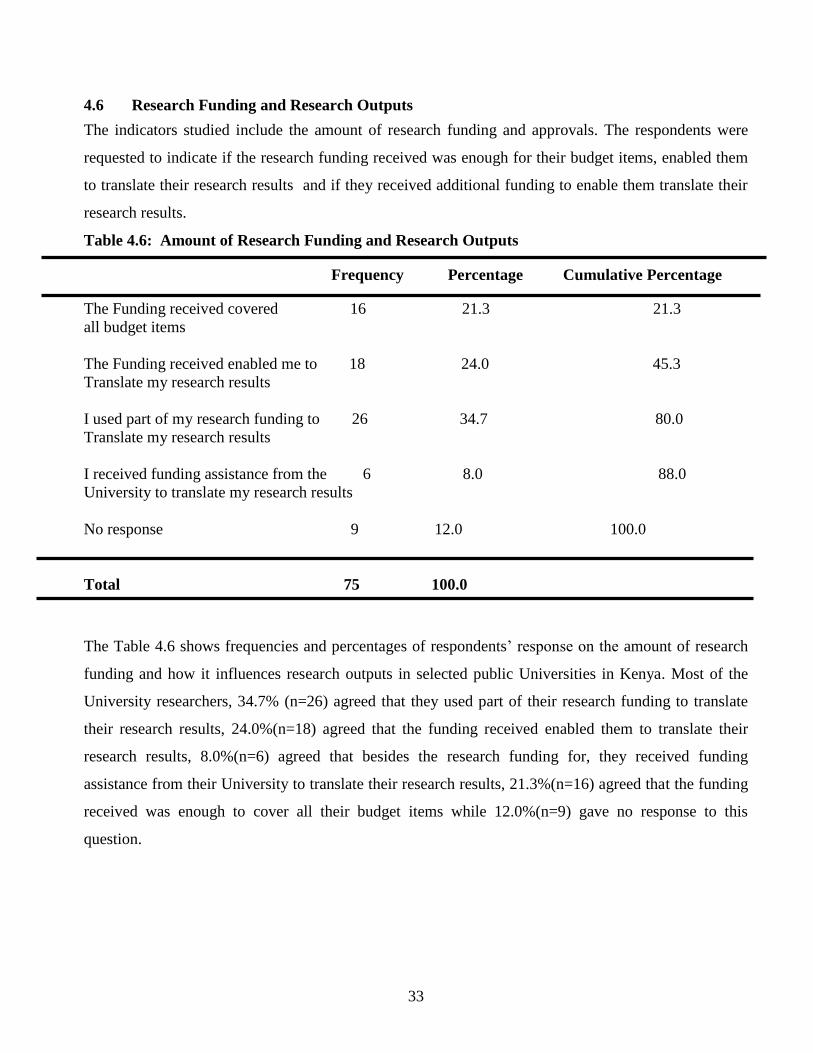
33
4.6 Research Funding and Research Outputs
The indicators studied include the amount of research funding and approvals. The respondents were
requested to indicate if the research funding received was enough for their budget items, enabled them
to translate their research results and if they received additional funding to enable them translate their
research results.
Table 4.6: Amount of Research Funding and Research Outputs
Frequency Percentage Cumulative Percentage
The Funding received covered 16 21.3 21.3
all budget items
The Funding received enabled me to 18 24.0 45.3
Translate my research results
I used part of my research funding to 26 34.7 80.0
Translate my research results
I received funding assistance from the 6 8.0 88.0
University to translate my research results
No response 9 12.0 100.0
Total 75 100.0
The Table 4.6 shows frequencies and percentages of respondents’ response on the amount of research
funding and how it influences research outputs in selected public Universities in Kenya. Most of the
University researchers, 34.7% (n=26) agreed that they used part of their research funding to translate
their research results, 24.0%(n=18) agreed that the funding received enabled them to translate their
research results, 8.0%(n=6) agreed that besides the research funding for, they received funding
assistance from their University to translate their research results, 21.3%(n=16) agreed that the funding
received was enough to cover all their budget items while 12.0%(n=9) gave no response to this
question.

34
Table 4.7: Coordination of Funding
Frequency Percentage Cumulative Percentage
Received Funds without delay 12 16.0 16.0
Delay in Funds remittance by 25 33.3 49.3
University
Late release of funds from 30 40.0 89.3
NACOSTI
No response 8 10.7 100.0
Total 75 100.0
Table 4.7 shows frequencies and percentages of responses on the ease with which the University
researchers received Research Funding. 12(16.0%) indicated that they received funding without delays;
25(33.3%) indicated that they experienced delays at the University; 30(40.0%) indicated that the funds
were released late while 8(10.7%) gave no answer to this question.
4.7 University Researchers Characteristics
The indicators studied include previous experience, motivation and knowledge on commercialization.
Table 4.8: Previous Experience and University Research outputs
Frequency Percentage Cumulative Percentage
Yes 40 53.3 53.3
No 21 28.0 81.3
No response 14 18.7 100.0
Total 75 100.0
Table 4.8 shows frequencies and percentages of responses on previous experience and how it influences
research outputs. University researchers who agreed that previous experience influences research
outputs were 53.3 % (n=40), those who disagreed were 28.0 % (n=21) while 18.7 % (n=14) gave no
response to this question. The findings mirror Ambos, Makela, Julian, & D'Este, (2008) findings that
researcher previous experience is important in generation of research outputs.

35
Further studies were done on different motivations towards generation of research outputs.
Table 4.9: University Researcher Motivation
Frequency and Percentages
Not Important Somewhat Important Uncertain Important Very Important
Indicators
Recognition 3 (4.0%) 8 (10.7%) 15(20.0%) 33(44.0% 19 (25.3%)
Job-satisfaction 2(2.7%) 9(12.0%) 14(18.7%) 30(40.0%) 17(22.7%)
Extra Income 4(5.3%) 10 (13.3%) 14(18.7%) 23(30.7%) 23(30.7%)
Requirement 12(16.0%) 16(21.3%) 20 (26.7%) 16(21.3%) 10(13.1%)
Opportunity 2(2.7%) 5(6.7%) 17(22.7%) 31(41.3%) 19(25.3 %)
Promotion - 9(12.0%) 8 (10.7%) 26(34.7%) 32 (42.7%)
Table 4.9 shows frequencies and percentages of participant response on how important Research
Outputs were. 32(42.7%) of the researchers agreed that research outputs were very important for them
to be promoted, 23(30.7%) agreed that research outputs were important for extra income, 33(44.0%)
agreed that research outputs were important for recognition within the academic community, 31(41.3%)
agreed that they would consider research outputs as important if there was an opportunity to generate
them and 20(26.7%) agreed that research outputs were important if it was a requirement by University
to generate them. These results agree with Leisyte (2011) and Goktepe-Hultein (2008) who found out
that motives behind research outputs and commercialization for University researchers were primarily
focused on their reputation and recognition factors and that financial gain or economic gain factors
were secondary. Lam, 2010 concludes that University researchers driven by “ribbon” factors
(reputational/career rewards) are traditional while Researchers who are entrepreneurial in nature are
driven by “gold” factors (financial rewards).

36
Table 4.10: Knowledge and Entrepreneurial skills and Research Outputs
Frequency Percentage Cumulative Percentage
Very Low Extent 3 4.0 4.0
Low Extent 4 5.3 9.3
Uncertain 18 24.0 33.3
Great Extent 19 25.3 58.7
Very Great Extent 31 41.3 100.0
Total 75 100.0
Table 4.10 shows frequencies and percentages of responses given on extent to which knowledge and
entrepreneurial skills influence Research Outputs in Universities. 41.3% (n=31) of the respondents
indicated knowledge and entrepreneurial skills influence Research outputs to a very great extent, 25.3%
(n=19) of the respondents indicated to a great extent, 24.0% (n=18) were uncertain, 5.3% (n=4)
indicated to a low extent while 4.0% (n=3) indicated to a very low extent. The results agree with
Goktepe-Hultein(2008) who found out that establishing an entrepreneurial culture within the University
together with entrepreneurial training are key motivators for researchers to have a commercialization
mindset.
4.8 Industrial Involvement and Research Outputs in Universities
The indicators studied include collaborative research and incubation centres, and MoUs between
University and Industry.
Table 4.11: Number of Researchers who partnered with Industry during their Research
Frequency Percentage Cumulative Percentage
Researchers who Partnered 33 44.0 44.0
Those who did not 36 48.0 92.0
No response 6 8.0 100.0
Total 75 100.0

37
Table 4.11 shows frequencies and percentages of responses on collaborative research between
University Researchers and Industry. 48.0% (n=36) of the respondents indicated that they did not work
with anyone from Industry during their research, 44.0% (n=33) indicated that they had collaborative
research while 8.0% (n=6) gave no response to this question. The results may explain why there were
low commercialization efforts among the University researchers and agree with D'Este and Patel (2007)
findings that previous collaborative research with industry influences their research outputs and is
significantly important for University researchers to engage in commercialization.
Table 4.12: University-Industry Linkage and Research outputs
Frequency Percentage Cumulative Percentage
Yes 63 84.0 84.0
No 6 8.0 92.0
No response 6 8.0 100.0
Total 75 100.0
84.0% (n=63) of the respondents agreed that university-industry collaborative research would enhance
their research results as indicated in Table 4.12. The results agree with Keerati-angkoon, Pichyangkura,
& Chandrachai(2012) whose study found out that linkage between Universityand Industry strongly
influence Research outputs in Universities and Gulbrandsen and Smeby, 2005 who found that
Researchers who have a prior interaction with the industry have a greater urge towards commercial
outputs.
Table 4.13: University Incubation Centres and Research Outputs
Frequency Percentage Cumulative Percentage
Disagree 3 4.0 4.0
Uncertain 14 18.7 18.7
Agree 21 28.0 50.7
Strongly Agree 34 45.3 96.0
No response 3 4.0 100.0
Total 75 100.0

38
Table 4.13 shows frequencies and percentages of University Researchers response to how Incubation
Centres influences their Research Outputs. 45.3% (n= 34) of the respondents strongly agreed that
Incubation centres influence their Research outputs, 28.0% (n=21) agreed, 18.7% (n=14) were not sure,
4% (n=3) disagreed while 4% (n=3) gave no response to this question.
Table 4.14: MoU between University and Industry
Frequency Percentage Cumulative Percentage
Agree 39 52.0 52.0
Disagree 29 38.7 90.7
No response 7 9.3 100.0
Total 75 100.0
Table 4.14 shows the frequencies and percentages of responses on how MoUs between University and
Industry influence Research Outputs. 39(52.0%) of the researchers agreed that MoUs between
University and Industry enhance Research Outputs, 29(38.7%) disagreed while 7(9.3%) gave no
response to this question.
4.9 Institutional Factors and Commercialization
The indicators studied include University research policies, technology transfer offices, training and
sensitization on IPR.
Table 4.15: University develop Policy on Commercialization
Frequency Percentage Cumulative Percentage
Disagree 2 2.7 2.7
Uncertain 20 26.7 29.3
Agree 24 32.0 61.3
Strongly Agree 26 34.7 96.0
No response 3 4.0 100.0
Total 75 100.0

39
Table 4.15 shows the frequencies and percentages of participant response on how University Policies
influence Research Outputs. 34.7%(n=26) strongly agreed, 32.0%(n=24) agreed, 26.7%(n=20) were not
sure, 2.7%(n=2) disagreed while 4.0%(n=3) gave no response to this question. The results agree with
Farsi, Modarresi, & Zarea, (2011) that University Research policies infleunce research outputs.
Table 4.16: University to establish well managed Technology Transfer Offices
Frequency Percentage Cumulative Percentage
Disagree 8 10.7 10.7
Uncertain 11 14.7 25.3
Agree 24 32.0 57.3
Strongly Agree 29 38.7 96.0
No response 3 4.0 100.0
Total 75 100.0
Table 4.16 shows frequencies and percentages of participant response on how University Technology
Transfer Offices influence Research Outputs. 38.7% strongly agreed, 32.0% agreed, 14.7% were not
sure, 10.7% disagreed while 4.0% gave no response to this question. The results agree with Amanor-
Boadu and Metla (2008) who found out that University Research policies and Technology Transfer
Offices significantly influence University Researchers to generate outputs from their Research results
Table 4.17: University training and sensitization on IPR and Research Outputs
Frequency Percentage Cumulative Percentage
Uncertain 13 17.3 17.3
Agree 30 40.0 57.3
Strongly Agree 27 36.0 93.3
No response 5 6.7 100.0
Total 75 100.0

40
Table 4.17 shows frequencies and percentages of participant response on how training and sensitization
on IPR influence research outputs of University Research Results. 40% agreed, 36.0% strongly agreed,
17.3% were not sure while 6.7% gave no response to this question.

41
CHAPTER FIVE
SUMMARY OF THE FINDINGS, CONCLUSIONS AND RECOMMENDATIONS
5.1 Introduction
This chapter entails the summary of the research findings, conclusions of the study, recommendations
and suggestions for further studies.
5.2 Summary of the Findings
The questionnaire return rate was 66%. 113 questionnaires were distributed but 38 questionnaires
representing 34% were not returned.
The male respondents were 39 representing 52% of the respondents while the female respondents were
(36) representing 48% of the respondents. Respondents within the age group 30-34 years were 6.7%
(n=5), the group within 35-40 years of age were 24% (n=18), the age group 40-44 years represented
32.0% (n=24) while the age group 45 years and above were 37.3% (n=28). According to the study
findings, 20% (n=15) of the respondents had research experience of between 1 to 5 years, 33.3 %
(n=25) of the University researchers had research experience between 5-10 years while 46.7% (n=35)
had research experience of over 10 years. Responses from University Researchers who were PhD
holders accounted for 61.3% (n=46), Master’s degree holders were 27 (36%) while Post doctorate
degree holders were 2(2.7%) of the respondents. The respondents who received their funding from
NACOSTI in 2009 were 18.7 % (n=14), those who received funding in 2010 were 16 %( n=12), those
who received funding in 2011 were 42.7 %( n=32), while those who received funding in 2012 were
21.3 %( n=16).
Most of the research outputs from the University Researchers surveyed were publications and
conference presentations; conferences and publications in refereed journals accounted for 34.7%;
publications in refereed journals accounted for 20.0% ; conference presentations accounted for 14.7%;
2.7% had a business startup; 1.3% had published in refereed journals and had a copyright; 5.3% had
published in refereed journal, had made conference presentation and had a utility model, 1.3% had
published in refereed journals, had published a text book, policy brief, had made conference
presentation, developed a utility model and had a business startup; 6.7% had published in refereed
journals, had a textbook and had made conference presentation; 1.3% had developed a policy brief and

42
made conference presentation; 4.0% had developed a policy brief; 1.3% had a trademark; 1.3% had
made conference presentation, had published in refereed journals and had a patent; 5.3% gave no
response to this question.
Research funding was found to influence Research outputs in selected public Universities in Kenya.
34.7% of the University researchers agreed that they used part of their research funding to generate
outputs from their research results. 24.0% agreed that the funding received enabled them to translate
their research results, 8.0% agreed that besides the research funding, they received funding assistance
from their Universities to generate outputs from their research results, 21.3% agreed that the funding
received from NACOSTI was enough to cover all their budget items while 12.0% gave no response to
this question.
University researcher’s characteristics were found to influence Research outputs in selected public
Universities in Kenya. 53.3% of the University researchers agreed that previous experience influences
Research Outputs in Universities. 41.3% of the respondents indicated that knowledge and
entrepreneurial skills greatly influences Research Outputs. On motivation 42.7% of the researchers
agreed that research outputs were very important for them to be promoted, 30.7% agreed that research
outputs were important for their extra income, 44.0% agreed that research outputs were important for
their recognition within the academic community, 41.3% agreed that research outputs were important if
there was an opportunity to generate them and 26.7% agreed that research outputs were important if it
was a requirement by University to generate them.
Industrial Involvement factors were found to influence Research outputs in selected public Universities
in Kenya. 48.0% of the respondents indicated that they did not work with anyone from Industry during
their research. 84.0% of the respondents agreed that university-industry collaborative research would
enhance generation of research outputs in Universities. On incubation centres, 45.3% of the researchers
strongly agreed that Incubation centres influence Research outputs, 28.0% agreed that Incubation
centres influence their Research outputs, 18.7% were not sure, 4% disagreed while 4% gave no
response to this question. On MoUs between Universities and Industry, 52.0% of the researchers agreed
that MoUs between University and Industry enhance Research Outputs, 38.7% disagreed while 9.3%
gave no response to this question.

43
Institutional Administrative Structures were found to influence Research Outputs in selected public
Universities in Kenya. 34.7% of the researchers strongly agreed that University Policies influence
research outputs, 32.0% agreed, 26.7% were not sure, 2.7% disagreed while 4.0% gave no response to
this question. 38.7% strongly agreed that University Technology Transfer Offices influence Research
Outputs, 32.0% agreed, 14.7% were not sure, 10.7% disagreed while 4.0% gave no response to this
question. On training and sensitization on IPR, 40% of the Researchers agreed that training and
sensitization on IPR influence Research outputs, 36.0% strongly agreed, 17.3% were not sure while
6.7% gave no response to this question.
5.3 Conclusions
The first objective of this research study was to determine how research funding influences Research
Outputs in Selected Public Universities in Kenya. Majority of the respondents agreed that amount of
funding and coordination of funding influence Research outputs in selected public Universities in
Kenya. The second objective of this study was to establish how University Researchers characteristics
influence Research outputs in selected public Universities in Kenya. Majority of the respondents agreed
that reputation and recognition factors motivate University Researchers to generate research products as
compared to financial factors.
The third objective of this study was to investigate how Industrial involvement influence Research
outputs in Selected Public Universities in Kenya. Majority of the respondents agreed that linkage
between University and Industry strongly influence Research outputs. The fourth objective of this study
was to examine how Institutional Administrative Structures influence Research outputs of selected
public Universities in Kenya. Majority of the respondents agreed that training and sensitization on IPR,
technology transfer offices and development of policy on Commercialization influences Research
outputs in Universities in Kenya.
The research findings indicate that Research outputs in selected public Universities in Kenya is
influenced by Research Funding, University Researcher’s Characteristics, Industrial Involvement, and
by Institutional Administrative Structures. This research study attempted to examine research outputs in
Kenyan Public Universities albeit to a small extent. More comprehensive research is necessary to
provide a clearer picture of the status of Research outputs in Kenyan Universities.

44
5.4 Recommendations
1. Increasing research funding to Public Universities in Kenya beyond the final report.
2. University researchers should explore how their research can impact the economy as a way of
giving back to the society and also how they can benefit through Commercialization.
3. Universities should support Researchers by creating linkages with Industry through formal
collaborative research efforts.
4. University to Sensitize researchers on IPR and Commercialization of their Research Results and
to enable them develop commercial products from their Research and move beyond
publications and conference presentation stage.
5. Fast-track the development of a National Commercialization policy and guidelines touching on
IP protection, ownership and benefit sharing of results policies to encourage Commercialization
of publicly funded research through Kenya National Innovation Agency established by the
ST&I Act, 2013 but which is not operational
5.4.1 Suggestions for Further Studies
Based on the findings and conclusions, the research study recommends the following arears for future
studies;
1. Determinants of Commercialization of University Research Results in Public Universities in
Kenya
2. The Influence of Academic Research on Economic Development in Kenya

45
REFERENCES
AAU. (2012). Strengthening Industry and University linkage in Africa.
Acs, Z. J., Audretsch, D.B. Braunerhjelim, P., Carlsson, B. (2008, December 13). The Knowledge
Spillover Theory of Entrepreneurship. Small Bus Econ (2009); 15-30
doi: 10.1007/s11187-008-9157-3
Adams, G., Graham, D., Gray, J., Purcell, R., & De Fazekas, A. (2005). The Commercialization
Handbook; An introductory guide for researchers. Ontario: Intellectual Property Management
Office of Ontario's Post Secondary Research Institutions.
Allen, K. R. (2012). Technology Commercialization: Have we learned anything. The Journal of
Engineering and Entrepreneurship, 3(1).
Amanor-Boadu, V., & Metla, C. M. (2008). Research Faculty, Entrepreneurship and
Commercialization: The case of Kansas State University. Southern Agricultural Economics
Association Annual Meeting. Dallas.
Ambos, T. C., Makela, K., Julian, B., & D'Este, P. (2008). When does University ResearchGet
Commercialized? Creating Ambidexterityin Research Institutions. Journal of Management
Studies, 45(8), 1424-1447.
Awuor, E. (2013). The Role of Research and Findings Dissemination in Industrial Development in
Kenya: The Floriculture Industry in Perspective. Developing Country Studies, 3(3). Retrieved
from www.iiste.org/Journals
Bank, W. (2012). Knowledge Economy Index 2012 Rankings. Retrieved from World Bank:
http://siteresources.worldbank.org/INTUNIKAM/Resources/2012.pdf
Bloom, D., Canning, D., & Chan, K. (2006). Higher Education and Economic Development in Africa.
Harvard University.
Bonaccorsi, A., Daraio, C., & Geuna, A. (2010). Universities in the New Knowledge Landscape:
Tensions, Challenges, Change-An Introduction. Springer.
Bornmann, L. (2013). What is the societal impact of Research and how can it be accessed: A literature
survey. Journal of the American Society for Information Science and Technology, 64(2), 217-
233.
Breznitz, S. M., & Ram, N. (2011). Enhancing Economic Growth? University Technology
Commercialization.
Bwisa, H. M., & Gacuhi, A. R. (1999). An investigation into Factors that Influence the Diffusion and
Adoption of Inventions and Innovations from Research Institutes and Universities in Kenya.

46
Nairobi: African Technology Policy Studies. Retrieved from African Technology Plolicy
Studies: http:www.atpsnet.org/Files/working_paper_series_19.pdf
CARE. (2009). Beyond Scientific Publication: Strategies for Disseminating Research Findings. Yale
Centre for Clinical Investigation.
Coalition, S. (2010). Sparking Economic Growth, How federally funded University Creates innovation,
new companies and jobs. The Science Coalition. Retrieved from
http://www.sciencecoalition.org
Collier, A., & Gray, B. (2010). The commercialisation of University innovations-A Qualitative analysis
of the New Zealand situation. Centre for Entrepreneurship, School of Business, University of
Otago.
Commons, H. o. (2013). Bridging the valley of death; Improving the commercialization of research.
London: Sationery Office Limited.
Crosswaite, C., & Curtise, L. (1994). Disseminating research results-the challenge of bridgingthe gap
between health research and health action. Heath Promotion International, 9(4), 289-296.
Retrieved from http://www.heapro.oxfordjournals.org/content/9/4/289
Darke, P., Shanks, G., & Marianne, B. (1998). Successfully completing Case Study Research:
combining rigour, relevance and pragmatism. Information Systems Journal, 8, 273-289.
D’Este, P., & Patel, P. (2007). University –Industry linkages in the UK: What are the factors?
Research Policy 36, 1295-1313. doi: 10.1016/j.respol.2007.05.002
Dosi, G., & Nelson, R. R. (2013). The Evolution of Technologies: An Assessment of the State-of-the-
Art. Eurasian Business Review, 3(1), 3-46. Retrieved from
http://www.ebesweb.org/pdf/ebr/EBR-3 (1) _Dosi%20and%20Nelson.pdf
Downie, J., & Herder, M. (2007). Reflections on the Commercialization of Research conducted in
Public Institutions in Canada. Mc Gill Health Law Publication.
Economics, I. o. (2008). Effective Dissemination of Findings from Research. Canada: Institute of
Health Economics.
Etzkowitz, H. (1998). The norms of entrepreneurial science:cognitive effects of the new University-
Industry linkages. Research Policy, 823-833.
Etzkowitz, H., & Leydesdorff, L. (2000). The dynamics of Innovation from National systems and
"Mode 2"to a Triple Helix of University-Industry-Government Relations. Research Policy 29,
109-123.

47
Etzkowitz, H., & Leydesdorff, L. (2000). The dynamics of innovation: from National Systems and
"Mode 2" to a Triple Helix of University-Industry-Government relations. Research Policy, 29,
109-123.
EU. (2010). How ways of doing research are evolving in order to address societal challenges. Brussels:
Science in Society.
Farsi, J. Y., Modarresi, M., & Zarea, H. (2011). Obstacles and Solutions of Commercialization of
University Research: Case Studyof Small Businesses Development Centre of University of
Tehran. Journal of Knowledge Management, Economics and Information Technology.
Fletcher, A. C., & Bourne, P. E. (2012). Ten simple rules to Commercialize Scientific Research. PLOs
Computational Biology, 8(9). Retrieved 2014, from www.ploscompbiol.org
Foundation, E. S. (2012). The capture and analysis of research outputs. European Science Foundation.
GOK. (2009). Kenyan Constitution. Nairobi: Government Printers.
GOK. (2012). University Act. Nairobi: Government Printers
GOK. (2013). Science, Technology and Innovation Act.Government Printers
GoK. (2013). Second Medium Term Plan( 2013-2017). Nairobi: Government of Kenya.
Goktepe-Hultein, D. (2008). Why and how do scientists commerrcialize their research? Towards a
typology of inventors. JENA Economic Research Papers.
Gorasson, B., & Brundenius, C. (2011). Universities in Transition. The Changing Role and Challenges
for Academic Institutions. Springer.
Grant, J. (2006). Measuring the Benefits from Reasearch. Retrieved from RAND CORPORATION:
www.rand.org/pubs/research_briefs/RB9202.html
Grimshaw, J. M., P, E. M., N, L. J., Hill, S. J., & Squires, J. E. (2012). Knowledge translation of
research findings. Implementation Science, 7(50). Retrieved from
http://www.implementation.science.com/content/7/1/50
Guenther, J., & Wagner, K. (2008). Getting out of the ivory tower- new perspectives on the
entrepreneurial University. European Journal of International Management .
Gulbrandsen, M., & Smeby, J.C. (2005). Industry funding and University Professor’s research
performance. Research Policy 34(6) 932-950
Gutierrez, J. J., & Correa, P. (2012, November). Commercialization of Publicly funded Research and
Development in Russia. Policy Research Working Paper 6263.

48
Henderson, J. A., & Smith, J. J. (2002). Academia, Industry and the Bayh-Dole Act: An implied Duty
to Commercialize. Massachusetts. Retrieved 2014, from
http://www.cimt.org/news/regulatory/coi_part3.pdf
Holy, K. Z. (2010, June). Full Potential of University Research. A new model of cultivating new
technologies and innovation ecosystems. Retrieved from Science Progress:
www.scienceprogress.org
Jackson, S. L. (2009). Research Methods and Statistics: A critical thinking Approach. Belmont CA:
Wadsworth Cengage Learning.
Keerati-angkoon, K., Pichyangkura, R., & Chandrachai, A. (2012). Academic scientist's motivation in
research commercialization from National Research Universities in Thailand: An Individual
Level. Journal of Economics and Sustainable Development, 3(9).
Kefela, G. T. (2010). Knowledge-based Economy and Society has become a Vital commodity to
countries. International Journal of Education Research and Technology, 1(2), 68-75. Retrieved
from http://www.soeagra.com
Kendagor, S. T., Kosgei, R., Tuitoek, D., & Chelangat, S. (2012). Factors affecting Research
Productivity in Public Universities of Kenya. Journal of Emerging Trends in Economicsand
Management Science, 3(5), 475-484. Retrieved from www.jetems.scholarlinkresearch.org
Khademi, T., Ismail, K., Lee, C. T., & Shafaghat, A. (2015). Enhancing Commercialization Level of
Academic Research Outputs in Research University. Jurnal Teknologi, 141-151.
Kombo, D. K., & Tromp, D. L. (2009). Proposal and Thesis writing; An introduction. Nairobi:
Paulines Publications Africa.
Krejcie R.V. & Morgan D.W.(1970). Determining sample size for research activities. Educational and
Psychological Measurements, 30, 607-610
Lam, A. (2010, December). What Motivates Academic Scientists to Engage in Research
Commercialization: “Gold”, Ribbon or Puzzle. The School of Management, Royal Holloway
University of London. Retrieved from
http://digirep.rhul.ac.uk/items/4a99d3bd-1053-aec8-3e4c-3adb31a44c4c/1/
Lance, C. E., Butts, M. M., & Michelis, L. C. (2006, April). The sources of Four Commonly Reported
Cutoff Criteria. What did they Really Say? Organizational Research Methods, 9(2), 202-220.
Lane, J. P. (2012). Tracking Evidence of Knowledge Use through Knowledge Translation, Technology
Transfer and Commercial Transactions. FOCUS Technical Brief No. 34. SUNY, United States
of America. Retrieved from
http:www.ktdr.org/ktlibrary/articles_pubs/ncddrwork/focus/focus34/Focus34.pdf

49
Leisyte, L. (2011, July). University Commercialisation Policies and their implementation in the
Netherlands and the United States. Science and Public Policy, 38(6), 437-448. Retrieved from
http://www.ingentaconnect.com/content/beech/spp
Link, A. N., & Siegel, D. S. (2007). Innovation, Entrepreneurship and Technological Change.
Oxford University Press.
Martin, B. R. (2012). Are Universities and University research under threat? Towards an evolutionary
model of University speciation. Cambridge Journal of Economics, 36(3), 543-565.
Mathooko, J. M. (2010). Evaluation of Strategies for moblilizing resources for Research and
Enahancing Outputs in Public and Private Universities in Kenya. Kenya Methodist
University(KEMU).
Migosi, J., Muola, J., & Maithya, R. (2012, March 25). Perceptions of academic staff on research and
publishing in Kenyan Universities. International Journal of Education Administration and
Policy Studies, 4. Retrieved February 2014, from http://www.academicjournals.org/IJEAPS
Mowery, D. C., & Sampat, B. N. (2007). Universities in National Innovation systems.
Mutz, R.,Bornmann, L., & Daniel, H. –D. (2013). Types of Research Output profiles: A multilevel
latent class analysis of the Austrian Science Fund’s final project report data. Research
Evaluation, 22, 118-133. doi: 10.1093/reseval/rvs038
NACOSTI. (2013). Annual Report. NACOSTI.
NACOSTI. (2014). Strategic Plan.
Narayan, A., & Hooper, K. (2010). The Role of Government towards Encouraging the Development of
Academic Research Commercialisation in New Zealand: A Historical Overview of Policy
Directions.
Nordfors, D., Sandred, J., & Wessner, C. (2003). Commercialization of Academic Research Results.
VINNOVA.
Nulty, D. D. (2008, June). The adequacy of response rates to online and paper surveys what can be
done? Assessment & Evaluation in Higher Education, 33(3), 301-314.
OECD (2014, January 17), OECD Estimates of R&D Expenditure growth in 2012. Retrieved from
http://www.oecd.org/sti/inno/Note_MSTI2013_2.pdf
Oduwaye, R. O., Owolabi, H. O., Onasanga, S. A., & Shehu, R. A. (2010, June). Research
dissemination, Utilization and Commercialization by Lecturers of a Nigerian University: Case
study of University of Ilorin. Journal of Educational Review, 3(2).

50
Ogunwusi, A. A., & D, I. H. (2014). Promoting Industrialization through Commercialization of
Innovation in Nigeria. Industrial Engineering Letters, 4(7).
Ondimu, S. (2012). Possible Approaches to Commercialisable University Research in Kenya. Nairobi:
Jomo Kenyatta University of Agriculture and Technology.
Power, D., & Malmberg, A. (2008). The contribution of Universities to innovation and economic
development: in what senses a regional problem? Cambridge Journal of Regions, Economy and
Society, 233-245.
Ranga, M., & Etzkowitz, H. (2013, August). Triple Helix Systems: An Analytical Framwework for
Innovation Policy and Practice in the Knowledge Society. Industry and Higher Education,
4(27).
Rao, K., M. X. & Piccaluga. ( 2011). Government role in supporting the commercialization of
University research- From the perspective of Chinese government R&D investment. Triple
Helix IX International Conference. California. USA
Rieu, A.-M. (n.d.). The triple helix concept;towards the formation of a new social system.
Rogers, E. M., Takegami, S., & Jing, Y. (2001). Lessons learned about Technology Transfer.
Technovation 21, 253-261.
Rothaermel, F. T., Agung, S. D., & Jiang, L. (2007). University entrepreneurship; a taxonomy of the
literature. University and Corporate Change, 69-79.
Rudiger, M., Lutz, B., & Hans- Dieter, D. (2012). Types of Research Output profiles: A multilevel
latent class analysis of the Austrian Science Fund's final project report data. Research
Evaluation Advance Access, 22, 118-133.
Salter, A., & Martin, B. R. (2001). The economic benefits of a publicly funded basic research; a critical
review. Elsevier Research Policy, 509-532.
Schwab, K. (2013-2014). The Global Competitiveness Report. World Economic Forum.
Simon, M. (2011). Dissertaion and scholarly research: Recipes for Success. Seattle. Retrieved from
http://dissertationrecipes.com
Students, C. F. (2007). Public Risk Private Gain. An introduction to commercialisation.
Sutherland, W. J., Goulson, D., Potts, S. G., & Dicks, L. V. (n.d.). Quantifying the Impact and
Relevance of Scientific Research. (T. Clifford, Ed.) PLos ONE, 6(11).
doi:10.1371/journal.pone.0027537
Svensson, R. (2008). Growth through Research and Development-what does the literature say?
VINNOVA.

51
Tantiyaswasdikul, K. (2013). Technology Transfer for Commercialization in Japanese University: A
review of the Literature. Japanese Studies Journal.
Ukwuoma, P. O., Amade, B., & Moghalu, E. I. (2013, January-February). The Management of
Researchand Development (R&D) for Commercialization in Nigeria. International Journal of
Advanced Scientific and Technical Research, 1(3).
UNECA. (2014). National Experiencesin the Transfer of Publicly Funded Technologies in Africa:
Ghana, Kenya and Zambia. Addis, Ababa, Ethiopia: ECA Publishing and Distribution Unit.
UNESCO. (2010). The Current Status of Science Around the World. UNESCO Publishing.
Thomson Reuters. (2015) Webometric Ranking of World Universities, Retrieved from
http://www.webometrics.info
Weckowska, D. M. (2010). The Role of Intermediaries in the Commercialisation of Academic
Research: A practised based approach. DRUID-DIME Academy Winter 2010 PhD Conference.
Denmark.
Wilson, P. M., Petticrew, M., Calnan, M. W., & Nazareth, I. (2010). Disseminating research findings:
what should researchers do? A systematic scoping review of conceptual frameworks.
Implementation Science, 5(91). Retrieved from
http://www.implementationscience.com/contents/5/1/91
WIPO. (2007). Technology transfer, Intellectual Property and Effective University-Industry
Partnerships. The Experience of China, India, Japan, Philippines, Republic of Korea,
Singapore and Thailand.
Yaakub, N. I., Wan Hussain, W.M., Abdul Rahman, M. N., Zainol, Z. A., Mujani, .K., Jamsari,
E.A.,….. Jusoff, K. (2011). Challenges for Commercialization of University Research for
Based Invention. World Applied Sciences Journal, 12(2), 132-138
52
APPENDICES
APPENDIX I: Letter of Transmittal of Data Collection Instrument
Claris Awuor Adoyo
School of Distance and Continuing Education
University of Nairobi
P.O. Box 30197
Nairobi
Dear Respondent,
RE: REQUEST FOR YOUR PARTICIPATION IN A RESEARCH STUDY
I am a Masters student in the School of Distance and Continuing Education of the University of
Nairobi. I am carrying out a research study on Factors influencing Research Outputs in Public
Universities in Kenya: The Case of Selected Public Universities in partial fulfillment of the
requirement for Master of Arts in Project Planning and Management.
As a recipient of Research Grants from NACOSTI, I am glad to inform you that you have been selected
to form part of this research study. Therefore, I kindly request your assistance in completing the
attached questionnaire which forms a major input of the research study.
I assure you that all the information and data you may provide will be treated with uttermost
confidentiality and will only be used for the research study. I will follow up this email with a telephone
call to confirm when you will have the questionnaire ready for collection. Your kind cooperation will
go a long way in ensuring the success of this project.
Thanking you in advance,
Yours Sincerely,
Claris Adoyo
University of Nairobi
Encl.

53
APPENDIX II: Questionnaire for Public Universities Researchers
SECTION A: Demographic Characteristics of Respondents
Please tick where appropriate
1. Please indicate your gender: Male Female
2. What is your age bracket:
Below 30 years 30-34 years 35-40years
40-44 years 45 years and above
3. Indicate your highest academic qualification level
Degree Masters PhD Diploma Certificate
4. Please indicate your research specialty
....................................................................................
5. How long have you been involved in research?
Less than 1 year 1-5years 5-10 years over 10 years
6. Indicate when you received research funding from NACOSTI
....................................................................................
SECTION B: Amount of Research Funding
1. How much did you receive for your research project from National Commission for Science,
Technology and Innovation(NACOSTI)
..............................................................................................................................................
2. In your opinion was this funding level enough?
Yes No
If your answer is No, Please explain
..........................................................................................................................................................
..........................................................................................................................................................
3. Does your University have Internal Monitoring & Evaluation mechanisms to ensure timely
project implementation?
Yes No

54
4. Were you able to complete your project in time?
Yes No
If your answer is No, Please explain why
................................................................................................................................................
................................................................................................................................................
5. Do you think the NACOSTI disbursement process is efficient?
Yes No
If your answer is No, Please explain
..........................................................................................................................................................
......................................................................................................................................
.............................................................................................................................................
6. Have you been able to translate your research results since completion of the research project
into any products?
Yes No
If yes, please tick all as appropriate
Publication Refereed Journal
Textbook
Policy Brief
Conference presentation
Patent
Utility model
Copyright
Industrial design
Trademark
Business startup
Any other, please indicate......................................................................

55
7. Please tick as appropriate
The Funding received was enough to cover all budget items
The Funding received enabled me to translate research findings
I used part of my research funding from NACOSTI to translate my
research findings
I received funding assistance from University to translate my research
findings
8. What advice or recommendation do you have on how to improve the disbursement process in
future?
……………………………………………………………………………………………..
................................................................................................................................................
SECTION C: University Researcher Characteristics
1. Have you commercialized your research results before? Yes No
If your answer is No, please proceed to Question 4
2. Do you think this experience would influence your commercialization efforts now or in the future?
Yes No
3. How did you learn about Commercialization? Please select from the options below
Sensitization by University.................................................................
Own Initiative...................................................................................
4. In a scale of 1-5, kindly indicate the extent to which the following factors influence Research
Outputs of Universities in Kenya;
1. Very Low Extent
2. Low Extent
3. Uncertain
4. Great extent
5. Very great Extent

56
Knowledge on Commercialization and Entrepreneurial skills
Funds set aside for Commercialization
Policy compelling Researchers to Commercialize their Research Results
Interaction with the Industrial/Business Sector
University support to carry out Research
University Intellectual Property Policy
5. Rate the following reasons why you would generate research outputs according to your
level of importance
1. Not Important
2. Somewhat Important
3. Uncertain
4. Important
5. Very important

57
For recognition and reputation
For job satisfaction
For extra income
Requirement by University
Opportunity to do so
Promotion
SECTION D: Industrial Involvement
1. Does your University have any formal linkage with the industrial sector towards supporting
research outputs and commercialization?
Yes No
2. Does your University participate in joint/ collaborative research with the Industrial Sector?
Yes No
3. Does your University have a Technology Transfer Office?
Yes No
4. In your opinion, does the existence of the Technology Transfer Office encourage
Commercialization of Research Results in your University?
Yes No
Please explain......................................................................................................
...............................................................................................................................
……………………………………………………………………………………
5. During your research, did you work with anyone from Industry?
Yes No
6. Were all the needed equipments for your research available at the University?
Yes No
7. If No, please explain how you accessed them?
…………………………………………………………………………………………………
………..…………………………………………………………………………………………

58
…………………………………………………………………………………………………
……………………………………………………………………………….
8. a) As a Researcher, do you think University-Industrial linkages have any influence on research
outputs and Commercialization of University Research Results?
Yes No
b) How, please explain
…………………………………………………………………………………………………
………..…………………………………………………………………………………………
…………………………………………………………………………………………………
…………………………………………………………………………………
SECTION E: Institutional Administrative Structures
1. Is there a policy to guide research outputs and Commercialization of Research results in your
University?
Yes No
2. Is there Monitoring Mechanism within the University to ensure this is adhered to?
Yes No
3. How many teaching/research hours are allowed for University Researchers per week
i. Teaching hours...........................................................................
ii. Research hours............................................................................
4. a) Do you think the time allocated for Research is enough?
Yes No
b)Why? Please explain...........................................................................................................
…………………………………………………………………………………………………..
………………………………………………………………………………………
5. Are there any motivation/incentives offered by your University when you publish or acquire
intellectual property of your research results?
Yes No
If yes please indicate
………..…………………………………………………………………………………………
…………………………………………………………………………………………………
6. Do you think this could motivate more researchers to commercialize their Research Results?
Yes No

59
7. In a scale of 1-5, kindly indicate the degree to which you agree or disagree with the following
statements on how your University can Increase research outputs and Commercialization of
Research Results;
1. Strongly Disagree
2. Disagree
3. Not sure
4. Agree
5. Strongly Agree
Offer Incentives to Publish
Pay for Patents developed by Researchers at University
Provide Financial Support for Commercialization
Develop policy on Commercialization
Training and Sensitization on Commercialization and IPR
Allocate enough time to Concentrate on Research
Offer Incentives to those who have Commercialized their Research
Results
Monitoring to ensure all Researchers Commercialize viable Research
Results
Seek partnership with Industry to help in Commercialization efforts
Establish well managed Technology Transfer Offices
Establish Incubation Hubs/Centres
Mainstream Entrepreneurial skills in University Curriculum
Thank you for taking time to fill out this questionnaire.

60
APPENDIX III: Research Permit