2014 kenya demographic and health survey (kdhs) · republic of kenya 2014 kenya demographic and...
TRANSCRIPT

2014 Kenya Demographic and Health Survey (KDHS)
County-level KDHS Data: Outputs from a DHS Workshop


Republic of Kenya
2014 Kenya Demographic and Health Survey (KDHS) County-level KDHS Data:
Outputs from a DHS Workshop
Kenya National Bureau of Statistics Nairobi, Kenya
Ministry of Health Nairobi, Kenya
National AIDS Control Council Nairobi, Kenya
Kenya Medical Research Institute Nairobi, Kenya
National Council for Population and Development Nairobi, Kenya
The DHS Program, ICF Rockville, Maryland, USA
December 2017
WORLD BANK KENYANS AND AMERICANSIN PARTNERSHIP TO FIGHT HIV/AIDS

Cover photos (left to right):
© 2009 Georgina Goodwin/Vestegaard Frandsen, Courtesy of Photoshare
© 2011 Riders for Health/Tom Oldham , Courtesy of Photoshare
© 2013 Molly Snell, Courtesy of Photoshare
Recommended citation:
Kenya National Bureau of Statistics, Ministry of Health [Kenya], National AIDS Control Council
[Kenya], Kenya Medical Research Institute, National Council for Population and Development [Kenya],
and ICF. 2017. 2014 Kenya Demographic and Health Survey (KDHS) County-level KDHS Data: Outputs from a DHS Workshop. Nairobi, Kenya: Ministry of Health Kenya.

iii
Contents
County-level KDHS Data: Outputs from a DHS Workshop ............................................... v Acknowledgements ................................................................................................................ vii Acronym List ........................................................................................................................... ix Participants .............................................................................................................................. xi Malaria Endemicity Zones by County ................................................................................. xiii
Ownership of Insecticide-treated Nets (ITNs) ...................................................................... 2 Use of Insecticide-treated Nets (ITNs) .................................................................................. 4
Children’s Use of Insecticide-treated Nets (ITNs) ............................................................... 6
Malaria in Pregnancy ................................................................................................................ 8
Antimalarials .......................................................................................................................... 10
Malaria Diagnostics ................................................................................................................ 12 Vitamin A Supplementation ................................................................................................. 14
Basic Vaccination Coverage .................................................................................................. 16
HIV Counselling during ANC ................................................................................................ 18
HIV Counselling and Testing during Pregnancy ................................................................. 20 Prevalence of Fever................................................................................................................ 22
Treatment Seeking for Children with Fever ....................................................................... 24
Teenage Childbearing ............................................................................................................ 26
Modern Methods of Family Planning .................................................................................... 28 Short Birth Intervals .............................................................................................................. 30
Health Facility Deliveries ...................................................................................................... 32
Assistance during Delivery .................................................................................................... 34
Prevalence of Diarrhoea ........................................................................................................ 36 Care Seeking for Diarrhoea .................................................................................................. 38
Diarrhoea Treatment ............................................................................................................ 40
Four or More ANC Visits ...................................................................................................... 42
ANC Visits within the First Trimester ................................................................................. 44
Appendix Tables ..................................................................................................................... 47 Table A1 Percentage of households with at least 1 insecticide-treated mosquito net (ITN) by
county, Kenya 2014 ........................................................................................................................... 47 Table A2 Percentage of household population that slept under an ITN the previous night by
county, Kenya 2014 ........................................................................................................................... 48 Table A3 Percentage of children under age 5 who slept under an ITN the previous night by
county, Kenya 2014 ........................................................................................................................... 49 Table A4 Among women age 15-49 with a live birth in the two years preceding the survey, the
percentage who received 3 or more doses of SP/Fansidar, at least one of which was received during an ANC visit by county, Kenya 2014 .............................................................. 50
Table A5 Among children under age 5 with recent fever, the percentage who took any ACT, Kenya 2014 .......................................................................................................................................... 51

iv
Table A6 Among children under age 5 with recent fever the percentage who had blood taken from a finger or heel for testing by county, Kenya 2014 .......................................................... 52
Table A7 Percentage of living children, age 6-59 months who received vitamin A supplements in the 6 months preceding the survey, by county, Kenya 2014 .............................................. 53
Table A8 Percentage of children age 12-23 months who had received all basic vaccines at any time before the survey by county, Kenya 2014 .......................................................................... 54
Table A9 Percentage of women age 15-49 years of age with live birth in two years preceding the survey who received counselling on HIV during ANC by county, Kenya 2014 .......... 55
Table A10 Percentage of women age 15-49 years of age with live birth in two years preceding the survey who were counselled on HIV, tested and received result during ANC by county, Kenya 2014 ........................................................................................................................... 56
Table A11 Percentage of children under age 5 who had fever in the two weeks preceding the survey by county, Kenya 2014 ........................................................................................................ 57
Table A12 Among children under age 5 with recent fever, the percentage for whom advice on treatment was sought from a health facility or provider by county, Kenya 2014 .............. 58
Table A13 Among young women age 15-19, the percentage who have had a live birth or are pregnant with their first child by county, Kenya 2014 .............................................................. 59
Table A14 Among currently married women age 15-49, the percentage currently using a modern contraceptive method by county, Kenya 2014 ........................................................... 60
Table A15 Among the nonfirst births in the five years preceding the survey, the percentage with a short preceding birth interval (less than 24 months) by county, Kenya 2014 ........ 61
Table A16 Among live births in the five years preceding the survey, the percentage delivered in a health facility by county, Kenya 2014 ......................................................................................... 62
Table A17 Among live births in the five years preceding the survey, the percentage delivered by a skilled provider by county, Kenya 2014 ............................................................................... 63
Table A18 Percentage of children under age 5 who had diarrhoea in the two weeks preceding the survey by county, Kenya 2014 ................................................................................................. 64
Table A19 Among children under age 5 with recent diarrhoea, the percentage for whom advice or treatment was sought from a health facility or provider by county, Kenya 2014 ....................................................................................................................................................... 65
Table A20 Among children under age 5 with recent diarrhoea, the percentage given oral rehydration solution (ORS) by county, Kenya 2014 ................................................................. 66
Table A21 Among women age 15-49 who had a live birth in the five years preceding the survey, the percentage who had 4 or more antenatal care (ANC) visits during pregnancy for their most recent birth by county, Kenya 2014............................................... 67
Table A22 Among women age 15-49 who attended at least one ANC visit for their most recent live birth in the five years preceding the survey, the percentage whose first visit occurred during the first trimester (before month 4) by county, Kenya 2014 .................. 68

v
County-level KDHS Data Outputs from a DHS Workshop
This county-level report is the product of the KDHS County-level Analysis Workshop held in
in Nakuru, Kenya from December 8-15, 2016. The purpose of the workshop was to increase the
capacity of participants to analyse and interpret Kenya Demographic and Health Survey (KDHS)
county-level data. The workshop taught participants to analyse the 2014 Kenya Demographic and
Health Survey (KDHS) data sets to examine county-level variation in indicator coverage. The
workshop included training on KDHS sampling and weighting, recoding variables, calculating indicators,
examining confidence intervals, and other topics. Eighteen participants worked in teams of 2
individuals from the same institution (please see the participant list on page xi) to produce the
findings presented in this report. The teams produced indicator coverage estimates with confidence
intervals, examined variation in indicator coverage across counties and other background
characteristics, and interpreted the findings. Each team produced the tables, figures, and bulleted
indicator summaries included in this report. At the end of the workshop the teams also presented
their key findings to the group, describing and interpreting results for their calculated indicators.
A NOTE ON INTERPRETATION
Every estimate from a sample survey such as the KDHS is subject to a certain degree of
uncertainty. The values shown in KDHS tables and figures are the middle of a range of possible values.
This range of possible values is called the confidence interval. Researchers are confident that the
“truth,” or the value one would get if every single person in the population were surveyed (rather
than using a sample) lies within this range. All figures in this report include confidence interval bars
showing the lower and upper limit of the 95% confidence interval for the estimate. For example,
58.7% of households own at least one insecticide-treated mosquito net (ITN) in the 2014 KDHS
(page 47). The KDHS results are 95% confident that the true percentage of households in Kenya
that own at least one ITN is between 57.5% and 59.8%.


vii
Acknowledgements
The authors would like to thank Glorine Nyakambi, Harrison Odondi, Anne Kioi, and
Winfred Chepkwony from the ICF Kenya office for all their logistical support for the KDHS County-
level Analysis Workshop. Additional thanks goes to Sally Zweimueller for her careful and thoughtful
review of the report, and to Audrey Shenett and Chris Gramer for their formatting of the report.


ix
Acronym List
ACT Artemisinin-based combination therapy
ANC Antenatal care
HIV Human Immunodeficiency Virus
IPTp3+ Intermittent preventive treatment during pregnancy, three or more doses of SP/Fansidar
with one received during ANC visit
ITN Insecticide-treated net
mCPR Modern contraceptive prevalence rate
NMCP National Malaria Control Programme
ORS Oral rehydration solution
RMHSU Division of Family Health and Reproductive and Maternal Health Services Unit
SBA Skilled birth attendant
SP Sulfadoxine/pyrimethamine


xi
Participants
Participant Names by Team Participant OrganizationMinistry of Health, NMCPBeatrice Machini
Faustine Sakari Ministry of Health, NMCP-Kakamega Elizabeth Chomba Ministry of Health, NMCP-Kwale Lilyana Dayo Ministry of Health, NMCP-Kisumu Andrew A. Imbwaga Kenya National Bureau of Statistics Alinoor Hussein Hapicha Kenya National Bureau of Statistics Michael M. Musyoka Kenya National Bureau of Statistics Zachary Ochola Kenya National Bureau of Statistics Renice Akinyi Bunde Kenya National Bureau of Statistics George Muriithi Magara Kenya National Bureau of Statistics Hellen Sidha Ministry of Health-RMHSUHassan Ali Ibrahim Ministry of Health-RMHSUEunice Wachira Ministry of Health-RMHSUMary Magubo Ministry of Health-RMHSUMakokha Fredrick Ministry of Health-Kakamega County Alfred Wamyonyi Ministry of Health-Nandi County Lize Apondi Ojowi USAID/KenyaWashington Omwomo USAID/Kenya

xiii
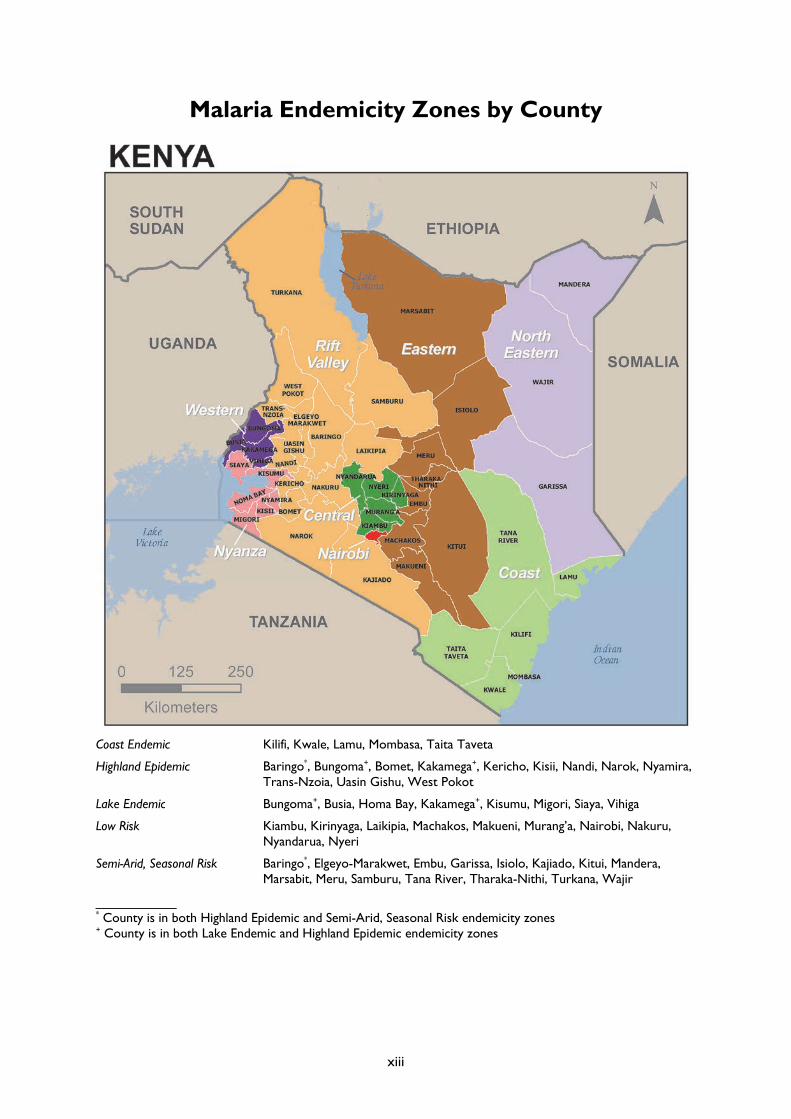
Malaria Endemicity Zones by County
Coast Endemic Kilifi, Kwale, Lamu, Mombasa, Taita Taveta
Highland Epidemic Baringo*, Bungoma+, Bomet, Kakamega+, Kericho, Kisii, Nandi, Narok, Nyamira, Trans-Nzoia, Uasin Gishu, West Pokot
Lake Endemic Bungoma+, Busia, Homa Bay, Kakamega+, Kisumu, Migori, Siaya, Vihiga
Low Risk Kiambu, Kirinyaga, Laikipia, Machakos, Makueni, Murang’a, Nairobi, Nakuru, Nyandarua, Nyeri
Semi-Arid, Seasonal Risk Baringo*, Elgeyo-Marakwet, Embu, Garissa, Isiolo, Kajiado, Kitui, Mandera, Marsabit, Meru, Samburu, Tana River, Tharaka-Nithi, Turkana, Wajir
__________ * County is in both Highland Epidemic and Semi-Arid, Seasonal Risk endemicity zones+ County is in both Lake Endemic and Highland Epidemic endemicity zones
2
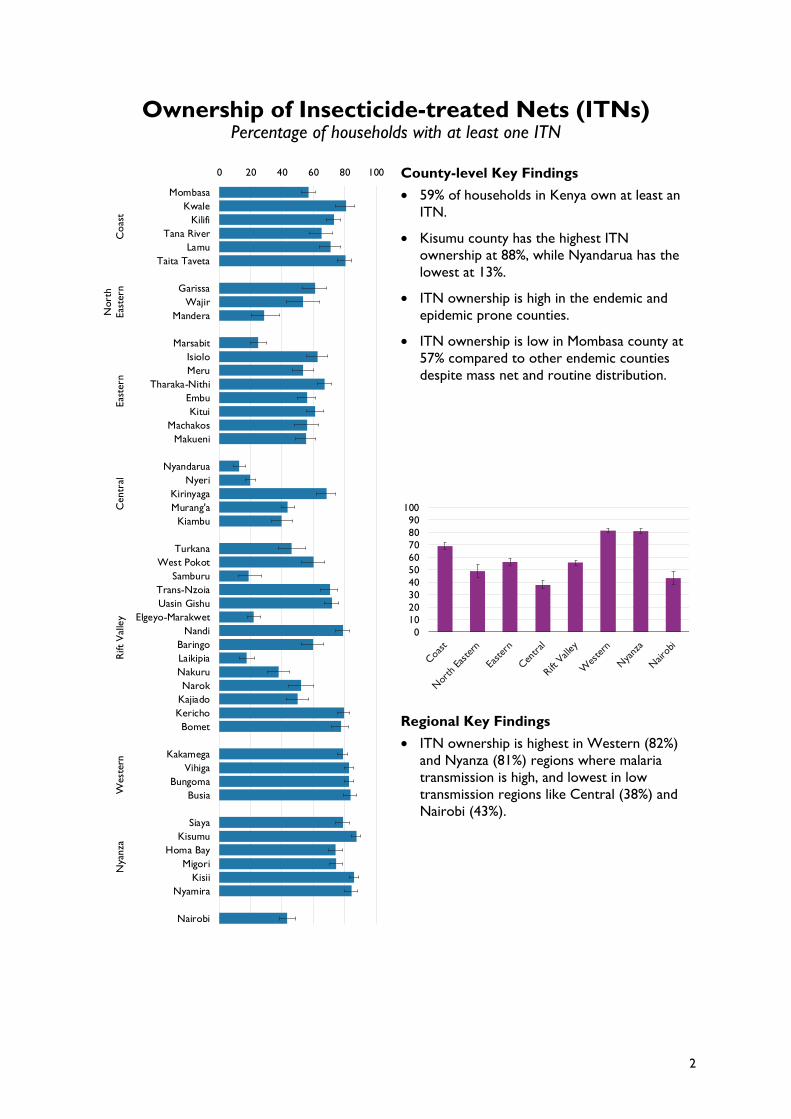
Ownership of Insecticide-treated Nets (ITNs) Percentage of households with at least one ITN
County-level Key Findings
• 59% of households in Kenya own at least anITN.
• Kisumu county has the highest ITNownership at 88%, while Nyandarua has thelowest at 13%.
• ITN ownership is high in the endemic andepidemic prone counties.
• ITN ownership is low in Mombasa county at57% compared to other endemic countiesdespite mass net and routine distribution.
Regional Key Findings
• ITN ownership is highest in Western (82%)and Nyanza (81%) regions where malariatransmission is high, and lowest in lowtransmission regions like Central (38%) andNairobi (43%).
0 20 40 60 80 100
MombasaKwale
KilifiTana River
LamuTaita Taveta
GarissaWajir
Mandera
MarsabitIsioloMeru
Tharaka-NithiEmbuKitui
MachakosMakueni
NyandaruaNyeri
KirinyagaMurang'a
Kiambu
TurkanaWest Pokot
SamburuTrans-NzoiaUasin Gishu
Elgeyo-MarakwetNandi
BaringoLaikipiaNakuruNarok
KajiadoKerichoBomet
KakamegaVihiga
BungomaBusia
SiayaKisumu
Homa BayMigori
KisiiNyamira
Nairobi
Coa
stN
orth
East
ern
East
ern
Cen
tral
Rift
Val
ley
Wes
tern
Nya
nza
0102030405060708090
100

3
National-level Wealth Key Findings
• Households in the middle wealth quintilehave the highest ITN ownership at 64% whilethose in the poorest wealth quintile have thelowest ITN ownership at 51%.
• Households in the middle quintile are morelikely to own an ITN compared tohouseholds in the poorest quintile.
National-level Residence Key Findings
• ITN ownership is higher in rural areas (61%)than in urban areas (56%).
• The difference in ITN ownership by rural andurban residence is statistically significant.
0
10
20
30
40
50
60
70
80
90
100
Poorest Second Middle Fourth Wealthiest
0
10
20
30
40
50
60
70
80
90
100
Urban Rural

4
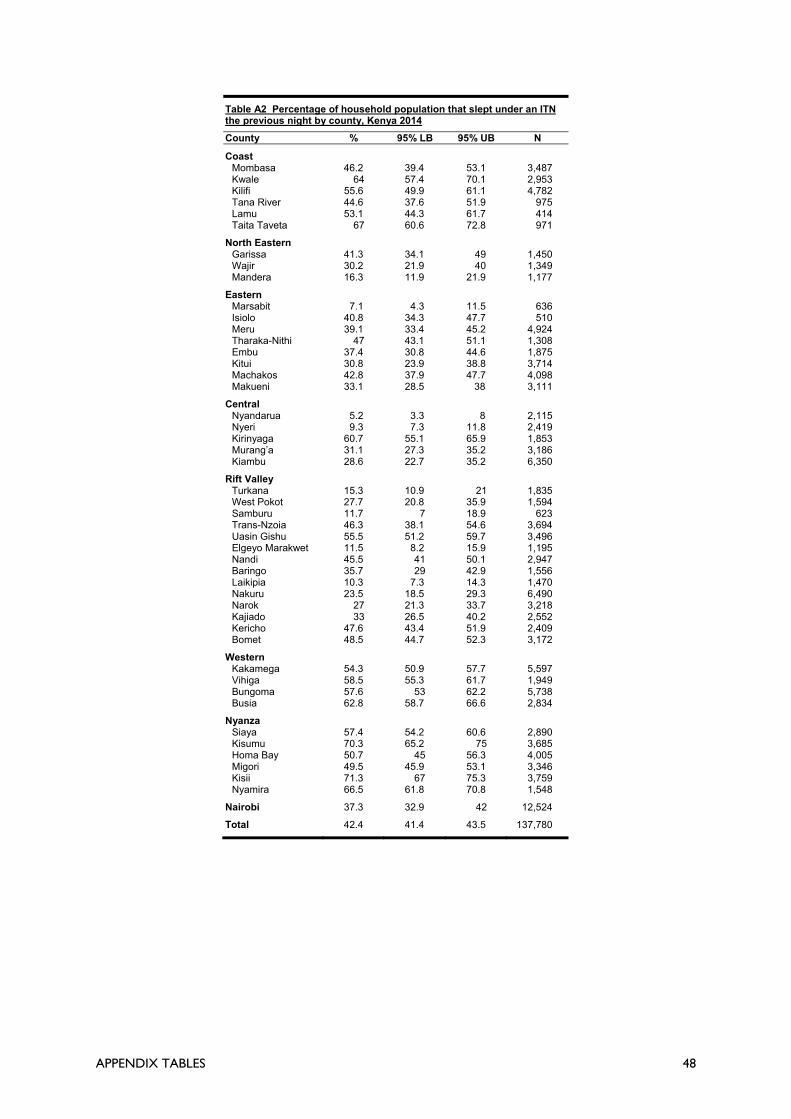
Use of Insecticide-treated Nets (ITNs) Percentage of household population that slept under an ITN the previous night
County-level Key Findings
• ITN use is highest in Kisii and Kisumucounties at 71% and 70%, respectively, andlowest in Nyandarua (5%) and Marsabit (7%).
• Household members in counties with higherITN ownership are more likely to have sleptunder an ITN.
Regional Key Findings
• The percentage of the household populationwho slept under an ITN the previous night ishighest in Nyanza (61%), Western (58%), andCoast (55%) regions.
• The percentage of the household populationwho slept under an ITN the previous night inother regions ranges from 27% to 37%.
0 20 40 60 80 100
MombasaKwale
KilifiTana River
LamuTaita Taveta
GarissaWajir
Mandera
MarsabitIsioloMeru
Tharaka-NithiEmbuKitui
MachakosMakueni
NyandaruaNyeri
KirinyagaMurang'a
Kiambu
TurkanaWest Pokot
SamburuTrans-NzoiaUasin Gishu
Elgeyo-MarakwetNandi
BaringoLaikipiaNakuruNarok
KajiadoKerichoBomet
KakamegaVihiga
BungomaBusia
SiayaKisumu
Homa BayMigori
KisiiNyamira
Nairobi
Coa
stN
orth
East
ern
East
ern
Cen
tral
Rift
Val
ley
Wes
tern
Nya
nza
0102030405060708090
100

5
National-level Wealth Key Findings
• The household population in the poorestwealth quintile is less likely to have sleptunder an ITN compared to the wealthiestquintile.
• There is significant difference in ITN useamong household members in the poorestwealth quintile and household members in allother wealth quintiles.
National-level Age Group Key Findings
• Children under age 5 are more likely to haveslept under an ITN (54%) than otherhousehold members
• Household members age 5 to 14 are lesslikely to have slept under an ITN (37%)compared to other age groups.
0
10
20
30
40
50
60
70
80
90
100
Poorest Second Middle Fourth Wealthiest
0
10
20
30
40
50
60
70
80
90
100
<5 5-14 15-34 35-50 50+

6
Children’s Use of Insecticide-treated Nets (ITNs) Percentage of children under age 5 who slept under an ITN the previous night
County-level Key Findings Children under age 5 in Kisumu and Taita
Taveta counties are more likely to have slept under an ITN (82% each) compared to children in Nyandarua and Marsabit counties (12% each).
79% of children under age 5 in Kirinyaga county slept under an ITN.
Among the endemic counties, children in Homa Bay county have the lowest ITN use (56%).
Regional Key Findings Children under age 5 in Nyanza and
Western regions are more likely to have slept under an ITN (69%) compared to children in North Eastern, Central, and Rift Valley regions (from 40% to 43%).
0 20 40 60 80 100
MombasaKwale
KilifiTana River
LamuTaita Taveta
GarissaWajir
Mandera
MarsabitIsioloMeru
Tharaka-NithiEmbuKitui
MachakosMakueni
NyandaruaNyeri
KirinyagaMurang'a
Kiambu
TurkanaWest Pokot
SamburuTrans-NzoiaUasin Gishu
Elgeyo-MarakwetNandi
BaringoLaikipiaNakuruNarok
KajiadoKerichoBomet
KakamegaVihiga
BungomaBusia
SiayaKisumu
Homa BayMigori
KisiiNyamira
Nairobi
Coa
stN
orth
East
ern
East
ern
Cen
tral
Rift
Val
ley
Wes
tern
Nya
nza
0102030405060708090
100

7
National-level Wealth Key Findings A higher percentage of children under age 5
in the wealthiest quintile (63%) slept under an ITN compared to those in the poorest wealth quintile (40%).
ITN use in children under age 5 increases by wealth quintile.
National-level Age Group Key Findings Children under age 5 are more likely to
have slept under an ITN (54%) than other household members
Household members age 5 to 14 are less likely to have slept under an ITN (37%) compared to other age groups.
0
10
20
30
40
50
60
70
80
90
100
Poorest Second Middle Fourth Wealthiest
0
10
20
30
40
50
60
70
80
90
100
Urban Rural

8
Malaria in Pregnancy Among women age 15-49 with a live birth in the two years preceding the survey,
the percentage who received 3 or more doses of SP/Fansidar, at least one of which was received during an ANC visit (IPTp3+)
County-level Key Findings Kwale (52%), Busia (36%), Lamu (36%), and
Taita Taveta (32%) counties have the highest percentage of IPTp3+.
Meru (0%), Embu (0%), Wajir (1%), Nairobi (1%), and Marsabit (1%) counties have the lowest percentage of IPTp3+.
Regional Key Findings Coast (33%), Western (26%), and Nyanza
(10%) regions have the highest percentage of IPTp3+.
North Eastern and Central regions have the lowest percentage of IPTp3+ at 1% and 2%, respectively.
0 20 40 60 80 100
MombasaKwale
KilifiTana River
LamuTaita Taveta
GarissaWajir
Mandera
MarsabitIsioloMeru
Tharaka-NithiEmbuKitui
MachakosMakueni
NyandaruaNyeri
KirinyagaMurang'a
Kiambu
TurkanaWest Pokot
SamburuTrans-NzoiaUasin Gishu
Elgeyo-MarakwetNandi
BaringoLaikipiaNakuruNarok
KajiadoKerichoBomet
KakamegaVihiga
BungomaBusia
SiayaKisumu
Homa BayMigori
KisiiNyamira
Nairobi
Coa
stN
orth
East
ern
East
ern
Cen
tral
Rift
Val
ley
Wes
tern
Nya
nza
0102030405060708090
100

9
National-level Wealth Key Findings The highest proportion of IPTp3+ is from
the poorest to middle wealth quintiles at 12%, 10%, and 14%, respectively.
The fourth and wealthiest quintiles have the lowest proportion of IPTp3+.
The difference in IPTp3+ between the wealthiest quintile and the poorest quintile is statistically significant.
National-level Education Key Findings The percentage of IPTp3+ slightly decreases
as education level increases.
The difference in IPTp3+ coverage between those with education and no education is not statistically significant.
0
10
20
30
40
50
60
70
80
90
100
Poorest Second Middle Fourth Wealthiest
0
10
20
30
40
50
60
70
80
90
100
Noeducation
Incompleteprimary
Completeprimary
Incompletesecondary
Completesecondary
Higher

10
Antimalarials Among children under age 5 with recent fever, the percentage who took any ACT
County-level Key Findings Busia (60%), Siaya (59%), and Bungoma
(55%) counties have the highest percentage of children with recent fever who took any ACT.
Nyeri, Murang’a, Wajir, and Kajiado counties have the lowest percentage of children with recent fever who took any ACT at 0% for all.
Regional Key Findings Western and Nyanza regions have the
highest percentage of children with recent fever who took any ACT at 50% and 42%, respectively.
Central and North Eastern regions have the lowest percentage of children with recent fever who took any ACT at 4% and 5%, respectively.
ⁱ Estimate not shown due to insufficient sample size (<25 unweighted cases) ⁱⁱ Estimate is based on 25-49 unweighted cases and should be interpreted with caution
0 20 40 60 80 100
MombasaKwale
KilifiTana River
LamuTaita Taveta
GarissaⁱⁱWajir
ManderaⁱMarsabit
IsioloMeru
Tharaka-NithiEmbuⁱⁱ
KituiMachakosⁱⁱ
Makueni
NyandaruaNyeriⁱⁱ
KirinyagaⁱⁱMurang'aⁱⁱ
Kiambu
TurkanaWest Pokot
SamburuTrans-NzoiaUasin Gishu
Elgeyo-MarakwetNandi
BaringoLaikipiaNakuruNarok
KajiadoKerichoBomet
KakamegaVihiga
BungomaBusia
SiayaKisumu
Homa BayMigori
KisiiNyamiraⁱ
Nairobi
Coa
stN
orth
East
ern
East
ern
Cen
tral
Rift
Val
ley
Wes
tern
Nya
nza
0102030405060708090
100

11
National-level Wealth Key Findings The lowest percentage of children with
recent fever who took any ACT is in the wealthiest quintile.
The second quintile has the highest percentage of children with recent fever who took any ACT.
The difference in coverage of any ACT between the wealthiest quintile and poorest quintile is statistically significant.
National-level Education Key Findings Children whose mothers have primary and
secondary levels of education have the highest percentage of any ACT use, compared to children whose mothers have no education.
The difference in any ACT use between children whose mothers have incomplete primary education and no education is statistically significant.
0
10
20
30
40
50
60
70
80
90
100
Poorest Second Middle Fourth Wealthiest
0
10
20
30
40
50
60
70
80
90
100
Noeducation
Incompleteprimary
Completeprimary
Incompletesecondary
Completesecondary
Higher

12
Malaria Diagnostics Among children under age 5 with recent fever, the percentage who had blood taken
from a finger or heel for testing
County-level Key Findings The counties with the highest percentage of
children with recent fever who had blood taken for finger or heel testing are Siaya (61%), Isiolo (61%), Garrisa (52%), and Homa Bay (51%).
The counties with the lowest percentage of finger or heel testing for children with recent fever are Murang’a (4%), Kitui (9%), Lamu (12%), and Nandi (12%).
Regional Key Findings The highest percentage of finger or heel
testing for children with recent fever is in Nyanza at 47%, while the lowest percentage is in Central at 25%.
Western and Coast have a high percentage of finger or heel testing for children with recent fever at 38% and 35%, respectively. The two regions are considered malaria endemic zones.
Nairobi (a malaria low risk zone) has a high percentage of finger or heel testing for children with fever at 36%.
ⁱ Estimate not shown due to insufficient sample size (<25 unweighted cases) ⁱⁱ Estimate is based on 25-49 unweighted cases and should be interpreted with caution
0 20 40 60 80 100
MombasaKwale
KilifiTana River
LamuTaita Taveta
GarissaⁱⁱWajir
ManderaⁱMarsabit
IsioloMeru
Tharaka-NithiEmbuⁱⁱ
KituiMachakosⁱⁱ
Makueni
NyandaruaNyeriⁱⁱ
KirinyagaⁱⁱMurang'aⁱⁱ
Kiambu
TurkanaWest Pokot
SamburuTrans-NzoiaUasin Gishu
Elgeyo-MarakwetNandi
BaringoLaikipiaNakuruNarok
KajiadoKerichoBomet
KakamegaVihiga
BungomaBusia
SiayaKisumu
Homa BayMigori
KisiiNyamiraⁱ
Nairobi
Coa
stN
orth
East
ern
East
ern
Cen
tral
Rift
Val
ley
Wes
tern
Nya
nza
0102030405060708090
100

13
National-level Wealth Key Findings The level of finger or heel testing for
children with fever is highest in the wealthiest quintile and lowest in the poorest quintile at 44% and 30%, respectively.
There is a significant statistical difference between the wealthiest and poorest quintiles.
National-level Education Key Findings Children whose mothers have a secondary
or higher education have a higher percentage of finger or heel testing for fever at 37% and 39%, respectively.
There is no significant statistical difference in finger or heel testing coverage between children whose mothers have no education and mothers who have higher education.
0
10
20
30
40
50
60
70
80
90
100
Poorest Second Middle Fourth Wealthiest
0
10
20
30
40
50
60
70
80
90
100
Noeducation
Incompleteprimary
Completeprimary
Incompletesecondary
Completesecondary
Higher

14
Vitamin A Supplementation Among children age 6-59 months, the percentage given vitamin A supplements
in the last 6 months
County-level Key Findings The percentage of children age 6-59 months
given vitamin A supplements in the 6 months preceding the survey is highest in Laikipia county and lowest in Mandera county with significant variations.
The percentage of children age 6-59 months given vitamin A supplements in the 6 months preceding the survey varies significantly across counties in the North Eastern region.
In most counties the confidence intervals for the point estimates are overlapping showing that the point estimates are not significantly different.
Regional Key Findings The highest percentage of children who
received vitamin A supplements are found in the Central, Western, and Nairobi regions.
North Eastern is the least performing region for this indicator, and is statistically different from the other regions.
0 20 40 60 80 100
MombasaKwale
KilifiTana River
LamuTaita Taveta
GarissaWajir
Mandera
MarsabitIsioloMeru
Tharaka-NithiEmbuKitui
MachakosMakueni
NyandaruaNyeri
KirinyagaMurang'a
Kiambu
TurkanaWest Pokot
SamburuTrans-NzoiaUasin Gishu
Elgeyo-MarakwetNandi
BaringoLaikipiaNakuruNarok
KajiadoKerichoBomet
KakamegaVihiga
BungomaBusia
SiayaKisumu
Homa BayMigori
KisiiNyamira
Nairobi
Coa
stN
orth
East
ern
East
ern
Cen
tral
Rift
Val
ley
Wes
tern
Nya
nza
0102030405060708090
100

15
National-level Wealth Key Findings By wealth quintile, the variation in
percentage of children age 6-59 months given vitamin A supplements in the 6 months preceding the survey are not significantly different.
The percentage of children given vitamin A supplements increases with household wealth.
National-level Residence Key Findings Urban children age 6-59 months receive
higher levels of vitamin A supplements compared to their rural counterparts.
The percentage is significantly lower for rural children compared to urban children.
0
10
20
30
40
50
60
70
80
90
100
Poorest Second Middle Fourth Wealthiest
0
10
20
30
40
50
60
70
80
90
100
Urban Rural

16
Basic Vaccination Coverage Among children age 12-23 months, the percentage fully vaccinated
County-level Key Findings The percentage of children age 12-23
months who have received all basic vaccines is highest in Kirinyaga, Kiambu, and Nandi counties.
The percentage of children age 12-23 months who have received all basic vaccines is lowest in West Pokot, Mandera, and Wajir counties.
Generally, among all counties there is no major statistically significant variation in the percentage of children age 12-23 months who have received all basic vaccines.
Regional Key Findings North Eastern region has the lowest basic
vaccination coverage in Kenya and is significantly lower than all other regions.
Overall, the Central region has the highest percentage of children age 12-23 months who have received all the basic vaccines.
0 20 40 60 80 100
MombasaKwale
KilifiTana River
LamuTaita Taveta
GarissaWajir
Mandera
MarsabitIsioloMeru
Tharaka-NithiEmbuKitui
MachakosMakueni
NyandaruaNyeri
KirinyagaMurang'a
Kiambu
TurkanaWest Pokot
SamburuTrans-NzoiaUasin Gishu
Elgeyo-MarakwetNandi
BaringoLaikipiaNakuruNarok
KajiadoKerichoBomet
KakamegaVihiga
BungomaBusia
SiayaKisumu
Homa BayMigori
KisiiNyamira
Nairobi
Coa
stN
orth
East
ern
East
ern
Cen
tral
Rift
Val
ley
Wes
tern
Nya
nza
0102030405060708090
100

17
National-level Wealth Key Findings Generally, the percentage of children age
12-23 months who have received all basic vaccines increases with increased household wealth.
The point estimates for basic vaccination coverage do not show significant variation among the four upper wealth quintiles.
National-level Residence Key Findings There is significant variation in the
percentage of children age 12-23 months who have received all basic vaccines in rural and urban areas, with urban areas having higher basic vaccination coverage.
0
10
20
30
40
50
60
70
80
90
100
Poorest Second Middle Fourth Wealthiest
0
10
20
30
40
50
60
70
80
90
100
Urban Rural

18
HIV Counselling during ANC Among women age 15-49 who gave birth in the two years preceding the survey, the
percentage who received counselling on HIV during ANC
County-level Key Findings The percentage of women who have
received counselling on HIV during ANC varies from county to county. The lowest percentage of women who have received counselling is in Marsabit (16%), Wajir (18%), and Mandera (20%), while the highest is in Migori (88%), Kisii (87%), and Mombasa (85%), and Nairobi (85%).
The variation between women who have received counselling in three counties—Wajir, Mandera, and Marsabit—and other counties is statistically significant.
Regional Key Findings The percentage of women who have
received counselling on HIV during ANC varies from region to region. The lowest percentage of women is in North Eastern (29%) while the highest is in Nairobi, Nyanza, and Western, ranging from 74% to 85%.
There is a significant difference between the percentage of women who have received HIV counselling during ANC in North Eastern compared to other regions.
0 20 40 60 80 100
MombasaKwale
KilifiTana River
LamuTaita Taveta
GarissaWajir
Mandera
MarsabitIsioloMeru
Tharaka-NithiEmbuKitui
MachakosMakueni
NyandaruaNyeri
KirinyagaMurang'a
Kiambu
TurkanaWest Pokot
SamburuTrans-NzoiaUasin Gishu
Elgeyo-MarakwetNandi
BaringoLaikipiaNakuruNarok
KajiadoKerichoBomet
KakamegaVihiga
BungomaBusia
SiayaKisumu
Homa BayMigori
KisiiNyamira
Nairobi
Coa
stN
orth
East
ern
East
ern
Cen
tral
Rift
Val
ley
Wes
tern
Nya
nza
0102030405060708090
100

19
National-level Wealth Key Findings The percentage of women who have
received HIV counselling during ANC varies by wealth quintile. Women in the poorest quintile (53%) are less likely to have received HIV counselling during ANC than women in the wealthiest quintile (80%).
The difference between women in the poorest quintile is significantly different from other wealth quintiles.
National-level Age Group Key Findings HIV counselling coverage differs with age.
HIV counselling during ANC increases with age up to age 30-34 where it is highest at 70%.
The differences observed across age groups are not statistically significant.
0
10
20
30
40
50
60
70
80
90
100
Poorest Second Middle Fourth Wealthiest
0
10
20
30
40
50
60
70
80
90
100
15-19 20-24 25-29 30-34 35-39 40-44 45-49

20
HIV Counselling and Testing during Pregnancy Among women age 15-49 who gave birth in the two years preceding the survey, the percentage who received counselling on HIV and an HIV test during ANC, and the
results
County-level Key Findings The percentage of women who have
received HIV counselling, testing, and their results during ANC ranges from 16% in Marsabit county to 86% in Migori and Kisii counties.
There is a significant difference in HIV counselling, testing and receiving the results between women in northern counties (Marsabit, Wajir, and Mandera) compared with women in most other counties such as Migori, Kisii, Mombasa, and Nairobi.
A woman in Migori or Kisii is five times more likely to be counselled on HIV, tested and given their result during ANC compared to a woman Marsabit or Mandera.
Regional Key Findings The percentage of women who have
received HIV counselling, testing, and their results during ANC varies from region to region. The lowest percentage is in North Eastern (27%), while the highest is in Western, Nyanza, and Nairobi, ranging from 74% to 85%.
There is a significant difference in HIV counselling, testing, and receiving results between women in the North Eastern region compared with women in all other regions.
0 20 40 60 80 100
MombasaKwale
KilifiTana River
LamuTaita Taveta
GarissaWajir
Mandera
MarsabitIsioloMeru
Tharaka-NithiEmbuKitui
MachakosMakueni
NyandaruaNyeri
KirinyagaMurang'a
Kiambu
TurkanaWest Pokot
SamburuTrans-NzoiaUasin Gishu
Elgeyo-MarakwetNandi
BaringoLaikipiaNakuruNarok
KajiadoKerichoBomet
KakamegaVihiga
BungomaBusia
SiayaKisumu
Homa BayMigori
KisiiNyamira
Nairobi
Coa
stN
orth
East
ern
East
ern
Cen
tral
Rift
Val
ley
Wes
tern
Nya
nza
0102030405060708090
100

21
National-level Wealth Key Findings Coverage of HIV counselling, testing, and
receiving results during ANC varies by wealth. Women in the poorest quintile are less likely (52%) to have received counselling, testing, and their results than women in the wealthiest quintile (79%).
The variation between women in the poorest quintile and other quintiles is significantly different.
National-level Women’s Age Group Key Findings HIV counselling, testing, and receiving
results during ANC differs across different age groups in Kenya.
The difference is not statistically significant.
0
10
20
30
40
50
60
70
80
90
100
Poorest Second Middle Fourth Wealthiest
0
10
20
30
40
50
60
70
80
90
100
15-19 20-24 25-29 30-34 35-39 40-44 45-49

22
Prevalence of Fever Percentage of children under age 5 who had fever in the two weeks preceding the
survey
County-level Key Findings The percentage of children who had fever in
the two weeks preceding the survey is lowest in Mandera county (5%) and highest in Vihiga county (49%).
Within Nyanza region, there is a significant difference between the percentage of children with fever in Nyamira county compared with the other counties.
Regional Key Findings The prevalence of fever among children
under age 5 is higher in Nyanza and Western regions compared to other regions.
The percentage of children under age 5 with fever in the North Eastern region is significantly different from other regions.
0 20 40 60 80 100
MombasaKwale
KilifiTana River
LamuTaita Taveta
GarissaWajir
Mandera
MarsabitIsioloMeru
Tharaka-NithiEmbuKitui
MachakosMakueni
NyandaruaNyeri
KirinyagaMurang'a
Kiambu
TurkanaWest Pokot
SamburuTrans-NzoiaUasin Gishu
Elgeyo-MarakwetNandi
BaringoLaikipiaNakuruNarok
KajiadoKerichoBomet
KakamegaVihiga
BungomaBusia
SiayaKisumu
Homa BayMigori
KisiiNyamira
Nairobi
Coa
stN
orth
East
ern
East
ern
Cen
tral
Rift
Val
ley
Wes
tern
Nya
nza
0102030405060708090
100

23
National-level Wealth Key Findings The prevalence of fever is lowest among
children in the wealthiest quintile (18%) and highest among children in the second quintile (29%).
There is a significant difference in the percentage of children with fever in the wealthiest quintile compared to other quintiles.
National-level Children’s Age Group Key Findings The prevalence of fever is lowest among
children under 6 months (17%) and highest among children age 6-11 months (31%).
There is a significant difference in the prevalence of fever between children under 6 months and children age 6-11 months.
0
10
20
30
40
50
60
70
80
90
100
Poorest Second Middle Fourth Wealthiest
0
10
20
30
40
50
60
70
80
90
100
<6 6-11 12-23 24-35 36-47 48-59

24
Treatment Seeking for Children with Fever Among children under age 5 with recent fever, the percentage for whom advice or
treatment was sought from a health facility or provider
County-level Key Findings In the Coast region, there is a significant
difference between the percentage of children with fever who are taken to a health facility/provider in Mombasa and Lamu counties.
In the Rift Valley region, there is a significant difference between the percentage of children with fever who are taken to a health facility/provider in Baringo and Nandi counties.
Regional Key Findings The percentage of children with fever who
are taken to health facility/provider is lowest in North Eastern (50%) and Western (52%) regions.
ⁱ Estimate not shown due to insufficient sample size (<25 unweighted cases) ⁱⁱ Estimate is based on 25-49 unweighted cases and should be interpreted with caution
0 20 40 60 80 100
MombasaKwale
KilifiTana River
LamuTaita Taveta
GarissaⁱⁱWajir
ManderaⁱMarsabit
IsioloMeru
Tharaka-NithiEmbuⁱⁱ
KituiMachakosⁱⁱ
Makueni
NyandaruaNyeriⁱⁱ
KirinyagaⁱⁱMurang'aⁱⁱ
Kiambu
TurkanaWest Pokot
SamburuTrans-NzoiaUasin Gishu
Elgeyo-MarakwetNandi
BaringoLaikipiaNakuruNarok
KajiadoKerichoBomet
KakamegaVihiga
BungomaBusia
SiayaKisumu
Homa BayMigori
KisiiNyamira
Nairobi
Coa
stN
orth
East
ern
East
ern
Cen
tral
Rift
Val
ley
Wes
tern
Nya
nza
0102030405060708090
100

25
National-level Wealth Key Findings There is no significant difference in the
percentage of children with fever who are taken to a health facility/provider across wealth quintiles.
National-level Education Key Findings The percentage of children with fever who
are taken to health facility/provider increases with increases in mother’s education level.
There is no significant difference in the percentage of children with fever who are taken to a health facility/provider between educated and non-educated mothers.
0
10
20
30
40
50
60
70
80
90
100
Poorest Second Middle Fourth Wealthiest
01020
30405060708090
100
No education Primaryincomplete
Primarycomplete
Secondary+

26
Teenage Childbearing Among young women age 15-19, the percentage who have had a live birth or are
pregnant with their first child
County-level Key Findings Early childbearing varies across counties in
Kenya. Narok county has the highest percentage of adolescent mothers age 15-19 (40%) followed by Homa Bay (33%), while Murang'a and Nyeri have the lowest at (6%) and (7%), respectively.
In some regions such as Rift Valley, there are significant differences by county in adolescent childbearing. For example, teenage childbearing is significantly different in Narok and Elgayo-Markwet.
Regional Key Findings The prevalence of adolescent childbearing
varies by region. Nyanza region has the highest percentage of adolescent mothers at 22%, while Central region has the lowest (10%).
There is no significant difference in adolescent childbearing by region.
0 20 40 60 80 100
MombasaKwale
KilifiTana River
LamuTaita Taveta
GarissaWajir
Mandera
MarsabitIsioloMeru
Tharaka-NithiEmbuKitui
MachakosMakueni
NyandaruaNyeri
KirinyagaMurang'a
Kiambu
TurkanaWest Pokot
SamburuTrans-NzoiaUasin Gishu
Elgeyo-MarakwetNandi
BaringoLaikipiaNakuruNarok
KajiadoKerichoBomet
KakamegaVihiga
BungomaBusia
SiayaKisumu
Homa BayMigori
KisiiNyamira
Nairobi
Coa
stN
orth
East
ern
East
ern
Cen
tral
Rift
Val
ley
Wes
tern
Nya
nza
0102030405060708090
100

27
National-level Wealth Key Findings Among adolescent women age 15-19 in
Kenya, 18% have started childbearing. There is a significant difference in teenage childbearing between the poorest and wealthiest quintiles.
National-level Education Key Findings Adolescent childbearing varies across
education level.
In Kenya, adolescent women who have completed primary education have the highest percentage of adolescent childbearing.
There is a significant difference in adolescent childbearing between young women with incomplete primary education compared to women with primary complete education.
0
10
20
30
40
50
60
70
80
90
100
Poorest Second Middle Fourth Wealthiest
0102030405060708090
100
No education Primaryincomplete
Primarycomplete
Secondary+

28
Modern Methods of Family Planning Among currently married women age 15-49, the percentage currently using a
modern contraceptive method
County-level Key Findings Modern contraceptive use varies across
counties.
Kirinyiga county has the highest modern contraceptive use among married women (76%), while Madera has the lowest (2%).
There is a significant difference in modern contraceptive use in some counties within the same region such as Eastern and Rift Valley.
Regional Key Findings The modern contraceptive prevalence rate
(mCPR) among married women is 53%. The Central region has the highest mCPR (67%), while North Eastern region has the lowest (3%).
0 20 40 60 80 100
MombasaKwale
KilifiTana River
LamuTaita Taveta
GarissaWajir
Mandera
MarsabitIsioloMeru
Tharaka-NithiEmbuKitui
MachakosMakueni
NyandaruaNyeri
KirinyagaMurang'a
Kiambu
TurkanaWest Pokot
SamburuTrans-NzoiaUasin Gishu
Elgeyo-MarakwetNandi
BaringoLaikipiaNakuruNarok
KajiadoKerichoBomet
KakamegaVihiga
BungomaBusia
SiayaKisumu
Homa BayMigori
KisiiNyamira
Nairobi
Coa
stN
orth
East
ern
East
ern
Cen
tral
Rift
Val
ley
Wes
tern
Nya
nza
0102030405060708090
100

29
National-level Wealth Key Findings Modern contraceptive use varies across
wealth quintiles.
Married women in the poorest quintile are less likely to use modern contraceptives, compared to women in the other quintiles.
National-level Age Key Findings Modern contraceptive use is high among
women age 25-39 years.
Modern contraceptive use is low among adolescent and older women.
0
10
20
30
40
50
60
70
80
90
100
Poorest Second Middle Fourth Wealthiest
0
10
20
30
40
50
60
70
80
90
100
15-19 20-24 25-29 30-34 35-39 40-44 45-49

30
Short Birth Intervals Among non-first births in the five years preceding the survey, the percentage with a
short preceding birth interval (<24 months)
County-level Key Findings Birth spacing intervals among non-first births
vary across counties.
Garissa county in North Eastern region has the highest percentage of birth intervals less than 24 months (37%), while Kirinyaga county (5%) has the lowest.
There are no significant differences in the percentage of short birth intervals less than 24 months across the counties.
Regional Key Findings The percentage of short birth intervals less
than 24 months in Kenya among non-first births is 18%. Short birth spacing is highest among non-first births in North Eastern region (34%) and lowest in Central region (11%).
0 20 40 60 80 100
MombasaKwale
KilifiTana River
LamuTaita Taveta
GarissaWajir
Mandera
MarsabitIsioloMeru
Tharaka-NithiEmbuKitui
MachakosMakueni
NyandaruaNyeri
KirinyagaMurang'a
Kiambu
TurkanaWest Pokot
SamburuTrans-NzoiaUasin Gishu
Elgeyo-MarakwetNandi
BaringoLaikipiaNakuruNarok
KajiadoKerichoBomet
KakamegaVihiga
BungomaBusia
SiayaKisumu
Homa BayMigori
KisiiNyamira
Nairobi
Coa
stN
orth
East
ern
East
ern
Cen
tral
Rift
Val
ley
Wes
tern
Nya
nza
0102030405060708090
100
31
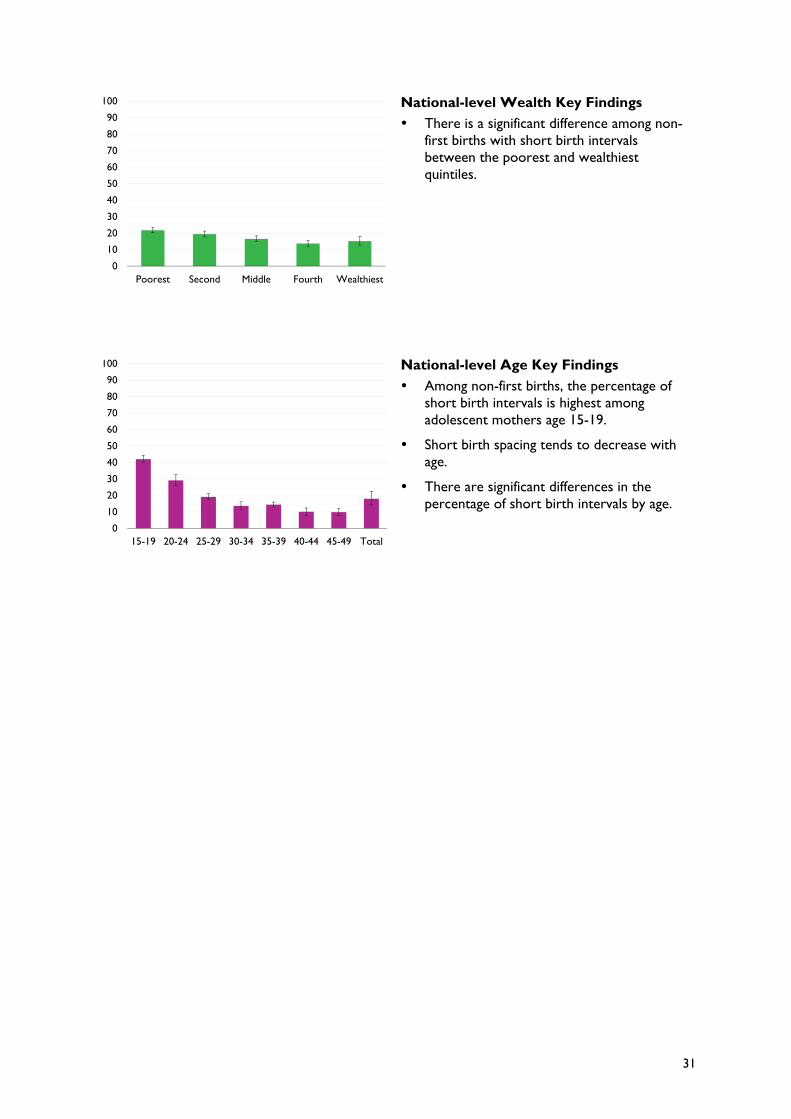
National-level Wealth Key Findings There is a significant difference among non-
first births with short birth intervals between the poorest and wealthiest quintiles.
National-level Age Key Findings Among non-first births, the percentage of
short birth intervals is highest among adolescent mothers age 15-19.
Short birth spacing tends to decrease with age.
There are significant differences in the percentage of short birth intervals by age.
0
10
20
30
40
50
60
70
80
90
100
Poorest Second Middle Fourth Wealthiest
0
10
20
30
40
50
60
70
80
90
100
15-19 20-24 25-29 30-34 35-39 40-44 45-49 Total

32
Health Facility Deliveries Among live births in the five years preceding the survey, the percentage
delivered in a health facility
County-level Key Findings Kiambu and Kirinyaga counties record the
highest percentage of health facility deliveries at 93% each.
Wajir has the lowest percentage of health facility deliveries at 18%.
There is a statistically significant difference between the counties in Central region and North Eastern region. However, there is no statistical difference in counties within Central region.
Regional Key Findings Nairobi and Central regions have higher
percentages of health facility deliveries compared to other regions at 89% and 90%, respectively.
North Eastern region records the lowest percentage of health facility deliveries at 29%.
There is a significant difference in the percentage of health facility deliveries in North Eastern region compared to the other regions.
0 20 40 60 80 100
MombasaKwale
KilifiTana River
LamuTaita Taveta
GarissaWajir
Mandera
MarsabitIsioloMeru
Tharaka-NithiEmbuKitui
MachakosMakueni
NyandaruaNyeri
KirinyagaMurang'a
Kiambu
TurkanaWest Pokot
SamburuTrans-NzoiaUasin Gishu
Elgeyo-MarakwetNandi
BaringoLaikipiaNakuruNarok
KajiadoKerichoBomet
KakamegaVihiga
BungomaBusia
SiayaKisumu
Homa BayMigori
KisiiNyamira
Nairobi
Coa
stN
orth
East
ern
East
ern
Cen
tral
Rift
Val
ley
Wes
tern
Nya
nza
0102030405060708090
100

33
National-level Wealth Key Findings Wealth is directly proportional to health
facility deliveries with more than 90% of births from the wealthiest quintile delivered in a health facility compared to only 30% from the poorest quintile.
National-level ANC Key Findings Health facility delivery is proportional to the
number of ANC visits. Only 18% of women with no ANC visits delivered in a health facility, compared to 75% among women who had 4 or more ANC visits.
0
10
20
30
40
50
60
70
80
90
100
Poorest Second Middle Fourth Wealthiest
0
10
20
30
40
50
60
70
80
90
100
None 1 to 3 visits 4+ visit

34
Assistance during Delivery Among live births in the five years preceding the survey, the percentage delivered by a
skilled provider (doctor, nurse, or midwife)
County-level Key Findings In more than half of counties, coverage of
deliveries by skilled birth attendants (SBAs) is less than the national average of 62%.
There are regional disparities in coverage of deliveries by a SBA. Counties in the Central region have higher percentages, compared to counties in the North Eastern region.
Regional Key Findings The Central region reports the highest
percentage of deliveries by a SBA at 90%, while the North Eastern region reports the lowest at 32%.
0 20 40 60 80 100
MombasaKwale
KilifiTana River
LamuTaita Taveta
GarissaWajir
Mandera
MarsabitIsioloMeru
Tharaka-NithiEmbuKitui
MachakosMakueni
NyandaruaNyeri
KirinyagaMurang'a
Kiambu
TurkanaWest Pokot
SamburuTrans-NzoiaUasin Gishu
Elgeyo-MarakwetNandi
BaringoLaikipiaNakuruNarok
KajiadoKerichoBomet
KakamegaVihiga
BungomaBusia
SiayaKisumu
Homa BayMigori
KisiiNyamira
Nairobi
Coa
stN
orth
East
ern
East
ern
Cen
tral
Rift
Val
ley
Wes
tern
Nya
nza
0102030405060708090
100

35
National-level Wealth Key Findings Wealth is directly proportional to deliveries
by a SBA. Only 31% of deliveries in the poorest quintile are delivered by a SBA, compared to 93% in the wealthiest quintile.
National-level Age Key Findings Among women age 20-34 years, 63% of
deliveries are delivered by a SBA.
There is no significant difference between the percentage of deliveries assisted by a SBA between women age 20-34 and women less than 19 years.
0
10
20
30
40
50
60
70
80
90
100
Poorest Second Middle Fourth Wealthiest
01020
30405060708090
100
<19 years oryounger
20-34 years 35-49 years

36
Prevalence of Diarrhoea Percentage of children under age 5 who had diarrhoea in the
two weeks preceding the survey
County-level Key Findings Prevalence of diarrhoea ranges from 3% to
28%.
Diarrhoea prevalence is highest among children in Migori county (28%) and lowest in Nyamira and Mandera (3% each). The difference between Migori and the two counties with the lowest prevalence is statistically significant.
Regional Key Findings The highest diarrhoea prevalence is in the
Western region (20%) and the lowest in the North Eastern region (8%). The results are statistically significant.
Coast, Nyanza, Western, and Nairobi regions have a prevalence of diarrhoea greater than 15%.
Only North Eastern region has diarrhoea prevalence below 10%.
0 20 40 60 80 100
MombasaKwale
KilifiTana River
LamuTaita Taveta
GarissaWajir
Mandera
MarsabitIsioloMeru
Tharaka-NithiEmbuKitui
MachakosMakueni
NyandaruaNyeri
KirinyagaMurang'a
Kiambu
TurkanaWest Pokot
SamburuTrans-NzoiaUasin Gishu
Elgeyo-MarakwetNandi
BaringoLaikipiaNakuruNarok
KajiadoKerichoBomet
KakamegaVihiga
BungomaBusia
SiayaKisumu
Homa BayMigori
KisiiNyamira
Nairobi
Coa
stN
orth
East
ern
East
ern
Cen
tral
Rift
Val
ley
Wes
tern
Nya
nza
0102030405060708090
100

37
National-level Wealth Key Findings Diarrhoea prevalence is highest in the
poorest and second quintiles (17% each) and lowest in the wealthiest quintile (11%).
Diarrhoea prevalence reduces with increases in wealth.
There is no significant difference between the first four quintiles.
National-level Education Key Findings The highest diarrhoea prevalence is among
children whose mothers have incomplete primary education (18%).
There is no correlation between mother's education and prevalence of diarrhoea among children.
The differences among the four education strata are not statistically significant.
0
10
20
30
40
50
60
70
80
90
100
Poorest Second Middle Fourth Wealthiest
0102030405060708090
100
No education Primaryincomplete
Primarycomplete
Secondary +
38
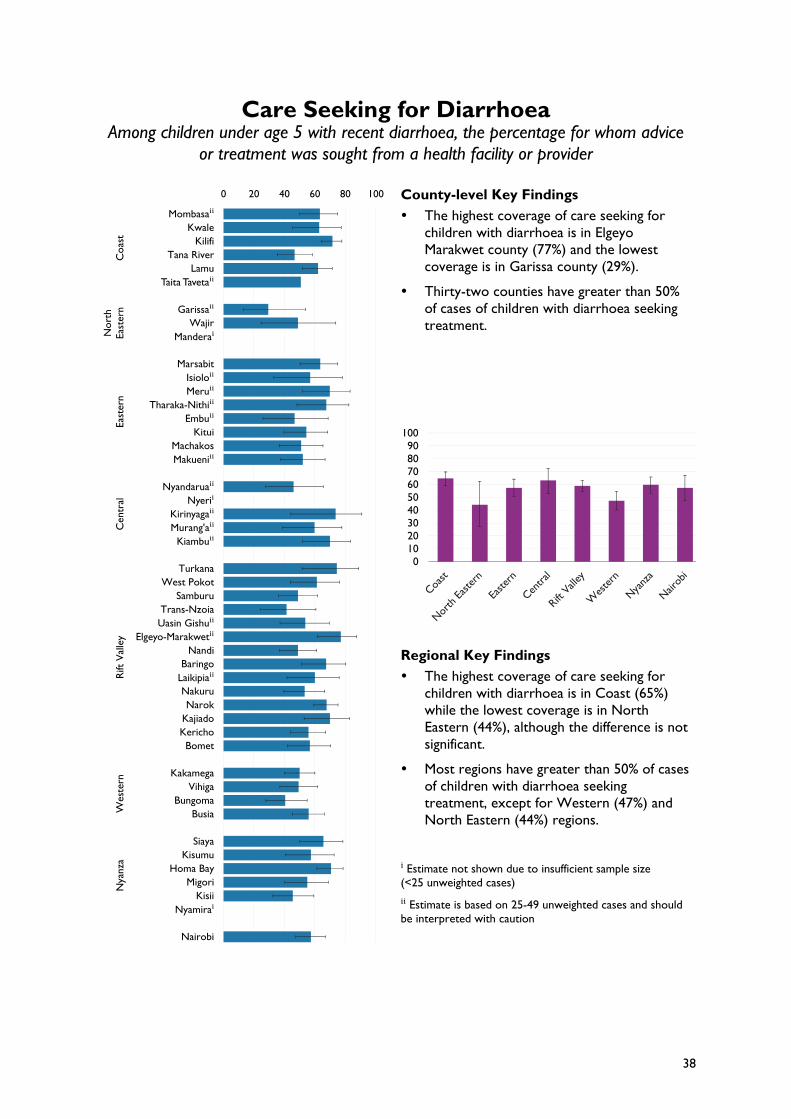
Care Seeking for Diarrhoea Among children under age 5 with recent diarrhoea, the percentage for whom advice
or treatment was sought from a health facility or provider
County-level Key Findings The highest coverage of care seeking for
children with diarrhoea is in Elgeyo Marakwet county (77%) and the lowest coverage is in Garissa county (29%).
Thirty-two counties have greater than 50% of cases of children with diarrhoea seeking treatment.
Regional Key Findings The highest coverage of care seeking for
children with diarrhoea is in Coast (65%) while the lowest coverage is in North Eastern (44%), although the difference is not significant.
Most regions have greater than 50% of cases of children with diarrhoea seeking treatment, except for Western (47%) and North Eastern (44%) regions.
ⁱ Estimate not shown due to insufficient sample size (<25 unweighted cases) ⁱⁱ Estimate is based on 25-49 unweighted cases and should be interpreted with caution
0 20 40 60 80 100
MombasaⁱⁱKwale
KilifiTana River
LamuTaita Tavetaⁱⁱ
GarissaⁱⁱWajir
ManderaⁱMarsabit
IsioloⁱⁱMeruⁱⁱ
Tharaka-NithiⁱⁱEmbuⁱⁱ
KituiMachakosMakueniⁱⁱ
NyandaruaⁱⁱNyeriⁱ
KirinyagaⁱⁱMurang'aⁱⁱ
KiambuⁱⁱTurkana
West PokotSamburu
Trans-NzoiaUasin Gishuⁱⁱ
Elgeyo-MarakwetⁱⁱNandi
BaringoLaikipiaⁱⁱNakuruNarok
KajiadoKerichoBomet
KakamegaVihiga
BungomaBusia
SiayaKisumu
Homa BayMigori
KisiiNyamiraⁱ
Nairobi
Coa
stN
orth
East
ern
East
ern
Cen
tral
Rift
Val
ley
Wes
tern
Nya
nza
0102030405060708090
100

39
National-level Wealth Key Findings Among children in the poorest quintile, 61%
of children with diarrhoea sought treatment , while 56% sought care in the wealthiest quintile.
The differences among quintiles are not statistically significant.
National-level Education Key Findings The highest coverage of care seeking for
children with diarrhoea is among children whose mothers have no education (63%), while the lowest coverage is among children whose mothers have completed primary education (54%).
There is no significant difference in care seeking for children with diarrhoea by mother's education.
0
10
20
30
40
50
60
70
80
90
100
Poorest Second Middle Fourth Wealthiest
0102030405060708090
100
No education Primaryincomplete
Primarycomplete
Secondary +

40
Diarrhoea Treatment Among children under age 5 with recent diarrhoea, percentage given
oral rehydration solution (ORS)
County-level Key Findings Homa Bay county has the highest (71%) and
West Pokot has the lowest (22%) uptake of ORS among children with diarrhoea.
More than a half of counties (24 counties) have ORS uptake of less than or equal to 50% among children with diarrhoea.
ORS treatment for diarrhoea varies within and between regions.
Regional Key Findings ORS uptake among children with diarrhoea
ranges from 46% in Western to 63% in both Nairobi and Coast. The differences are statistically significant.
Only two regions, Western and Eastern, have less than 50% ORS uptake among children with diarrhoea.
ⁱ Estimate not shown due to insufficient sample size (<25 unweighted cases) ⁱⁱ Estimate is based on 25-49 unweighted cases and should be interpreted with caution
0 20 40 60 80 100
MombasaⁱⁱKwale
KilifiTana River
LamuTaita Tavetaⁱⁱ
GarissaⁱⁱWajir
ManderaⁱMarsabit
IsioloⁱⁱMeruⁱⁱ
Tharaka-NithiⁱⁱEmbuⁱⁱ
KituiMachakosMakueniⁱⁱ
NyandaruaⁱⁱNyeriⁱ
KirinyagaⁱⁱMurang'aⁱⁱ
KiambuⁱⁱTurkana
West PokotSamburu
Trans-NzoiaUasin Gishuⁱⁱ
Elgeyo-MarakwetⁱⁱNandi
BaringoLaikipiaⁱⁱNakuruNarok
KajiadoKerichoBomet
KakamegaVihiga
BungomaBusia
SiayaKisumu
Homa BayMigori
KisiiNyamiraⁱ
Nairobi
Coa
stN
orth
East
ern
East
ern
Cen
tral
Rift
Val
ley
Wes
tern
Nya
nza
0102030405060708090
100

41
National-level Wealth Key Findings The uptake of ORS is highest in the middle,
fourth, and wealthiest quintiles (55% each) and lowest in the poorest quintile (52%).
There is no significant difference between the uptake of ORS and wealth quintiles among children with diarrhoea.
National-level Education Key Findings The uptake of ORS ranges from 52% among
children whose mothers have no education and primary incomplete to 58% among children whose mothers have secondary+ education.
The difference in mother’s education level is not statistically significant.
Generally, ORS uptake increases with an increase in mother’s level of education.
0
10
20
30
40
50
60
70
80
90
100
Poorest Second Middle Fourth Wealthiest
01020
30405060708090
100
No education Primaryincomplete
Primarycomplete
Secondary +

42
Four or More ANC Visits Among women age 15-49 who had a live birth in the five years preceding the survey, the
percentage who had 4 or more antenatal care (ANC) visits during pregnancy for their most recent birth
County-level Key Findings The county with the highest coverage of 4+
ANC visits is Nairobi (73%), while the county with the lowest is West Pokot (18%).
Counties in Coast and Central regions have more than 50% of pregnant women attending 4+ ANC visits.
West Pokot and Mandera counties have the greatest need for 4+ ANC visit interventions.
Regional Key Findings The region with the lowest percentage of
pregnant women completing 4+ ANC visits is North Eastern (37%), while the region with the highest is Nairobi (73%).
Rift Valley and Western are similar regions while Coast, Central, Eastern, and Nyanza regions also show insignificant differences due to overlapping confidence intervals.
0 20 40 60 80 100
MombasaKwale
KilifiTana River
LamuTaita Taveta
GarissaWajir
Mandera
MarsabitIsioloMeru
Tharaka-NithiEmbuKitui
MachakosMakueni
NyandaruaNyeri
KirinyagaMurang'a
Kiambu
TurkanaWest Pokot
SamburuTrans-NzoiaUasin Gishu
Elgeyo-MarakwetNandi
BaringoLaikipiaNakuruNarok
KajiadoKerichoBomet
KakamegaVihiga
BungomaBusia
SiayaKisumu
Homa BayMigori
KisiiNyamira
Nairobi
Coa
stN
orth
East
ern
East
ern
Cen
tral
Rift
Val
ley
Wes
tern
Nya
nza
0102030405060708090
100

43
National-level Wealth Key Findings There is a significant difference in 4+ ANC
visits between the poorest and the two highest wealth quintiles.
Women in the wealthiest quintile have a much higher likelihood of attending 4+ ANC visits.
National-level Residence Key Findings The percentage of urban residents
completing 4+ ANC visits is higher than the percentage among rural residents.
There is a statically significant difference in the percentage of women completing 4+ ANC visits between urban and rural areas.
0
10
20
30
40
50
60
70
80
90
100
Poorest Second Middle Fourth Wealthiest
0
10
20
30
40
50
60
70
80
90
100
Urban Rural

44
ANC Visits within the First Trimester Among women age 15-49 who attended at least one ANC visit for their most recent live birth in
the five years preceding the survey, the percentage whose first visit occurred during the first trimester (before month 4)
County-level Key Findings Less than 30% of pregnant women access
ANC within the first trimester, ranging from 5% to 30% across the 47 counties.
The greatest need for early ANC within the first trimester is found in West Pokot, Nandi, and Wajir, while the best performing counties include Nairobi, Migori, and Kisumu ranging from 25% to 30%.
The observed differences across all counties are not statistically significant given that almost all confidence intervals overlap, which is attributable to the small sample sizes.
Regional Key Findings There are regional differences in attendance
of ANC within the first trimester. North Eastern and Rift Valley are the lowest performing, while Nairobi and Central regions are the highest performing.
However, there are minimal differences across the eight regions due to their overlapping confidence intervals.
0 20 40 60 80 100
MombasaKwale
KilifiTana River
LamuTaita Taveta
GarissaWajir
Mandera
MarsabitIsioloMeru
Tharaka-NithiEmbuKitui
MachakosMakueni
NyandaruaNyeri
KirinyagaMurang'a
Kiambu
TurkanaWest Pokot
SamburuTrans-NzoiaUasin Gishu
Elgeyo-MarakwetNandi
BaringoLaikipiaNakuruNarok
KajiadoKerichoBomet
KakamegaVihiga
BungomaBusia
SiayaKisumu
Homa BayMigori
KisiiNyamira
Nairobi
Coa
stN
orth
East
ern
East
ern
Cen
tral
Rift
Val
ley
Wes
tern
Nya
nza
0102030405060708090
100

45
National-level Wealth Key Findings There is a significant difference in ANC
attendance within the first trimester between the poorest and the two wealthiest quintiles.
Women from the wealthiest households have a much higher likelihood of attending ANC within the first trimester.
National-level Residence Key Findings More pregnant women in urban settings
attend ANC within the first trimester than rural women.
There is a statistically significant difference in ANC attendance within the first trimester between urban and rural residents.
0
10
20
30
40
50
60
70
80
90
100
Poorest Second Middle Fourth Wealthiest
0
10
20
30
40
50
60
70
80
90
100
Urban Rural


APPENDIX TABLES 47
Appendix Tables
Table A1 Percentage of households with at least 1 insecticide-treated mosquito net (ITN) by county, Kenya 2014 County % 95% LB 95% UB N
Coast Mombasa 56.9 52.3 61.3 1,245 Kwale 81 74.4 86.2 704 Kilifi 73.1 68.3 77.4 999 Tana River 65.3 57.4 72.4 210 Lamu 71.1 63.7 77.6 104 Taita Taveta 80.4 75.5 84.5 307
North Eastern Garissa 61.1 53.3 68.3 265 Wajir 53.6 43 63.8 242 Mandera 28.7 20.5 38.5 217
Eastern Marsabit 24.7 19.7 30.5 146 Isiolo 62.7 55.6 69.2 122 Meru 53.5 47 59.9 1,406 Tharaka-Nithi 67.2 62.6 71.5 379 Embu 55.9 50.2 61.4 548 Kitui 61.1 55.6 66.3 856 Machakos 56 48.3 63.5 1,088 Makueni 55.3 48.9 61.6 717
Central Nyandarua 12.5 9.1 17 593 Nyeri 19.7 16.5 23.4 792 Kirinyaga 68.5 62 74.4 622 Murang’a 43.7 39.6 47.8 968 Kiambu 39.9 33.2 46.9 2,037
Rift Valley Turkana 46.2 37.7 54.9 448 West Pokot 60.2 52.6 67.4 319 Samburu 18.8 12.4 27.3 146 Trans-Nzoia 70.6 64.8 75.7 814 Uasin Gishu 72 67.3 76.3 962 Elgeyo Marakwet 21.9 18 26.3 301 Nandi 78.8 74.2 82.8 671 Baringo 59.8 52.6 66.5 391 Laikipia 17.5 13.2 22.7 406 Nakuru 37.7 30.9 45 1,950 Narok 52.2 44.3 60 752 Kajiado 49.8 43 56.7 770 Kericho 79.5 75.3 83.2 589 Bomet 77.6 71.9 82.4 732
Western Kakamega 78.8 75.2 82.1 1,350 Vihiga 82.9 79.6 85.7 446 Bungoma 82.9 79.7 85.6 1,180 Busia 83.9 79.3 87.6 628
Nyanza Siaya 78.8 74 82.9 725 Kisumu 87.6 84.3 90.3 943 Homa Bay 74.3 69.4 78.6 877 Migori 74.6 70.3 78.5 701 Kisii 86.1 83 88.8 904 Nyamira 84.5 79.9 88.1 409
Nairobi 43.3 38.3 48.5 4,451
Total 58.7 57.5 59.8 36,430
APPENDIX TABLES 48
Table A2 Percentage of household population that slept under an ITN the previous night by county, Kenya 2014 County % 95% LB 95% UB N
Coast Mombasa 46.2 39.4 53.1 3,487 Kwale 64 57.4 70.1 2,953 Kilifi 55.6 49.9 61.1 4,782 Tana River 44.6 37.6 51.9 975 Lamu 53.1 44.3 61.7 414 Taita Taveta 67 60.6 72.8 971
North Eastern Garissa 41.3 34.1 49 1,450 Wajir 30.2 21.9 40 1,349 Mandera 16.3 11.9 21.9 1,177
Eastern Marsabit 7.1 4.3 11.5 636 Isiolo 40.8 34.3 47.7 510 Meru 39.1 33.4 45.2 4,924 Tharaka-Nithi 47 43.1 51.1 1,308 Embu 37.4 30.8 44.6 1,875 Kitui 30.8 23.9 38.8 3,714 Machakos 42.8 37.9 47.7 4,098 Makueni 33.1 28.5 38 3,111
Central Nyandarua 5.2 3.3 8 2,115 Nyeri 9.3 7.3 11.8 2,419 Kirinyaga 60.7 55.1 65.9 1,853 Murang’a 31.1 27.3 35.2 3,186 Kiambu 28.6 22.7 35.2 6,350
Rift Valley Turkana 15.3 10.9 21 1,835 West Pokot 27.7 20.8 35.9 1,594 Samburu 11.7 7 18.9 623 Trans-Nzoia 46.3 38.1 54.6 3,694 Uasin Gishu 55.5 51.2 59.7 3,496 Elgeyo Marakwet 11.5 8.2 15.9 1,195 Nandi 45.5 41 50.1 2,947 Baringo 35.7 29 42.9 1,556 Laikipia 10.3 7.3 14.3 1,470 Nakuru 23.5 18.5 29.3 6,490 Narok 27 21.3 33.7 3,218 Kajiado 33 26.5 40.2 2,552 Kericho 47.6 43.4 51.9 2,409 Bomet 48.5 44.7 52.3 3,172
Western Kakamega 54.3 50.9 57.7 5,597 Vihiga 58.5 55.3 61.7 1,949 Bungoma 57.6 53 62.2 5,738 Busia 62.8 58.7 66.6 2,834
Nyanza Siaya 57.4 54.2 60.6 2,890 Kisumu 70.3 65.2 75 3,685 Homa Bay 50.7 45 56.3 4,005 Migori 49.5 45.9 53.1 3,346 Kisii 71.3 67 75.3 3,759 Nyamira 66.5 61.8 70.8 1,548
Nairobi 37.3 32.9 42 12,524
Total 42.4 41.4 43.5 137,780

APPENDIX TABLES 49
Table A3 Percentage of children under age 5 who slept under an ITN the previous night by county, Kenya 2014 County % 95% LB 95% UB N
Coast Mombasa 61.5 53.3 69.1 477 Kwale 72.4 65.7 78.2 421 Kilifi 63.6 58.4 68.6 759 Tana River 57.4 45.5 68.5 174 Lamu 57.7 45.9 68.7 55 Taita Taveta 82 73.9 88 120
North Eastern Garissa 47.6 39.1 56.2 239 Wajir 42.8 31.5 54.9 260 Mandera 25.5 17.4 35.7 165
Eastern Marsabit 12.1 7.4 19.1 93 Isiolo 57.7 49.2 65.8 83 Meru 59.3 51.4 66.8 541 Tharaka-Nithi 61.9 57.2 66.4 155 Embu 58.5 51.1 65.4 204 Kitui 39.6 29.5 50.6 494 Machakos 62.9 53.7 71.2 515 Makueni 50.8 44.2 57.5 379
Central Nyandarua 12.3 7.4 19.7 259 Nyeri 17.4 12.2 24.2 268 Kirinyaga 78.9 72.3 84.2 196 Murang’a 57 50.9 62.9 315 Kiambu 47.5 37.7 57.5 755
Rift Valley Turkana 21 16.3 26.7 372 West Pokot 42.9 32.2 54.3 306 Samburu 16.6 9.9 26.7 117 Trans-Nzoia 59.2 50.6 67.3 570 Uasin Gishu 69.3 61.7 76 498 Elgeyo Marakwet 16.9 12.1 23.1 179 Nandi 55 47.4 62.4 416 Baringo 49.1 39.6 58.8 235 Laikipia 13.6 8.1 21.9 216 Nakuru 30.7 23.1 39.6 880 Narok 31.1 23.9 39.5 640 Kajiado 42.6 31.1 54.9 447 Kericho 53.1 45.9 60.3 349 Bomet 60 53.7 65.9 487
Western Kakamega 62.6 57.9 67.1 860 Vihiga 70.9 65.5 75.7 263 Bungoma 71.5 67.2 75.4 955 Busia 73.9 67.9 79 448
Nyanza Siaya 67.8 63.6 71.7 428 Kisumu 81.7 76.4 86.1 529 Homa Bay 56.4 47.7 64.7 658 Migori 62.2 58 66.2 556 Kisii 79.5 74.5 83.7 516 Nyamira 69.6 63.9 74.7 207
Nairobi 49.5 42.3 56.7 1,738
Total 54.1 52.6 55.5 19,798

APPENDIX TABLES 50
Table A4 Among women age 15-49 with a live birth in the two years preceding the survey, the percentage who received 3 or more doses of SP/Fansidar, at least one of which was received during an ANC visit by county, Kenya 2014 County % 95% LB 95% UB N
Coast Mombasa 24.9 17.3 34.4 190 Kwale 51.9 43.3 60.4 181 Kilifi 28.5 22.9 34.8 293 Tana River 21.4 15.5 28.9 68 Lamu 35.7 25.6 47.2 19 Taita Taveta 31.9 22.5 43.1 42
North Eastern Garissa 0.8 0.2 3 86 Wajir 0.5 0.1 3.3 93 Mandera 3 0.8 11.3 49
Eastern Marsabit 0.6 0.1 4.1 35 Isiolo 1.8 0.6 5.4 33 Meru 0 198 Tharaka-Nithi 7.1 3.2 15.1 56 Embu 0 81 Kitui 16 11.5 21.8 164 Machakos 2.5 0.9 6.4 190 Makueni 7.4 4 13 115
Central Nyandarua 2.2 0.7 6.3 97 Nyeri 1.9 0.5 7.4 92 Kirinyaga 3.7 0.9 13.7 61 Murang’a 1.9 0.5 6.7 120 Kiambu 2.6 0.9 7.1 312
Rift Valley Turkana 13 8.4 19.7 131 West Pokot 2.9 1.2 6.8 121 Samburu 2.8 0.5 13.8 46 Trans-Nzoia 3.6 1.4 9 218 Uasin Gishu 6.4 2.8 14.1 187 Elgeyo Marakwet 1.8 0.6 5.5 65 Nandi 1.9 0.6 5.9 153 Baringo 6.7 3.8 11.6 94 Laikipia 1.6 0.4 6.2 78 Nakuru 4.2 1.9 8.9 332 Narok 0.6 0.1 2.6 237 Kajiado 8.5 5.8 12.5 179 Kericho 3.4 1.5 7.9 139 Bomet 4.8 2.2 10.2 187
Western Kakamega 20.1 14 27.9 244 Vihiga 20.5 14.1 28.9 83 Bungoma 27.7 17.7 40.4 354 Busia 36.1 27.8 45.4 146
Nyanza Siaya 16.1 10.1 24.7 142 Kisumu 5.9 2.9 11.5 177 Homa Bay 12.3 8.3 17.8 253 Migori 12.9 8.2 19.5 203 Kisii 3.7 1.5 9 193 Nyamira 8.2 3.5 17.8 67
Nairobi 0.8 0.2 3.1 753
Total 10.1 9.1 11.4 7,357

APPENDIX TABLES 51
Table A5 Among children under age 5 with recent fever, the percentage who took any ACT, Kenya 2014 County % 95% LB 95% UB N
Coast Mombasa 13.5 7.8 22.3 111 Kwale 30 22 39.6 105 Kilifi 1 0.1 6.7 221 Tana River 9.5 4.9 17.7 45 Lamu 1.2 0.2 8.2 12 Taita Taveta 1.3 0.2 9.1 33
North Eastern Garissaⁱⁱ (5.6) (1.0) (26.9) 16 Wajir 0.4 0.1 2.7 31 Manderaⁱ * * * 7
Eastern Marsabit 10.1 4.4 21.5 17 Isiolo 43.4 30.9 56.8 11 Meru 14.9 8.1 25.8 128 Tharaka-Nithi 9.8 3.6 23.6 39 Embuⁱⁱ (21.7) (11.1) (38) 27 Kitui 3.5 1.1 10.8 72 Machakosⁱⁱ (10.8) (3.7) (28) 64 Makueni 7.8 2.8 20.2 49
Central Nyandarua 5.3 1.4 18.2 40 Nyeriⁱⁱ (0) 34 Kirinyagaⁱⁱ (18.6) (7.4) (39.3) 40 Murang’aⁱⁱ (0) 52 Kiambu 1.2 0.2 8.6 143
Rift Valley Turkana 21.7 9.8 41.4 38 West Pokot 16.1 7.7 30.7 28 Samburu 5 2 11.9 22 Trans-Nzoia 10.9 5.5 20.4 113 Uasin Gishu 4.7 1.8 11.7 89 Elgeyo Marakwet 1.5 0.5 4.5 49 Nandi 8.8 4.4 16.8 76 Baringo 22.9 14.3 34.6 53 Laikipia 6.2 2.4 15.3 44 Nakuru 11 4.8 23.2 132 Narok 9.7 5.1 17.5 188 Kajiado 0 116 Kericho 14.4 8.7 22.9 92 Bomet 12.9 6.7 23.3 99
Western Kakamega 38.4 30.2 47.3 209 Vihiga 39.5 33.2 46.2 106 Bungoma 55.1 47.1 62.9 302 Busia 59.6 51.2 67.4 166
Nyanza Siaya 59.2 49.1 68.6 170 Kisumu 39.5 27.9 52.4 148 Homa Bay 46.5 36.5 56.8 281 Migori 37.2 31.5 43.2 249 Kisii 27.2 21.8 33.4 130 Nyamiraⁱ * * * 11
Nairobi 6.9 2.9 15.6 359 Total 23.1 21.5 24.9 4,562
Note: Figures in parenthesis are based on 25-49 unweighted cases and should be interpreted with caution. An asterisk indicates that an estimate is based on fewer than 25 cases and has been suppressed.

APPENDIX TABLES 52
Table A6 Among children under age 5 with recent fever the percentage who had blood taken from a finger or heel for testing by county, Kenya 2014 County % 95% LB 95% UB N
Coast Mombasa 46.7 33.9 59.9 111 Kwale 42.8 31.5 54.9 105 Kilifi 31 22 41.6 221 Tana River 22.6 14.3 33.9 45 Lamu 11.8 4.7 26.3 12 Taita Taveta 21.7 12.5 34.9 33
North Eastern Garissaⁱⁱ (52.4) (28.8) (74.9) 16 Wajir 19.9 11.6 32.1 31 Manderaⁱ * * * 7
Eastern Marsabit 22.3 16 30.1 17 Isiolo 60.7 46.5 73.3 11 Meru 54 41 66.5 128 Tharaka-Nithi 41.9 31.7 52.8 39 Embuⁱⁱ (38.4) (24) (55.1) 27 Kitui 9.1 3.9 19.5 72 Machakosⁱⁱ (18.4) (9.6) (32.5) 64 Makueni 21.7 12.3 35.2 49
Central Nyandarua 22.6 11.8 38.8 40 Nyeriⁱⁱ (17.5) (9.4) (30.1) 34 Kirinyagaⁱⁱ (28.6) (17.1) (43.8) 40 Murang’aⁱⁱ (3.7) (0.8) (15.1) 52 Kiambu 33.6 23.3 45.7 143
Rift Valley Turkana 49.5 24.8 74.5 38 West Pokot 20.6 11.9 33.1 28 Samburu 16.6 9.3 28 22 Trans-Nzoia 45.2 32.5 58.6 113 Uasin Gishu 17 11 25.4 89 Elgeyo Marakwet 13.5 5.4 30.2 49 Nandi 12.2 6.5 21.6 76 Baringo 39.1 27.5 52.1 53 Laikipia 26 14.7 41.6 44 Nakuru 27.6 17.5 40.6 132 Narok 20.4 13.4 29.8 188 Kajiado 21.8 11.5 37.5 116 Kericho 37.9 29.7 46.8 92 Bomet 14.9 8.7 24.2 99
Western Kakamega 34.9 26.8 43.9 209 Vihiga 34.4 25.5 44.5 106 Bungoma 41.6 33 50.6 302 Busia 37.2 29.5 45.7 166
Nyanza Siaya 61.1 48.6 72.4 170 Kisumu 48.8 39.3 58.4 148 Homa Bay 50.7 40.9 60.5 281 Migori 42.6 34.3 51.4 249 Kisii 27.1 19.4 36.4 130 Nyamiraⁱ * * * 11
Nairobi 36 26.1 47.2 359 Total 34.9 32.9 36.9 4,562
Note: Figures in parenthesis are based on 25-49 unweighted cases and should be interpreted with caution. An asterisk indicates that an estimate is based on fewer than 25 cases and has been suppressed.
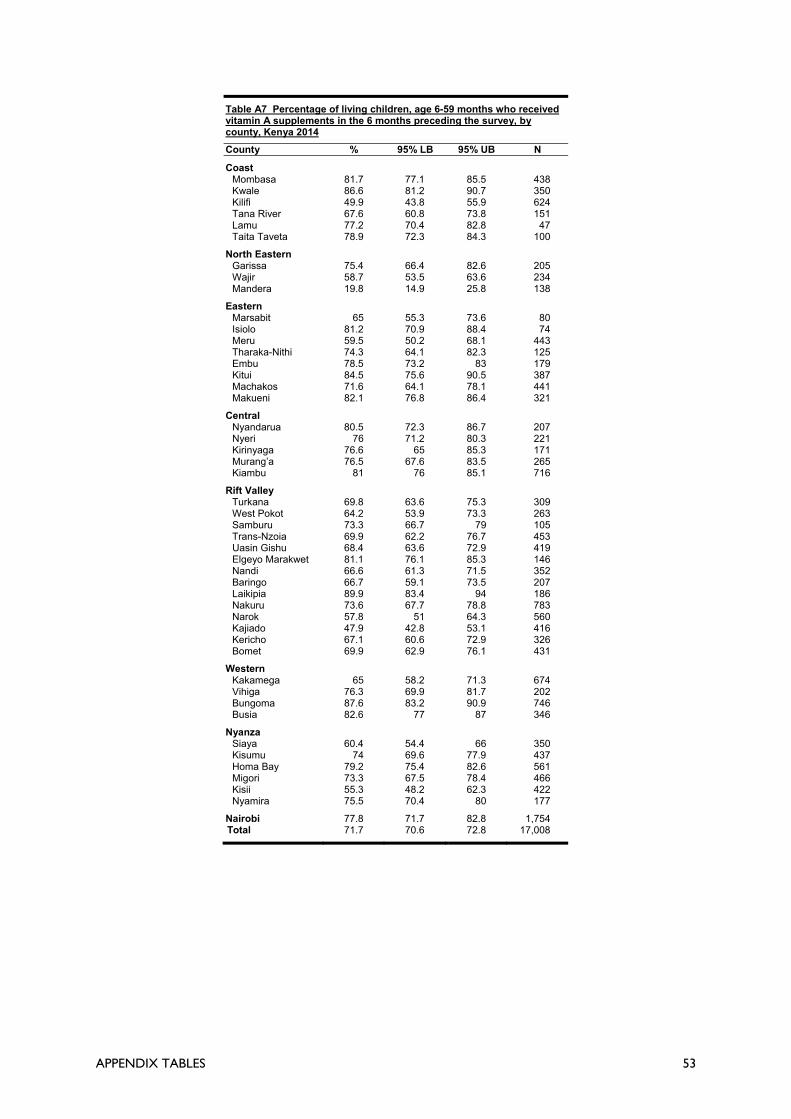
APPENDIX TABLES 53
Table A7 Percentage of living children, age 6-59 months who received vitamin A supplements in the 6 months preceding the survey, by county, Kenya 2014 County % 95% LB 95% UB N
Coast Mombasa 81.7 77.1 85.5 438 Kwale 86.6 81.2 90.7 350 Kilifi 49.9 43.8 55.9 624 Tana River 67.6 60.8 73.8 151 Lamu 77.2 70.4 82.8 47 Taita Taveta 78.9 72.3 84.3 100
North Eastern Garissa 75.4 66.4 82.6 205 Wajir 58.7 53.5 63.6 234 Mandera 19.8 14.9 25.8 138
Eastern Marsabit 65 55.3 73.6 80 Isiolo 81.2 70.9 88.4 74 Meru 59.5 50.2 68.1 443 Tharaka-Nithi 74.3 64.1 82.3 125 Embu 78.5 73.2 83 179 Kitui 84.5 75.6 90.5 387 Machakos 71.6 64.1 78.1 441 Makueni 82.1 76.8 86.4 321
Central Nyandarua 80.5 72.3 86.7 207 Nyeri 76 71.2 80.3 221 Kirinyaga 76.6 65 85.3 171 Murang’a 76.5 67.6 83.5 265 Kiambu 81 76 85.1 716
Rift Valley Turkana 69.8 63.6 75.3 309 West Pokot 64.2 53.9 73.3 263 Samburu 73.3 66.7 79 105 Trans-Nzoia 69.9 62.2 76.7 453 Uasin Gishu 68.4 63.6 72.9 419 Elgeyo Marakwet 81.1 76.1 85.3 146 Nandi 66.6 61.3 71.5 352 Baringo 66.7 59.1 73.5 207 Laikipia 89.9 83.4 94 186 Nakuru 73.6 67.7 78.8 783 Narok 57.8 51 64.3 560 Kajiado 47.9 42.8 53.1 416 Kericho 67.1 60.6 72.9 326 Bomet 69.9 62.9 76.1 431
Western Kakamega 65 58.2 71.3 674 Vihiga 76.3 69.9 81.7 202 Bungoma 87.6 83.2 90.9 746 Busia 82.6 77 87 346
Nyanza Siaya 60.4 54.4 66 350 Kisumu 74 69.6 77.9 437 Homa Bay 79.2 75.4 82.6 561 Migori 73.3 67.5 78.4 466 Kisii 55.3 48.2 62.3 422 Nyamira 75.5 70.4 80 177
Nairobi 77.8 71.7 82.8 1,754 Total 71.7 70.6 72.8 17,008

APPENDIX TABLES 54
Table A8 Percentage of children age 12-23 months who had received all basic vaccines at any time before the survey by county, Kenya 2014 County % 95% LB 95% UB N
Coast Mombasa 84.6 74 91.3 93 Kwale 85.9 76.1 92.1 89 Kilifi 74.7 63.9 83.1 144 Tana River 73.3 63.6 81.2 32 Lamu 69.9 51.7 83.5 9 Taita Taveta 93 78.6 98 23
North Eastern Garissa 62.1 53.4 70.1 43 Wajir 55.8 42.5 68.3 54 Mandera 43.8 29 59.8 24
Eastern Marsabit 70.8 58.6 80.6 16 Isiolo 83.3 72 90.6 20 Meru 88.4 73 95.6 95 Tharaka-Nithi 95.3 80.9 99 33 Embu 85.5 73 92.8 42 Kitui 69.3 50.7 83.2 76 Machakos 93.4 84.4 97.3 86 Makueni 92 83.6 96.3 63
Central Nyandarua 86.2 75.6 92.6 53 Nyeri 87.8 74.8 94.6 59 Kirinyaga 100 31 Murang’a 88.2 76.1 94.6 70 Kiambu 99 92.8 99.9 150
Rift Valley Turkana 62.5 47.3 75.6 61 West Pokot 35.9 25.7 47.5 66 Samburu 66.6 56.8 75.1 23 Trans-Nzoia 71.5 62.4 79.1 105 Uasin Gishu 85.6 75.4 92 96 Elgeyo Marakwet 85.9 73.5 93 32 Nandi 96.3 90.7 98.6 82 Baringo 78.3 66.5 86.8 49 Laikipia 83.2 69.8 91.4 38 Nakuru 79.2 69.2 86.5 167 Narok 66.4 54.2 76.8 118 Kajiado 58.5 43.8 71.8 95 Kericho 76.3 60.1 87.4 67 Bomet 87 78.3 92.5 84
Western Kakamega 77.3 66.6 85.3 125 Vihiga 94.4 85.8 97.9 48 Bungoma 80.8 71.3 87.7 187 Busia 81.6 71.7 88.6 59
Nyanza Siaya 79.3 68.7 86.9 84 Kisumu 78.9 67.8 86.9 96 Homa Bay 69 55.7 79.8 131 Migori 70.3 62 77.4 102 Kisii 84.6 76.6 90.3 99 Nyamira 95 83.6 98.6 39
Nairobi 81.2 73.5 87.1 417 Total 79.4 77.7 81 3,777
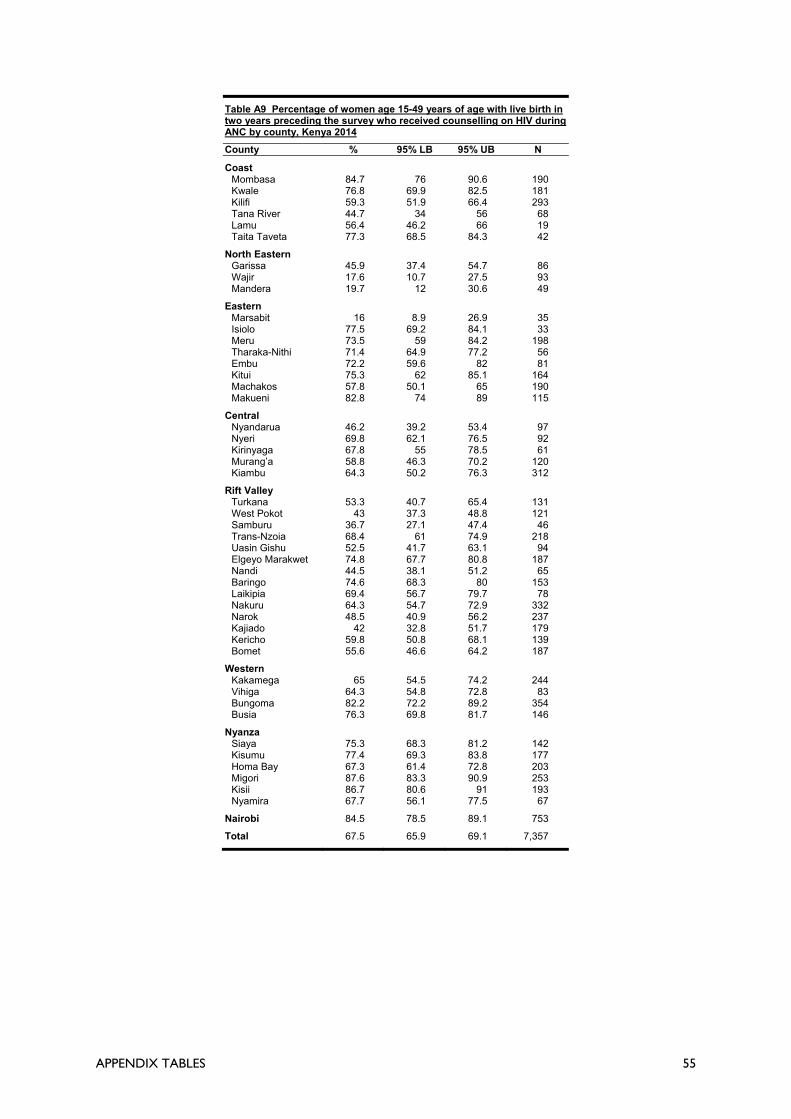
APPENDIX TABLES 55
Table A9 Percentage of women age 15-49 years of age with live birth in two years preceding the survey who received counselling on HIV during ANC by county, Kenya 2014 County % 95% LB 95% UB N
Coast Mombasa 84.7 76 90.6 190 Kwale 76.8 69.9 82.5 181 Kilifi 59.3 51.9 66.4 293 Tana River 44.7 34 56 68 Lamu 56.4 46.2 66 19 Taita Taveta 77.3 68.5 84.3 42
North Eastern Garissa 45.9 37.4 54.7 86 Wajir 17.6 10.7 27.5 93 Mandera 19.7 12 30.6 49
Eastern Marsabit 16 8.9 26.9 35 Isiolo 77.5 69.2 84.1 33 Meru 73.5 59 84.2 198 Tharaka-Nithi 71.4 64.9 77.2 56 Embu 72.2 59.6 82 81 Kitui 75.3 62 85.1 164 Machakos 57.8 50.1 65 190 Makueni 82.8 74 89 115
Central Nyandarua 46.2 39.2 53.4 97 Nyeri 69.8 62.1 76.5 92 Kirinyaga 67.8 55 78.5 61 Murang’a 58.8 46.3 70.2 120 Kiambu 64.3 50.2 76.3 312
Rift Valley Turkana 53.3 40.7 65.4 131 West Pokot 43 37.3 48.8 121 Samburu 36.7 27.1 47.4 46 Trans-Nzoia 68.4 61 74.9 218 Uasin Gishu 52.5 41.7 63.1 94 Elgeyo Marakwet 74.8 67.7 80.8 187 Nandi 44.5 38.1 51.2 65 Baringo 74.6 68.3 80 153 Laikipia 69.4 56.7 79.7 78 Nakuru 64.3 54.7 72.9 332 Narok 48.5 40.9 56.2 237 Kajiado 42 32.8 51.7 179 Kericho 59.8 50.8 68.1 139 Bomet 55.6 46.6 64.2 187
Western Kakamega 65 54.5 74.2 244 Vihiga 64.3 54.8 72.8 83 Bungoma 82.2 72.2 89.2 354 Busia 76.3 69.8 81.7 146
Nyanza Siaya 75.3 68.3 81.2 142 Kisumu 77.4 69.3 83.8 177 Homa Bay 67.3 61.4 72.8 203 Migori 87.6 83.3 90.9 253 Kisii 86.7 80.6 91 193 Nyamira 67.7 56.1 77.5 67
Nairobi 84.5 78.5 89.1 753
Total 67.5 65.9 69.1 7,357

APPENDIX TABLES 56
Table A10 Percentage of women age 15-49 years of age with live birth in two years preceding the survey who were counselled on HIV, tested and received result during ANC by county, Kenya 2014
County Point Estimate and CI
% 95% LB 95% UB N
Coast Mombasa 84.7 76.0 90.6 190 Kwale 76.8 69.9 82.5 181 Kilifi 59.3 51.9 66.4 293 Tana River 44.5 33.7 55.8 68 Lamu 56.4 46.2 66.0 19 Taita Taveta 76.0 66.5 83.4 42
North Eastern Garissa 43.3 35.5 51.4 86 Wajir 17.5 10.7 27.4 93 Mandera 18.0 10.6 29.0 49
Eastern Marsabit 15.7 8.8 26.5 35 Isiolo 76.3 67.8 83.2 33 Meru 73.5 59.0 84.2 198 Tharaka-Nithi 61.0 52.1 69.2 56 Embu 72.2 59.6 82.0 81 Kitui 75.3 62.0 85.1 164 Machakos 57.8 50.1 65.0 190 Makueni 82.3 73.4 88.7 115
Central Nyandarua 46.2 39.2 53.4 97 Nyeri 69.8 62.1 76.5 92 Kirinyaga 67.8 55.0 78.5 61 Murang’a 58.8 46.3 70.2 120 Kiambu 64.3 50.2 76.3 312
Rift Valley Turkana 52.1 39.5 64.5 131 West Pokot 35.9 30.4 41.8 121 Samburu 34.9 26.0 44.9 46 Trans-Nzoia 68.0 60.6 74.5 218 Uasin Gishu 51.8 40.8 62.7 94 Elgeyo Marakwet 74.2 66.7 80.5 187 Nandi 44.5 38.1 51.2 65 Baringo 74.6 68.3 80.0 153 Laikipia 69.4 56.7 79.7 78 Nakuru 62.8 53.7 71.0 332 Narok 48.0 40.5 55.7 237 Kajiado 40.7 31.6 50.4 179 Kericho 59.1 50.0 67.7 139 Bomet 55.6 46.6 64.2 187
Western Kakamega 65.0 54.5 74.2 244 Vihiga 62.9 53.6 71.4 83 Bungoma 81.7 71.7 88.8 354 Busia 76.3 69.8 81.7 146
Nyanza Siaya 75.3 68.3 81.2 142 Kisumu 76.7 68.5 83.3 177 Homa Bay 66.1 60.3 71.4 203 Migori 86.2 81.8 89.7 253 Kisii 86.1 79.1 91.0 193 Nyamira 65.6 54.6 75.2 67
Nairobi 84.5 78.5 89.1 753 Total 66.9 65.2 68.5 7,357

APPENDIX TABLES 57
Table A11 Percentage of children under age 5 who had fever in the two weeks preceding the survey by county, Kenya 2014
County % 95% LB 95% UB N
Coast Mombasa 22.5 17.3 28.8 493 Kwale 25.7 20.6 31.6 408 Kilifi 31.3 25 38.5 705 Tana River 26.8 23.8 30 166 Lamu 22.2 17.5 27.8 52 Taita Taveta 29.5 22.3 38 110
North Eastern Garissa 7 4.9 10 223 Wajir 12.5 9.1 16.9 252 Mandera 4.8 2.8 8.2 150
Eastern Marsabit 19.3 12.8 28.2 88 Isiolo 13.2 9.5 18.1 81 Meru 26 21.3 31.4 490 Tharaka-Nithi 28.1 22.4 34.6 137 Embu 13.8 7.8 23.2 194 Kitui 17 12.2 23.1 424 Machakos 13.6 9 20.1 474 Makueni 14.1 10.2 19.3 346
Central Nyandarua 17.2 11.5 25 232 Nyeri 14.1 9.2 21 240 Kirinyaga 21.2 15.1 28.8 188 Murang’a 17.7 13 23.8 293 Kiambu 18.5 12.8 25.9 772
Rift Valley Turkana 11.4 8.1 15.9 333 West Pokot 9.4 6.7 13 294 Samburu 19.1 15 24.1 114 Trans-Nzoia 21.9 15.2 30.4 516 Uasin Gishu 19.3 14.4 25.4 463 Elgeyo Marakwet 29.7 21.7 39.2 164 Nandi 19.7 15.4 24.9 388 Baringo 22.9 17.6 29.2 230 Laikipia 21.6 15.5 29.1 206 Nakuru 15.5 12 19.8 849 Narok 30.7 25.6 36.3 614 Kajiado 25.7 20.8 31.3 452 Kericho 25.6 21.7 29.8 359 Bomet 20.8 15.9 26.7 475
Western Kakamega 28.9 24.1 34.3 721 Vihiga 49.2 45.1 53.4 215 Bungoma 35.8 29.8 42.4 842 Busia 42.7 37.3 48.3 388
Nyanza Siaya 44.9 37.8 52.2 378 Kisumu 30.9 24.8 37.7 478 Homa Bay 45.6 40.3 51 616 Migori 48.2 42.1 54.3 516 Kisii 28.1 24.2 32.4 463 Nyamira 5.7 4.1 7.8 187
Nairobi 18.7 14.4 24 1,920 Total 24.4 23.4 25.4 18,702
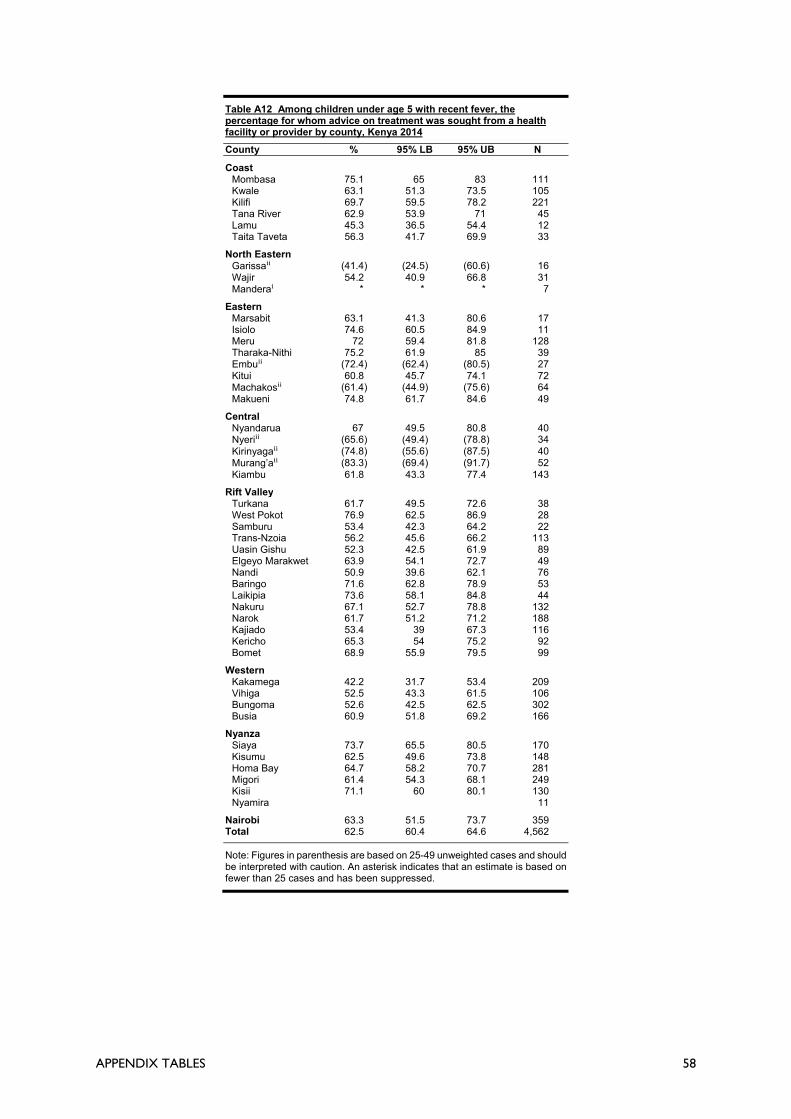
APPENDIX TABLES 58
Table A12 Among children under age 5 with recent fever, the percentage for whom advice on treatment was sought from a health facility or provider by county, Kenya 2014
County % 95% LB 95% UB N
Coast Mombasa 75.1 65 83 111 Kwale 63.1 51.3 73.5 105 Kilifi 69.7 59.5 78.2 221 Tana River 62.9 53.9 71 45 Lamu 45.3 36.5 54.4 12 Taita Taveta 56.3 41.7 69.9 33
North Eastern Garissaⁱⁱ (41.4) (24.5) (60.6) 16 Wajir 54.2 40.9 66.8 31 Manderaⁱ * * * 7
Eastern Marsabit 63.1 41.3 80.6 17 Isiolo 74.6 60.5 84.9 11 Meru 72 59.4 81.8 128 Tharaka-Nithi 75.2 61.9 85 39 Embuⁱⁱ (72.4) (62.4) (80.5) 27 Kitui 60.8 45.7 74.1 72 Machakosⁱⁱ (61.4) (44.9) (75.6) 64 Makueni 74.8 61.7 84.6 49
Central Nyandarua 67 49.5 80.8 40 Nyeriⁱⁱ (65.6) (49.4) (78.8) 34 Kirinyagaⁱⁱ (74.8) (55.6) (87.5) 40 Murang’aⁱⁱ (83.3) (69.4) (91.7) 52 Kiambu 61.8 43.3 77.4 143
Rift Valley Turkana 61.7 49.5 72.6 38 West Pokot 76.9 62.5 86.9 28 Samburu 53.4 42.3 64.2 22 Trans-Nzoia 56.2 45.6 66.2 113 Uasin Gishu 52.3 42.5 61.9 89 Elgeyo Marakwet 63.9 54.1 72.7 49 Nandi 50.9 39.6 62.1 76 Baringo 71.6 62.8 78.9 53 Laikipia 73.6 58.1 84.8 44 Nakuru 67.1 52.7 78.8 132 Narok 61.7 51.2 71.2 188 Kajiado 53.4 39 67.3 116 Kericho 65.3 54 75.2 92 Bomet 68.9 55.9 79.5 99
Western Kakamega 42.2 31.7 53.4 209 Vihiga 52.5 43.3 61.5 106 Bungoma 52.6 42.5 62.5 302 Busia 60.9 51.8 69.2 166
Nyanza Siaya 73.7 65.5 80.5 170 Kisumu 62.5 49.6 73.8 148 Homa Bay 64.7 58.2 70.7 281 Migori 61.4 54.3 68.1 249 Kisii 71.1 60 80.1 130 Nyamira 11
Nairobi 63.3 51.5 73.7 359 Total 62.5 60.4 64.6 4,562
Note: Figures in parenthesis are based on 25-49 unweighted cases and should be interpreted with caution. An asterisk indicates that an estimate is based on fewer than 25 cases and has been suppressed.

APPENDIX TABLES 59
Table A13 Among young women age 15-19, the percentage who have had a live birth or are pregnant with their first child by county, Kenya 2014
County % 95% LB 95% UB N
Coast Mombasa 16.6 9.7 27.1 123 Kwale 24.2 16.6 33.9 132 Kilifi 21.8 14.9 30.8 252 Tana River 28.2 20.7 37.1 41 Lamu 10 5.5 17.7 20 Taita Taveta 13.4 7.5 22.8 36
North Eastern Garissa 10.2 5.4 18.4 67 Wajir 17.4 8.3 32.9 41 Mandera 10.1 4.9 19.6 36
Eastern Marsabit 16.6 10.2 25.8 25 Isiolo 18.9 9.4 34.5 18 Meru 19.9 12.7 29.6 185 Tharaka-Nithi 13.7 7.4 24 50 Embu 8 4 15.1 91 Kitui 14.8 10.6 20.2 169 Machakos 14 8.7 21.7 143 Makueni 11.1 7.3 16.6 168
Central Nyandarua 9.7 4.7 19 67 Nyeri 6.9 3.3 14 101 Kirinyaga 11.3 4.8 24.3 54 Murang’a 6.3 2.9 13.2 137 Kiambu 14.1 6.7 27.1 242
Rift Valley Turkana 20.2 11 34.3 51 West Pokot 28.6 17.8 42.7 38 Samburu 25.7 19.8 32.6 21 Trans-Nzoia 23.3 16 32.5 185 Uasin Gishu 22.2 16.1 29.9 137 Elgeyo Marakwet 8.7 4.6 15.8 51 Nandi 15.6 11.6 20.7 133 Baringo 13.2 7.4 22.5 83 Laikipia 18.7 9.8 32.8 65 Nakuru 18.4 12.4 26.4 295 Narok 40.4 30.4 51.3 107 Kajiado 20.2 12.3 31.5 106 Kericho 20.5 12.6 31.7 91 Bomet 24 16.1 34.3 129
Western Kakamega 19.4 12.9 28.2 242 Vihiga 12.7 7.9 19.9 98 Bungoma 14.4 11.4 18.1 319 Busia 20.8 14 29.8 131
Nyanza Siaya 17.2 10.8 26.4 130 Kisumu 15.4 10.1 22.9 179 Homa Bay 33.3 23.3 45 177 Migori 24.3 17.9 32.2 140 Kisii 18.4 13.2 25 191 Nyamira 27.8 19.1 38.5 58
Nairobi 17.4 10.1 28.3 467 Total 18.1 16.7 19.6 5,820

APPENDIX TABLES 60
Table A14 Among currently married women age 15-49, the percentage currently using a modern contraceptive method by county, Kenya 2014
County % 95% LB 95% UB N
Coast Mombasa 43.6 36.7 50.7 537 Kwale 38.2 32 44.8 357 Kilifi 32.8 27.4 38.8 600 Tana River 20.5 13.4 29.9 144 Lamu 39.5 31.1 48.6 55 Taita Taveta 61.3 55.1 67.2 128
North Eastern Garissa 5.5 3.1 9.5 165 Wajir 2.3 1.2 4.5 158 Mandera 1.9 0.6 5.5 128
Eastern Marsabit 10.9 6.6 17.5 76 Isiolo 26.3 16.7 38.8 65 Meru 73.2 65.8 79.5 690 Tharaka-Nithi 67.2 61.5 72.4 169 Embu 67.2 61.4 72.5 266 Kitui 55.1 47.4 62.5 445 Machakos 67.5 62.4 72.3 553 Makueni 65 58.9 70.7 404
Central Nyandarua 60.4 55.9 64.8 273 Nyeri 67.1 61.7 72 358 Kirinyaga 75.6 70.5 80.1 281 Murang’a 63.4 57.5 68.9 444 Kiambu 67.8 63.7 71.6 967
Rift Valley Turkana 10.1 5.5 17.6 214 West Pokot 13.3 7.8 21.9 197 Samburu 20 14.4 27.1 83 Trans-Nzoia 56.4 50.8 61.9 467 Uasin Gishu 56 51 60.8 460 Elgeyo Marakwet 43.6 36.8 50.6 139 Nandi 59.2 54.5 63.6 335 Baringo 33.1 26.8 40 190 Laikipia 51.3 44.3 58.2 207 Nakuru 53.5 48.3 58.7 851 Narok 38.1 30.7 46.1 446 Kajiado 45.2 37.1 53.5 387 Kericho 56.9 52.3 61.3 327 Bomet 50.4 43.3 57.4 394
Western Kakamega 60.3 54.4 66 697 Vihiga 56.6 51.8 61.2 212 Bungoma 53.9 48.4 59.3 696 Busia 56.5 52.5 60.5 345
Nyanza Siaya 51 46.7 55.4 326 Kisumu 59.3 55.3 63.2 500 Homa Bay 45.5 40 51.2 520 Migori 43.9 38.3 49.6 432 Kisii 62.8 58.3 67 531 Nyamira 64.2 57.1 70.8 216
Nairobi 58.3 53.3 63.1 2,117 Total 53.2 52.1 54.3 18,549

APPENDIX TABLES 61
Table A15 Among the nonfirst births in the five years preceding the survey, the percentage with a short preceding birth interval (less than 24 months) by county, Kenya 2014
County % 95% LB 95% UB N
Coast Mombasa 12.4 7.9 18.9 354 Kwale 22 18.2 26.2 331 Kilifi 19.6 16.1 23.7 548 Tana River 20.4 17.5 23.6 145 Lamu 23.9 19.4 29.1 47 Taita Taveta 9 5.3 14.8 91
North Eastern Garissa 36.8 32.3 41.6 207 Wajir 34.6 29.3 40.4 230 Mandera 29.3 22.4 37.3 138
Eastern Marsabit 15.9 9.6 25.2 73 Isiolo 20.9 14.5 29.2 70 Meru 6.8 4.4 10.5 348 Tharaka-Nithi 8.2 4.4 14.6 107 Embu 15.5 8 27.7 130 Kitui 15.8 11.4 21.5 342 Machakos 12 8.9 16 343 Makueni 12.2 9 16.3 266
Central Nyandarua 10.6 6.8 16.3 189 Nyeri 9.1 5.6 14.3 157 Kirinyaga 5.3 2.8 9.7 130 Murang’a 7.8 4.8 12.4 227 Kiambu 13.4 9.3 19 512
Rift Valley Turkana 17.1 10.3 27.1 278 West Pokot 25.6 20.4 31.6 255 Samburu 18.1 13.8 23.3 95 Trans-Nzoia 12.6 9.3 16.9 381 Uasin Gishu 14.3 10.2 19.7 332 Elgeyo Marakwet 18.4 14.1 23.7 129 Nandi 18.2 13.6 23.8 301 Baringo 25.8 19.6 33.2 190 Laikipia 10 7.5 13.2 155 Nakuru 17.4 13.8 21.6 665 Narok 22.9 19.3 26.9 499 Kajiado 21.7 16.8 27.6 322 Kericho 13.2 9.8 17.7 268 Bomet 16.8 12.2 22.6 385
Western Kakamega 20.4 17.3 24 582 Vihiga 18.6 14.8 23.2 179 Bungoma 21.8 18.1 26.1 703 Busia 18 13.5 23.6 317
Nyanza Siaya 22.1 17.2 27.9 311 Kisumu 16.7 12.5 22 379 Homa Bay 20.4 16 25.6 527 Migori 24.9 21 29.1 471 Kisii 18.1 13.5 23.9 349 Nyamira 16.1 11 22.9 148
Nairobi 16.2 12.5 20.8 1,182 Total 17.9 17.1 18.7 14,388

APPENDIX TABLES 62
Table A16 Among live births in the five years preceding the survey, the percentage delivered in a health facility by county, Kenya 2014
County % 95% LB 95% UB N
Coast Mombasa 81.8 76 86.4 512 Kwale 49 36 62.2 427 Kilifi 52.6 43.9 61.2 739 Tana River 31.6 22.8 42 175 Lamu 43.9 30.2 58.6 56 Taita Taveta 61.9 48.8 73.5 113
North Eastern Garissa 36.7 28.5 45.7 237 Wajir 18.3 12 26.9 258 Mandera 36 25.4 48.2 155
Eastern Marsabit 25.8 17.7 36 91 Isiolo 42.1 32.3 52.6 85 Meru 81.8 75.3 86.9 517 Tharaka-Nithi 77.7 69.6 84.1 141 Embu 81.5 72.2 88.2 201 Kitui 45.6 34.5 57.2 438 Machakos 62.9 55.5 69.7 493 Makueni 53.3 41.3 64.9 355
Central Nyandarua 86.1 81.6 89.6 248 Nyeri 89 82.8 93.1 249 Kirinyaga 92.5 87.2 95.7 197 Murang’a 85 79.7 89 308 Kiambu 93.4 89.6 95.9 794
Rift Valley Turkana 23.1 13 37.8 347 West Pokot 25.8 18 35.5 302 Samburu 24.5 16.5 34.9 117 Trans-Nzoia 41.5 32.2 51.4 528 Uasin Gishu 53.5 42 64.7 238 Elgeyo Marakwet 57.4 47.8 66.5 483 Nandi 64.7 57.6 71.2 168 Baringo 46.5 38.7 54.5 402 Laikipia 48.1 33.5 63.1 209 Nakuru 69.7 60.6 77.5 909 Narok 38.6 28.6 49.7 638 Kajiado 62.4 49.7 73.6 461 Kericho 62.2 54.2 69.6 373 Bomet 49 40.8 57.2 502
Western Kakamega 47 40.4 53.6 747 Vihiga 50.2 42.7 57.7 229 Bungoma 40.8 34.1 47.9 870 Busia 58.4 51.2 65.3 409
Nyanza Siaya 69.6 61.7 76.4 391 Kisumu 69.5 62 76.1 500 Homa Bay 53.3 43.7 62.7 565 Migori 61.9 51.9 71 658 Kisii 69.3 62.1 75.7 482 Nyamira 74.3 67.5 80 195
Nairobi 88.7 83.4 92.4 2051 Total 61.2 59.7 62.7 19,564

APPENDIX TABLES 63
Table A17 Among live births in the five years preceding the survey, the percentage delivered by a skilled provider by county, Kenya 2014
County % 95% LB 95% UB N
Coast Mombasa 82.8 77.1 87.3 512 Kwale 50.1 37 63.2 427 Kilifi 52.3 43.5 60.9 739 Tana River 32.2 23.2 42.8 175 Lamu 47.3 32.9 62.1 56 Taita Taveta 62.5 49.5 73.9 113
North Eastern Garissa 39.8 31.3 48.9 237 Wajir 21.7 13.4 33.2 258 Mandera 38.7 26.5 52.6 155
Eastern Marsabit 25.8 17.7 36 91 Isiolo 43.8 33.9 54.2 85 Meru 82.8 76.7 87.5 517 Tharaka-Nithi 76.6 68.6 83.1 141 Embu 81.5 72.2 88.2 201 Kitui 46.2 34.8 57.9 438 Machakos 63.4 56 70.1 493 Makueni 54.6 42.9 65.9 355
Central Nyandarua 85.3 80.8 88.9 248 Nyeri 88.1 80.5 92.9 249 Kirinyaga 92.3 86.2 95.8 197 Murang’a 85.5 80.5 89.4 308 Kiambu 92.6 88.7 95.3 794
Rift Valley Turkana 22.8 13.9 35 347 West Pokot 27 19.2 36.5 302 Samburu 29 20.2 39.8 117 Trans-Nzoia 41.8 32.5 51.6 528 Uasin Gishu 53.8 42.4 64.7 238 Elgeyo Marakwet 59 49.3 68 483 Nandi 65 57.9 71.6 168 Baringo 46.8 39.1 54.5 402 Laikipia 49.5 35.1 64 209 Nakuru 69.5 60.6 77.1 909 Narok 40.3 29.5 52.1 638 Kajiado 63.2 50.7 74.2 461 Kericho 64.4 56.5 71.5 373 Bomet 52.2 44 60.3 502
Western Kakamega 48.6 42.2 55.1 747 Vihiga 50.3 43 57.7 229 Bungoma 41.4 34.9 48.2 870 Busia 58.5 50.9 65.6 409
Nyanza Siaya 70.4 63.8 76.2 391 Kisumu 69.2 61.3 76.1 500 Homa Bay 53.4 43.7 62.7 565 Migori 60.4 50.7 69.3 658 Kisii 72.8 67.2 77.8 482 Nyamira 74.1 67.4 79.8 195
Nairobi 89.1 84 92.7 2051 Total 61.8 60.4 63.3 19,564

APPENDIX TABLES 64
Table A18 Percentage of children under age 5 who had diarrhoea in the two weeks preceding the survey by county, Kenya 2014
County % 95% LB 95% UB N
Coast Mombasa 11.8 8.4 16.3 493 Kwale 14.6 9.8 21.1 408 Kilifi 22.9 17.7 29.2 705 Tana River 21.3 18.1 25 166 Lamu 17.3 12.2 23.9 52 Taita Taveta 16.1 9.7 25.5 110
North Eastern Garissa 5.5 3.9 7.8 223 Wajir 12.6 8.6 18 252 Mandera 3 1.4 6.2 150
Eastern Marsabit 14.9 9.7 22.3 88 Isiolo 6.8 4.5 10.4 81 Meru 12.9 9.3 17.5 490 Tharaka-Nithi 20.5 14.2 28.8 137 Embu 11.5 7.9 16.4 194 Kitui 18.2 13.6 24 424 Machakos 15.1 11.3 19.7 474 Makueni 11.3 8.2 15.3 346
Central Nyandarua 11.3 7.9 16 232 Nyeri 4.6 2.2 9.2 240 Kirinyaga 12 8.6 16.4 188 Murang’a 12.1 8.4 17 293 Kiambu 11 6.7 17.6 772
Rift Valley Turkana 14.3 10.9 18.4 333 West Pokot 8.4 5.9 11.8 294 Samburu 18.1 14 23 114 Trans-Nzoia 14.9 10.5 20.7 516 Uasin Gishu 9.3 6.5 13.1 463 Elgeyo Marakwet 11.6 8.4 15.7 164 Nandi 10.9 8.1 14.6 388 Baringo 16 12.7 20.1 230 Laikipia 13.5 8.9 20 206 Nakuru 11.7 9 14.9 849 Narok 18.8 15.8 22.3 614 Kajiado 10.6 7.5 14.6 452 Kericho 16.3 12.9 20.3 359 Bomet 12.3 9.2 16.1 475
Western Kakamega 20.8 16.6 25.7 721 Vihiga 23.6 19.7 28 215 Bungoma 19.5 15.2 24.8 842 Busia 18.2 14 23.4 388
Nyanza Siaya 14.1 11.4 17.5 378 Kisumu 15.5 11.6 20.5 478 Homa Bay 23.5 19.8 27.6 616 Migori 27.9 23.1 33.2 516 Kisii 16.9 14.3 19.8 463 Nyamira 2.9 1.6 5.4 187
Nairobi 15.6 11.9 20.3 1,920 Total 15.2 14.4 16 18,702

APPENDIX TABLES 65
Table A19 Among children under age 5 with recent diarrhoea, the percentage for whom advice or treatment was sought from a health facility or provider by county, Kenya 2014
County % 95% LB 95% UB N
Coast Mombasaⁱⁱ (63.3) (49.8) (75) 58 Kwale 62.8 45.4 77.4 59 Kilifi 71.5 64.3 77.7 162 Tana River 46.7 35.3 58.4 36 Lamu 62.1 51.9 71.4 9 Taita Tavetaⁱⁱ (50.8) (31.8) (69.5) 18
North Eastern Garissaⁱⁱ 29.4 12.9 53.8 12 Wajir 48.9 24.7 73.7 32 Manderaⁱ * * * 5
Eastern Marsabit 63.5 50.3 74.9 13 Isioloⁱⁱ (56.9) (33) (78) 6 Meruⁱⁱ (69.8) (52) (83.1) 63 Tharaka-Nithiⁱⁱ (67.5) (48.2) (82.3) 28 Embuⁱⁱ (46.7) (25.9) (68.7) 22 Kitui 54.4 39.6 68.4 77 Machakos 51 36.6 65.3 71 Makueniⁱⁱ (52.1) (37.2) (66.7) 39
Central Nyandaruaⁱⁱ (46) (27.7) (65.5) 26 Nyeriⁱ * * * 11 Kirinyagaⁱⁱ (73.6) (44.2) (90.8) 23 Murang’aⁱⁱ (59.8) (38.8) (77.7) 35 Kiambuⁱⁱ (69.9) (51.8) (83.4) 85
Rift Valley Turkana 74.4 51.7 88.8 47 West Pokot 61.3 43.8 76.2 25 Samburu 48.9 36.2 61.7 21 Trans-Nzoia 41.4 24.5 60.7 77 Uasin Gishuⁱⁱ (53.7) (37.1) (69.5) 43 Elgeyo Marakwetⁱⁱ (77) (61.6) (87.5) 19 Nandi 48.9 36.7 61.2 42 Baringo 67.4 51.4 80.2 37 Laikipiaⁱⁱ (60) (41.7) (75.9) 28 Nakuru 53.3 39.6 66.5 99 Narok 67.7 59.2 75.2 116 Kajiado 69.9 52.9 82.7 48 Kericho 55.8 44 67.1 58 Bomet 56.7 42.1 70.3 58
Western Kakamega 50 40 60 150 Vihiga 49.3 37 61.7 51 Bungoma 40.5 27.6 54.9 164 Busia 55.9 45.1 66.2 71
Nyanza Siaya 65.6 50 78.4 53 Kisumu 57.4 40.7 72.6 74 Homa Bay 70.6 61.3 78.5 144 Migori 55 40.2 68.9 144 Kisii 45.5 32.4 59.3 78 Nyamiraⁱ * * * 5
Nairobi 57.4 47.3 66.9 300 Total 57.6 55 60.2 2,844
Note: Figures in parenthesis are based on 25-49 unweighted cases and should be interpreted with caution. An asterisk indicates that an estimate is based on fewer than 25 cases and has been suppressed.

APPENDIX TABLES 66
Table A20 Among children under age 5 with recent diarrhoea, the percentage given oral rehydration solution (ORS) by county, Kenya 2014 County % 95% LB 95% UB N
Coast Mombasaⁱⁱ (69.4) (52) (82.6) (58) Kwale 69.1 52.6 81.8 59 Kilifi 66.2 57.9 73.6 162 Tana River 44.7 33.3 56.6 36 Lamu 45.2 35.6 55.1 9 Taita Tavetaⁱⁱ (40) (24.5) (57.8) (18)
North Eastern Garissaⁱⁱ (61.1) (43.8) (76) (12) Wajir 57 45.5 67.8 32 Manderaⁱ * * * 5
Eastern Marsabit 57.7 45.5 68.9 13 Isioloⁱⁱ (47.8) (23.4) (73.4) (6) Meruⁱⁱ (47.4) (26.8) (68.9) (63) Tharaka-Nithiⁱⁱ (37.7) (26) (50.9) (28) Embuⁱⁱ (40.4) (23.3) (60.3) (2) Kitui 50 35.3 64.7 77 Machakos 46.7 32.3 61.6 71 Makueniⁱⁱ (49.3) (34.9) (63.9) (39)
Central Nyandaruaⁱⁱ (42.9) (26.9) (60.5) (26) Nyeriⁱ * * * 11 Kirinyagaⁱⁱ (51.7) (36.1) (66.9) (23) Murang’aⁱⁱ (44.7) (23.4) (68.2) (35) Kiambuⁱⁱ (57) (37.1) (74.8) (85)
Rift Valley Turkana 42.9 34.2 52 47 West Pokot 21.5 12.6 34.1 25 Samburu 42.6 34.8 50.8 21 Trans-Nzoia 43.3 26.9 61.3 77 Uasin Gishuⁱⁱ (7.9) (30.6) (65.7) (43) Elgeyo Marakwetⁱⁱ (65) (47.1) (79.4) (19) Nandi 45.4 30.6 61.2 42 Baringo 59.9 44 73.9 37 Laikipiaⁱⁱ (48.2) (32.6) (64.2) (28) Nakuru 56.4 41.3 70.4 99 Narok 65.1 53.8 74.9 116 Kajiado 53.5 39 67.4 48 Kericho 60.9 50.3 70.5 58 Bomet 56.9 41.2 71.3 58
Western Kakamega 47.9 37.3 58.8 150 Vihiga 51.8 40.8 62.6 51 Bungoma 40.2 28.7 52.8 164 Busia 48.8 36.2 61.5 71
Nyanza Siaya 51.3 34.8 67.5 53 Kisumu 49 32.2 66 74 Homa Bay 71.3 61.7 79.3 144 Migori 47.6 37.6 57.7 144 Kisii 49.5 37.2 61.9 78 Nyamiraⁱ * * * 5
Nairobi 63.4 53.7 72.1 300 Total 53.8 51.2 56.4 2,844
Note: Figures in parenthesis are based on 25-49 unweighted cases and should be interpreted with caution. An asterisk indicates that an estimate is based on fewer than 25 cases and has been suppressed.

APPENDIX TABLES 67
Table A21 Among women age 15-49 who had a live birth in the five years preceding the survey, the percentage who had 4 or more antenatal care (ANC) visits during pregnancy for their most recent birth by county, Kenya 2014 County % 95% LB 95% UB N
Coast Mombasa 65 60.2 69.4 422 Kwale 60.3 50.8 69 304 Kilifi 64.6 58.2 70.5 503 Tana River 50.8 43.4 58.1 115 Lamu 62.2 52.2 71.3 36 Taita Taveta 58.9 47.8 69.1 90
North Eastern Garissa 47.7 40.9 54.6 135 Wajir 37.7 27.2 49.6 141 Mandera 20.2 13 29.9 96
Eastern Marsabit 42.8 35.9 50.1 64 Isiolo 50.2 43.1 57.2 58 Meru 45.3 37.2 53.6 442 Tharaka-Nithi 56.1 47.6 64.3 121 Embu 56.2 49.1 63.1 167 Kitui 62.2 55.6 68.3 313 Machakos 60.8 54 67.2 396 Makueni 65.8 59.6 71.5 274
Central Nyandarua 58.4 49.8 66.6 195 Nyeri 61.1 55 66.9 216 Kirinyaga 60 52 67.5 174 Murang’a 61.4 51.8 70.2 255 Kiambu 67.1 61.9 71.9 688
Rift Valley Turkana 48.9 43.2 54.6 214 West Pokot 18.2 13.4 24.3 180 Samburu 51.9 43.1 60.6 79 Trans-Nzoia 40.6 32.8 48.9 382 Uasin Gishu 54.5 46.7 62 160 Elgeyo Marakwet 63 57.9 67.8 363 Nandi 46.8 38 55.9 114 Baringo 56.8 50.9 62.4 302 Laikipia 56.2 48.2 63.8 165 Nakuru 61.4 54.5 67.9 674 Narok 46 41 51.1 403 Kajiado 66.9 60 73.1 335 Kericho 53.7 47.7 59.6 277 Bomet 37.2 31.3 43.5 354
Western Kakamega 45 37.4 52.9 532 Vihiga 61.3 55 67.3 164 Bungoma 50 45.6 54.5 607 Busia 59.9 54.1 65.4 287
Nyanza Siaya 61.1 55.7 66.4 268 Kisumu 68.1 60.5 74.9 378 Homa Bay 56.4 52 60.7 360 Migori 61.4 54.2 68.1 447 Kisii 50 44 56 384 Nyamira 50.3 42.7 57.8 152
Nairobi 73.1 68.8 77 1657 Total 57.6 56.4 58.8 14,442
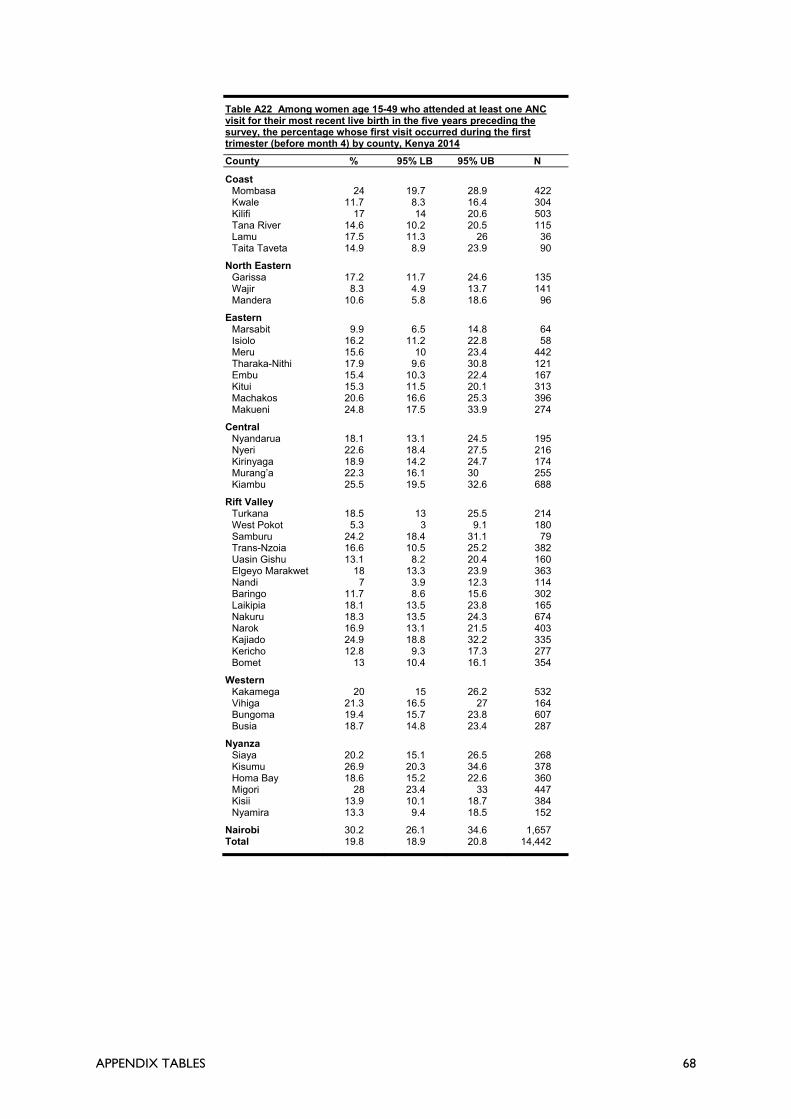
APPENDIX TABLES 68
Table A22 Among women age 15-49 who attended at least one ANC visit for their most recent live birth in the five years preceding the survey, the percentage whose first visit occurred during the first trimester (before month 4) by county, Kenya 2014 County % 95% LB 95% UB N
Coast Mombasa 24 19.7 28.9 422 Kwale 11.7 8.3 16.4 304 Kilifi 17 14 20.6 503 Tana River 14.6 10.2 20.5 115 Lamu 17.5 11.3 26 36 Taita Taveta 14.9 8.9 23.9 90
North Eastern Garissa 17.2 11.7 24.6 135 Wajir 8.3 4.9 13.7 141 Mandera 10.6 5.8 18.6 96
Eastern Marsabit 9.9 6.5 14.8 64 Isiolo 16.2 11.2 22.8 58 Meru 15.6 10 23.4 442 Tharaka-Nithi 17.9 9.6 30.8 121 Embu 15.4 10.3 22.4 167 Kitui 15.3 11.5 20.1 313 Machakos 20.6 16.6 25.3 396 Makueni 24.8 17.5 33.9 274
Central Nyandarua 18.1 13.1 24.5 195 Nyeri 22.6 18.4 27.5 216 Kirinyaga 18.9 14.2 24.7 174 Murang’a 22.3 16.1 30 255 Kiambu 25.5 19.5 32.6 688
Rift Valley Turkana 18.5 13 25.5 214 West Pokot 5.3 3 9.1 180 Samburu 24.2 18.4 31.1 79 Trans-Nzoia 16.6 10.5 25.2 382 Uasin Gishu 13.1 8.2 20.4 160 Elgeyo Marakwet 18 13.3 23.9 363 Nandi 7 3.9 12.3 114 Baringo 11.7 8.6 15.6 302 Laikipia 18.1 13.5 23.8 165 Nakuru 18.3 13.5 24.3 674 Narok 16.9 13.1 21.5 403 Kajiado 24.9 18.8 32.2 335 Kericho 12.8 9.3 17.3 277 Bomet 13 10.4 16.1 354
Western Kakamega 20 15 26.2 532 Vihiga 21.3 16.5 27 164 Bungoma 19.4 15.7 23.8 607 Busia 18.7 14.8 23.4 287
Nyanza Siaya 20.2 15.1 26.5 268 Kisumu 26.9 20.3 34.6 378 Homa Bay 18.6 15.2 22.6 360 Migori 28 23.4 33 447 Kisii 13.9 10.1 18.7 384 Nyamira 13.3 9.4 18.5 152
Nairobi 30.2 26.1 34.6 1,657 Total 19.8 18.9 20.8 14,442

