factorial designs f terms for factorials f types of factorial designs f notation for factorials f...
Post on 19-Dec-2015
229 views
TRANSCRIPT
FACTORIAL DESIGNS
Terms for Factorials Types of Factorial Designs Notation for Factorials Types of Effects Looking at Tables of Means Looking at Graphs of Means
Terms for Factorials
level: value of an IV condition: combination of levels of two or
more IV’s factor: another name for IV
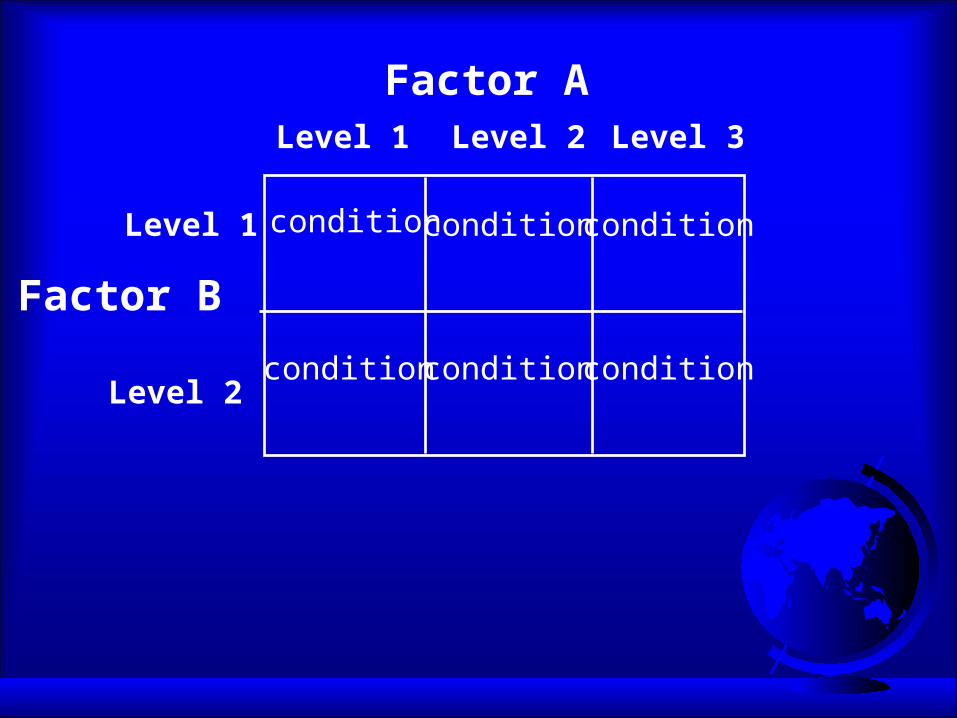
Factor A
Factor B
Level 1 Level 2
Level 1
Level 2
Level 3
condition condition condition
condition condition condition
Types of Factorial Designs
between subjects within subjects mixed
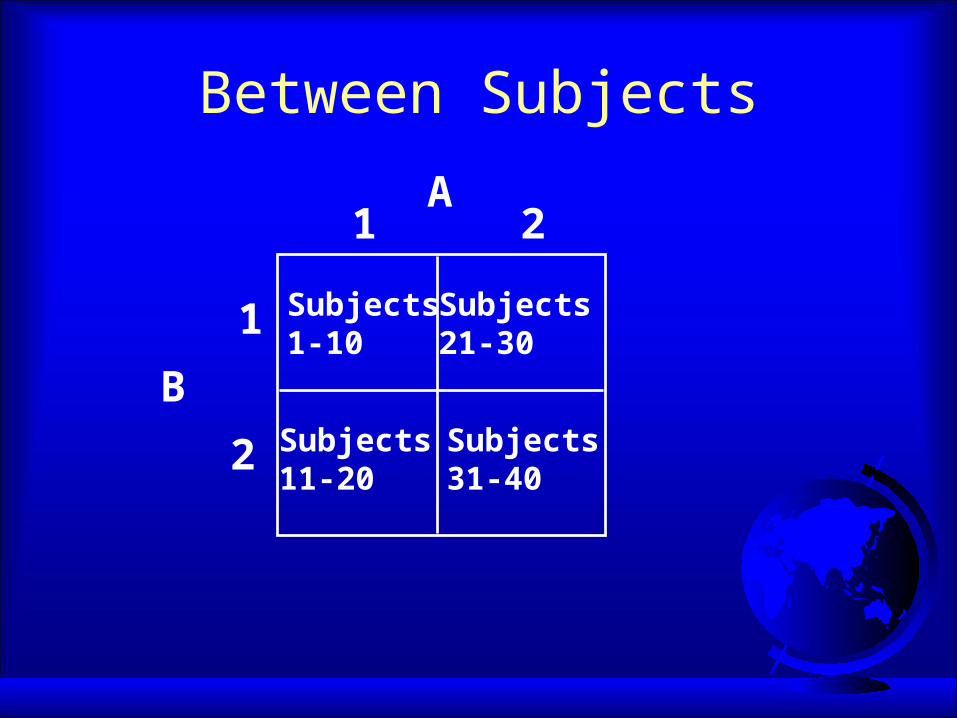
Between Subjects
B
1
2
A1 2
Subjects1-10
Subjects11-20
Subjects31-40
Subjects21-30
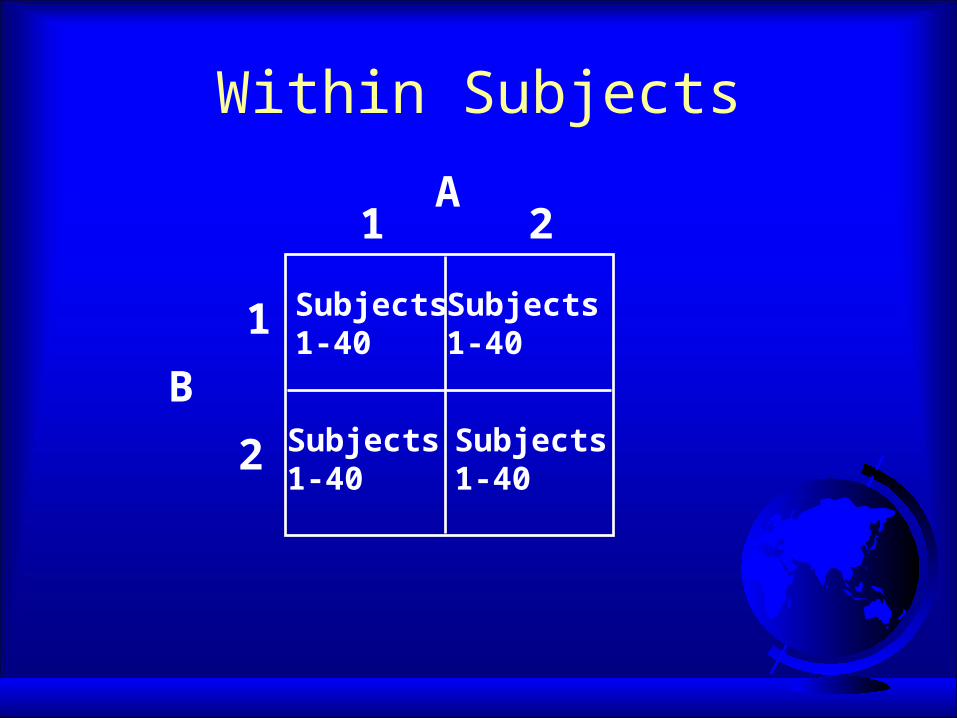
Within Subjects
B
1
2
A1 2
Subjects1-40
Subjects1-40
Subjects1-40
Subjects1-40
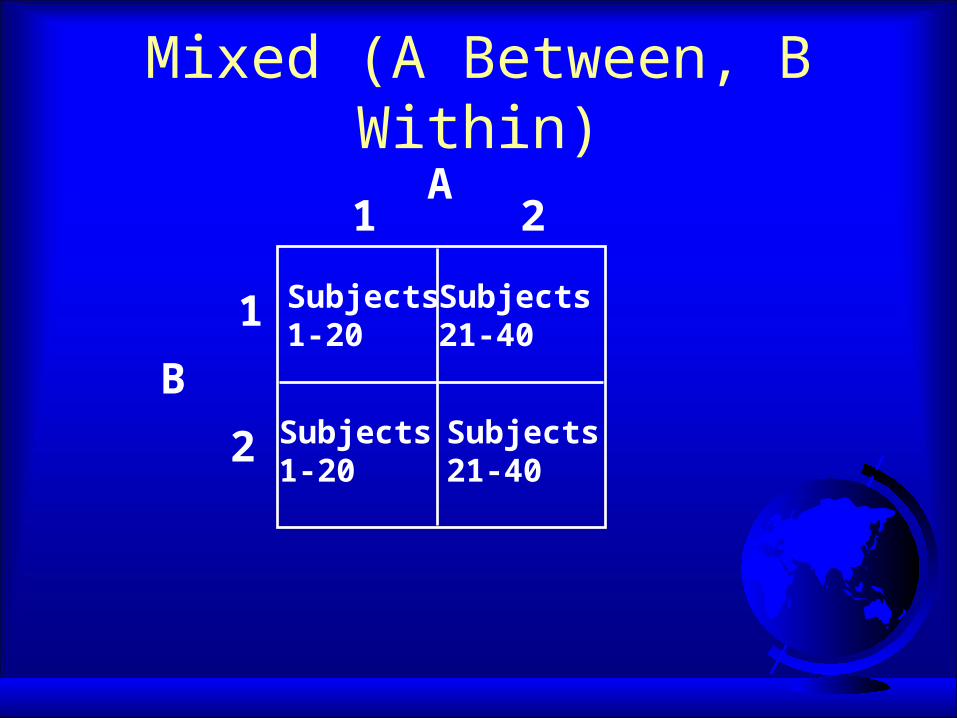
Mixed (A Between, B Within)
B
1
2
A1 2
Subjects1-20
Subjects1-20
Subjects21-40
Subjects21-40
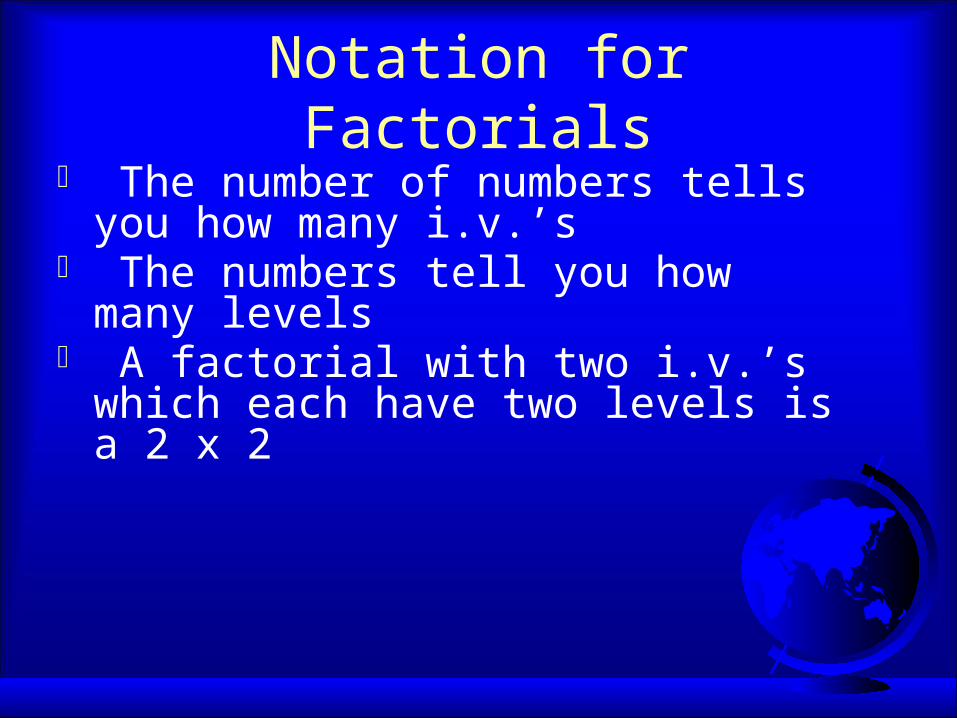
Notation for Factorials The number of numbers tells you how
many i.v.’s The numbers tell you how many levels A factorial with two i.v.’s which each have
two levels is a 2 x 2
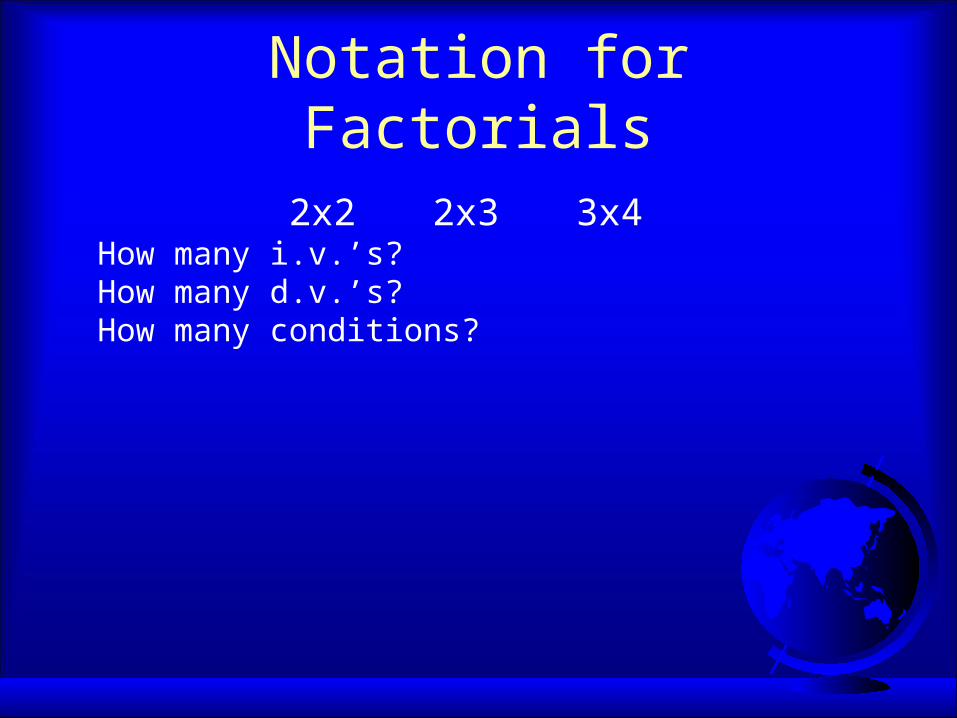
Notation for Factorials
2x2 2x3 3x4How many i.v.’s?How many d.v.’s?How many conditions?
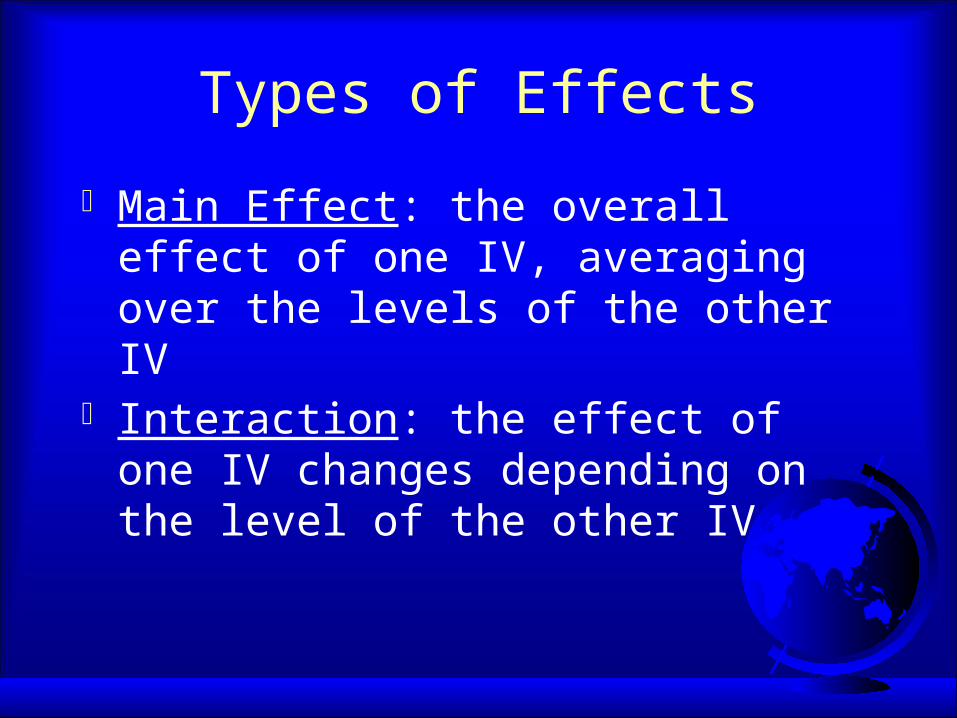
Types of Effects
Main Effect: the overall effect of one IV, averaging over the levels of the other IV
Interaction: the effect of one IV changes depending on the level of the other IV
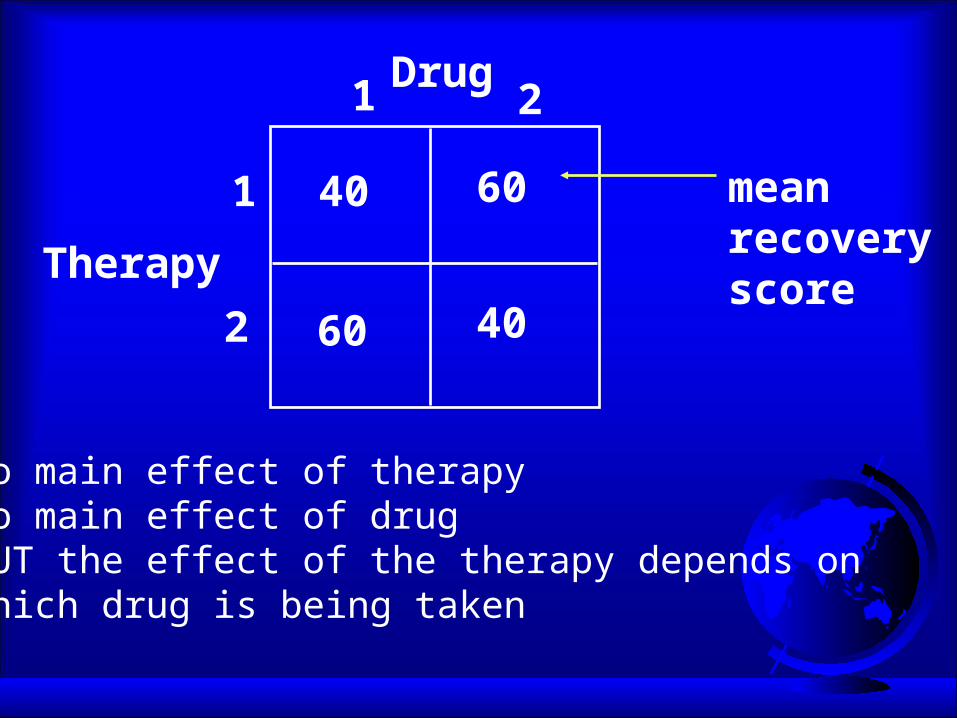
Drug
Therapy
1 2
1
2
40 60
60 40
meanrecoveryscore
No main effect of therapyNo main effect of drugBUT the effect of the therapy depends on which drug is being taken

Why Factorials?
Reduce amount of non-systematic variance Ability to measure interaction Main effects can be misleading without
considering the interaction
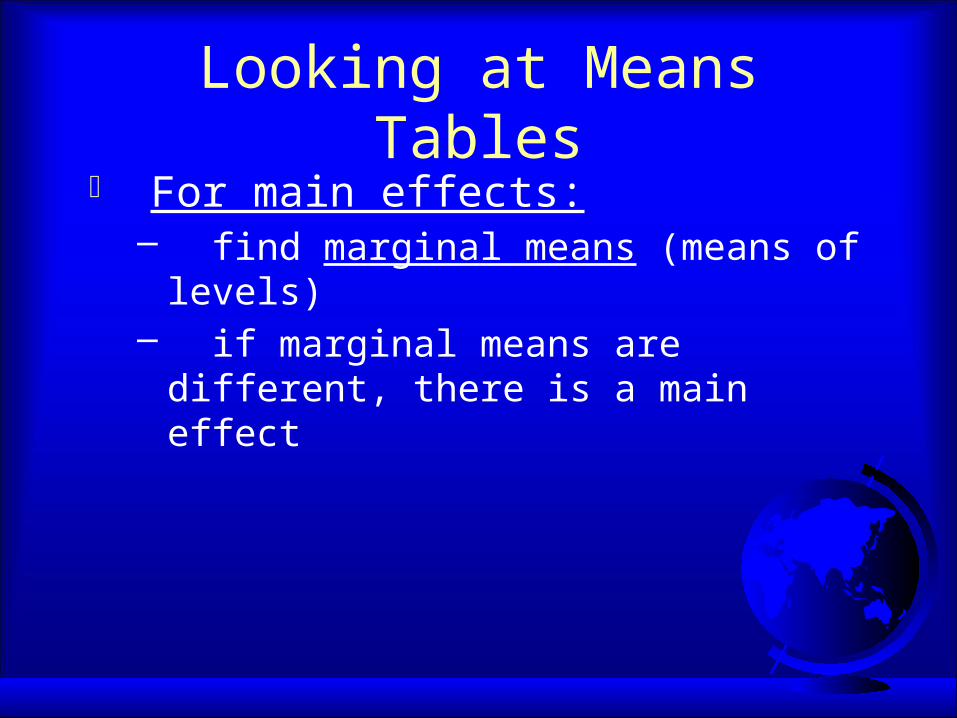
Looking at Means Tables For main effects:
– find marginal means (means of levels)– if marginal means are different, there is a main
effect
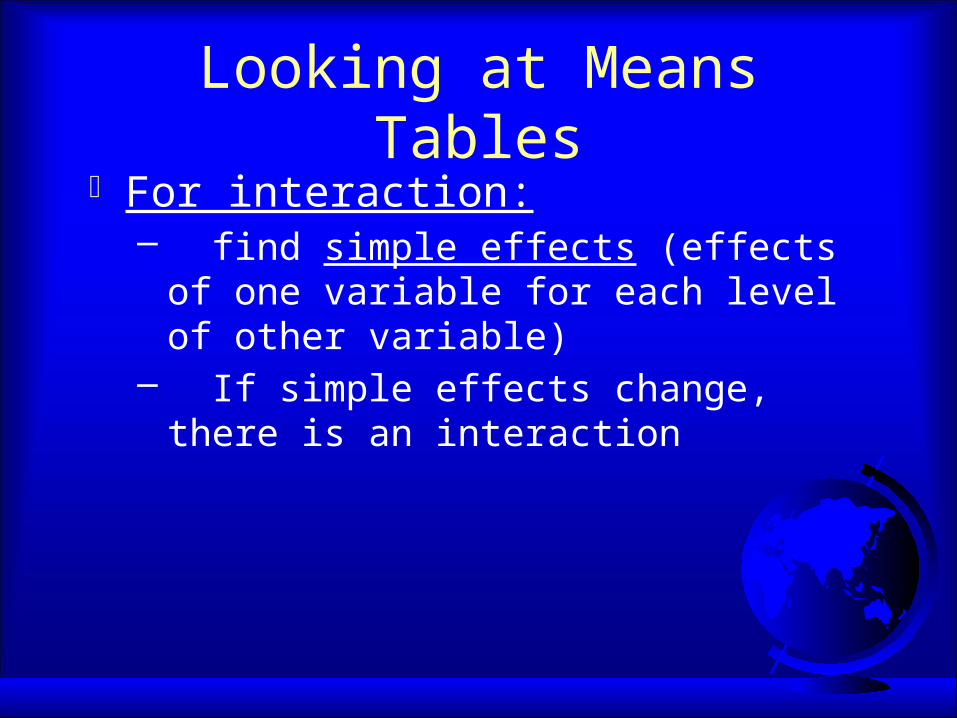
Looking at Means Tables For interaction:
– find simple effects (effects of one variable for each level of other variable)
– If simple effects change, there is an interaction
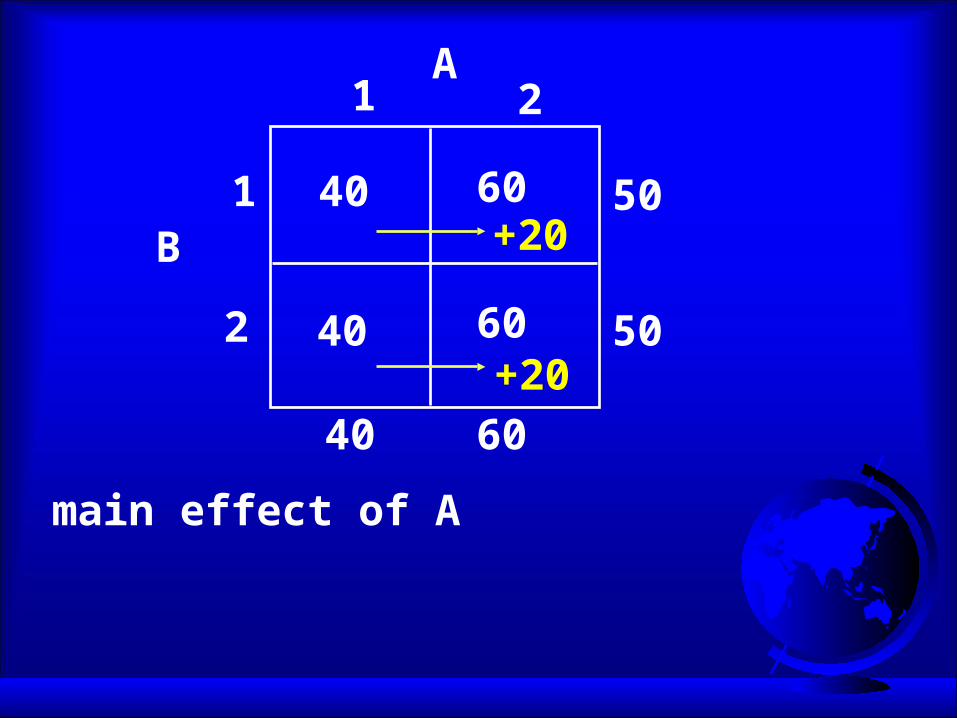
A
B
1 2
1
2
40 60
40 60
main effect of A
50
50
40 60
+20
+20
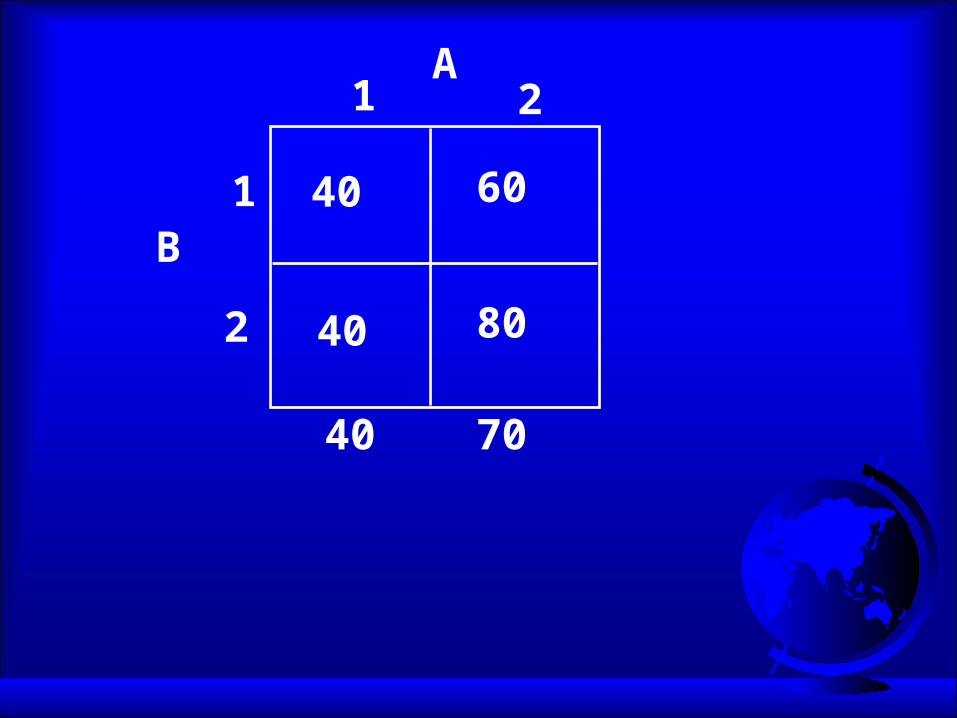
A
B
1 2
1
2
40 60
40 80
40 70
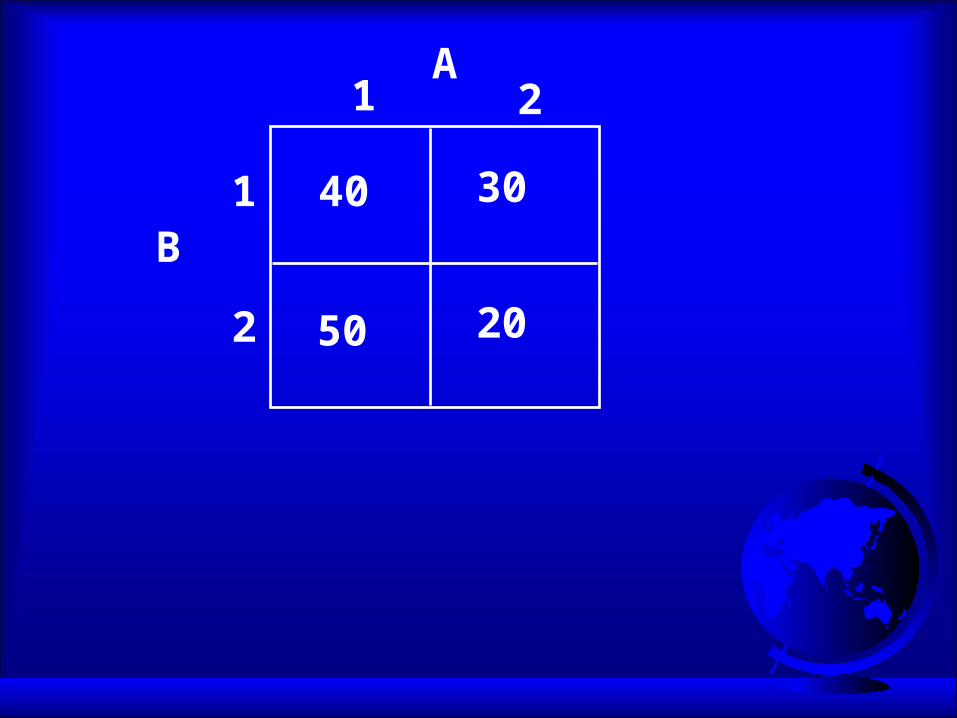
A
B
1 2
1
2
40 30
50 20
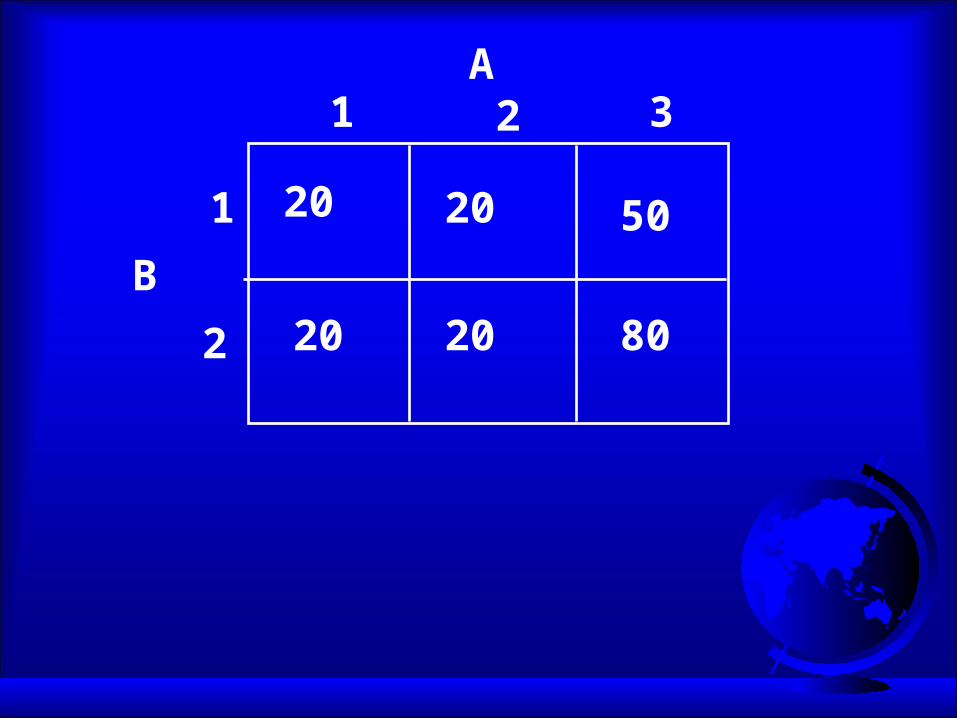
A
B
1 2
1
2
3
20
20
20
20
50
80
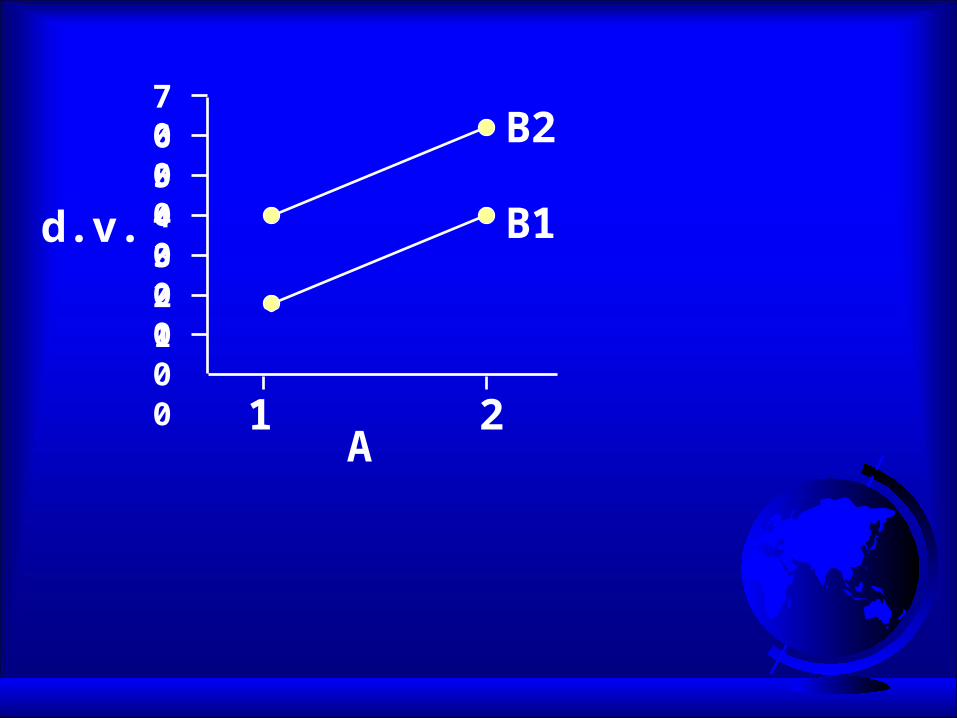
Looking at Graphs of Means
main effects: – visually estimate marginal means– if they are at different heights, there is a main
effect
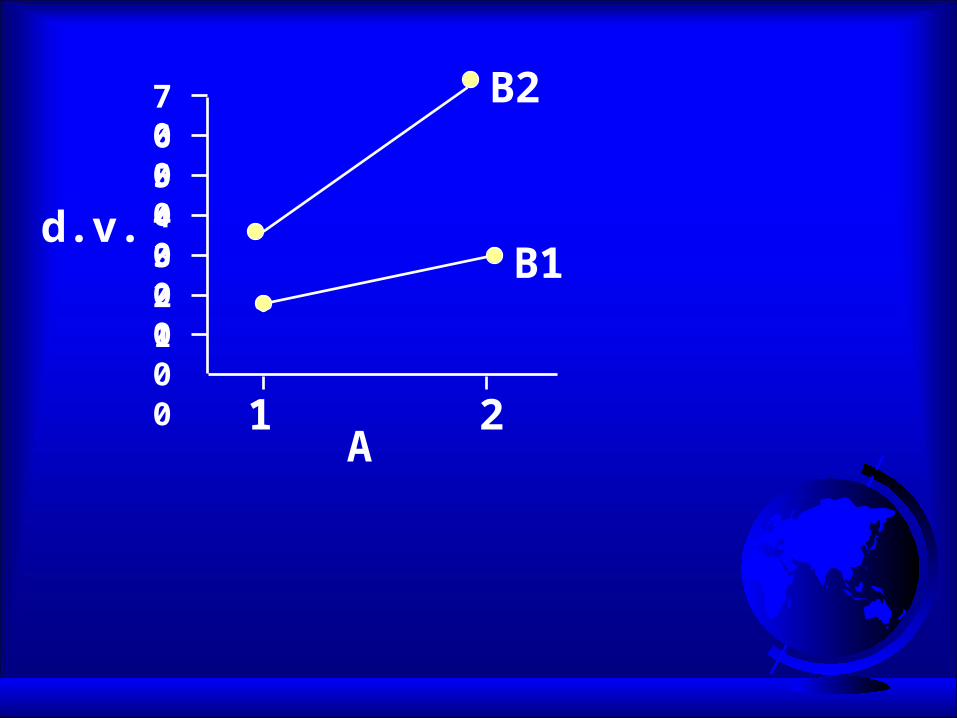
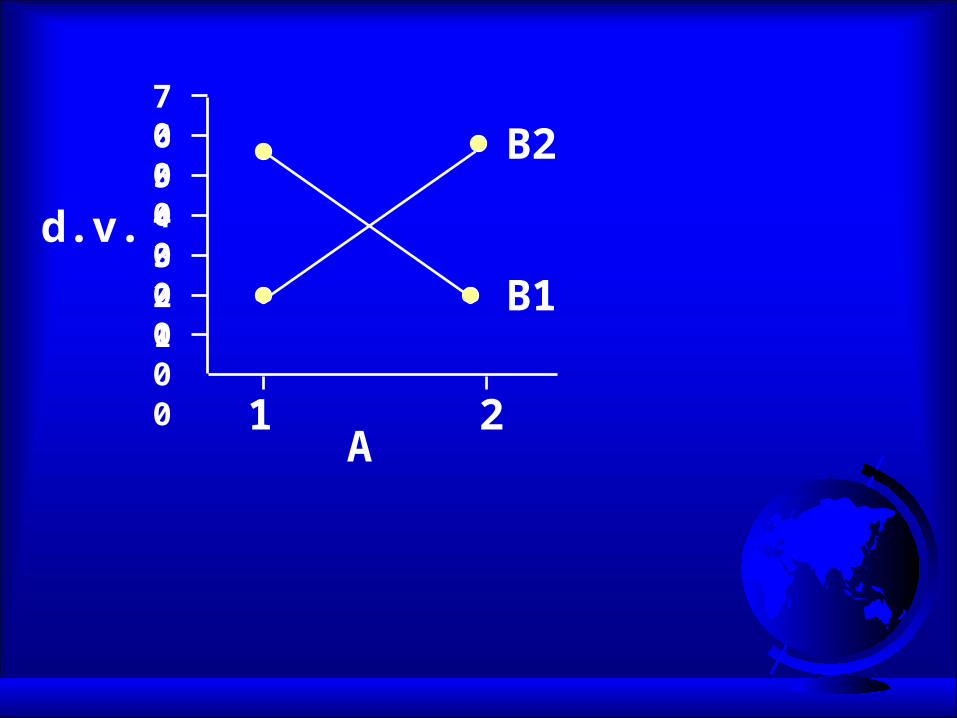
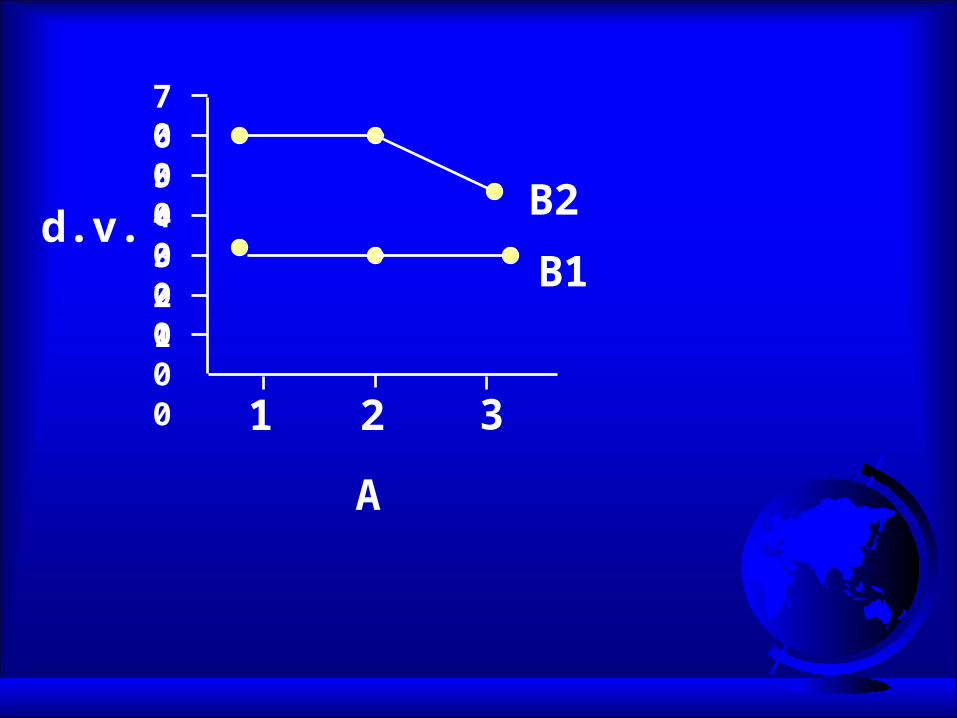
Looking at Graphs of Means
interaction:– parallel lines mean no interaction– non-parallel lines mean an interaction
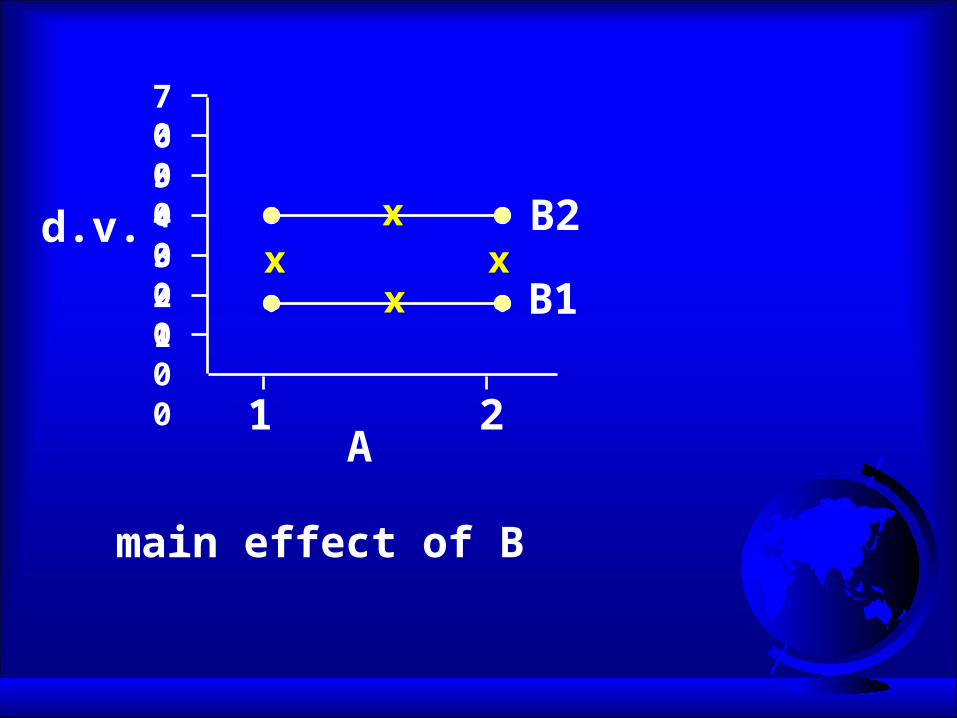
d.v.
10203040506070
0
A1 2
B1
B2x
xx x
main effect of B
d.v.
10203040506070
0
A1 2
B1
B2
d.v.
10203040506070
0
A1 2
B1
B2
d.v.
10203040506070
0
A1 2
B1
B2
d.v.
10203040506070
0
A
1 3
B1
B2
2