factor analysis of water-related disasters in sri lanka. 21 gin ganga basin map ..... 61 fig. 22...
TRANSCRIPT

ISSN 0386-5878 Technical Note of PWRI No.4066
Factor Analysis of Water-related Disasters in Sri Lanka
June 2007
The International Centre for Water Hazard and Risk Management PUBLIC WORKS RESEARCH INSTITUTE
1-6, Minamihara Tukuba-Shi, Ibaraki-Ken, 305-8516

Copyright ○C (2007) by P.W.R.I. All rights reserved. No part of this book may be reproduced by any means, nor transmitted, nor translated into a machine language without the written permission of the Chief Executive of P.W.R.I. この報告書は、独立行政法人土木研究所理事長の承認を得て刊行したものであ
る。したがって、本報告書の全部又は一部の転載、複製は、独立行政法人土木研
究所理事長の文書による承認を得ずしてこれを行ってはならない。

T e c h n i c a l N o t e of PWRI No.4066
Factor Analysis of Water-related Disasters in Sri Lanka
by
Junichi YOSHITANI Norimichi TAKEMOTO
Tarek MERABTENE
The International Centre for Water Hazard and Risk Managemant
Synopsis:
Vulnerability to disaster differs considerably depending on natural exposure
to hazards and social conditions of countries affected. Therefore, it is
important to take practical disaster mitigating measures which meet the
local vulnerability conditions of the region. Designating Sri Lanka as a
research zone, this research aims to propose measures for strengthening the
disaster mitigating system tailored to the region starting from identifying
the characteristics of the disaster risk threatening the country. To this end,
we identified the country’s natural and social characteristics first, and then
analyzed the risk challenges and their background as the cause to create and
expand the water-related disasters. Furthermore, we also analyzed the
system of the socio-economic structure, the evacuation behavior of the
affected people and related experience to disasters.
Key Words: water-ralated disaster, risk management, case study, disaster prevention plan

List of Abbreviations ADB Asian Development Bank
ASEAN Association of Southeast Asian Nation
CNO Center for National Operations
CRED Centre for Research on the Epidemiology of Disasters
DDMA District Disaster Management Authority
Div DMA Division Disaster Management Authority
DS Division Secretary
EM-DAT Emergency Disasters Data Base
FTA Free Trade Agreement
GA Government Agent
GRP Gin Ganga Regulation Project
IMF International Monetary Fund
IOC Intergovernmental Oceanographic Commission
IOTWS Indian Ocean Tsunami Warning and Mitigation System
IPKF India Peace Keeping Force
ISDR International Strategy for Disaster Reduction
JST Japan Standard Time
JVP Janatha Vimukthi Peramuna (People's Liberation Front)
LHMP Landslide Hazard Mapping Programme
LTTE The Liberation Tigers of Tamil Eelam
MAIMD Ministry of Agriculture, Irrigation and Mahaweli Development
MDMHR Ministry of Disaster Management and Human Rights
MDRS Ministry of Disaster Relief Services
MWESW Ministry of Women Empowerment and Social Welfare
NBRO National Building Research Organization
NCDM National Council for Disaster Management
NDMC National Disaster Management Center
PA People's Alliance
PRSP Poverty Reduction Strategy Paper
PTWC Pacific Tsunami Warning Center
SLFP Sri Lanka Freedom Party

TAFLOL Task Force for Logistics and Law and Order
TAFREN The Task Force to Rebuilding Nation
TAFRER Task Force for Rescue and Relief
UNCHS United Nations Centre for Human Settlements (Habitat)
UNDP United Nations Development Programme
UNESCO United Nations Educational, Scientific and Cultural Organization
UNP United National Party
UPFA United People's Freedom Alliance
USGS United States Geological Survey
UTC Coordinated Universal Time
WMO World Meteorological Organization

i
Contents 1. General Information on Sri Lanka ................................................................................................ 1
1.1 Social Economy (S01), (S16), (S18) .......................................................................................... 1 1.2 Natural Conditions (S01), (S03), (S19) ...................................................................................... 2
2. Regional and Local Features ........................................................................................................ 5 (1) Meteorological Features (S03), (S19)............................................................................. 5 (2) Hydrological and Geographical Features (S03), (S19), (S23) ............................................ 7 (3) Hydrological and Meteorological Network (S03), (S20), (S23) ...................................... 14
3. Social Structure .......................................................................................................................... 19 (1) History (S16) ............................................................................................................ 19 (2) Political System (S01), (S04), (S07), (S14), (S16), (S19), (S20) ..................................................... 20 (3) Provinces and Districts, Self-government (S01), (S14), (S16), (S20) .................................. 28 (4) Economic Situation (S16), (S21) .................................................................................. 30 (5) Industrial Situation (S16), (S21), (S22) ............................................................................ 33 (6) Culture, Religion, Language (S02), (S16), (S24) ............................................................. 37 (7) Gender (S24) ............................................................................................................. 39 (8) Minorities (S02), (S24) ................................................................................................. 41
4. Overview of Water Damage in Sri Lanka (S15) ............................................................................ 47 4.1 Overview of Floods and Landslide Disasters (S03), (S07), (S15), (S23) .................................... 50
(1) Period .................................................................................................................... 50 (2) Frequency .............................................................................................................. 53 (3) Characteristics ....................................................................................................... 55 (4) List of Damages ..................................................................................................... 67 (5) Measures (structural, non-structural) ..................................................................... 70
4.2 Overview of the December 2004 Tsunami Damage in Sri Lanka (S05), (S06), (S09), (S12), (S13)79 (1) General Overview .................................................................................................. 79 (2) Human Damage ..................................................................................................... 89 (3) Social Damage ....................................................................................................... 90 (4) Disaster Countermeasures ..................................................................................... 92
5. Damage Analysis ........................................................................................................................ 96 5.1 Damage Analysis of the May 2003 Flood and Landslide Disaster ............................. 96
(1) Flood and Landslide Disaster of Kalu Ganga (S03), (S07), (S15), (S23) ............................ 96 (2) Flood and Landslide Disaster of Gin Ganga (S03), (S07), (S15), (S23) ............................ 101 (3) Flood and Landslide Disaster of Nilwala Ganga (S03), (S07), (S15), (S23) ..................... 107
5.2 Damage Analysis of the December 2004 Tsunami (S05), (S06), (S08), (S09), (S12), (S13) ......... 114 Appendix: List of Documents Related to Sri Lanka

ii
List of Tables and Figures
Fig. 1 Topographic Map ............................................................................................................... 2 Fig. 2 Geological Map.................................................................................................................. 4 Fig. 3 Climatic Division Map ....................................................................................................... 5 Fig. 4 Frequency of Cyclones in Ceylon ...................................................................................... 7 Fig. 5 Rainfall Distribution Map .................................................................................................. 8 Fig. 6 River Basins Map ............................................................................................................. 10 Fig. 7 Surface Water Potential Map ........................................................................................... 12 Fig. 8 Spatial Variability of Annual Runoff and Precipitation in Major Rivers ....................... 13 Fig. 9 Spatial Distribution of Meteorological Stations ............................................................... 14 Fig. 10 Spatial Distribution of Gauging Stations ....................................................................... 17 Fig. 11 Flood Warning System of Kelani Ganga ........................................................................ 18 Fig. 12 Map of Local Administrations ....................................................................................... 28 Fig. 13 Path of the Cyclone that Affected the Concentrated Heavy Rain ................................ 51 Fig. 14 May 6 - 13, 2003 Weekly Rainfall ................................................................................. 52 Fig. 15 Daily Rainfall in May 2003 Observed at Ratnapura Rain-gauge Station .................... 53 Fig. 16 Hourly Rainfall Observed at Ratnapura Rain-gauge Station (72 hrs between May 16,
00:00 and May 18, 24:00) ................................................................................................... 53 Fig. 17 Comparison of Rainfall Rates Between the Past 5 Major Floods ................................ 55 Fig. 18 Kalu Ganga Basin Map .................................................................................................. 56 Fig. 19 Rainfall and Flow in Ratnapura during the May 2003 Flood ...................................... 58 Fig. 20 Number of Deaths and Missing by District Following the May 17 Landslide Disaster
............................................................................................................................................... 59 Fig. 21 Gin Ganga Basin Map .................................................................................................... 61 Fig. 22 Temporal Changes in the Gin Ganga Flood Conditions and Measures Against Disasters
............................................................................................................................................... 62 Fig. 23 Nilwana Ganga Basin Map ............................................................................................ 63 Fig. 24 Time History of the Water Levels at Bopagoda in May 2003 ...................................... 64 Fig. 25 Time History of the Water Levels at Bopagoda in June 2003………………………….64 Fig. 26 Data on the Discharge at Pitabeddara in May 2003 ....................................................... 65 Fig. 27 Data on the Daily Discharge at Piabeddara During Hydrological Year 2003 (1) .......... 66 Fig. 28 Data on the Daily Discharge at Piabeddara During Hydrological Year 2003 (2) .......... 66 Fig. 29 Example of Landslide Hazard Map ............................................................................... 73 Fig. 30 Kalu Ganga River Mouth Topography ........................................................................... 75 Fig. 31 Flood Prevention Works of Lower Nilwala Ganga ........................................................ 78 Fig. 32 Epicenter and Aftershock Area of the Sumatra Earthquake……………………………81 Fig. 33 Map of the Indian Ocean Tsunami Propagation (numbers refer to propagation time) ... 84 Fig. 34 Areas in Sri Lanka Affected by the Tsunami ................................................................. 85 Fig. 35 Geomorphic Characteristics of Afflicted Areas ........................................................... 86 Fig. 36 Wave Height Distribution in Southwest Sri Lanka Based on Research on Tsunami

iii
Traces .................................................................................................................................. 87 Fig. 37 Tsunami Movement at the Southwest Coast .................................................................. 88 Fig. 38 Extent of the Tsunami Damage in Hambantota (case where the valley floor is narrow
and the tsunami reaches the lagoon) ................................................................................... 88 Fig. 39 Number of Deaths Due to the Tsunami by Province and District (as of February 1,
2005) ..................................................................................................................................... 89 Fig. 40 Structure of the Government of Sri Lanka in Response to the December 2004 Tsunami
Disaster (Central, District, Division) ................................................................................... 94 Fig. 41 District Disaster Management Structure (DDMA) in Response to the December 2004
Tsunami Disaster (Ampara District) ................................................................................... 95 Fig. 42 Damage Factor Analysis of the May 2003 Flood and Landslide Disaster (Kalu Ganga)
(Summary of facts) .............................................................................................................. 99 Fig. 43 Damage Factor Analysis of the May 2003 Flood and Landslide Disaster (Kalu Ganga)
(Diagram) ............................................................................................................................ 100 Fig. 44 Damage Factor Analysis of the May 2003 Flood and Landslide Disaster (Gin Ganga)
(Summary of facts) ............................................................................................................ 105 Fig. 45 Damage Factor Analysis of the May 2003 Flood and Landslide Disaster (Gin Ganga)
(Diagram) ............................................................................................................................ 106 Fig. 46 Damage Factor Analysis of the May 2003 Flood and Landslide Disaster (Nilwala Gan-
ga) (Summary of facts) ........................................................................................................ 112 Fig. 47 Damage Factor Analysis of the May 2003 Flood and Landslide Disaster (Nilwala Gan-
ga) (Diagram) ...................................................................................................................... 113 Fig. 48 Damage Factor Analysis of the December 2004 Tsunami Disaster (Summary of facts)
............................................................................................................................................. 119 Fig. 49 Damage Factor Analysis of the December 2004 Tsunami Disaster (Diagram) ........... 120
Table 1 Climatic Divisions and their Characteristics ................................................................... 6 Table 2 (1) List of Ministries(1/2) ........................................................................................ 24 Table 2 (2) List of Ministries(2/2) ........................................................................................ 25 Table 3 Basic Economic Indicators ............................................................................................ 31 Table 4 Changes in the Industrial Structure Between 1993 and 2000 (GDP share: %) ............. 34 Table 5 GDP (real) Composition by Sector Between 2001 and 2005 …………………………35 Table 6 GDP (real) Composition by Sector for 2004 and 2005 ................................................. 36 Table 7 Structural Factors of Conflicts (prior to 1983) and their Effects and Alternatives ........ 42 Table 8 Factors that Contributed to Sri Lanka's Continued Conflicts ........................................ 45 Table 9 Top 10 Numbers of Deaths Caused by Natural Disasters ............................................. 47 Table 10 Top 10 Numbers of Victims Caused by Natural Disasters .......................................... 48 Table 11 Top 10 Amounts of Damage Resulting from Natural Disasters .................................. 48

iv
Table 12 Overview of the Natural Disasters that Occurred in Sri Lanka Between 1957 and 2005
............................................................................................................................................... 49 Table 13 Comparison of Basin Mean Rainfall Rates Between the Past 5 Major Floods ........... 54 Table 14 Ratnapura's Flood Classification……………………………………………………..57 Table 15 Ratnapura's Previous Flood Levels ………………………………………………….57 Table 16 Catchment Areas of Kalu Ganga's Reference Points and Peak Flows During the May
2003 Flood ............................................................................................................................ 58 Table 17 Damage Caused by the May 2003 Flood .................................................................. 67 Table 18 Damage of Kalu Ganga Basin Caused by the May 2003 Flood ......................................... 68 Table 19 Damage of Nilwala Ganga Basin Caused by the May 2003 Flood ........................... 70 Table 20 Status of Structural and Non-structural Measures for Kalu, Gin and Nilwala Ganga . 71 Table 21 Status of the Creation of Landslide Hazard Maps ....................................................... 73 Table 22 Magnitudes of Past Tsunamis ...................................................................................... 82 Table 23 Past Tsunamis that Occurred in Sumatra's Southwest Region .................................... 83 Table 24 Results of Study on Tsunami Traces at Each Location ................................................ 87 Table 25 Human Damage Caused by the Tsunami (as of February 1, 2005) ........................... 90

v
Source: S Preliminary Report on Sri Lanka's Urgent Indian Ocean Tsunami Disaster Recovery and
Rehabilitation Program (S09)
General View of Sri Lanka
Jaffina District
Jaffna
Kilinochchi District Mullaittivu District
Mullaittivu Kilinochchi
Kokkilai
Trincomalee District
Trincomalee
Mutur Kinniya
Batticaloa District
Trikkandimadu
Batticaloa
Kalmunai
AkkaraipattuAmparai District
Komari
Pottuvil
Amparai
Habanara
Galle District
Hikkaduwa
GalleMatara District Tangalla
HambatotaHambatota District

1
1. General Information
1.1 Social Economy (S01), (S16), (S18) Ever since it gained independence from the British Empire in 1948, Sri Lanka has been a democratic country where people have the right to vote for their leaders in democratic elections. The current population is about 20 million, in which the Sinhalese make up more than 70% (72.9%), forming the largest ethnic group in the nation. This is followed by the Tamils who live in the northeastern area (18%), the Sri Lankan Moors (8%), con-stituting the minority groups. Both Sinhalese and Tamil are Sri Lanka's national languag-es, while English is used as the link language. Buddhism is the major religion, with 70% of the population as followers, followed by Hinduism (10%), Islam (8.5%) and Christian-ity (11.3%). Otherwise, Sri Lanka also boasts a high adult literacy rate (92.3%) due to its particular educational system established while under the British rule whereby tuition is free up to university (See note). Furthermore, other features include high life expectancy and a low infant mortality rate. Note: The total span of schooling spreads over a period of 13 years. Tuition is free up to university level. However, there are private schools that do charge tuition.
Sri Lanka's Major Indicators
Major indicators Content
Total land area 65,610km2
Date of independence February 4, 1948 (making Sri Lanka a dominion)
Total population (2005) About 19,670,000 (excluding some areas)
Population density 314 per km2
Life expectancy (2006) 73.4 yrs old (men: 70.8 yrs old; women 76.1 yrs old)
Gross domestic product (GDP) (2005) US$ 23,540,000,000 (nominal GDP, market price)
GDP per capita (2005) US$ 1,197 (nominal GDP, market price)
Export (2005) US$ 6,351,040,000
Import (2005) US$ 8,869,420,000
Infant mortality rate (2006) 14.0/1,000 (estimate by US CIA)
Birth rate (2006) 15.5/1,000 (estimate by US CIA)
Literacy rate (2003) 92.3% (men: 94.8%, women: 90.0%)

2
In order to rebuild economic confidence that has fallen since 1983, Sri Lanka has been, under an accord with the International Monetary Fund (IMF), implementing structural adjustment policies since 1988 including cutting back government spending, privatizing public companies and easing regulations such as foreign exchange control. The negative growth the country experienced in 2001 turned positive at the beginning of 2002 and achieved dynamic growth later that same year. This was mainly due to the fact that the environment of the domestic economy improved with the development of the peace process, as well as other factors including monetary policies such as the suppression of policy rates, efforts to improve finances, development of structural reforms, and changes in the international environment such as the recovery of the global economy. Despite the negative factors in recent years such as a deterioration of public security, nat-ural disasters including tsunamis, and soaring international oil prices, the country has been maintaining an overall growth rate of about 5 - 6% due to the steady performance of the service industry.
1.2 Natural Conditions (S01), (S03), (S19) Sri Lanka is an island located about 29km south of India, between latitude 5°55' and 9°50' and longitude 79°42' and 81°53'. It is surrounded by either the Indian Ocean or Bay of Bengal and has a coastline of 1,340km. Its total land area is 65,610km2, which is slightly larger than Kyushu, and is 432km long and 224km wide. The northern half of the land is mostly flat, the southern half is a mountainous area with lush vegetation, and in the south-central part of the island stands Pidurutalagala, the highest point in Sri Lanka, rising 2,524m in the highlands along with other mountains exceeding 2,000m (See Fig. 1).
Source: 2003 Sri Lanka's Flood Damage Survey Report (S03)
Fig. 1 Topographical map

3
From areas surrounding Kandy and Nuwara Eliya are rivers flowing toward the north, south, east, and west. Among them the Mahaweli River is the longest at 335km. Its cat-chment spans 10,448km2, and it feeds 1,003 tanks. Agricultural land consists of about 15% of the entire land and the rest is mostly mountainous and densely-wooded areas. Most of the less-than-30m-above-sea-level coast consists of sandy beaches indented by coastal lagoons. In some areas of the island's most northern district of Jaffna, limestone beds are exposed to the waves as low-lying cliffs. In the northeast and south coastline, rocky cliffs, bays and offshore islands can be found. These conditions have created one of the world's best natural harbors at Trincomalee on the northeast coast and at Galle on the southwestern coast.
Fig. 2 shows Sri Lanka's geological conditions. Most of the island is underlain by meta-morphic rocks and granites (hereinafter called "ancient rocks") which constitute the orig-inal rocks accumulated during the Precambrian age (over 600 million years ago). These rocks form the south Indian shield, one of the oldest crusts on earth, which has undergone metamorphism during either the middle Precambrian age (1,300 million - 1,500 million years ago) or the early Paleozoic age (450 million - 550 million years ago). These ancient rocks are divided into three major units: the Vijayan Complex, the Highland Group and the Southwestern Group, which are composed of metamorphic rocks originating from various types of accumulated rocks, in other words various types of gneiss, granite, char-nockite and granulite. The accumulated rocks of the Jurassic period of the Mesozoic era are distributed as small crustal blocks in the faults of the western Vijayan Complex. In addition, Miocene fast limestone (Jaffna limestone) is found along the northwestern coas-tline, on the northern Jaffna peninsula and western islands. The sediments of the fourth period of the Cenozoic era covered the above-mentioned ancient rocks and accumulated rocks, forming a relatively good aquifer.

4
0 10 20 30 40 50km
SCALE
トリンコマレー
バティカロア
カロダイ
ハンバントタ
ゴール
ラトナプラ
コロンボ
ガンパナ
クルネガラ
キャンディ
プタラム
バブニア
マナー
バドゥラヌワラエリヤ
クマナ
カタラガマ
タンガラ
アンバランゴダ
パラマ
アンディガマ
トニガラダンブラ
マンクラム
ジャフナ 第4紀
中新世紀
ジュラ紀
Vijayan Complex
HighLand Group
Southwestern Group
Caarbonatite
花崗岩
Dolerite
INTRUSIVES
N
Source: 2002 Report on the Aid Policy Research (Democratic Socialist Republic of Sri Lanka) (S19)
Fig. 2. Geographical Map
Jaffna
Mankulam
Mannar
Trincomalee
Vavuniya
Puttalam
Quaternary Miocene Jura Vijayan Complex Highland Group Southwester Group
Carbonite Granite Dolerite
Tonigala
Andiga-
Pala-Kurene-
Dambulla
Karodai
Kandy
Catticaloa
Badulla Nuwara Eliya
Ratnapura
Kataragama
Ku-
Galle
Ambalagoda
Colom-
Tangalla
Hambantota
Gampana
5
2. Regional and Local Features
(1) Meteorological Features (S03), (S19)
1) Climate・Climatic Division
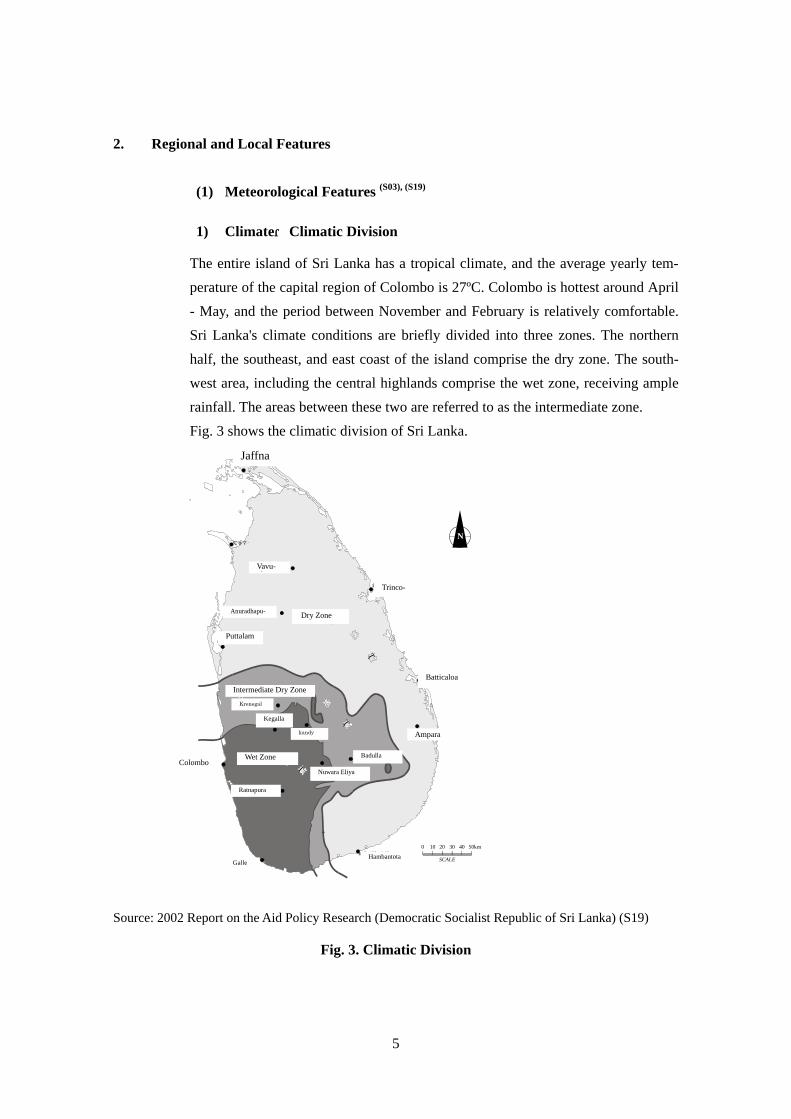
The entire island of Sri Lanka has a tropical climate, and the average yearly tem-perature of the capital region of Colombo is 27ºC. Colombo is hottest around April - May, and the period between November and February is relatively comfortable. Sri Lanka's climate conditions are briefly divided into three zones. The northern half, the southeast, and east coast of the island comprise the dry zone. The south-west area, including the central highlands comprise the wet zone, receiving ample rainfall. The areas between these two are referred to as the intermediate zone. Fig. 3 shows the climatic division of Sri Lanka.
ジャフナ
トリンコマレー
バッティカロア
アンパラ
ハンバントタ
ゴール
ラトナプラ
コロンボ
ケガラ
クルネガラ
キャンディ
プタラム
アヌラダプラ
バブニア
マナー
バドゥラ
ヌワラエリヤ
N
0 10 20 30 40 50km
SCALE
乾 燥
地
域
半乾 燥
地
域
湿 潤 地域
Source: 2002 Report on the Aid Policy Research (Democratic Socialist Republic of Sri Lanka) (S19)
Fig. 3. Climatic Division
Jaffna
Trinco-
Vavu-i
Anuradhapu- Dry Zone
Puttalam
Batticaloa Intermediate Dry Zone
Kegalla
Ampara
Colombo Wet Zone Badulla
Nuwara Eliya
Ratnapura
Hambantota Galle
kandy
Krenegal

6
Sri Lanka is greatly affected meteorologically by the monsoons that hit the country twice a year. It is subject to two monsoons: the southwest monsoon or Yala season from May to September and the northeast monsoon or Maha season from December to the following February. Due to these monsoons, the meteorological conditions are categorized into 4 periods as shown in the following Table 1.
Table 1. Climatic Divisions and their Characteristics Division Period Characteristics
Inter-Monsoon Season (March April)
March - April
During this period, the equatorial trough moves from the island's south to north. Due to the re-sulting humid air from the southwest thus brings frequent showers and thunderstorms mainly in the southwest regions.
Southwest Monsoon Sea-son (Yala)
May - Sep-tember
During this season, the equatorial trough shifts northward, as a result of which the humid mon-soon from the Indian Ocean penetrates the island from the southeast. The monsoon then hits the central highlands, bringing an average of 1,000 to 3,500mm of rainfall in the southwest area of the island. During this period, 3,000 to 4,000mm of rainfalls in Sri Lanka's central highlands.
Inter-Monsoon Season (October - November)
October - November
During this season the equatorial trough moves from the center of the island toward the south, causing a tropical storm or cyclone that brings rain across the entire island.
Northeast Monsoon Sea-son (Maha)
December - following February
During this period, because the equatorial trough has shifted southward, the monsoon from the northeast hits the east side of the island and brings rain in that area.
Source: 2003 Sri Lanka's Flood Damage Survey Report (S03)
2) Frequency of Cyclones
Located between latitude 5°55' and 9°50' and longitude 79°42' and 81°53', Sri Lanka is affected by cyclones formed in the Bay of Bengal. As shown in Fig. 2, cyclones are not that frequent, with less than 20 of them recorded during a period of 100 years, most of which are concentrated between November and December.
However, past records show that Sri Lanka suffered severe damage in the east, north and northern central areas. The most recent cyclones that hit the island were in 1921, 1931, 1964, 1978, 1993, 1994, 1997 and 1998.
Meanwhile, as will be mentioned later in 4.1, a cyclone unusually formed and stalled in the Bay of Bengal in May 2003, which caused torrential rainfall in Sri Lanka.

7
Source: 2003 Sri Lanka's Flood Damage Survey Report (S03)
Fig. 4. Frequency of Cyclones in Ceylon
(2) Hydrological and Geographical Features (S03), (S19), (S23)
1) Precipitation
Fig. 5 is the precipitation map of Sri Lanka. Among the 3 types of climatic condi-tions mentioned in (1) 1), the dry zone covers about 3/4 of the island, with a mean annual rainfall of less than 1,900mm, and precipitation during the dry season of less than 500mm. Precipitation is higher than in the above-mentioned dry zone in the wet and intermediate zones, with mean annual rainfalls of 3,000 - 7,500mm and 2,000 - 3,000mm, respectively.

8
ゴール
カルタラ
マタラ
タンゴール
ハンバントタ
ヤラ
アンパラ
マハオヤ
バティカロア
プタラム
アヌラダプラ
バブニア
マナー
ジャフナ
カンケサントゥライ
ネゴンボ
クルネガラ
キャンディ
コロンボ
ラトナプラ
ヌワラエリヤ
バランゴダ
ディヤタラワハンウェラ
トリンコマレー
500~
1000
1500~2000
1000~1500
3000~4000
2000~3000
1000~1500
2000~3000
3000
~400
0
500~1000
1000~1500
1500~2000
1000~1500
1500~2000
7500
4000~5000
3000~4000
500~1000
1500~2000
スリ・ランカ
年間平均降水量 (mm)(1961~1990)
N
Source: 2002 Report on the Aid Policy Research (Democratic Socialist Republic of Sri Lanka) (S19)
Fig. 5. Precipitation Map
2) Features of the Major River Basins
As shown in Fig. 6, Sri Lanka is divided into 103 river basins. The rivers of Sri Lanka flow in a radial pattern from central massif toward the sea. The river chan-nels in the central highlands are often cut off from the main river due to disconti-nuous geological structures, and numerous waterfalls and rapid streams are formed on cliffs and steep slopes. The velocity of these rivers decreases as they reach the plains as they meander through flood plains and deltas. In Sri Lanka, large rivers are called GANGA, medium-sized rivers are called OYA, and small rivers are called ARU. However, most of the rivers on the island are small drainage basins, with only 17 rivers out of the 103 basins that have a basin area of more than
Tangalle Galle
Matara
Hambantota
Balango-
Diyatalawa
Karutara
Ratnapura
Colombo
Ampara
Mahaoya
Kandy
Batticaloa
Kurenegala
Puttalam
Anuradhapura
Trincomalee
Vavuniya
Jaffna
Kankesanturai
Sri Lanka Annual average precipitation (mm) (1961-1990)
Mannar
Nuwara Eliya
Yala
Negombo
Han-

9
1,000km2.
Sri Lanka's largest river is Mahaweli Ganga (No. 60 in Fig. 6) with a length of 335km and a basin area of 10,448km2. In addition, 6 rivers have a basin area be-tween 3,500km2 and 2,000km2, as follows:
2,000km2 - 1,000km2 10 rivers 1,000km2 - 500km2 11 rivers 500km2 - 100km2 32 rivers 100km2 - 43 rivers
Meanwhile, there are 16 rivers whose lengths exceed 100km, among which 12 re-lease 75% of the entire country's average river flow.

10
Source: 2002 Report on the Aid Policy Research (Democratic Socialist Republic of Sri Lanka) (S19)
Fig. 6. River Basins Map

11
In general, the water volume of most of the rivers excluding large rivers such as Mahaweli Ganga varies according to the season and many run dry during the dry season. However, the rivers that have a headstream on the humid western slope flow throughout the year. Even in terms of the surface water potentials by area (See Fig. 7), although the values are high from the central highlands down to the south-west area, they do not even reach 500mm in the dry zones.
Rivers that are particularly vulnerable to floods include Kalu Ganga (No. 3 in Fig. 6), Kelani Ganga (No. 1 in Fig. 6), Gin Ganga (No. 9 in Fig. 6) and Nilwala Ganga (No. 12 in Fig. 6) that flow on the western slope, as well as the Mahaweli Ganga which originates from the central highlands and supplies large amounts of water to the eastern dry zone.
In addition to the precipitations shown in Fig. 5, Fig. 8 provides information on the different basins and runoff of major rivers. The column graphs in the figure represent the annual runoffs of the rainfall in the basins (height of the column) and percentage discharge to sea (lighter blue area). These show that water use is low in rivers that are vulnerable to floods (unable to use the large volumes of rain that fall over the course of the year, the water is discharged to the sea).

12
Source: 2002 Report on the Aid Policy Research (Democratic Socialist Republic of Sri Lanka) (S19)
Fig. 7. Surface Water Potential Map

13
Source: 2003 Sri Lanka's Flood Damage Survey Report (S03)
Fig. 8. Spatial Variability of Annual Runoff and Precipitation in Major Rivers
Kalu Ganga basin
Ratnapura
Karutara
Kalu Ganga Kalu Ganga
Colombo
Mahaweli Ganga

14
(3) Hydrological and Meteorological Network (S03), (S20), (S23)
1) Meteorological Observation
Overview
The history of meteorological observation in Sri Lanka in the form of rain gauging dates back to 1850, and the first systematic records of the results have been put to-gether by the Ceylon Research Bureau between 1866 and 1883. Today, the De-partment of Meteorology enacted in the parliament in October 1948 has deployed a network of observations across the entire country. Fig. 9 shows the distribution of weather stations in Sri Lanka. There are 22 meteorological stations in the country, mainly in the major cities of each area. As for rain-gauge stations outside the De-partment of Meteorology, there are 42 agro-meteorology stations controlled by the Department of Irrigation and district agencies, as well as over 350 rain-gauge sta-tions on private property. All these observing stations form the meteorological network.
Source: 2003 Sri Lanka's Flood Damage Survey Report (S03)
Fig. 9. Spatial Distribution of Meteorological Stations

15
Network of Observation
As shown in Fig. 9, although Sri Lanka does not have an automated rain gauging network, its density is high. However, the rain gauging network is dense in the southwest area but low in the northeast area. The agro-meteorology stations under the jurisdiction of the Department of Irrigation are also not automated, but auto-mated observation is carried out with the rain gauge installed at 8 gauging stations. Meanwhile, the observation data of the Department of Meteorology and those of the Department of Irrigation are not used together.
The oldest observing stations have been in operation since the 1920s, but the cur-rent number of stations has only been reached around 1990. Today new observing stations continue to be established as necessary.
Observation and Report System
Because all the operations of the observing stations under the direct jurisdiction of the Department of Meteorology are performed manually, real-time access to me-teorological information is in fact impossible. Observations are done every 3 hours at meteorological stations and once a day (9:00 a.m.) at rain-gauge stations. Ob-servations are carried out in meteorological enclosures and not by remote control. The data of the self-recording rain gauge are recorded every 3 hours on paper and stored, and hourly data can be read by staff members as necessary.
The transmission of observation data from meteorological stations and rain-gauge stations of each area to the Department of Meteorology is done by telephone (voice). Meteorological Stations have jurisdictional boundaries. First, the observed data of the rain-gauge stations within the jurisdictional boundaries are collected and then the data of each jurisdictional boundary are reported to the Department of Meteorology.
In Sri Lanka, there are no sophisticated rainstorm warning systems like there are in Japan. Sometimes a warning is issued when a cyclone is expected to develop in the vicinity. These warnings are issued through media including television and radio. As for government agencies, fax or telephone is used to issue the warning. Trans-mission of the warning by fax is always directly performed by the Department of Meteorology, even when sending it to local authorities.

16
2) Hydrological measurement
Overview
With regard to flood control, several ministries are involved. However, the respon-sibility of determining flood zones, developing flood-control plans that include structural measures to control flooding in flood zones, flood prevention, and offi-cial announcements of flood warnings lies in the Department of Irrigation at the Ministry of Agriculture, Irrigation and Mahaweli Development (MAIMD). In addi-tion, hydrological measurement is controlled by the Hydrology Division of the Department of Irrigation. Duties of the Hydrology Division include the gathering, organization, storage and dissemination (disclosure) of hydrological data, hydro-logical studies as well as estimation of dam reservoir inflow and outflow rates.
The observation items are as follows: water level, flow, precipitation, evaporation, wind velocity, temperature, solar radiation and sediment level.
Network of Observation
Sri Lanka has 69 gauging stations installed at 17 river basins. Fig. 10 shows the locations of these gauging stations.
The 17 rivers listed in the figure are the Kelani Ganga, No.1 in Fig. 6), Kalu Ganga (No. 3 in Fig. 6), Gin Ganga (No. 9 in Fig. 6), Nilwala Ganga, No. 12 in Fig. 6), Walawe Ganga (No.18 in Fig. 6), Kirindi Oya (No. 22 in Fig. 6), Menik Ganga (No. 26 in Fig. 6), Kumbukkan Oya (No. 31 in Fig. 6), Wila Oya (No.35 in Fig. 6), Maduru Oya (No.54 in Fig. 6), Mahaweli Ganga (No.60 in Fig. 6), Malwatu Oya (Aruvi aru)No.90 in Fig. 6), Kala Oya (No.93 in Fig. 6), Mi Oya (No.95 in Fig. 6), Deduru Oya (No.99 in Fig. 6), Maha Oya (No.102 in Fig. 6) and Attanagalla Oya (No.103 in Fig. 6).

17
Source: Hydrometric Network & Flood Mitigation (S23)
Fig. 10. Spatial Distribution of Gauging Stations
Observation and Report System
According to the Reference S23 (Hydrometric Network & Flood Mitigation), there are 39 (57%) observing stations among the 69 gauging stations with rating curves for flow calculations. Therefore it is believed that flow conversions are not per-formed at the other remaining observing stations. In addition, as records show that

18
among the 69 gauging stations, 16 observing stations have wage-stage recorders and are cable-connected, this most likely means that 16 gauging stations (23%) possess an automated wired observing network system. Unfortunately, information could not be obtained regarding which gauging stations in Fig. 10 have rating curves, an automated observing system, and how often the observations are carried out (once a day, twice a day, every hour, etc.).
Projects are underway to introduce flood warning systems as needed at major riv-ers in order to reduce the frequent flood damage in Sri Lanka. Currently the only river with such a flood warning system is Kelani Ganga, as shown in Fig. 11.
Source: Hydrometric Network & Flood Mitigation (S23)
Fig. 11. Flood Warning System of Kelani Ganga
A warning is issued based on the data obtained on precipitation and water levels at each of the points presented in the above figure (ex: start of flood monitoring in case of continuous rainfall of 120mm and water level exceeding 3m). Warnings are issued to the general public through broadcasting media. Water levels of Kelani Ganga are reported in real time using reserved radio frequencies to Colombo's De-partment of Irrigation.

19
3. Social Structure
(1) History (S16)
The following chronological table shows a brief background description of Sri Lanka.
483 B.C. Landing of Prince Vijaya (known as the founding father of the Sinhalese people) in Sri Lanka Foundation of the Sinhalese Dynasty
250 B.C. Introduction of Buddhism
1505 Arrival of the Portuguese (colonized the coastal areas)
1658 Arrival of the Dutch (colonized the coastal areas)
1802 By the Treaty of Amians the Dutch part of the island was formally ceded to Britain.
1815 The Kingdom of Kandy was invaded and the entire island became a colony of Britain.
1948 Receives dominion status in the Commonwealth of Nations
1956 Bandaranaike becomes Prime Minister. The Sinhala Only Bill passes making Sinhalese the only official language of the country.
1972 Country name becomes Free, Sovereign and Independent Republic of Sri Lanka. (Dominion of Ceylon granted full independence.)
February 1978 Jayewardene becomes President (introduces a presidential system).
September 1978 Country name becomes Democratic Socialist Republic of Sri Lanka.
July 1983 Major riots
July 1987 Signing of a peace accord between Sri Lanka and India Occupation of the Indian Peace Keeping Force (IPKF) in Sri Lanka
November 1987 Amendment of the Constitution (Both Sinhalese and Tamil become the official languages of Sri Lanka. In-troduces the Provincial Councils System)
January 1989 Premadasa becomes President.
March 1990 Complete withdrawal of the IPKF
May 1993 President Premadasa assassinated

20
Premadasa succeeded by Wijetunga
November 1994 Presidential elections, Kumaratunga becomes President.
December 1999 Presidential elections, Kumaratunga re-elected as President
December 2001 Opposition party United National Party (UNP) wins a major victory at the general elections. Wickremasinghe becomes Prime Minister.
February 2002 Agreement on a ceasefire between the government and LTTE
September 2002 Start of negotiations for peace between the government and LTTE
April 2003 Statement by LTTE of temporary interruption of the negotiations for peace
June 2003 Tokyo Conference on Reconstruction and Development of Sri Lanka
April 2004 The opposition party United People's Freedom Alliance (UPFA) wins at the general elections. Rajapaksa becomes Prime Minister.
December 2004 Due to the Great Sumatra Earthquake and Indian Ocean Tsunami, the en-tire coastline of Sri Lanka other than the northwestern area was struck, re-sulting in more than 30,000 victims.
August 2005 Foreign Minister Kadirgamar assassinated
November 2005 Rajapaksa becomes President.
February 2006 Talks on the Ceasefire Agreement between the government and LTTE
July 2006 Issue surrounding the closing of the Mavil Aru sluice gate leads to fierce violence.
October 2006 Talks between the government and LTTE
(2) Political System (S01), (S04), (S07), (S14), (S16), (S19), (S20)
Political System
Even before it gained independence from the British Empire in 1948, Sri Lanka was a demo-cratic country with several parties where people had the right to vote for their leaders in dem-ocratic elections. Although the two main political parties, namely the United National Party (UNP:United National Party) with a strong liberalistic tendency and the socialism-oriented Sri Lanka Freedom Party (SLFP:Sri Lanka Freedom Party) had been alternately ruling Sri Lanka after gaining independence, there followed a long period of rule by the United National Party for 17 years from 1977.
With regard to economic policies, the J.R. Jayewardene administration of 1977 introduced

21
economic policies based on principles of a free market economy and in 1978 changed the name of the country to Democratic Socialist Republic of Sri Lanka under the Constitution, promoting efforts toward economic structural reforms to grow into an open market economy as a member of international society. In the late 1980s, the IMF and World Bank pressed the country to streamline the bloated public sector, to reduce foreign debt and to promote finan-cial reform.
Even during the People's Alliance (PA) government led by President Kumaratunga between 1994 and 2001, the open economy was maintained and structural adjustments including pri-vatization were put into effect. Furthermore, during the 2001-2004 UNP regime, a grand plan entitled "Regaining Sri Lanka" was elaborated in December 2002 to develop a market econ-omy and revitalize the private sector through the creation of new employment, redistribution of resources and reduction of public debt, etc., and an economic structural reform policy aim-ing at increasing domestic productivity and developing the country's economy. The policy stated among other things that a Poverty Reduction Strategy Paper should be formulated to reduce poverty, and was highly valued by the World Bank, etc. Meanwhile, although a new administration, the United People's Freedom Alliance (UPFA) administration, was formed during the general elections in April 2004, this new administration continues to promote eco-nomic structural reforms in order to ensure Sri Lanka's medium- to long-term economic growth.
As a result, despite the change of government following the long period of rule that began in 1977 the government of Sri Lanka still pursues economic structural reforms centered on a market economy to improve national finance. In addition, the government has been making efforts to change from an agriculturally-dependent nation, that has since old times been culti-vating rice and producing three major plantation products (tea, rubber and coconuts) to a more industrialized one in areas such as the textile industry. As a result, Sri Lanka has been main-taining its mean annual economic growth rate at about 5% since the 1990s (note: The real GDP growth rate for 2001 was negative (-1.5%) for the first time its independence due to factors such as stagnation of agricultural production caused by drought conditions, sluggish import-related manufacturing industry, and a drop in tourism caused by the bombing incident at the Colombo International Airport by The Liberation Tigers of Tamil Eelam (LTTE). In 2002 the economy took an upturn and recovered due to the Ceasefire Agreement with the LTTE.)
By taking advantage of its geopolitical position, Sri Lanka is aiming at strengthening diplo-matic and economic ties with Southwest Asian Nations and the Association of Southeast Asian Nations (ASEAN) as a result of which it signed a Free Trade Agreement with India. In June 2005, the Free Trade Agreement with Pakistan also went into effect.
In Sri Lanka, the biggest issue in terms of internal affairs is the ethnic conflicts between the country's majority Sinhalese and minority Tamils. A civil war has been going on over a span

22
of about 20 years between the government and the LTTE whose aim is to carve out a separate state in the North Eastern area of Sri Lanka. However, a ceasefire agreement was signed in February 2002 through the facilitation of the government of Norway, and peace talks began in September of the same year.
In order to clarify the positive role Japan is to play in the peace negotiations, Akashi, former Undersecretary General of the United Nations, was appointed in October of the same year as representative of the Government of Japan for the peace building, rehabilitation and recon-struction in the Democratic Socialist Republic of Sri Lanka. Furthermore, the Tokyo Confe-rence on Reconstruction and Development of Sri Lanka was held in June 2003, with the par-ticipation of Ministers and representatives from 51 countries and 22 international organiza-tions.
In the Tokyo Declaration adopted during the said Conference, the international community jointly pledged a total of US$ 4.5 billion (US$ 1 billion over a period of 3 years for Japan) in aid over a four-year period. Moreover, while promptly dealing with the humanitarian and re-construction assistance as the dividend of peace to carry forward the peace process, they agreed that for full-scale reconstruction assistance to the north and eastern areas, a clear commitment by both parties, in other words the government of Sri Lanka and the LTTE, to progress in the peace negotiations was necessary, and that assistance by the international community must be closely linked with the peace process.
Meanwhile, although a total of 6 peace talks were held with the government of Sri Lanka until March 2003, in April of the same year, the LTTE pulled out of the negotiations on the grounds that they were unhappy with how the government dealt with the peace talks. After the Tokyo Declaration, the government side proposed an interim administration in July of the same year, while the LTTE side submitted a counterproposal in October of the same year, and due to conflicts between Prime Minister Wickremasinghe and President Kumaratunga concerning how to carry forward the peace process, President Kumaratunga dissolved the parliament in February 2004 following which general elections were held in April of the same year. As a result, although Kumaratunga's UPFA did not win a single-party majority, it did win the elec-tions, making Rajapaksa, leader of the opposition party (UPFA) the new Prime Minister.
Under the UPFA's rule, the People's Liberation Front (JVP), member of the ruling coalition, was reluctant to push forward the peace talks with the LTTE. On the other hand, the LTTE also faced a recent split in the organization following the rebellion of its former eastern com-mander "Colonel" Karuna, and thus did not take active part in the peace process from March 2004 onward.
Under such political circumstances, the Great Sumatra Earthquake and Indian Ocean Tsunami struck Southeast Asia in December 2004, claiming over 30,000 lives and injuring more than 800,000 (at most) people across Sri Lanka. What emerged was a call for cooperation, to put

23
aside religious and ethnic differences while dealing with this national crisis. As a result, dis-cussions aimed at the establishment of a joint mechanism that would ensure assistance to the population affected by the tsunami was delivered in a fair and transparent manner began, and in June 2005, an agreement regarding the said mechanism was reached and signed. The JVP, which opposed the agreement, withdrew from the UPFA government.
On August 12, 2005, Foreign Minister Kadirgamar, who was a constant critic and opponent of the LTTE, was assassinated in his home. Many view this as a crime committed by the LTTE, which led to growing international pressure on the LTTE, including travel ban measures of the LTTE members by the EU.
Meanwhile, presidential elections were held on November 17 of the same year. This literally one-on-one battle between Prime Minister Rajapaksa of the ruling PA and Wickremasinghe (former Prime Minister) of the opposition UNP resulted in Wickremasinghe being defeated narrowly and Rajapaksa taking office as President on the 19th.
Following April 2003's suspension of the peace talks, the international community led by the agreed facilitator to the Peace Process continued its efforts in urging the government and the LTTE to discuss issues surrounding the implementation of a ceasefire agreement, but due to the closing of the Mavil Aru sluice gate in July 2006, violence has escalated between the gov-ernment and the LTTE, there is now no predicting the fate of the Peace Process.
Political System
Sri Lanka has a republican system of government and the head of state is the President, who is elected by popular vote. The term of office for the President is 6 years. The country has a unicameral parliament with 225 seats.
Government Organization (Cabinet)
The government is comprised of the President, Prime Minister and Ministers listed in Table 2.
President: Mahinda Rajapaksa Prime Minister: Ratnasiri Wickremanayake

24
Table 2 (1) List of Ministries (1/2)
Name of Ministry Ministry of Agrarian Services and Development of Farmer Communities Ministry of Agricultural Development Ministry of Agriculture, Irrigation and Mahaweli DevelopmentMinistry of Child Development and Women's Empowerment Ministry of Coconut Development Ministry of Constitutional Affairs and National Integration Ministry of Co-operatives and Co-operative Development Ministry of Cultural Affairs and National Heritage Ministry of Defence, Public Security, Law and Order Ministry of Disaster Management and Human Rights Ministry of Disaster Relief Service Ministry of Education Ministry of Enterprise Development and Investment Promo-tion Ministry of Environment Ministry of Estate Infrastructure and Livestock Development Ministry of Finance and Planning Ministry of Fisheries and Aquatic Resources Ministry of Fisheries and Housing Development Ministry of Foreign Affairs Ministry of Foreign Employment Promotion Ministry of Healthcare and Nutrition Ministry of Highways Ministry of Home Affairs Ministry of Housing and Construction Ministry of Indigenous Medicine Ministry of Industrial Development Ministry of Infrastructure Development and Fisheries HousingMinistry of Internal Administration Ministry of Irrigation Ministry of Justice and Law Reforms Ministry of Labor Relations and Foreign Employment Ministry of Local Government and Provincial Councils Ministry of Mass Media and Information Ministry of Nation Building and Estate Infrastructure Devel-opment Ministry of New Railroad Development Ministry of Parliamentary Affairs Ministry of Petroleum and Petroleum Resources DevelopmentMinistry of Plan Implementation Ministry of Plantation Industries Ministry of Policy Development and Implementation Ministry of Ports and Aviation Ministry of Post and Telecommunication Ministry of Power and Energy
Name of Minister (honorific titles omitted) S. M. Chandrasena Chamal Rajapakse Maithripala Sirisena Sumedha G. Jayasena Salinda Dissanayake Dew Gunasekera Abdul Majeed Mahinda Yapa Abeywarden Mahinda Rajapaksa Mahinda Samarasinghe Ameer Ali Shihabdeen G. D. S. Premajayantha Rohitha Bogollagama Maithripala Sirisena R M C B Ratnayake Mahinda Rajapaksa Felix Perera Athaullah Ahamed Lebbe MarikkarMangala Samaraweera Rohitha Abeygunawardena Nimal Siripala de Silva Jeyaraj Fernandopulle Chandrasiri Gajadheera (Mrs.) Ferial Ashraff Tissa Karalliyadde Kumara Welgama Athaullah Ahamed Lebbe MarikkarRatnasiri Wickremanayake Anver Ismail Amarasiri Dodangoda Athauda Senevirathne Janaka Bandara Tennakoon Anura Priyadarshana Yapa Mahinda Rajapaksa Mahinda Amaraweera W. A. Wiswa Warnapala A. H. M. Fowzie Mahinda Rajapaksa Milroy Fernando Keheliya Rambukwella Mangala Samaraweera D. M. Jayarathna John Senevirathna Bandula Basnayake Sarath Amunugama A. H. M. Fowzie

25
Ministry of Promotion of Botanical and Zoological Gardens Ministry of Public Administration and Home Affairs Ministry of Railways and Transport Ministry of Regional Development Ministry of Religious Affairs Ministry of Resettlement Ministry of Road Development
M. H. Gunarathna Weerakoon Mahinda Rajapaksa Abdul Risath Bathiyutheen T. B. Ekanayake
Table 2 (2) List of Ministries (2/2)
Name of Ministry Name of Minister (honorific titles
omitted) Ministry of Rural Economic Development Ministry of Rural Industries and Self-Employment Ministry of Rural Livelihood Development Ministry of Samurdhi and Poverty Alleviation Ministry of Science and Technology Ministry of Skills Development and Public Enterprise ReformsMinistry of Social Services and Social Welfare Ministry of Sports and Youth Affairs Ministry of State Banks Development Ministry of Textile Development Industry Ministry of Tourism Ministry of Trade, Commerce, Consumer Affairs and Market-ing Development Ministry of Urban Development and Water Supply Ministry of Vocational and Technical Training Ministry of Youth Empowerment and Social Economic De-velopment
D. M. Jayaratne R. M. S. B. Navinne A. P. Jagath Pushpa Kumara (Mrs.) Pavithra Wanniarachchi Tissa Vitharana Sripathi Suriya Arachchige Douglas Devananda Jeevan Kumaratunga Wijeyadasa Rajapakse Jayatissa Ranaweera Anura Bandaranaike Jeyaraj Fernandopulle Dinesh Gunawardene Piyasena Gamage Arumugam Thondaman
Meanwhile, due to the extremely large number and consolidation of ministries, of the 66 min-istries posted on the government of Sri Lanka website (http://www.gov.lk) as of December 2006, Table 2 lists 65 ministries minus one that is believed to be a repetition of the same min-istry (confusion of name) (judged that the Ministry of Irrigation, Mahaweli and Rajarata De-velopment either changed its name to Ministry of Agriculture, Irrigation and Mahaweli De-velopment or underwent an integration process).
Disaster-Related Legal System / Framework
Due to the Indian Ocean Tsunami that occurred on December 26, 2004, Sri Lanka suffered unprecedented damage. Following this tragedy, the Sri Lanka Disaster Management Act, No.13 was established in May 2005 to provide a national framework for disaster guidelines and the country's disaster risk control actions. Moreover, the National Council for Disaster Management (NCDM) led by the President and comprised of concerned ministers was estab-lished to protect the life, assets and environment of the population from all disasters including natural disasters.

26
In addition, although the National Disaster Management Center (NDMC), which incorporates various aspects of disaster management such as the formulation of a disaster prevention plan, the arrangement of authorities concerned and emergency response, was, prior to the tsunami disaster, under the control of the Ministry of Women Empowerment and Social Welfare (MWESW) (from source of reference S04), following the tsunami disaster, it temporarily came under the direct jurisdiction of the President. Later, it was under the jurisdiction of the Ministry of Disaster Management and Human Rights (MDMHR) and today it is controlled by the Ministry of Disaster Relief Services (MDRS) (NDMC website: http://www.ndmc.gov.lk/). The NDMC also serves as the NCDM's office. Furthermore, the NDMC is focusing its efforts on disaster control by submitting in May 2006 a report put together with the assistance of the UNDP entitled "Towards a Safer Sri Lanka, Road Map for Disaster Management" that lists measures against disasters that should be taken.
Other legal systems related to disaster prevention exist besides the Sri Lanka Disaster Man-agement Act, No.13, such as those related to Sri Lanka's rivers, urban development, land use and coastal protection. The following are the country's major legal systems.
"River management by local governments"
i. Municipal Council Ordinance (Chapter 252) No. 19 of 1987
ii. Urban Councils Ordinance (Chapter 255) No. 18 of 1987
iii. Pradeshiya Sabbas Act No. 15 of 1987 (river cleanup)
"Development actions and land use"
iv. Town & Country Planning Ordinance No.13 of 1946 (Chapter 269) reprint 1960 and the Amendment by Act No. 49 of 2000 on the creation of the National Physical Plan-ning Department
v. Urban Development Authority Law No. 41 of 1978
vi. Land Development Ordinance (Chapter 464) as amended by Act No. 60 of 1961 and 16 of 1969
vii. Colombo District (Low Lying Areas) Reclamation and Development Board Act No. 15 of 1968, since superceded by the Sri Lanka Land Reclamation and Development Corporation Act No. 52 of 1982
viii. Draft National Land Use policy Paper prepared by the Land Use planning Division of the Ministry of Agriculture and Lands.
"Flood prevention / coastal protection"

27
ix. Flood Protection Ordinance No.4 of 1924 and Act No.22 of 1955.
x. Coast Conservation Act No. 57 of 1981
"Environment"
xi. National Environmental Act No. 47 of 1980
xii. Forest Ordinance No. 16 of 1907 and amendments by Act No.56 of 1979 and Act No. 13 of 1982
"Irrigation"
xiii. Irrigation Ordinance No.32 of 1946, Act No.1 of 1951, Act No.48 of 1968, and Law No. 37 of 1973

28
(3) Provinces and Districts, Self-government (S01), (S14), (S16), (S20)
Local Administration
Sri Lanka is divided into 9 provinces, which consist of 25 districts (See Fig. 12). Each prov-ince is governed by the Provincial Council selected by elections.
Meanwhile, following the India - Sri Lanka agreement of 1987, the North-Eastern Province of Trincomalee which merged the Northern Province and Eastern Province was declared by the then-President Jayewardene. This merger was temporary and the decision on whether to make it official was supposed to be based on a subsequent local referendum. Unfortunately, because a local referendum was not conducted in the Eastern Province, a suit was filed by the JVP against the government, as a result of which on October 16, 2006, the supreme court of Sri Lanka ruled that the current merger of the Northern and Eastern Provinces into a single entity was unconstitutional and invalid.
Central Province (Kandy)
Eastern Province (Trincomalee)
North Central Province (Anuradhapura)
North Western Province (Kurunegala)
Northern Province (Jaffna)
Sabaragamuwa Province (Ratnapura)
Souther Province (Galle)
Uva Province (Badulla)
Western Province (Colombo)
Note: Cities in parentheses are the provincial capitals
Source: Wikipedia (http://ja.wikipedia.org/wiki/%E7%94%BB%E5%83%8F:Sri_Lanka_Districts.png)
Fig. 12 Map of Local Administrations
Disaster Prevention Organization
Using the Action Plan formulated in 1993, Sri Lanka's disaster management gained momen-

29
tum following the 2004 Indian Ocean Tsunami. The objectives of the Action Plan are as fol-lows:
(a) Disaster prevention and reduction (b) Protection of human life and assets (c) Maintenance of order and recovery of devastated areas (d) Provision of facilities for emergency response, rescue, rehabilitation and reconstruction
The Action Plan classifies the activities into the following categories:
(a) Preliminary activities (preparedness) (b) Rescue activities (c) Recovery, rehabilitation, reconstruction (d) Public awareness and disaster prevention education
In addition, the following is the framework of the policies defined in the Action Plan.
(a) Introduce case examples of technical improvements in the fields of agriculture, land-use planning, construction and control of maintenance (b) Promote the participation of non-governmental organizations (NGOs), private research institutes and individuals. Raise money and donate to non-affected areas. (c) Promote scientific and technical research (ex: creation of a landslide hazard map) as a measures for sustainable development (d) While maintaining and reinforcing the rescue, recovery and rehabilitation capacities needed after a disaster, also focus on the planning and preparations for disasters. (e) Incorporate disaster prevention and preparation measures in the planning process not only on a national level but also on a local level
In addition, the said Action Plan requires that a committee is established at each administra-tion level in order to organize disaster management activities at the hamlet, divisional, district and provincial levels. These committees are composed of members of both the public and private sectors.
The Provincial Council, district offices and divisional offices are each in charge of recovery activities. In other words, the Disaster Management Coordinating Committee at the district and divisional levels coordinate the disaster management activities at the district and divi-sional levels. The Ministry of Social Services (former) carries out all the disaster prevention, rescue and rehabilitation activities through the divisional offices. The Ministry of Social Ser-vices (former) and divisional offices have intermediate staff members called social services officials who support the implementation by the divisional offices of disaster prevention and rescue activities at the divisional levels. These offices also have hamlet-level administrative offices called Grama Niladary who carry out disaster-related activities. Hamlet-level Disaster Management Coordinating Committees are also established as grass-roots levels for the coor-

30
dination of all disaster-related activities at hamlet level.
(4) Economic Situation (S16), (S21)
Although traditionally Sri Lanka was an agriculturally-dependent nation that has since old times been cultivating rice and producing three major plantation products (See p.16), recently it has been devoting every effort to become an industrialized and economically diversified country. Today, garments are Sri Lanka's biggest exports.
Some of the expressions that define the country's economy from 1980 to the 1990s include "export-oriented foreign investment" and "most liberalized economy in South Asia". This image was achieved through economic deregulation. In 1977, Sri Lanka was the first among the South Asian nations to undertake a process to liberalize its economy. In the beginning, economic deregulation showed remarkable results. The GNP growth rate significantly in-creased from the average annual growth rat of 2.9% between 1970 and 1977, which was prior to deregulation, to 6.0% between 1978 and 1982. Moreover, in order to rebuild the economy that fell apart from 1983 onward, due to the outbreak and expansion of ethnic conflicts be-tween the Sinhalese and Tamils, since 1988 Sri Lanka has been implementing structural ad-justment policies whose contents include the reduction of government spending, privatization of public companies and the relaxation of regulations such as exchange control, based on the agreement with the World Bank and IMF.
As the 21st century dawned, although the real GDP growth rate for 2001 was negative (-1.5%) for the first time since its independence, due to factors such as stagnation of agricultural pro-duction caused by drought conditions, sluggish import-related manufacturing industry, and a drop in tourism caused by the bombing incident at the Colombo International Airport by the LTTE, the economy took an upturn in 2002, achieving dynamic growth toward the end of that year with a GDP of 4%. This was mainly due to the fact that the environment of the domestic economy improved with the progress of the peace process, as well as other factors, including monetary policies such as suppression of policy rates, efforts to improve finances, develop-ment of structural reforms, and changes in the international environment such as the recovery of global economy. From 2003 onward, despite the negative factors in recent years such as deterioration of public security, natural disasters including tsunamis, and soaring international oil prices, the country has been maintaining an overall growth rate of about 5 - 6% due to the steady performance of the service industry.
Table 3 shows the basic economic indicators during the 10 years from 1996 to 2005.
By taking advantage of its geopolitical position, Sri Lanka is aiming at strengthening diplo-matic and economic ties with Southwest Asian Nations and the Association of Southeast Asian Nations (ASEAN) as a result of which it signed a Free Trade Agreement with India. In June 2005, the Free Trade Agreement (FTA) with Pakistan also went into effect.

31
Year 1996 1997 1998 1999 2000 2001 2002 2003 2004 2005 Real GDP growth rate 3.8 6.3 4.7 4.3 6.0 -1.5 4.0 6.0 5.4 6.0Real GDP growth rate - remarks provisional value Total nominal GDP (local currency) 695,934,000,000 803,698,000,000 912,839,000,000 994,730,000,000 1,125,259,000,00
01,245,599,000,00
01,403,286,000,00
0 1,562,737,000,000 1,797,941,000,000
Total nominal GDP ($) 12,591,213,539 13,623,246,873 14,163,500,134 14,082,598,810 14,612,785,387 13,935,524,652 14,669,195,010 16,190,642,451 17,767,268,810GDP per capita (nominal) ($) 794.6 852.5 880.7 859.9 884.4 840.6 870.0 948.8 1031.4 1198.5Rate of increase in consumer price index 15.9 9.6 9.4 4.7 6.2 14.2 9.6 6.3 7.6 11.6Rate of increase in consumer price index - remarks
Colombo CPI Colombo CPI Colombo CPI Colombo CPI Colombo CPI Colombo CPI Colombo CPI Colombo CPI Colombo CPI Colombo CPI
Consumer price index 1906.7 2089.1 2284.9 2392.1 2539.8 2899.4 3176.4 3377.0 3632.8 4055.5Consumer price index - remarks Colombo CPI, 1
952=100 Colombo CPI,
1952=100 Colombo CPI,
1952=100Colombo CPI,
1952=100Colombo CPI,
1952=100Colombo CPI,
1952=100Colombo CPI,
1952=100 Colombo CPI,
1952=100 Colombo CPI,
1952=100Colombo CPI,
1952=100Unemployment rate 11.3 10.5 9.2 8.9 7.6 7.9 8.8 8.4 8.3 7.7Unemployment rate - remarks Average for 1st,
3rd, 4th quarters Average from the
1st to 3rd quarters
Current account (balance of international payment basis) (local currency)
-37,456,000,000 -22,745,000,000 -13,795,000,000 -39,903,000,000 -78,857,000,000 -21,980,000,000 -22,693,000,000 -6,625,000,000 -65,458,000,000 -65,246,000,000
Current account (balance of international payment basis) (local currency) - remarks
provisional value
Current account (balance of international payment basis) ($)
-677,000,000 -393,000,000 -226,000,000 -563,000,000 -1,066,000,000 -215,000,000 -236,000,000 -71,000,000 -648,000,000 -650,000,000
Current account (balance of international payment basis) ($) - remarks
provisional value
Balance of trade (balance of international payment basis) (local currency)
-74,276,000,000 -71,833,000,000 -69,742,000,000 -96,702,000,000 -134,176,000,000 -102,592,000,000 -134,706,000,000 -148,324,000,000 -227,171,000,000 -253,082,000,000
Balance of trade (balance of international payment basis) (local currency) - remarks
provisional value
Balance of trade (balance of international payment basis) ($)
-1,344,000,000 -1,225,000,000 -1,092,000,000 -1,369,000,000 -1,798,000,000 -1,157,000,000 -1,406,000,000 -1,539,000,000 -2,243,000,000 -2,516,000,000
Balance of trade (balance of international payment basis) ($) - remarks
provisional value
Foreign currency reserves 1,961,550,000 2,024,140,000 1,979,770,000 1,635,550,000 1,039,000,000 1,286,810,000 1,630,950,000 2,264,930,000 2,132,110,000 2,650,910,000Foreign debts (local currency) 718,352,000,000 808,211,000,000 884,095,000,000 999,632,000,000 1,131,088,000,000 1,336,373,000,000 1,330,986,000,000Foreign debts (local currency) - remarks provisional value Foreign debts ($) 9,973,000,000 10,106,000,000 9,490,000,000 10,334,000,000 11,692,000,000 12,775,000,000 13,034,000,000Foreign debts ($) - remarks provisional value Exchange rates (against the dollar) - (aver-age rates)
55.2714 58.9946 64.4501 70.6354 77.0051 89.3830 95.6621 96.5210 101.1940 100.4980
Exchange rates (against the dollar) - (end-of-period rates)
56.7050 61.2850 68.2970 72.1700 82.5800 93.1587 96.7250 96.7382 104.6050 102.1170
Monetary growth 11.3 15.6 13.2 13.4 12.9 13.6 13.4 15.3 19.6Monetary growth - remarks M2 M2 M2 M2 M2 M2 M2 M2 M2Export values (local currency) 226,801,000,000 274,193,000,000 310,393,000,000 325,171,000,000 420,114,000,000 430,372,000,000 449,850,000,000 495,426,000,000 583,967,000,000 638,267,000,000Export values (local currency) - remarks provisional value
(JETRO-FILE / Sri Lanka: Basic Economic Indicators) Table 3. Basic Economic Indicators (updated on July 28, 2006; Unit: local currency is the Rupee, rate =%)

32
Year 1996 1997 1998 1999 2000 2001 2002 2003 2004 2005 Export values ($) 4,103,406,102 4,647,764,372 4,816,020,456 4,603,513,253 5,455,664,625 4,814,920,063 4,702,489,283 5,132,831,197 5,770,767,042 6,351,041,812Export values ($) - remarks provisional value Exports to Japan (local currency) 11,199,000,000 17,407,000,000 16,602,000,000 13,390,000,000 15,674,000,000 15,947,000,000 14,533,000,000Exports to Japan ($) 158,546,564 226,049,963 185,740,018 139,971,838 162,389,532 157,588,395 144,609,843Import values (local currency) 301,076,000,000 346,026,000,000 380,138,000 421,888,000,000 554,290,000,000 532,964,000,000 584,491,000,000 643,749,000,000 811,138,000,000 891,359,000,000Import values (local currency) - remarks provisional value Import values ($) 5,447,229,489 5,865,384,289 5,898,175,488 5,972,755,870 7,198,094,672 5,962,699,842 6,109,953,681 6,669,522,695 8,015,672,866 8,869,420,287Import values ($) - remarks provisional value Imports from Japan (local currency) 39,479,000,000 48,957,000,000 30,105,000,000 33,989,000,000 43,254,000,000 41,660,000,000 38,158,000,000Imports from Japan ($) 558,912,387 635,763,086 336,809,013 355,302,675 448,130,459 411,684,487 379,689,148Direct investments (local currency) 155,559,000,000 72,859,000,000 114,040,000,000 57,486,000,000 21,313,000,000 25,093,000,000 31,657,800,000 77,698,690,000 69,706,480,000 27,768,000,000Direct investments ($) 2,814,457,387 1,235,011,340 1,769,430,924 813,841,218 276,773,876 280,735,710 330,933,567 804,992,592 688,840,050 276,304,006Direct investments - remarks BOI Law, Section
17, approval basisBOI Law, Sec-
tion 17, approval basis
BOI Law, Sec-tion 17, approval
basis
BOI Law, Section 17, approval basis
BOI Law, Sec-tion 17, approval
basis
BOI Law, Section 17, approval basis
BOI Law, Sec-tion 17, approval
basis
BOI Law, Section 17, approval basis
BOI Law, Section 17, approval basis
BOI Law, Section 17, approval basis
Source: Japan External Trade Organization (JETRO) website (S21) [Source]
Real GDP grows rate, total nominal GDP, rate of increase in consumer price index, consumer price index,
unemployment rate, current account, balance of trade, foreign debts, export values, exports to Japan,
gross domestic expenditure, GDP composition by sector Central Bank of Sri Lanka, “Annual Report 2005”
GDP per capita: IMF, “World Economic Outlook Database”
Foreign currency reserves, exchange rates: IFS CD-ROM
Momentary growth: IMF “International Financial Statistics Yearbook”
Direct investments: Board of Investment (BOI)

33
(5) Industrial Situation (S16), (S21), (S22)
As mentioned earlier on p.16 and 23, Sri Lanka used to be characterized by the fact that it was an agricultural-dependent economy based on the cultivation of rice and the pro-duction of three major plantation products, in other words a typical "plantation econo-my". The history of the establishment of the plantation economy dates back to the mid 19th century during the British rule. In the 1940s, the plantation sector made up 37% of the GNP, and in 1948 this sector was estimated to make up about 90% of total exports.
Meanwhile, under this plantation economy, the manufacturing industry stagnated, representing only 5.6% of the GDP in the early 1960s. Until the start of economic re-forms in 1977, this percentage increased to almost 11%, but even in 1981, almost 80% of the population still lived in agricultural villages. However, starting from the late 1980s, the growth rate of the manufacturing industry began to exceed those of other sectors, revealing major changes in industrial structures. As shown in Table 4, the con-tribution of the manufacturing industry to total GDP had reached 17% by 2000. Another important point is that the service industry's share of GDP is positively continuing to increase. The growth in the service industry is mainly found in the "financial services, insurance and real estate" sectors and "transport and communication" sector. A look at the GDP composition by sector for 2000 reveals that services, agricul-ture/forestry/fishing, manufacturing, construction and mining sectors account for 54%, 20%, 17%, 7% and 2%, respectively.

34
Table 4: Changes in the Industrial Structure Between 1993 and 2000 (GDP share: %)
1933 1994 1995 1996 1997 1998 1999 2000
1. Agriculture, forestry, fishing
24.6 23.8 23.0 22.4 21.9 21.1 20.7 20.0
2. Mining 1.9 2.0 1.9 2.0 2.1 1.9 1.8 2.0
3. Manufacturing 15.2 15.4 15.7 16.2 16.4 16.5 16.4 17.0
4. Construction 7.2 7.3 7.4 6.9 7.0 7.6 7.6 7.0
5. Services 51.1 51.5 52.0 52.5 52.6 52.9 53.5 54.0
a.Electricity, gas and water
1.4 1.5 1.5 1.3 1.4 1.5 1.5 n.a.
b.Transportation and communication
10.0 10.0 9.9 10.6 10.7 11.1 11.4 n.a.
c.Business 22.0 22.0 22.0 22.3 22.0 21.5 21.2 n.a.
d.Financial services, insurance and real estate services
6.1 6.8 7.2 7.1 7.4 7.6 8.1 n.a.
e.Households living in their own dwellings
2.3 2.2 2.1 2.0 2.0 1.9 1.8 n.a.
f.Government, national defense
5.0 4.8 5.2 5.1 5.1 5.3 5.3 n.a.
g.Others 4.3 4.2 4.0 4.0 4.0 4.0 4.1 n.a.
Source: Central Bank of Sri Lanka Annual Report 2000
Although the manufacturing industry's share has remained steady at around 16% as they
entered the 21st century, the service industry's share has continued to grow and in 2005, it had reached close to 58% (See Table 4). However, due to this increase, the share of agriculture, forestry and fishing is declining. A look at the GDP composition by sector in 2005 reveals that the service, agriculture/forestry/fishing, manufacturing, construc-tion and mining sectors account for 58%, 17%, 16%, 7% and 2%, respectively.

35
Table 5. GDP (Real) Composition by Sector Between 2001 and 2005 Country name: Sri Lanka
GDP (real) composition by sector Unit: Rs in Million
%:as a share of GDP
Sector 2001 2002 2003 2004 2005 Provisional
Value % Value % Value % Value % Value %
1. Agriculture, forestry and fishing 169,377 20.1 173,623 19.8 176,450 19.0 175,852 17.9 178.475 17.2
2. Mining 15,019 1.8 14,858 1.7 15,699 1.7 16,946 1.7 19,335 1.9
3. Manufacturing 142,909 16.9 145,864 16.6 151,951 16.3 159,712 16.3 169,337 16.3
4. Construction 61,292 7.3 60,796 6.9 64,115 6.9 68,332 7.0 74,414 7.2
5. Services 455,197 53.9 482,107 55.0 521,842 56.1 559,869 57.1 598,174 57.5
Electricity and water 12,130 104 12,044 104 14,651 1.6 14,287 1.5 17,610 1.7
Wholesale and retail trade, hotels and res-
taurants
181,733 21.5 191,505 21.8 206,507 22.2 219,041 22.3 224,652 21.6
Transportation, storage, communication 105,497 12.5 113,525 12.9 125,538 13.5 142,727 14.6 160,882 15.5
Financial services, insurance, real estate
and business services
91,456 10.8 99,620 11.4 108,578 11.7 114,661 11.7 122,127 11.7
Public administration, other government
services and defense, and other communi-
ty, social and personal services
64,381 7.6 65,213 7.4 66,568 7.2 69,153 7.1 72,903 7.0
(of these, those that are public companies) 41857 5.0 41,869 4.8 42,125 4.5 42,987 4.4 45,180 4.3
Total 843,794 100.0 877,248 100.0 930,057 100.0 980,720 100.0 1,039,735 100.0
Source: Central Bank of Sri Lanka "Annual Report 2005"
Reference year: 1996

36
Note: Prepared based on the information on the Japan External Trade Organization (JETRO) website (S21)
Furthermore, Table 5 shows the details of the GDP (real) composition by sector shown
in Table 4 for the years 2004 and 2005. An individual look at each of the agriculture, forestry and fishing sectors reveals trends that were not visible in Table 4. In other words, although agricultural production shows significant recovery between 2004 and 2005, the fishery production shows an enormous drop. The fishery's share of GDP de-clined from 2.3% to 1.3%, with the rate of change reaching a negative value of minus 42%.
Table 6. GDP (Real) Composition by Sector for 2004 and 2005
Source:Central Bank of Sri Lanka Annual Report 2005 (S22)
One of the reasons for the decreased production is that the fishing industry was hit hard by the Indian Ocean Tsunami disaster on December 26, 2004, where fishing boats and harbors were greatly damaged, as a result of which the local people could not fish for an extended period of time.

37
(6) Culture, Religion, Language (S02), (S16), (S24)
Culture
Sri Lanka is a multiethnic nation, and in addition to ethnic and religious differences, lifestyles and customs are different in urban and rural areas.
Although not as marked as in India, caste discrimination still exists. For example, earn-ing a living from washing clothes is looked down upon. Fishermen also have a low so-cial status.
Among the few things that form the cultural foundation of Sri Lanka, astrology consti-tutes one of the most valued traditions. Astrology is used to determine the time and date of many of the country's important events and holidays. It is also deeply rooted in the lives of the people.
In addition, with 6 cultural heritages and 1 natural heritage, Sri Lanka has a total of 7 UNESCO World Heritage sites. The Indian Ocean Tsunami caused enormous human loss as well as significant damage in historic cities on the south coast. The recovery of cultural heritages in the old town and fortifications of Galle registered as a World Her-itage in 1988, its neighboring historic cities, in particular Mathara and Hambatota, which suffered extensive damage is an issue that is being addressed.
[Cultural Heritages]
Sacred City of Anuradhapura : registered in 1982 Ancient City of Polonnaruwa : registered in 1982 Ancient City of Sigiriya : registered in 1982 Sacred City of Kandy : registered in 1988 Old Town of Galle and its Fortifications : registered in 1988 Golden Temple of Dambulla : registered in 1991
[Natural Heritage]
Sinharaja Forest Reserve : registered in 1988
Religion
Buddhism is the major religion, with 70% of the population as followers, followed by Hinduism (10%), Islam (8.5%) and Christianity (11.3%).
The country's southwest side is the Buddhist area inhabited by the Sinhalese, and polit-

38
ical and armed conflicts continue with the Hindu Tamils who are mostly concentrated on the northeast side. Meanwhile, although the conflicts between Sinhalese and Tamils are often interpreted as animosity between races and religious conflicts between Budd-hism and Hinduism, the distinctive Sinhalese and Tamil identities, with their corres-ponding languages and religions were formed after 1948's independence, and thus per-haps making a sweeping judgment on the reasons behind their conflicts is risky. Instead, the Sinhalese superiority policy which the Sinhalese government adopted, is of decisive importance when considering the ethnic conflicts. This issue will further be discussed in section (8) Minorities.
Buddhism was first introduced from India to Ceylon in the 3rd century B.C. as Therava-da Buddhism. Although Buddhism waned for various historical reasons in India, its birth land, it is still practiced in Sri Lanka in its original form. In addition, Theravada Buddhism was also introduced from Sri Lanka to Southeast Asia. Meanwhile, although Theravada Buddhism is sometimes referred to as Hinayana Buddhism, this name was created to imply that it is a Lesser Vehicle as opposed to Mahayana Buddhism, or the Greater Vehicle, and is simply a derogatory term based on the superiority of Mahayana Buddhism. Therefore, Theravada Buddhists would never use this term to describe themselves. Those who leave home to become a monk withdraw from the world and discipline themselves while living a communal life in temples to become exceptional beings excelling in virtue. Anyone wishing to become a monk can become one regard-less of family background, but there are many restrictions, such as not being able to get married or have a relationship with a member of the opposite sex. As for ordinary people, while continuing life in the real world, they accumulate good deeds by serving the temple and monks, improve their karma and hope for happiness in the next life. As a result, monks are revered in Sri Lanka, forming a sort of privileged class.
Language
Both Sinhalese and Tamil are Sri Lanka's national languages, while English is constitu-tionally recognized as the link language. For example, government publications are prepared in 3 languages, while signs and street names of public institutions or related institutions are also in Sinhalese, Tamil and English.
Although, on a daily basis most of the population use their own language (Sinhalese people use the Sinhalese language and Tamils use the Tamil language), 10% of the people use English as their first language. These English-speaking people live mostly in Colombo and have leadership positions in Sri Lankan society.

39
An estimated 15 million people speak Sinhalese, and as will be described later, the Ta-mil-speaking population worldwide is greater than those who speak Sinhalese. In terms of families of languages, it belongs to the Indo-European language family, Indo-Iranian language group and Indo-Aryan language. The basic work order is SOV, and with many open syllables, its linguistic system is often compared to that of Japanese. The Sinhalese language uses the Sinhala alphabet, a descendent of the Brahmi script (Bonji means Brahmi script, used in India).
Meanwhile, Tamil belongs to the Dravida language family which originally was the language used by Tamils living in the south of India. The name Tamil is a variant of Dramila (or Dravida). Although its affinity to Malayalam from the same Dravida lan-guage family is most striking, Malayalam has a huge quantity of loanwords from San-scrit, Tamil has relatively few of them. Tamil is restricted in terms of vocabulary and thus communication is not easy. It is the official language of the Indian state of Tamil Nadu as well as one of the official languages of Singapore. With 74 million Tamil speakers, it is the 18th most spoken language in the world. Tamil is the oldest written language in the Dravida language family, and it is said that the oldest remaining docu-ment dates back around the historical boundary between B.C. and A.D. Today, Tamil mainly uses its own alphabet. The basic word order is, as in Japanese, SOV. This some-times changes to OSV, but in cases where the meaning of a sentence is obtained after an affix is attached to the verb, the word order is basically SOV. However, like Malayalam, in some rare cases, OVS is also seen where only the subject comes at the end of the sentence. Although sometimes considered an inversion, this is also seen in print, such as in newspapers, studies show that this is not intended as a rhetorical device.
(7) Gender (S24)
The percentage of women in Sri Lanka with careers as administrative officers, politi-cians, physicians and lawyers is high, and their role in labor productivity is significant, while in the family, the husband or the father has the authority. This shows the country has both of the features of the old Japanese feudal society.
First, from the perspective of retention of equal rights regardless of gender, universal franchise including women's political participation and decision making representative of the modern western democratic values as well as a parliamentary government system based thereon, were introduced in Sri Lanka as early as 1931, which is considered to be

40
exceptionally early in Asia. In addition, in 1960 Sirimavo Bandaranaike became the world's first female Prime Minister. Apparently, common laws that allowed polyandry and matrilocal residence existed in the Sinhalese society prior to British rule, revealing that women had always been well-placed socially. In addition, at the University of Co-lombo which produced many social elites in Sri Lanka, the key members of the admin-istration, such as the university president, executive director, finance officer, chief libra-rian, dean of the medical school, dean of the Faculty of Science and dean of the School of Law (as of 1999). The percentage of women is slightly higher not only among faculty members but also among students. As a result, the ratio of women with professional ca-reers including physicians and lawyers is increasing. This should be described as being a result of Sri Lanka's unique tradition instead of a change that occurred following in-dependence.
Meanwhile, although remittance by workers abroad concentrated mainly in Arab oil countries can be named as the second source of foreign exchange following the apparel industry, already in the 1990s, more than 70% of the migrant workers who make up close to 10% of the entire laboring population are unmarried women. According to a survey by the Sri Lanka Bureau of Foreign Employment, about 60% of the female mi-grant workers are working under long-term contracts in West Asia, leaving behind their husband and at least 2 children. Such an increase in the ratio of female workers is a characteristic that emerged after Sri Lanka gained its independence. Later, society be-gan to rely mostly on women for the backbone of the workforce involving product commercialization in the labor market, such as farm work, factory work and work abroad. The increased presence of women in areas that were until the 1970s restricted to men, such as soldiers and police officers, is also significant.
Unfortunately, the hardships of female workers who leave their village to work in farms, city plants, abroad or who go off to war have barely been improved. Moreover, Sri Lankan society operates within a framework of strict hierarchy not only at work but also inside the family and at school, showing a resemblance with old Japanese feudal society. In the family, the husband or the father has the authority, and the wife and children are required to be submissive.
For example, when making important decisions such as marriage, the opinions of the parents and brothers are taken into great consideration, and although adult males are relatively free to choose their path when making life-altering decisions, restrictions are imposed on women as they must listen to what male family members have to say.

41
Moreover, women are prohibited to smoke, drink alcohol, and wear clothing that expose their legs, such as mini skirts and shorts.
(8) Minorities (S02), (S24)
History and Factor Analysis of the Conflicts
According to the survey of Sri Lanka's ethnic composition the Sinhalese make up more than 70% (72.9%), forming the largest ethnic group in the nation. This is followed by the Tamils who live in the north-eastern area (18%) and the Sri Lankan Moors (8%), constituting the minority groups. Meanwhile, although the conflicts between Sinhalese and Tamils are often interpreted as animosity between races and religious conflicts be-tween Buddhism and Hinduism, the distinctive Sinhalese and Tamil identities with their corresponding languages and religions were formed after 1948's independence.
Instead, the numerous Sinhalese superiority policies which the Sinhalese government adopted following the country's independence are of decisive importance when consi-dering the ethnic conflicts. Some claim that this is a backlash by the Sinhalese against the colonial governance (intentionally treating ethnic minorities preferentially that en-sured the backlash against dominance was directed toward not the British but the ethnic minorities) the British had been pursuing prior to the independence where the Tamils were treated preferentially. In fact, at the time when Sri Lanka gained its independence, the percentage of Tamils in the population with professional careers or in the govern-ment service was not low and thus the fact that a certain degree of racial superiority ex-isted can not be denied. However, just like the Sinhalese, the Tamils were also classified into the elite class and low class. Prior to independence, conflicts that existed in Sri Lanka were at most conducted along caste lines or conducted to reinforce distinctions between highland Sinhalese and lowland Sinhalese, and so it is more appropriate to consider that the Sinhalese and Tamils became much more conscious about their respec-tive identities after the country's independence. The growth of Sinhalese nationalism led by Sinhalese Buddhist monks that intensified following independence was not initially intended to eliminate the Tamils. What they wanted was the country to consider the independence from the British merely as a change from colonial rule to a rule by the social elites who speak English or by the wealthy class, for Buddhist monks to revive Buddhism while playing a leading role in society, for Sinhalese, the people's language, to be made an official language to achieve a real independence for the people. In fact, they brought social reforms, worked on re-

42
building rural villages, made efforts toward improving the lives of the poor, and there-fore were popular with the Sinhalese people. However, because this movement was based on the protection of Buddhism, Sinhalese-oriented slogans such as making Sin-halese an official language, and the superiority of their group, they inevitably promoted the elimination of other groups including the Tamils and headed toward conflicts. As a result of taking measures that were supported by the majority Sinhalese in the post-independence political process, the possibility of a multiethnic coexistence was lost. Table 7 shows the structural factors of the conflicts in Sri Lanka including the Sin-halese superiority policy.
Table 7. Structural Factors of Conflicts (prior to 1983) and their Effects and Alternatives
Factors Effects Alternatives
1 Language poli-cy
Make Sinhalese an official language
Disadvantages Tamils Make Tamil an official language
2 Irrigation projects
Delay of the large-scale irrigation projects in the northeast area in-cluding the Maha-weli Development Programme
Beneficiary zones re-stricted to Sinhalese areas
Expand toward the Tamil areas in the northeast
3 Settlement project
Priority to settle in new farmlands given to the Sinhalese people
Relative decline in Tamil population size in Tamil villages living in the northeast area
Ensure equality in the settlement in new farmlands
4 Decentralization of authority
Centralization of authority by the na-tional government
Political superiority of the majority Sinhalese, segre-gation tendency in the North Eastern Province
Extend the au-tonomy of provin-cial governments
5 University enrollment
Adjustments of the GCE (AL) records
Decline in the university enrollment rate of Tamils
Enrollment in or-der of school per-formance
6 Development investment
Concentration in the southwest areas
Regional divide, misap-propriation of military spending
Development of projects in the northeast areas

43
7 Economic poli-cy shift
Increased social in-equality associated with liberalization resulting from struc-tural adjustments
Tamils feeling increasing-ly rejected and frustrated
Development of basic industry protection policies and safety nets
8 Poverty of workers
Low wages of Indian Tamils
Joint struggles in the mountain and northern areas
Increase wages and improve so-cial welfare
9 Employment opportunities
Increased unem-ployment rate
Increased soldiers, mili-tiamen, and participation in guerilla organizations
Industrial promo-tion and employ-ment creation
10 Issues sur-rounding ac-quirement of nationality of Indian Tamils
Denial of citizenship to Indian Tamils
Indian Tamils lose their national identity
Political participa-tion by granting citizenship, im-proved social welfare
Note 1) GCE refers to General Certificate of Education and AL to Advanced Level.
Source: Conflict and Development: Roles of JBIC (Development Assistance Strategy for Peace Building and in Sri Lanka) (S02)
The Tamil movement began with a peaceful political movement in the mid 1950s and
then shifted toward a civil disobedience movement at the beginning of the 1960s, and further transformed into violence in the 1970s. The violent conflicts, which started off as temporary local incidents eventually adopted more organized forms and directly tar-geted national assets and police defense forces. Finally at the beginning of the 1980s, they became a threat to Sri Lankan society as a whole. The increasingly violent nature of the movement corresponds to the intensification of the separatist movement.
Initially the purpose of the movement was the expansion of regional autonomy in Sri Lanka, but gradually the Tamils began seeking not a single nation but a federal state. In the end, the movement became an armed struggle to separate the island's north and east areas (Tamil homeland) into an independent nation.
The genocide of Tamils in Colombo in 1983 triggered a full-scale armed conflict and the LTTE gained support from the north-eastern Tamils. Along with the intensification of conflicts, a selection process also proceeded within the Tamil community, as a result of which the Tamil force was placed under the LTTE who extended their power through

44
violent attacks such as suicide bombings.
Mechanism of the Persistence of Ethnic Conflicts
Sri Lanka was divided into the Government-control area (Cleared Area) and the LTTE-control area (Uncleared Area), following which, conflicts continued for 20 years. A ceasefire agreement was signed in February 2002, and in September of the same year peace talks began, but unhappy with how the government handled the peace talks, the LTTE announced in April 2003 that it was temporarily suspending the negotiations. Later, due to the closing of the Mavil Aru sluice gate in July 2006, violence has esca-lated between the government and the LTTE, there is no predicting the fate of the Peace Process. How did the conflicts persist in such a small island? This can in part be ex-plained if we look at the numerous failed peace talks and trace the process that led to a further stalemate. However, this is not sufficient to have a structural understanding of the mechanism of the ethnic conflicts that persisted for so long. Although an attempt to simplify such complex issues is extremely difficult, Table 8 lists a few points that would allow a general understanding of the conflicts in Sri Lanka.

45
Table 8. Factors that Contributed to Sri Lanka's Continued Conflicts
Factors Effects
1 Military expenditures Increased military budgets Development of the military industry = escalation of hostili-ties
2 Intervention of outside countries
Intervention of the Indian military
Prolonged conflicts become increasingly complex
3 JVP armed uprising Frustration of young men who lost their jobs in rural villages
Respond to the LTTE's call for ethnic conflicts = an-ti-government uprising in the south area, as a result of which conflicts become more com-plex
4 Conflicts between ethnic groups
Conflicts of interest be-tween Tamils and Muslims, expulsion by the LTTE of Muslims from the nor-theastern area
Increased Muslim refugees in Sri Lanka, resulting in new conflicts
5 Conflicts within ethnic groups
Conflicts between upper and lower castes
Participation of the lower caste into the LTTE, further devel-opment of the military organi-zation
6 Economic development Commercialization of so-cial relations2, isolation of the economy from the so-cial and cultural infrastruc-tures
Growing class disparities, breeding ground for the dissa-tisfaction of the public
7 Overseas remittances Support by Tamils working abroad
Strengthening of the LTTE military
Note 2) Traditionally these were nothing more than specific social relations of communities. Workforce, possession
of land, and credits which until then had no economic values became objects of sale.
Source: Conflict and Development: Roles of JBIC (Development Assistance Strategy for Peace Building and in Sri Lanka) (S02)
46
Characteristics of the Conflicts in Sri Lanka
In contrast with the separatist movements in Myanmar, Thailand, Indonesia and the Philippines, the Tamil separatist movement in Sri Lanka possesses the following cha-racteristics.
First, it took a long period of about 25 years for the relatively nonviolent movement between the 1950s to the 1960s to develop into a violent separatist movement.
Second, as part of the Tamil struggle for independence many chiefs of state, leading politicians and other leaders have been assassinated through suicide bombing, etc.
Third, is the sense of minority felt by both the Sinhalese and Tamils. The Tamil ethnic movement in Sri Lanka is not simply a request for the minorities to have increased rights within the nation state. Although Tamils are a minority in Sri Lanka, Sinhalese people developed a relative minority consciousness in southern India including Tamil Nadu state, and it can be said that this cast a shadow over the relationship between both ethnic groups.
Fourth, it is a conflict involving the ensuring of a rightful social position through the improvement of the language issue. In the process of formation of the nation state fol-lowing independence, an attempt was made to make the people's languages, namely Sinhalese and Tamil, official languages and to offer real independence to the people. However, due to the existence of a covert agreement that placed those who spoke fluent English in a socially privileged class, and thus in classes that included major industries, public positions and specialized professions, English still plays a central role as it did under the British rule. Despite the overwhelming majority of Swabhasha (refers to those who speak only Sinhalese or Tamil, as opposed to the elite class who speak English) graduating university, these Sri Lankans are not offered positions in such fields. Al-though various national measures are taken, political and social conflicts have repeat-edly broken out as a result these issues not being resolved (the discontent people con-sisted not only of Tamils but also of Sinhalese People's Liberation Front (JVP) who dis-play animosity toward English language dominance.
These deep and complex issues must be addressed in order to bring lasting peace.

47
4. Overview of Water Damage in Sri Lanka (S15)
The main natural disasters in Sri Lanka are floods, landslides, cyclones, droughts, storms and littoral erosions. Sometimes, the country also suffers from an outbreak of infectious diseases.
Tables 9 to 12 show the data obtained in the Emergency Disasters Database (EM-DAT) disclosed by the Centre for Research on the Epidemiology of Disasters (CRED) of the Louvain Catholic University in Belgium regarding national disasters that hit Sri Lanka.
Table 9. Top 10 Numbers of Deaths Caused by Natural Disasters Type of disaster Date of disaster Number of deaths
Tsunami December 26, 2004 35,399 Cyclone November 24, 1978 740
Flood May 30, 1989 325 Flood May 17, 2003 235
Cyclone December 22, 1964 206 Cyclone December 25, 1957 200
Landslide October 08, 1993 65 Flood December 25, 1969 62
Infectious disease (See note) November 1987 53
Flood May 24, 1984 45 Note: Infectious diseases include malaria, diarrhea / cholera, arborvirus infection, measles and dengue fever. Source: EM-DAT: The OFDA/CRED International Disaster Database (S15) http://www.em-dat.net - Louvain Catholic University, Brussels, Belgium (as of November 6, 2006)

48
Table 10. Top 10 Numbers of Victims Caused by Natural Disasters Type of disaster Date of disaster Total numbers of victims
Drought 1987 2,200,000 Drought September 1982 2,000,000
Flood December 1983 1,250,000 Tsunami December 26, 2004 1,019,306 Cyclone November 24, 1978 1,005,000
Flood December 25, 1969 1,000,000 Drought September 2001 1,000,000 Drought August 1988 806,000
Flood May 17, 2003 695,000 Flood May 30, 1989 501,000
Source: EM-DAT: The OFDA/CRED International Disaster Database (S15) http://www.em-dat.net - Louvain Catholic University, Brussels, Belgium (as of November 6, 2006)
Table 11. Top 10 Amounts of Damage Resulting from Natural Disasters Type of disaster Date of disaster Total damage (US$ 1,000)
Tsunami December 26, 2004 1,316,500 Flood June 05, 1992 250,000
Cyclone November 24, 1978 100,000 Cyclone December 22, 1964 37,300
Flood May 30, 1989 35,000 Flood June 02, 1991 30,000 Flood May 17, 2003 29,000 Flood December 25, 1969 8,500 Flood September 1966 5,000 Flood October 18, 1967 3,000
Source: EM-DAT: The OFDA/CRED International Disaster Database (S15) http://www.em-dat.net - Louvain Catholic University, Brussels, Belgium (as of November 6, 2006)

49
Table 12. Overview of the Natural Disasters that Occurred in Sri Lanka
Between 1957 and 2005
Type of dis-aster Frequency
Number of
deaths
Number of in-jured
Number of home-
less Number
of victimsTotal
number of victims
Total amount of damage
(US$ 1,000)
Drought 8 0 0 0 6,256,000 6,256,000 0(per disaster) 0 0 0 782,000 782,000 0Infectious disease (See note)
5 58 0 0 206,177 206,177 0
(per disaster) 12 0 0 41,355 41,355 0Flood 37 948 1,000 2,746,601 6,455,127 9,202,728 370,444(per disaster) 26 27 74,232 174,463 248,722 10,012Landslide 3 119 0 0 130 130 0(per disaster) 40 0 0 43 43 0Tsunami 1 35,399 23,176 480,000 516,130 1,019,306 1,316,500(per disaster) 35,399 23,176 480,000 516,130 1,019,306 1,316,500Cyclone 5 1,151 5,000 100,000 1,913,000 2,018,000 137,300(per disaster) 230 1,000 20,000 382,600 403,600 27,460 Note: Infectious diseases include malaria, diarrhea / cholera, arborvirus infection, measles and dengue fever. Source: EM-DAT: The OFDA/CRED International Disaster Database (S15) http://www.em-dat.net - Louvain Catholic University, Brussels, Belgium (as of November 6, 2006)
The EM-DAT defines the victims mentioned in Table 12 as follows: “People requiring immediate assistance during a period of emergency; it can also include displaced or evacuated people (quoted directly from the website).” In addition, the total number of victims is calculated using the following formula. The number of death is not included in the total number of victims.
(Total number of victims) = (number of injured) + (number of homeless) + (number of victims)
Meanwhile the flood and landslide disaster that will be the subject of focus in this report is the flood that hit Sri Lanka on May 17, 2003. The flood that claimed the most lives was the one on May 30, 1989 with 325 people dead and even in terms of total number of vic-tims, there were more victims during the December 1983 flood or December 25, 1969 flood. However, although the flood on May 17, 2003 is regarded as the worst flood and landslide disaster on the Sri Lankan side since 1947, 2003 being more recent means more detailed information is available and the data are more reliable. The flood and landslide

50
disasters at the 3 rivers on the western slopes, namely Kalu Ganga, Gin Ganga and Nil-wala Ganga, which are considered particularly vulnerable to floods, occurred almost si-multaneously. This flood was thus considered to be an appropriate selection for a com-parative study of responses to the disaster.
Meanwhile, as for water-related disasters other than flood and landslide disasters, we de-cided to study the December 26, 2004 Indian Ocean Tsunami which caused extensive damage due to lack of precautions because tsunamis in Sri Lanka are rare.
4.1 Overview of Floods and Landslide Disasters (S03), (S07), (S15), (S23)
(1) Period
Generally, most floods occur due to monsoons that hit the country twice a year, the southwest monsoon or Yala season from May to September in the Western Province, Southern Province and in Sabaragamuwa Province and the northeast monsoon or Maha season from December to the following February in the Eastern Province, Northern Province and North Central Province.
From May 17 - 18, 2003, a record rainstorm hit the south of Sri Lanka for the first time in about 50 years. The heavy rainfall caused floods and landslides over extensive areas and resulted in extensive human and physical damage, such as claiming the lives of 235 people, partially or completely destroying houses, damaging agricultural products and breaking down the infrastructure network, as a result of which about 700,000 people became victims to this disaster. The rainfall that caused the floods and landslides were characterized by the following three points.
1) Stalling of the cyclone, something rarely seen in May
2) Continuous rain resulting from the stalling of the cyclone
3) Concentrated downpour following soil moisture saturation
As shown in Fig. 4, there have been less than 20 cyclones during the last 100 years, and they are mostly all concentrated in November and December. Meanwhile, Fig. 13 shows the path of the cyclone from May 11 - 19, 2003. The cyclone that slowly moved up the Bay of Bengal set up the monsoon and brought heavy rain in the southwest area of Sri

51
Lanka. Fig. 14 shows the rainfall distribution in Sri Lanka prior to the disaster (May 16 - 18) during the one week from May 6 - 13. According to the data, 1 week of rain ex-ceeding 100mm was recorded in the southwest area of the country.
Source: 2003 Sri Lanka's Flood Damage Survey Report (S03)
Fig. 13. Path of the Cyclone that Affected the Concentrated Heavy Rain

52
Source: 2003 Sri Lanka's Flood Damage Survey Report (S03)
Fig. 14. May 6 - 13, 2003 Weekly Rainfall
In particular, as shown in Fig. 15, total rainfall exceeding 600mm was recorded in the Kalu Ganga's basin around Ratnapura from May 1 until May 15, the day prior to the disaster. It is believed that due to this continuous rainfall, the soil moisture in the area of the disaster was already saturated. On May 16, heavy rains were recorded in Ratnapura, with 156mm on May 16 and 146.5mm on May 17. Fig. 16 shows the hourly rainfall during 72 hours, between 00:00 on May 16 and 24:00 on May 18. In particular, conti-nuous rain for 18 hours between 03:00 and 21:00 on May 17 was recorded for a total of 366.1mm, during which an hourly rainfall of 99.8mm was recorded between 14:00 and 15:00. In other words, the concentrated downpour following saturation of the soil moisture may have directly contributed to the events that caused the floods and landslides disaster.

53
Source: 2003 Sri Lanka's Flood Damage Survey Report (S03)
Fig. 15. Daily Rainfall in May 2003 Observed at Ratnapura Rain-gauge Station
Source: 2003 Sri Lanka's Flood Damage Survey Report (S03)
Fig. 16. Hourly Rainfall Observed at Ratnapura Rain-gauge Station (72 hours between
may 16, 00:00 and May18, 24:00)
(2) Frequency
Although the enormous damage caused by the recent December 26, 2004 Indian Ocean Tsunami is still fresh in the memory, the most frequent disasters in Sri Lanka are landslides caused by heavy rains, in other words, floods and landslide disasters.
Table 12 presents an overview of natural disasters that occurred in Sri Lanka during the 49 years between 1957 and 2005. While the country was hit by a tsunami disaster only
Hou
rly ra
infa
ll (m
m)
Enormous floods and landslides disaster(16 – 18 days)
Date
Continuous rainfall before the disaster
Time
Maximum hourly rainfall: 99.8mm (between 14:00 and 15:00 on May 17)
Total continuous rainfall: 366.1mm (18 hours between 03:00 and 21:00 on May 17)
Dai
ly r
ainf
all

54
once, it suffered floods and landslides disasters 37 times in 49 years. In particular, in the southwest area where precipitation is high, the rivers flood every year, as a result of which 325 lives and 235 lives in 1989 and 2003 respectively, have been claimed, (See Table 9).
Records show that major floods in Sri Lanka occurred in 1913, 1940, 1947, 1957, 1967, 1969, 1978, 1989 and 1992.
Among these, the basin mean rainfall rates of Kalu Ganga, Gin Ganga and Nilwala Ganga during the 5 major floods in the past, namely 1947, 1957, 1969 and 1978 when the extent of the damage was severe as well as the May, 2003 floods are shown in Table 13. In addition, Fig. 17 shows a comparison of rainfall rates between the past 5 major floods.
Although in all basins, the most extensive damage was during the floods of May 2003, data show that they did not involve record-high rainfalls. Moreover, while rainfalls were evenly distributed across the country during the other major floods, the area where rain fell was limited to southwest Ceylon in May 2003.
Table 13. Comparison of Basin Mean Rainfall Rates between the Past 5 Major Floods (mm)
Name of basin August 13-15,
1947
December 24-25,
1957
December 29-30,
1969
November 23,
1978
May 17, 2003
Kalu Ganga 369 109 102 55 219
Gin Ganga 249 83 223 227
Nilwala Ganga 221 305 52 233
Note: Figures in red represent the maximum mean rainfall rates for the basins.
Source: 2003 Sri Lanka's Flood Damage Survey Report (S03)

55
Source: 2003 Sri Lanka's Flood Damage Survey Report (S03)
Fig. 17. Comparison of Rainfall Rates Between the Past 5 Major Floods
(3) Characteristics
Kalu Ganga
Kalu Ganga (Fig. 6, No.3) is a river located in the central area of Sri Lanka whose basin area is 2,690km2 and river channel length is about 100km. According to the Department of Irrigation, annual mean rainfall is 4,000mm, and total annual discharge is 7.3 billion cubic meters. As shown in Fig. 18, the Kalu Ganga basin covers the upstream basin area (Ratnapura district) and the downstream low-lying area (Kalutara district). Although the altitude difference between the mountainous region of the riverhead and the estuary is about 2,250m, because the river drops from an altitude of 2,250m to 14m within 36km from the upstream border, most of the river is a low-gradient river, with a gradient of about 1/5,000. Moreover, another feature of this basin is that the boundary point of the
May 17, 2003 November 23, 1978 December 29-30, 1969
December 24-25, 1957 August 13-15, 1947

56
downstream low-lying area and upstream basin is a narrow area whose channel width is about 50m, which constitutes a factor contributing to the flooding in the upstream basin.
Source: 2003 Sri Lanka's Flood Damage Survey Report (S03)
Fig. 18. Kalu Ganga Basin Map Ratnapura city, at the center of the upstream basin area, is located at a point where riv-ers from the surrounding mountains meet, and because the gradient suddenly becomes gentle at the meeting point, this city is prone to floods. According to data obtained by the Department of Irrigation, the flood scales according to flood levels are classified as shown in Table 14. Ratnapura city's ground height is just about 20mMSL, and so when the flood level reaches the "minor level", a flood occurs in Ratnapura city. Ratnapura has seen a few major floods in the past, and Table 15 shows the 5 highest flood levels recorded.
Ellaga-
Ellagawa pasture
Putopaura
Kaluta-
KaluGanga estuary closed
Paratuta
Ratna-
Maluwara
Area prone to landslides
Flooding Status of the Kalu Ganga Basin
Area affected by the May 2003 flood (in the administrative Ratnapura District) Area with the worst flooding in History (in the administrative Kalutara District) Gauging stations District boundary
River
Roads
Urban areas, settlements
Index Kalu Ganga basin boundary

57
Table 14. Ratnapura's Flood Classification
Classification Water level (mMSL)
Normal 18.3 Minor 20.1 Major 21.3
Critical 24.4
Source: 2003 Sri Lanka's Flood Damage Survey Report (S03)
Table 15. Ratnapura’s Previous Flood Levels
Rank Year Max. water level (mMSL) 1 1947 24.8 2 1913 24.6 3 1941 24.4 4 1903 23.9 5 1940 21.5
Source: 2003 Sri Lanka's Flood Damage Survey Report (S03)
The flood level in May 2003 reached a maximum of 23.9 mMSL, making it the fourth-highest level
in recorded history. The city's flood depth exceeded 3m, submerging the first floor of most houses.
Fig. 19 shows the rainfall and flow in Ratnapura during this period while Table 16 shows the peak
flows at the reference points.

58
Source: 2003 Sri Lanka's Flood Damage Survey Report (S03)
Fig. 19 Rainfall and Flow in Ratnapura during the May 2003 Flood
Table 16. Catchment Areas of Kalu Ganga's Reference Points and Peak Flows
During the May 2003 Flood
Reference point Catchment area (km2) Peak flow (m3/s)
Ratnapura 604 1,300
Ellagawa 1,393 2,620
PUTSUPAURA 2,598 1,020 Source: 2003 Sri Lanka's Flood Damage Survey Report (S03)
According to the Department of Irrigation, the maximum flow in Ratnapura is estimated
at about 1,300m3/s, which corresponds to a probable flood level in a period of 50 years. The estimated flooded area in Ratnapura District for this particular flood is the light blue area in Fig. 18. Meanwhile, because the flooded area of the downstream low-lying area (Kalutara District) was still under investigation (in the source of reference S03), as reference the flood area prepared based on prior major floods is shown in pink in the same figure.
Records on water levels show that the duration of this flood in Ratnapura was about 3 days. Although the duration of floods in this region is said to be usually around 3 days, a period of about 1 month is required for a return to normal economic activities.
■Rainfall in Ratnapura -Flow in Ratnapura
Flow
(m3 /s
ec)
Rai
nfal
l(mm
)
Day

59
According to the Department of Irrigation, the causes of this flood disaster can be summarized into the following 3 points.
(1) Extremely low gradient (1.0ft/1mile = 30.48cm/1,609m ≒ 1/5,280) (2) Far too much rain: 275 - 525mm (3) Weir created by the narrowed area at Ellagawa
Meanwhile, due to torrential rain after May 16, 2003, landslides and avalanches oc-curred on May 17 in the mountainous areas of Ratnapura, Matara, Galle, Hambantota and Kalutara, which caused great human damage. Fig. 20 shows the statistics on the numbers of deaths and missing persons resulting from this landslide disaster. It is be-lieved that many of the dead and missing persons were farmers with agricultural lands, such as tea plantations on the mountain sides which were directly affected by the mass movement of sediments. Moreover, on the upstream of Kalu Ganga, the collapsed se-diments formed a natural dam, and the dam break may have washed away the down-stream bridge.
Source: 2003 Sri Lanka's Flood Damage Survey Report (S03)
Fig. 20. Number of Deaths and Missing by District following the May 17 Landslide Disaster

60
Gin Ganga
Gin Ganga (Fig. 6, No.9) is a river flowing in the Galle District in the south of Sri Lan-ka, whose basin area is 947km2 and river channel length is 112km (See Fig. 21). Heavy rain fell mainly on the upstream of the Gin Ganga until early morning of May 17, 2003. A flood occurred at Neluwa on the upstream of Gin Ganga, located at 20km upstream from the estuary, and the flood water flowed down the protected lowland downstream for 3-4 days. It seems that the water that overflowed in the protected lowland could not be discharged even after opening the floodgate. In some places during the flood, the current of the water was rapid and water depth exceeded 2m, and because roads leading up the shelters were also inundated with water, evacuation was extremely difficult in some areas. There were cases where helicopters were required to rescue the isolated residents. In Gin Ganga basin, 17 people were killed by this disaster. Six died due to landslides and the remaining 11 due to the flood. Compared to other districts, the num-ber of deaths caused by the flood is high. The damage to infrastructure facilities and agricultural crops was also extensive.
Early in the morning of the 17, the Sinharaja forest reserve was hit by heavy rain ex-ceeding 350mm. At that point, the water level was not particularly high but before noon it suddenly rose steeply. Then by night, Neluwa was swamped, and the water level of Gin Ganga rose to an unprecedented level. The low-lying area of Neluwa was inundated with water, and the village people were faced with a massive flood. That night, Tawa-lama faced a similar situation as a result of which the roads were completely cut off. Early morning on May 18, Nagoda and Niyagama were also affected by the flood and by that night, Badegama, Elpitiya, HIKARUBA and Galle were flooded.
At noon on May 19, the water level of the river gradually decreased at the upstream end, and districts and municipalities began loss assessment and the rescue of victims. Meanwhile, at the Gin Ganga estuary of Gintona, because the flow of the flood water was too weak to flow down from upstream, the water level of the river rose. As a result, at the bridge pier of the Galle-Colombo highway situated in the suburbs of Galle, the water level rose to 0.6m under the floor of the bridge. Due to such circumstances, in Galle District, sand bars that accumulated near the bridge pier were partially removed on May 20, which prevented Galle city from flooding.

61
Source: 2003 Sri Lanka's Flood Damage Survey Report (S03)
Fig. 21. Gin Ganga Basin Map
Fig. 22 shows the temporal changes in the Gin Ganga flood conditions and measures against disasters.
Although some residents had knowledge about the flood conditions through media, such as the radio and television, it is believed that disaster information in the affected areas was mainly transmitted by word of mouth including the use of loudspeakers. Moreover, the armed forces (naval forces) vigorously engaged in rescue and relief ac-tivities. Schools and public institutions were used as shelters, and boats used for evacu-ations and rescues were provided by fishermen.
Sinharaja
Neluwa Tawalama
Gin Ganga
Elpitiya
Galle Province Niyagama
Nagoda
Udugama Badegama
Wakwella
Gintona
Galle
Hikaruba
Indian Ocean

62
Source: 2003 Sri Lanka's Flood Damage Survey Report (S03)
Fig. 22. Temporal Changes in the Gin Ganga Flood Conditions and Meas-
ures Against Disasters
Nilwala Ganga
Nilwala Ganga (Fig.6, No.12) is located in Matara District in the south of Sri Lanka, between latitude 6°13' - 5°55' and longitude 80°25' - 80°38' (See Fig.23). It starts from the hill country in Deniyaya and Rakwana at an altitude of 1,050m. The length of the river channel is 70km. It reaches the city of Matara, the district capital (population: 110,000) and joins the Indian Ocean. The basin area is 1,070km2, and the mountain area at the head is a forest covered with red-yellow podzols. On the mountainsides are rubber, tea and spice plantations, and most of the downstream lowlands are rice paddies. While the riverbed in the mountain area is a steeply sloping land of rocks, the gradient at the downstream end is relatively gentle.
As in Ratnapura at the upstream of Kalu Ganga, landslides occurred in precipitous mountainous terrain at the upstream of Nilwala Ganga following the long period of heavy rain in May 2003, as a result of which many roads were cut off. Moreover, slope failures caused the death of 34 people.
Meanwhile, with regard to flood conditions associated with heavy rain, the gentle river bed gradient in Pitabeddara combined with the land feature of the catchment basin at the upstream end which spreads out laterally led the flow to increase drastically and caused
May 2003
Heavy rain of 350mm at the upstream by early morning; Report of small flood
Disaster Headquarters established before noon; Distribution of food supplies and emergency supplies; Roads are flooded, impassable
Conditions worsen from about 7 pm; Province and armed forces begin rescue and relief activi-ties; Naval forces send rescue teams
Index Kalu Ganga basin boundary River's water level gradually de-creases at the upstream end, flood worsens in the low-lying areas at the downstream end; Warning and evacuation instructions provided to the residents living at the downstream end
Full-scale rescue activities (rescue of isolated resi-dents by heli-copter)
Serious water level increase at the down-stream end; partial re-moval of sand bars at the estuary; lack of trucks distributing rescue sup-plies; some of the infor-mation transmission systems malfunction- ing
Gradual restoration of lifelines
Water level decreases at the upstream end; Conditions still serious at the downstream end Rescue activities continue; Setting up temporary shelters
(day)

63
a flood. However, the duration of the flood was short and depth was not significant. Therefore, the flood in this area seems to not have been a major problem. Meanwhile, because the local residents in the downstream area cut the dikes, the flood caused inun-dation to an extensive area, claiming the lives of 30 people.
However, because no flood had occurred in the past 30 years in Nilwala Ganga, most of the residents had never experienced one. This is believed to be one of the reasons why the damage was so significant.
Source: 2003 Sri Lanka's Flood Damage Survey Report (S03)
Fig. 23. Nilwala Ganga Basin Map
One of the features of the flood studied in this report is the sudden rise in water levels between May 17 and 18. Fig. 24 and 25 each show the time history of the water levels at Bopagoda at the upstream of Nilwala Ganga in May and June 2003.

64
Source: 2003 Sri Lanka's Flood Damage Survey Report (S03)
Fig. 24. Time History of the Water Levels at Bopagoda in May 2003
Source: 2003 Sri Lanka's Flood Damage Survey Report (S03)
Fig. 25. Time History of the Water Levels at Bopagoda in June 2003
A comparison between Fig. 24 and 25 reveals that the water levels during the flood of May were much higher than the levels recorded during the flood in June. As opposed to

65
3.8ft (1.2m) during the one in June, water levels had reached 35.5ft (10.8m) during the flood that occurred on May 17. Because the water level at that time had exceeded the observable range of the automatic recording system, Fig. 24 shows the records obtained using traces. The maximum water level is estimated to have been reached at around 4:30 a.m. on May 18. Moreover, the data observed at Pitabeddara, located further up-stream of Bopagoda, were converted into flow, and on the 18, the daily flow was 2,900m3/s (See Fig. 26).
Source: 2003 Sri Lanka's Flood Damage Survey Report (S03)
Fig. 26. Data on the Discharge at Pitabeddara in May 2003
Next, Fig. 27 and 28 each show the annual flow data at Pitabeddara from December 2002, using a different flow scale. While Fig. 27 shows that the daily flow rarely ex-ceeds the normal 100m3/s, Fig. 28 reveals that in May 2003 alone, the flow twice ex-ceeded 500m3/s. This shows that the rainfall in May 2003 was different from normal times and that the scale of the flood that occurred on May 17 2003 was out of the ordi-nary.

66
Source: 2003 Sri Lanka's Flood Damage Survey Report (S03)
Fig. 27. Data on the Daily Discharge at Pitabeddara during Hydrological Year 2003 (1)
Source: 2003 Sri Lanka's Flood Damage Survey Report (S03)
Fig. 28. Data on the Daily Discharge at Piabeddara during Hydrological Year 2003 (2)

67
(4) List of Damages
Overview Although discrepancies exist in the information contained in the sources of ref-erence S03 and S15, Table 17 shows a list of the damages for each of the river basins, namely Kalu Ganga, Gin Ganga and Nilwala Ganga, and for the whole country, as will be discussed later.
Table 17. Damage Caused by the May 2003 Flood
Kalu Ganga Gin Ganga Nilwala Ganga
Total for the 3 basins
National total (See note)
1. Damage to residents
1-1.Deaths 133 17 64 214 235
Missing 0 0 17 17 -
1-2.Damaged housing units 58,675 32,000 47,637 138,312 -
Victims - - 145,875 - 695,000
1-3.Damaged houses
(1) Complete 3,488 - 2,138 - -
(2) Partial 11,108 - 5,562 - -
2. Amount of damage by sector (unit: 1 million Rs)
2-1. Electricity 88.9 - - - -
2-2. Roads 263.1 - - - -
2-3. Education 34.2 - - - -
2-4. Irrigation facilities 44 - - - -
2-5. Hygiene, healthcare 43.2 - - - -
2-6. Dairy farming 20.1 - - - -
2-7. Commerce and industry 97.1 - - - -
2-8. Home equity, personal assets 795.9 - - - -
2-9. Government agencies 6.4 - - - -
Total 1,393.3 - - - 2,799.1 Note: The national totals are based on the data in the source of reference S15 (Table 11). Meanwhile, because the
amounts of damage were in US$, they were converted into Rs using the exchange rate in 2003, as shown in Ta-ble 3 (average rates). The figures other than the national totals are based on the source of reference S03 (Tables 18 and 19). Here, the "-" refers to figures that could not be confirmed.

68
Kalu Ganga
Table 18 shows the damage of Kalu Ganga basin caused by the May 2003 flood for both the upstream (Ratnapura area) and downstream (Kalutara area), based on the Sri Lan-ka's government survey.
Table 18. Damage of Kalu Ganga Basin Caused by the May 2003 Flood
Ratnapura area Kalutara area Total
1. Damage to residents
1-1.Deaths 122 11 133
1-2. Damaged housing units 37,008 21,667 58,675
1-3.Damaged houses
(1) Complete 2,544 944 3,488
(2) Partial 8,683 2,425 11,108
2. Amount of damage by sector (unit: 1
million Rs)
2-1. Electricity 62.7 26.2 88.9
2-2. Roads 205.2 57.9 263.1
2-3. Education 29.0 5.2 34.2
2-4. Irrigation facilities 33.4 10.6 44.0
2-5. Hygiene, healthcare 37.0 6.2 43.2
2-6. Dairy farming 9.6 10.5 20.1
2-7. Commerce and industry 78.4 18.7 97.1
2-8. Home equity, personal assets 600.7 195.2 795.9
2-9. Government agencies 1.0 5.4 6.4
Total 1,057.0 336.3 1,393.3 Source: 2003 Sri Lanka's Flood Damage Survey Report (S03)
Gin Ganga
While 17 people died from the flood of May 2003, 6 died from landslides. As for the remaining 11, the flood was the actual cause of their death. Compared to other districts, the high number of deaths due to the flood is a feature to be noted. The number of damaged housing units amount to 32,000, and the places most severely affected were

69
Neluwa, Tawalama, Nagoda, Niyagama, Badegama and Galle.
The following is a summary of the damage within Galle District.
Damage to bridge piers Concrete bridges: 16, culverts: 194, suspended and wooden bridges: 19
Damage to roads Important roads: 419, general roads: 88
Damage to flood control facilities Damaged levee area: 30km, sediment deposition at pumping stations: 10, area of sedi-ment deposition in channels: 15km, partial damage to weirs: 3
Damage to telecommunications facilities Poles that required replacement: 86, span wires: 197, telecommunications area: 33km
Damage to electricity facilities High-voltage electrical power lines area: 85km, low-voltage electrical power lines area: 575km, electrical poles: 660, household electricity meters: 12,000, transformers: 25
Damage to other infrastructures Temples, mosques, churches: 9, hospital (number of beds: 115): 1, public schools (damage caused by the flood alone): 19, public schools (damage caused by the flood and strong winds): 31, public buildings: 94
Damaged agricultural crops Coconut plantations: 63 acres (estimated damage costs: 880,000 Sri Lanka rupees) Tea plantations: 3,098 acres (estimated damage costs: 2,783,000 Sri Lanka rupees) Rice paddies: 2,000 acres (estimated damage costs: 3,196,000 Sri Lanka rupees) Cinnamon: 643 acres (estimated damage costs: 40,000 Sri Lanka rupees) Banana: 497 acres (estimated damage costs: 1,360,000 Sri Lanka rupees) Vegetable plantations (estimated damage costs: 211,500 Sri Lanka rupees) Note: 1 acre = about 4,047m2, 1 Sri Lankan rupees = about 1.25 JPY (as of April 2003)
Damage to companies Tea factories: 5, small power plants: 11, stores: 853, gas stations: 4, rice mills: 5, village markets: 6

70
Nilwala Ganga
In the end, the extent of the damage turned out to be one of the worst ever seen, as shown in Table 19. This was the largest flood since 1947. The damage not only included inundated houses and damaged crops. Roads were cut off and bridge piers and culverts were destroyed. Moreover, 26 schools suffered damage. Some of the schools were used as shelters. For the reconstruction of houses, 100,000 Sri Lankan rupees and 50,000 Sri Lankan rupees were offered to completely destroyed houses and partially destroyed houses, respectively. The army cleaned the 2,941 polluted wells. A few international agencies provided tents and medical supplies. More than 300,000 people from local NGOs participated in voluntary activities.
Table 19. Damage of Nilwala Ganga Basin Caused by the May 2003 Flood
Number of cases Total number Damaged houses 47,637 (25.6%) 185,668Victims 145,875 (19.1%) 761,240Partial damage 5,562Complete damage 2,138Casualties Floods 30Landslides (slope failure) 34Missing 17
Source: 2003 Sri Lanka's Flood Damage Survey Report (S03)
(5) Measures (structural, non-structural)
Overview
Table 20 shows the status of structural and non-structural measures against floods and landslides for the basins of Kalu, Gin and Nilwala Ganga in May 2003.

71
Table 20. Status of Structural and Non-structural Measures for Kalu, Gin and Nilwala Ganga
Name of river
Basin area
(km2)
Channel length (km)
Status of measures against floods and landslides
Structural Non-structural
Kalu Ganga
2,690 About
100
Downstream (Kalutara)
・ Existing facilities Levees (partial)
・ Other temporary measures Artificial cut and cover of river mouth sand bank
Upstream (Ratnapura)
・ Existing facilities None
・ Plans Construction of multi-purpose dam in the upstream area and plans for levees in the sur-roundings of Ratnapura, etc.
・ Flood prediction and warning system
None
・ Flood hazard map None
・ Landslide hazard map Completed for Ratna-pura (1996-1999) Plans to prepare one for Kalutara (2005-2007)
・ Disaster prevention edu-cation Publication of a disaster prevention textbook (2000) However, they were ap-parently not widely pro-moted
Gin Gan-ga
947 112
・ Probable maximum precipita-tion Probability of 20 years
・ Target area 182km2 covering the 22km or so from Agaliya to the estuary
・ Existing facilities Levees, overflow levees (spill-way), pumping stations for drainage (10 stations), water gates, bridges, discharge chan-nels, flood prevention of 5,000ha of rice paddies (based
・ Flood prediction and warning system
None
・ Flood hazard map None
・ Landslide hazard map Map for Matara not completed No plans to create a map for Galle
・ Disaster prevention edu-cation Publication of a disaster

72
on a 10-year probable maxi-mum precipitation), diversion aqueducts of about 30m in width around the downstream area, etc.
prevention textbook (2000) However, they were ap-parently not widely pro-moted
Nilwala Ganga
1,070 70
・ Existing facilities Reservoirs, levees, drainage ba-sins, pumping stations (Tudawa and two other places)
・ Levees Worsened the flood damage because the residents cut the levee on the right bank during the flood
・ Tudawa pumping station Largest pumping station in Nilwala Ganga Number of pumps: 8 (spout ca-pacity: 3.5m3/s) Note: Among the 8, 4 did not
operate during the flood due to poor maintenance
・ Flood prediction and warning system
None
・ Flood hazard map None
・ Landslide hazard map ・ Map for Matara not
completed
・ Disaster prevention edu-cation Publication of a disaster prevention textbook (2000) However, they were ap-parently not widely pro-moted
Note: Prepared based on 2003 Sri Lanka's Flood Damage Survey Report (S03)
The 4 rivers situated in the southwest, namely Kalu Ganga, Gin Ganga and Nilwala Ganga that suffered extensive floods in the past and Kelani Ganga have been receiving support from abroad since the 1960s and the government of Sri Lanka has put together a master plan on the measures against floods. However, more than 30 years have passed since the creation of the master plan, and because the status of land use within the basin has greatly changed, the validity of the master plan is now called into question. Moreo-ver, although non-structural measures such as community disaster prevention and early warning and evacuation plans are necessary due to the fact that reduction of damage through structural measures alone can be financially and technically challenging under the current conditions in Sri Lanka, much work is still needed in this area.
Meanwhile, with regard to the hazard map-related project, which constitutes one of the non-structural measures, the National Building Research Organization (NBRO) has

73
been working on the Landslide Hazard Mapping Programme (LHMP) since 1995 with the support of the UNDP/UNCHS. The LHMP targets 8 districts that are most prone to landslides, namely, Badulla, Nuwara Eliya, Kegale, Ratnapura, Kandy, Matale, Kalutara and Matara. Table 21 shows the status of the creation landslide hazard maps. As shown in the table, the LHMP is divided into 4 phases. During phase I, a hazard map was created in 1995 for Badulla and Nuwara Eliya. During the 1996-1999 phase II, a hazard map was created for Kegale and Ratnapura, during the 2000-2004 phase III, a hazard map was created for Kandy and Matale. During phase IV, which is between 2005 and 2007, a hazard map is expected to be completed for Kalutara and Matara.
Table 21. Status of the Creation of Landslide Hazard Maps Phase Area Period of creation
I Badulla, Nuwara Eliya 1995 II Kegale, Ratnapura 1996-1999 III Kandy, Matale 2000-2004 IV Kalutara, Matara 2005-2007
Note: Prepared based on the 2003 Sri Lanka's Flood Damage Survey Report (S03)
The hazard maps were created using scales of 1/50,000 and 1/10,000, showing the 4 degrees of risk while taking into consideration information on land use, land forms, steepness of slopes, soil, geology and hydrology. Fig. 29 is an example of a hazard map. The figure also shows where landslides occurred in 2003. Landslides do not necessarily arise at the most vulnerable places, they also occur where the degree of risk is lower. According to a local interview survey, one of the factors explaining this is the change in the use of land.
Source: 2003 Sri Lanka's Flood Damage Survey Report (S03)
Fig. 29. Example of Landslide Hazard Map

74
Kalu Ganga
Even though in terms of existing structural measures, a levee was partially built at the most downstream point around Kalutara, measures against floods for flood-prone zone Ratnapura consist only of plans to build a multi-purpose dam at the upstream area and a levee around Ratnapura, nothing concrete has yet been implemented.
A major problem regarding the measures against floods for Kalu Ganga is the treatment of the estuary. Fig. 30 provides an overview of Kalu Ganga's river mouth topography. Because the city of Kalutara lies on the left bank of the estuary, the treatment of the estuary is an important aspect in flood control. Near the estuary the river channel changes its direction south, its width is about 100 to 200m and has a 3km-long estuary sand bar. This indicates that at this estuary, the coastal sand drift moving south is most troublesome. The width of the sand bar at the estuary is narrower at the base than at the end.
During the May 2003 flood, when the water level rose to +1.1mMSL at the Palatota point (estuary water level gauging site), the sand bar was artificially removed. Fig. 30 shows where the sand bar had been removed. However, due to active sand drift as men-tioned earlier, it is difficult to maintain the opening for an extended period of time as it closes about 2 months later.

75
Source: 2003 Sri Lanka's Flood Damage Survey Report (S03)
Fig. 30. Kalu Ganga River Mouth Topography
If the level of +1.1mMSL is taken as the starting level in the river channel project, then it would signify that the current river channel can only accommodate water up to
the longitudinal water level that is less than +1.1mMSL. Meanwhile, during the May 2003 flood, the traces of flood at Palatota had reached about 2.1m, which goes to show how serious this flood was. Based on such circumstances, although maintenance of the estuary using artificial structures such as training levees is a possibility, some of the concerns include salt water intrusion into the river channel associated with the increased cross-sectional area at the river mouth and the effects of structures controlling coastal sand drifts on neighboring beaches. Thus radical measures that would replace artificial removal have still yet to be taken.
As for non-structural measures, the LHMP as mentioned earlier is being undertaken. Of the 8 districts whose degree of landslide risk is high, Kalu Ganga basin extends through 2 districts, namely Ratnapura District and Kalutara District. Mapping for the upstream
Removable site of the sand bank
Estuary water level gauging
Kalutara City
(Palatota)

76
Ratnapura District was already completed prior to May 2003. Despite this fact, it seems it was not of much use during the disaster, and the lessons learned must surely be ap-plied in the event of future disasters.
Gin Ganga
First, with regard to measures against floods using structures, levees are built and main-tained only in the downstream zone of the river channel from the mouth to around 12km. Because the downstream region of the Gin Ganga is a low-lying area with much rain during the rainy season, it seems that emphasis is put on the protected lowland's drai-nage behind the levee. As water levels of Gin Ganga rise during the rainly season, drai-nage is carried out using pumps because the tributary stream water can not naturally flow down to Gin Ganga.
One of Gin Ganga's measures against floods, which include the abovementioned main-tenance of levees and pumping stations, is the Gin Ganga Regulation Project (GRP) realized with the assistance of the Chinese Government. The GRP involves flood con-trol of the 182km2 area in the 22km or so interval between Agaliya and the mouth, based on a 20-year precipitation probability. It consists of structures such as levees, overflow levees (spillway), drainage pumping stations (10) from the tributary stream to this river, water gates, bridges and discharge channels. The GRP was made and entered by and between the Chinese and Sri Lanka Governments in 1972. Constructions began in 1976 and were complete in 1982. In addition China seems to have worked on flood control of 5,000ha of paddy lands (based on a 10-year probability precipitation) and on a hydraulic design of a diversion aqueduct of about 30m in width around the down-stream area.
Meanwhile, an estuary barrage (lift gate) is under construction (as of 2004) to prevent salt water intrusion that accompanies the recent increases in water intake and decreased river bed. Because there are few dams at the upstream of Gin Ganga the supply of se-diments is large, but sediment deposition on the upstream of the estuary barrage is not taken into consideration because the gate is opened fully during the rainy season. There are also no plans to create a fish pass due to the full opening of the gate during the rainy season, which is the spawning season for fish. The construction of the estuary barrage is sponsored by ADB and performed by the consortium of Korea's Kolon and Samsung as well as Sri Lanka's CML Edwards as their subcontractor.
In terms of non-structural measures, no particular plans were implemented, such as

77
flood forecasting and warning systems or flood hazard maps, while disaster prevention education that generates awareness about the risks of flood disasters were also not suf-ficient. Moreover, while Gin Ganga basin extends through 2 districts, namely Galle District and Matara District, a landslide hazard map of Matara District has yet to be completed, and Galle District is not included in the LHMP's list of districts.
Nilwala Ganga
Flood prevention works on Nilwala Ganga were conducted with the assistance of France by the then Ministry of Irrigation in 1979. The main projects included the build-ing of reservoirs, and the establishment of levees, drainage basins and pumping stations. As shown in Fig. 31, the hilly area of the river's lower reach was used successfully in constructing a levee like a mountain ridge, which has been protecting the flatland. However, during the May 2003 flood, a substantial amount of water flowed within the levee due to the cutting of the levee, which created a situation where the pumping sta-tions could no longer operate. In addition, many protected lowlands suffered from the floods as they were not prepared to deal with such sudden inundations.

78
Note: The ● marks refer the locations of the pumping stations, the × marks refer to areas where
levees were cut, the red lines represent levees, and the 3 colored areas each represent the
areas protected by levees.
Source: 2003 Sri Lanka's Flood Damage Survey Report (S03)
Fig. 31. Flood Prevention Works of the Lower Nilwala Ganga
The main flood prevention works by the French Government consist of 3 pumping sta-tions and levees. In particular, the Tudawa pumping station is the largest with 8 pumps. Meanwhile, although the spout capacity per pump is 3.5m3/s, it was revealed that 4 out of the existing 8 did not operate during the flood due to poor maintenance. In addition, these flood prevention works also included drainage basins with overflow levees in some places, which are useful during normal floods, but it seems that the large-scale

79
floods of May 2003 were much too extensive.
In terms of non-structural measures, just as with Gin Ganga, no particular plans were implemented such as flood forecasting and warning systems or flood hazard maps. With regard to landslide hazard maps, although Nilwala Ganga basin is located in Matara District and is thus included in the LHMP's list of districts, no map has been completed yet. In addition, because no flood had occurred in the past 30 years in Nilwala Ganga, most of the residents had never experienced a flood, and disaster prevention education that generates awareness about the risks of flood disasters were also not sufficient.
4.2 Overview of the December 2004 Tsunami Damage in Sri Lanka (S05), (S06), (S09), (S12),
(S13)
(1) Overview
Introduction
On December 26, 2004 at 7:58:53 am local time (Japan Standard Time (JST): 9:58:53 am, Coordinated Universal Time (UTC): 0:58:53 am), an earthquake whose epicenter was 30km beneath the Indian Ocean occurred at 250km (latitude 3.316° north, longi-tude 95.854° east) south of the provincial capital Aceh located on the west coast of the Province of Nanggroe Aceh Darussalam, off the west coast of Indonesia's Sumatra Isl-and, reporting a moment magnitude (magnitude defined by common logarithm of the energy of fault movements, Mw) of 9.0 (See note). This earthquake triggered a massive tsunami that devastated the coastline of not only Sri Lanka but also that of other nations on the coast of the Indian Ocean including Indonesia, India, the Maldives, Thailand and Malaysia. Even countries as far as in East Africa such as Kenya and Somalia were af-fected by the tsunami, resulting in a global-scale catastrophic disaster that claimed the lives of more than 200,000.
There are no official names for this earthquake and tsunami as they vary according to each media and website. For the purpose of this report, the above earthquake will be called the "Sumatra Earthquake" and the tsunami the "Indian Ocean Tsunami".
Although in Sri Lanka there was almost no damage caused by the Sumatra Earthquake, the Indian Ocean Tsunami that followed caused extensive damage. In mid January, there were over 35,000 dead or missing person, and more than 400,000 residents were forced

80
to take shelter.
Note: This report uses moment magnitude Mw=9.0 which is the value found in the sources of reference S06 and S12. Meanwhile, as of 2006, the United States Geological Survey (USGS) claims the Mw to be 9.1 and research groups such as Northwestern University claim it to be 9.3.
Overview of the Earthquake
The waters off the coast of Sumatra where the Sumatra Earthquake occurred is the Sunda Trench that runs past Indonesia's Sumatra and Java's southwest side (formed along the boundary where the Indo-Australian and Eurasian Plates meet). One of the features is that the epicenter of the earthquake that occurred along the Sunda Trench was relatively shallow (occurred at a depth that easily triggers tsunamis). Moreover, according to USGS, the scale of the faulting that occurred at the plate boundary had reached about 1,000km south north. Fig. 32 shows the epicenter and aftershock area of this earthquake. The number of aftershocks after the December 26 earthquake exceed-ing magnitude 6 amounted to 21 in a single month.

81
Source: Grant-in-Aid for Scientific Research (Grant-in-Aid for Special Purposes) Report on the "Understanding of
the Overall Picture of the December 2004 Asian Tsunami Disaster" (S12)
Fig. 32. Epicenter and Aftershock Area of the Sumatra Earthquake
Overview of the Tsunami
The tsunami that followed the Sumatra Earthquake traveled in the Andaman Sea and Indian Ocean and smashed its way through Thailand, Malaysia, Indonesia's Sumatra, India, Sri Lanka, the Maldives, and even reached as far as the east coast of Africa.

82
Table 22 shows a comparison between the magnitudes (Mt) of the Indian Ocean Tsuna-mi and other major tsunamis in the past. Here, Mt was calibrated to obtain a similar scale with Mw and is the scale to assess the size of the tsunami at the wave source
Table 22. Magnitudes of Past Tsunamis
Year of tsunami Wave source Tsunami magnitude (Mt)
1837 Valdivia (Chile) 9.3
1841 Kamchatka 9.0
1868 Africa (Chile) 9.0
1877 Iquique (Chile) 9.0
1946 Aleutians 9.3
1952 Kamchatka 9.0
1957 Aleutians 9.0
1960 Chile 9.4
1964 Alaska 9.1
2004 Sumatra (Indonesia) 9.1
Source: Field Survey Report on the Indian Ocean Tsunami Damages in Sri Lanka and the Maldives as a part of “Research on the Management of Projects in the Field of Disaster Prevention (Project Research)” (S06)
The above table shows that the size of the Indian Ocean Tsunami was one that ranks right behind the tsunami that followed the 1960's Chile Earthquake and the 1946 Aleu-tians Tsunami and is the same as the 1964 Alaska Tsunami, indicating that it was the second or third largest tsunami of the 20th century.
Furthermore, Table 23 lists past tsunamis that occurred on the Sunda Trench. According to this table, the oldest tsunami whose size (m) is assessed as 3 dates back to about 140 years ago in 1861. Even in terms of more recent ones, it was about 100 years ago in 1907 (m=2). This indicates that the Indian Ocean Tsunami was the type of tsunami that occur once every 100 to 150 years.
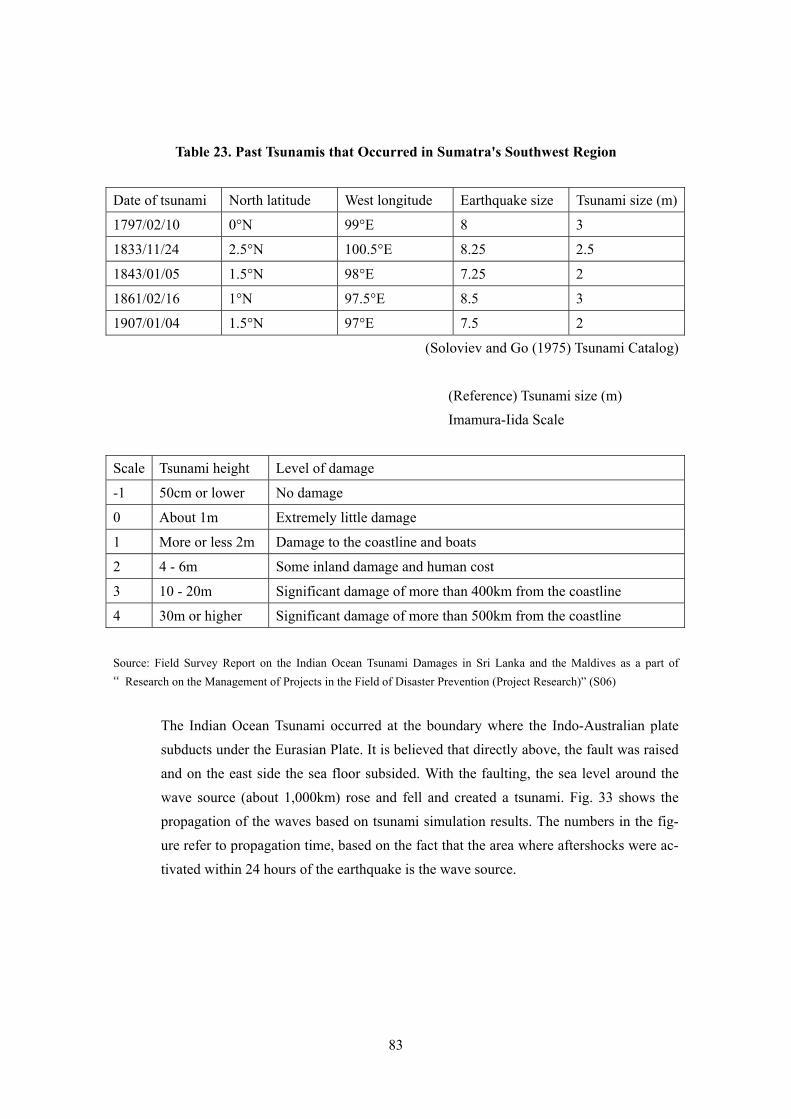
83
Table 23. Past Tsunamis that Occurred in Sumatra's Southwest Region
Date of tsunami North latitude West longitude Earthquake size Tsunami size (m)
1797/02/10 0°N 99°E 8 3
1833/11/24 2.5°N 100.5°E 8.25 2.5
1843/01/05 1.5°N 98°E 7.25 2
1861/02/16 1°N 97.5°E 8.5 3
1907/01/04 1.5°N 97°E 7.5 2
(Soloviev and Go (1975) Tsunami Catalog)
(Reference) Tsunami size (m) Imamura-Iida Scale
Scale Tsunami height Level of damage
-1 50cm or lower No damage
0 About 1m Extremely little damage
1 More or less 2m Damage to the coastline and boats
2 4 - 6m Some inland damage and human cost
3 10 - 20m Significant damage of more than 400km from the coastline
4 30m or higher Significant damage of more than 500km from the coastline
Source: Field Survey Report on the Indian Ocean Tsunami Damages in Sri Lanka and the Maldives as a part of “Research on the Management of Projects in the Field of Disaster Prevention (Project Research)” (S06)
The Indian Ocean Tsunami occurred at the boundary where the Indo-Australian plate subducts under the Eurasian Plate. It is believed that directly above, the fault was raised and on the east side the sea floor subsided. With the faulting, the sea level around the wave source (about 1,000km) rose and fell and created a tsunami. Fig. 33 shows the propagation of the waves based on tsunami simulation results. The numbers in the fig-ure refer to propagation time, based on the fact that the area where aftershocks were ac-tivated within 24 hours of the earthquake is the wave source.

84
Source: Report on the "Understanding of the Overall Picture of the December 2004 Asian Tsunami Disaster" (S12)
Fig. 33. Map of the Indian Ocean Tsunami Propagation (numbers refer to propagation time)
The above figure indicates that the time of arrival of the tsunami is about 2 hours to Phuket (Thailand) and east coast of Sri Lanka, 2 hours and a half to the east coast of In-dia and southwest coast of Sri Lanka, and about 3 hours and a half to the Maldives. Moreover, the tsunami that traveled in the Indian Ocean reached Madagascar 8 hours later and the east coast of Africa 9 to 10 hours later.
Overview of the Tsunami Damage in Sri Lanka
Because Sri Lanka was 1,700km away from the epicenter of the Sumatra Earthquake, no one physically felt the earthquake. However, the tsunami that hit the east coast of Sri Lanka about 2 hours after the earthquake gradually moved south clockwise and even hit the southwest coast on the opposite side of the epicenter. As a result, 3/4 of the coastline of Sri Lanka suffered catastrophic damage. In the end, the devastated areas extended from Jaffna District on the northeast coast to Gampaha District on the southwest coast,

85
covering 11 coastal districts except the west coast.
Source: Field Survey Report on the Indian Ocean Tsunami Damages in Sri Lanka and the Maldives as a part of
“Research on the Management of Projects in the Field of Disaster Prevention (Project Research)” (S06)
Fig. 34. Areas in Sri Lanka Affected by the Tsunami
The followings are geomorphic characteristics of affected areas (See Fig. 35 for a sketch).
(1) The coast of Sri Lanka consists of a series of roads and communities on the slightly elevated ground of the coastal dune. (2) On the inland side of these communities are a series of lagoons, glades, or rice paddies (particularly so on the east coast). (3) Main roads are all positioned high above sea level.
Damage levels vary greatly
Damages uniformly distributed

86
Source: Field Survey Report on the Indian Ocean Tsunami Damages in Sri Lanka and the Maldives as a part of “Research on the Management of Projects in the Field of Disaster Prevention (Project Research)” (S06)
Fig. 35. Geomorphic Characteristics of Afflicted Areas
The damages were limited to areas of a few hundred meters along the coast. However, as shown in Fig. 34, while damages are almost uniformly distributed on the east coasts, the damage levels on the west coasts vary greatly. Table 24 shows the results of a survey of traces regarding the tsunami's wave heights (Hv) on the southwest coast and damage area from the coastline toward the inland region (Dh). Moreover, Fig. 36 shows the dis-tribution of wave heights.
Position of main roads on the east coasts
Position of main roads on the south coasts
lagoons, glades, or rice paddies

87
Table 24. Results of Study on Tsunami Traces at Each Location
Source: Report on the "Understanding of the Overall Picture of the December 2004 Asian Tsunami Disaster" (S12)
Source: Report on the "Understanding of the Overall Picture of the December 2004 Asian Tsunami Disaster" (S12)
Fig. 36. Wave Height Distribution in Southwest Sri Lanka Based on Research on Tsunami Traces
Latitude
Longitude

88
A few reasons for the great variations in the levels of damage on the southwest coast include the fact that the tsunami that traveled toward the west of the island from the epicenter reflected off the south coast of Sri Lanka and hit the southwest coast as boundary waves (See Fig. 37), and that not only are there geomorphic differences on land but also slight differences in the geological formation of the seabed.
Source: Field Survey Report on the Indian Ocean Tsunami Damages in Sri Lanka and the Maldives as a part of “Research on the Management of Projects in the Field of Dis-aster Prevention (Project Research)” (S06)
Fig. 37. Tsunami Movement at the
Southwest Coast
In addition, towns with geomorphic features that could not absorb the energy of the tsunami due to the short distance to the lagoon and the fearful energy of the incoming tsunami suffered devastating damage. For example, because the old town of Hambanto-ta in Hambantota District is positioned high above sea level, there was no damage. However, the residential area on the slightly elevated sand bar about 500m wide suf-fered catastrophic damage. These conditions are shown in Fig. 38.
Source: Field Survey Report on the Indian Ocean Tsunami Damages in Sri Lanka and the Maldives as a part of “Research on the Management of Projects in the Field of Disaster Prevention (Project Research)”
Fig. 38. Extent of the Tsunami Damage in Hambantota (case where the valley floor is nar-row and the tsunami reaches the lagoon)
No damage in the old town built high above sea level
Catastrophic damage inflicted on the residential area devel-oped on a sand bar about 500m wide

89
(2) Human Damage
As of February 1, 2005, the total number of deaths in Sri Lanka was 30,974 and that of missing persons was 4,698. Furthermore, as shown in Table 9, although the EM-DAT declares the number of deaths to be 35,399 (as of November 6, 2006) this section uses the figures of February 1, 2005 because details regarding the numbers by Province and District were unknown.
Damage was particularly severe in the Eastern Province where the tsunami directly hit the coast, resulting in about half of the total number of deaths (46.4%). This is followed by the Southern Province, and then the Northern Province, the Western Province, and the Northwestern Province.
In terms of districts, the tsunami killed the most people in Ampara District in the East-ern Province, with 19,436 deaths which is about 1/3 of the total number of deaths. This was followed by Hambantota District in the Southern Province, with 4,500 deaths, which accounts for 14.5% of the total number of deaths.
Fig. 39 shows the number of people who were killed by the tsunami by province and district, and Table 25 provides details on human damage across the country.
Source: Field Survey Report on the Indian Ocean Tsunami Damages in Sri Lanka and the Maldives as a part of “Research on the Management of Projects in the Field of Disaster Prevention (Project Research)” (S06)
Fig. 39. Number of Deaths Due to the Tsunami by Province and District
(as of February 1, 2005)
Southern area
Northern area
Eastern area

90
Table 25. Human Damage Caused by the Tsunami (as of February 1, 2005)
Source: Field Survey Report on the Indian Ocean Tsunami Damages in Sri Lanka and the Maldives as a part of “Research on the Management of Projects in the Field of Disaster Prevention (Project Research)” (S06)
(3) Social Damage
Damage to Infrastructures
Because the country was devastated by the tsunami along its coastal belt, damage to its infrastructure remained minimal. Below is an overview of the damage each sector expe-rienced.
[Roads and bridges] - As mentioned in 2.4.2. (1) the levels of damage were low because the roads are
situated on the most elevated parts of the coast. - Although most of the causeways (road elevated by a bank across a wetland or
seashore) and causeway bridges were struck, damage was minimal. - Causeways were mainly damaged due to the washout of the embankment that
came into contact with the bridge. Regarding bridges, most of the damage was due to the washout of abutment and subsequently of the structure above it. In addition, some bridge supports had sunk into the water, which may have been caused by the scouring mechanism associated with the tsunami and vibrations of the structures above.
[Ports] - Small-scale port facilities were equally damaged.
Number of damaged households
Number of sheltered households
Population of sheltered people
Shelters Friends' or relatives' house
Total Death :Injured Missing
Number of damaged houses
complete partial

91
- Of the 12 fishery harbors, 10 were damaged. In the southern area, most of the piers, breakwaters, ice facilities, and shore-based facilities, including workshops, administration buildings and a total of 9 fishery harbors, can no longer be used.
[Electricity] - Among the lifelines, electricity has mostly been restored due to the prompt re-
covery operations by power companies after the disaster. - The power companies are taking this opportunity to quickly replace the old
power poles with new ones.
[Water Facilities] - The water facilities on the northern and eastern coasts are mainly used by shal-
low wells, and due to saltwater, they are temporarily out of use. - Meanwhile, with regard to some shallow wells whose underground water layer
has been destroyed due to the water pressure of the tsunami and whose seepage layer may have been connected to the sea, future use may be difficult.
[Housing] - The houses along the coasts are inhabited by fishermen and even in small fish-
ing villages; most of them are nice stand-alone houses. However, because they are made of sun-dried brick walls, they are extremely vulnerable to external forces such as a tsunami and thus the area about 200m from the coastline is vir-tually all destroyed.
Damage to Industries
Because most of the damage occurred on the coast, the fishing industry was most af-fected by this tsunami disaster. According to the February 3, 2005 data, of the 31,343 fishing boats that existed prior to the tsunami, 20,552 (65%) were affected the tsunami as they were destroyed, washed away or damaged. In addition, more than 100,000 fi-shermen, 80,000 distributors, and 20,000 related workers lost their job. If their family members are included, this amounts to 800,000 people affected by the tsunami.
In particular, the damage was more serious on the northern and eastern coasts due to the large population of poor fishermen. Because their boats and fishing nets have been lost and they were supporting themselves, regaining their fishing equipment and rebuilding their lives are major issues.

92
(4) Disaster Countermeasures
Following the December 26, 2004 tsunami, the Sri Lanka Government declared a State of National Disaster, made an appeal for international assistance, and the President es-tablished 3 task forces to respond to the situation. Moreover, a Center for National Op-erations office was established at the President's office to be able to respond to emer-gency situations involving a tsunami. The CNO promoted emergency response activities in cooperation with concerned ministries and the United Nations. The names of each task force and their roles are as follows:
(1) Task Force for Rescue and Relief (TAFRER) Chairperson: Tare del Mel (undersecretary of the Ministry of Education, di-rector of the CNO) Role: Emergency response: Coordination with national and international agencies involved in the understanding the conditions of the damage, emergency assis-tance and recovery, coordination with emergency aid and assistance donors, operation of the CNO, etc.
(2) Task Force to Rebuilding Nation (TAFREN) Chairperson: Mano Tittawella (President's senior advisor) Role: Mid and long-term recovery / rehabilitation response: damage assess-ment and development, creation of an action plan for infrastructure recovery, coordina-tion with Sri Lanka's concerned departments including the private sector, coordination of donor assistance, etc.)
(3) Task Force for Logistics and Law and Order (TAFLOL) Chairperson: Tilak Ranaviraja (Ministry of Public Security, Law and Order (undersecretary (at the time)) Role: Coordination of logistics of matters such as emergency assistance: Ar-rangement and coordination of the storage, distribution and shipping of emergency sup-plies, maintenance of law and order in affected areas
In addition to coordination with the above 3 agencies, the CNO also worked on logistics, food aid, water supply, hygiene, education, the fishing industry, psychosocial care and childcare, as well as establishing offices for each sector related to the tsunami disaster to determine the extent of the damage and keep track of the status of support. Moreover, in order to share this information, exchange opinions, and perform coordination, they held regular meetings twice every week. Furthermore, they held coordination meetings
93
with bilateral assistance agencies, UN agencies and NGOs, etc. for the coordination of emergency assistance. Fig. 40 shows the structure of the Sri Lanka Government's (cen-tral, district, division) for tsunami disaster management.
However, there are reports that in regard to the monitoring and coordination of relief activities by the CNO, national coordination has not been strong enough, and as will be discussed later, each district managed the coordination with the district agent as leader, and there seems to be considerable differences between each district and division in terms of the status of coordination.
Furthermore, the CNO was composed of volunteers from various organizations. One month into the activities, the response to the tsunami disaster shifted from the emer-gency assistance to the recovery and rehabilitation phase, and as the recovery and reha-bilitation activities of each task force and ministry were on track, the CNO accom-plished its task at the beginning of February 2005 and dissolved. After dissolution, the activities related to emergency assistance which they were working on were each passed on to concerned ministries, and TAFRER became the coordinator and the main organi-zation to promote recovery and rehabilitation.

94
Source: Field Survey Report on the Indian Ocean Tsunami Damages in Sri Lanka and the Maldives as a part of “Research on the Management of Projects in the Field of Disaster Prevention (Project Research)” (S06)
Fig. 40. Structure of the Government of Sri Lanka in Response to the December 2004 Tsunami Disaster (Central, District, Division)
On a local administrative level, a District Disaster Management Authority (DDMA) was established in each district, which was led by a government agent (GA) sent directly by the Sri Lanka Government. For example in Ampara District, offices were established for "Relief, Temporary Shelters and Maintenance of Welfare Centres", "Health, Sanitation and Environment", "Restoration / Reconstruction of Infrastructure", "Resettlement of Displaced Families", "Rebuilding of Livelihood of Affected Families, "Data Collection

95
and Information Management", "Logistics Supports" and "Social Infrastructure Devel-opment and Child Care". Fig. 41 shows the district disaster management structure in Ampara District.
As for divisions, a Division Secretary (DS) was designated and a Division Disaster Management Authority (Div DMA) was established. As the lowest organization level, the DS directly responded to the affected population. The DS also monitored and up-dated information on the status of casualties and missing persons, numbers of displaced persons, and conditions of camps such as the status of food aid. In addition, they se-lected the sites of temporary shelters and occupants.
Source: Field Survey Report on the Indian Ocean Tsunami Damages in Sri Lanka and the Maldives as a part of “Research on the Management of Projects in the Field of Disaster Prevention (Project Research)” (S06)
Fig. 41. District Disaster Management Structure (DDMA) in Response to the December 2004
Tsunami Disaster (Ampara District)

96
5. Damage Analysis 5.1 Damage Analysis of the May 2003 Flood and Landslide Disaster
(1) Flood and Landslide Disaster of Kalu Ganga (S03), (S07), (S15), (S23)
Fig. 42 shows the results of the damage factor analysis of the Kalu Ganga flood and landslide disaster. Meanwhile, Fig. 43 shows a diagram of the particular items obtained from the sources of reference for the factor analysis.
Below are the analyzed results regarding each factor.
[Natural Factors]
1) Continuous rain resulting from the stalling of the cyclone and concentrated down-pour following soil moisture saturation
As mentioned in 4.1 (1), from May 17 - 18, 2003, a record rainstorm hit the south of Sri Lanka for the first time in about 50 years. However, it is believed that the previous heavy rain resulting from the stalling of the cyclone in the Bay of Bengal, something rarely seen in May, triggered the following flood and landslide disaster.
As shown in Fig. 15, total rainfall exceeding 600mm was recorded in the Kalu Ganga's basin around Ratnapura from May 1 until May 15, the day prior to the disaster. It is be-lieved that due to this continuous rainfall, the soil moisture in the area of the disaster was already saturated. On May 16, heavy rains were recorded in Ratnapura, with 156mm on May 16 and 146.5mm on May 17. In particular, continuous rain for 18 hours between 03:00 and 21:00 on May 17 was recorded for a total of 366.1mm, during which an hourly rainfall of 99.8mm was recorded between 14:00 and 15:00 (See Fig. 16). In other words, the concentrated downpour following saturation of the soil moisture may have directly contributed to the events that caused the floods and landslides disaster.
2) Concentrated rain in southwest Ceylon
As mentioned in 4.1 (2), while the country suffered floods and landslides disasters 37 times in 49 years between 1957 and 2005, during the 4 major floods in 1947, 1957, 1969 and 1978 when the extent of the damage was severe, rainfalls were evenly distributed across the country but the area where rain fell during the May 2003 flood was limited to southwest Ceylon (See Table 13 and Fig. 17).

97
3) Geomorphic characteristics of Kalu Ganga whose middle and lower reach is of anextremely low-gradient and that also has a narrowed section
Most of the rivers in Sri Lanka are of high gradient in the upper river basin and then be-come extremely low gradient at the middle and lower reach. As a result, while landslides are frequent in the upper river basin, because the rivers are low gradient in the middle and lower reach, flood water can not promptly flow down and thus often overflow.
As shown in Fig. 18, the Kalu Ganga basin covers the upstream basin area (Ratnapura district) and the downstream low-lying area (Kalutara district). Ratnapura city, at the center of the upstream basin area, is located at a point where rivers from the surrounding mountains meet, and because the gradient becomes suddenly gentle at the meeting point, this city is prone to floods.
Moreover, another feature of this basin is that the boundary point (Ellagawa) of the downstream low-lying area and upstream basin is a narrow area whose channel width is about 50m, which constitutes a factor contributing to the flooding in the upstream basin.
[Social Factors]
4) Villagers live on dangerous mountainsides and do not respond to evacuation in-structions
As mentioned in 4.1 (3), due to torrential rain after May 16, 2003, landslides and ava-lanches occurred on May 17 in the mountainous areas of Ratnapura, which caused great human suffering. It is believed that many of the dead and missing persons were farmers with agricultural lands such as tea plantations on the mountain-side who were directly affected by the mass movement of sediments. Although the Sri Lankan Government had prior to the disaster strongly advised the residents to evacuate, the residents prioritized the convenience of location for agricultural work and refused to leave their homes. This can be considered as one of the factors that spread the damage.
5) Increased potentials of flood and landslide disasters associated with the disorderly cultivation of slopes in mountain areas
In relation with 4), according to the source of reference S03, the 122 deaths in Ratnapura area as shown in Table 18 were all due to landslides. Although it is a matter of course that the risk of farmers living on hillsides and slopes of facing a landslide disaster is high, if they cut forest trees and cultivate mountain areas in a disorderly fashion, the artificial change of land use, such as transforming the area into a tea plantation, causes the forest's water retaining capacity to decrease and the risk of sediment washout to increase, and therefore the possibility that flood and landslide disaster potentials have increased com-pared to before the cutting of trees and cultivation can not be denied.

98
[Status of Measures (flood control facilities, shelters, etc.)]
6) No flood control facilities (structures) in Ratnapura, a flood-prone zone
As mentioned in 4.1 (5), although in terms of existing structural measures a levee is partially built at the most downstream point around Kalutara, measures against floods for flood-prone zone Ratnapura consist only of plans to build a multi-purpose dam at the upstream area and a levee around Ratnapura, nothing concrete has been imple-mented yet.
7) Unused landslide hazard map
As mentioned in 4.1 (5), hazard mapping for the Ratnapura District, which is included in the Kalu Ganga basin, was already completed prior to May 2003. Despite this fact, it seems it was not of much use during the disaster.
8) Insufficient disaster prevention education
Surveys reveal that the disaster prevention textbook published in 2000 was not suffi-ciently promoted. However, because the content of the textbook is unknown, it may not be safe to assume that sufficient promotion would have alleviated this flood and landslide disaster. Nevertheless, according to the field survey results indicated in the source of reference S03, local disaster prevention education seems to have been insuffi-cient.
[Status of Response (evacuation status, etc.)]
9) Surprisingly long evacuation time
According to the residents, the flood did not rush down in a torrent, both in Ratnapura city and in neighboring villages. Instead, it gradually inundated and thus there seems to have been enough evacuation time. The reason for the flood is believed to have been the increased water level of the dam due to the narrowed passage gradually affected the up-stream area. Meanwhile, as mentioned in 5), the 122 deaths in Ratnapura area were all due to landslides, indicating that they had not evacuated or that the situation was not at a crisis point that could lead to death.

99
[Explanatory notes]
◆Measure status (flood control facilities, shelters, etc.): ■blue
◆Measure status (evacuation status, etc.): ■green
◆Damage status
Human: ■red solid line
Physical: ■red dotted line
◆Natural factors (external force, geography, land features:
■orange
◆Social factors (poverty, vulnerability): ■purple
Natural Conditions of Sri Lanka
・Located about 29km south of India, Sri Lanka is an island surrounded by sea, with a coastline of 1,340km. ・Sri Lanka's climate conditions are briefly divided into three zones. The island's southwest area including the central highlands is a wet zone with high precipitation. ・It is affected by the southwest monsoon or Yala season from May to September and the northeast monsoon or Maha season fromDecember to the following February. Due to these monsoons, the meteorological conditions are categorized into 4 periods. During the Yala period, rain falls abundantly in the southwest area including the island's central highlands. ・It is often hit by cyclones because it is located at a low altitude, but they are not frequent.
Deaths: 133 (Ratnapura area: 122, Kalutara area: 11)
Victims: 58,675 households
Among these, the 122 deaths in Ratnapura area were due to landslide disasters. It is believed that many of the dead and
missing were farmers with agricultural land on the mountain-side such as tea plantations who were directly affected by the
mass movement of sediments.
Heavy rain resulting from the
stalling of the cyclone in the Bay
of Bengal, something rarely seen
in May
Ratnapura's total rainfall ex-
ceeding 600mm (May 1-15)
No flood control facilities (structural) at the upstream flood-prone zone (only plans of construction of multi-purpose dam in the upstream area and of levees in the surroundings of Ratnapura, etc. Because
the water cannot flow down the narrowed passage, water levels rose.
Rainfall limited to southwest Ceylon.
Concentrated downpour following soil moisture saturation (rainfall at Rat-
napura) Daily rainfall: 156mm (May 16), 146.5mm (May 17)
Hourly rainfall: 366.1mm (3:00 - 21:00 = 18 hrs,
99.8mm (14:00 - 15:00 = 1 hr)
Boundary point of the
downstream low-lying
area and upstream basin
(Ellagawa) is a narrow
area whose channel width
is about 50m
The flood did not rush down in a torrent both in Ratnapura city and in neighboring villages. Instead, it gradually inundated and thus there seems to have been enough evacuation time.
Although there is a 100 to 200m wide and 3km-long sand bar at the estuary, because the city of Kalutara lies on the left bank of the estuary, the treatment of the estuary is an important aspect of flood control.
To lower the water level of the river, the sand bar was artificially removed.
The National Building Research Organization (NBRO) has been working on the Landslide Hazard Mapping Programme (LHMP) since 1995, targeting 8 districts whose risk of landslides is high. Of the
8 districts, Kalu Ganga basin extends through 2 districts, namely Ratnapura and Kalutara district. Mapping for the upstream Ratnapura District was already completed prior to May 2003.
However it was not used effectively during the disaster.
Farmers with agricultural land on mountainsides such as tea plantations prioritized the convenience of location for agricultural work and refused to leave their home.
Despite the Sri Lanka Government's recommendations to the residents to evacuate, most the residents did not respond.
Details regarding the rea-sons why it wasn't used is unknown.
Damaged houses
Complete: 3,488
Partial: 11,108
Damage costs per sector (1 million Rs)
Electricity 88.9
Roads 263.1
Education 34.2
Irrigation facilities 44.0
Hygiene and healthcare 43.2
Dairy farming 20.1
Commerce and industry 97.1
Housing and personal assets 795.9
Government-related agencies 6.4
Total 1,393.3
The residents on mountainsides cut forest trees and cultivated mountain areas in a disorderly fashion, and the artificial change of land use such as transforming the area into a tea plantation caused the forest's water re-
taining capacity to decrease and the risk of sediment washout to increase and therefore the possibility of flood and landslide disaster potentials have increased compared to before the cutting of trees and cultivation.
Fig. 42. Damage Factor Analysis of the May 2003 Flood and Landslide Disaster (Kalu Ganga) (Summary of facts)

100
Social root factors
Factors related to public awareness that increase or decrease damage potentials
Natural factors
Factors related to measures against flood and landslide that increase or decrease disaster potentials Direct social factors that increase damage potentials
Hazard
河川は上流域で急勾配、中
下流域では極端な緩勾配
(S03)
下流低平部と上流盆地の境
界地点(エルガワ地点)が流
路幅約 50m の狭窄部
(S03_03)
Human damage Physical damage
Damage
Direct damage Indirect damage
Deaths: 133 (S03)
Injured: unknown(S03)
土壌水分飽和後の集中豪雨
<ラトナプラ地点日雨量>
156.0mm(5 月 16 日) 146.5mm(5 月 17 日)
(S03)サイクロンの停滞による継続
降雨、ス国南西部に集中
<南西部の 1 週間雨量>
100mm 超(5 月 6 日~13 日)(S03)
サイクロンの停滞による継続
降 <ラトナプラ地点雨量>計 600mm 超(5 月 1 日~15 日)
(S03)
土壌水分飽和後の集中豪雨
<ラトナプラ地点時間雨量>
366.1mm(3~21 時:18 時間)
99.8mm(14~15 時:1 時間)
(S03)
Victims: 58,675 households(S03)
Residents did not try Residents could not evacuate
Downstream
Insufficient measures against floods and landslides Many live in vulnerable regions
A landslide hazard map was completed for Ratnapura but was not effectively used.
(S03_12)
インドほどではないがカースト
的な差別意識がある
(S06_27)
漁師はカーストで低い地位に
ある
(S06_27)
They do not want to leave the place they are used to living
(S01_25)
Partial construction of a levee at the most downstream point around Kalutara (S03)
てきたシンハラ優位政策
(S02_02) (S24_03)
人意識、タミル人意識が形成
(S02_01)
策による植民地統治
(S02)
Sinhala Only Law(1956) (S24_11)
(S24_11)
(S20_01)
Existence of a covert agreement that placed those who spoke fluent English in a socially privileged class
(S24_12)
Despite the overwhelming majority of Swabhasha (refers to those who speak only Sinhalese or Tamil, as opposed to the elite class who speak English) graduating university, these Sri Lankans are not offered good positions.
(S24_12)
(S24)
Centralization of authority
(S02)
Segregation tendency in theNorth Eastern Province (S02)
Increased poverty in thenortheast area
Increased unemployment
Low income
Vulnerable houses
Distrust in politics
They can not afford to buy land in good locations (with little risk of disasters)
They live in dangerous regions
行政側は住居を移すことを住 民に勧告しているが、ほとん
どそれに応じない
(S03_10)
洪水氾濫は徐々に浸水したと
いう感じであり、避難時間も
十分にあった
Prioritize agricultural work (S01_09)
Complete destruction: 3,488(S03)
Damage to houses
Damage to housing and personal assets795.9 (1 million Rs)
(S03)
Damage to other assets
Partial destruction: 11,108 (S03)
Damage to infrastructure
Damage to agricultural crops Damage costs by sector (1 million Rs)
電力 88.9道路 263.1教育 34.2灌漑施設 44.0衛生・保健 43.2酪農業 20.1商工業 97.1政府関係機関 6.4計 597.4
(S03)
There were no flood warning systems (S03)
Instructions to evacuate were not properly transmitted.
Long estuary sand bar and thus its treatment is an issue (S03_08)
Artificial removal of sand bar (S03)
UpstreamNo flood control facilities in Ratnapura, a flood-prone area (S03)
避難の必要性を感じない
Religious reasons
There were no flood hazard (S03)
家庭内での男性(世帯主)優
位の序列 【ム教】
ムスリム女性は夫の死後、
4 ヶ月と 10 日間は誰とも会って
はならない 【イスラム教】
(S06_33)
4 つの宗教(仏教、ヒンドゥ教、
イスラム教、キリスト教)と 6 つ
の民族(シンハラ、スリランカ
系/インド系タミール、ムー
ア、マラヤーリ、バーガー)の
組合せで形成された各コミュ
ニティ(部落)を混合すること
は不可能
(S06_22)
Insufficient disasterprevention education
(S03)
防災対策テキストが普及され
ていない
Damage to industry
Continuous rain due to the cyclone (Rainfall at Ratnapura) Total: over 600mm (May 1 - 15) (S03)
Continuous rain due to the stalling of the cyclone, concentrated rain in the southwest of Sri Lanka (weekly rainfall in the southwest area). Over 100mm (May 6 - 13) (S03)
The rivers are high gradient in the upper river basin and then become extremely low gradient at the middle and lower reach (S03)
Narrowed passage of about 50m at the boundary point between the downstream low-lying area and upstream basin (Ellagawa) (S03_03)
Concentrated downpour fol-lowing soil moisture saturation (Daily rainfall at Ratnapura) 156.0mmm (May 16) 146.5mm (May 17) (S03)
Concentrated downpour following soil moisture saturation (Hourly rainfall at Ratnapura) 366.1mm (3:00 - 21:00 = 18 hrs) 99.8mm (14:00 - 15:00 = 1 hr) (S03)
Electricity: 88.9 Roads: 263.1 Education: 34.2 Irrigation facilities: 44.0 Hygiene, healthcare: 43.2 Dairy farming: 20.1 Commerce and industry: 97.1 Government-related agencies:
6.4 Total: 597.4 (S03)
Impossible to mix the communities (hamlets) consisting of a combination of 4 religions (Buddhism, Hinduism, Islam, Christian-ity) and 6 ethnic groups (Sinhalese, Sri Lan-kan/Indian Tamils, Sri Lankan Moors, Malay and Burgher) (S06_22)
A Muslim woman cannot see any person during a period of 4 months and 10 days after her husband's death. (Islam) (S06_33)
The man (head of the household) dominates the family hierarchy (Islam)
Lack of crisis awareness Incorrect knowledge about disasters
Residents do not feel the necessity to evacuate
Flood gradually inun-dated and evacuation time was sufficiently long. (S03_07)
Disaster prevention text-books were not promoted
Published a disaster prevention textbook "Landslide in Focus Vol.1-4" for residents (2000) (S20_01)
Despite the recommenda-tions of the government to evacuate, most did not respond.
(S03_10)
Cultivated steep slopes in mountain areas in a disorderly fashion and made them into tea plantations (S01_07, S01_09)
Following constitutional amendment, both Sinhalese and Tamil become official languages (1987) (S24_11)
Tamils unhappy because the ODA privilege the Sinhalese area
Sinhalese superiority policy by the Sinhalese government after independence
Formation of a Sinhalese and Tamil consciousness surrounding language and religion (S02_01)
Colonial governance the British had been pursuing prior to independence in 1948 where the Tamils were treated prefe-rentially (S02)
Not as distinct as in India but caste discrimination exists (S06_27)
Fishermen have a low caste status (S06_27)
Women in the Sinhalese society prior to British rule did not have a low social status (S24_03)
Fig. 43. Damage Factor Analysis of the May 2003 Flood and Landslide Disaster (Kalu Ganga) (Diagram)

101
(2) Flood and Landslide Disaster of Gin Ganga (S03), (S07), (S15), (S23)
Fig. 44 shows the results of the damage factor analysis of the Gin Ganga flood and landslide disaster. Meanwhile, Fig. 45 shows a diagram of the particular items obtained from the sources of reference for the factor analysis.
Below are the analyzed results regarding each factor.
[Natural Factors]
1) Continuous rain resulting from the stalling of the cyclone and concentrated down-pour following soil moisture saturation
As mentioned in 4.1 (1), from May 17 - 18, 2003, a record rainstorm hit the south of Sri Lanka for the first time in about 50 years. However, it is believed that the previous heavy rain resulting from the stalling of the cyclone in the Bay of Bengal, something rarely seen in May, triggered the following flood and landslide disaster.
Early in the morning of the 17, the Sinharaja forest reserve located in the Gin Ganga ba-sin was hit by heavy rain exceeding 350mm. Although this downpour is believed to have directly contributed to the flood, prior to this, continuous rain of a total of over 600mm was recorded at Ratnapura in the Kalu Ganga basin between May 1 and May 15 (See Fig. 15). It is believed that the rainfall conditions in the upper river basin are similar due to the fact that the Kalu Ganga basin and Gin Ganga basin are located close to each other and thus it is appropriate to believe that soil moisture in the disaster area was already sa-turated due to continuous rainfall.
2) Concentrated rain in southwest Ceylon
As mentioned in 4.1 (2), while the country suffered floods and landslides disasters 37 times in 49 years between 1957 and 2005, during the 4 major floods in 1947, 1957, 1969 and 1978 when the extent of the damage was severe, rainfalls were evenly distributed across the country but the area where rain fell during the May 2003 flood was limited to southwest Ceylon (See Table 13 and Fig. 17).
3) Geomorphic features characterized by the tributary stream water were not able to naturally flow down to Gin Ganga during the floods and lack of capacity for the estuary water to flow down
Most of the rivers in Sri Lanka are high gradient in the upper river basin and then be-

102
come extremely low gradient at the middle and lower reach. As a result, while landslides are frequent in the upper river basin, because the rivers are low gradient in the middle and lower reach, flood water can not promptly flow down and thus often overflow.
The geomorphic features of the Gin Ganga basin also apply to the above. Because the downstream region of the Gin Ganga is a low-lying area with much rain during the rainy season, as water levels of Gin Ganga rise during the rainy season, drainage is carried out using pumps because the tributary stream water cannot naturally flow down to Gin Gan-ga.
In addition, with regard to the May 2003 flood, because the water levels of the river rose due to lack of capacity for estuary water to flow down, the sand bar that had formed at the estuary was partially removed.
[Social Factors]
Generally speaking, it is believed that due to factors such as poverty, some people in Sri Lan-ka have no other choice but to live on waterside land within the river area. However, no par-ticular social factors could be found to explain the flood disaster in the Gin Ganga basin.
[Status of Measures (flood control facilities, shelters, etc.)]
4) Maintenance of levees limited to the downstream zone
As mentioned in 4.1 (5), with regard to structural measures against floods, levees are built and maintained only in the downstream zone of the river channel from the mouth to around 12km.
These levees were built as a measure against floods in Gin Ganga as part of the GRP rea-lized with the assistance of the Chinese Government. The GRP involves flood control of the 182km2 area in the 22km or so interval between Agaliya and the mouth, based on a 20-year probability precipitation. It consists of structures such as levees, overflow levees (spillway), drainage pumping stations (10) from the tributary stream to this river, water gates, bridges and discharge channels.
Although the May 2003 flood started at Neluwa (See Fig. 21) located 20km upstream from the mouth, no levees were built in this zone.
5) Pumps that somewhat functioned
Because the downstream region of the Gin Ganga is a low-lying area with much rain during the rainy season, as water levels of Gin Ganga rise during the rainy season, the tributary stream water cannot naturally flow down to Gin Ganga. For this reason,

103
through the GRP as mentioned in 4), drainage pumping stations (10) have been built for the water to flow from the tributary stream to Gin Ganga.
The GRP was made and entered by and between the Chinese and Sri Lanka Governments in 1972. Constructions began in 1976 and were complete in 1982. According to the plate on the pumps the year of completion is 1977, which means that close to 30 years have passed since completion. However, maintenance was effective, the pumps are still opera-ble, and during the May 2003 flood, they seem to have been effective in the drainage be-hind the levee.
6) Undeveloped flood warning systems and flood hazard maps, etc.
As mentioned in 4.1. (5), in terms of non-structural measures, no particular plans were implemented such as flood forecasting and warning systems or flood hazard maps. Moreover, while the Gin Ganga basin extends through 2 districts, namely Galle District and Matara District, a landslide hazard map of Matara District has yet to be completed, and Galle District is not included in the LHMP's list of districts.
7) Insufficient disaster prevention education
Surveys reveal that the disaster prevention textbook published in 2000 was not suffi-ciently promoted. However, because the content of the textbook is unknown, it may not be safe to assume that sufficient promotion would have alleviated this flood and landslide disaster. Nevertheless, according to the field survey results indicated in the source of reference S03, local disaster prevention education seems to have been insuffi-cient.
[Status of Response (evacuation status, etc.)]
8) Evacuation procedures generally good
Surveys reveal that residents had knowledge about the flood conditions through media, such as the radio and television. However, it is believed that disaster information in the affected areas was mainly transmitted by word of mouth including the use of loudspeak-ers. Evacuation instructions were first given in each district, which were then transmitted to each village and in the end to village communities.
As a result, although some were caught behind in the evacuation, evacuation procedures were generally good.
9) Evacuation difficult in some areas
Although this seems to contradict 8), some residents were isolated during the flood be-

104
cause water velocity was significant in some places with depths exceeding 2m and also because the roads leading to the shelters were inundated with water. These residents needed to be rescued by helicopter.
While the residents in the above 8) lived in the downstream area, those who were left isolated lived in the upper river basin. It is believed that with the existing flood evacua-tion information system and the residents' levels of disaster awareness, the flood in the upper river basin occurred and progressed faster than the residents could handle.
10) Building of temporary shelters for the evacuees It seems that there were no specific disaster shelters. During this disaster, schools and public institutions were used as shelters, but whether these buildings were designated as disaster shelters beforehand is unknown.

105
[Explanatory notes]
◆Measure status (flood control facilities, shelters, etc.): ■blue
◆Measure status (evacuation status, etc.): ■green
◆Damage status
Human: ■red solid line
Physical: ■red dotted line
◆Natural factors (external force, geography, land features:
■orange
◆Social factors (poverty, vulnerability): ■purple
Natural Conditions of Sri Lanka
・Located about 29km south of India, Sri Lanka is an island surrounded by sea, with a coastline of 1,340km. ・Sri Lanka's climate conditions are briefly divided into three zones. The island's southwest area including the central highlands is a wetzone with high precipitation. ・It is affected by the southwest monsoon or Yala season from May to September and the northeast monsoon or Maha season fromDecember to the following February. Due to these monsoons, the meteorological conditions are categorized into 4 periods. During theYala period, rain falls abundantly in the southwest area including the island's central highlands. ・It is often hit by cyclones because it is located at a low altitude, but they are not frequent.
Deaths: 17 Victims: 32,000 households
Among the deaths, 6 died due to landslides and the remaining 11 died due to floods.
Heavy rain resulting from the
stalling of the cyclone in the Bay
of Bengal, something rarely seen
in May
Total weekly rainfall in the
southwest: over 100mm (May
6-13)
One of Gin Ganga's measures against floods is the Gin Ganga Regulation Project (GRP) realized with the assistance of the Chinese Government. The GRP involves flood con-
trol of the 182km2 area in the 22km or so interval between Agaliya and the mouth, based on a 20-year probability precipitation. It consists of structures such as levees, overflow
levees (spillway), drainage pumping stations (10) from the tributary stream to this river, water gates, bridges and discharge channels.
Rainfall limited to southwest Ceylon
Concentrated downpour after soil moisture saturation (rainfall atSinharaja) Over 350mm (early morning on May 17)
Because water levels of
Gin Ganga rise during
the rainy season, the
tributary stream water
cannot naturally flow
down to Gin Ganga.
Water levels at the estuary of the river rose because the flood water from the upstream area could not flow down. In Galle District, partial removal of the sand bar prevented
Galle city from flooding.
The NBRO has been working since 1995 on the Landslide Hazard Mapping Programme (LHMP) targeting 8 districts most prone to landslides. While Gin Ganga
basin extends through 2 districts, namely Galle District and Matara District, a landslide hazard map of Matara District has yet to be completed, and Galle District
is not included in the LHMP's list of districts.
Generally speaking, it is believed that due to factors such as poverty, some people in Sri Lanka have no other choice but to live on waterside land within the river area.
Details regarding Ging
Ganga basin are unknown.
Details regarding damaged
houses are unknown
In addition to bridge supports, roads,
flood control facilities, telecommunica-
tions facilities and power facilities, 9
temples, mosques and churches, 1 hos-
pital (number of beds 115), 19 public
schools (damage caused floods only), 31
public schools (damage caused by floods
and strong winds) and 94 public build-
ings were damaged.
Close to 30 years have passed since completion of the pumps maintained through the GRP. However, maintenance was effective, the pumps are
still operable, and during the May 2003 flood, they seem to have been effective in the drainage behind the levee.
The levees maintained through the GRP are limited to the downstream zone of the river channel from the mouth to around 12km. Although the
May 2003 flood started at Neluwa located 20km upstream from the mouth, no levees were built in this zone.
Damage to agricultural crops Coconut plantations: 63 acres Tea plantations: 3,098 acres Rice paddies: 2,000acres Cinnamon: 643acres Bananas: 497acres Vegetable fields: 21acres
Although generally speaking evacuation proceeded smoothly, is believed that with the existing
flood evacuation information system and the residents' levels of disaster awareness, the flood in
the upper river basin occurred and progressed faster than the residents could handle.
Fig. 44. Damage Factor Analysis of the May 2003 Flood and Landslide Disaster (Gin Ganga) (Summary of facts)

106
Social root factors
Factors related to public awareness that increase or decrease damage potentials
Natural factors
Factors related to measures against flood and landslide that increase or decrease disaster potentials
Direct social factors that increase damage potentials
External forces
(S03)
Human damage
Physical damage
Damage
Direct damage
Indirect damage
Deaths: 17 (S03-16) Injured: unknown (S03)
(S03)
(S03)
< >
Victims: 32,000 households (S03-16)
Residents did not try to evacuate
Residents could not evacuate
Downstream
Insufficient measures against floods and landslides Many live in vulnerable regions
地滑りハザードマップ マータラ県:未作成 ゴール県:作成予定なし
(S03)
的な差別意識がある
(S03_19, S03_26)
Shinhala Only Law(1956) (S24_11)
Following constitutional amendment, both Sinhalese and Tamil become official languages (1987) (S24-11)
住民向けの防災対策テキス ト”LANDSLIDE IN FOCUS Vol.1-4”発行(2000 年)
Existence of a covert agreement that placed those who spoke fluent English in a socially privileged class (S24-12)
Despite the overwhelming majority of Swabhasha (refers to those who speak only Sinhalese or Tamil, as opposed to the elite class who speak English) graduating university, these Sri Lankans are not offered good positions. (S24-12)
ODA がシンハラ地区に偏ってSegregation tendency in the North Eastern Province (S02)
Increased poverty in the northeast area
Increased unemployment rate
Low income
Vulnerable houses
They live in dangerous regions
危機意識の欠如
災害に関する誤った知識
They can not afford to buy land in good locations (with little risk of disasters)
Damage to houses
Damage to housing and personal assets
Damage to other assets
Damage to infrastructure
There were no flood warning Systems (S03)
Instructions to evacuate were not properly transmitted (S03-15)
Lack of flow capacity at the estuary (S03)
Artificial removal of sand bar (S03)
Upstream
Unmaintained levees (S03-19)
避難の必要性を感じない
Religious reasons
There were no flood hazard maps (S03)
家庭内での男性(世帯主)優 位の序列 【イスラム教】
ムスリム女性は夫の死後、 4 ヶ月と 10 日間は誰とも会って はならない 【イスラム教】
(S06_33)
防災教育が十分でない (S03)
防災対策テキストが普及され ていない
(S03_20)
No water disaster plan for the entire basin (S03-21)
Damage to industry
A Muslim woman can not see any person during a period of 4 months and 10 days after her husband's death. (Islam) (S06-33)
The man (head of the house-hold) dominates the family hierarchy (Islam)
Lack of crisis awareness Incorrect knowledge about disasters
Insufficient disaster preven-tion education (S03)
Disaster prevention textbooks were not promoted
Published a disaster preven-tion textbook "Landslide in Focus Vol.1-4" for residents (2000) (S02-01)
Residents do not feel the necessity to evacuate
Tamils unhappy because the ODA privilege the Sinhalese area (S24)
Not as distinct as in India but caste discrimination exists (S06-27)
Women in the Sinhalese society prior to British rule did not have a low social status (S24-03)
Landslide hazard mapsMatara: Incomplete Galle: No plans of creating one
Flood control facilities as part of the GRP (10 pumping stations, building levees from the estuary to about 12km)
Concentrated downpour after soil moisture satura-tion (rainfall at Sinharaja) Over 350mm (early morning on May 17) (S03)
Continuous rain due to the cyc-lone (Rainfall at Ratnapura) Total: over 600mm (May 1 - 15) (S03)
The rivers are high gradient in the upper river basin and then become extremely low gradient at the middle and lower reach (S03)
Because the water level of Gin Ganga rises during the rainy season, the tributary stream water can not naturally flow down to Gin Ganga (S03-20).
Continuous rain due to the stalling of the cycloe, concentrated rain in the southwest of Sri Lanka. (weekly rainfall in the southwest area) Over 100mm (May 6 - 13) (S03)
In addition to bridge supports, roads, flood control facilities, telecommunications facilities and power facilities, 9 temples, mosques and churches, 1 hospital (number of beds 115), 19 public schools (damage caused floods only), 31 public schools (damage caused by floods and strong winds) and 94 public buildings were damaged.
Damage to agricultural crops Coconut plantation: 63 acres Tea plantation: 3,098 acres Rice paddies: 2,000 acres Cinnamon: 643 acres Banana: 497 acres Vegetable field: 21 acres
Impossible to mix the com-munities (hamlets) consisting of a combination of 4 reli-gions (Buddhism, Hinduism, Islam, Christianity) and 6 ethnic groups (Sinhalese, Sri Lankan/Indian Tamils, Sri Lankan Moors, Malay and Burgher) (S06-22)
Formation of a Sinhalese and Tamil consciousness surrounding language and religion (S02-01)
Colonial governance the British had been pursuing prior to independence in 1948 where the Tamils were treated (S02)
Centralization of authority (S02)
Sinhalese superiority policy by the Sinhalese government after independence (S02-02)
Fig. 45. Damage Factor Analysis of the May 2003 Flood and Landslide Disaster (Gin Ganga) (Diagram)
Fishermen have a low caste status (S06-27)
Distrust in Policies

107
(3) Flood and Landslide Disaster of Nilwala Ganga (S03), (S07), (S15), (S23)
Fig. 46 shows the results of the damage factor analysis of the Nilwala Ganga flood and landslide disaster. Meanwhile, Fig. 47 shows a diagram of the particular items obtained from the sources of reference for the factor analysis.
Below are the analyzed results regarding each factor.
[Natural Factors]
1) Continuous rain resulting from the stalling of the cyclone and concentrated down-pour following soil moisture saturation
As mentioned in 4.1 (1), from May 17 - 18, 2003, a record rainstorm hit the south of Sri Lanka for the first time in about 50 years. However, it is believed that the previous heavy rain resulting from the stalling of the cyclone in the Bay of Bengal, something rarely seen in May, triggered the following flood and landslide disaster.
In the Nilwala Ganga basin the rain that had continuously been falling since the 11th, in-creased from the 16th, causing a flood in Cotopora area as well in other regions.
As a result, although this flood and landslide disaster occurred directly because of the increased rainfall from the 16th, as with Kalu Ganga and Gin Ganga, it is appropriate to believe that soil moisture in the disaster area was already saturated due to continuous rainfall prior to that.
2) Concentrated rain in southwest Ceylon
As mentioned in 4.1 (2), while the country suffered floods and landslides disasters 37 times in 49 years between 1957 and 2005, during the 4 major floods in 1947, 1957, 1969 and 1978 when the extent of the damage was severe, rainfalls were evenly distributed across the country but the area where rain fell during the May 2003 flood was limited to southwest Ceylon in May 2003 (See Table 13 and Fig. 17).
In addition, as can be seen from Fig. 27 and 28, which show the annual flow data at Pi-tabeddara from December 2002, while Fig. 27 shows that the daily flow rarely exceeds the normal 100m3/s, Fig. 28 reveals that in May 2003 alone, the flow twice exceeded 500m3/s. This shows that the rainfall in May 2003 was different from normal times and that the scale of the flood that occurred on May 17 2003 was out of the ordinary.

108
3) Geomorphic characteristics of Nilwala Ganga basin that is prone to floods in the downstream area
Although precipitous woodland is seen at the upstream of Nilwala Ganga, in the down-stream area the gradient is relatively gentle. Most of the rivers in Sri Lanka are high gra-dient in the upper river basin and then become extremely low gradient at the middle and lower reach. As a result, while landslides are frequent in the upper river basin, because the rivers are low gradient in the middle and lower reach, flood water can not promptly flow down and thus often overflow. It can be said that Nilwala Ganga basin's geomor-phic features apply to these conditions as well.
4) Geomorphic and geological features of the Nilwala Ganga basin that is prone to landslides and slope failures in the upper river basin
The mountain area at the head of Nilwala Ganga is a forest covered with red-yellow podzols. As in Ratnapura at the upstream of Kalu Ganga, landslides occurred in preci-pitous mountainous terrain at the upstream of Nilwala Ganga following the long period of heavy rain in May 2003, as a result of which many roads were cut off. Moreover, slope failures caused the death of 34 people.
[Social Factors]
5) Villagers live on dangerous mountainsides (inference)
As mentioned in 2.5.1. (1) 4), one of the factors that contributed to an increase in human suffering in Ratnapura's mountain area involves the farmers who lived on dangerous mountainsides.
As a result of this downpour, 34 people lost their life due to slope failures in the Nilwala Ganga basin. Kalu Ganga and Nilwala Ganga in the upper river basin are situated close to each other and thus land use in both basins is also believed to be similar. Although this remains an inference, it is believed that in the upstream Nilwala Ganga as well, farmers prioritizing the convenience of location for agricultural work lived on dangerous moun-tainsides.
6) Villagers live on waterside land
Generally speaking, it is believed that due to factors such as poverty, some people in Sri Lanka have no other choice but to live on waterside land within the river area. In the Nilwala Ganga basin, people living on waterside land are seen here and there, and with regard to the cutting of the levee, they may have done it to protect their houses which eventually led to a major flood in the protected lowland on the right bank.

109
7) Cutting of the downstream levee by the residents
As mentioned in 4.1. (5), with the assistance of the French Government, the hilly area of the river's lower reach was used successfully in constructing a levee like a mountain ridge, which has been protecting the flatland (See Fig. 31). However, during the May 2003 flood, a substantial amount of water flowed within the levee due to the cutting of the levee by local residents, which caused the flood to spread over an extensive area and claiming the lives of 30 people.
Meanwhile, with regard to the reason why the residents cut the levee, there is a theory that when the Minister suggested to the local officials of the then Irrigation Ministry to cut the upstream levee to protect Matara City, local residents living on waterside land cut it instead. However, according to the officials, it is impossible that the residents could have heard the above story before cutting the levee, and thus the reasons for the cutting are unclear.

110
[Status of Measures (flood control facilities, shelters, etc.)]
8) Pump facilities did not effectively operate due to poor maintenance
As mentioned in 4.1. (5), the main flood prevention works by the French Government consist of 3 pumping stations and levees. In particular, the Tudawa pumping station is the largest with 8 pumps. Meanwhile, although the spout capacity per pump is 3.5m3/s, it was revealed that 4 out of the existing 8 did not operate during the flood due to poor maintenance.
9) Scale of the flood more extensive than the flood control basin could handle
These flood prevention works also included drainage basins with overflow levees in some places, which are useful during normal floods, but it seems that the large-scale floods of May 2003 were much too extensive.
10) Undeveloped flood warning systems and flood hazard maps
As mentioned in 4.1. (5), in terms of non-structural measures, no particular plans were implemented such as flood forecasting and warning systems or flood hazard maps. With regard to landslide hazard maps, although Nilwala Ganga basin is located in Matara Dis-trict and thus included in the LHMP's list of districts, no map has been completed yet.
11) Insufficient disaster prevention education
Surveys reveal that the disaster prevention textbook published in 2000 was not suffi-ciently promoted. However, because the content of the textbook is unknown, it may not be safe to assume that sufficient promotion would have alleviated this flood and landslide disaster. Nevertheless, according to the field survey results indicated in the source of reference S03, local disaster prevention education seems to have been insuffi-cient.
[Status of Response (evacuation status, etc.)]
12) With no experience of floods, residents underestimated the necessity to evacuate
Because no flood had occurred in the past 30 years in Nilwala Ganga, most of the resi-dents had never experienced one. This is believed to be one of the reasons why the dam-age was so significant.
Because the rain started on the 11th, the risk of landslides and floods were reported by the media, such as television, radio and newspaper. The residents were also aware about this

111
information. Unfortunately, with regard to the flood expansion at the downstream point on the 18th, the residents were unaware of the risks until they were informed by louds-peaker, as will be described later, and thus they did not take precautions and did not evacuate.
13) Some residents could not evacuate due to tardiness of bureaucratic response
Due to continuous rain, the Department of Irrigation in Matara held a meeting on meas-ures against floods on the 17th. A flood warning was issued to each local office by tele-phone and fax. The local offices then informed the residents about evacuation and shel-ters using loudspeakers. These loudspeakers through which they spoke from their three-wheelers or cars were in fact used as an emergency measure as there were no "dis-aster prevention loudspeakers" per se. These loudspeakers were set up at electric ap-pliance shops in big communities, and when transmission of certain information was ne-cessary, this was done with the cooperation of NGOs.
On the 18th, a large area was flooded and thus a conference on measures against floods was held by Sri Lankan Government officials and cabinet members. Moreover, at this stage, a request to the army and police for rescue and relief operations was made. It is said that evacuation instructions on this day led to the evacuation of about 8,000 people. Unfortunately, because in some areas, the flood spread before the residents received in-structions to evacuate, these areas ended up being isolated. The isolated residents were rescued using boats that were brought in from the coasts, but by that time, water levels were below the maximum levels. Therefore, it can be said that response was undeniably slow.

112
[Explanatory notes]
�Measure status (flood control facilities, shelters, etc.): ■blue
�Measure status (evacuation status, etc.): ■green
�Damage status
Human: ■red solid line
Physical: ■red dotted line
�Natural factors (external force, geography, land features:
■orange
�Social factors (poverty, vulnerability): ■purple
Natural Conditions of Sri Lanka
・Located about 29km south of India, Sri Lanka is an island surrounded by sea, with a coastline of 1,340km. ・Sri Lanka's climate conditions are briefly divided into three zones. The island's southwest area including the central highlands is a wet zone with high precipitation. ・It is affected by the southwest monsoon or Yala season from May to September and the northeast monsoon or Maha season from December to the following February. Due to these monsoons, the meteorological conditions are categorized into 4 periods. During the Yala period, rain falls abundantly in the southwest area including the island's central highlands.・It is often hit by cyclones because it is located at a low altitude, but they are not frequent.
Deaths: 64
Missing: 17
Victims: 47,637 households (145,875 people)
Among the deaths, 30 people died due to floods, and the remaining 34 died of landslides (slope failures). Most likely,
even in the Nilwala Ganga basin, farmers who prioritize the convenience of location for agricultural work live on
dangerous mountainsides, which contributed to expansion of damage.
Heavy rain resulting from the stalling of the cyclone in the Bay of Bengal, something rarely seen in May. Total weekly rainfall in the southwest: over 100mm (May 6-13)
At Nilwala Ganga, the then Ministry of Irrigation undertook flood control projects with the assistance of France in 1979.
Rainfall limited to southwest Ceylon.
Concentrated downpour following soil moisture saturation (flow at Pita-
beddara) 2,900m3/s (May 18)
The mountain area at the
head is a forest covered
with red-yellow podzols
and is a precipitous
landscape.
Because bureaucratic response was slow and the flood spread faster than expected, it created isolated areas that could not receive official announcements as a result of which some residents could not evacuate.
The NBRO has been working since 1995 on the Landslide Hazard Mapping Programme (LHMP) targeting 8 districts most prone to landslides. While Nilwala Ganga basin is situated in Matara District, a
landslide hazard map of Matara District has yet to be completed.
Damaged houses
Completely destroyed:
2,138
Partially destroyed: 5,562
Roads were cut off and bridge piers and culverts were
damaged. Moreover, 26 schools suffered damages.
Among these, some were used as shelters. The army
cleaned the 2,941 wells that were polluted
The hilly area of the river's lower reach was used successfully in constructing a levee like a mountain ridge, which has been protecting the flatland.
The flood prevention works also included drainage basins with overflow levees in some places, which are useful during normal floods, but it seems that the large-scale floods of May 2003were much too extensive.
Although there are pumping stations, 4 of the 8 pumps at the largest Tudawa pumping station did not operate during the flood due to poor maintenance.
Because no flood had occurred in the past 30 years in Nilwala Ganga, most of the residents had never experienced one. Risk of landslides and floods was announced on television and radio, and although the
residents had knowledge of the situation, they were not sufficiently aware of the necessity to evacuate.
Generally speaking, it is believed that due to factors such as poverty, some people in Sri Lanka have no other choice but to live on waterside land within the river area or on dangerous mountainsides. .
A substantial amount of water flowed within the levee due to the cutting of the levee on the right bank by local residents living on waterside land, which caused the flood tospread over an extensive area and claiming the lives of 30 people.
The reason why the levee was cut is unknown.
Fig. 46. Damage Factor Analysis of the May 2003 Flood and Landslide Disaster (Nilwala Ganga) (Summary of facts)

113
Social root factors
Factors related to public awareness that increase or decrease damage potentials
Natural factors
Factors related to measures against flood and landslide measures that increase or decrease disaster potentials Direct social factors that increase damage potentials
External force
Human damage
Physical damage
Damage
Direct damage
Indirect damage
Deaths: 64 (S03-27) Missing: 17 persons
(S03)
3/s(5 月 18 日)
Victims: 47,637 households 145,875 persons (S03)
Residents did not try to evacuate Residents could not evacuate
Insufficient measures against floods and landslides Many live in vulnerable regions
氾濫拡大が先行したため、
情 報伝達が出来ない孤立し
域が発生
Sinhala Only Law (1956) (S24_11)
憲法改正によりシンハラ語
及 ( 1987
住民向けの防災対策テキ
ス ト ” LANDSLIDE IN
Existence of a covert agreement that placed those who spoke fluent English in a socially privileged class
(S24_12)
Despite the overwhelming majority of Swabhasha (refers to those who speak only Sinhalese or Tamil, as opposed to the elite class who speak English) graduating university, these Sri Lankans are not offered good positions. (S24-12)
ODA がシンハラ地区に偏っ
Centralization of authority (S02)
Segregation tendency in theNorth Eastern Province
(S02)Increased poverty in the northeast
Increased unemployment rate
Low income
Vulnerable houses
Distrust in politics
る
過去 30 年間洪水氾濫が生
危 機 意 識 の 欠
災害に関する誤った知
識
Complete destruction: 2,138 (S03)
Damage to houses
Damage to housing and personal assets
Damage to other assets
Partial destruction: 5,562 (S03)
Damage to infrastructure
Damage to agricultural crops Road traffic cut off
Culvert and bridge destroyed
26 school buildings damaged and 2,941 wells polluted (S03)
There were no flood warningsystems (S03)
There were no flood warningsystems (S03)
Flood control project aided byFrance
避難の必要性を感じな
い
Religious reasons
地滑りハザードマッ
ムスリム 女性は 夫の死
後、
4 つの宗教(仏教、ヒンドゥ
イスラム教、キリスト教)と 6
の民族(シンハラ、スリラン
カ 系/インド系タミール、ム
ー ア、マラヤーリ、バーガー)
の 組合せで形成された各コミ
ュ は 不 可防災教育が十分でな
(S03
) 防災対策テキストが普及さ
Form increasingly vulnerable
Flood was too fierce to handle
(S03
Flood control basins with overflow levees (S03)
ツゥダワのポンプ 8 基のう
4 基は整備不良で稼働せ
排水ポンプ場(ツゥダワ他 2
所
下流域の丘陵地を利用し
た 山つき堤のような
Slow bureaucratic response
(S03)
を通して洪水の状況を把握
し )
Damage to industry
Impossible to mix the communities (hamlets) consisting of a combina-tion of 4 religions (Buddhism, Hinduism, Islam, Christianity) and 6 ethnic groups (Sinhalese, Sri Lankan/Indian Tamils, Sri Lankan Moors, Malay and Burgher) (S06-22)
A Muslim woman can not see any person during a period of 4 months and 10 days after her husband's death. (Islam) (S06-33)
The man (head of the household) dominates the family hierarchy (Islam)
Lack of crisis awareness Incorrect knowledge about disasters
Disaster prevention textbooks were not promoted
Published a disaster prevention textbook "Landslide in Focus Vol.1-4" for residents (2000) (S20-01)
Residents do not feel the necessity to eva-cuate
Following constitutional amendment, both Sinhalese and Tamil become official languages (1987) (S24-11)
Tamils unhappy because the ODA privilege the Sinhalese area (S24)
Sinhalese superiority policy by the Sinhalese government after independence (S02-02)
Formation of a Sinhalese and Tamil consciousness surrounding language and religion (S02-01)
Colonial governance the British had been pursuing prior to independence in 1948 where the Tamils were treated preferen-tially (S02)
Fishermen have a low caste status (S06-27)
Not as distinct as in India but caste discrimination exists (S06-27)
Women in the Sinha-lese society prior to British rule did not have a low social status (S24-03)
Continuous rain due to the stalling of the cyclone, concentrated rain the southwest Sri Lanka (weekly rainfall in the southwest) Over 100mm (May 6 - 13) (S03)
Continuous rain due to the stalling of the cyclone (rainfall at Ratnapura (reference)) Total exceeding 600mm (May 1-15)
River is high gradient in the upper river basin and extremely low gradient at the middle and lower reach (S03)
The mountain area at the head is a forest covered with red-yellow podzols and is a precipitous landscape. (S03)
Concentrated downpour following soil moisture satu-ration (daily flow at Pita-beddara) 2,900m3/s (May 18) (S03)
Because there were no floods in the last 30 years, most of the residents had never experienced one.(S03-30)
The residents had knowledge of the flood through media such as radio and television (S03-3)
Landslide hazard mapsMatara district: incom-plete (S03)
Because the flood spread faster than expected, some areas were isolated and could not receive official announcements (S03-22)
4 of the 8 pumps in Tudawa did no operate due to poor mainten-ance (S03)
Drainage pumping stations (2 other than Tudawa) (S03)
Hilly area of thelower reach was used successfully in constructing a levee like a mountain ridge (S03)
Worsened the flood because residents living on the waterside land cut the levee on the right bank during the flood (S03-27)
Live in dangerous places (on mountainsides)
Live in dangerous places (on waterside land)
They cannot afford to buy land in good locations (with little risk ofdisasters)
Fig. 47. Damage Factor Analysis of the May 2003 Flood and Landslide Disaster (Nilwala Ganga) (Diagram)
Insufficient disaster prevention education (S03)

114
5.2 Damage Analysis of the December 2004 Tsunami (S05), (S06), (S08), (S09), (S12), (S13)
Fig. 48 shows the results of the damage factor analysis of the December 2004 tsunami disaster. Meanwhile, Fig. 49 shows a diagram of the particular items obtained from the sources of ref-erence for the factor analysis.
Below are the analyzed results regarding each factor.
[Natural Factors]
1) Tsunami whose scale is one that is seen once every 100 to 150 years in the Indian Ocean
As mentioned in 2.4.2. (1), the size of the Indian Ocean Tsunami was one that ranks right behind the tsunami that followed the 1960's Chile Earthquake and the 1946 Aleutians Tsunami and is the same as the 1964 Alaska Tsunami, indicating that it was the second or third largest tsunami of the 20th century (See Table 22).
Furthermore, according to the past tsunamis that occurred on the Sunda Trench (See Ta-ble 23) the Indian Ocean Tsunami can be considered as the type of tsunamis that occur once every 100 to 150 years.
Meanwhile, although the scale of the earthquake itself was significant as it recorded Mw=9 and caused damage to Sumatra which was close to the epicenter, because Sri Lanka was 1,700km away from the epicenter, no one physically felt the earthquake.
2) Coasts of Sri Lanka consist of a series of roads and communities on the slightly ele-vated ground of the coastal dune
As mentioned in 2.4.2. (1), the damage caused by the Indian Ocean Tsunami involved only the few hundred-meter coastal belt along the coastline. One of the geomorphic fea-tures is the fact that the coasts of Sri Lanka consist of a series of roads and communities on the slightly elevated ground of the coastal dune (See Fig. 35). In other words, because there are no natural obstacles that would absorb the energy of the tsunami, such as fo-rests between the coastline and communities, and because the communities are situated at extremely low levels of a few meters above sea level, it can be said that the geomor-phic features of the coastline make it prone to tsunamis.
3) Influence of the geological formation of the seabed on the southwest coast of Ceylon on the movement of the tsunami
As mentioned in 2.4.2. (1), the Indian Ocean Tsunami that hit the east coast of Sri Lanka about 2 hours after the earthquake gradually moved south clockwise and even hit the southwest coast on the opposite side of the epicenter. However, although the damage on

115
the east coast was uniformly distributed, damage levels varied greatly on the southwest coast (See Fig. 34).
A few reasons for the great variations in the levels of damage on the southwest coast in-clude the fact that the tsunami that traveled toward the west of the island from the epi-center reflected off the south coast of Sri Lanka and hit the southwest coasts as boundary waves (See Fig. 37), and that not only are there geomorphic differences on land but also slight differences in the geological formation of the seabed.
[Social Factors]
4) Due to the influence of civil wars, development of the northeast area is 25-30 years behind that of other regions
As mentioned in 2.3. (6) and 2.3. (8), the country's southwest side is the Buddhist area inhabited by the Sinhalese, and political and armed conflicts continue with the Hindu Tamils who are mostly concentrated on the northeast side. Because this northeast area is mostly controlled by the LTTE (Uncleared Area), government investment for social in-frastructure development was delayed. In addition, the damage due to civil wars with government forces that lasted closed to 20 years was extensive, and thus development of the northeast area is 25 to 30 years behind that of other regions.
5) Low social status of fishermen
Although not as marked as in India, caste discrimination still exists and is affecting social statuses. For example, fishermen have a low social status.
Of course one of the main reasons why fishermen live near the coastline is because it is more convenient when they go fishing, but it is believed that sufficiently wealthy fi-shermen have both a house where they store their boats and another one in which they live, built in a nicer place away from the coastline. One of the reasons why they cannot do that is poverty, and a reason why they cannot get out of their situation is that social status of fishermen is low.
[Status of Measures (flood control facilities, shelters, etc.)]
6) Almost no breakwater facilities nor floodgates on the extensive coastline
Sri Lanka is an island surrounded by either the Indian Ocean or Bay of Bengal and has a coastline of 1,340km. Developing breakwater facilities or floodgates on the extensive coastline which would be compatible with the occurrence probability of the Indian Ocean Tsunami would be unrealistic. In addition, no one had imagined before the tsuna-mi disaster that it would hit Sri Lanka and thus there were only breakwater facilities and

116
floodgates in limited places such as Colombo and Galle where important ports are lo-cated.
7) Undeveloped tsunami forecasting and warning systems
Because volcanic activities are common in the Pacific Ocean area and earthquakes and tsunamis are frequently observed, an earthquake and tsunami information network had been established in the surrounding countries since a long time ago. However, no such network existed in the Indian Ocean.
In the wake of the Indian Ocean Tsunami, the United Nations, led by UNESCO'S Inter-governmental Oceanographic Commission (IOC), has been working in cooperation with the International Strategy for Disaster Reduction (ISDR) and the World Meteorological Organization (WMO) on activities toward the development of the Indian Ocean Tsunami Warning and Mitigation System (IOTWS). The agencies in Sri Lanka that are part of this project are the Geological Survey and Mines Bureau and the Department of Meteorology. A receiving system of the tsunami warning system is installed in the Geological Survey and Mines Bureau, allowing them to receive information from the Pacific Tsunami Warning Center (PTWC) and the Japan Meteorological Agency.
8) Insufficient disaster prevention education
According to a survey conducted after the tsunami disaster to local residents living in af-fected areas, although many people escaped to higher grounds when the tsunami hit the island, quite a few people also went to take a look at the ocean during the backwash (23%). In addition, 94% of the residents had no knowledge about tsunamis, while 90% believe that the damage could have been mitigated if they had knowledge about tsunamis. Moreover, according to a survey conducted to school children, 71% of the students are aware that tsunamis occur due to earthquakes, but the remaining 30% or so still had no knowledge of this fact.
As a result, it can be said when the tsunami occurred, disaster prevention education to better understand tsunamis was not sufficiently given to the general public and in schools.
[Status of Response (evacuation status, etc.)]
9) Incorrect response to the tsunami increased human damage
As mentioned in 8), the lack of knowledge about natural phenomena such as tsunamis and incorrect response to the tsunami on an individual level may have contributed to the increased human suffering.

117
For example, according to some reports, because local residents along the coast had nev-er experienced a tsunami, when the water receded about 300-400m from the usual coas-tline between the first and second wave, children went to the beach to pick the fish lying on the sand or tried to throw them back to the sea, the second wave came, which aggra-vated the damage.
10) Sri Lanka Government declared a State of National Disaster immediately after the tsunami
Following the December 26, 2004 tsunami, the Sri Lanka Government declared a State of National Disaster, made an appeal for international assistance, and the President es-tablished 3 task forces to respond to the situation. Moreover, a Center for National Oper-ations office was established at the President's office which promoted emergency re-sponse activities in cooperation with concerned ministries and the United Nations (See Fig. 40).
11) Insufficient overall monitoring and coordination of relief activities and considerable differences between each district and division
In addition to coordination with the above 3 agencies, the CNO also worked on logistics, food aid, water supply, hygiene, education, fishing industry, psychosocial care and childcare, as well as establishing offices for each sector related to the tsunami disaster to determine the extent of the damage and keep track of the status of support. Moreover, in order to share this information, exchange opinions, and perform coordination, they held regular meetings twice every week. Furthermore, they held coordination meetings with bilateral assistance agencies, UN agencies and NGO, etc. for the coordination of emer-gency assistance.
However, there are reports that with regard to the monitoring and coordination of relief activities by the CNO, national coordination has not been strong enough, and each dis-trict managed the coordination with the district agent as leader, and there seems to be considerable differences between each district and division in terms of the status of coordination.
12) Building of temporary shelters for the evacuees
There were no shelters reserved for tsunami disasters per se, and thus schools around the affected areas temporarily closed and were pressed into use as camps. The Sri Lanka pri-oritized the evacuees staying in schools and recommended them to move to temporary houses in order to reopen the schools as soon as possible. In addition to the building of temporary houses, schoolyards, gardens of mosques and temples, and even private prop-

118
erties were used to shelter the evacuees.

119
[Explanatory notes]
�Measure status (flood control facilities, shelters, etc.): ■blue
�Measure status (evacuation status, etc.): ■green
�Damage status
Human: ■red solid line
Physical: ■red dotted line
�Natural factors (external force, geography, land features:
■orange
�Social factors (poverty, vulnerability): ■purple
Natural Conditions of Sri Lanka
・Located about 29km south of India, Sri Lanka is an island surrounded by sea, with a coastline of 1,340km.
・ The entire coastal area is low and a series of roads and communities are found on the slightly elevated ground of the coastal dune.
・ There are geomorphic differences on land but also slight differences in the geological formation of the seabed.
Deaths: 30,974 Injured: 23,176 Unidentified: 4,698 Victims: 248,266 households
The tsunami magnitude (Mt) of the Indian Ocean Tsunami was 9.1, a magnitude that ranks right behind the tsunami that fol-
lowed the 1960's Chile Earthquake and the 1946 Aleutians Tsunami and is the same as the 1964 Alaska Tsunami, indicating that
it was the second or third largest tsunami of the 20th century.
The tsunami's time of arrival from the epicenter to Sri Lanka was about 2 hours at the east coast and 2.5 hours at the southwest coast. However, unlike in the Pacific Ocean area where vol-
canic activities are common and earthquakes and tsunamis occur frequently, there were no earthquake and tsunami information network in the Indian Ocean and because Sri Lanka had no
system to receive tsunami warnings, the Government could not inform in advance the residents living along the coast of the incoming tsunami.
According to the past tsunamis that occurred on the Sunda Trench the Indian Ocean Tsunami can be considered as the type of
tsunamis that occur once every 100 to 150 years.
Due to the long civil wars between the government forces and the LTTE, develop-ment in the northeast area is 25 to 30 years behind that of other areas.
Destroyed houses Complete 68,779 Partial: 43,405
There were only breakwater facilities and floodgates in limited places such as Colombo and Galle where important ports are located.
Although not as marked as in India, caste discrimination still exists and is affecting
social statuses. For example, fishermen have a low social status.
The un-wealthy residents living (particularly fishermen) living around the coastline were those on whom the tsunami took a drastic toll.
Most of the residents living on the coastline had never experienced a tsunami and thus 94% of them had no knowledge about tsunamis. Disaster prevention education on tsunamis was insufficient.
When the water receded about 300-400m from the usual coastline between the first and second wave, while children went to the beach to pick the fish lying on
the sand or tried to throw them back to the sea, the second wave came, which aggravated the damage.
This day was Unduvap poya day, a holiday, and thus fishermen were not out fishing. Damage to infrastructures
Roads and bridges
Harbors
Power
Water supply
Most of the fishing boats wereanchored in the harbors or lefton the sand.
Damage to agricultural crops
Damage to fishing industry 1 Fishing boats: 20,552 2 Fishermen: more than100,000 3 Distributors: 80,000 4 Related workers: 20,000 5 Total including family members form 2-4:
800,000
Fig. 48. Damage Factor Analysis of the December 2004 Tsunami Disaster (Summary of facts)

120
Social source factors
Factors related to public awareness that increase or decrease damage potentials
Natural factors
Factors related to measures against tsunamis that increase or decrease disaster potentials
Direct social factors that increase damage potentials
External forces
Human damage
Physical damage
Damage
Direct damage
Indirect damage
Deaths: 30,974 (S06) Injured: 23,176Unknown identity 4,698 (S06)
津波マグニチュード(Mt)9.1 で
あり、20 世紀に発生した津波
の中で 2~3 位に位置する巨
大津波の一つ
インド洋海域においては 100
~150 年に 1 度の生起確率で
発生する規模の津波であった
と評価
(S06)
Victims: 248,266 (S06)
Residents did not try to evacuate
Residents could not evacuate
Insufficient measures against tsunamis
Many live in vulnerable regions
<震源からス国までの津波
到達時間>
東部海岸:約 2 時間
北東部はそれ以外の地域に
比べ、25~30 年開発が遅れ
They can not afford to buy land in good locations (with little risk of disasters)
独立後のシンハラ政権がとっ
てきたシンハラ優位政策
(S02_02)
(S24_03)
1948 年の独立以前にイギリス
が行ってきたタミル人優位政
策による植民地統治
Sinhala Only Law
(1956) (S24-11)
Existence of a covert agreement that placed those who spoke fluent Englishin a socially privileged class(S24-12)
Despite the overwhelming majority of Swabhasha (refers to those who speak only Sinhalese or Tamil, as opposed to the elite class who speak English) graduating university, these Sri Lankans are not offered good positions. (S24-12)
ODA がシンハラ地区に偏って
Centralization of authority (S02)
Segregation tendency in theNorth Eastern Province (S02)
Increased poverty in the northeastarea
Increased unemployment
Low income
一戸建てだが、”日干し煉瓦
積み壁”で脆弱な家屋
Distrust in politics
危険な場所(海岸付近)に居
住する
政府軍と LTTE との内戦の長
住民の 94%は津波についての
知識がなかった
(S08_02)
危機意識の欠如
災害に関する誤った知識
漁への利便性を優先
Complete destruction: 68,779(S06)
Damage to houses
Damage to housing and personal assets
Damage to other assets
Partial destruction: 43,405 (S06)
Damage to infrastructure
(S06)
津波の警報を受けるような体
制になっていなかった重要な港湾施設が位置する
コロンボ、ゴール等限られた
場所に防波・防潮施設が存
在する程度
防波・防潮施設が不充分避難の必要性を感じない
Religious factors
家庭内での男性(世帯主)優
位の序列 【イスラム教】
ムスリム女性は夫の死後、
4 ヶ月と 10 日間は誰とも会って
はならない 【イスラム教】
(S06_33)
4 つの宗教(仏教、ヒンドゥ教、
イスラム教、キリスト教)と 6 つ
の民族(シンハラ、スリランカ
系/インド系タミール、ムー
ア、マラヤーリ、バーガー)の
組合せで形成された各コミュ
ニティ(部落)を混合すること
は不可能
(S06_22)第一波から第二波の間に通
常の海岸線から 3~400m ほ
ど海水が引いた際、子どもら
が浜に取り残された魚を捕っ
たり、海へ戻そうとしている間
に第二波に襲われた
(S05_01, S08_01)
Lack of disaster prevention education about tsunamis
Damage to industry
ウンドゥワプ月のポヤ・デー
Damage to agricultural crops
津波の襲来を住民に事前に
知らせることが出来なかった
沿岸の住民が津波を経験し
ていない
(S05_01)
Impossible to mix the communities (hamlets) consisting of a combi-nation of 4 religions (Buddhism, Hinduism, Islam, Christianity) and 6 ethnic groups (Sinha-lese, Sri Lankan/Indian Tamils, Sri Lankan Moors, Malay and Burgher) (S06-22)
A Muslim woman can not see any person during a period of 4 months and 10 days after her husband's death. (Islam) (S06-33)
The man (head of the household) dominates the family hierarchy (Islam)
Lack of crisis awareness Incorrect knowledge about disasters
Residents do not feel the necessity to evacuate (S08-02)
Following constitutional amendment, both Sinhalese and Tamil become official languages (1987) (S24-11)
Tamils unhappy because the ODA privilege the Sinha-lese area (S24)
Sinhalese superiority policy by the Sinhalese government after independence (S02-02)
Formation of a Sinhalese and Tamil consciousness surround-ing language and religion (S02-01)
Colonial governance the British had been pursuing prior to independence in 1948 where the Tamils were treated preferentially (S02)
Fishermen have a low caste status (S06-27)
Not as distinct as in India but caste discrim-ination exists (S06-27)
Women in the Sinhalese society prior to British rule did not have a low social status (S24-63)
Geomorphic differences on land but also slight differences in the geological formation of the seabed (S05-03)
Sri Lanka is an island surrounded by sea, with a coastline of 1,340km
The distance from the epicenter of the Sumatra Earthquake was 1,700km
The tsunami magnitude (Mt) was 9.1, making it the second or third largest tsunami of the 20th century (S06)
The Indian Ocean Tsunami can be consi-dered as the type of tsunamis that occur once every 100 to 150 years. (S06)
When the water receded about 300-400m from the usual coastline between the first and second wave, while children went to the beach to pick the fish lying on the sand or tried to throw them back to the sea, the second wave came (S05-01, S06-01)
94% of the residents had no knowledge about tsunamis
Most of the residents had never experienced a tsunami (S05-01)
The arrival of the tsunami could not be communicated to the residents in advance
There were no tsunami warning systems (S06-28)
<Tsunami arrival time from the epicenter to Sri Lanka> East coast: about 2 hrs Southwest coast: 2.5 hrs
Insufficient breakwater facilities and floodgates (S06)
There were only break-water facilities and floodgates in limited places such as Colombo and Galle where impor-tant ports are located.
Loss of personal fishing boats and fishing equipment (S06)
Roads and bridgesHarbors Power Water supply (S06)
Most of the fishing boats were anchored in the harbors or left on the sand. (S06-16)
This day was Unduvap poya day, a holiday, and thus fishermen were not out fishing (S06-16)
Development in the northeast area is 25 to 30 years behind that of other areas.(S02-05)
Prolonged civil wars between the government forces and LTTE
Although they are stand-alone houses. because they are made of sun-dried brick wall, they are extremely vulnerable to external forces (S06-10)
Live in dangerous places (near the coas-tline)
Prioritize the conveni-ence of the location for fishing
The entire coastal area is low and a series of roads and communities are found on the slightly elevated ground of the coastal dune. (S06-02)
Damage to fishing industry1. Fishing boads: 20,552 2. Fishermen: over 10,000 3. Distributors: 80,000 4. Related workers: 20,000 5. Total include ng family mem-bers of the above 2-4: 800,000
(S06)
Fig. 49. Damage Factor Analysis of the December 2004 Tsunami Disaster (Diagram)

Appendix

List of Documents Related to Sri Lanka
Ref. No Document Date of
Publication Publisher Author
S01 Sri Lanka Country Report 1999 (Japanese Version) Unknown Asian Disaster Reduction
Center National Disaster Management Centre of Sri Lanka
S02
Conflict and Development: Roles of JBIC (Development Assistance Strategy for Peace Building and Reconstruction in Sri Lanka) (Japanese Version)
August 2003
Japan Bank for International Cooperation
JBIC Institute
S03 2003 Sri Lanka's Flood Damage Survey Report (in Japanese)
September 2004
Committee on Hydroscience and Hydraulic Engineering, JSCE
S04
National Report and Information on Disaster Reduction Sri Lanka - Country Paper (for World Conference on Disaster Reduction, Kobe - Japan, January 2005)
Unknown UNDP Disaster Risk Management Programme
National Disaster Management Centre of Sri Lanka
S05 Investigation Report on the Indian Ocean Tsunami Damage in Sri Lanka (Flash Report)
January 2005
Japan Water Forum (JWF)
S06
Field Survey Report on the Indian Ocean Tsunami Damages in Sri Lanka and the Maldives as a part of “Research on the Management of Projects in the Field of Disaster Prevention (Project Research)” (in Japanese)
March 2005
Japan International Cooperation Agency
Pacific Consultants International
S07 Taking Stock of Disaster Management Efforts in Sri Lanka
April 2005
UNDP Disaster Risk Management Programme
National Disaster Management Centre of Sri Lanka
S08 Report on the Results of the Survey on Tsunami Awareness in Sri Lanka
April 2005
Asian Disaster Reduction Center
S09
Preliminary Report on Sri Lanka's Urgent Indian Ocean Tsunami Disaster Recovery and Rehabilitation Program (in Japanese)
May 2005
Japan International Cooperation Agency
S10
AFTER THE TSUNAMI Human Rights of Vulnerable Populations
October 2005
Human Rights Center University of California, Berkeley East-West Center
S11 SRI LANKA Post Tsunami Recovery and Reconstruction - progress, challenges, way forward -
December 2005
Joint Report of the Government of Sri Lanka and Development Partners
S12
Report on the "Understanding of the Overall Picture of the December 2004 Asian Tsunami Disaster"
December 2005
Research Group on the December 26, 2004 Earthquake Tsunami Disaster of Indian Ocean
S13
Recovery, rehabilitation and development project for tsunami affected area of southern region in the Democratic Socialist Republic of Sri Lanka final report : executive summary (Japanese Version)
March 2006
Japan International Cooperation Agency
PADECO Co. Ltd NIPPON KOEI Co., Ltd. Overseas Agro Fisheries Consultants, Inc.
S14 Sri Lanka Country Report 2006 (Japanese Version) Unknown Asian Disaster Reduction
Center National Disaster Management Centre of Sri Lanka
S15 EM-DAT: Sri Lanka Country Profile - Natural Disasters
November 2006
EM-DAT: The OFDA/CRED International Disaster Database
S16 Country Index on Democratic Socialist Republic of Sri Lanka in the Website of Ministry of Foreign Affairs
Updated as needed
Ministry of Foreign Affairs of Japan
S17 Official Development Assistance (ODA) Data Book by Country, Version 2005 II Southwest Asian Regions [2] Sri Lanka
Unknown Ministry of Foreign Affairs of Japan

Ref. No Document Date of
Publication Publisher Author
S18 THE WORLD FACTBOOK 2006 November 2006
Central Intelligence Agency (USA)
S19 2002 Report on the Aid Policy Research (Democratic Socialist Republic of Sri Lanka) (in Japanese)
March 2003
Infrastructure Development Institute - Japan
S20
Report on the 2005 Research Survey on International Technical Cooperation in the Field of Disaster Prevention (in Japanese)
March 2006
Ministry of Land, Infrastructure and Transport & Infrastructure Development Institute - Japan
S21 Website of Japan External Trade Organization (JETRO)
Updated as needed
Japan External Trade Organization
S22 Central Bank of Sri Lanka Annual Report 2005
April 2006
Central Bank of Sri Lanka
S23
Hydrometric Network & Flood Mitigation March 2006
ITU Workshop on Emergency Telecommunications for Disaster Management in Sri Lanka
Eng(Miss) P. P. G. Dias Deputy Director of Hydrology Division, Irrigation Department
S24
Current Status and Future Issues on the Economy of Neighboring Asian Countries Research Institute on the Economic Situation of Neighboring Asian Countries, Report (in Japanese)
June 2000
Institute of Fiscal and Monetary Policy, Ministry of Finance