fact book - east carolina university book, employees with unc-ga job category (jcat) codes beginning...
TRANSCRIPT

Enrollment
Students
Degrees
Faculty & Staff
Fact Book 2013-2014
Office of Institutional Planning,
Assessment, and Research

Significant Changes in the 2013-2014 Fact Book
Students
Prior to 2013, Dental enrollment was reported under the Graduate student heading.
Beginning in the 2013-2014 Fact Book, Dental students are reported separately.
Therefore, Graduate student totals will differ from previous Fact Books.
Prior to 2013, non-degree-seeking undergraduate enrollment was reported under the
General College/Undeclared Major heading. Beginning in the 2013-2014 Fact Book,
non-degree-seeking undergraduate students are reported separately. Therefore,
General College/Undeclared Major totals will differ from previous Fact Books.
o Note: Non-degree-seeking undergraduates include high school students
participating in the Early College Second Life Program, exchange students,
students seeking a post-baccalaureate teacher licensure only, and visiting
students (students taking for-credit courses at ECU while matriculated at another
institution, including students participating in the UNC-GA World Languages
initiative).
Faculty and Staff
Prior to 2013, all Faculty and Staff were reported under the Occupational Activity
Category (OACAT) code. In 2013, the Occupational Activity Category code was
eliminated from the UNC-GA Personnel Data File. Beginning in the 2013-2014 Fact
Book, all Faculty and Staff are reported under the UNC-GA Job Category (JCAT) code
and the IPEDS Standard Occupational Classification (SOC) code.
Selection Criteria for Faculty:
o Prior to 2013, employees with Occupational Activity Category (OACAT) code of
“20” (Instructional Faculty) were reported as Faculty. Beginning in the 2013-2014
Fact Book, employees with UNC-GA Job Category (JCAT) codes beginning with
“2” (Faculty and Academics) are reported as Faculty. Please refer to the footnote
of each page for detailed selection criteria.

ORGANIZATIONAL CHARTSDIVISION OF ACADEMIC AFFAIRS i
DIVISION OF ADMINISTRATION AND FINANCE ii
DIVISION OF HEALTH SCIENCES iii
DIVISION OF RESEARCH AND GRADUATE STUDIES iv
DIVISION OF STUDENT AFFAIRS v
DIVISION OF THE CHANCELLOR vi
DIVISION OF UNIVERSITY ADVANCEMENT vii
EAST CAROLINA UNIVERSITY viii
STUDENTS
HIGHLIGHTS
FALL ENROLLMENT HISTORY 1909 - PRESENT 1
STUDENT HIGHLIGHTS 2
ENROLLMENT SUMMARY FALL TO FALL COMPARATIVE DATA 3
ADMISSIONS
NEW FRESHMAN AVERAGE SAT BY RESIDENCY 5
NEW FRESHMAN ADMITTED AND ENROLLED BY SAT INTERVAL 6
NEW FRESHMAN HIGH SCHOOL CLASS RANK 7
NEW FRESHMAN IN-STATE BY NC COUNTY 8
NEW FRESHMAN OUT-OF-STATE BY STATE OF RESIDENCY 9
NEW TRANSFERS BY SENDING INSTITUTION 10
ENROLLMENT
ON-CAMPUS AND DISTANCE EDUCATION 11
ON-CAMPUS AND TOTAL FTE 12
BY GENDER AND ATTENDANCE STATUS 13
BY RESIDENCY AND ATTENDANCE STATUS 14
BY CLASSIFICATION, ATTENDANCE STATUS, AND GENDER 15
BY RESIDENCY AND CLASSIFICATION 16
HISTORY BY CLASSIFICATION AND GENDER 17
HISTORY BY CLASSIFICATION AND RESIDENCY 18
BY CLASSIFICATION, ATTENDANCE STATUS, AND ETHNICITY 19
BY CLASSIFICATION, GENDER, AND ETHNICITY 20
HISTORY BY ETHNICITY 21
IN-STATE ON CAMPUS BY NC COUNTY 22
IN-STATE DISTANCE EDUCATION BY NC COUNTY 23
OUT-OF-STATE ON CAMPUS BY STATE OF RESIDENCY 24
OUT-OF-STATE DISTANCE EDUCATION BY STATE OF RESIDENCY 25
UNDERGRADUATE AGE RANGE 26
GRADUATE AGE RANGE 27
BY CLASSIFICATION AND METHOD OF COURSE DELIVERY 28
BY IPEDS POPULATION 29
BY STUDENT HOUSING OCCUPANCY AND LOCATION 30
HISTORY AT ALL UNC PUBLIC INSTITUTIONS 31
Fact Book 2013-2014Table of Contents

Fact Book 2013-2014Table of Contents
UNDUPLICATED HEACOUNT BY UNIT AND PRIMARY MAJOR
UNDERGRADUATE HEADCOUNT HISTORY BY UNIT AND PRIMARY MAJOR 32
GRADUATE HEADCOUNT HISTORY BY UNIT AND PRIMARY MAJOR 36
UNDERGRADUATE BY UNIT, PRIMARY MAJOR, ATTENDANCE STATUS, AND GENDER 40
GRADUATE HEADCOUNT BY UNIT, PRIMARY MAJOR, ATTENDANCE STATUS, AND GENDER 43
UNDERGRADUATE HEADCOUNT BY UNIT, PRIMARY MAJOR, ETHNICITY, AND GENDER 46
GRADUATE HEADCOUNT BY UNIT, PRIMARY MAJOR, ETHNICITY, AND GENDER 50
TOTAL ENROLLMENT IN ACADEMIC PROGRAMS BY UNIT AND MAJOR
COLLEGE OF ALLIED HEALTH 54
COLLEGE OF ARTS & SCIENCES 55
COLLEGE OF BUSINESS 57
COLLEGE OF EDUCATION 58
COLLEGE OF FINE ARTS & COMMUNICATION 59
COLLEGE OF HEALTH & HUMAN PERFORMANCE 60
COLLEGE OF HUMAN ECOLOGY 61
COLLEGE OF NURSING 62
COLLEGE OF TECHNOLOGY & COMPUTER SCIENCE 63
BRODY SCHOOL OF MEDICINE 64
SCHOOL OF DENTAL MEDICINE 64
RESEARCH & GRADUATE STUDIES 65
GENERAL COLLEGE 65
NON-DEGREE SEEKING 65
EAST CAROLINA UNIVERSITY 65
DOUBLE MAJORS AND DUAL DEGREE STUDENTS BY UNIT AND SECOND MAJOR 66
DEGREES CONFERREDDEGREES CONFERRED BY UNIT, LEVEL, AND GENDER 70
UNDERGRADUATE DEGREES CONFERRED HISTORY BY UNIT AND MAJOR 71
GRADUATE DEGREES CONFERRED HISTORY BY UNIT AND MAJOR 74
UNDERGRADUATE DEGREES CONFERRED BY UNIT, MAJOR, ETHNICITY, AND GENDER 77
GRADUATE DEGREES CONFERRED BY UNIT, MAJOR, ETHNICITY, AND GENDER 80
FOUR, FIVE, AND SIX YEAR GRADUATION RATES OF THE MOST RECENT 6-YR COHORT 83
STUDENT CREDIT HOURSSTUDENT CREDIT HOURS PRODUCED BY UNITS IN THE FALL SEMESTER 84

Fact Book 2013-2014Table of Contents
FACULTY AND STAFF
HIGHLIGHTS
FACULTY AND STAFF HIGHLIGHTS 85
FACULTY
BY RANK AND GENDER 86
BY RANK AND ETHNICITY 87
BY AGE INTERVAL 88
BY RANK, GENDER, AND AVERAGE AGE 89
BY UNIT, TENURE STATUS, GENDER, AND FTE 90
BY UNIT, GENDER, FULL OR PART-TIME STATUS, AND FTE 91
LONGITUDINAL PROFILE OF TENURE STATUS
EXCLUDING MEDICAL AND DENTAL 92
ALL ECU UNITS 93
AVERAGE SALARY HISTORY FOR FULL-TIME 9-10 MONTH BY RANK AND GENDER 94
AVERAGE SALARY OF PERMANENT FACULTY BY RANK, GENDER, AND ETHNICITY
EXCLUDING MEDICAL AND DENTAL 95
MEDICAL AND DENTAL ONLY 96
BY UNIT AND TERMINAL DEGREE 104
PERMANENT FACULTY TURNOVER 105
UNIVERSITY PERSONNEL
HISTORY BY JOB CATEGORY CODE (JCAT) AND GENDER 97
BY JOB CATEGORY CODE (JCAT), GENDER, AND ETHNICITY 98
BY JOB CATEGORY CODE (JCAT), GENDER, AND FULL/PART-TIME STATUS 99
HISTORY BY STANDARD OCCUPATIONAL CLASSIFICATION (SOC) AND GENDER 100
BY STANDARD OCCUPATIONAL CLASSIFICATION (SOC), GENDER, AND ETHNICITY 101


Year Year Year Year Year
1909 174 1930 984 1951 2,123 1972 10,286 1993 18,186 *1910 227 1931 972 1952 2,280 1973 10,068 1994 18,076 *1911 235 1932 970 1953 2,454 1974 11,341 1995 17,923 *1912 252 1933 1,013 1954 2,878 1975 11,725 1996 17,583 *1913 251 1934 1,096 1955 3,315 1976 11,696 1997 18,271 *1914 295 1935 1,134 1956 3,693 1977 11,968 1998 18,263 *1915 295 1936 1,142 1957 3,947 1978 12,476 1999 18,811 *1916 307 1937 1,204 1958 4,179 1979 12,874 2000 18,750 *1917 325 1938 1,269 1959 4,583 1980 13,165 2001 19,412 *1918 278 1939 1,289 1960 4,178 1981 13,264 2002 20,577 *1919 285 1940 1,296 1961 5,883 1982 13,311 2003 21,756 *1920 381 1941 1,339 1962 6,306 1983 14,438 * 2004 22,767 *1921 317 1942 1,064 1963 6,570 1984 15,140 * 2005 23,164 *1922 395 1943 980 1964 7,318 1985 15,267 * 2006 24,351 *1923 516 1944 953 1965 8,667 1986 15,284 * 2007 25,990 *1924 593 1945 1,049 1966 8,834 1987 15,901 * 2008 27,677 *1925 709 1946 1,382 1967 9,360 1988 16,501 * 2009 27,654 *1926 736 1947 1,549 1968 9,272 1989 16,954 * 2010 27,783 *1927 767 1948 1,511 1969 9,258 1990 17,564 * 2011 27,386 *1928 976 1949 1,858 1970 10,007 1991 17,926 * 2012 26,947 *1929 952 1950 2,075 1971 10,106 1992 19,264 * 2013 26,887 *
Note: Enrollment numbers for years 1983 through 1997 were revised in the 2002-2003 Fact Book.
Source: East Carolina College Bulletin (History subsection), UNC-GA enrollment report, and Institutional Planning, Assessment, and Research data files.
Note: Beginning in 1983, headcount enrollment includes both on-campus and distance education. Before 1983, data include on-campus enrollment only.
Fall Enrollment History
Fall Enrollment
EnrolledEnrolledEnrolledEnrolled Enrolled
0
5,000
10,000
15,000
20,000
25,000
30,000
Fall Headcount Enrollment
1

Students
Highlights In the Fall 2013 semester:
Total headcount enrollment was 26,887 including both on-campus and distance education students. On-campus enrollment totaled 21,269.
85% of first-time freshmen were residents of North Carolina.
13% of undergraduate transfer students were from out-of-state; of the 87% coming
from NC institutions, 82% transferred from community colleges and 4% transferred from private senior institutions. The top-three-sending NC senior institutions were: North Carolina State University, the University of North Carolina at Wilmington, and the University of North Carolina at Pembroke; and comprising 35% of in-state senior institution transfers.
21% of all students were enrolled in Distance Education courses only.
86% of ECU undergraduate students attended full-time; 43% of graduate students
(excluding medical students) attended full time.
Ethnic minorities (including American Indian/Alaskan Native, Asian, Black or African American, Native Hawaiian/Pacific Islander, and Hispanic) made up 24% of the undergraduate students, 16% of the graduate students, 32% of the medical students, and 25% of the dental students.
87% of on-campus students were North Carolina residents.
15% of undergraduates were 25 or older.
19% of enrolled students took online courses only; 65% of enrolled students took
face-to-face courses only; 16% of enrolled students took a combination of both online and face-to-face courses.
35% of enrolled students took at least one online course.
2

2012 2013 % Chg 2012 2013 % Chg 2012 2013 % ChgUndergraduate Students:On Campus
Full-Time 15,142 15,465 2% 2,534 2,393 -6% 17,676 17,858 1%Part-Time 685 684 0% 61 56 -8% 746 746 0%Total On Campus 15,827 16,149 2% 2,595 2,449 -6% 18,422 18,598 1%
Distance Education OnlyFull-Time 591 579 -2% 50 63 26% 641 642 0%Part-Time 2,164 2,203 2% 71 65 -8% 2,235 2,268 1%Total DE Only 2,755 2,782 1% 121 128 6% 2,876 2,910 1%
18,582 18,931 2% 2,716 2,577 -5% 21,298 21,508 1%Graduate Students:On Campus
Full-Time 1,364 1,270 -7% 342 336 -2% 1,706 1,606 -6%Part-Time 535 563 5% 34 25 -26% 569 588 3%Total On Campus 1,899 1,833 -3% 376 361 -4% 2,275 2,194 -4%
Distance Education OnlyFull-Time 348 358 3% 43 35 -19% 391 393 1%Part-Time 2,340 2,104 -10% 220 211 -4% 2,560 2,315 -10%Total DE Only 2,688 2,462 -8% 263 246 -6% 2,951 2,708 -8%
4,587 4,295 -6% 639 607 -5% 5,226 4,902 -6%Medical Students:
Full-Time 316 318 1% 0 0 0% 316 318 1%Part-Time 3 5 67% 0 0 0% 3 5 67%Total On Campus 319 323 1% 0 0 0% 319 323 1%
Full-Time 0 0 0% 0 0 0% 0 0 0%Part-Time 0 0 0% 0 0 0% 0 0 0%Total DE Only 0 0 0% 0 0 0% 0 0 0%
319 323 1% 0 0 0% 319 323 1%Dental Students:
Full-Time 104 154 48% 0 0 0% 104 154 48%Part-Time 0 0 0% 0 0 0% 0 0 0%Total On Campus 104 154 48% 0 0 0% 104 154 48%
Full-Time 0 0 0% 0 0 0% 0 0 0%Part-Time 0 0 0% 0 0 0% 0 0 0%Total DE Only 0 0 0% 0 0 0% 0 0 0%
104 154 48% 0 0 0% 104 154 48%
On CampusFull-Time 16,926 17,207 2% 2,876 2,729 -5% 19,802 19,936 1%Part-Time 1,223 1,252 2% 95 81 -15% 1,318 1,333 1%Total On Campus 18,149 18,459 2% 2,971 2,810 -5% 21,120 21,269 1%
Distance Education OnlyFull-Time 939 937 0% 93 98 5% 1,032 1,035 0%Part-Time 4,504 4,307 -4% 291 276 -5% 4,795 4,583 -4%Total DE Only 5,443 5,244 -4% 384 374 -3% 5,827 5,618 -4%
Full-TimeOn Campus 16,926 17,207 2% 2,876 2,729 -5% 19,802 19,936 1%Distance Education Only 939 937 0% 93 98 5% 1,032 1,035 0%Total Full-Time 17,865 18,144 2% 2,969 2,827 -5% 20,834 20,971 1%
Part-TimeOn Campus 1,223 1,252 2% 95 81 -15% 1,318 1,333 1%Distance Education Only 4,504 4,307 -4% 291 276 -5% 4,795 4,583 -4%Total Part-Time 5,727 5,559 -3% 386 357 -8% 6,113 5,916 -3%
23,592 23,703 0.47% 3,355 3,184 -5.10% 26,947 26,887 -0.22%
On Campus
Distance Education Only
Enrollment Summary: Fall 2012 with Fall 2013 Comparative Data
Total
Total Undergraduate
Total Graduate
CategoryIn-State Out-of-State
Total Medical
All Students:
On Campus
Distance Education Only
Total Dental
Grand Total All Students
3

2012 2013 % Chg 2012 2013 % Chg 2012 2013 % ChgAmerican Indian or Alaska Native 160 160 0% 10 13 30% 170 173 2%Asian 608 659 8% 36 52 44% 644 711 10%Black or African American 3,509 3,813 9% 212 225 6% 3,721 4,038 9%Hispanic of Any Race 625 1,095 75% 96 132 38% 721 1,227 70%Native Hawaiian / Pacific Islander 21 23 10% 2 2 0% 23 25 9%Non-Resident Alien 59 38 -36% 263 214 -19% 322 252 -22%Race and Ethnicity Unknown 878 523 -40% 123 77 -37% 1,001 600 -40%Two or More Races 536 619 15% 68 72 6% 604 691 14%White 17,196 16,773 -2% 2,545 2,397 -6% 19,741 19,170 -3%
23,592 23,703 0% 3,355 3,184 -5% 26,947 26,887 0%1st-Time Freshman Ethnicity:American Indian or Alaska Native 23 29 26% 3 4 33% 26 33 27%Asian 99 120 21% 3 10 233% 102 130 27%Black or African American 525 696 33% 34 40 18% 559 736 32%Hispanic of Any Race 113 251 122% 23 40 74% 136 291 114%Native Hawaiian / Pacific Islander 4 4 0% 0 1 0% 4 5 25%Non-Resident Alien 5 3 -40% 14 9 -36% 19 12 -37%Race and Ethnicity Unknown 81 22 -73% 16 4 -75% 97 26 -73%Two or More Races 137 121 -12% 24 22 -8% 161 143 -11%White 2,348 2,577 10% 563 542 -4% 2,911 3,119 7%
3,335 3,823 14.63% 680 672 -1.18% 4,015 4,495 11.96%University Gender Profile:Undergraduate
Male 7,639 7,788 2% 1,112 1,014 -9% 8,751 8,802 1%Female 10,943 11,143 2% 1,604 1,563 -3% 12,547 12,706 1%
GraduateMale 1,493 1,409 -6% 272 229 -16% 1,765 1,638 -7%Female 3,094 2,886 -7% 367 378 3% 3,461 3,264 -6%
MedicalMale 160 163 2% 0 0 0% 160 163 2%Female 159 160 1% 0 0 0% 159 160 1%
DentalMale 56 81 45% 0 0 0% 56 81 45%Female 48 73 52% 0 0 0% 48 73 52%
Total Male: 9,348 9,441 0.99% 1,384 1,243 -10.19% 10,732 10,684 -0.45%Total Female: 14,244 14,262 0.13% 1,971 1,941 -1.52% 16,215 16,203 -0.07%
Applied, Accepted, Enrolled:First-Time Freshman
Applied 11,302 11,427 1% 4,233 3893 -8.03% 15,535 15,320 -1%Accepted 7,240 8,555 18% 2,418 2683 10.96% 9,658 11,238 16%Enrolled 3,335 3,823 15% 680 672 -1.18% 4,015 4,495 12%
New Undergraduate TransfersApplied 2,586 2,280 -12% 554 427 -22.92% 3,140 2,707 -14%Accepted 1,799 1,737 -3% 301 262 -12.96% 2,100 1,999 -5%Enrolled 1,297 1,221 -6% 128 107 -16.41% 1,425 1,328 -7%
First-Time Graduate StudentsApplied 2,259 2,060 -9% 1,154 1325 14.82% 3,413 3,385 -1%Accepted 1,577 1,407 -11% 462 496 7.36% 2,039 1,903 -7%Enrolled 1,273 1,138 -11% 235 242 2.98% 1,508 1,380 -8%
First-Time Doctor's Degree (Professional)Applied 978 1,075 10% 65 51 -21.54% 1,043 1,126 8%Accepted 204 255 25% 4 2 -50.00% 208 257 24%Enrolled 163 182 12% 2 0 -100.00% 165 182 10%
17,125 16,842 -1.65% 6,006 5,696 -5.16% 23,131 22,538 -2.56%10,820 11,954 10.48% 3,185 3,443 8.10% 14,005 15,397 9.94%6,068 6,364 4.88% 1,045 1,021 -2.30% 7,113 7,385 3.82%
Total:
Total Applied:
Total:
Enrollment Summary: Fall 2012 with Fall 2013 Comparative Data (Continued)
University Ethnic Profile:
Source: Student Data Files, Fall 2012 and Fall 2013.
Total Accepted:Total Newly Enrolled:
In-State Out-of-State Total
4

Average Average Average UNC SystemIn-State Out-of-State All 1st-time Fr. Average
Year Test SAT Score SAT Score SAT Score Score
2009 Verbal 511 513 511 533Math 535 531 535 551
Combined 1046 1044 1046 1084Writing 497 518 501 518
2010 Verbal 507 525 509 534Math 528 545 530 551
Combined 1035 1070 1039 1085Writing 488 517 492 518
2011 Verbal 510 530 510 530Math 530 550 540 550
Combined 1040 1080 1050 1080Writing 490 530 500 520
2012* Verbal 516 529 518 537Math 538 547 540 554
Combined 1055 1076 1058 1091Writing 493 527 498 519
2013* Verbal 516 529 518
Math 533 542 535
Combined 1049 1072 1052
Writing 492 522 497
Source: ECU Data, Student Data Files (Fall 2009 through Fall 2013); UNC Average Scores, UNC-GA.
Note: Combined score may differ from the sum of Math and Verbal scores due to rounding.
Note: Writing scores first reported in 2007 - 2008 Fact Book; Writing scores not included in Combined.
Note: Beginning 2012, SAT scores are reported only when the SAT was used in the student's admission decision.
First -Time Freshman Fall Enrollment HistoryAverage SAT Scores by Residence
850
900
950
1000
1050
1100
2010 2011 2012 2013
Avg. In‐State Avg. Out‐of‐State Avg. All First‐time Freshman
5

Freshmen First Time % Enrolled Freshmen First Time % EnrolledAccepted, Freshmen by Accepted, Freshmen by
SAT Interval Not Enrolled Enrolled SAT Interval Not Enrolled Enrolled SAT Interval
601-800 3 9 0.2% 12 29 0.6%
801-1000 1,144 1,435 35.7% 1,463 1,608 35.8%
1001-1200 3,350 2,095 52.2% 3,439 2,028 45.1%
1201-1400 745 300 7.5% 898 276 6.1%
1401-1600 37 8 0.2% 54 4 0.1%
Unavailable* 364 168 4.2% 877 550 12.2%
Total 5,643 4,015 100.0% 6,743 4,495 100.0%
Source: Student Data File, Fall 2012 and 2013
Note: *Beginning 2012, SAT scores are reported only when the SAT was used in the student's admission decision.
Freshman Applicants Accepted and Enrolledin the Fall 2012 and 2013 Semesters by SAT Interval
2012 2013
0
200
400
600
800
1,000
1,200
1,400
1,600
1,800
2,000
2,200
2,400
601‐800 801‐1000 1001‐1200 1201‐1400 1401‐1600
2012 2013
6

2009 2010 2011 2012 2013% of % of % of % of % of
Class Rank N Total N Total N Total N Total N Total
Top Fifth 1,106 29.4% 1,215 35.8% 1,151 33.0% 1,225 35.1% 1,236 32.4%
Second Fifth 1,251 33.3% 1,344 39.6% 1,223 35.0% 1,165 33.4% 1,372 36.0%
Third Fifth 774 20.6% 880 26.0% 740 21.2% 786 22.5% 847 22.2%
Fourth Fifth 273 7.3% 294 8.7% 247 7.1% 284 8.1% 313 8.2%
Bottom Fifth 25 0.7% 29 0.9% 29 0.8% 30 0.9% 44 1.2%
Total
No Class Rank 527 448 501 525 683
Source: Student Data Files, Fall 2009 through Fall 2013.
First-Time Freshman Fall Enrollment Historyby High School Class Rank
3,8123,429 3,762 3,390 3,490
0
200
400
600
800
1,000
1,200
Bottom & 4th Fifth 3rd Fifth 2nd Fifth Top Fifth
2009
2010
2011
2012
2013
7

County N County N County N County N
Alamance 51 Currituck 13 Lee 22 Rockingham 20Alexander 6 Dare 22 Lenoir 37 Rowan 24Alleghany 2 Davidson 48 Lincoln 18 Rutherford 3Anson 7 Davie 8 Macon 0 Sampson 22Ashe 1 Duplin 31 Madison 0 Scotland 15Avery 1 Durham 63 Martin 17 Stanly 21Beaufort 47 Edgecombe 27 McDowell 1 Stokes 10Bertie 7 Forsyth 96 Mecklenburg 240 Surry 14Bladen 2 Franklin 47 Mitchell 0 Swain 1Brunswick 31 Gaston 33 Montgomery 3 Transylvania 2Buncombe 19 Gates 4 Moore 25 Tyrrell 0Burke 16 Graham 2 Nash 88 Union 94Cabarrus 81 Granville 17 New Hanover 113 Vance 15Caldwell 5 Greene 10 Northampton 11 Wake 793Camden 9 Guilford 186 Onslow 77 Warren 6Carteret 35 Halifax 43 Orange 35 Washington 10Caswell 3 Harnett 56 Pamlico 1 Watauga 4Catawba 38 Haywood 2 Pasquotank 18 Wayne 72Chatham 10 Henderson 5 Pender 24 Wilkes 10Cherokee 0 Hertford 9 Perquimans 5 Wilson 69Chowan 8 Hoke 16 Person 17 Yadkin 5Clay 1 Hyde 8 Pitt 227 Yancey 0Cleveland 25 Iredell 54 Polk 0Columbus 21 Jackson 4 Randolph 28Craven 57 Johnston 101 Richmond 14Cumberland 156 Jones 4 Robeson 42
Total North Carolina First-Time Freshman = 3,821Total First-Time Freshman = 4,495
Source: Student Data File, Fall 2013.
North Carolina Resident First-Time FreshmanFall Enrollment by County of Residence
8

State N State N State N State N
Alabama 0 Iowa 0 New Jersey 104 Vermont 3
Alaska 0 Kansas 1 New Mexico 0 Virginia 205
Arizona 0 Kentucky 0 New York 35 Washington 1
Arkansas 1 Louisiana 1 North Carolina 0 West Virginia 2
California 8 Maine 1 North Dakota 0 Wisconsin 6
Colorado 2 Maryland 117 Ohio 5 Wyoming 0
Connecticut 26 Massachusetts 29 Oklahoma 0 U.S. Territories 0
Delaware 14 Michigan 0 Oregon 0 Unknown 8
D. C. 2 Minnesota 2 Pennsylvania 54 Foreign Countries 11
Florida 6 Mississippi 0 Rhode Island 4
Georgia 5 Missouri 1 South Carolina 4
Hawaii 1 Montana 0 South Dakota 0
Idaho 0 Nebraska 0 Tennessee 3
Illinois 0 Nevada 1 Texas 2
Indiana 4 New Hampshire 3 Utah 0
672
4,495
Source: Student Data File, Fall 2013.
Total First-Time Freshman =
Total Out-of-State First-Time Freshman =
Out-of-State First-Time FreshmanFall Enrollment by State of Residence
9

2009 2010 2011 2012 2013North Carolina Instituitions
Public Senior InstitutionsAppalachian State University 18 10 13 8 7Elizabeth City State University 11 17 4 11 7Fayetteville State University 11 6 9 5 12NC A & T State University 3 3 3 5 4NC Central University 7 13 7 7 12NC School of the Arts 1 2 0 0 1NC State University 47 38 26 30 23UNC-Asheville 3 3 2 1 1UNC-Chapel Hill 8 9 7 10 12UNC-Charlotte 11 14 24 23 14UNC-Greensboro 19 13 16 15 13UNC-Pembroke 11 12 15 16 15UNC-Wilmington 22 15 22 20 16Western Carolina University 8 7 9 5 9Winston-Salem State University 4 8 6 7 9Military Centers 0 0 0 0 0
Total Public Senior Institutions 184 170 163 163 155
Community Colleges 867 735 879 985 949
Business Schools 0 0 0 0 0
Technical Institutions 0 0 0 0 0
Private Senior Institutions 89 61 67 45 45
Bible Colleges 0 0 0 0 0
Private Junior Institutions 9 11 11 6 5
Discontinued Schools 0 0 0 0 0
Unknown NC Institutions 4 5 3 1 0
Total from North CarolinaInstitutions 1,153 982 1,123 1,200 1,154
Out of state institutionsTotal from Foreign Institutions 3 8 5 5 2
Total from Out-of-StateInstitutions
Total Transfer Students 1,415 1,199 1,358 1,426 1,328
Source: Headcount Enrollment, Student Data File Fall 2009 through Fall 2013.
and Sending Institutions HistoryNew Undergraduate Transfer Student Fall Enrollment
259 209 230 221 172
10

YearOn-Campus Headcount
% change from
previous year
Distance Education
Only Headcount
% change from
previous yearTotal
Headcount
% change from
previous year
2009 21,584 3.7% 6,070 17.3% 27,677 6.5%
2010 21,722 0.6% 6,061 -0.1% 27,654 -0.1%
2011 21,657 -0.3% 5,729 -5.5% 27,783 0.5%
2012 21,120 -2.5% 5,827 1.7% 26,947 -3.0%
2013 21,269 0.7% 5,618 -3.6% 26,887 -0.2%
On-Campus and Distance EducationFall Enrollment Headcount History
Source: Student Data Files, Fall 2009 through Fall 2013.
0
5,000
10,000
15,000
20,000
25,000
30,000
2009 2010 2011 2012 2013
On‐Campus Distance Education Only Total Headcount
11

2009 20872.5 24543.5
Year On-Campus FTE% change from previous year Total FTE
% change from previous year
2009 20,877.50 4.6% 24,543.50 6.0%
2010 21,099.25 1.1% 24,890.50 1.4%
2011 21,657.00 2.6% 24,587.50 -1.2%
2012 20,568.25 -5.0% 24,197.50 -1.6%
2013 20,733.25 0.8% 24,269.25 0.3%
On-Campus & TotalFull-Time Equivalent History
Source: Student Data Files, Fall 2009 through Fall 2013.
Note: FTE calculations are based on the following formula: Undergraduate students enrolled in 0-5 credit hours=0.25 FTE, 6-8=0.50 FTE, 9-11=0.75 FTE, 12 or more=1.00 FTE; Graduate students enrolled in 0-2 credit hours=0.25 FTE, 3-5=0.50 FTE, 6-8=0.75 FTE, 9 or more=1.00 FTE.
Note: UNC-GA policy assumes that one student represents a maximum of 1.00 FTE; an undergraduate student taking more than taking more than 12 credit hours or a graduate student taking more than 9 credit hours is considered to be 1.00 FTE.
0
5,000
10,000
15,000
20,000
25,000
30,000
2009 2010 2011 2012 2013
On‐Campus Total FTE
12

Part-Time Full-Time Total GrandYear Women Men Women Men Women Men Total
2009 4,514 2,284 12,310 8,632 16,824 10,916 27,7402010 4,291 2,198 12,455 8,907 16,746 11,105 27,8512011 4,127 2,130 12,236 8,857 16,363 10,987 27,3502012 3,963 2,150 12,252 8,582 16,215 10,732 26,9472013 3,856 2,060 12,347 8,624 16,203 10,684 26,887
Source: Student Data Files, Fall 2009 through Fall 2013.
Fall Enrollment Historyby Gender and Attendance Status
0
3,000
6,000
9,000
12,000
15,000
18,000
2009 2010 2011 2012 2013
Women Men
13

Full-Time Part-Time Full-Time Part-Time SchoolOut-of- Out-of- Out-of- Out-of- of
Year In-State State In-State State In-State State In-State State Medicine Total2007 14,984 2,325 2,364 94 1,783 272 3,652 225 291 25,9902008 15,693 2,558 2,628 95 1,855 314 4,048 200 286 27,6772009 15,803 2,589 2,983 83 1,899 348 3,437 208 304 27,6772010 16,052 2,682 2,829 100 1,940 383 3,272 217 308 27,7832011 15,974 2,632 2,853 130 1,816 367 3,105 201 308 27,3862012 15,733 2,584 2,849 132 1,816 385 2,876 253 319 26,9472013 16,044 2,456 2,887 121 1,782 371 2,667 236 323 26,887
Source: Student Data Files, Fall 2007 through Fall 2013.Note: All School of Medicine students are in-state unless otherwise specified.
Fall Enrollment Historyby Residence and Attendance Status
Undergraduate Graduate
0
4,000
8,000
12,000
16,000
20,000
2009 2010 2011 2012 2013
In-State Out-of-State
14

Level / Classification Gender Full-Time Part-Time Total
Undergraduate
Freshman Women 3,175 57.1% 54 75.0% 3,229 57.3%Men 2,388 42.9% 18 25.0% 2,406 42.7%
5,563 100.0% 72 100.0% 5,635 100.0% 21.0% 26.2%
Sophomore Women 2,188 59.5% 106 62.4% 2,294 59.6%Men 1,488 40.5% 64 37.6% 1,552 40.4%
3,676 100.0% 170 100.0% 3,846 100.0% 14.3% 17.9%
Junior Women 2,261 57.7% 330 60.9% 2,591 58.1%Men 1,656 42.3% 212 39.1% 1,868 41.9%
3,917 100.0% 542 100.0% 4,459 100.0% 16.6% 20.7%
Senior Women 3,092 59.3% 858 58.3% 3,950 59.1%Men 2,121 40.7% 614 41.7% 2,735 40.9%
5,213 100.0% 1,472 100.0% 6,685 100.0% 24.9% 31.1%
Unclassified Women 80 61.1% 562 74.7% 642 72.7%Men 51 38.9% 190 25.3% 241 27.3%
131 100.0% 752 100.0% 883 100.0% 3.3% 4.1%
Total Undergraduate Women 10,796 58.4% 1,910 63.5% 12,706 59.1% 47.3%Men 7,704 41.6% 1,098 36.5% 8,802 40.9% 32.7%
Subtotal 18,500 100.0% 3,008 100.0% 21,508 100.0% 80.0% 100.0%
Graduate Women 1,322 66.1% 1,942 66.9% 3,264 66.6% 12.1%Men 677 33.9% 961 33.1% 1,638 33.4% 6.1%
Subtotal 1,999 100.0% 2,903 100.0% 4,902 100.0% 18.2%
Medical Women 156 49.1% 4 80.0% 160 49.5% 0.6%Men 162 50.9% 1 20.0% 163 50.5% 0.6%
Subtotal 318 100.0% 5 0.0% 323 100.0% 1.2%
Dental Women 73 47.4% 0 0.0% 73 47.4% 0.3%Men 81 52.6% 0 0.0% 81 52.6% 0.3%
Subtotal 154 100.0% 0 0.0% 154 100.0% 0.6%
Grand Total Women 12,347 58.9% 3,856 65.2% 16,203 60.3%Men 8,624 41.1% 2,060 34.8% 10,684 39.7%
Total 20,971 100.0% 5,916 100.0% 26,887 100.0% 100.0%
Source: Student Data File Fall 2013, submitted to UNC-GANote: Class assignment is based on credit hours earned. As described in the ECU Undergraduate Catalog, 2011-2012, students with 1-29 semester credit hours are classified as Freshmen, 30-59 as Sophomores, 60-89 as Juniors, 90 or more as Seniors. Unclassified students are non-degree seeking.
% Total ECU
Enrollment% Undergrad Enrollment
Fall Enrollment byClassification, Attendance Status, and Gender
15

Out-of-State Total
Classification N % Of Total N % Of Total N % Of Total
Undergraduate
Freshman 4,780 84.8% 855 15.2% 5,635 21.0%
Sophomore 3,311 86.1% 535 13.9% 3,846 14.3%
Junior 3,989 89.5% 470 10.5% 4,459 16.6%
Senior 6,064 90.7% 621 9.3% 6,685 24.9%
Unclassified 787 89.1% 96 10.9% 883 3.3%
Total 18,931 88.0% 2,577 12.0% 21,508 80.0%
Graduate 4,295 87.6% 607 12.4% 4,902 18.2%
Medical 323 100.0% 0 0.0% 323 1.2%
Dental 154 100.0% 0 0.0% 154 0.6%
Grand Total 23,703 88.2% 3,184 11.8% 26,887 100%
Source: Student Data File, Fall 2013
In-State
Fall Enrollment by Residence and Class Level
0
1,000
2,000
3,000
4,000
5,000
6,000
7,000
Freshman Sophomore Junior Senior Unclassified Graduate Medical Dental
In‐State Out‐of‐State
16

Percent PercentLevel/Year of Total of Total
Undergraduate2003 10,023 59% 6,912 41% 16,9352004 10,408 59% 7,102 41% 17,5102005 10,574 60% 7,154 40% 17,7282006 11,055 59% 7,532 41% 18,5872007 11,677 59% 8,090 41% 19,7672008 12,246 58% 8,728 42% 20,9742009 12,642 59% 8,816 41% 21,4582010 12,637 58% 9,026 42% 21,6632011 12,570 58% 9,019 42% 21,5892012 12,547 59% 8,751 41% 21,2982013 12,706 59% 8,802 41% 21,508
Graduate2003 2,979 66% 1,538 34% 4,5172004 3,366 68% 1,598 32% 4,9642005 3,587 70% 1,563 30% 5,1502006 3,872 71% 1,602 29% 5,4742007 4,185 71% 1,747 29% 5,9322008 4,490 70% 1,927 30% 6,4172009 4,031 68% 1,861 32% 5,8922010 3,954 68% 1,858 32% 5,8122011 3,615 66% 1,822 34% 5,4372012 3,461 66% 1,765 34% 5,2262013 3,264 67% 1,638 33% 4,902
Medical2003 150 49% 154 51% 3042004 146 50% 147 50% 2932005 142 50% 144 50% 2862006 144 50% 146 50% 2902007 141 48% 150 52% 2912008 146 51% 140 49% 2862009 151 50% 153 50% 3042010 155 50% 153 50% 3082011 154 50% 154 50% 3082012 159 50% 160 50% 3192013 160 50% 163 50% 323
Dental2011 24 46% 28 54% 522012 48 46% 56 54% 1042013 73 47% 81 53% 154
Totals, All Levels 2003 13,152 60% 8,604 40% 21,7562004 13,920 62% 8,847 38% 22,7672005 14,303 62% 8,861 38% 23,1642006 15,071 62% 9,280 38% 24,3512007 16,003 62% 9,987 38% 25,9902008 16,882 61% 10,795 39% 27,6772009 16,824 60% 10,830 40% 27,6542010 16,746 60% 11,037 40% 27,7832011 16,363 60% 11,023 40% 27,3862012 16,215 60% 10,732 40% 26,9472013 16,203 60% 10,684 40% 26,887
Source: Student Data File, Fall 2003 through 2013.
Note: Enrollment includes on-campus and distance education students.
TotalWomen Men
Fall Enrollment Historyby Class Level and Gender
17

In-State Out-of-StateLevel/Year N % of Total N % of Total Total
Undergraduate2003 14,402 85.0% 2,533 15.0% 16,9352004 14,920 85.2% 2,590 14.8% 17,5102005 15,279 86.2% 2,449 13.8% 17,7282006 16,159 86.9% 2,428 13.1% 18,5872007 17,348 87.8% 2,419 12.2% 19,7672008 18,321 87.4% 2,653 12.6% 20,9742009 18,786 87.5% 2,672 12.5% 21,4582010 18,881 87.2% 2,782 12.8% 21,6632011 18,827 87.2% 2,762 12.8% 21,5892012 18,582 87.2% 2,716 12.8% 21,2982013 18,931 88.0% 2,577 12.0% 21,508
Graduate2003 4,022 89.0% 495 11.0% 4,5172004 4,487 90.4% 477 9.6% 4,9642005 4,686 91.0% 464 9.0% 5,1502006 4,982 91.0% 492 9.0% 5,4742007 5,435 91.6% 497 8.4% 5,9322008 5,903 92.0% 514 8.0% 6,4172009 5,336 90.6% 556 9.4% 5,8922010 5,212 89.7% 600 10.3% 5,8122011 4,869 89.6% 568 10.4% 5,4372012 4,588 87.8% 638 12.2% 5,2262013 4,295 87.6% 607 12.4% 4,902
Medical2003 304 100.0% 0 0.0% 3042004 292 99.7% 1 0.3% 2932005 286 100.0% 0 0.0% 2862006 290 100.0% 0 0.0% 2902007 291 100.0% 0 0.0% 2912008 286 100.0% 0 0.0% 2862009 304 100.0% 0 0.0% 3042010 306 99.4% 2 0.6% 3082011 308 100.0% 0 0.0% 3082012 319 100.0% 0 0.0% 3192013 323 100.0% 0 0.0% 323
Dental2011 52 100.0% 0 0.0% 522012 104 100.0% 0 0.0% 1042013 154 100.0% 0 0.0% 154
Totals, All Levels 2003 18,728 86.1% 3,028 13.9% 21,7562004 19,699 86.5% 3,068 13.5% 22,7672005 20,251 87.4% 2,913 12.6% 23,1642006 21,431 88.0% 2,920 12.0% 24,3512007 23,074 88.8% 2,916 11.2% 25,9902008 24,510 88.6% 3,167 11.4% 27,6772009 24,426 88.3% 3,228 11.7% 27,6542010 24,399 87.8% 3,384 12.2% 27,7832011 24,056 87.8% 3,330 12.2% 27,3862012 23,593 87.6% 3,354 12.4% 26,9472013 23,703 88.2% 3,184 11.8% 26,887
Source: Student Data File, Fall 2003 through 2013.
Note: Enrollment includes on-campus and distance education students.
Fall Enrollment Historyby Residence and Class Level
18

Full-Time Part-Time Total% of FT % of
Level/Ethnicity N by Class N by Class N Total Class
UndergraduateAmerican Indian or Alaska Native 108 0.6% 15 0.5% 123 0.6%Asian 492 2.7% 55 1.8% 547 2.5%Black or African American 2,943 15.9% 524 17.4% 3,467 16.1%Hispanic of Any Race 969 5.2% 105 3.5% 1,074 5.0%Native Hawaiian / Pacific Islander 21 0.1% 2 0.1% 23 0.1%Non-Resident Alien 152 0.8% 12 0.4% 164 0.8%Race and Ethnicity Unknown 264 1.4% 146 4.9% 410 1.9%Two or More Races 570 3.1% 40 1.3% 610 2.8%White 12,981 70.2% 2,109 70.1% 15,090 70.2%Total 18,500 86.0% 3,008 14.0% 21,508 100.0%
GraduateAmerican Indian or Alaska Native 11 0.6% 33 1.1% 44 0.9%Asian 58 2.9% 47 1.6% 105 2.1%Black or African American 188 9.4% 326 11.2% 514 10.5%Hispanic of Any Race 65 3.3% 69 2.4% 134 2.7%Native Hawaiian / Pacific Islander 0 0.0% 2 0.1% 2 0.0%Non-Resident Alien 68 3.4% 20 0.7% 88 1.8%Race and Ethnicity Unknown 50 2.5% 127 4.4% 177 3.6%Two or More Races 32 1.6% 40 1.4% 72 1.5%White 1,527 76.4% 2,239 77.1% 3,766 76.8%Total 1,999 40.8% 2,903 59.2% 4,902 100.0%
MedicalAmerican Indian or Alaska Native 5 1.6% 0 0.0% 5 1.5%Asian 45 14.2% 0 0.0% 45 13.9%Black or African American 37 11.6% 3 0.1% 40 12.4%Hispanic of Any Race 13 4.1% 0 0.0% 13 4.0%Native Hawaiian / Pacific Islander 0 0.0% 0 0.0% 0 0.0%Non-Resident Alien 0 0.0% 0 0.0% 0 0.0%Race and Ethnicity Unknown 13 4.1% 0 0.0% 13 4.0%Two or More Races 6 1.9% 0 0.0% 6 1.9%White 199 62.6% 2 0.1% 201 62.2%Total 318 98.5% 5 1.5% 323 100.0%
DentalAmerican Indian or Alaska Native 1 0.6% 0 0.0% 1 0.6%Asian 14 9.1% 0 0.0% 14 9.1%Black or African American 17 11.0% 0 0.0% 17 11.0%Hispanic of Any Race 6 3.9% 0 0.0% 6 3.9%Native Hawaiian / Pacific Islander 0 0.0% 0 0.0% 0 0.0%Non-Resident Alien 0 0.0% 0 0.0% 0 0.0%Race and Ethnicity Unknown 0 0.0% 0 0.0% 0 0.0%Two or More Races 3 1.9% 0 0.0% 3 1.9%White 113 73.4% 0 0.0% 113 73.4%Total 154 100.0% 0 0.0% 154 100.0%
Totals, All Levels American Indian or Alaska Native 125 0.6% 48 0.8% 173 0.6%Asian 609 2.9% 102 1.7% 711 2.6%Black or African American 3,185 15.2% 853 14.4% 4,038 15.0%Hispanic of Any Race 1,053 5.0% 174 2.9% 1,227 4.6%Native Hawaiian / Pacific Islander 21 0.1% 4 0.1% 25 0.1%Non-Resident Alien 220 1.0% 32 0.5% 252 0.9%Race and Ethnicity Unknown 327 1.6% 273 4.6% 600 2.2%Two or More Races 611 2.9% 80 1.4% 691 2.6%White 14,820 70.7% 4,350 73.5% 19,170 71.3%Total 20,971 78.0% 5,916 22.0% 26,887 100.0%Source: Student Data File, Fall 2013.Note: Due to rounding, some percentages may not total 100%
% of PT
by Class Level, Attendance Status, and EthnicityFall Enrollment
19

Women Men Total% of women % of men % of
Level/Ethnicity N N N
UndergraduateAmerican Indian or Alaska Native 66 0.5% 57 0.6% 123 0.6%Asian 293 2.3% 254 2.9% 547 2.5%Black or African American 2,189 17.2% 1,278 14.5% 3,467 16.1%Hispanic of Any Race 621 4.9% 453 5.1% 1,074 5.0%Native Hawaiian / Pacific Islander 8 0.1% 15 0.2% 23 0.1%Non-Resident Alien 81 0.6% 83 0.9% 164 0.8%Race and Ethnicity Unknown 241 1.9% 169 1.9% 410 1.9%Two or More Races 356 2.8% 254 2.9% 610 2.8%White 8,851 69.7% 6,239 70.9% 15,090 70.2%Total 12,706 59.1% 8,802 40.9% 21,508 100.0%
GraduateAmerican Indian or Alaska Native 36 1.1% 8 0.5% 44 0.9%Asian 65 2.0% 40 2.4% 105 2.1%Black or African American 370 11.3% 144 8.8% 514 10.5%Hispanic of Any Race 89 2.7% 45 2.7% 134 2.7%Native Hawaiian / Pacific Islander 1 0.0% 1 0.1% 2 0.0%Non-Resident Alien 38 1.2% 50 3.1% 88 1.8%Race and Ethnicity Unknown 101 3.1% 76 4.6% 177 3.6%Two or More Races 53 1.6% 19 1.2% 72 1.5%White 2,511 76.9% 1,255 76.6% 3,766 76.8%Total 3,264 66.6% 1,638 33.4% 4,902 100.0%
MedicalAmerican Indian or Alaska Native 2 1.3% 3 1.8% 5 1.5%Asian 27 16.9% 18 11.0% 45 13.9%Black or African American 31 19.4% 9 5.5% 40 12.4%Hispanic of Any Race 8 5.0% 5 3.1% 13 4.0%Native Hawaiian / Pacific Islander 0 0.0% 0 0.0% 0 0.0%Non-Resident Alien 0 0.0% 0 0.0% 0 0.0%Race and Ethnicity Unknown 2 1.3% 11 6.7% 13 4.0%Two or More Races 3 1.9% 3 1.8% 6 1.9%White 87 54.4% 114 69.9% 201 62.2%Total 160 49.5% 163 50.5% 323 100.0%
DentalAmerican Indian or Alaska Native 1 1.4% 0 0.0% 1 0.6%Asian 9 12.3% 5 6.2% 14 9.1%Black or African American 11 15.1% 6 7.4% 17 11.0%Hispanic of Any Race 1 1.4% 5 6.2% 6 3.9%Native Hawaiian / Pacific Islander 0 0.0% 0 0.0% 0 0.0%Non-Resident Alien 0 0.0% 0 0.0% 0 0.0%Race and Ethnicity Unknown 0 0.0% 0 0.0% 0 0.0%Two or More Races 1 1.4% 2 2.5% 3 1.9%White 50 68.5% 63 77.8% 113 73.4%Total 73 47.4% 81 52.6% 154 100.0%
Totals, All Levels American Indian or Alaska Native 105 0.6% 68 0.6% 173 0.6%Asian 394 2.4% 317 3.0% 711 2.6%Black or African American 2,601 16.1% 1,437 13.5% 4,038 15.0%Hispanic of Any Race 719 4.4% 508 4.8% 1,227 4.6%Native Hawaiian / Pacific Islander 9 0.1% 16 0.1% 25 0.1%Non-Resident Alien 119 0.7% 133 1.2% 252 0.9%Race and Ethnicity Unknown 344 2.1% 256 2.4% 600 2.2%Two or More Races 413 2.5% 278 2.6% 691 2.6%White 11,499 71.0% 7,671 71.8% 19,170 71.3%Total 16,203 60.3% 10,684 39.7% 26,887 100.0%Source: Student Data File, Fall 2013.Note: Due to rounding, some percentages may not total 100%
level
by Class Level, Gender, and EthnicityFall Enrollment
in level in level
20

2009 2010 2011 2012 2013Race/Ethnicity N % N % N % N % N %
305 1.1% 330 1.2% 347 1.3% 322 1.2% 252 0.9%
1,071 3.9% 1,334 4.9% 1,024 3.7% 1,001 3.7% 600 2.2%
564 2.0% 762 2.8% 688 2.5% 721 2.7% 1,227 4.6%
194 0.7% 192 0.7% 179 0.7% 170 0.6% 173 0.6%
542 2.0% 604 2.2% 633 2.3% 644 2.4% 711 2.6%
3,838 13.9% 3,890 14.2% 3,837 14.0% 3,721 13.8% 4,038 15.0%
6 0.0% 8 0.0% 19 0.1% 23 0.1% 25 0.1%
20,943 75.7% 20,313 73.1% 20,219 73.8% 19,741 73.3% 19,170 71.3%
191 0.7% 350 1.3% 440 1.6% 604 2.2% 691 2.6%
Total 27,654 100% 27,783 100% 27,386 100% 26,947 100% 26,887 100%
Source: Student Data Files, Fall 2009 through Fall 2013.
Two or More Races
Fall Enrollment Historyby Race/Ethnicity
Native Hawaiian or Other Pacific Islander
White
Black or African American
Nonresident Alien
Race and Ethnicity Unknown
Hispanic of any race
American Indian or Alaska Native
Asian
0
500
1,000
1,500
2,000
2,500
3,000
3,500
4,000
NonresidentAlien
Race andEthnicityUnknown
Hispanic of anyrace
American Indianor Alaska Native
Asian Black or AfricanAmerican
Native Hawaiianor Other Pacific
Islander
Two or MoreRaces
Number of Minority Students
2009 2010 2011 2012 2013
21

County N County N County N County N
Alamance 207 Cumberland 578 Johnston 435 Randolph 117Alexander 19 Currituck 73 Jones 32 Richmond 39Alleghany 6 Dare 137 Lee 121 Robeson 138Anson 15 Davidson 132 Lenoir 270 Rockingham 50Ashe 7 Davie 43 Lincoln 51 Rowan 97Avery 4 Duplin 120 Macon 3 Rutherford 16Beaufort 267 Durham 272 Madison 2 Sampson 117Bertie 44 Edgecombe 156 Martin 131 Scotland 56Bladen 37 Forsyth 396 McDowell 13 Stanly 55Brunswick 112 Franklin 158 Mecklenburg 1,026 Stokes 43Buncombe 64 Gaston 143 Mitchell 2 Surry 41Burke 68 Gates 34 Montgomery 12 Swain 2Cabarrus 228 Graham 2 Moore 109 Transylvania 12Caldwell 37 Granville 113 Nash 385 Tyrrell 0Camden 36 Greene 66 New Hanover 415 Union 345Carteret 213 Guilford 544 Northampton 49 Vance 77Caswell 13 Halifax 181 Onslow 424 Wake 3,400Catawba 186 Harnett 183 Orange 158 Warren 18Chatham 57 Haywood 13 Pamlico 28 Washington 46Cherokee 3 Henderson 43 Pasquotank 101 Watauga 12Chowan 47 Hertford 57 Pender 96 Wayne 413Clay 5 Hoke 37 Perquimans 34 Wilkes 26Cleveland 79 Hyde 21 Person 51 Wilson 328Columbus 84 Iredell 212 Pitt 3,033 Yadkin 32Craven 420 Jackson 8 Polk 7 Yancey 0
18,44826,887
Source: Student Data File, Fall 2013.
North Carolina Resident Fall Enrollment by County of Residence (On Campus)
Total Enrollment = Total On Campus In-State Enrollment =
22

County N County N County N County N
Alamance 39 Cumberland 130 Johnston 183 Randolph 37Alexander 9 Currituck 15 Jones 26 Richmond 8Alleghany 3 Dare 48 Lee 37 Robeson 49Anson 7 Davidson 31 Lenoir 112 Rockingham 17Ashe 7 Davie 13 Lincoln 16 Rowan 18Avery 2 Duplin 34 Macon 4 Rutherford 18Beaufort 82 Durham 131 Madison 1 Sampson 28Bertie 18 Edgecombe 37 Martin 34 Scotland 6Bladen 13 Forsyth 108 McDowell 8 Stanly 31Brunswick 38 Franklin 43 Mecklenburg 270 Stokes 14Buncombe 43 Gaston 42 Mitchell 2 Surry 52Burke 19 Gates 7 Montgomery 3 Swain 4Cabarrus 54 Graham 0 Moore 35 Transylvania 7Caldwell 12 Granville 38 Nash 92 Tyrrell 0Camden 8 Greene 35 New Hanover 119 Union 67Carteret 83 Guilford 112 Northampton 5 Vance 14Caswell 4 Halifax 51 Onslow 144 Wake 798Catawba 42 Harnett 48 Orange 44 Warren 9Chatham 13 Haywood 10 Pamlico 13 Washington 7Cherokee 10 Henderson 30 Pasquotank 30 Watauga 8Chowan 19 Hertford 53 Pender 28 Wayne 155Clay 3 Hoke 10 Perquimans 8 Wilkes 17Cleveland 43 Hyde 4 Person 14 Wilson 95Columbus 23 Iredell 47 Pitt 707 Yadkin 10Craven 154 Jackson 9 Polk 4 Yancey 0
5,242
26,887
Source: Student Data File, Fall 2013.
North Carolina Residence Fall Enrollment by County of Residence (Distance Education Only)
Total Enrollment =
Total Distance Education In-State Enrollment =
23

State N State N State N State N
Alabama 2 Indiana 15 Nevada 1 Tennessee 16Alaska 2 Iowa 4 New Hampshire 16 Texas 19Arizona 5 Kansas 5 New Jersey 395 Utah 2Arkansas 3 Kentucky 5 New Mexico 0 Vermont 13California 27 Louisiana 5 New York 148 Virginia 776Colorado 4 Maine 3 North Carolina -- Washington 4Connecticut 83 Maryland 408 North Dakota 0 West Virginia 6Delaware 56 Massachusetts 98 Ohio 45 Wisconsin 13District of Columbia 13 Michigan 12 Oklahoma 2 Wyoming 0Florida 56 Minnesota 3 Oregon 3 U.S. Territories 1Georgia 42 Mississippi 4 Pennsylvania 207 Unknown 26Hawaii 5 Missouri 7 Rhode Island 10 Foreign Countries 175Idaho 0 Montana 0 South Carolina 44Illinois 18 Nebraska 2 South Dakota 1
2,81026,887
Source: Student Data File, Fall 2013.
Out-of-State Fall Enrollment by State of Residence (On Campus)
Total Enrollment = Total On Campus Out-of-State Enrollment =
24

State N State N State N State N
Alabama 19 Indiana 5 Nevada 2 Tennessee 4Alaska 13 Iowa 0 New Hampshire 0 Texas 14Arizona 5 Kansas 2 New Jersey 13 Utah 3Arkansas 3 Kentucky 6 New Mexico 0 Vermont 2California 12 Louisiana 0 New York 12 Virginia 67Colorado 6 Maine 0 North Carolina -- Washington 1Connecticut 1 Maryland 7 North Dakota 0 West Virginia 0Delaware 3 Massachusetts 2 Ohio 12 Wisconsin 1District of Columbia 1 Michigan 1 Oklahoma 4 Wyoming 1Florida 13 Minnesota 0 Oregon 1 U.S. Territories 0Georgia 17 Mississippi 2 Pennsylvania 15 Unknown 14Hawaii 1 Missouri 13 Rhode Island 1 Foreign Countries 50Idaho 1 Montana 0 South Carolina 20Illinois 3 Nebraska 1 South Dakota 0
Total Distance Education Out-of-State Enrollment = 37426,887
Source: Student Data File, Fall 2013.
Total Enrollment =
Out-of-State Fall Enrollment by State of Residence (Distance Education Only)
25

% of % of % of % of % ofN Total N Total N Total N Total N Total
18 & Under 3,517 16.4% 3,769 17.4% 3,431 15.9% 3,583 16.8% 4,775 22.2%
19-21 10,637 49.6% 10,616 49.0% 10,893 50.5% 10,452 49.1% 10,257 47.7%
22-24 3,546 16.5% 3,590 16.6% 3,682 17.1% 3,808 17.9% 3,237 15.1%
25-30 1,558 7.3% 1,554 7.2% 1,493 6.9% 1,419 6.7% 1,356 6.3%
31-40 1,253 5.8% 1,247 5.8% 1,224 5.7% 1,176 5.5% 1,100 5.1%
41-64 939 4.4% 877 4.0% 856 4.0% 850 4.0% 768 3.6%
65 & Over 8 0.0% 10 0.0% 10 0.0% 10 0.0% 14 0.1%
Unknown 0 0.0% 0 0.0% 0 0.0% 0 0.0% 1 0.0%
Total 21,458 100% 21,663 100% 21,589 100% 21,298 100% 21,508 100%
Source: Student Data Files, Fall 2009 through 2013.
by Age IntervalUndergraduate Fall Enrollment History
Age Interval
20132012201120102009
0
1,000
2,000
3,000
4,000
5,000
6,000
7,000
8,000
9,000
10,000
11,000
18 & Under 19-21 22-24 25-30 31-40 41 & Over
2009 2010 2011 2012 2013
26

% of % of % of % of % ofN Total N Total N Total N Total N Total
24 & Under 1,481 23.9% 1,464 23.9% 1,419 24.5% 1,401 24.8% 1,394 25.9%25-30 2,016 32.5% 1,999 32.7% 1,961 33.8% 1,896 33.6% 1,750 32.5%31-40 1,532 24.7% 1,507 24.6% 1,380 23.8% 1,256 22.2% 1,201 22.3%41-64 1,158 18.7% 1,143 18.7% 1,029 17.8% 1,089 19.3% 1,024 19.0%65 & Over 9 0.1% 7 0.1% 8 0.1% 7 0.1% 9 0.2%Unknown 0 0.0% 0 0.0% 0 0.0% 0 0.0% 1 0.0%
Total 6,196 100% 6,120 100% 5,797 100% 5,649 100% 5,379 100%
Source: Student Data Files, Fall 2009 through Fall 2013.
Graduate Fall Enrollment Historyby Age Interval
2012 2013
Age Interval
2009 2010 2011
0
500
1,000
1,500
2,000
2,500
Age 24 and Under Age 25-30 Age 31-40 Age 41 and Over
2008 2009 2010 2011 2012
27

Classificationn % n % n % n % n % n %
UndergraduateFreshman 4,669 93% 327 7% 26 1% 5,130 91% 467 8% 38 1%Sophomore 3,254 80% 722 18% 110 3% 2,935 76% 772 20% 139 4%Junior 2,931 65% 1,142 25% 416 9% 2,909 65% 1,017 23% 533 12%Senior 3,877 57% 1,758 26% 1,214 18% 3,773 56% 1,495 22% 1,417 21%Unclassified 136 16% 113 13% 603 71% 261 30% 101 11% 521 59%Total 14,867 70% 4,062 19% 2,369 11% 15,008 70% 3,852 18% 2,648 12%
Graduate 2,120 41% 585 11% 2,521 48% 1,913 39% 547 11% 2,442 50%
Medical 319 100% 0 0% 0 0% 323 100% 0 0% 0 0%
Dental 104 100% 0 0% 0 0% 154 100% 0 0% 0 0%
Total 17,410 65% 4,647 17% 4,890 18% 17,398 65% 4,399 16% 5,090 19%
Total Students Enrolled in at Least One Online Course
2012 9,537
2013 9,489
Source: Student Data Files, Fall 2012 and 2013
Enrollment by Classificationand Method of Course Delivery
Face to Face Only
Face to Face and Online
Online Only
2012 2013
Face to Face Only
Face to Face and Online
Online Only
0
2,000
4,000
6,000
8,000
10,000
12,000
14,000
16,000
18,000
20,000
Face to Face Only Face to Face and Online Online Only At Least One OnlineCourse
2012 2013
28

GrandMen Women Men Women Men Women Total
Undergraduate1,827 2,636 6 26 1,833 2,662 4,495
466 512 128 222 594 734 1,3285,360 7,568 836 1,271 6,196 8,839 15,0357,653 10,716 970 1,519 8,623 12,235 20,858
51 80 128 391 179 471 6507,704 10,796 1,098 1,910 8,802 12,706 21,508
920 1,551 962 1,946 1,882 3,497 5,379
26,887
Non-Degree Total Grand1st-Time Fr. Undergrad. Undergrad. Undergrad. Graduate Total Percent
American Indian or Alaska Native 33 85 5 123 50 173 0.64%Asian 130 414 3 547 164 711 2.64%Black or African American 736 2,562 169 3,467 571 4,038 15.02%Hispanic of Any Race 291 766 17 1,074 153 1,227 4.56%Native Hawaiian or Other Pacific Islander 5 18 0 23 2 25 0.09%Non-Resident Alien 12 75 77 164 88 252 0.94%Race and Ethnicity Unknown 26 342 42 410 190 600 2.23%Two or More Races 143 463 4 610 81 691 2.57%White 3,119 11,638 333 15,090 4,080 19,170 71.30%
Grand Total 4,495 16,363 650 21,508 5,379 26,887 100%
* The first-professional degree category has been eliminated by the National Center for Education Statistics (NCES).
Fall EnrollmentIPEDS Population 2013
Total Degree-Seeking
Total Degree- & Non-Degree-SeekingTotal Undergraduate 3,008
Total
21,508
Total Graduate
Class Level
Race/Ethnicity
18,500
Grand Total
Non-Degree-Seeking, Enrolled in Credit Courses
All Other Degree-SeekingTransfer-In Degree-SeekingDegree-Seeking First-Time Freshmen
Graduate*
26,8875,91620,971
Full-Time Part-Time
5,3792,9082,471
Note: Degree-Seeking Undergraduates only includes students who have declared degree intent and excludes unclassified students.
Degree-Seeking
Note: The Integrated Postsecondary Education Data System contains survey data reported to the National Center for Education Statistics (NCES).
Source: Student Data File, Fall 2013.
29

# % # % # %Residence Halls:
Aycock 470 99% 250 54% 214 46% 464 8%Belk 497 97% 190 39% 293 61% 483 9%Clement 381 98% 157 42% 218 58% 375 7%College Hill Suites 485 96% 225 48% 243 52% 468 9%Cotten 255 99% 130 52% 122 48% 252 5%Fleming 167 99% 70 42% 95 58% 165 3%Fletcher 415 99% 179 44% 230 56% 409 7%Garrett 298 99% 117 40% 179 60% 296 5%Greene 384 100% 0 0% 383 100% 383 7%Jarvis 132 97% 55 43% 73 57% 128 2%Jones 431 97% 127 31% 289 69% 416 8%Scott 610 98% 309 52% 289 48% 598 11%Tyler 472 99% 208 45% 257 55% 465 8%Umstead 211 100% 126 60% 84 40% 210 4%White 382 98% 165 44% 211 56% 376 7%
5,590 98% 5,488 100%
# % # % # %Housing Type:
Off-Campus Temporary Housing 0 0% 0 0% 0 0%Greek Housing: Fraternities 81 100% 0 0% 81 0.4%Greek Housing: Sororities 0 0% 188 100% 188 0.9%Commuters 8,295 39% 12,835 61% 21,130 98.7%
8,376 39% 13,023 61% 21,399 100%
# % # % # %10,684 40% 16,203 60% 26,887 97%
Fall 2013 Student Housing Occupancy by Location & Gender
On-Campus HousingMaximum Capacity
Percent Occupied
Male Female Total
Source: Fall 2013 Student Housing Data, Fall 2013 Student Data File.
Residence Hall Total
Off-Campus HousingMale Female Total
Off-Campus Total
Grand TotalMale Female Total
Residence Hall + Off-Campus Total
2,308 3,180
0
2,000
4,000
6,000
8,000
10,000
12,000
14,000
Male Female
On‐Campus
Off‐Campus
30

5-Year Institution 2009 2010 2011 2012 2013 Change
Appalachian State 16,968 17,222 17,344 17,589 17,838 5.1%
East Carolina 27,654 27,783 27,386 26,947 26,887 -2.8%
Elizabeth City State 3,264 3,307 2,930 2,878 2,421 -25.8%
Fayetteville State 6,283 5,781 5,930 6,060 6,179 -1.7%
NC A&T State 10,614 10,795 10,881 10,636 10,561 -0.5%
NC Central 8,587 8,645 8,359 8,604 8,093 -5.8%
NC School of the Arts 872 872 893 880 912 4.6%
NC State 33,819 34,376 34,767 34,340 34,009 0.6%
UNC-Asheville 3,897 3,967 3,863 3,751 3,784 -2.9%
UNC-Chapel Hill 28,916 29,390 29,137 29,278 29,127 0.7%
UNC-Charlotte 24,701 25,063 25,277 26,232 26,571 7.6%
UNC-Greensboro 21,306 18,771 18,627 18,516 18,074 -15.2%
UNC-Pembroke 6,661 6,944 6,251 6,269 6,222 -6.6%
UNC-Wilmington 12,924 13,071 13,145 13,733 13,937 7.8%
Western Carolina 9,429 9,407 9,352 9,608 10,107 7.2%
Winston-Salem State 6,427 6,333 6,163 5,689 5,399 -16.0%
UNC System Total 222,322 221,727 220,305 221,010 220,121 -1.0%
Note: Headcount enrollment includes distance education students.
Source: The University of North Carolina Fall 2013 Enrollment Report, as compiled by UNC-GA.
UNC Public InstitutionsFall Headcount Enrollment History
31

Unit 2009 2010 2011 2012 2013
College of Allied Health Sciences51.0999 Assistive Technology (C) 4 2 12 9 -51.1005 Clinical Laboratory Science (BS) 26 22 29 31 3444.0401 Community Hlth Administration (C) 0 1 9 6 151.0701 Health Care Administration (C) 14 21 23 36 2652.0201 Health Care Management (C) 3 7 5 5 351.2706 Health Informatics (C) 9 11 24 26 3151.0706 Health Information Management (BS) 45 18 24 10 051.0701 Health Services Management (BS) 175 169 159 143 15351.2310 Rehabilitation Counseling (C) 1 0 0 3 251.2310 Rehabilitation Services (BS) 38 50 51 57 4851.0204 Speech and Hearing Sciences (BS) 34 32 61 31 6051.1501 Substance Abuse Counseling (C) 18 36 37 43 3251.2399 Vocational Evaluation (C) 1 1 2 1 3
Total 368 370 436 401 393
Thomas Harriot College of Arts & Sciences05.0201 African and African American Studies (BA) 0 0 0 0 145.0201 Anthropology (BA) 44 56 68 64 9740.0499 Atmospheric Sciences, Applied (BS) 0 8 12 18 1326.0202 Biochemistry (BS) 37 33 43 45 3726.0101 Biology (BS) 375 434 460 370 44423.1303 Business and Technical Communication (C) 13 12 15 13 1640.0501 Chemistry (BA, BS) 75 72 77 73 8052.0201 Economic Development (C) 0 2 1 1 045.0601 Economics (BA, BS) 136 149 170 158 14923.0101 English (BA) 158 166 178 135 13216.0901 French (BA) 7 6 8 4 613.1325 French Education (BS) 0 0 1 1 211.0401 Geographic Information Sciences and Technology (BS) 0 0 4 4 445.0701 Geography (BA) 4 4 6 7 1145.0701 Geography, Applied (BS) 29 34 26 20 2240.0601 Geology (BS) 32 35 58 61 6516.0501 German (BA) 12 15 20 18 1413.1326 German Education (BS) 2 0 0 0 016.0905 Hispanic Studies (BA) 0 30 40 27 2216.0905 Hispanic Studies (C) 1 0 0 1 013.1330 Hispanic Studies Education (BS) 11 20 25 18 1754.0101 History (BA) 69 80 77 82 6640.0605 Hydrogeology and Environmental Geology (C) 0 4 1 0 113.0701 International Teaching (C) 0 1 0 0 027.0101 Mathematics (BA, BS) 34 22 30 35 3430.9999 Multicultural and Transnational Literature (C) 5 3 10 9 1024.0101 Multidisciplinary Studies (BA, BS) 37 39 62 68 5938.0101 Philosophy (BA) 10 9 17 20 1040.0801 Physics (BA, BS) 14 20 15 18 2240.0801 Physics, Applied (BSAP) 2 0 0 2 345.1001 Political Science (BA, BS) 165 143 177 137 11842.0101 Psychology (BA) 333 317 421 398 44954.0105 Public History (BS) 7 7 3 4 830.0501 Security Studies (C) 17 14 10 7 945.1101 Sociology (BA) 11 11 16 19 2845.1101 Sociology, Applied (BS) 56 60 67 69 8327.0501 Statistics (C) 1 0 0 0 013.1401 Teaching Engl to Speakers of Other Languages (C) 0 0 6 5 304.0301 Urban and Regional Planning (BS) 33 29 32 32 2505.0207 Women's Studies (BA) 3 1 1 1 1
Total 1,733 1,836 2,157 1,944 2,061
Unduplicated Undergraduate Fall Enrollment Historyby Unit and Primary Major (CIP)
Continued Next Page
32

Unit 2009 2010 2011 2012 2013
College of Business52.0301 Accounting (BSA) 6 1 0 0 052.0801 Finance or General Business Admin (BSBA) (Total) 292 288 337 292 53152.0801 Finance (C) 4 4 3 3 252.0201 Management (BSBA) 1,589 1,593 1,444 1,407 1,35252.0305 Management Accounting (BSBA) 442 440 394 427 44252.1201 Management Information Systems (BSBA) 149 158 193 199 21152.1201 Management Information Systems (C) 1 0 4 1 252.1401 Marketing (BSBA) 554 504 527 518 55452.0203 Supply Chain Management (C) 0 0 0 0 1
Total 3,037 2,988 2,902 2,847 3,095
College of Education***51.0999 Assistive Technology (C) - - - - 413.1013 Autism (C) 5 3 5 2 113.1303 Business or Business & Mktg Education (BSBE) (Total) 19 37 28 64 7213.0407 Community College Instruction (C) 8 12 13 20 1613.0501 Distance Learning and Administration (C) 5 6 3 8 413.1202 Elementary Education (BS) 651 907 1,149 1,093 96913.1311 Elementary Mathematics Education (C) 0 0 23 8 513.1305 English Education (BS) 41 83 87 80 6113.1318 History Education (BS) 39 106 118 122 11152.0407 Information Technologies (BSBE) 248 219 191 160 13613.1311 Mathematics Education (BS) 40 72 79 82 7113.1203 Middle Grades Education (BS) (Total) 71 96 103 89 10013.1316 Science Education (BS) 11 28 32 45 4613.1099 Special Educ, Adapted Curriculum (BS) 21 52 84 84 8813.1001 Special Educ, General Curriculum (BS) 66 78 112 118 13213.0501 Special Endorsement in Computer Education (C) 12 6 16 23 2313.0501 Virtual Reality in Education and Training (C) 0 1 0 0 0
Total 1,237 1,706 2,043 1,998 1,839
College of Fine Arts & Communication50.0903 Advanced Performance Studies (C) 2 1 0 2 150.0701 Art (BA) 10 12 2 0 013.1302 Art Education (BFA) 46 87 74 80 6050.0703 Art History and Appreciation (BA) 15 25 27 17 1150.0702 Art, Fine/Studio Arts (BFA) 511 511 505 446 42709.0101 Communication (BA) 24 5 0 0 009.0101 Communication (BS) 981 860 841 795 75750.0301 Dance Performance (BFA) 52 46 58 40 5413.1312 Music Education (BM) 57 139 140 132 12450.0903 Music Performance (BM) 100 97 91 82 7950.0904 Music Theory and Composition (BM) 11 12 12 8 1251.2305 Music Therapy (BM) 27 32 34 43 4513.1312 Suzuki Pedagogy (C) 0 2 2 1 050.0501 Theatre Arts (BA, BFA) 126 129 153 100 15713.1324 Theatre Arts or Dance Education (BFA) (Total) 32 53 33 30 26
Total 1,994 2,011 1,972 1,776 1,753Continued Next Page
Unduplicated Undergraduate Fall Enrollment Historyby Unit and Primary Major (CIP)
33

Unit 2009 2010 2011 2012 2013
College of Health & Human Performance51.2309 Aquatic Therapy (C) 0 0 0 0 151.0913 Athletic Training (BS) 40 53 70 75 7051.0999 Biofeedback (C) 2 1 2 5 151.2202 Environmental Health (BS) 32 36 28 24 2626.0908 Exercise and Sport Science (BA) 7 6 3 0 026.0908 Exercise Physiology (BS) 148 138 208 161 18931.0599 Health Fitness Specialist (BS) 136 119 186 181 17213.1314 Physical Education (BS) 59 63 76 72 7351.2207 Public Health Studies (BS) 110 103 171 177 22831.0101 Recreation and Park Management (BS) 78 76 74 73 6551.2309 Recreational Therapy (BS) 123 105 142 121 10913.1307 School Health Education (BS) 18 18 17 17 1631.0505 Sports Management (C) 0 1 0 0 031.0599 Sports Studies (BS) 51 43 134 110 109
Total 804 762 1,111 1,016 1,059
College of Human Ecology13.1209 Birth to Kindergarten Teacher Education (BS) 57 71 71 70 6219.0706 Child Life (BS) 93 82 68 79 5543.0104 Criminal Justice (BS) 382 345 454 412 43219.0707 Family Community Services (BS) 239 188 208 192 19113.1308 Family and Consumer Sciences Education (BS) 11 21 25 14 1430.1101 Gerontology (C) 0 0 2 3 352.0901 Hospitality Management (BS) 204 220 308 324 35852.0901 Hospitality Management (C) 1 0 0 0 050.0408 Interior Design (BS) 82 47 42 37 5419.0901 Merchandising (BS) 116 77 170 164 15151.3101 Nutrition and Dietetics (BS) 55 45 55 50 3844.0701 Social Work (BSW) 143 166 154 158 13251.1501 Substance Abuse (C) 2 0 0 0 0
Total 1,385 1,262 1,557 1,503 1,490
College of Nursing51.3801 Nursing (BSN) 616 614 636 673 679
College of Technology and Computer Science11.0901 Computer Network Professional (C) 0 3 4 4 611.0701 Computer Science (BA, BS) 217 219 251 222 28215.9999 Construction Management (BS) 587 509 386 291 24515.1301 Design (BS) 116 112 99 68 7214.0101 Engineering (BS) 265 224 379 435 48915.0612 Industrial Distribution and Logistics (BS) 141 149 163 165 14615.0613 Industrial Engineering Technology (BS) 26 32 44 45 6015.0612 Industrial Technology (BS) 443 411 424 418 38411.1003 Information Assurance (C) 2 2 2 4 411.0103 Information and Computer Technology (BS) 186 177 157 173 20215.0702 Lean Six Sigma Black Belt (C) 3 9 8 13 1215.1501 Performance Improvement (C) 3 1 3 2 011.1004 Website Developer (C) 13 15 15 16 10
Total 2,002 1,863 1,935 1,856 1,912
Unduplicated Undergraduate Fall Enrollment Historyby Unit and Primary Major (CIP)
Continued Next Page
34

Unit 2009 2010 2011 2012 2013
Brody School of Medicine51.2207 Ethnic and Rural Health Disparities (C) 0 2 1 4 0
General CollegeUndeclared Major 7,545 7,581 6,249 6,712 6,577
Non-Degree UndergraduateEarly College Second Life Program 34 37 34 71 152Exchange Students 70 91 110 81 74Post Baccalaureate Teacher Licensure 633 540 446 416 408Visiting Students - - - - 16
Total 737 668 590 568 650
Grand Total, All Colleges 21,458 21,663 21,589 21,298 21,508
Source: Student Data Files, Fall 2009 through Fall 2013.
Note: In unduplicated enrollment tables, students seeking a double major or dual degree are counted under their primary major only.
Note: 2009 and 2010 values were updated in 2013.
Unduplicated Undergraduate Fall Enrollment Historyby Unit and Primary Major (CIP)
*** Beginning in Fall 2010 the College of Education began admitting students at the Freshman and Sophomore levels. This change in policy explains the significant increase in students between Fall 2009 and Fall 2010.
35

Unit 2009 2010 2011 2012 2013
College of Allied Health Sciences51.0202 Audiology (AUD) 3 6 8 10 751.0204 Communication Sciences and Disorders (MS) 114 121 123 111 10251.0204 Communication Sciences and Disorders (PHD) 15 13 7 9 951.2706 Health Informatics and Information Management (MS) 0 0 0 0 751.2306 Occupational Therapy (MSOT) 60 61 66 72 7651.2308 Physical Therapy (DPT) 87 85 86 90 8951.0912 Physician Assistant Studies (MS) 97 94 96 97 10251.2310 Rehabilitation Counseling (MS) 45 46 7 13 1251.2310 Rehabilitation Counseling Administration (PHD) 12 19 22 19 1751.1501 Substance Abuse Clinical Counseling (MS) 16 19 41 53 6051.2310 Vocational Evaluation (MS) 4 1 0 0 0
Total 453 465 456 474 481Thomas Harriot College of Arts & Sciences
45.0201 Anthropology (MA) 23 26 21 21 2445.0602 Applied and Resource Economics (MS) 12 10 10 10 1126.0101 Biology (MS) 52 45 44 45 4526.0203 Biomedical Physics (PHD) 21 20 19 23 2240.0501 Chemistry (MS) 20 17 17 15 1842.2801 Clinical Psychology (MA) 5 3 1 0 023.0101 English (MA) 134 133 142 139 13845.0701 Geography (MA) 21 17 22 28 2040.0601 Geology (MS) 24 26 36 38 4042.2810 Health Psychology (PHD) 23 29 30 35 4054.0101 History (MA) 32 31 33 36 3530.2001 International Studies (MA) 37 38 30 16 1830.9999 Maritime Studies (MA) 40 46 54 51 5827.0101 Mathematics (MA) 15 21 24 20 1326.0204 Molecular Biology and Biotechnology (MS) 23 29 22 18 1340.0801 Physics (MS) 17 22 23 16 1442.0101 Psychology (MA) 39 39 36 25 2044.0401 Public Administration (MPA) 33 39 37 29 3323.1303 Rhetoric Writing and Professional Comm (PhD) 25 29 27 27 2142.2805 School Psychology (MA, CAS) 21 20 21 20 1930.0601 Security Studies (MS) 0 2 17 23 2545.1101 Sociology (MA) 17 20 20 14 17
Total 634 662 686 649 644College of Business
52.0301 Accounting (MSA) 124 138 115 119 10852.0201 Business Administration (MBA) 762 792 794 796 742
Total 886 930 909 915 850
Unduplicated Graduate Fall Enrollment Historyby Unit and Primary Major (CIP)
Continued Next Page
36

Unit 2009 2010 2011 2012 2013College of Education
13.0403 Adult Education (MAED) 40 35 38 40 4113.1399 Business Education (MAED) 12 12 8 6 413.1101 Counselor Education (MS) 103 101 108 97 7613.0401 Educational Administration and Supervision (EDS) 26 25 20 33 3213.0401 Educational Leadership (EDD) 98 125 103 121 11813.1202 Elementary Education (MAED) 73 59 44 36 3613.1305 English Education (MAED) 10 8 11 5 313.1328 History Education (MAED) 11 7 6 7 913.0501 Instructional Technology (MS) 66 59 54 52 5013.0501 Instructional Technology Education (MAED) 141 109 96 105 10525.0101 Library Science (MLS) 338 288 204 194 17713.1399 Marketing Education (MAED) 0 0 0 0 113.1299 Master of Arts in Teaching (MAT) (Total) 75 61 65 55 4013.1311 Mathematics Education (MAED) 15 28 36 23 2213.1203 Middle Grades Education (MAED) 21 19 11 15 713.1315 Reading Education (MAED) 72 72 74 63 8313.0401 School Administration (MSAM) 195 171 173 141 11813.1316 Science Education (MA) 4 5 6 3 013.1316 Science Education (MAED) 39 40 35 37 2513.1011 Special Educ, Behavioral/Emotional Disabilities (MAED) 4 9 7 7 713.1011 Special Educ, Learning Disabilities (MAED) 33 44 32 30 1913.1011 Special Educ, Low Incidence Disabilities (MAED) 38 37 31 15 813.1006 Special Educ, Mental Disabilities (MAED) 2 4 5 4 313.1319 Vocational Education (MS) 22 14 17 19 10
Total 1,438 1,332 1,184 1,108 994College of Fine Arts & Communication
13.1302 Art Education (MAED) 29 24 20 14 1550.0702 Art, Fine/Studio Arts (MFA) 44 46 36 38 3209.0101 Communication (MA) 20 21 28 22 1613.1312 Music Education (MM) 24 19 12 8 1250.0903 Music Performance (MM) 41 30 24 31 3550.0904 Music Theory and Composition (MM) 5 1 2 3 3
Total 163 141 122 116 113College of Health & Human Performance
51.0913 Athletic Training (MS) 4 4 0 0 026.0999 Bioenergetics and Exercise Science (PHD) 14 14 13 14 1251.2202 Environmental Health (MSEH) 28 29 33 31 2431.0505 Exercise Sport Science (MS) 89 67 66 66 6551.2207 Health Education and Promotion (MA) 85 85 84 76 5713.1307 Health Education and Promotion (MAED) 69 45 37 30 2113.1314 Physical Education (MAED) 25 34 28 29 2031.0101 Recreation and Park Administration (MS) 23 23 20 17 1151.2309 Recreational Therapy Administration (MS) 15 17 13 11 12
Total 352 318 294 274 222
Unduplicated Graduate Fall Enrollment Historyby Unit and Primary Major (CIP)
Continued Next Page
37

Unit 2009 2010 2011 2012 2013College of Human Ecology
13.1209 Birth to Kindergarten Education (MAED) 21 25 25 17 1119.0707 Child Development and Family Relations (MS) 30 17 16 19 2143.0104 Criminal Justice (MS) 58 44 40 18 1713.1399 Family and Consumer Sciences (MAED) 7 13 8 3 651.1505 Marriage and Family Therapy (MS) 23 25 26 28 2051.1505 Medical Family Therapy (PHD) 15 12 14 9 1119.0501 Nutrition (MS) 46 46 39 35 3344.0701 Social Work (MSW) 151 179 154 123 127
Total 351 361 322 252 246School of Medicine
26.0401 Anatomy and Cell Biology (PHD) 7 8 10 10 1026.0202 Biochemistry and Molecular Biology (PHD) 12 10 12 10 926.0102 Biomedical Science (MS) 0 0 5 11 1126.9999 Interdisciplinary Biological Science (PHD) 28 31 26 26 2851.1201 Medicine (MD) 304 308 308 319 32326.0503 Microbiology and Immunology (PHD) 14 14 15 16 1426.1007 Pharmacology and Toxicology (PHD) 15 15 13 15 1526.0901 Physiology (PHD) 9 10 11 11 1251.2201 Public Health (MPH) 80 91 102 97 84
Total 469 487 502 515 506School of Dental Medicine
51.0401 Dental Medicine (DMD) 0 0 52 104 154Total 0 0 52 104 154
College of Nursing51.3805 Adult Gerontology Nurse Practitioner (C) 4 5 7 6 1351.3813 Clinical Nurse Specialist (C) 4 3 4 5 751.3805 Family Nurse Practitioner (C) 11 5 9 10 951.3806 Neonatal Nurse Practitioner (C) 0 0 1 2 351.3804 Nurse Anesthesia (C) 0 0 1 1 051.3807 Nurse Midwifery (C) 0 4 4 4 451.3899 Nursing (MSN) 465 491 504 533 50851.3808 Nursing (PHD) 30 29 28 30 3051.3817 Nursing Education (C) 1 1 2 6 251.3802 Nursing Leadership (C) 0 2 2 1 151.3818 Nursing Practice (DNP) - - - - 19
Total 515 540 562 598 596College of Technology and Computer Science
11.0701 Computer Science (MS) 19 16 18 15 1815.1001 Construction Management (MCM) 18 17 25 26 2111.1099 Network Technology (MS) 0 0 0 0 2451.2206 Occupational Safety (MS) 23 24 23 28 2114.0903 Software Engineering (MS) 36 51 53 51 4015.0612 Technology Systems (MS) 122 129 118 86 68
Total 218 237 237 206 192Research & Graduate Studies
30.9999 Coastal Resources Management (PhD) 25 32 36 36 3130.9999 Sustainable Tourism (MS) 0 4 6 13 14
Total 25 36 42 49 45Non-Degree Seeking 692 611 429 389 336
Grand Total, All Majors 6,196 6,120 5,797 5,649 5,379Source: Student Data Files, Fall 2009 through Fall 2013.
Note: In unduplicated enrollment tables, students seeking a double major or dual degree are counted under their primary major only.
Continued Next Page
Unduplicated Graduate Fall Enrollment Historyby Unit and Primary Major (CIP)
38

* Prior to 2008 Coastal Resources Management was listed in the Thomas Harriot College of Arts & Sciences.
** In 2010 Health Psychology (PhD) CIP changed from 42.2301 to 42.2810
** In 2010 Psychology, Clinical (MA) CIP changed from 42.0201 to 42.2801
** In 2010 Psychology, School (MA) CIP changed from 42.1701 to 42.2805
** In 2010 Psychology, School (CAS) CIP changed from 42.1701 to 42.2805
** In 2010 Technical & Professional Discourse (PhD) CIP changed from 23.1101 to 23.1303
** In 2010 Adult Nurse Practitioner (C) CIP changed from 51.1604 to 51.3805
** In 2010 Clinical Nurse Specialist (C) CIP changed from 51.1616 to 51.3813
** In 2010 Family Nurse Practitioner (C) CIP changed from 51.1605 to 51.3805
** In 2010 Neonatal Nurse Practitioner (C) CIP changed from 51.1606 to 51.3806
** In 2010 Nurse Anesthesia (C) CIP changed from 51.1604 to 51.3804
** In 2010 Nurse Midwifery (C) CIP changed from 51.1607 to 51.3807
** In 2010 Nursing Science (PhD) CIP changed from 51.1608 to 51.3808
Unduplicated Graduate Fall Enrollment Historyby Unit and Primary Major (CIP)
39

Full- Part-
Unit Women Men Women Men Time Time Total
College of Allied Health Sciences51.1005 Clinical Laboratory Science (BS) 19 8 5 2 27 7 3444.0401 Community Health Administration (C) 0 0 1 0 0 1 151.0701 Health Care Administration (C) 0 0 22 4 0 26 2652.0201 Health Care Management (C) 0 0 2 1 0 3 351.2706 Health Informatics (C) 0 0 22 9 0 31 3151.0701 Health Services Management (BS) 96 16 37 4 112 41 15351.2310 Rehabilitation Counseling (C) 0 0 2 0 0 2 251.2310 Rehabilitation Services (BS) 41 4 3 0 45 3 4851.0204 Speech and Hearing Sciences (BS) 56 2 2 0 58 2 6051.1501 Substance Abuse Counseling (C) 0 0 29 3 0 32 3251.2399 Vocational Evaluation (C) 0 0 2 1 0 3 3
Total 212 30 127 24 242 151 393Thomas Harriot College of Arts & Sciences
05.0201 African and African American Studies (BA) 0 1 0 0 1 0 145.0201 Anthropology (BA) 62 32 2 1 94 3 9740.0499 Atmospheric Sciences, Applied (BS) 0 13 0 0 13 0 1326.0202 Biochemistry (BS) 16 17 0 4 33 4 3726.0101 Biology (BS) 244 180 12 8 424 20 44423.1303 Business and Technical Communication (C) 0 0 15 1 0 16 1640.0501 Chemistry (BA, BS) 44 30 1 5 74 6 8045.0601 Economics (BA, BS) 31 110 3 5 141 8 14923.0101 English (BA) 86 37 5 4 123 9 13216.0901 French (BA) 3 1 2 0 4 2 613.1325 French Education (BS) 1 0 1 0 1 1 211.0401 Geographic Information Sciences and Technology (BS) 1 3 0 0 4 0 445.0701 Geography (BA) 3 8 0 0 11 0 1145.0701 Geography, Applied (BS) 7 12 1 2 19 3 2240.0601 Geology (BS) 17 45 2 1 62 3 6516.0501 German (BA) 4 3 2 5 7 7 1416.0905 Hispanic Studies (BA) 18 4 0 0 22 0 2213.1330 Hispanic Studies Education (BS) 14 1 2 0 15 2 1754.0101 History (BA) 16 42 2 6 58 8 6640.0605 Hydrogeology and Environmental Geology (C) 0 0 0 1 0 1 127.0101 Mathematics (BA, BS) 12 18 1 3 30 4 3430.9999 Multicultural and Transnational Literature (C) 0 0 6 4 0 10 1024.0101 Multidisciplinary Studies (BA, BS) 28 24 4 3 52 7 5938.0101 Philosophy (BA) 4 4 0 2 8 2 1040.0801 Physics (BA, BS) 2 19 0 1 21 1 2240.0801 Physics, Applied (BSAP) 2 1 0 0 3 0 345.1001 Political Science (BA, BS) 36 79 0 3 115 3 11842.0101 Psychology (BA) 319 101 23 6 420 29 44954.0105 Public History (BS) 5 3 0 0 8 0 830.0501 Security Studies (C) 0 0 4 5 0 9 945.1101 Sociology (BA) 17 11 0 0 28 0 2845.1101 Sociology, Applied (BS) 57 17 7 2 74 9 8313.1401 Teaching Engl to Speakers of Other Languages (C) 0 0 1 2 0 3 304.0301 Urban and Regional Planning (BS) 4 21 0 0 25 0 2505.0207 Women's Studies (BA) 1 0 0 0 1 0 1
Total 1,054 837 96 74 1,891 170 2,061Continued Next Page
Unduplicated Undergraduate Fall 2013 Enrollmentby Unit, Primary Major, Attendance Status, and Gender
Full-Time Part-Time
40

Full- Part-
Unit Women Men Women Men Time Time Total
Unduplicated Undergraduate Fall 2013 Enrollmentby Unit, Primary Major, Attendance Status, and Gender
Full-Time Part-Time
College of Business*52.0801 Finance (C) 0 0 0 2 0 2 2
52.0801 Finance or General Business Admin (BSBA) (Total) 118 279 88 46 397 134 531
52.0201 Management (BSBA) 368 780 113 91 1,148 204 1,352
52.0305 Management Accounting (BSBA) 175 235 17 15 410 32 442
52.1201 Management Information Systems (BSBA) 43 93 26 49 136 75 211
52.1201 Management of Info Syst (C) 0 0 1 1 0 2 2
52.1401 Marketing (BSBA) 205 296 22 31 501 53 554
52.0203 Supply Chain Management (C) 0 0 0 1 0 1 1
Total 909 1,683 267 236 2,592 503 3,095
College of Education51.0999 Assistive Technology (C) 0 0 4 0 0 4 4
13.1013 Autism (C) 0 0 1 0 0 1 1
13.1303 Business or Business & Mktg Education (BSBE) (Total) 20 34 12 6 54 18 72
13.0407 Community College Instruction (C) 0 0 13 3 0 16 16
13.0501 Distance Learning and Administration (C) 0 0 4 0 0 4 4
13.1202 Elementary Education (BS) 774 32 153 10 806 163 969
13.1311 Elementary Mathematics Education (C) 0 0 5 0 0 5 5
13.1305 English Education (BS) 46 14 0 1 60 1 61
13.1318 History Education (BS) 52 56 2 1 108 3 111
52.0407 Information Technologies (BSBE) 23 25 50 38 48 88 136
13.1311 Mathematics Education (BS) 42 28 1 0 70 1 71
13.1203 Middle Grades Education (BS) (Total) 70 11 10 9 81 19 100
13.1316 Science Education (BS) 26 16 3 1 42 4 46
13.1099 Special Educ, Adapted Curriculum (BS) 78 7 2 1 85 3 88
13.1001 Special Educ, General Curriculum (BS) 81 6 40 5 87 45 132
13.0501 Special Endorsement in Computer Education (C) 0 0 16 7 0 23 23
Total 1,212 229 316 82 1,441 398 1,839
College of Fine Arts & Communication50.0903 Advanced Performance Studies (C) 0 0 0 1 0 1 1
13.1302 Art Education (BFA) 51 5 2 2 56 4 60
50.0703 Art History and Appreciation (BA) 9 2 0 0 11 0 11
50.0702 Art, Fine/Studio Arts (BFA) 227 158 29 13 385 42 427
09.0101 Communication (BS) 435 214 77 31 649 108 757
50.0301 Dance Performance (BFA) 47 6 1 0 53 1 54
13.1312 Music Education (BM) 58 62 3 1 120 4 124
50.0903 Music Performance (BM) 41 35 0 3 76 3 79
50.0904 Music Theory and Composition (BM) 3 9 0 0 12 0 12
51.2305 Music Therapy (BM) 34 7 3 1 41 4 45
50.0501 Theatre Arts (BA, BFA) 100 52 3 2 152 5 157
13.1324 Theatre Arts or Dance Education (BFA) (Total) 23 3 0 0 26 0 26
Total 1,028 553 118 54 1,581 172 1,753
Continued Next Page
41

Full- Part-
Unit Women Men Women Men Time Time Total
Unduplicated Undergraduate Fall 2013 Enrollmentby Unit, Primary Major, Attendance Status, and Gender
Full-Time Part-Time
College of Health & Human Performance51.2309 Aquatic Therapy (C) 0 0 1 0 0 1 1
51.0913 Athletic Training (BS) 42 26 2 0 68 2 70
51.0999 Biofeedback (C) 0 0 1 0 0 1 1
51.2202 Environmental Health (BS) 12 10 1 3 22 4 26
26.0908 Exercise Physiology (BS) 107 77 4 1 184 5 189
31.0599 Health Fitness Specialist (BS) 65 103 0 4 168 4 172
13.1314 Physical Education (BS) 14 54 3 2 68 5 73
51.2207 Public Health Studies (BS) 186 37 4 1 223 5 228
31.0101 Recreation and Park Management (BS) 20 44 0 1 64 1 65
51.2309 Recreational Therapy (BS) 98 9 2 0 107 2 109
13.1307 School Health Education (BS) 8 7 0 1 15 1 16
31.0599 Sports Studies (BS) 19 84 2 4 103 6 109
Total 571 451 20 17 1,022 37 1,059
College of Human Ecology13.1209 Birth to Kindergarten Teacher Education (BS) 38 0 24 0 38 24 62
19.0706 Child Life (BS) 48 2 5 0 50 5 55
43.0104 Criminal Justice (BS) 156 254 12 10 410 22 432
19.0707 Family Community Services (BS) 162 10 17 2 172 19 191
13.1308 Family and Consumer Sciences Education (BS) 12 0 2 0 12 2 14
30.1101 Gerontology (C) 0 0 3 0 0 3 3
52.0901 Hospitality Management (BS) 236 81 33 8 317 41 358
50.0408 Interior Design (BS) 46 4 4 0 50 4 54
19.0901 Merchandising (BS) 146 2 3 0 148 3 151
51.3101 Nutrition and Dietetics (BS) 29 2 7 0 31 7 38
44.0701 Social Work (BSW) 112 13 7 0 125 7 132
Total 985 368 117 20 1,353 137 1,490
Brody School of Medicine51.2207 Ethnic & Rural Health Disparities 0 0 0 0 0 0 0
Total 0 0 0 0 0 0 0
College of Nursing51.1601 Nursing (BSN) 442 46 168 23 488 191 679
Total 442 46 168 23 488 191 679
College of Technology and Computer Science11.0901 Computer Network Professional (C) 0 0 5 1 0 6 6
11.0701 Computer Science (BA, BS) 39 224 6 13 263 19 282
15.9999 Construction Management (BS) 9 229 1 6 238 7 245
15.1301 Design (BS) 12 57 1 2 69 3 72
14.0101 Engineering (BS) 77 392 2 18 469 20 489
15.0612 Industrial Distribution and Logistics (BS) 10 104 5 27 114 32 146
15.0613 Industrial Engineering Technology (BS) 4 55 0 1 59 1 60
15.0612 Industrial Technology (BS) 10 77 46 251 87 297 384
11.1003 Information Assurance (C) 0 0 1 3 0 4 4
11.0103 Information and Computer Technology (BS) 16 161 1 24 177 25 202
15.0702 Lean Six Sigma Black Belt (C) 0 0 3 9 0 12 12
11.1004 Website Developer (C) 0 0 7 3 0 10 10
Total 177 1,299 78 358 1,476 436 1,912
General CollegeUndeclared Major 4,126 2,157 212 82 6,283 294 6,577
Non-Degree UndergraduateEarly College Second Life Program 0 0 100 52 0 152 152
Exchange Students 39 34 0 1 73 1 74
Post Baccalaureate Teacher Licensure 38 17 283 70 55 353 408
Visiting Students 3 0 8 5 3 13 16
Total 80 51 391 128 131 519 650
Grand Total, All Colleges 10,796 7,704 1,910 1,098 18,500 3,008 21,508
Source: Student Data Files, Fall 2013.
Note: In unduplicated enrollment tables, students seeking a double major or dual degree are counted under their primary major only.
42

Full- Part-
Unit Women Men Women Men Time Time Total
College of Allied Health Sciences51.0202 Audiology (AUD) 6 0 1 0 6 1 7
51.0204 Communication Sciences and Disorders (MS) 73 1 28 0 74 28 102
51.0204 Communication Sciences and Disorders (PHD) 3 3 2 1 6 3 9
51.2706 Health Informatics and Information Management (MS) 2 1 2 2 3 4 7
51.2306 Occupational Therapy (MSOT) 51 4 19 2 55 21 76
51.2308 Physical Therapy (DPT) 64 25 0 0 89 0 89
51.0912 Physician Assistant Studies (MS) 81 20 1 0 101 1 102
51.2310 Rehabilitation Counseling (MS) 10 1 1 0 11 1 12
51.2310 Rehabilitation Counseling Administration (PHD) 8 2 5 2 10 7 17
51.1501 Substance Abuse Clinical Counseling (MS) 48 11 1 0 59 1 60
Total 346 68 60 7 414 67 481Thomas Harriot College of Arts & Sciences
45.0201 Anthropology (MA) 16 4 4 0 20 4 24
45.0602 Applied and Resource Economics (MS) 2 9 0 0 11 0 11
26.0101 Biology (MS) 16 18 8 3 34 11 45
26.0203 Biomedical Physics (PHD) 4 12 0 6 16 6 22
40.0501 Chemistry (MS) 6 9 1 2 15 3 18
23.0101 English (MA) 21 21 78 18 42 96 138
45.0701 Geography (MA) 6 10 1 3 16 4 20
40.0601 Geology (MS) 9 13 5 13 22 18 40
42.2810 Health Psychology (PHD) 21 9 9 1 30 10 40
54.0101 History (MA) 4 8 14 9 12 23 35
30.2001 International Studies (MA) 7 6 5 0 13 5 18
30.9999 Maritime Studies (MA) 16 15 13 14 31 27 58
27.0101 Mathematics (MA) 3 8 2 0 11 2 13
26.0204 Molecular Biology and Biotechnology (MS) 5 5 1 2 10 3 13
40.0801 Physics (MS) 6 7 0 1 13 1 14
42.0101 Psychology (MA) 8 9 2 1 17 3 20
44.0401 Public Administration (MPA) 9 7 13 4 16 17 33
23.1303 Rhetoric Writing and Professional Comm (PhD) 5 2 8 6 7 14 21
42.2805 School Psychology (MA, CAS) 12 1 5 1 13 6 19
30.0601 Security Studies (MS) 2 3 2 18 5 20 25
45.1101 Sociology (MA) 9 3 5 0 12 5 17
Total 187 179 176 102 366 278 644College of Business
52.0301 Accounting (MSA) 45 50 6 7 95 13 108
52.0201 Business Administration (MBA) 82 92 239 329 174 568 742
Total 127 142 245 336 269 581 850
Unduplicated Graduate Fall 2013 Enrollmentby Unit, Major, Attendance Status, and Gender
Full-Time Part-Time
Continued Next Page
43

Full- Part-
Unit Women Men Women Men Time Time Total
Unduplicated Graduate Fall 2013 Enrollmentby Unit, Major, Attendance Status, and Gender
Full-Time Part-Time
College of Education13.0403 Adult Education (MAED) 3 1 25 12 4 37 41
13.1399 Business Education (MAED) 0 0 3 1 0 4 4
13.1101 Counselor Education (MS) 45 5 20 6 50 26 76
13.0401 Educational Administration and Supervision (EDS) 0 0 12 20 0 32 32
13.0401 Educational Leadership (EDD) 4 0 69 45 4 114 118
13.1202 Elementary Education (MAED) 4 0 30 2 4 32 36
13.1305 English Education (MAED) 0 0 2 1 0 3 3
13.1328 History Education (MAED) 4 1 2 2 5 4 9
13.0501 Instructional Technology (MS) 4 0 27 19 4 46 50
13.0501 Instructional Technology Education (MAED) 4 4 78 19 8 97 105
25.0101 Library Science (MLS) 7 2 158 10 9 168 177
13.1399 Marketing Education (MAED) 0 0 1 0 0 1 1
13.1299 Master of Arts in Teaching (MAT) (Total) 23 12 3 2 35 5 40
13.1311 Mathematics Education (MAED) 3 1 13 5 4 18 22
13.1203 Middle Grades Education (MAED) 4 1 1 1 5 2 7
13.1315 Reading Education (MAED) 12 0 70 1 12 71 83
13.0401 School Administration (MSAM) 20 8 72 18 28 90 118
13.1316 Science Education (MAED) 1 0 18 6 1 24 25
13.1011 Special Educ, Behavioral/Emotional Disabilities (MAED) 0 0 6 1 0 7 7
13.1011 Special Educ, Learning Disabilities (MAED) 3 1 13 2 4 15 19
13.1011 Special Educ, Low Incidence Disabilities (MAED) 0 0 7 1 0 8 8
13.1006 Special Educ, Mental Disabilities (MAED) 0 0 3 0 0 3 3
13.1319 Vocational Education (MS) 0 0 7 3 0 10 10
Total 141 36 640 177 177 817 994College of Fine Arts & Communication
13.1302 Art Education (MAED) 2 0 9 4 2 13 15
50.0702 Art, Fine/Studio Arts (MFA) 19 10 3 0 29 3 32
09.0101 Communication (MA) 9 2 2 3 11 5 16
13.1312 Music Education (MM) 1 0 8 3 1 11 12
50.0903 Music Performance (MM) 15 16 2 2 31 4 35
50.0904 Music Theory and Composition (MM) 1 1 0 1 2 1 3
Total 47 29 24 13 76 37 113College of Health & Human Performance
26.0999 Bioenergetics and Exercise Science (PHD) 3 8 0 1 11 1 12
51.2202 Environmental Health (MSEH) 4 2 9 9 6 18 24
31.0505 Exercise Sport Science (MS) 29 28 5 3 57 8 65
51.2207 Health Education and Promotion (MA) 16 4 34 3 20 37 57
13.1307 Health Education and Promotion (MAED) 6 3 8 4 9 12 21
13.1314 Physical Education (MAED) 3 2 5 10 5 15 20
31.0101 Recreation and Park Administration (MS) 7 0 3 1 7 4 11
51.2309 Recreational Therapy Administration (MS) 5 3 4 0 8 4 12
Total 73 50 68 31 123 99 222Continued Next Page
44

Full- Part-
Unit Women Men Women Men Time Time Total
Unduplicated Graduate Fall 2013 Enrollmentby Unit, Major, Attendance Status, and Gender
Full-Time Part-Time
College of Human Ecology13.1209 Birth-Kindergarten Education (MAED) 1 0 10 0 1 10 11
19.0707 Child Development and Family Relations (MS) 14 0 7 0 14 7 21
43.0104 Criminal Justice (MS) 8 0 4 5 8 9 17
13.1399 Family and Consumer Sciences (MAED) 0 0 5 1 0 6 6
51.1505 Marriage and Family Therapy (MS) 15 5 0 0 20 0 20
51.1505 Medical Family Therapy (PHD) 6 3 2 0 9 2 11
19.0501 Nutrition (MS) 8 1 24 0 9 24 33
44.0701 Social Work (MSW) 91 11 21 4 102 25 127
Total 143 20 73 10 163 83 246
School of Dental Medicine51.0401 Dental Medicine (DMD) 73 81 0 0 154 0 154
Total 73 81 0 0 154 0 154School of Medicine
26.0401 Anatomy and Cell Biology (PHD) 6 4 0 0 10 0 10
26.0202 Biochemistry and Molecular Biology (PHD) 6 3 0 0 9 0 9
26.0102 Biomedical Science (MS) 2 8 0 1 10 1 11
26.9999 Interdisciplinary Biological Science (PHD) 12 14 1 1 26 2 28
51.1201 Medicine (MD) 156 162 4 1 318 5 323
26.0503 Microbiology and Immunology (PHD) 4 10 0 0 14 0 14
26.1007 Pharmacology and Toxicology (PHD) 7 8 0 0 15 0 15
26.0901 Physiology (PHD) 5 6 1 0 11 1 12
51.2201 Public Health (MPH) 40 24 18 2 64 20 84
Total 238 239 24 5 477 29 506College of Nursing
51.3805 Adult Gerontology Nurse Practitioner (C) 7 0 5 1 7 6 13
51.3813 Clinical Nurse Specialist (C) 0 0 7 0 0 7 7
51.3805 Family Nurse Practitioner (C) 4 0 5 0 4 5 9
51.3806 Neonatal Nurse Practitioner (C) 0 0 3 0 0 3 3
51.3807 Nurse Midwifery (C) 1 0 3 0 1 3 4
51.3899 Nursing (MSN) 115 19 353 21 134 374 508
51.3808 Nursing (PHD) 1 0 25 4 1 29 30
51.3817 Nursing Education (C) 0 0 2 0 0 2 2
51.3802 Nursing Leadership (C) 0 0 1 0 0 1 1
51.3818 Nursing Practice (DNP) 5 1 11 2 6 13 19
Total 133 20 415 28 153 443 596College of Technology and Computer Science
11.0701 Computer Science (MS) 4 8 1 5 12 6 18
15.1001 Construction Management (MCM) 0 5 2 14 5 16 21
11.1099 Network Technology (MS) 1 3 3 17 4 20 24
51.2206 Occupational Safety (MS) 0 4 5 12 4 17 21
14.0903 Software Engineering (MS) 2 7 4 27 9 31 40
15.0612 Technology Systems (MS) 1 5 10 52 6 62 68
Total 8 32 25 127 40 152 192Research & Graduate Studies
30.9999 Coastal Resources Management (PHD) 9 6 10 6 15 16 31
30.9999 Sustainable Tourism (MS) 3 7 2 2 10 4 14
Total 12 13 12 8 25 20 45Non-Degree Seeking 23 11 184 118 34 302 336
Grand Total, All Majors 1,551 920 1,946 962 2,471 2,908 5,379
Source: Student Data Files, Fall 2013.
Note: In unduplicated enrollment tables, students seeking a double major or dual degree are counted under their primary major only.
45

Unit Women Men Women Men Women Men Women Men Women Men Women Men Women Men Women Men Women Men All
College of Allied Health Sciences51.1005 Clinical Laboratory Science (BS) 0 0 3 1 0 0 4 0 1 2 12 4 1 0 3 0 0 3 3444.0401 Community Health Administration (C) 0 0 1 0 0 0 0 0 0 0 0 0 0 0 0 0 0 0 151.0701 Health Care Administration (C) 1 0 1 0 0 0 9 2 0 0 9 2 0 0 2 0 0 0 2652.0201 Health Care Management (C) 0 0 0 0 0 0 1 0 0 0 1 1 0 0 0 0 0 0 351.2706 Health Informatics (C) 0 0 1 0 0 0 8 0 0 0 11 6 1 0 1 3 0 0 3151.0701 Health Services Management (BS) 1 0 7 0 0 0 30 2 4 0 84 16 3 1 4 1 0 0 15351.2310 Rehabilitation Counseling (C) 0 0 0 0 0 0 2 0 0 0 0 0 0 0 0 0 0 0 251.2310 Rehabilitation Services (BS) 0 0 2 0 0 0 12 1 0 0 28 3 2 0 0 0 0 0 4851.0204 Speech and Hearing Sciences (BS) 1 0 1 0 0 0 5 0 2 0 46 2 0 0 3 0 0 0 6051.1501 Substance Abuse Counseling (C) 0 0 0 0 0 0 19 1 0 0 9 2 0 0 1 0 0 0 3251.2399 Vocational Evaluation (C) 0 0 0 0 0 0 1 0 0 0 1 1 0 0 0 0 0 0 3
Total 3 0 16 1 0 0 91 6 7 2 201 37 7 1 14 4 0 3 393
College of Arts & Sciences05.0201 African and African American Studies (BA) 0 0 0 0 0 0 0 1 0 0 0 0 0 0 0 0 0 0 145.0201 Anthropology (BA) 0 1 3 1 0 0 6 6 4 3 46 18 3 3 1 1 1 0 9740.0499 Atmospheric Sciences, Applied (BS) 0 0 0 0 0 0 0 2 0 2 0 8 0 0 0 1 0 0 1326.0202 Biochemistry (BS) 0 0 3 3 0 1 2 2 0 2 11 11 0 0 0 1 0 1 3726.0101 Biology (BS) 3 1 26 23 1 0 51 19 16 10 146 125 4 7 7 2 2 1 44423.1303 Business and Technical Communication (C) 0 0 0 0 0 0 5 0 0 0 8 0 1 0 1 1 0 0 1640.0501 Chemistry (BA, BS) 0 0 3 5 0 0 9 3 4 3 28 20 1 2 0 1 0 1 8045.0601 Economics (BA, BS) 0 0 1 3 0 0 5 15 2 0 24 91 1 2 1 2 0 2 14923.0101 English (BA) 0 0 2 0 0 0 15 6 6 3 60 29 5 1 2 2 1 0 13216.0901 French (BA) 0 0 0 0 0 0 0 0 1 0 3 1 0 0 1 0 0 0 613.1325 French Education (BS) 0 0 0 0 0 0 1 0 0 0 1 0 0 0 0 0 0 0 211.0401 Geographic Information Sciences and Technology (BS) 0 0 0 0 0 0 0 0 0 0 1 3 0 0 0 0 0 0 445.0701 Geography (BA) 0 0 0 0 0 0 0 0 1 1 2 4 0 0 0 3 0 0 1145.0701 Geography, Applied (BS) 0 0 0 0 0 0 2 0 0 0 6 14 0 0 0 0 0 0 2240.0601 Geology (BS) 0 0 0 0 0 0 0 0 2 3 17 40 0 2 0 1 0 0 6516.0501 German (BA) 0 0 0 0 0 0 0 0 1 0 5 8 0 0 0 0 0 0 1416.0905 Hispanic Studies (BA) 0 0 1 0 0 0 2 1 5 0 10 1 0 1 0 1 0 0 2213.1330 Hispanic Studies Education (BS) 0 0 1 0 0 0 3 1 3 0 8 0 0 0 1 0 0 0 1754.0101 History (BA) 0 0 1 0 0 0 0 3 0 2 16 41 1 2 0 0 0 0 6640.0605 Hydrogeology and Environmental Geology (C) 0 0 0 0 0 0 0 0 0 0 0 1 0 0 0 0 0 0 127.0101 Mathematics (BA, BS) 0 0 1 0 0 0 1 2 0 1 11 18 0 0 0 0 0 0 3430.9999 Multicultural and Transnational Literature (C) 0 0 0 0 0 0 0 0 2 2 4 1 0 0 0 1 0 0 1024.0101 Multidisciplinary Studies (BA, BS) 0 0 3 0 0 0 5 4 2 2 19 17 2 2 1 1 0 1 5938.0101 Philosophy (BA) 0 0 0 0 0 0 0 3 0 0 4 1 0 0 0 2 0 0 1040.0801 Physics (BA, BS) 0 0 0 2 0 0 1 1 0 3 1 14 0 0 0 0 0 0 2240.0801 Physics, Applied (BSAP) 0 0 1 0 0 0 0 0 0 0 1 1 0 0 0 0 0 0 345.1001 Political Science (BA, BS) 0 1 0 0 0 0 9 12 1 2 22 67 4 0 0 0 0 0 11842.0101 Psychology (BA) 0 1 9 4 1 0 86 30 22 4 202 60 13 5 8 3 1 0 449
Continued Next Page
Unduplicated Undergraduate Fall 2013 Enrollmentby Unit, Primary Major, Ethnicity, and Gender
Two or more races
Race & ethnicity
unkNon-Res
AlienAm Indian
Alaskan Nat Asian
Nat Hawaiian
Pacific Islander
Black or African
Amer, Non-Hisp Hispanic
White, Non-Hisp
46

Unit Women Men Women Men Women Men Women Men Women Men Women Men Women Men Women Men Women Men All
Unduplicated Undergraduate Fall 2013 Enrollmentby Unit, Primary Major, Ethnicity, and Gender
Two or more races
Race & ethnicity
unkNon-Res
AlienAm Indian
Alaskan Nat Asian
Nat Hawaiian
Pacific Islander
Black or African
Amer, Non-Hisp Hispanic
White, Non-Hisp
54.0105 Public History (BS) 0 0 0 0 0 0 0 0 0 0 5 3 0 0 0 0 0 030.0501 Security Studies (C) 0 0 0 0 0 0 2 1 0 1 1 3 0 0 1 0 0 0 945.1101 Sociology (BA) 0 0 0 0 0 0 2 2 1 1 12 6 1 1 1 1 0 0 2845.1101 Sociology, Applied (BS) 0 0 2 0 0 0 21 4 2 1 34 12 1 1 4 1 0 0 8313.1401 Teaching Engl to Speakers of Other Languages (C) 0 0 0 0 0 0 1 0 0 0 0 1 0 1 0 0 0 0 304.0301 Urban and Regional Planning (BS) 0 0 0 0 0 0 0 3 1 0 3 17 0 0 0 1 0 0 2505.0207 Women's Studies (BA) 0 0 0 0 0 0 0 0 0 0 0 0 1 0 0 0 0 0 1
Total 3 4 57 41 2 1 229 121 76 46 711 636 38 30 29 26 5 6 2,061
College of Business52.0801 Finance (C) 0 0 0 1 0 0 0 0 0 0 0 1 0 0 0 0 0 0 252.0801 Finance or General Business Admin (BSBA) (Total) 0 1 2 12 0 1 35 26 14 11 142 260 5 8 4 4 4 2 53152.0201 Management (BSBA) 0 6 7 8 0 2 62 82 27 40 371 698 7 19 4 8 3 8 1,35252.0305 Management Accounting (BSBA) 1 2 4 11 2 0 34 36 14 7 122 185 6 7 6 1 3 1 44252.1201 Management Information Systems (BSBA) 0 0 1 6 0 1 18 21 6 5 39 99 3 6 1 2 1 2 21152.1201 Management Information Systems (C) 0 0 0 0 0 0 1 0 0 0 0 1 0 0 0 0 0 0 252.1401 Marketing (BSBA) 1 2 4 5 0 1 19 36 16 10 177 257 8 9 0 4 2 3 55452.0203 Supply Chain Management (C) 0 0 0 0 0 0 0 0 0 0 0 1 0 0 0 0 0 0 1
Total 2 11 18 43 2 5 169 201 77 73 851 1,502 29 49 15 19 13 16 3,095
College of Education51.0999 Assistive Technology (C) 0 0 0 0 0 0 0 0 0 0 3 0 0 0 1 0 0 0 413.1013 Autism (C) 0 0 0 0 0 0 0 0 0 0 1 0 0 0 0 0 0 0 113.1303 Business or Business & Mktg Education (BSBE) (Total) 0 0 1 1 0 0 7 7 0 1 21 30 2 0 1 1 0 0 7213.0407 Community College Instruction (C) 0 0 0 0 0 0 7 2 0 0 5 1 0 0 1 0 0 0 1613.0501 Distance Learning and Admin (C) 0 0 0 0 0 0 1 0 0 0 3 0 0 0 0 0 0 0 413.1202 Elementary Education (BS) 3 1 3 3 0 0 55 6 22 3 816 28 10 1 18 0 0 0 96913.1311 Elementary Mathematics Educ (C) 0 0 0 0 0 0 0 0 0 0 3 0 2 0 0 0 0 0 513.1305 English Education (BS) 0 0 0 0 0 0 3 3 2 0 40 10 0 2 1 0 0 0 6113.1318 History Education (BS) 0 0 0 0 0 0 5 3 1 0 46 50 2 3 0 1 0 0 11152.0407 Information Technologies (BSBE) 1 1 0 1 0 0 21 12 3 1 46 45 0 2 2 1 0 0 13613.1311 Mathematics Education (BS) 0 0 0 2 0 0 7 5 1 0 31 20 3 1 0 0 1 0 7113.1203 Middle Grades Education (BS) (Total) 0 0 1 0 1 0 16 4 1 2 60 13 0 1 1 0 0 0 10013.1316 Science Education (BS) 0 0 1 1 0 0 5 2 0 0 21 14 0 0 1 0 1 0 4613.1099 Special Educ, Adapted Curriculum (BS) 1 0 2 0 0 0 4 0 1 1 69 7 3 0 0 0 0 0 8813.1001 Special Educ, General Curriculum (BS) 2 0 0 0 0 0 10 1 3 1 104 9 1 0 0 0 1 0 13213.0501 Special Endorsement in Computer Education (C) 0 0 0 0 0 0 4 0 0 1 12 5 0 0 0 1 0 0 23
Total 7 2 8 8 1 0 145 45 34 10 1,281 232 23 10 26 4 3 0 1,839
Continued Next Page
47

Unit Women Men Women Men Women Men Women Men Women Men Women Men Women Men Women Men Women Men All
Unduplicated Undergraduate Fall 2013 Enrollmentby Unit, Primary Major, Ethnicity, and Gender
Two or more races
Race & ethnicity
unkNon-Res
AlienAm Indian
Alaskan Nat Asian
Nat Hawaiian
Pacific Islander
Black or African
Amer, Non-Hisp Hispanic
White, Non-Hisp
College of Fine Arts & Communication50.0903 Advanced Performance Studies (C) 0 0 0 0 0 0 0 0 0 0 0 1 0 0 0 0 0 0 113.1302 Art Education (BFA) 0 0 0 0 0 0 3 0 3 0 43 6 2 1 2 0 0 0 6050.0703 Art History and Appreciation (BA) 0 0 1 0 0 0 0 1 0 0 8 1 0 0 0 0 0 0 1150.0702 Art, Fine/Studio Arts (BFA) 1 1 4 5 0 0 24 31 13 15 194 108 13 5 7 6 0 0 42709.0101 Communication (BS) 1 3 2 1 0 1 76 47 26 11 376 177 23 2 8 2 0 1 75750.0301 Dance Performance (BFA) 0 0 1 0 0 0 0 3 1 0 44 2 2 1 0 0 0 0 5413.1312 Music Education (BM) 1 0 1 1 0 0 6 11 2 4 50 42 1 5 0 0 0 0 12450.0903 Music Performance (BM) 0 0 1 0 0 0 2 6 3 1 29 29 4 0 0 1 2 1 7950.0904 Music Theory and Composition (BM) 0 0 0 0 0 0 2 1 0 0 1 8 0 0 0 0 0 0 1251.2305 Music Therapy (BM) 0 0 0 0 0 0 4 2 0 0 32 5 1 1 0 0 0 0 4550.0501 Theatre Arts (BA, BFA) 1 0 1 0 0 0 9 7 7 4 78 40 6 2 1 1 0 0 15713.1324 Theatre Arts or Dance Education (BFA) (Total) 0 0 0 0 0 0 0 0 0 0 23 3 0 0 0 0 0 0 26
Total 4 4 11 7 0 1 126 109 55 35 878 422 52 17 18 10 2 2 1,753
College of Health & Human Performance51.2309 Aquatic Therapy (C) 0 0 0 0 0 0 0 0 0 0 1 0 0 0 0 0 0 0 151.0913 Athletic Training (BS) 0 0 0 1 0 0 5 2 1 1 35 20 1 2 1 0 1 0 7051.0999 Biofeedback (C) 0 0 0 0 0 0 0 0 0 0 1 0 0 0 0 0 0 0 151.2202 Environmental Health (BS) 0 0 2 1 0 0 3 3 0 1 8 8 0 0 0 0 0 0 2626.0908 Exercise Physiology (BS) 0 0 0 2 0 0 18 10 2 2 90 60 0 3 1 1 0 0 18931.0599 Health Fitness Specialist (BS) 0 1 0 1 0 1 17 25 1 5 44 70 1 3 2 1 0 0 17213.1314 Physical Education (BS) 0 0 0 0 0 0 1 2 0 2 15 48 1 0 0 3 0 1 7351.2207 Public Health Studies (BS) 1 0 11 3 0 0 66 10 7 2 98 21 4 1 3 0 0 1 22831.0101 Recreation and Park Management (BS) 0 1 0 1 0 0 5 0 0 1 15 41 0 1 0 0 0 0 6551.2309 Recreational Therapy (BS) 0 0 4 0 0 0 12 2 3 1 79 6 1 0 1 0 0 0 10913.1307 School Health Education (BS) 0 0 0 0 0 0 2 4 0 0 6 4 0 0 0 0 0 0 1631.0599 Sports Studies (BS) 0 3 1 0 0 0 4 21 0 2 15 59 1 2 0 1 0 0 109
Total 1 5 18 9 0 1 133 79 14 17 407 337 9 12 8 6 1 2 1,059
College of Human Ecology13.1209 Birth to Kindergarten Teacher Education (BS) 0 0 1 0 0 0 11 0 2 0 45 0 1 0 2 0 0 0 6219.0706 Child Life (BS) 1 0 0 0 0 0 5 1 3 0 42 1 1 0 1 0 0 0 5543.0104 Criminal Justice (BS) 0 0 1 4 0 2 46 45 19 17 94 183 6 8 2 4 0 1 43219.0707 Family Community Services (BS) 2 0 0 0 0 0 50 9 7 0 114 3 4 0 2 0 0 0 19113.1308 Family and Consumer Sciences Education (BS) 0 0 0 0 0 0 3 0 0 0 10 0 1 0 0 0 0 0 1430.1101 Gerontology (C) 0 0 1 0 0 0 1 0 0 0 1 0 0 0 0 0 0 0 352.0901 Hospitality Management (BS) 1 1 3 1 2 0 27 11 10 4 216 69 2 2 8 1 0 0 35850.0408 Interior Design (BS) 0 0 0 0 0 0 7 0 0 0 37 4 3 0 2 0 1 0 5419.0901 Merchandising (BS) 1 0 1 0 0 0 19 1 9 0 111 1 5 0 2 0 1 0 15151.3101 Nutrition and Dietetics (BS) 0 0 0 0 0 0 2 1 3 0 29 1 0 0 1 0 1 0 3844.0701 Social Work (BSW) 0 0 5 0 0 0 34 5 4 1 68 6 3 1 5 0 0 0 132
Total 5 1 12 5 2 2 205 73 57 22 767 268 26 11 25 5 3 1 1,490
Continued Next Page
48

Unit Women Men Women Men Women Men Women Men Women Men Women Men Women Men Women Men Women Men All
Unduplicated Undergraduate Fall 2013 Enrollmentby Unit, Primary Major, Ethnicity, and Gender
Two or more races
Race & ethnicity
unkNon-Res
AlienAm Indian
Alaskan Nat Asian
Nat Hawaiian
Pacific Islander
Black or African
Amer, Non-Hisp Hispanic
White, Non-Hisp
School of Medicine51.2207 Ethnic and Rural Health Disparities (C) 0 0 0 0 0 0 0 0 0 0 0 0 0 0 0 0 0 0 0
College of Nursing51.1601 Nursing 5 1 7 4 0 0 58 2 16 6 486 55 10 0 26 1 2 0 679
College of Technology & Computer Science
11.0901 Computer Network Professional (C) 2 0 0 0 0 0 1 1 0 0 1 0 1 0 0 0 0 0 611.0701 Computer Science (BA, BS) 0 2 5 14 0 1 12 38 4 21 22 144 2 8 0 7 0 2 28215.9999 Construction Management (BS) 0 0 0 2 0 0 0 10 0 7 9 209 0 3 1 4 0 0 24515.1301 Design (BS) 0 1 3 1 0 0 1 1 0 3 9 47 0 2 0 3 0 1 7214.0101 Engineering (BS) 1 2 7 15 0 0 9 40 4 22 51 301 5 15 1 12 1 3 48915.0612 Industrial Distribution and Logistics (BS) 0 0 1 1 0 0 3 13 0 2 10 111 0 2 1 2 0 0 14615.0613 Industrial Engineering Technology (BS) 0 0 1 1 0 0 0 7 1 3 2 35 0 4 0 3 0 3 6015.0612 Industrial Technology (BS) 0 2 1 9 0 1 9 29 0 15 44 258 1 1 1 12 0 1 38411.1003 Information Assurance (C) 0 0 0 0 0 0 0 2 0 0 1 1 0 0 0 0 0 0 411.0103 Information and Computer Technology (BS) 0 1 1 10 0 0 5 34 0 14 11 111 0 9 0 5 0 1 20215.0702 Lean Six Sigma Black Belt (C) 0 0 1 1 0 0 1 2 0 0 1 6 0 0 0 0 0 0 1211.1004 Website Developer (C) 0 0 0 0 0 0 1 0 0 0 5 2 0 0 1 1 0 0 10
Total 3 8 20 54 0 2 42 177 9 87 166 1,225 9 44 5 49 1 11 1,912
General CollegeUndeclared Major 29 20 124 81 1 3 862 425 261 153 2,851 1,444 149 80 50 28 11 5 6,577
Non-Degree UndergraduateEarly College Second Life Program 1 0 0 1 0 0 46 23 3 0 45 22 0 0 5 6 0 0 152Exchange Students 0 0 0 0 0 0 0 0 0 1 0 0 0 0 0 0 39 34 74Post Baccalaureate Teacher Licensure 2 1 2 0 0 0 80 17 12 1 202 55 4 0 18 10 1 3 408Visiting Students 1 0 0 0 0 0 3 0 0 0 5 4 0 0 2 1 0 0 16
Total 4 1 2 1 0 0 129 40 15 2 252 81 4 0 25 17 40 37 650
Grand Total (All Majors) 66 57 293 254 8 15 2,189 1,278 621 453 8,851 6,239 356 254 241 169 81 83 21,508
Source: Fall 2013 Student Data File.Note: In unduplicated enrollment tables, students seeking a double major or dual degree are counted under their primary major only.
49

Unit Women Men Women Men Women Men Women Men Women Men Women Men Women Men Women Men Women Men All
College of Allied Health Sciences
51.0202 Audiology (AUD) 0 0 0 0 0 0 0 0 0 0 6 0 1 0 0 0 0 0 7
51.0204 Communication Sciences and Disorders (MS) 2 0 1 0 0 0 0 0 2 1 93 0 1 0 1 0 1 0 102
51.0204 Communication Sciences and Disorders (PHD) 0 0 0 0 0 0 0 0 0 0 3 2 0 0 0 0 2 2 9
51.2706 Health Informatics and Information Management (MS) 0 0 1 0 0 0 1 0 0 0 2 3 0 0 0 0 0 0 7
51.2306 Occupational Therapy (MSOT) 0 0 0 0 0 0 0 0 0 0 62 6 2 0 6 0 0 0 76
51.2308 Physical Therapy (DPT) 0 0 2 0 0 0 1 0 1 0 60 24 0 0 0 1 0 0 89
51.0912 Physician Assistant Studies (MS) 0 0 1 0 0 0 0 0 2 0 76 17 2 1 1 2 0 0 102
51.2310 Rehabilitation Counseling (MS) 0 0 1 0 0 0 1 1 0 0 7 0 2 0 0 0 0 0 12
51.2310 Rehabilitation Counseling Administration (PHD) 0 0 0 0 0 0 5 0 1 0 7 3 0 0 0 0 0 1 17
51.1501 Substance Abuse Clinical Counseling (MS) 0 0 0 0 0 0 6 1 2 0 39 10 1 0 1 0 0 0 60
Total 2 0 6 0 0 0 14 2 8 1 355 65 9 1 9 3 3 3 481
College of Arts & Sciences45.0201 Anthropology (MA) 0 0 0 0 0 0 0 0 1 1 17 3 0 0 2 0 0 0 24
45.0602 Applied and Resource Economics (MS) 0 0 0 0 0 0 0 1 0 0 1 6 0 0 0 0 1 2 11
26.0101 Biology (MS) 1 0 3 0 0 0 0 1 2 0 17 20 0 0 1 0 0 0 45
26.0203 Biomedical Physics (PHD) 0 0 0 4 0 0 1 1 0 1 1 8 0 1 0 2 2 1 22
40.0501 Chemistry (MS) 0 0 1 0 0 0 0 0 0 0 5 9 0 0 0 1 1 1 18
23.0101 English (MA) 0 0 1 0 0 0 12 2 1 1 75 31 5 2 5 2 0 1 138
45.0701 Geography (MA) 0 0 0 0 0 0 0 0 1 0 6 11 0 0 0 1 0 1 20
40.0601 Geology (MS) 0 0 0 0 0 0 0 0 1 0 13 26 0 0 0 0 0 0 40
42.2810 Health Psychology (PHD) 0 0 1 0 0 0 2 0 0 0 27 9 0 0 0 1 0 0 40
54.0101 History (MA) 0 0 0 0 0 0 2 0 2 0 13 16 0 1 1 0 0 0 35
30.2001 International Studies (MA) 0 0 0 0 0 0 1 1 0 0 10 5 1 0 0 0 0 0 18
30.9999 Maritime Studies (MA) 0 0 0 0 0 0 0 0 1 0 25 26 0 0 2 2 1 1 58
27.0101 Mathematics (MA) 0 0 0 0 0 0 0 1 0 0 4 6 0 0 1 0 0 1 13
26.0204 Molecular Biology and Biotechnology (MS) 0 0 0 0 0 0 0 1 1 1 3 3 0 0 1 1 1 1 13
40.0801 Physics (MS) 0 0 0 1 0 0 0 1 0 1 6 5 0 0 0 0 0 0 14
42.0101 Psychology (MA) 0 0 0 0 0 0 0 0 0 0 10 10 0 0 0 0 0 0 20
44.0401 Public Administration (MPA) 0 0 1 0 0 0 2 1 1 1 15 8 3 1 0 0 0 0 33
23.1303 Rhetoric Writing and Professional Comm (PhD) 0 0 0 0 0 0 1 2 0 0 12 4 0 0 0 2 0 0 21
42.2805 School Psychology (MA, CAS) 0 0 0 0 0 0 0 1 0 0 16 1 1 0 0 0 0 0 19
30.0601 Security Studies (MS) 0 0 0 1 0 0 0 0 0 1 4 19 0 0 0 0 0 0 25
45.1101 Sociology (MA) 1 0 0 0 0 0 5 0 0 0 8 3 0 0 0 0 0 0 17
Total 2 0 7 6 0 0 26 13 11 7 288 229 10 5 13 12 6 9 644
Continued Next Page
Black or African
Amer, Non-Hisp Hispanic
White, Non-Hisp
Unduplicated Graduate Fall 2013 Enrollmentby Unit, Major, Ethnicity, and Gender
Two or more races
Race & ethnicity unk
Non-ResAlien
Am Indian Alaskan Nat Asian
Nat HawaiianPacific
Islander
50

Unit Women Men Women Men Women Men Women Men Women Men Women Men Women Men Women Men Women Men All
Black or African
Amer, Non-Hisp Hispanic
White, Non-Hisp
Unduplicated Graduate Fall 2013 Enrollmentby Unit, Major, Ethnicity, and Gender
Two or more races
Race & ethnicity unk
Non-ResAlien
Am Indian Alaskan Nat Asian
Nat HawaiianPacific
Islander
College of Business52.0301 Accounting (MSA) 1 0 4 3 0 0 8 6 1 2 32 44 0 1 2 1 3 0 108
52.0201 Business Administration (MBA) 1 2 9 10 0 0 50 39 15 11 227 324 5 5 12 24 2 6 742
Total 2 2 13 13 0 0 58 45 16 13 259 368 5 6 14 25 5 6 850
College of Education13.0403 Adult Education (MAED) 2 0 0 0 0 0 2 1 0 0 22 12 1 0 1 0 0 0 41
13.1399 Business Education (MAED) 0 0 0 0 0 0 1 0 0 0 2 1 0 0 0 0 0 0 4
13.1101 Counselor Education (MS) 0 0 0 0 0 0 6 2 3 0 54 9 1 0 1 0 0 0 76
13.0401 Educational Administration and Supervision (EDS) 0 0 0 0 0 0 5 7 0 0 7 12 0 0 0 1 0 0 32
13.0401 Educational Leadership (EDD) 3 2 0 1 0 0 22 8 1 0 39 32 1 0 6 2 1 0 118
13.1202 Elementary Education (MAED) 0 0 0 0 0 0 2 1 0 0 32 1 0 0 0 0 0 0 36
13.1305 English Education (MAED) 0 0 0 0 0 0 1 0 0 0 1 1 0 0 0 0 0 0 3
13.1328 History Education (MAED) 0 0 0 0 0 0 1 0 0 0 4 3 0 0 1 0 0 0 9
13.0501 Instructional Technology (MS) 0 1 0 0 0 0 11 0 0 0 19 18 1 0 0 0 0 0 50
13.0501 Instructional Technology Education (MAED) 0 0 1 1 1 0 3 1 4 0 72 20 0 0 1 0 0 1 105
25.0101 Library Science (MLS) 6 0 1 0 0 0 7 1 2 0 138 10 3 0 8 1 0 0 177
13.1399 Marketing Education (MAED) 0 0 0 0 0 0 0 0 0 0 1 0 0 0 0 0 0 0 1
13.1299 Master of Arts in Teaching (MAT) (Total) 0 0 0 0 0 0 3 5 2 0 21 9 0 0 0 0 0 0 40
13.1311 Mathematics Education (MAED) 0 0 0 0 0 0 1 0 0 1 15 5 0 0 0 0 0 0 22
13.1203 Middle Grades Education (MAED) 0 0 0 0 0 0 0 0 0 0 3 2 1 0 1 0 0 0 7
13.1315 Reading Education (MAED) 0 0 1 0 0 0 3 0 4 0 71 1 1 0 2 0 0 0 83
13.0401 School Administration (MSAM) 1 0 0 0 0 0 17 3 3 2 70 21 0 0 1 0 0 0 118
13.1316 Science Education (MAED) 1 0 0 0 0 0 0 1 0 0 16 5 0 0 2 0 0 0 25
13.1011 Special Educ, Behavioral/Emotional Disabilities (MAED) 0 0 0 0 0 0 0 0 0 0 6 0 0 0 0 1 0 0 7
13.1011 Special Educ, Learning Disabilities (MAED) 0 0 0 0 0 0 1 0 0 0 15 3 0 0 0 0 0 0 19
13.1011 Special Educ, Low Incidence Disabilities (MAED) 0 0 0 0 0 0 1 0 0 0 6 1 0 0 0 0 0 0 8
13.1006 Special Educ, Mental Disabilities (MAED) 0 0 0 0 0 0 0 0 0 0 3 0 0 0 0 0 0 0 3
13.1319 Vocational Education (MS) 0 0 0 0 0 0 3 0 0 0 3 3 0 0 1 0 0 0 10
Total 13 3 3 2 1 0 90 30 19 3 620 169 9 0 25 5 1 1 994
College of Fine Arts & Communication
13.1302 Art Education (MAED) 0 0 0 0 0 0 2 1 0 0 9 3 0 0 0 0 0 0 15
50.0702 Art, Fine/Studio Arts (MFA) 0 0 0 0 0 0 0 1 0 0 17 8 2 0 2 1 1 0 32
09.0101 Communication (MA) 0 0 0 0 0 0 2 1 1 0 8 4 0 0 0 0 0 0 16
13.1312 Music Education (MM) 0 0 0 0 0 0 1 0 0 0 8 3 0 0 0 0 0 0 12
50.0903 Music Performance (MM) 0 0 1 1 0 0 1 0 2 1 12 15 0 0 1 0 0 1 35
50.0904 Music Theory and Composition (MM) 0 0 0 0 0 0 0 0 0 0 1 2 0 0 0 0 0 0 3
Total 0 0 1 1 0 0 6 3 3 1 55 35 2 0 3 1 1 1 113
Continued Next Page
51

Unit Women Men Women Men Women Men Women Men Women Men Women Men Women Men Women Men Women Men All
Black or African
Amer, Non-Hisp Hispanic
White, Non-Hisp
Unduplicated Graduate Fall 2013 Enrollmentby Unit, Major, Ethnicity, and Gender
Two or more races
Race & ethnicity unk
Non-ResAlien
Am Indian Alaskan Nat Asian
Nat HawaiianPacific
Islander
College of Health & Human Performance 0 0
26.0999 Bioenergetics and Exercise Science (PHD) 0 0 0 1 0 0 1 0 0 0 1 7 0 0 0 0 1 1 12
51.2202 Environmental Health (MSEH) 0 0 1 0 0 0 1 2 0 1 9 7 0 0 0 1 2 0 24
31.0505 Exercise Sport Science (MS) 0 1 0 0 0 0 5 2 2 3 26 24 0 0 0 0 1 1 65
51.2207 Health Education and Promotion (MA) 0 0 0 0 0 0 9 1 2 0 38 6 1 0 0 0 0 0 57
13.1307 Health Education and Promotion (MAED) 0 0 0 0 0 0 2 1 1 0 10 4 1 1 0 1 0 0 21
13.1314 Physical Education (MAED) 0 0 1 0 0 0 0 1 1 1 6 10 0 0 0 0 0 0 20
31.0101 Recreation and Park Administration (MS) 0 0 0 0 0 0 4 0 0 0 6 1 0 0 0 0 0 0 11
51.2309 Recreational Therapy Administration (MS) 0 0 0 0 0 0 2 0 0 0 7 3 0 0 0 0 0 0 12
Total 0 1 2 1 0 0 24 7 6 5 103 62 2 1 0 2 4 2 222
College of Human Ecology
13.1209 Birth to Kindergarten Education (MAED) 2 0 0 0 0 0 0 0 0 0 8 0 1 0 0 0 0 0 11
19.0707 Child Development and Family Relations (MS) 0 0 0 0 0 0 3 0 0 0 17 0 0 0 1 0 0 0 21
43.0104 Criminal Justice (MS) 0 0 1 0 0 0 2 0 0 1 9 3 0 1 0 0 0 0 17
13.1399 Family and Consumer Sciences (MAED) 0 0 0 0 0 0 0 0 0 0 5 1 0 0 0 0 0 0 6
51.1505 Marriage and Family Therapy (MS) 0 0 1 0 0 0 0 0 1 0 12 5 1 0 0 0 0 0 20
51.1505 Medical Family Therapy (PHD) 0 0 0 0 0 0 0 0 0 1 8 2 0 0 0 0 0 0 11
19.0501 Nutrition (MS) 0 0 1 0 0 0 1 0 1 0 28 1 0 0 1 0 0 0 33
44.0701 Social Work (MSW) 2 0 2 0 0 0 36 2 3 0 68 11 1 1 0 1 0 0 127
Total 4 0 5 0 0 0 42 2 5 2 155 23 3 2 2 1 0 0 246
College of Technology & Computer Science
11.0701 Computer Science (MS) 0 0 2 0 0 0 1 1 0 0 0 4 0 0 0 1 2 7 18
15.1001 Construction Management (MCM) 0 1 0 0 0 0 0 1 0 0 2 13 0 0 0 2 0 2 21
11.1099 Network Technology (MS) 0 0 0 1 0 0 1 2 1 2 1 12 1 1 0 1 0 1 24
51.2206 Occupational Safety (MS) 0 0 0 0 0 0 1 0 2 1 2 12 0 0 0 1 0 2 21
14.0903 Software Engineering (MS) 0 0 1 5 0 0 1 5 0 0 1 20 0 0 1 0 2 4 40
15.0612 Technology Systems (MS) 1 1 0 0 0 1 1 5 1 2 7 44 1 0 0 4 0 0 68
Total 1 2 3 6 0 1 5 14 4 5 13 105 2 1 1 9 4 16 192
Continued Next Page
52

Unit Women Men Women Men Women Men Women Men Women Men Women Men Women Men Women Men Women Men All
Black or African
Amer, Non-Hisp Hispanic
White, Non-Hisp
Unduplicated Graduate Fall 2013 Enrollmentby Unit, Major, Ethnicity, and Gender
Two or more races
Race & ethnicity unk
Non-ResAlien
Am Indian Alaskan Nat Asian
Nat HawaiianPacific
Islander
School of Medicine
26.0401 Anatomy and Cell Biology (PHD) 0 0 0 0 0 0 0 0 0 0 4 3 0 0 1 0 1 1 10
26.0202 Biochemistry and Molecular Biology (PHD) 0 0 1 0 0 0 0 0 0 0 4 3 0 0 0 0 1 0 9
26.0102 Biomedical Science (MS) 0 0 0 0 0 0 0 0 0 0 2 7 0 1 0 0 0 1 11
26.9999 Interdisciplinary Biological Science (PHD) 0 0 1 3 0 0 1 0 1 0 8 7 0 0 0 0 2 5 28
51.1201 Medicine (MD) 2 3 27 18 0 0 31 9 8 5 87 114 3 3 2 11 0 0 323
26.0503 Microbiology and Immunology (PHD) 0 0 1 1 0 0 0 0 0 0 3 6 0 0 0 0 0 3 14
26.1007 Pharmacology and Toxicology (PHD) 0 0 0 1 0 0 0 0 0 0 2 5 1 0 0 1 4 1 15
26.0901 Physiology (PHD) 0 0 0 0 0 0 0 0 0 0 5 6 0 0 0 0 1 0 12
51.2201 Public Health (MPH) 1 0 6 1 0 0 13 5 3 0 34 18 1 1 0 1 0 0 84
Total 3 3 36 24 0 0 45 14 12 5 149 169 5 5 3 13 9 11 506
School of Dental Medicine51.0401 Dental Medicine (DMD) 1 0 9 5 0 0 11 6 1 5 50 63 1 2 0 0 0 0 154
Total 1 0 9 5 0 0 11 6 1 5 50 63 1 2 0 0 0 0 154
College of Nursing
51.3805 Adult Gerontology Nurse Practitioner (C) 0 0 0 0 0 0 6 0 0 0 6 1 0 0 0 0 0 0 13
51.3813 Clinical Nurse Specialist (C) 0 0 0 0 0 0 2 0 0 0 4 0 1 0 0 0 0 0 7
51.3805 Family Nurse Practitioner (C) 0 0 0 0 0 0 1 0 0 0 7 0 0 0 1 0 0 0 9
51.3806 Neonatal Nurse Practitioner (C) 0 0 0 0 0 0 0 0 0 0 3 0 0 0 0 0 0 0 3
51.3807 Nurse Midwifery (C) 0 0 0 0 0 0 1 0 0 0 3 0 0 0 0 0 0 0 4
51.3899 Nursing (MSN) 4 0 10 1 0 0 54 2 5 1 373 33 5 0 16 3 1 0 508
51.3808 Nursing (PHD) 2 0 0 0 0 0 3 0 0 0 18 4 2 0 1 0 0 0 30
51.3817 Nursing Education (C) 0 0 0 0 0 0 1 0 0 0 1 0 0 0 0 0 0 0 2
51.3802 Nursing Leadership (C) 0 0 0 0 0 0 0 0 0 0 1 0 0 0 0 0 0 0 1
51.3818 Nursing Practice (DNP) 1 0 0 1 0 0 0 1 0 0 15 1 0 0 0 0 0 0 19
Total 7 0 10 2 0 0 68 3 5 1 431 39 8 0 18 3 1 0 596
Research & Graduate Studies
30.9999 Coastal Resources Management (PHD) 1 0 0 0 0 0 1 0 1 1 12 10 0 0 2 0 2 1 31
30.9999 Sustainable Tourism (MS) 0 0 0 0 0 0 1 0 0 0 3 9 0 0 0 0 1 0 14
Total 1 0 0 0 0 0 2 0 1 1 15 19 0 0 2 0 3 1 45
Non-Degree Seeking 3 0 6 3 0 0 21 20 7 6 155 86 1 1 13 13 1 0 336
Grand Total 39 11 101 63 1 1 412 159 98 55 2,648 1,432 57 24 103 87 38 50 5,379
Source: Student Data File, Fall 2013.Note: In unduplicated enrollment tables, students seeking a double major or dual degree are counted under their primary major only.
53

Unit 2009 2010 2011 2012 2013
College of Allied Health SciencesBachelor's
51.1005 Clinical Laboratory Science (BS) 26 25 31 32 3451.0706 Health Information Management (BS) 45 18 24 10 051.0701 Health Services Management (BS) 221 189 161 144 15351.2310 Rehabilitation Services (BS) 38 51 52 57 4851.0204 Speech and Hearing Sciences (BS) 34 32 61 31 60
Total 364 315 329 274 295Post Baccaleurate Certificate
51.0999 Assistive Technology (C) 5 2 18 13 -44.0401 Community Health Administration (C) 0 1 10 6 451.0701 Health Care Administration (C) 14 21 26 36 3052.0201 Health Care Management (C) 41 36 53 43 4451.2706 Health Informatics (C) 9 11 24 26 3251.2310 Rehabilitation Counseling (C) 1 0 1 10 1551.1501 Substance Abuse Counseling (C) 18 36 40 64 5051.2399 Vocational Evaluation (C) 1 1 2 2 11
Total 89 108 174 200 186
Total Undergraduate Program Enrollment 453 423 503 474 481Less Double Majors and Dual Degrees 85 53 67 73 88Total Undergraduate Unduplicated Headcount 368 370 436 401 393
Master's51.0204 Communication Sciences and Disorders (MS) 114 121 123 111 10251.2706 Health Informatics and Information Management (MS) - - - - 751.2306 Occupational Therapy (MSOT) 62 61 66 72 7651.0912 Physician Assistant Studies (MS) 98 94 97 98 10251.2310 Rehabilitation Counseling (MS) 46 47 23 20 1351.1501 Substance Abuse Clinical Counseling (MS) 20 20 43 55 6051.2310 Vocational Evaluation (MS) 5 1 0 1 1
Total 345 344 352 357 361Doctoral - Research/Scholarship
51.0204 Communication Sciences and Disorders (PHD) 15 13 7 9 1651.2310 Rehabilitation Counseling Administration (PHD) 12 19 22 19 17
Total 27 32 29 28 33Doctoral - Professional
51.0202 Audiology (AUD) 3 6 8 10 751.2308 Physical Therapy (DPT) 87 85 86 90 89
Total 90 91 94 100 96
Total Graduate Program Enrollment 462 467 475 485 490Less Double Majors and Dual Degrees 9 2 19 11 9Total Graduate Unduplicated Headcount 453 465 456 474 481
College of Allied Health Total Program Enrollment 915 890 978 959 971Less Double Majors and Dual Degrees 94 55 86 84 97College of Allied Health Total Unduplicated Headcount 821 835 892 875 874
Total Fall Enrollment in Academic Programsby Unit, Level, Degree Intent, and Major (CIP)
Continued Next Page
54

Unit 2009 2010 2011 2012 2013
Total Fall Enrollment in Academic Programsby Unit, Level, Degree Intent, and Major (CIP)
Thomas Harriot College of Arts & SciencesBachelor's
05.0201 African and African American Studies (BA) 0 0 1 0 145.0201 Anthropology (BA) 48 64 73 69 10440.0499 Atmospheric Sciences, Applied (BS) 0 8 12 18 1326.0202 Biochemistry (BS) 42 41 49 48 3826.0101 Biology (BS) 387 445 470 382 45940.0501 Chemistry (BA, BS) 138 140 157 139 12845.0601 Economics (BA, BS) 139 154 174 164 15923.0101 English (BA) 168 181 196 152 15616.0901 French (BA) 12 14 20 12 1513.1325 French Education (BS) 0 0 1 1 211.0401 Geographic Information Science and Technology (BS) 0 0 4 4 445.0701 Geography (BA) 4 4 7 8 1345.0701 Geography, Applied (BS) 29 35 26 21 2340.0601 Geology (BS) 33 36 62 66 7016.0501 German (BA) 15 20 33 26 1813.1326 German Education (BS) 2 0 0 0 016.0905 Hispanic Studies (BA) 0 65 102 59 5513.1330 Hispanic Studies Education (BS) 12 21 27 19 1754.0101 History (BA) 79 87 90 106 13327.0101 Mathematics (BA, BS) 51 40 59 60 6024.0101 Multidisciplinary Studies (BA, BS) 65 66 109 108 8938.0101 Philosophy (BA) 33 30 49 37 3540.0801 Physics (BA, BS) 14 21 18 20 2540.0801 Physics, Applied (BSAP) 4 0 0 3 545.1001 Political Science (BA, BS) 181 159 193 146 13042.0101 Psychology (BA) 360 349 458 432 48354.0105 Public History (BS) 8 8 4 5 1045.1101 Sociology (BA) 14 14 19 22 3145.1101 Sociology, Applied (BS) 56 60 67 70 8404.0301 Urban and Regional Planning (BS) 33 29 32 34 2705.0207 Women's Studies (BA) 4 1 2 1 1
Total 1,931 2,092 2,514 2,232 2,388Post Baccaleurate Certificate
23.1303 Business and Technical Communication (C) 14 15 22 16 1804.0401 Development and Environmental Planning (C) 2 1 0 1 052.0201 Economic Development (C) 0 3 4 3 111.0401 Geographic Information Science and Technology (C) 0 0 0 2 216.0905 Hispanic Studies (C) 2 0 3 3 040.0605 Hydrogeology and Environmental Geology (C) 0 14 12 10 1113.0701 International Teaching (C) 0 1 0 0 130.9999 Multicultural and Transnational Literature (C) 5 3 11 11 1230.0501 Security Studies (C) 18 19 25 20 2027.0501 Statistics (C) 1 0 0 0 013.1401 Teaching Engl to Speakers of Other Languages (C) 0 0 7 9 6
Total 42 56 84 75 71
Total Undergraduate Program Enrollment 1,973 2,148 2,598 2,307 2,459Less Double Majors and Dual Degrees 240 312 441 363 398Total Undergraduate Unduplicated Headcount 1,733 1,836 2,157 1,944 2,061
Continued Next Page
55

Unit 2009 2010 2011 2012 2013
Total Fall Enrollment in Academic Programsby Unit, Level, Degree Intent, and Major (CIP)
Master's45.0201 Anthropology (MA) 23 26 21 21 2445.0602 Applied and Resource Economics (MS) 12 10 10 10 1126.0101 Biology (MS) 52 46 44 45 4540.0501 Chemistry (MS) 20 17 17 15 1842.2801 Clinical Psychology (MA) 5 3 3 7 123.0101 English (MA) 134 133 142 139 13845.0701 Geography (MA) 21 17 22 28 2040.0601 Geology (MS) 24 26 36 38 4054.0101 History (MA) 32 31 33 36 3530.2001 International Studies (MA) 37 38 30 16 1930.9999 Maritime Studies (MA) 40 46 54 51 5827.0101 Mathematics (MA) 16 21 24 20 1426.0204 Molecular Biology and Biotechnology (MS) 23 29 22 18 1340.0801 Physics (MS) 17 22 23 17 1442.0101 Psychology (MA) 39 39 36 25 2644.0401 Public Administration (MPA) 33 39 37 29 3342.2805 School Psychology (MA) 20 20 21 20 1930.0601 Security Studies (MS) 0 2 18 23 2545.1101 Sociology (MA) 18 21 20 14 17
Total 566 586 613 572 570
Intermediate/Specialist/Post Master's Certificate42.2805 School Psychology (CAS) 1 0 0 0 19
Total 1 0 0 0 19
Doctoral - Research/Scholarship26.0203 Biomedical Physics (PHD) 21 20 20 23 2242.2810 Health Psychology (PHD) 23 29 30 35 4023.1303 Rhetoric Writing and Professional Comm (PHD) 25 29 27 27 21
Total 69 78 77 85 83
Total Graduate Program Enrollment 636 664 690 657 672Less Double Majors and Dual Degrees 2 2 4 8 28Total Graduate Unduplicated Headcount 634 662 686 649 644
College of Arts & Sciences Total Program Enrollment 2,609 2,812 3,288 2,964 3,131Less Double Majors and Dual Degrees 242 314 445 371 426College of Arts & Sciences Total Unduplicated Headcount 2,367 2,498 2,843 2,593 2,705
Continued Next Page
56

Unit 2009 2010 2011 2012 2013
Total Fall Enrollment in Academic Programsby Unit, Level, Degree Intent, and Major (CIP)
College of BusinessBachelor's
52.0301 Accounting (BSA) 6 1 0 0 052.0801 Finance or General Business Admin (BSBA) (Total) 301 298 357 307 55552.0201 Management (BSBA) 1,597 1,605 1,457 1,423 1,36752.0305 Management Accounting (BSBA) 447 445 404 443 45252.1201 Management Information Systems (BSBA) 149 162 199 214 21952.1401 Marketing (BSBA) 557 507 540 536 570
Total 3,057 3,018 2,957 2,923 3,163Post Baccaleurate Certificate
52.0801 Finance (C) 47 48 65 41 3652.1101 International Management (C) 3 2 4 2 352.1201 Management Information Systems (C) 27 24 32 24 3052.1401 Marketing (C) - - - 8 2252.0807 Professional Investment Mgmt and Operations (C) 2 1 3 2 052.0206 School Business Management (C) 0 2 1 0 052.0203 Supply Chain Management (C) 14 14 20 16 1952.1601 Tax (C) 3 3 3 1 0
Total 96 94 128 94 110
Total Undergraduate Program Enrollment 3,153 3,112 3,085 3,017 3,273Less Double Majors and Dual Degrees 116 124 183 170 178Total Undergraduate Unduplicated Headcount 3,037 2,988 2,902 2,847 3,095
Master's52.0301 Accounting (MSA) 124 138 115 119 10852.0201 Business Administration (MBA) 766 793 796 797 745
Total 890 931 911 916 853
Total Graduate Program Enrollment 890 931 911 916 853Less Double Majors and Dual Degrees 4 1 2 1 3Total Graduate Unduplicated Headcount 886 930 909 915 850
College of Business Total Program Enrollment 4,043 4,043 3,996 3,933 4,126Less Double Majors and Dual Degrees 120 125 185 171 181College of Business Total Unduplicated Headcount 3,923 3,918 3,811 3,762 3,945
Continued Next Page
57

Unit 2009 2010 2011 2012 2013
Total Fall Enrollment in Academic Programsby Unit, Level, Degree Intent, and Major (CIP)
College of EducationBachelor's
13.1303 Business or Business & Mktg Education (BSBE) (Total) 19 37 28 64 7213.1202 Elementary Education (BS) 654 908 1,151 1,095 97113.1305 English Education (BS) 42 84 87 80 6113.1318 History Education (BS) 39 106 118 122 11152.0407 Information Technologies (BSBE) 248 219 191 160 13613.1311 Mathematics Education (BS) 40 73 79 82 7213.1203 Middle Grades Education (BS) (Total) 71 96 103 89 10013.1316 Science Education (BS) 11 28 33 46 4713.1099 Special Education, Adapted Curriculum (BS) 22 52 84 84 8813.1001 Special Education, General Curriculum (BS) 66 78 115 120 134
Total 1,212 1,681 1,989 1,942 1,792Post Baccaleurate Certificate
51.0999 Assistive Technology (C) - - - - 513.1013 Autism (C) 6 3 7 4 413.0407 Community College Instruction (C) 13 13 23 33 3713.1099 Deaf-Blindness (C) 1 1 1 0 013.0501 Distance Learning and Admin (C) 5 13 10 18 713.1311 Elementary Mathematics Education (C) 0 0 23 8 513.0501 Special Endorsement in Computer Education (C) 12 6 17 25 2313.0501 Virtual Reality in Education and Training (C) 0 2 1 0 0
Total 37 38 82 88 81
Total Undergraduate Program Enrollment 1,249 1,719 2,071 2,030 1,873Less Double Majors and Dual Degrees 12 13 28 32 34Total Undergraduate Unduplicated Headcount 1,237 1,706 2,043 1,998 1,839
Master's13.0403 Adult Education (MAED) 40 35 38 41 4113.1399 Business Education (MAED) 12 12 8 6 413.1101 Counselor Education (MS) 104 102 108 97 7613.1202 Elementary Education (MAED) 73 59 44 36 3613.1305 English Education (MAED) 10 8 11 5 313.1328 History Education (MAED) 11 7 6 7 913.0501 Instructional Technology (MS) 66 59 54 52 5013.0501 Instructional Technology Education (MAED) 141 109 96 105 10525.0101 Library Science (MLS) 339 288 204 194 17713.1399 Marketing Education (MAED) 0 0 0 0 113.1299 Master of Arts in Teaching (MAT) (Total) 75 61 65 55 4013.1311 Mathematics Education (MAED) 15 28 36 23 2213.1203 Middle Grades Education (MAED) 21 19 11 15 713.1315 Reading Education (MAED) 72 72 74 63 8313.0401 School Administration (MSAM) 195 171 173 141 11813.1316 Science Education (MA) 4 5 6 3 013.1316 Science Education (MAED) 39 40 35 37 2513.1011 Special Education, Behaviroal/Emotional Disable (MAED) 4 9 7 7 713.1011 Special Education, Learning Disable (MAED) 34 44 32 30 1913.1011 Special Education, Low Incidence Disable (MAED) 38 37 31 15 813.1006 Special Education, Mental Disable (MAED) 2 4 5 4 313.1319 Vocational Education (MS) 22 14 17 19 10
Total 1,317 1,183 1,061 955 844Intermediate/Specialist/Post Master's Certificate
13.0401 Education Administration and Supervision (EDS) 26 25 20 33 32Total 26 25 20 33 32
Doctoral - Research/Scholarship13.0401 Educational Leadership (EDD) 98 125 103 121 118
Total 98 125 103 121 118
Total Graduate Program Enrollment 1,441 1,333 1,184 1,109 994Less Double Majors and Dual Degrees 3 1 0 1 0Total Graduate Unduplicated Headcount 1,438 1,332 1,184 1,108 994
College of Education Total Program Enrollment 2,690 3,052 3,255 3,139 2,867Less Double Majors and Dual Degrees 15 14 28 33 34College of Education Total Unduplicated Headcount 2,675 3,038 3,227 3,106 2,833
Continued Next Page
58

Unit 2009 2010 2011 2012 2013
Total Fall Enrollment in Academic Programsby Unit, Level, Degree Intent, and Major (CIP)
College of Fine Arts & CommunicationBachelor's
50.0701 Art (BA) 10 12 2 0 050.0702 Art, Fine/Studio Art (BFA) 527 522 516 454 43513.1302 Art Education (BFA) 49 91 80 85 6150.0703 Art History and Appreciation (BA) 16 26 29 18 1209.0101 Communication (BA) 25 5 0 0 009.0101 Communication (BS) 998 880 858 808 76150.0301 Dance Performance (BFA) 55 48 62 43 5913.1312 Music Education (BM) 60 140 143 138 12750.0903 Music Performance (BM) 103 100 92 85 8450.0904 Music Theory and Composition (BM) 11 12 15 8 1351.2305 Music Therapy (BM) 28 32 35 44 4650.0501 Theatre Arts (BA, BFA) 133 138 160 107 16413.1324 Theatre Arts or Dance Education (BFA) (Total) 36 56 37 31 28
Total 2,051 2,062 2,029 1,821 1,790Post Baccaleurate Certificate
50.0903 Advanced Performance Studies (C) 2 1 0 2 113.1312 Suzuki Pedagogy (C) 0 2 2 1 0
Total 2 3 2 3 1
Total Undergraduate Program Enrollment 2,053 2,065 2,031 1,824 1,791Less Double Majors and Dual Degrees 59 54 59 48 38Total Undergraduate Unduplicated Headcount 1,994 2,011 1,972 1,776 1,753
Master's13.1302 Art Education (MAED) 29 24 20 14 1550.0702 Art, Fine/Studio Art (MFA) 44 46 36 38 3209.0101 Communication (MA) 20 21 28 22 1613.1312 Music Education (MM) 25 19 12 8 1250.0903 Music Performance (MM) 41 30 24 31 3650.0904 Music Theory and Composition (MM) 5 1 2 3 3
Total 164 141 122 116 114
Total Graduate Program Enrollment 164 141 122 116 114Less Double Majors and Dual Degrees 1 0 0 0 1Total Graduate Unduplicated Headcount 163 141 122 116 113
College of Fine Arts & Comm Total Program Enrollment 2,217 2,206 2,153 1,940 1,905Less Double Majors and Dual Degrees 60 54 59 48 39College of Fine Arts & Comm Total Unduplicated Headcount 2,157 2,152 2,094 1,892 1,866
Continued Next Page
59

Unit 2009 2010 2011 2012 2013
Total Fall Enrollment in Academic Programsby Unit, Level, Degree Intent, and Major (CIP)
College of Health and Human PerformanceBachelor's
51.0913 Athletic Training (BS) 40 53 70 75 7051.2202 Environmental Health (BS) 32 36 28 24 2626.0908 Exercise Physiology (BS) 150 138 209 162 19026.0908 Exercise and Sport Science (BA) 8 6 3 0 031.0599 Health Fitness Specialist (BS) 136 119 187 182 17413.1314 Physical Education (BS) 59 63 76 72 7351.2207 Public Health Studies (BS) 111 105 172 177 22831.0101 Recreation and Park Mgmt (BS) 78 76 74 74 6651.2309 Recreational Therapy (BS) 124 105 142 121 10913.1307 School Health Education (BS) 18 24 30 29 2031.0599 Sports Studies (BS) 51 44 135 111 109
Total 807 769 1,126 1,027 1,065Post Baccaleurate Certificate
51.2309 Aquatic Therapy (C) 0 0 2 0 151.0999 Biofeedback (C) 2 1 3 7 213.1314 Physical Education Clinical Supervison (C) 0 0 3 5 131.0505 Sports Management (C) 5 3 11 11 11
Total 7 4 19 23 15
Total Undergraduate Program Enrollment 814 773 1,145 1,050 1,080Less Double Majors and Dual Degrees 10 11 34 34 21Total Undergraduate Unduplicated Headcount 804 762 1,111 1,016 1,059
Master's51.0913 Athletic Training (MS) 4 4 0 0 051.2202 Environmental Health (MSEH) 28 29 33 31 2431.0505 Exercise Sport Science (MS) 89 67 66 66 6651.2207 Health Education and Promotion (MA) 85 85 85 77 5713.1307 Health Education and Promotion (MAED) 69 45 37 30 2113.1314 Physical Education (MAED) 25 34 28 29 2031.0101 Recreation and Park Administration (MS) 23 23 20 17 1151.2309 Recreational Therapy Administration (MS) 15 17 13 11 12
Total 338 304 282 261 211Doctoral - Research/Scholarship
26.0999 Bioenergetics and Exercise Sci (PHD) 14 14 13 14 12Total 14 14 13 14 12
Total Graduate Program Enrollment 352 318 295 275 223Less Double Majors and Dual Degrees 0 0 1 1 1Total Graduate Unduplicated Headcount 352 318 294 274 222
College of HHP Total Program Enrollment 1,166 1,091 1,440 1,325 1,303Less Double Majors and Dual Degrees 10 11 35 35 22College of HHP Total Unduplicated Headcount 1,156 1,080 1,405 1,290 1,281
Continued Next Page
60

Unit 2009 2010 2011 2012 2013
Total Fall Enrollment in Academic Programsby Unit, Level, Degree Intent, and Major (CIP)
College of Human EcologyBachelor's
13.1209 Birth to Kindergarten Teacher Education (BS) 58 73 71 70 6219.0706 Child Life (BS) 93 83 68 79 5643.0104 Criminal Justice (BS) 385 349 459 417 43619.0707 Family Community Services (BS) 244 194 219 199 20213.1308 Family and Consumer Science Education (BS) 11 23 26 15 1452.0901 Hospitality Management (BS) 205 222 308 324 35850.0408 Interior Design (BS) 82 47 42 37 5419.0901 Merchandising (BS) 116 77 170 166 15651.3101 Nutrition and Dietetics (BS) 56 46 56 51 3944.0701 Social Work (BSW) 148 169 155 159 133
Total 1,398 1,283 1,574 1,517 1,510Post Baccaleurate Certificate
44.0701 Child Welfare Studies (C) 1 1 1 0 030.1101 Gerontology (C) 0 0 2 4 452.0901 Hospitality Management (C) 5 5 6 4 451.1501 Substance Abuse (C) 2 0 9 3 0
Total 8 6 18 11 8
Total Undergraduate Program Enrollment 1,406 1,289 1,592 1,528 1,518Less Double Majors and Dual Degrees 21 27 35 25 28Total Undergraduate Unduplicated Headcount 1,385 1,262 1,557 1,503 1,490
Master's13.1209 Birth to Kindergarten Education (MAED) 21 25 25 17 1119.0707 Child Development and Family Relations (MS) 30 17 16 19 2143.0104 Criminal Justice (MS) 58 44 40 18 1713.1399 Family and Consumer Sciences (MAED) 7 13 8 3 651.1505 Marriage and Family Therapy (MS) 23 25 26 28 2019.0501 Nutrition (MS) 46 46 39 35 3344.0701 Social Work (MSW) 151 179 154 124 128
Total 336 349 308 244 236Doctoral - Research/Scholarship
51.1505 Medical Family Therapy (PHD) 15 12 14 9 11Total 15 12 14 9 11
Total Graduate Program Enrollment 351 361 322 253 247Less Double Majors and Dual Degrees 0 0 0 1 1Total Graduate Unduplicated Headcount 351 361 322 252 246
College of Human Ecology Total Program Enrollment 1,757 1,650 1,914 1,781 1,765Less Double Majors and Dual Degrees 21 27 35 26 29College of Human Ecology Total Unduplicated Headcount 1,736 1,623 1,879 1,755 1,736
Continued Next Page
61

Unit 2009 2010 2011 2012 2013
Total Fall Enrollment in Academic Programsby Unit, Level, Degree Intent, and Major (CIP)
College of NursingBachelor's
51.3801 Nursing (BSN) 616 614 636 673 679Total 616 614 636 673 679
Total Undergraduate Program Enrollment 616 614 636 673 679Less Double Majors and Dual Degrees 0 0 0 0 0Total Undergraduate Unduplicated Headcount 616 614 636 673 679
Master's51.3899 Nursing (MSN) 466 491 504 533 508
Total 466 491 504 533 508Intermediate/Specialist/Post Master's Certificate
51.3805 Adult Gerontology Nurse Practitioner (C) 4 5 7 6 1351.3813 Clinical Nurse Specialist (C) 4 3 4 5 751.3805 Family Nurse Practitioner (C) 11 5 9 10 951.3806 Neonatal Nurse Practitioner (C) 0 0 1 2 351.3804 Nurse Anesthesia (C) 0 0 1 1 051.3807 Nurse Midwifery (C) 0 4 4 4 451.3817 Nursing Education (C) 1 1 2 6 251.3802 Nursing Leadership (C) 0 2 2 1 1
Total 20 20 30 35 39Doctoral - Research/Scholarship
51.3808 Nursing (PHD) 31 29 28 30 30Total 31 29 28 30 30
Doctoral - Professional51.3818 Nursing Practice (DNP) - - - - 19
Total 0 0 0 0 19
Total Graduate Program Enrollment 517 540 562 598 596Less Double Majors and Dual Degrees 2 0 0 0 0Total Graduate Unduplicated Headcount 515 540 562 598 596
College of Nursing Total Program Enrollment 1,133 1,154 1,198 1,271 1,275Less Double Majors and Dual Degrees 2 0 0 0 0College of Nursing Total Unduplicated Headcount 1,131 1,154 1,198 1,271 1,275
Continued Next Page
62

Unit 2009 2010 2011 2012 2013
Total Fall Enrollment in Academic Programsby Unit, Level, Degree Intent, and Major (CIP)
College of Technology and Computer ScienceBachelor's
11.0701 Computer Science (BA, BS) 223 223 254 223 28315.9999 Construction Management (BS) 591 511 388 292 24615.1301 Design (BS) 125 117 106 69 7214.0101 Engineering (BS) 265 226 382 438 49215.0612 Industrial Distribution and Logistics (BS) 141 149 165 166 14715.0613 Industrial Engineering Tech (BS) 28 32 44 45 6015.0612 Industrial Technology (BS) 443 411 424 418 38411.0103 Information and Computer Tech (BS) 188 178 158 173 203
Total 2,004 1,847 1,921 1,824 1,887Post Baccaleurate Certificate
11.0901 Computer Network Professional (C) 0 5 7 5 611.1003 Information Assurance (C) 2 2 3 5 515.0702 Lean Six Sigma Black Belt (C) 3 9 20 20 2415.1501 Performance Improvement (C) 3 1 3 2 011.1004 Website Developer (C) 13 17 16 18 11
Total 21 34 49 50 46
Total Undergraduate Program Enrollment 2,025 1,881 1,970 1,874 1,933Less Double Majors and Dual Degrees 23 18 35 18 21Total Undergraduate Unduplicated Headcount 2,002 1,863 1,935 1,856 1,912
Master's11.0701 Computer Science (MS) 20 17 18 15 1815.1001 Construction Management (MCM) 19 17 25 26 2111.1099 Network Technology (MS) 0 0 0 0 2451.2206 Occupational Safety (MS) 23 24 23 28 2114.0903 Software Engineering (MS) 37 52 54 51 4115.0612 Technology Systems (MS) 122 129 119 86 68
Total 221 239 239 206 193
Total Graduate Program Enrollment 221 239 239 206 193Less Double Majors and Dual Degrees 3 2 2 0 1Total Graduate Unduplicated Headcount 218 237 237 206 192
College of Tech and Comp Sci Total Program Enrollment 2,246 2,120 2,209 2,080 2,126Less Double Majors and Dual Degrees 26 20 37 18 22College of Tech and Comp Sci Total Unduplicated Headcount 2,220 2,100 2,172 2,062 2,104
Continued Next Page
63

Unit 2009 2010 2011 2012 2013
Total Fall Enrollment in Academic Programsby Unit, Level, Degree Intent, and Major (CIP)
Brody School of MediciinePost Baccaleurate Certificate
51.2207 Ethnic and Rural Health Disparities (C) 0 2 1 9 3Total 0 2 1 9 3
Total Undergraduate Program Enrollment 0 2 1 9 3Less Double Majors and Dual Degrees 0 0 0 5 3Total Undergraduate Unduplicated Headcount 0 2 1 4 0
Master's26.0102 Biomedical Science (MS) 0 0 5 11 1151.2201 Public Health (MPH) 80 91 102 97 85
Total 80 91 107 108 96Doctoral - Research/Scholarship
26.0401 Anatomy and Cell Biology (PHD) 7 8 10 10 1026.0202 Biochemistry and Molecular Biology (PHD) 12 10 12 10 926.9999 Interdisc Biological Science (PHD) 28 31 26 26 2826.0503 Microbiology and Immunology (PHD) 14 14 15 16 1426.1007 Pharmacology and Toxicology (PHD) 15 15 13 15 1526.0901 Physiology (PHD) 9 10 11 11 12
Total 85 88 87 88 88Doctoral - Professional
51.1201 Medicine (MD) 304 308 308 319 323Total 304 308 308 319 323
Total Graduate Program Enrollment 469 487 502 515 507Less Double Majors and Dual Degrees 0 0 0 0 1Total Graduate Unduplicated Headcount 469 487 502 515 506
Brody School of Medicine Total Program Enrollment 469 489 503 524 510Less Double Majors and Dual Degrees 0 0 0 5 4Brody School of Medicine Total Unduplicated Headcount 469 489 503 519 506
School of Dental MedicineDoctoral - Professional
51.0401 Dental Medicine (DMD) - - 52 104 154Total 0 0 52 104 154
Total Graduate Program Enrollment 0 0 52 104 154Less Double Majors and Dual Degrees 0 0 0 0 0Total Graduate Unduplicated Headcount 0 0 52 104 154
School of Dental Medicine Total Program Enrollment 0 0 52 104 154Less Double Majors and Dual Degrees 0 0 0 0 0School of Dental Medicine Total Unduplicated Headcount 0 0 52 104 154
Continued Next Page
64

Unit 2009 2010 2011 2012 2013
Total Fall Enrollment in Academic Programsby Unit, Level, Degree Intent, and Major (CIP)
Research and Graduate StudiesMaster's
30.9999 Sustainable Tourism (MS) 0 4 7 13 14Total 0 4 7 13 14
Doctoral - Research/Scholarship30.9999 Coastal Resources Management (PHD) 25 32 36 37 31
Total 25 32 36 37 31
Total Graduate Program Enrollment 25 36 43 50 45Less Double Majors and Dual Degrees 0 0 1 1 0Total Graduate Unduplicated Headcount 25 36 42 49 45
Research and Graduate Studies Total Program Enrollment 25 36 43 50 45Less Double Majors and Dual Degrees 0 0 1 1 0Research and Graduate Studies Total Unduplicated Headcount 25 36 42 49 45
General CollegeUndeclared Major 7,545 7,581 6,249 6,712 6,577
Non-Degree UndergraduateEarly College Second Life Program 34 37 34 71 152Exchange Students 70 91 110 81 74Post Baccalaureate Teacher Licensure 633 540 446 416 408Visiting Students - - - - 16
Total 737 668 590 568 650
Non-Degree GraduateNon-Degree Graduate 692 611 429 389 336
East Carolina UniversityGrand Total Bachelor's Program Enrollment 20,985 21,262 21,324 20,945 21,146Grand Total Post Baccaleurate Certificate Program Enrollment 302 345 557 553 521Grand Total Non-Degree Undergraduate 737 668 590 568 650Less Double Majors and Dual Degrees 566 612 882 768 809Grand Total Undergraduate Unduplicated Headcount 21,458 21,663 21,589 21,298 21,508
Grand Total Master's Program Enrollment 4,723 4,663 4,506 4,281 4,000Grand Total Intermediate/Specialist Program Enrollment 47 45 50 68 90Grand Total Doctoral - Research/Scholarship Program Enrollment 364 410 387 412 406Grand Total Doctoral - Professional Program Enrollment 394 399 454 523 592Grand Total Non-Degree Graduate 692 611 429 389 336Less Double Majors and Dual Degrees 24 8 29 24 45Grand Total Graduate Unduplicated Headcount 6,196 6,120 5,797 5,649 5,379
East Carolina University Academic Program Enrollment 26,815 27,124 27,278 26,782 26,755East Carolina University Non-Degree Seeking 1,429 1,279 1,019 957 986Less Double Majors and Dual Degrees 590 620 911 792 854East Carolina University Unduplicated Headcount 27,654 27,783 27,386 26,947 26,887
Source: Student Data Files, Fall 2009 through Fall 2013.Note: Students seeking double majors or dual degrees are listed in Unduplicated Enrollment tables under primary major only.
65

Full- Part-Unit Second Major Women Men Women Men time time
College of Allied Health Sciences44.0401 Community Health Administration (C) 13.1307 Health Education and Promotion (MAED) 0 0 1 0 0 1 1
44.0401 Public Administration (MPA) 0 0 2 0 0 2 251.0701 Health Care Administration (C) 51.2207 Health Education and Promotion (MA) 0 0 0 1 0 1 1
51.2201 Public Health (MPH) 1 1 1 0 2 1 352.0201 Health Care Management (C) 52.0201 Business Administration (MBA) 8 5 14 14 13 28 4151.2706 Health Informatics (C) 52.0201 Business Administration (MBA) 0 0 1 0 0 1 151.2310 Rehabilitation Counseling (C) 51.1501 Substance Abuse Clinical Counseling (MS) 12 1 0 0 13 0 1351.1501 Substance Abuse Counseling (C) 13.1101 Counselor Education (MS) 3 1 7 1 4 8 12
51.2207 Health Education and Promotion (MA) 0 0 2 0 0 2 213.1315 Reading Education (MAED) 0 0 1 0 0 1 151.2310 Rehabilitation Counseling (MS) 1 0 0 0 1 0 151.1501 Substance Abuse Clinical Counseling (MS) 2 0 0 0 2 0 2
51.2399 Vocational Evaluation (C) 13.1101 Counselor Education (MS) 0 1 0 0 1 0 151.2310 Rehabilitation Counseling (MS) 3 0 0 0 3 0 351.1501 Substance Abuse Clinical Counseling (MS) 4 0 0 0 4 0 4
51.2310 Rehabilitation Counseling (MS) 51.1501 Substance Abuse Clinical Counseling (MS) 0 0 1 0 0 1 151.2310 Vocational Evaluation (MS) 51.1501 Substance Abuse Clinical Counseling (MS) 1 0 0 0 1 0 151.0204 Communication Sciences and Disorders (PHD) 51.0202 Audiology (AUD) 6 0 1 0 6 1 7
Total 41 9 31 16 50 47 97
Thomas Harriot College of Arts and Sciences45.0201 Anthropology (BA) 26.0101 Biology (BS) 3 0 0 0 3 0 3
43.0104 Criminal Justice (BS) 1 0 0 0 1 0 151.2202 Environmental Health (BS) 0 1 0 0 1 0 126.0908 Exercise Physiology (BS) 1 0 0 0 1 0 154.0101 History (BA) 1 0 0 0 1 0 1
26.0202 Biochemistry (BS) 40.0501 Chemistry (BA, BS) 0 1 0 0 1 0 126.0101 Biology (BS) 40.0501 Chemistry (BA, BS) 2 0 0 0 2 0 2
13.1202 Elementary Education (BS) 1 0 0 0 1 0 114.0101 Engineering (BS) 0 1 0 0 1 0 151.3801 Nursing (BSN) 1 0 0 0 1 0 151.2207 Public Health Studies (BS) 1 0 0 0 1 0 113.1316 Science Education (BS) 5 2 0 1 7 1 8
Undeclared Major 0 1 0 0 1 0 140.0501 Chemistry (BA, BS) 26.0202 Biochemistry (BS) 5 4 0 1 9 1 10
26.0101 Biology (BS) 12 15 0 3 27 3 3043.0104 Criminal Justice (BS) 0 1 0 0 1 0 151.0701 Health Services Management (BS) 0 1 0 0 1 0 116.0905 Hispanic Studies (BA) 1 0 0 0 1 0 124.0101 Multidisciplinary Studies (BA, BS) 0 0 0 1 0 1 151.2207 Public Health Studies (BS) 0 1 0 0 1 0 113.1316 Science Education (BS) 1 1 0 0 2 0 2
Undeclared Major 0 1 0 0 1 0 145.0601 Economics (BA, BS) 26.0101 Biology (BS) 1 0 0 0 1 0 1
09.0101 Communication (BS) 0 1 0 0 1 0 114.0101 Engineering (BS) 0 0 0 1 0 1 152.0801 Finance or General Business Admin (BSBA) (Total) 0 1 0 0 1 0 154.0101 History (BA) 0 1 0 0 1 0 152.0201 Management (BSBA) 0 2 0 0 2 0 252.0305 Management Accounting (BSBA) 0 1 0 0 1 0 145.1001 Political Science (BA, BS) 1 1 0 0 2 0 2
23.0101 English (BA) 45.0201 Anthropology (BA) 1 0 0 0 1 0 113.1302 Art Education (BFA) 1 0 0 0 1 0 150.0702 Art, Fine/Studio Arts (BFA) 0 1 0 0 1 0 109.0101 Communication (BS) 4 1 0 0 5 0 543.0104 Criminal Justice (BS) 1 0 0 0 1 0 154.0101 History (BA) 0 1 0 0 1 0 124.0101 Multidisciplinary Studies (BA, BS) 1 1 0 0 2 0 250.0904 Music Theory and Composition (BM) 1 0 0 0 1 0 138.0101 Philosophy (BA) 0 1 0 0 1 0 145.1001 Political Science (BA, BS) 0 1 0 0 1 0 142.0101 Psychology (BA) 2 0 0 0 2 0 251.2207 Public Health Studies (BS) 1 0 0 0 1 0 150.0501 Theatre Arts (BA, BFA) 1 0 0 0 1 0 1
Undeclared Major 2 2 0 1 4 1 516.0901 French (BA) 45.0201 Anthropology (BA) 1 0 0 0 1 0 1
50.0703 Art History and Appreciation (BA) 1 0 0 0 1 0 126.0101 Biology (BS) 1 0 0 0 1 0 109.0101 Communication (BS) 2 0 2 0 2 2 450.0301 Dance Performance (BFA) 1 0 0 0 1 0 1
Undeclared Major 0 1 0 0 1 0 145.0701 Geography (BA) 16.0905 Hispanic Studies (BA) 1 0 0 0 1 0 1
45.1001 Political Science (BA, BS) 0 1 0 0 1 0 145.0701 Geography, Applied (BS) 04.0301 Urban and Regional Planning (BS) 0 1 0 0 1 0 140.0601 Geology (BS) 45.0201 Anthropology (BA) 1 0 0 0 1 0 1
11.0701 Computer Science (BA, BS) 0 1 0 0 1 0 113.1316 Science Education (BS) 1 1 0 0 2 0 2
Undeclared Major 1 0 0 0 1 0 116.0501 German (BA) 40.0501 Chemistry (BA, BS) 2 0 0 0 2 0 2
52.1401 Marketing (BSBA) 0 0 0 1 0 1 142.0101 Psychology (BA) 1 0 0 0 1 0 1
16.0905 Hispanic Studies (BA) 26.0202 Biochemistry (BS) 1 0 0 0 1 0 126.0101 Biology (BS) 1 1 0 0 2 0 209.0101 Communication (BS) 4 0 0 0 4 0 443.0104 Criminal Justice (BS) 2 2 0 0 4 0 413.1202 Elementary Education (BS) 2 0 0 0 2 0 223.0101 English (BA) 1 0 0 0 1 0 119.0707 Family Community Services (BS) 1 0 0 0 1 0 116.0901 French (BA) 0 0 1 0 0 1 113.1318 History Education (BS) 1 0 0 0 1 0 152.0201 Management (BSBA) 0 1 0 0 1 0 152.1201 Management Information Systems (BSBA) 0 1 0 0 1 0 113.1312 Music Education (BM) 0 1 0 0 1 0 150.0903 Music Performance (BM) 1 0 0 0 1 0 140.0801 Physics, Applied (BSAP) 0 1 0 0 1 0 145.1001 Political Science (BA, BS) 1 1 0 0 2 0 2
Continued Next Page…
Double Majors and Dual Degree Students Fall Enrollmentby Second Major, Gender, and Attendance Status
Full-time Part-timeTotal
Primary Major
66

Full- Part-Unit Second Major Women Men Women Men time time
Double Majors and Dual Degree Students Fall Enrollmentby Second Major, Gender, and Attendance Status
Full-time Part-timeTotal
Primary Major
42.0101 Psychology (BA) 2 2 0 0 4 0 451.2207 Public Health Studies (BS) 2 0 0 0 2 0 213.1316 Science Education (BS) 1 0 0 0 1 0 145.1101 Sociology (BA) 0 1 0 0 1 0 1
Undeclared Major 1 0 0 0 1 0 154.0101 History (BA) 45.0201 Anthropology (BA) 2 1 0 0 3 0 3
09.0101 Communication (BS) 1 1 0 0 2 0 245.0601 Economics (BA, BS) 0 1 0 0 1 0 123.0101 English (BA) 2 0 1 0 2 1 316.0901 French (BA) 1 0 0 0 1 0 116.0501 German (BA) 1 0 0 0 1 0 113.1318 History Education (BS) 19 22 0 1 41 1 4252.1401 Marketing (BSBA) 0 0 0 1 0 1 113.1203 Middle Grades Education (BS) (Total) 1 0 0 0 1 0 124.0101 Multidisciplinary Studies (BA, BS) 0 1 0 0 1 0 138.0101 Philosophy (BA) 2 0 0 0 2 0 245.1001 Political Science (BA, BS) 1 8 0 0 9 0 9
27.0101 Mathematics (BA, BS) 40.0499 Atmospheric Sciences, Applied (BS) 0 1 0 0 1 0 114.0101 Engineering (BS) 0 2 0 0 2 0 240.0601 Geology (BS) 1 0 0 0 1 0 127.0101 Mathematics (BA, BS) 0 2 0 0 2 0 213.1311 Mathematics Education (BS) 13 7 0 0 20 0 20
24.0101 Multidisciplinary Studies (BA, BS) 45.0201 Anthropology (BA) 2 6 0 0 8 0 826.0202 Biochemistry (BS) 1 0 0 0 1 0 126.0101 Biology (BS) 3 2 0 0 5 0 543.0104 Criminal Justice (BS) 1 0 0 0 1 0 145.0601 Economics (BA, BS) 1 0 0 0 1 0 123.0101 English (BA) 1 2 0 0 3 0 316.0501 German (BA) 0 0 0 1 0 1 131.0599 Health Fitness Specialist (BS) 0 0 0 1 0 1 151.0701 Health Services Management (BS) 1 0 0 0 1 0 116.0905 Hispanic Studies (BA) 1 0 0 0 1 0 113.1318 History Education (BS) 0 1 0 0 1 0 150.0903 Music Performance (BM) 1 0 0 0 1 0 142.0101 Psychology (BA) 2 1 0 0 3 0 345.1101 Sociology (BA) 1 0 0 0 1 0 1
Undeclared Major 0 1 0 0 1 0 138.0101 Philosophy (BA) 45.0201 Anthropology (BA) 0 1 0 0 1 0 1
26.0101 Biology (BS) 1 0 0 0 1 0 109.0101 Communication (BS) 1 1 0 0 2 0 243.0104 Criminal Justice (BS) 0 1 0 1 1 1 223.0101 English (BA) 3 1 0 1 4 1 552.0801 Finance or General Business Admin (BSBA) (Total) 0 1 0 0 1 0 116.0501 German (BA) 0 1 0 0 1 0 113.1318 History Education (BS) 0 1 0 0 1 0 113.1311 Mathematics Education (BS) 1 0 0 0 1 0 124.0101 Multidisciplinary Studies (BA, BS) 1 1 0 0 2 0 251.3801 Nursing (BSN) 1 0 0 0 1 0 145.1001 Political Science (BA, BS) 1 2 0 0 3 0 342.0101 Psychology (BA) 0 2 0 0 2 0 251.2207 Public Health Studies (BS) 0 1 0 0 1 0 1
Undeclared Major 0 1 0 0 1 0 140.0801 Physics (BA, BS) 27.0101 Mathematics (BA, BS) 2 0 0 0 2 0 2
50.0903 Music Performance (BM) 0 1 0 0 1 0 140.0801 Physics, Applied (BSAP) 40.0501 Chemistry (BA, BS) 1 0 0 0 1 0 1
14.0101 Engineering (BS) 0 1 0 0 1 0 145.1001 Political Science (BA, BS) 26.0101 Biology (BS) 0 1 0 0 1 0 1
40.0501 Chemistry (BA, BS) 2 0 0 0 2 0 209.0101 Communication (BS) 1 0 0 0 1 0 143.0104 Criminal Justice (BS) 0 3 0 0 3 0 316.0501 German (BA) 0 0 1 0 0 1 116.0905 Hispanic Studies (BA) 1 0 0 0 1 0 124.0101 Multidisciplinary Studies (BA, BS) 0 1 0 0 1 0 138.0101 Philosophy (BA) 0 1 0 0 1 0 104.0301 Urban and Regional Planning (BS) 0 1 0 0 1 0 1
42.0101 Psychology (BA) 45.0201 Anthropology (BA) 3 0 0 0 3 0 350.0702 Art, Fine/Studio Arts (BFA) 1 0 0 0 1 0 126.0101 Biology (BS) 1 0 0 0 1 0 143.0104 Criminal Justice (BS) 3 1 1 0 4 1 523.0101 English (BA) 4 1 0 0 5 0 526.0908 Exercise Physiology (BS) 0 1 0 0 1 0 119.0707 Family Community Services (BS) 2 0 0 0 2 0 252.0201 Management (BSBA) 1 1 0 0 2 0 227.0101 Mathematics (BA, BS) 1 0 0 0 1 0 124.0101 Multidisciplinary Studies (BA, BS) 1 2 1 0 3 1 413.1312 Music Education (BM) 1 0 0 0 1 0 150.0904 Music Theory and Composition (BM) 1 0 0 0 1 0 138.0101 Philosophy (BA) 1 0 0 0 1 0 145.1001 Political Science (BA, BS) 1 1 0 0 2 0 2
Continued Next Page…
67

Full- Part-Unit Second Major Women Men Women Men time time
Double Majors and Dual Degree Students Fall Enrollmentby Second Major, Gender, and Attendance Status
Full-time Part-timeTotal
Primary Major
51.2309 Recreational Therapy (BS) 1 0 0 0 1 0 113.1099 Special Educ, Adapted Curriculum (BS) 1 0 0 0 1 0 131.0599 Sports Studies (BS) 1 1 0 0 2 0 2
54.0105 Public History (BS) 45.0201 Anthropology (BA) 1 0 1 0 1 1 245.1101 Sociology (BA) 16.0905 Hispanic Studies (BA) 1 0 0 0 1 0 1
45.1001 Political Science (BA, BS) 0 1 0 0 1 0 142.0101 Psychology (BA) 1 0 0 0 1 0 1
45.1101 Sociology, Applied (BS) 52.0801 Finance or General Business Admin (BSBA) (Total) 0 1 0 0 1 0 104.0301 Urban and Regional Planning (BS) 15.1301 Computer Network Professional (CERT) 0 1 0 1 1 1 223.1303 Business and Technical Communication (C) 52.0201 Business Administration (MBA) 0 0 1 0 0 1 1
51.2207 Health Education and Promotion (MA) 1 0 0 0 1 0 152.0201 Economic Development (C) 30.2001 International Studies (MA) 1 0 0 0 1 0 111.0401 Geographic Information Sciences and Technology (C) 45.0701 Geography (MA) 1 0 0 0 1 0 1
40.0601 Geology (MS) 0 0 0 1 0 1 140.0605 Hydrogeology and Environmental Geology (C) 45.0701 Geography (MA) 1 0 0 0 1 0 1
40.0601 Geology (MS) 1 1 1 6 2 7 913.0701 International Teaching (C) 30.2001 International Studies (MA) 0 1 0 0 1 0 130.9999 Multicultural and Transnational Literature (C) 23.0101 English (MA) 0 0 1 1 0 2 230.0501 Security Studies (C) 52.0201 Business Administration (MBA) 0 1 2 1 1 3 4
43.0104 Criminal Justice (MS) 0 0 0 3 0 3 330.2001 International Studies (MA) 1 2 1 0 3 1 4
13.1401 Teaching Engl to Speakers of Other Languages (C) 51.0204 Communication Sciences and Disorders (MS) 1 0 0 0 1 0 123.0101 English (MA) 1 0 0 0 1 0 130.2001 International Studies (MA) 1 0 0 0 1 0 1
42.2801 Clinical Psychology (MA) 42.2810 Health Psychology (PHD) 1 0 0 0 1 0 130.2001 International Studies (MA) 51.2201 Public Health (MPH) 1 0 0 0 1 0 127.0101 Mathematics (MA) 45.0602 Applied and Resource Economics (MS) 0 1 0 0 1 0 142.0101 Psychology (MA) 42.2810 Health Psychology (PHD) 3 2 1 0 5 1 642.2805 School Psychology (CAS) 42.2805 School Psychology (MA) 12 1 5 1 13 6 19
Total 214 163 20 29 377 49 426
College of Business52.0801 Finance or General Business Admin (BSBA) (Total) 15.9999 Construction Management (BS) 0 1 0 0 1 0 1
43.0104 Criminal Justice (BS) 0 1 0 0 1 0 152.0201 Management (BSBA) 1 4 0 0 5 0 552.0305 Management Accounting (BSBA) 4 7 0 1 11 1 1252.1201 Management Information Systems (BSBA) 0 1 0 0 1 0 152.1401 Marketing (BSBA) 2 1 0 0 3 0 3
Undeclared Major 0 1 0 0 1 0 152.0201 Management (BSBA) 50.0702 Art, Fine/Studio Arts (BFA) 1 0 0 0 1 0 1
14.0101 Engineering (BS) 1 0 0 0 1 0 152.0801 Finance or General Business Admin (BSBA) (Total) 1 0 0 0 1 0 116.0905 Hispanic Studies (BA) 1 0 0 0 1 0 152.0901 Hospitality Management (BS) 0 2 0 0 2 0 252.1401 Marketing (BSBA) 2 1 0 1 3 1 451.3801 Nursing (BSN) 1 0 0 0 1 0 145.1001 Political Science (BA, BS) 0 1 0 0 1 0 1 . Undeclared Major 1 2 0 0 3 0 3
52.0305 Management Accounting (BSBA) 52.0801 Finance or General Business Admin (BSBA) (Total) 2 3 0 1 5 1 651.0701 Health Services Management (BS) 0 1 0 0 1 0 152.0201 Management (BSBA) 0 1 0 0 1 0 113.1324 Theatre Arts or Dance Education (BFA) (Total) 1 0 0 0 1 0 1
Undeclared Major 0 1 0 0 1 0 152.1201 Management Information Systems (BSBA) 11.0701 Computer Science (BA, BS) 1 1 0 0 2 0 2
52.0801 Finance or General Business Admin (BSBA) (Total) 0 4 0 0 4 0 415.0612 Industrial Technology (BS) 0 1 0 0 1 0 152.1401 Marketing (BSBA) 0 1 0 0 1 0 1
52.1401 Marketing (BSBA) 50.0702 Art, Fine/Studio Arts (BFA) 1 1 0 0 2 0 252.0801 Finance or General Business Admin (BSBA) (Total) 1 2 0 0 3 0 352.0201 Management (BSBA) 4 4 0 0 8 0 852.1201 Management Information Systems (BSBA) 0 1 0 0 1 0 1
Undeclared Major 1 0 1 0 1 1 252.0801 Finance (C) 52.0201 Business Administration (MBA) 2 5 8 19 7 27 3452.1101 International Management (C) 52.0201 Business Administration (MBA) 2 1 0 0 3 0 352.1201 Management of Info Syst (C) 52.0201 Business Administration (MBA) 4 1 6 16 5 22 27
45.1101 Sociology (MA) 0 1 0 0 1 0 152.1401 Marketing (C) 52.0201 Business Administration (MBA) 7 2 9 3 9 12 21
23.0101 English (MA) 0 0 1 0 0 1 152.0203 Supply Chain Management (C) 52.0201 Business Administration (MBA) 1 2 5 10 3 15 1852.0201 Business Administration (MBA) 31.0505 Exercise Sport Science (MS) 0 0 0 1 0 1 1
51.2706 Health Informatics and Information Management (MS) 1 0 0 0 1 0 130.9999 Sustainable Tourism (MS) 0 0 0 1 0 1 1
Total 43 55 30 53 98 83 181
College of Education13.1202 Elementary Education (BS) 50.0301 Dance Performance (BFA) 1 0 0 0 1 0 1
13.1099 Special Educ, Adapted Curriculum (BS) 1 0 0 0 1 0 113.1311 Mathematics Education (BS) 11.0701 Computer Science (BA, BS) 0 0 1 0 0 1 113.1316 Science Education (BS) 50.0903 Music Performance (BM) 1 0 0 0 1 0 113.1001 Special Educ, General Curriculum (BS) 13.1302 Art Education (BFA) 1 0 0 0 1 0 1
51.2305 Music Therapy (BM) 1 0 0 0 1 0 151.0999 Assistive Technology (C) 13.1101 Counselor Education (MS) 1 0 0 0 1 0 113.1013 Autism (C) 13.1101 Counselor Education (MS) 1 0 0 0 1 0 1
51.2207 Health Education and Promotion (MA) 1 1 0 0 2 0 213.0407 Community College Instruction (C) 52.0301 Accounting (MSA) 0 0 1 0 0 1 1
13.0403 Adult Education (MAED) 0 0 4 0 0 4 413.1101 Counselor Education (MS) 2 1 0 0 3 0 323.0101 English (MA) 1 0 2 1 1 3 451.2207 Health Education and Promotion (MA) 2 0 2 0 2 2 425.0101 Library Science (MLS) 0 0 3 0 0 3 313.1315 Reading Education (MAED) 0 0 1 0 0 1 113.1319 Vocational Education (MS) 0 0 0 1 0 1 1
13.0501 Distance Learning and Admin (C) 23.0101 English (MA) 0 0 1 0 0 1 113.0501 Instructional Technology (MS) 1 0 0 0 1 0 115.0612 Technology Systems (MS) 1 0 0 0 1 0 1
Total 15 2 15 2 17 17 34
Continued Next Page…
68

Full- Part-Unit Second Major Women Men Women Men time time
Double Majors and Dual Degree Students Fall Enrollmentby Second Major, Gender, and Attendance Status
Full-time Part-timeTotal
Primary Major
College of Fine Arts & Communication13.1302 Art Education (BFA) 50.0702 Art, Fine/Studio Arts (BFA) 0 0 1 0 0 1 150.0703 Art History and Appreciation (BA) 52.0901 Hospitality Management (BS) 1 0 0 0 1 0 150.0702 Art, Fine/Studio Arts (BFA) 13.1302 Art Education (BFA) 4 1 0 0 5 0 5
14.0101 Engineering (BS) 0 1 0 0 1 0 116.0905 Hispanic Studies (BA) 1 0 0 0 1 0 152.1401 Marketing (BSBA) 1 0 0 0 1 0 1
09.0101 Communication (BS) 23.0101 English (BA) 1 0 0 0 1 0 152.0801 Finance or General Business Admin (BSBA) (Total) 1 0 0 0 1 0 119.0901 Merchandising (BS) 1 0 0 0 1 0 150.0501 Theatre Arts (BA, BFA) 0 1 0 0 1 0 1
50.0301 Dance Performance (BFA) 13.1202 Elementary Education (BS) 1 0 0 0 1 0 150.0408 Interior Design (BS) 0 0 1 0 0 1 113.1324 Theatre Arts or Dance Education (BFA) (Total) 1 0 0 0 1 0 1
Undeclared Major 0 2 0 0 2 0 213.1312 Music Education (BM) 50.0904 Music Theory and Composition (BM) 0 1 0 0 1 0 1
51.2305 Music Therapy (BM) 1 1 0 0 2 0 250.0903 Music Performance (BM) 13.1312 Music Education (BM) 4 1 0 0 5 0 550.0904 Music Theory and Composition (BM) 50.0903 Music Performance (BM) 1 0 0 0 1 0 151.2305 Music Therapy (BM) 13.1312 Music Education (BM) 1 0 0 0 1 0 150.0501 Theatre Arts (BA, BFA) 09.0101 Communication (BS) 0 1 0 0 1 0 1
50.0301 Dance Performance (BFA) 1 0 0 0 1 0 116.0501 German (BA) 0 1 0 0 1 0 142.0101 Psychology (BA) 1 0 0 0 1 0 113.1324 Theatre Arts or Dance Education (BFA) (Total) 2 1 0 0 3 0 3
13.1324 Theatre Arts or Dance Education (BFA) (Total) 51.2305 Music Therapy (BM) 0 0 1 0 0 1 150.0501 Theatre Arts (BA, BFA) 1 0 0 0 1 0 1
50.0903 Music Performance (MM) 25.0101 Library Science (MLS) 0 0 1 0 0 1 1Total 24 11 4 0 35 4 39
College of Health and Human Performance26.0908 Exercise Physiology (BS) Undeclared Major 0 1 0 0 1 0 131.0599 Health Fitness Specialist (BS) 50.0301 Dance Performance (BFA) 1 1 0 0 2 0 231.0101 Recreation and Park Management (BS) 51.2207 Public Health Studies (BS) 1 0 0 0 1 0 113.1307 School Health Education (BS) 51.0913 Athletic Training (BS) 3 1 0 0 4 0 451.0999 Biofeedback (C) 51.2309 Recreational Therapy Administration (MS) 0 0 1 0 0 1 113.1314 Physical Education Clinical Supervision (C) 13.1314 Physical Education (MAED) 0 0 0 1 0 1 131.0505 Sports Management (C) 52.0201 Business Administration (MBA) 1 8 1 0 9 1 10
31.0505 Exercise Sport Science (MS) 1 0 0 0 1 0 131.0505 Exercise Sport Science (MS) 52.0201 Business Administration (MBA) 1 0 0 0 1 0 1
Total 8 11 2 1 19 3 22
College of Human Ecology19.0706 Child Life (BS) 43.0104 Criminal Justice (BS) 1 0 0 0 1 0 143.0104 Criminal Justice (BS) 16.0905 Hispanic Studies (BA) 2 0 0 0 2 0 2
52.0201 Management (BSBA) 0 1 0 0 1 0 145.1101 Sociology, Applied (BS) 0 1 0 0 1 0 1
19.0707 Family Community Services (BS) 19.0706 Child Life (BS) 8 0 1 0 8 1 943.0104 Criminal Justice (BS) 1 0 0 0 1 0 113.1202 Elementary Education (BS) 0 0 1 0 0 1 1
19.0901 Merchandising (BS) 50.0702 Art, Fine/Studio Arts (BFA) 2 0 0 0 2 0 209.0101 Communication (BS) 1 0 0 0 1 0 150.0408 Interior Design (BS) 1 0 0 0 1 0 142.0101 Psychology (BA) 0 1 0 0 1 0 1
51.3101 Nutrition and Dietetics (BS) 31.0599 Health Fitness Specialist (BS) 0 0 0 1 0 1 144.0701 Social Work (BSW) Undeclared Major 1 0 0 0 1 0 130.1101 Gerontology (C) 51.2310 Rehabilitation Counseling (C) 0 0 1 0 0 1 152.0901 Hospitality Management (C) 52.0201 Business Administration (MBA) 1 1 2 0 2 2 444.0701 Social Work (MSW) 51.1501 Substance Abuse Clinical Counseling (MS) 1 0 0 0 1 0 1
Total 19 4 5 1 23 6 29
College of Technology and Computer Science11.0701 Computer Science (BA, BS) 50.0501 Theatre Arts (BA, BFA) 0 1 0 0 1 0 115.9999 Construction Management (BS) 15.1301 Computer Network Professional (CERT) 0 1 0 0 1 0 114.0101 Engineering (BS) 16.0501 German (BA) 0 0 0 1 0 1 1
40.0801 Physics (BA, BS) 0 2 0 0 2 0 215.0612 Industrial Distribution and Logistics (BS) 09.0101 Communication (BS) 1 0 0 0 1 0 111.0103 Information and Computer Technology (BS) 40.0801 Physics (BA, BS) 0 1 0 0 1 0 111.1003 Information Assurance (C) 11.1099 Network Technology (MS) 1 0 0 0 1 0 115.0702 Lean Six Sigma Black Belt (C) 52.0201 Business Administration (MBA) 0 0 1 0 0 1 1
15.0612 Technology Systems (MS) 0 1 3 7 1 10 1111.1004 Website Developer (C) 52.0201 Business Administration (MBA) 0 0 0 1 0 1 114.0903 Software Engineering (MS) 11.0701 Computer Science (MS) 0 0 0 1 0 1 1
Total 2 6 4 10 8 14 22
Brody School of Medicine51.2207 Ethnic and Rural Health Disparities (C) 51.2207 Health Education and Promotion (MA) 1 0 0 0 1 0 1
51.2201 Public Health (MPH) 1 1 0 0 2 0 251.2201 Public Health (MPH) 51.2207 Health Education and Promotion (MA) 0 1 0 0 1 0 1
Total 2 2 0 0 4 0 4
Grand Total Double Majors and Dual Degrees 368 263 111 112 631 223 854
Source: Student Data File, Fall 2013.
Note: These students are listed in Unduplicated Enrollment tables by their primary majors.
69

Male Female Male Female Male Female Male Female Male Female Male Female
Allied Health 22 132 21 51 16 119 0 0 3 1 8 24 397
Arts and Sciences 449 524 13 23 92 116 1 6 3 5 0 0 1,232
Business 338 223 39 15 149 120 0 0 0 0 0 0 884
Education 59 452 10 44 61 349 2 2 4 10 0 0 993
Fine Arts and Communication 139 328 1 2 29 39 0 0 0 0 0 0 538
Health and Human Performance 225 292 7 7 39 60 0 0 1 2 0 0 633
Human Ecology 152 464 7 36 16 95 0 0 1 0 0 0 771
Medicine 0 0 3 9 14 28 0 0 4 8 33 37 136
Nursing 37 263 0 0 12 133 1 9 1 5 0 0 461
Research and Graduate Studies 0 0 0 0 1 3 0 0 1 6 0 0 11
Technology and Computer Science 358 38 4 3 67 17 0 0 0 0 0 0 487
Total by Gender & Level 1,779 2,716 105 190 496 1,079 4 17 18 37 41 61 6,543
Total by Level 6,543
Source: Graduated Student Data Files, Summer 2012 through Spring 2013.
Intermediate/Specialist includes Certificate of Advanced Study (CAS), Educational Specialist (EdS), and Post Master's Certificates.
Doctoral Professional includes Medicine (MD), Dental Medicine (DMD), Physical Therapy (DPT), Nursing Practice (DNP), and Audiology (AUD).
Doctoral Research/Scholarship includes all PhD and EdD.
Note: Double majors are counted as separate degrees, therefore the number of degrees conferred will be higher than the graduated student headcount.
102
UnitTotal
by Unit
Summer 2012, Fall 2012, and Spring 2013Degrees Conferred by Unit, Level, and Gender:
Post Bachelor's Certificate
Bachelor's Master'sIntermediate/
SpecialistDoctoral
ProfessionalDoctoral
Rsch/Schrl
4,495 295 1,575 21 55
70

Unit 2008-2009 2009-2010 2010-2011 2011-2012 2012-2013
College of Allied Health Sciences51.1005 Clinical Laboratory Science (BS) 4 8 12 11 1051.0706 Health Information Management (BS) 18 21 13 13 951.0701 Health Services Management (BS) 72 87 81 78 6151.2310 Rehabilitation Services (BS) 34 25 31 36 4051.0204 Speech and Hearing Sciences (BS) 25 30 23 30 34
Total 153 171 160 168 154Thomas Harriot College of Arts & Sciences
45.0201 Anthropology (BA) 17 21 19 22 2040.0499 Atmospheric Sciences, Applied (BS) 0 0 0 0 126.0202 Biochemistry (BS) 11 15 14 15 2126.0101 Biology (BS) 121 122 159 190 15240.0501 Chemistry (BA) 34 35 50 56 5940.0501 Chemistry (BS) 17 11 10 8 1545.0601 Economics (BA) 4 7 2 7 845.0601 Economics (BS) 70 76 88 88 10223.0101 English (BA) 63 62 64 81 9016.0901 French (BA) 6 3 1 6 211.0401 Geog Info Scie and Tech (BS) 0 0 0 1 145.0701 Geography (BA) 0 1 2 2 045.0701 Geography, Applied (BS) 7 7 8 9 940.0601 Geology (BS) 8 8 9 14 1716.0501 German (BA) 2 4 3 4 613.1326 German Education (BS) 1 2 0 0 016.0905 Hispanic Studies (BA) 0 12 10 28 2113.1330 Hispanic Studies Education (BS) 9 3 4 7 254.0101 History (BA) 51 36 34 29 5427.0101 Mathematics (BA) 6 10 7 12 1127.0101 Mathematics (BS) 2 7 12 7 1224.0101 Multidisciplinary Studies (BA) 7 12 18 20 2624.0101 Multidisciplinary Studies (BS) 13 5 11 2 1138.0101 Philosophy (BA) 13 16 14 15 840.0801 Physics (BA) 0 0 2 0 040.0801 Physics (BS) 3 4 3 7 340.0801 Physics, Applied (BSAP) 1 2 0 0 245.1001 Political Science (BA) 30 25 36 30 3245.1001 Political Science (BS) 38 38 37 32 5042.0101 Psychology (BA) 129 136 130 156 18854.0105 Public History (BS) 3 4 4 1 645.1101 Sociology (BA) 5 8 4 5 1245.1101 Sociology, Applied (BS) 11 22 21 30 2004.0301 Urban and Regional Planning (BS) 14 17 11 16 1205.0207 Women's Studies (BA) 0 2 2 0 0
Total 696 733 789 900 973College of Business
52.0301 Accounting (BSA) 14 21 9 0 052.0801 Finance or General Business Admin (BSBA) (Total) 112 77 139 141 11952.0201 Management (BSBA) 159 195 210 183 19352.0305 Management Accounting (BSBA) 56 103 109 104 9052.1201 Management Information Systems (BSBA) 18 45 35 65 5252.1401 Marketing (BSBA) 117 109 110 112 107
Total 476 550 612 605 561
by Unit and Major (CIP)Undergraduate Degrees Conferred History
71

Unit 2008-2009 2009-2010 2010-2011 2011-2012 2012-2013
by Unit and Major (CIP)Undergraduate Degrees Conferred History
College of Education13.1303 Business Education (BSBE) 1 3 4 1 213.1303 Business and Marketing Education (BSBE) 3 4 1 6 513.1202 Elementary Education (BS) 269 256 251 262 29213.1305 English Education (BS) 9 18 21 10 2613.1318 History Education (BS) 23 12 24 18 2152.0407 Information Technologies (BSBE) 49 63 62 49 5013.1311 Mathematics Education (BS) 15 22 16 15 1313.1203 Middle Grades Education (BS) 26 26 23 17 5213.1316 Science Education (BS) 13 5 3 4 813.1099 Special Education, Adapted Curriculum (BS) 9 8 8 14 2413.1001 Special Education, General Curriculum (BS) 21 39 12 36 18
Total 438 456 425 432 511College of Fine Arts & Communication
50.0701 Art (BA) 1 3 1 0 050.0702 Art (BFA) 65 58 50 82 7013.1302 Art Education (BFA) 12 11 13 9 1850.0703 Art History and Appreciation (BA) 1 3 4 7 409.0101 Communication (BA) 37 27 7 0 009.0101 Communication (BS) 225 224 263 310 27213.1324 Dance Education (BFA) 11 12 5 3 350.0301 Dance Performance (BFA) 11 21 11 12 1213.1312 Music Education (BM) 10 19 20 16 2650.0903 Music Performance (BM) 10 12 10 18 2550.0904 Music Theory and Composition (BM) 1 1 1 3 051.2305 Music Therapy (BM) 1 0 0 1 150.0501 Theatre Arts (BA) 8 6 8 8 450.0501 Theatre Arts (BFA) 25 25 23 25 2513.1324 Theatre Arts Education (BFA) 5 2 7 3 7
Total 423 424 423 497 467College of Health & Human Performance
51.0913 Athletic Training (BS) 11 8 12 13 2451.2202 Environmental Health (BS) 10 8 16 11 726.0908 Exercise Physiology (BS) 46 46 66 74 9826.0908 Exercise and Sport Science (BA) 6 3 7 5 031.0599 Health Fitness Specialist (BS) 75 73 70 79 9013.1314 Physical Education (BS) 37 25 22 36 2551.2207 Public Health Studies (BS) 71 65 93 97 11631.0101 Recreation and Park Mgmt (BS) 41 36 29 25 3351.2309 Recreational Therapy (BS) 68 59 49 53 5813.1307 School Health Education (BS) 10 5 7 6 1031.0599 Sports Studies (BS) 10 24 34 58 56
Total 385 352 405 457 517
72

Unit 2008-2009 2009-2010 2010-2011 2011-2012 2012-2013
by Unit and Major (CIP)Undergraduate Degrees Conferred History
College of Human Ecology13.1209 Birth to Kindergarten Teacher Education (BS) 20 16 13 15 1819.0706 Child Life (BS) 24 18 20 21 2243.0104 Criminal Justice (BS) 105 125 119 153 17619.0707 Family Community Services (BS) 131 96 90 107 10113.1308 Family and Consumer Science Education (BS) 5 5 4 10 352.0901 Hospitality Management (BS) 73 84 74 94 11350.0408 Interior Design (BS) 14 34 17 30 1819.0901 Merchandising (BS) 40 53 46 47 4451.3101 Nutrition and Dietetics (BS) 23 21 33 42 3744.0701 Social Work (BSW) 48 77 62 71 84
Total 483 529 478 590 616College of Nursing
51.1601 Nursing (BSN) 276 283 272 284 300Total 276 283 272 284 300
College of Technology & Computer Science11.0701 Computer Science (BA) 1 3 9 5 311.0701 Computer Science (BS) 30 19 20 24 1915.9999 Construction Management (BS) 135 135 167 128 10315.1301 Design (BS) 28 28 18 28 2214.0101 Engineering (BS) 19 14 36 30 5415.0612 Industl Distrib and Logistics (BS) 37 42 36 34 5415.0613 Industrial Engineering Tech (BS) 3 8 6 7 915.0612 Industrial Technology (BS) 81 67 74 94 10511.0103 Information and Computer Tech (BS) 26 37 26 32 27
Total 360 353 392 382 396
Grand Total, All Colleges 3,690 3,851 3,956 4,315 4,495
Source: Graduated Student Data Files 2008-2009 through 2012-2013.
* Communications programs merged to one 6-Digit CIP code in 2010
Note: Reporting year includes summer, fall, and spring graduations.
Note: Double majors and dual degrees are counted as separate degrees, therefore the number of degrees conferred will be higher than
the graduated student headcount. Previously, the Fact Book only reported first major degrees; historical data have been changed to include
second majors, therefore totals may not match previous Fact Books.
73

Unit 2008-2009 2009-2010 2010-2011 2011-2012 2012-2013
College of Allied Health Sciences51.0202 Audiology (AUD) 0 0 2 1 251.0204 Communication Sciences and Disorders (MS) 41 40 47 51 5151.0204 Communication Sciences and Disorders (PHD) 4 1 2 1 351.2306 Occupational Therapy (MSOT) 20 20 19 21 2251.2308 Physical Therapy (DPT) 33 29 29 26 3051.0912 Physician Assistant Studies (MS) 30 35 29 33 3151.2310 Rehabilitation Counseling Administration (PHD) 1 2 0 2 151.2310 Rehabilitation Counseling (MS) 30 25 31 27 1251.1501 Substance Abuse/Clinic Counsel (MS) 31 19 27 24 1851.2310 Vocational Evaluation (MS) 3 7 4 4 1
Total 193 178 190 190 171Thomas Harriot College of Arts & Sciences
45.0201 Anthropology (MA) 5 8 11 12 445.0602 Applied and Resource Economics (MS) 13 14 16 10 826.0101 Biology (MS) 14 12 13 13 1426.0203 Biomedical Physics (PHD) 4 1 1 4 340.0501 Chemistry (MS) 7 3 9 6 842.2801 Clinical Psychology (MA) 6 4 6 2 723.0101 English (MA) 37 49 57 44 5145.0701 Geography (MA) 8 7 10 9 640.0601 Geology (MS) 5 8 3 5 1042.2810 Health Psychology (PHD) 0 0 0 3 154.0101 History (MA) 5 7 4 5 730.2001 International Studies (MA) 7 13 17 12 1530.9999 Maritime Studies (MA) 3 5 5 17 427.0101 Mathematics (MA) 8 2 5 9 926.0204 Molecular Biology and Biotech (MS) 3 7 8 8 1040.0801 Physics (MS) 7 11 6 11 1042.0101 Psychology (MA) 23 16 18 16 1144.0401 Public Administration (MPA) 13 14 12 13 1423.1303 Rhetoric Writing and Professional Comm (PhD) 0 1 2 1 442.2805 School Psychology (MA) 0 0 6 5 1042.2805 School Psychology (CAS) 6 7 6 5 730.0601 Security Studies (MS) 0 0 0 5 345.1101 Sociology (MA) 4 6 6 9 7
Total 178 195 221 224 223College of Business
52.0301 Accounting (MSA) 37 57 81 61 5252.0201 Business Administration (MBA) 150 145 166 222 217
Total 187 202 247 283 269
by Unit and Major (CIP)Graduate Degrees Conferred History
74

Unit 2008-2009 2009-2010 2010-2011 2011-2012 2012-2013
by Unit and Major (CIP)Graduate Degrees Conferred History
College of Education13.0403 Adult Education (MAED) 13 15 17 12 1513.1399 Business Education (MAED) 7 4 7 5 313.1101 Counselor Education (MS) 31 28 48 31 2313.0401 Educ Admin and Supervision (EDS) 10 8 13 14 413.0401 Educational Leadership (EDD) 8 17 15 5 1413.1202 Elementary Education (MAED) 36 46 40 30 2213.1305 English Education (MAED) 10 5 2 5 313.1299 Master of Arts in Teaching (MAT) 67 59 59 53 4813.1328 History Education (MAED) 2 5 3 3 213.0501 Instructional Technology (MS) 8 19 30 30 1713.0501 Instructional Technology Education (MAED) 66 60 50 47 3225.0101 Library Science (MLS) 103 107 115 85 6913.1399 Marketing Education (MAED) 3 0 0 0 013.1311 Mathematics Education (MAED) 18 16 5 20 1013.1203 Middle Grades Education (MAED) 12 6 7 9 313.1315 Reading Education (MAED) 41 43 35 27 3313.0401 School Administration (MSAM) 85 70 85 87 7613.1316 Science Education (MA) 0 0 0 0 113.1316 Science Education (MAED) 7 15 14 9 1513.1011 Special Educ, Behavioral/Emotional Disabilities (MAED) 0 0 4 4 213.1011 Special Educ, Learning Disabilities (MAED) 10 4 17 13 1313.1011 Special Educ, Low Incidence Disabilities (MAED) 8 4 14 15 1213.1006 Special Educ, Mental Disabilities (MAED) 6 2 1 1 413.1319 Vocational Education (MS) 9 15 9 2 7
Total 560 548 590 507 428College of Fine Arts & Communication
13.1302 Art Education (MAED) 13 13 13 8 950.0702 Art, Fine/Studio Arts (MFA) 11 14 15 7 2109.0101 Communication (MA) 7 12 9 16 1613.1312 Music Education (MM) 8 5 7 5 850.0903 Music Performance (MM) 15 18 15 8 1350.0904 Music Theory and Composition (MM) 0 1 2 0 151.2305 Music Therapy (MM) 0 1 1 0 0
Total 54 64 62 44 68College of Health & Human Performance
51.0913 Athletic Training (MS) 1 0 4 0 026.0999 Bioenergetics and Exercise Sci (PHD) 2 2 2 4 351.2202 Environmental Health (MSEH) 6 7 4 7 631.0505 Exercise Sport Science (MS) 24 38 28 40 2551.2207 Health Education and Promotion (MA) 15 23 23 23 3013.1307 Health Education and Promotion (MAED) 24 28 32 19 1913.1314 Physical Education (MAED) 3 3 9 12 631.0101 Recreation and Park Admin (MS) 5 6 7 6 951.2309 Recreational Therapy Administr (MS) 2 4 3 6 4
Total 82 111 112 117 102
75

Unit 2008-2009 2009-2010 2010-2011 2011-2012 2012-2013
by Unit and Major (CIP)Graduate Degrees Conferred History
College of Human Ecology13.1209 Birth to Kindergarten Education (MAED) 1 4 2 12 819.0707 Child Development and Family Relations (MS) 16 7 13 8 843.0104 Criminal Justice (MS) 12 17 10 21 713.1399 Family and Consumer Sciences (MAED) 1 0 5 7 151.1505 Marriage and Family Therapy (MS) 12 10 13 10 1751.1505 Medical Family Therapy (PHD) 1 4 2 2 119.0501 Nutrition (MS) 7 14 16 8 1144.0701 Social Work (MSW) 77 50 82 82 59
Total 127 106 143 150 112School of Medicine
26.0401 Anatomy and Cell Biology (PHD) 2 1 1 1 126.0202 Biochemistry and Molecular Biology (PHD) 0 3 3 2 226.0102 Biomedical Science (MS) 0 0 0 0 126.9999 Interdisciplinary Biological Science (PHD) 4 5 6 3 351.1201 Medicine (MD) 65 65 70 71 7026.0503 Microbiology and Immunology (PHD) 2 2 2 3 126.1007 Pharmacology and Toxicology (PHD) 0 1 4 0 426.0901 Physiology (PHD) 1 2 2 1 151.2201 Public Health (MPH) 32 26 22 45 41
Total 106 105 110 126 124College of Nursing
51.3805 Adult Gerontology Nurse Practitioner (C) 1 1 1 0 251.3813 Clinical Nurse Specialist (C) 0 1 2 0 151.3805 Family Nurse Practitioner (C) 2 2 0 0 251.3806 Neonatal Nurse Practitioner (C) 2 0 0 1 051.3804 Nurse Anesthesia (C) 0 0 0 0 151.3807 Nurse Midwifery (C) 1 0 0 1 151.3899 Nursing (MSN) 111 110 143 129 14551.3808 Nursing (PHD) 1 3 3 4 651.3817 Nursing Education (C) 1 0 0 0 251.3802 Nursing Leadership (C) 0 0 1 0 1
Total 119 117 150 135 161College of Technology & Computer Science
11.0701 Computer Science (MS) 5 5 5 4 715.1001 Construction Management (MCM) 3 3 3 7 1151.2206 Occupational Safety (MS) 9 6 3 7 814.0903 Software Engineering (MS) 0 5 8 10 2115.0612 Technology Systems (MS) 49 31 50 47 37
Total 66 50 69 75 84Research & Graduate Studies
30.9999 Coastal Resources Management (PHD) 7 5 2 3 730.9999 Sustainable Tourism (MS) 0 0 2 3 4
Total 7 5 4 6 11
Grand Total (All Colleges) 1,679 1,681 1,898 1,857 1,753
Source: Graduated Student Data Files, 2008-2009 through 2012-2013.
Note: Reporting year includes summer, fall, and spring graduations.
Note: Double majors and dual degrees are counted as separate degrees, therefore the number of degrees conferred will be higher than
the graduated student headcount.
76

Unit Women Men Women Men Women Men Women Men Women Men Women Men Women Men Women Men Women Men All
College of Business
52.0801 Finance or General Business Admin (BSBA) (Total) 0 0 4 0 0 0 4 5 2 1 32 64 0 1 2 2 1 1 119
52.0201 Management (BSBA) 0 0 3 2 0 0 9 9 2 5 55 95 0 0 5 8 0 0 193
52.0305 Management Accounting (BSBA) 1 0 1 2 0 0 5 3 1 3 28 41 0 2 3 0 0 0 90
52.1201 Management Information Systems (BSBA) 0 0 0 1 1 0 1 6 1 1 11 21 1 3 1 3 0 1 52
52.1401 Marketing (BSBA) 0 1 3 1 0 0 0 6 2 1 41 45 1 0 1 3 1 1 107
Total 1 1 11 6 1 0 19 29 8 11 167 266 2 6 12 16 2 3 561
College of Education
13.1303 Business Education (BSBE) 0 0 0 0 0 0 0 0 0 0 2 0 0 0 0 0 0 0 2
13.1303 Business and Marketing Education (BSBE) 0 0 0 0 0 0 0 0 0 0 3 2 0 0 0 0 0 0 5
13.1202 Elementary Education (BS) 1 0 1 0 1 0 13 0 7 1 253 9 0 0 6 0 0 0 292
13.1305 English Education (BS) 0 0 0 0 0 0 2 0 1 0 18 1 1 1 2 0 0 0 26
13.1318 History Education (BS) 0 0 0 0 0 0 0 0 0 0 8 12 0 0 0 1 0 0 21
52.0407 Information Technologies (BSBE) 0 0 2 0 0 0 11 4 0 0 24 7 0 0 2 0 0 0 50
13.1311 Mathematics Education (BS) 0 0 0 0 0 0 0 0 0 0 10 2 1 0 0 0 0 0 13
13.1203 Middle Grades Education (BS) 0 0 0 0 0 0 1 1 0 0 34 13 1 1 1 0 0 0 52
13.1316 Science Education (BS) 0 0 0 0 0 0 0 1 1 0 5 1 0 0 0 0 0 0 8
13.1099 Special Education, Adapted Curriculum (BS) 0 0 0 0 0 0 1 1 0 0 19 1 1 0 1 0 0 0 24
13.1001 Special Education, General Curriculum (BS) 0 0 0 0 0 0 3 0 0 0 15 0 0 0 0 0 0 0 18
Total 1 0 3 0 1 0 31 7 9 1 391 48 4 2 12 1 0 0 511
College of Fine Arts & Communication
50.0702 Art (BFA) 0 0 5 1 0 0 0 3 1 0 44 14 0 1 0 1 0 0 7013.1302 Art Education (BFA) 0 0 0 0 0 0 0 0 0 0 15 2 0 0 0 1 0 0 1850.0703 Art History and Appreciation (BA) 0 0 0 0 0 0 1 0 0 0 3 0 0 0 0 0 0 0 409.0101 Communication (BS) 0 0 1 2 0 1 18 16 5 2 165 52 0 0 5 3 1 1 27213.1324 Dance Education (BFA) 0 0 0 0 0 0 0 0 1 0 2 0 0 0 0 0 0 0 350.0301 Dance Performance (BFA) 0 0 0 0 0 0 1 1 0 0 9 0 0 0 1 0 0 0 1213.1312 Music Education (BM) 0 0 0 1 0 0 0 2 1 0 11 9 0 0 1 1 0 0 2650.0903 Music Performance (BM) 0 0 0 0 0 0 0 3 1 1 9 9 1 0 0 1 0 0 2551.2305 Music Therapy (BM) 0 0 0 0 0 0 0 0 0 0 1 0 0 0 0 0 0 0 150.0501 Theatre Arts (BA) 0 0 0 0 0 0 0 0 0 0 3 1 0 0 0 0 0 0 450.0501 Theatre Arts (BFA) 0 0 0 0 0 0 0 0 1 0 15 9 0 0 0 0 0 0 2513.1324 Theatre Arts Education (BFA) 0 0 0 0 0 0 0 0 0 0 6 1 0 0 0 0 0 0 7
Total 0 0 6 4 0 1 20 25 10 3 283 97 1 1 7 7 1 1 467
Non-ResAlien
Undergraduate Degrees Conferred 2012-2013by Unit, Major, Ethnicity, and Gender
Am Indian Alaskan Nat Asian
Nat HawaiianPacific Islander
Black, African Amer, non-Hisp Hispanic
White, non-Hisp
Two or more races
Race & ethn unk.
77

Unit Women Men Women Men Women Men Women Men Women Men Women Men Women Men Women Men Women Men All
Non-ResAlien
Undergraduate Degrees Conferred 2012-2013by Unit, Major, Ethnicity, and Gender
Am Indian Alaskan Nat Asian
Nat HawaiianPacific Islander
Black, African Amer, non-Hisp Hispanic
White, non-Hisp
Two or more races
Race & ethn unk.
College of Health & Human Performance
51.0913 Athletic Training (BS) 1 0 0 0 0 0 2 1 0 0 13 7 0 0 0 0 0 0 24
51.2202 Environmental Health (BS) 0 0 0 0 0 0 1 0 0 1 4 1 0 0 0 0 0 0 7
26.0908 Exercise Physiology (BS) 0 1 0 2 1 0 9 2 1 1 41 33 1 0 1 3 1 1 98
31.0599 Health Fitness Specialist (BS) 2 0 0 1 0 0 2 9 2 1 32 36 1 0 1 3 0 0 90
13.1314 Physical Education (BS) 0 0 0 0 0 0 0 0 0 0 6 18 0 1 0 0 0 0 25
51.2207 Public Health Studies (BS) 2 0 3 2 0 0 32 4 2 2 46 17 1 0 3 2 0 0 116
31.0101 Recreation and Park Mgmt (BS) 0 0 0 0 0 0 1 3 1 0 10 16 0 0 1 1 0 0 33
51.2309 Recreational Therapy (BS) 0 0 0 0 0 0 6 1 0 0 46 4 1 0 0 0 0 0 58
13.1307 School Health Education (BS) 0 0 1 0 0 0 2 0 0 0 3 3 0 0 0 0 1 0 10
31.0599 Sports Studies (BS) 0 0 0 0 0 0 0 9 0 0 8 35 0 0 0 3 0 1 56
Total 5 1 4 5 1 0 55 29 6 5 209 170 4 1 6 12 2 2 517
College of Human Ecology
13.1209 Birth-Kindergarten Teacher Edu (BS) 0 0 0 0 0 0 4 0 0 0 14 0 0 0 0 0 0 0 18
19.0706 Child Life (BS) 0 0 2 0 0 0 4 0 0 0 13 1 0 0 2 0 0 0 22
43.0104 Criminal Justice (BS) 0 0 2 1 0 0 18 10 5 0 42 91 0 2 2 3 0 0 176
19.0707 Family Community Services (BS) 1 0 1 0 0 0 31 4 2 0 56 0 1 0 5 0 0 0 101
13.1308 Family and Consumer Science Education (BS) 0 0 0 0 0 0 1 0 0 0 2 0 0 0 0 0 0 0 3
52.0901 Hospitality Management (BS) 1 0 0 0 0 0 3 2 2 3 74 25 1 0 2 0 0 0 113
50.0408 Interior Design (BS) 0 0 1 0 0 0 0 0 0 0 17 0 0 0 0 0 0 0 18
19.0901 Merchandising (BS) 0 0 0 0 0 0 3 2 1 0 36 0 0 0 2 0 0 0 44
51.3101 Nutrition and Dietetics (BS) 0 0 1 1 0 0 2 0 1 0 25 4 0 0 3 0 0 0 37
44.0701 Social Work (BSW) 0 0 1 0 0 0 41 0 3 0 33 2 1 1 1 0 1 0 84
Total 2 0 8 2 0 0 107 18 14 3 312 123 3 3 17 3 1 0 616
College of Technology & Computer Science
11.0701 Computer Science (BA) 0 0 0 1 0 0 0 0 0 0 0 2 0 0 0 0 0 0 3
11.0701 Computer Science (BS) 0 0 0 1 0 0 0 1 0 1 0 14 0 0 0 1 0 1 19
15.9999 Construction Management (BS) 0 0 0 0 0 0 1 2 0 2 3 89 0 1 0 4 0 1 103
15.1301 Design (BS) 0 1 2 0 0 0 0 2 0 0 3 12 0 0 0 2 0 0 22
14.0101 Engineering (BS) 0 0 0 1 0 0 0 5 0 1 7 35 0 0 0 4 0 1 54
15.0612 Industl Distrib and Logistics (BS) 0 0 0 0 0 0 2 3 0 1 2 43 0 0 0 3 0 0 54
15.0613 Industrial Engineering Tech (BS) 0 0 0 0 0 0 0 0 0 0 1 7 0 0 0 1 0 0 9
15.0612 Industrial Technology (BS) 0 0 1 1 0 0 6 6 0 2 8 76 0 1 0 3 0 1 105
11.0103 Information and Computer Tech (BS) 0 1 0 1 0 0 0 3 0 2 2 16 0 0 0 2 0 0 27
Total 0 2 3 5 0 0 9 22 0 9 26 294 0 2 0 20 0 4 396
78

Unit Women Men Women Men Women Men Women Men Women Men Women Men Women Men Women Men Women Men All
Non-ResAlien
Undergraduate Degrees Conferred 2012-2013by Unit, Major, Ethnicity, and Gender
Am Indian Alaskan Nat Asian
Nat HawaiianPacific Islander
Black, African Amer, non-Hisp Hispanic
White, non-Hisp
Two or more races
Race & ethn unk.
Thomas Harriott College of Arts & Sciences
45.0201 Anthropology (BA) 1 0 1 1 0 0 1 0 0 0 6 6 0 0 4 0 0 0 20
40.0499 Atmospheric Sciences, Applied (BS) 0 0 0 0 0 0 0 0 0 0 0 1 0 0 0 0 0 0 1
26.0202 Biochemistry (BS) 0 0 2 2 0 0 1 0 1 0 3 10 1 0 1 0 0 0 21
26.0101 Biology (BS) 0 1 4 8 0 0 15 9 8 1 48 44 5 0 5 3 0 1 152
40.0501 Chemistry (BA) 0 0 1 5 0 0 2 2 3 0 18 23 1 0 1 2 0 1 59
40.0501 Chemistry (BS) 0 0 0 1 0 0 0 0 0 0 2 9 0 1 0 2 0 0 15
45.0601 Economics (BA) 0 0 0 0 0 0 0 1 1 2 1 2 0 0 0 1 0 0 8
45.0601 Economics (BS) 0 0 1 1 0 1 5 14 0 1 15 57 1 0 1 4 0 1 102
23.0101 English (BA) 1 0 0 0 0 0 7 3 1 1 54 14 2 2 5 0 0 0 90
16.0901 French (BA) 0 0 0 0 0 0 0 0 0 0 2 0 0 0 0 0 0 0 2
11.0401 Geog Info Scie and Tech (BS) 0 0 0 0 0 0 0 0 0 0 0 1 0 0 0 0 0 0 1
45.0701 Geography, Applied (BS) 0 0 0 0 0 0 0 1 0 0 3 5 0 0 0 0 0 0 9
40.0601 Geology (BS) 0 0 0 0 0 0 0 0 1 1 6 9 0 0 0 0 0 0 17
16.0501 German (BA) 0 0 0 0 0 0 0 0 1 0 2 2 0 0 0 1 0 0 6
16.0905 Hispanic Studies (BA) 0 0 1 0 0 0 0 0 2 1 11 2 0 0 4 0 0 0 21
13.1330 Hispanic Studies Education (BS) 0 0 0 0 0 0 0 0 1 0 1 0 0 0 0 0 0 0 2
54.0101 History (BA) 0 0 0 0 0 0 2 1 0 2 16 31 0 1 0 1 0 0 54
27.0101 Mathematics (BA) 0 0 0 0 0 0 0 0 0 0 8 2 1 0 0 0 0 0 11
27.0101 Mathematics (BS) 0 0 0 0 0 0 1 0 0 0 3 6 1 0 0 1 0 0 12
24.0101 Multidisciplinary Studies (BA) 0 0 0 0 0 0 3 0 1 1 9 9 0 1 1 1 0 0 26
24.0101 Multidisciplinary Studies (BS) 0 0 3 2 0 0 0 1 0 0 1 3 1 0 0 0 0 0 11
38.0101 Philosophy (BA) 0 0 0 0 0 0 1 1 0 0 1 5 0 0 0 0 0 0 8
40.0801 Physics (BS) 0 0 0 2 0 0 0 0 0 0 0 1 0 0 0 0 0 0 3
40.0801 Physics, Applied (BSAP) 0 0 0 0 0 0 0 1 0 0 0 1 0 0 0 0 0 0 2
45.1001 Political Science (BA) 0 0 1 0 0 0 0 1 1 0 15 13 0 0 1 0 0 0 32
45.1001 Political Science (BS) 0 0 1 0 0 0 1 2 0 0 12 30 1 0 0 3 0 0 50
42.0101 Psychology (BA) 1 0 4 1 0 0 29 6 4 2 91 35 4 0 8 2 0 1 188
54.0105 Public History (BS) 0 0 0 0 0 0 0 0 0 0 3 3 0 0 0 0 0 0 6
45.1101 Sociology (BA) 0 0 0 0 0 0 4 0 0 0 7 1 0 0 0 0 0 0 12
45.1101 Sociology, Applied (BS) 0 0 0 0 0 0 3 1 0 0 12 4 0 0 0 0 0 0 20
04.0301 Urban and Regional Planning (BS) 0 0 0 0 0 0 0 0 0 0 2 8 0 0 1 1 0 0 12
Total 3 1 19 23 0 1 75 44 25 12 352 337 18 5 32 22 0 4 973
College of Allied Health Sciences
51.1005 Clinical Laboratory Science (BS) 0 0 1 0 0 0 0 0 1 1 5 1 0 0 0 1 0 0 10
51.0706 Health Information Management (BS) 0 0 0 0 0 0 2 0 0 0 5 0 0 0 0 0 1 1 9
51.0701 Health Services Management (BS) 0 0 0 1 0 0 11 1 0 0 37 7 1 0 1 1 0 1 61
51.2310 Rehabilitation Services (BS) 0 0 2 0 0 0 6 1 1 0 24 3 1 0 1 1 0 0 40
51.0204 Speech and Hearing Sciences (BS) 0 0 0 0 0 0 0 0 0 0 31 2 0 0 1 0 0 0 34
Total 0 0 3 1 0 0 19 2 2 1 102 13 2 0 3 3 1 2 154
College of Nursing
51.3801 Nursing (BSN) 1 0 5 4 0 0 19 1 3 2 224 28 1 1 10 1 0 0 300
Total 1 0 5 4 0 0 19 1 3 2 224 28 1 1 10 1 0 0 300
Grand Total 13 5 62 50 3 2 354 177 77 47 2,066 1,376 35 21 99 85 7 16 4,495
Source: IPAR Graduated Student Data Files, Summer 2012 - Spring 2013
Note: Reporting year includes Summer 2012, Fall 2012, and Spring 2013 graduations.
Note: Double majors and dual degrees are counted as separate degrees, therefore the number of degrees conferred will be higher than the graduated student headcount.
79

Unit Women Men Women Men Women Men Women Men Women Men Women Men Women Men Women Men Women Men All
College of Business52.0301 Accounting (MSA) 0 0 3 0 0 0 1 1 0 0 20 26 0 0 0 0 1 0 52
52.0201 Business Administration (MBA) 0 0 3 4 0 0 11 8 1 2 68 101 4 2 5 4 3 1 217
Total 0 0 6 4 0 0 12 9 1 2 88 127 4 2 5 4 4 1 269
College of Education13.0403 Adult Education (MAED) 0 1 0 0 0 0 4 0 0 0 8 1 1 0 0 0 0 0 15
13.1399 Business Education (MAED) 0 0 0 0 0 0 2 0 0 0 1 0 0 0 0 0 0 0 3
13.1101 Counselor Education (MS) 0 0 0 0 0 0 4 0 0 0 17 1 0 1 0 0 0 0 23
13.0401 Educ Admin and Supervision (EDS) 0 0 0 0 0 0 2 0 0 0 0 2 0 0 0 0 0 0 4
13.0401 Educational Leadership (EDD) 0 0 0 0 0 0 2 1 0 0 7 3 0 0 1 0 0 0 14
13.1202 Elementary Education (MAED) 0 0 1 0 0 0 1 0 0 0 18 1 1 0 0 0 0 0 22
13.1305 English Education (MAED) 0 0 0 0 0 0 0 0 0 0 2 0 0 0 0 0 1 0 3
13.1299 General Teacher Education (MAT) 1 0 1 0 0 0 1 1 0 0 34 7 0 1 1 0 1 0 48
13.1328 History Education (MAED) 0 0 0 0 0 0 0 0 0 0 1 1 0 0 0 0 0 0 2
13.0501 Instructional Technology (MS) 1 0 0 0 0 0 1 1 0 0 8 6 0 0 0 0 0 0 17
13.0501 Instructional Technology Education (MAED) 0 0 0 0 0 0 0 0 1 0 25 4 0 1 1 0 0 0 32
25.0101 Library Science (MLS) 0 0 0 0 0 0 1 0 1 0 61 4 0 1 0 1 0 0 69
13.1311 Mathematics Education (MAED) 0 0 0 0 0 0 1 0 0 0 8 1 0 0 0 0 0 0 10
13.1203 Middle Grades Education (MAED) 0 0 0 0 0 0 2 0 0 0 0 1 0 0 0 0 0 0 3
13.1315 Reading Education (MAED) 1 0 0 0 0 0 4 0 0 0 27 0 0 0 1 0 0 0 33
13.0401 School Administration (MSAM) 0 0 0 0 0 0 14 4 3 0 44 10 0 0 1 0 0 0 76
13.1316 Science Education (MA) 0 0 0 0 0 0 0 1 0 0 0 0 0 0 0 0 0 0 1
13.1316 Science Education (MAED) 0 0 0 0 0 0 0 1 0 0 10 2 0 0 0 2 0 0 15
13.1011 Special Educ, Behavioral/Emotional Disabilities (MAED) 0 0 0 0 0 0 0 0 0 0 2 0 0 0 0 0 0 0 2
13.1011 Special Educ, Learning Disabilities (MAED) 1 0 0 0 0 0 1 0 0 0 9 0 0 0 2 0 0 0 13
13.1011 Special Educ, Low Incidence Disabilities (MAED) 0 0 0 0 0 0 0 0 0 0 10 2 0 0 0 0 0 0 12
13.1006 Special Educ, Mental Disabilities (MAED) 0 0 0 0 0 0 0 0 0 0 4 0 0 0 0 0 0 0 4
13.1319 Vocational Education (MS) 1 0 0 1 0 0 0 1 0 0 2 2 0 0 0 0 0 0 7
Total 5 1 2 1 0 0 40 10 5 0 298 48 2 4 7 3 2 0 428
College of Fine Arts & Communication 13.1302 Art Education (MAED) 0 0 0 0 0 0 0 0 1 0 5 2 0 0 1 0 0 0 950.0702 Art MFA (MFA) 0 0 0 0 0 0 0 1 0 0 10 7 0 0 2 1 0 0 2109.0101 Communication (MA) 0 0 0 0 0 0 4 1 0 0 6 4 0 0 1 0 0 0 1613.1312 Music Education (MM) 0 0 1 0 0 0 0 0 0 0 5 2 0 0 0 0 0 0 850.0903 Music Performance (MM) 0 0 0 0 0 0 0 0 0 1 2 8 0 0 0 0 0 2 1350.0904 Music Theory and Composition (MM) 0 0 0 0 0 0 0 0 0 0 1 0 0 0 0 0 0 0 1
Total 0 0 1 0 0 0 4 2 1 1 29 23 0 0 4 1 0 2 68
College of Health & Human Performance26.0999 Bioenergetics and Exercise Sci (PHD) 0 0 0 0 0 0 0 0 0 0 2 1 0 0 0 0 0 0 351.2202 Environmental Health (MSEH) 0 0 0 0 0 0 0 0 0 1 1 3 0 0 0 1 0 0 631.0505 Exercise Sport Science (MS) 0 0 0 0 0 0 0 2 0 0 9 14 0 0 0 0 0 0 2551.2207 Health Education and Promotion (MA) 1 0 1 0 0 0 4 1 0 0 23 0 0 0 0 0 0 0 3013.1307 Health Education and Promotion (MAED) 0 0 0 0 0 0 0 0 0 0 11 7 0 0 0 1 0 0 1913.1314 Physical Education (MAED) 0 0 0 0 0 0 0 0 0 0 2 4 0 0 0 0 0 0 631.0101 Recreation and Park Admin (MS) 0 0 0 0 0 0 0 1 0 0 3 4 0 0 0 0 1 0 951.2309 Recreational Therapy Administr (MS) 0 0 0 0 0 0 0 0 0 0 4 0 0 0 0 0 0 0 4
Total 1 0 1 0 0 0 4 4 0 1 55 33 0 0 0 2 1 0 102
2012-2013 Graduate Degrees Conferredby Unit, Major, Ethnicity, and Gender
Two or more races
Race & ethnicity unk
Non-ResAlien
Am Indian Alaskan Nat Asian
Nat HawaiianPacific Islander
Black or African Amer, Non-Hisp Hispanic
White, Non-Hisp
80

Unit Women Men Women Men Women Men Women Men Women Men Women Men Women Men Women Men Women Men All
2012-2013 Graduate Degrees Conferredby Unit, Major, Ethnicity, and Gender
Two or more races
Race & ethnicity unk
Non-ResAlien
Am Indian Alaskan Nat Asian
Nat HawaiianPacific Islander
Black or African Amer, Non-Hisp Hispanic
White, Non-Hisp
College of Human Ecology13.1209 Birth to Kindergarten Education (MAED) 0 0 0 0 0 0 1 0 0 0 6 0 0 0 1 0 0 0 819.0707 Child Development and Family Relations (MS) 0 0 0 0 0 0 1 0 1 0 6 0 0 0 0 0 0 0 843.0104 Criminal Justice (MS) 0 0 0 0 0 0 0 0 0 0 3 4 0 0 0 0 0 0 713.1399 Family and Consumer Sciences (MAED) 0 0 0 0 0 0 1 0 0 0 0 0 0 0 0 0 0 0 151.1505 Marriage and Family Therapy (MS) 0 0 0 0 0 0 2 0 1 0 9 3 1 0 1 0 0 0 1751.1505 Medical Family Therapy (PHD) 0 0 0 0 0 0 0 0 0 0 0 1 0 0 0 0 0 0 119.0501 Nutrition (MS) 0 0 0 0 0 0 0 0 0 0 11 0 0 0 0 0 0 0 1144.0701 Social Work (MSW) 0 0 0 0 0 0 14 3 0 0 32 6 0 0 4 0 0 0 59
Total 0 0 0 0 0 0 19 3 2 0 67 14 1 0 6 0 0 0 112
College of Technology & Computer Science11.0701 Computer Science (MS) 0 0 0 1 0 0 0 0 0 0 0 2 0 1 0 1 0 2 715.1001 Construction Management (MCM) 0 0 0 0 0 0 0 1 0 0 2 6 0 0 0 1 0 1 1151.2206 Occupational Safety (MS) 0 0 0 0 0 0 0 0 0 0 2 5 0 0 0 0 0 1 814.0903 Software Engineering (MS) 0 1 0 2 0 0 2 0 0 0 1 7 0 0 0 3 1 4 2115.0612 Technology Systems (MS) 0 2 0 0 0 0 1 3 0 1 4 19 2 0 1 3 1 0 37
Total 0 3 0 3 0 0 3 4 0 1 9 39 2 1 1 8 2 8 84
College of Arts & Sciences45.0201 Anthropology (MA) 0 0 0 1 0 0 1 0 0 0 0 1 0 0 0 0 0 1 445.0602 Applied and Resource Economics (MS) 0 0 0 0 0 0 0 0 0 0 0 5 0 0 0 0 3 0 826.0101 Biology (MS) 0 0 0 0 0 0 0 0 0 0 2 12 0 0 0 0 0 0 1426.0203 Biomedical Physics (PHD) 0 0 0 0 0 0 0 0 0 0 1 1 0 0 0 0 0 1 340.0501 Chemistry (MS) 0 0 0 2 0 0 0 0 0 0 1 3 0 0 0 0 2 0 842.2801 Clinical Psychology (MA) 0 0 0 0 0 0 1 0 0 0 5 1 0 0 0 0 0 0 723.0101 English (MA) 0 0 0 0 0 0 5 0 0 0 29 14 0 0 2 0 1 0 5145.0701 Geography (MA) 0 0 0 0 0 0 0 0 0 0 4 2 0 0 0 0 0 0 640.0601 Geology (MS) 0 0 0 0 0 0 1 1 0 0 4 4 0 0 0 0 0 0 1042.2810 Health Psychology (PHD) 0 0 0 0 0 0 0 0 0 0 1 0 0 0 0 0 0 0 154.0101 History (MA) 0 0 0 0 0 0 0 0 0 0 5 2 0 0 0 0 0 0 730.2001 International Studies (MA) 0 0 0 1 0 0 0 0 1 0 4 6 0 0 0 0 2 1 1530.9999 Maritime Studies (MA) 0 0 0 0 0 0 0 0 0 0 1 2 0 0 0 0 0 1 427.0101 Mathematics (MA) 0 0 0 0 0 0 0 0 0 0 2 7 0 0 0 0 0 0 926.0204 Molecular Biology and Biotech (MS) 0 0 1 1 0 0 0 0 0 0 3 4 0 0 0 0 1 0 1040.0801 Physics (MS) 0 0 1 1 0 0 1 0 0 0 2 4 0 1 0 0 0 0 1042.0101 Psychology (MA) 0 0 1 0 0 0 0 0 0 0 4 4 0 0 2 0 0 0 1144.0401 Public Administration (MPA) 0 0 0 0 0 0 1 0 1 0 7 3 0 0 1 0 1 0 1423.1303 Rhetoric Writing and Professional Comm (PhD) 0 0 0 0 0 0 1 0 0 0 2 1 0 0 0 0 0 0 442.2805 School Psychology (MA) 0 0 1 0 0 0 1 1 0 0 7 0 0 0 0 0 0 0 1042.2805 School Psychology (CAS) 0 0 0 0 0 0 0 1 0 0 6 0 0 0 0 0 0 0 730.0601 Security Studies (MS) 0 0 0 0 0 0 0 0 0 0 0 2 0 0 0 1 0 0 345.1101 Sociology (MA) 0 0 0 0 0 0 0 0 1 0 3 2 0 0 0 0 0 1 7
Total 0 0 4 6 0 0 12 3 3 0 93 80 0 1 5 1 10 5 223
81

Unit Women Men Women Men Women Men Women Men Women Men Women Men Women Men Women Men Women Men All
2012-2013 Graduate Degrees Conferredby Unit, Major, Ethnicity, and Gender
Two or more races
Race & ethnicity unk
Non-ResAlien
Am Indian Alaskan Nat Asian
Nat HawaiianPacific Islander
Black or African Amer, Non-Hisp Hispanic
White, Non-Hisp
College of Allied Health Sciences51.0202 Audiology (AUD) 0 0 0 0 0 0 0 0 0 0 1 1 0 0 0 0 0 0 251.0204 Communication Sciences and Disorders (MS) 0 0 0 0 0 0 2 0 2 0 42 0 1 0 4 0 0 0 5151.0204 Communication Sciences and Disorders (PHD) 0 0 0 0 0 0 0 0 0 0 1 2 0 0 0 0 0 0 351.2306 Occupational Therapy (MSOT) 0 0 0 0 0 0 0 0 0 0 16 3 0 0 2 1 0 0 2251.2308 Physical Therapy (DPT) 0 0 0 0 0 0 0 0 0 1 23 5 0 0 0 1 0 0 3051.0912 Physician Assistant Studies (MS) 0 0 1 0 0 0 1 0 1 0 22 6 0 0 0 0 0 0 3151.2310 Rehabilitation Counseling (MS) 1 0 0 0 0 0 0 1 0 0 6 1 2 0 1 0 0 0 1251.2310 Rehabilitation Counseling Administration (PHD) 0 0 0 0 0 0 0 0 0 0 0 1 0 0 0 0 0 0 151.1501 Substance Abuse Clinical Counseling (MS) 1 0 0 0 0 0 0 2 0 0 11 1 2 0 1 0 0 0 1851.2310 Vocational Evaluation (MS) 0 0 0 0 0 0 0 1 0 0 0 0 0 0 0 0 0 0 1
Total 2 0 1 0 0 0 3 4 3 1 122 20 5 0 8 2 0 0 171
School of Medicine26.0401 Anatomy and Cell Biology (PHD) 0 0 0 0 0 0 0 0 0 0 0 0 0 0 0 0 1 0 126.0202 Biochemistry and Molecular Biology (PHD) 0 0 0 0 0 0 0 0 0 0 0 2 0 0 0 0 0 0 226.0102 Biomedical Science (MS) 0 0 0 0 0 0 0 0 0 0 1 0 0 0 0 0 0 0 126.9999 Interdisciplinary Biological Science (PHD) 0 0 0 0 0 0 1 0 0 0 2 0 0 0 0 0 0 0 351.1201 Medicine (MD) 1 1 4 3 0 0 3 1 1 1 27 27 1 0 0 0 0 0 7026.0503 Microbiology and Immunology (PHD) 0 0 0 0 0 0 0 0 0 0 1 0 0 0 0 0 0 0 126.1007 Pharmacology and Toxicology (PHD) 0 0 2 0 0 0 0 0 0 0 0 1 0 0 0 0 0 1 426.0901 Physiology (PHD) 0 0 0 0 0 0 0 0 0 0 0 0 0 0 0 0 1 0 151.2201 Public Health (MPH) 0 0 3 0 0 0 4 3 0 0 20 9 0 1 0 0 0 1 41
Total 1 1 9 3 0 0 8 4 1 1 51 39 1 1 0 0 2 2 124
College of Nursing51.3805 Adult Gerontology Nurse Practitioner (C) 1 0 0 0 0 0 0 0 0 0 0 0 0 0 1 0 0 0 251.3813 Clinical Nurse Specialist (C) 0 0 0 0 0 0 0 0 0 0 1 0 0 0 0 0 0 0 151.3805 Family Nurse Practitioner (C) 0 0 0 0 0 0 0 0 0 0 2 0 0 0 0 0 0 0 251.3804 Nurse Anesthesia (C) 0 0 0 0 0 0 0 0 0 0 0 1 0 0 0 0 0 0 151.3807 Nurse Midwifery (C) 0 0 0 0 0 0 0 0 0 0 1 0 0 0 0 0 0 0 151.3899 Nursing (MSN) 2 0 2 0 0 1 13 0 4 0 107 11 0 0 5 0 0 0 14551.3808 Nursing (PHD) 0 0 0 0 0 0 2 0 0 0 2 1 0 0 1 0 0 0 651.3817 Nursing Education (C) 0 0 0 0 0 0 1 0 0 0 1 0 0 0 0 0 0 0 251.3802 Nursing Leadership (C) 0 0 0 0 0 0 0 0 0 0 0 0 1 0 0 0 0 0 1
Total 3 0 2 0 0 1 16 0 4 0 114 13 1 0 7 0 0 0 161
Graduate School30.9999 Coastal Resources Management (PHD) 0 0 1 0 0 0 0 0 0 0 4 1 0 0 1 0 0 0 730.9999 Sustainable Tourism (MS) 0 0 0 0 0 0 0 0 0 0 3 1 0 0 0 0 0 0 4
Total 0 0 1 0 0 0 0 0 0 0 7 2 0 0 1 0 0 0 11
Grand Total 12 5 27 17 0 1 121 43 20 7 933 438 16 9 44 21 21 18 1,753
Source: Graduated Student Data File 2012-2013.Note: Reporting year includes summer, fall, and spring graduations.Note: Double majors and dual degrees are counted as separate degrees, therefore the number of degrees conferred will be higher than the graduated student headcount.
82

White
Unknown/
Cohort Description Other Non-Res Alien Total
2007 First-Time, Full-Time Men 10 39 183 33 1,262 122 13 1,662
Original Freshman Cohort Women 16 45 359 52 1,861 185 16 2,534
Total 26 84 542 85 3,123 307 29 4,196
2007 First-Time, Full-Time Men 10 39 183 33 1,262 122 13 1,662
Adjusted Freshman Cohort Women 16 45 359 52 1,860 185 16 2,533
Total 26 84 542 85 3,122 307 29 4,195
Graduating after 4 years Men 0 11 33 5 313 27 5 394
Women 4 13 106 17 690 70 6 906
Total 4 24 139 22 1,003 97 11 1,300
% of Cohort 15.38% 28.57% 25.65% 25.88% 32.13% 31.60% 37.93% 30.99%
Cumulative % Graduated 15.38% 28.57% 25.65% 25.88% 32.13% 31.60% 37.93% 30.99%
Graduating after 5 years Men 3 8 44 8 299 26 2 390
Women 0 11 77 13 344 39 6 490
Total 3 19 121 21 643 65 8 880
% of Cohort 12.13% 22.96% 22.37% 25.01% 20.61% 21.28% 28.89% 20.98%
Cumulative % Graduated 27.51% 51.53% 48.02% 50.89% 52.73% 52.87% 66.83% 51.97%
Graduating after 6 years Men 1 4 6 2 67 7 0 87
Women 1 2 21 2 72 7 2 107
Total 2 6 27 4 139 14 2 194
% of Cohort 7.69% 7.14% 4.98% 4.71% 4.45% 4.56% 6.90% 4.62%
Cumulative % Graduated 35.21% 58.67% 53.00% 55.60% 57.19% 57.43% 73.72% 56.59%
Cumulative Total Graduating 9 49 287 47 1,785 176 21 2,374
HispanicHispanicAsianGender
Source: Graduated Student Data Files, Student Data Files: SDF Fall 2007, GSDF Fall 2008 through Summer 2013.
Note: The original cohort includes students who were first-time, full-time, degree-seeking students, some of whom
may still be enrolled, or who may have either "stopped out", dropped out, or transferred to other institutions.
Note: The adjusted cohort excludes members of the original cohort who are deceased or permanently disabled,
who entered the U.S. military service, the U.S. foreign service or the foreign aid service of the U.S.
government, or who joined official church missions before graduation.
Note: Race categories reflect those in use at students' entry into ECU
American
Gender and Ethnic Distribution of Entering
and Graduating 2007 Freshman Cohort
Indian/
Nat. Alask
Black,
Non-
Hispanic
Non-
83

Reg. Term Dist. Ed Total % Total Reg. Term Dist. Ed Total % Total
College / School SCH SCH SCH SCH College / School SCH SCH SCH SCH
College of Arts and Sciences 132,315 5,569 137,884 43.3% 1 College of Arts and Sciences 126,894 5,926 132,820 41.7% 1
College of Business 26,188 8,258 34,446 10.8% 2 College of Business 26,347 8,102 34,449 10.8% 2
Col Fine Arts and Communic 26,604 3,335 29,939 9.4% 3 Col Fine Arts and Communic 26,395 3,651 30,046 9.4% 3
College of Human Ecology 23,221 3,588 26,809 8.4% 4 College of Education 16,957 11,120 28,077 8.8% 4
College of Education 14,581 10,189 24,770 7.8% 5 College of Human Ecology 23,454 3,856 27,310 8.6% 5
Col of Health and Human Perf 22,969 1,605 24,574 7.7% 6 Col of Health and Human Perf 23,396 1,957 25,353 8.0% 6
Col of Technology and Comp Sci 11,617 2,732 14,349 4.5% 7 Col of Technology and Comp Sci 11,551 2,847 14,398 4.5% 7
College of Nursing 7,848 4,426 12,274 3.9% 8 College of Nursing 8,230 3,876 12,106 3.8% 8
College of Allied Health 9,387 2,285 11,672 3.7% 9 College of Allied Health 9,258 2,177 11,435 3.6% 9
Brody School of Medicine 1,491 393 1,884 0.6% 10 Brody School of Medicine 1,559 283 1,842 0.6% 10
Research and Graduate Studies 67 13 80 0.0% 11 Research and Graduate Studies 122 6 128 0.0% 11
Total College / School SCH 276,288 42,393 318,681 100.0% Total College / School SCH 274,163 43,801 317,964 100.0%
Biology 19,664 1,026 20,690 15.0% 1 Biology 18,564 887 19,451 14.1% 1
English 18,321 1,437 19,758 14.3% 2 English 16,350 1,770 18,120 13.1% 2
Mathematics 14,745 561 15,306 11.1% 3 Mathematics 14,343 615 14,958 10.8% 3
Psychology 14,552 442 14,994 10.9% 4 Psychology 13,214 1,010 14,224 10.3% 4
Chemistry 10,386 10,386 7.5% 5 Chemistry 10,866 10,866 7.9% 5
Sociology 8,304 141 8,445 6.1% 6 Sociology 7,569 75 7,644 5.5% 6
Economics 6,867 84 6,951 5.0% 7 Economics 6,678 255 6,933 5.0% 7
History 5,656 442 6,098 4.4% 8 History 6,047 163 6,210 4.5% 8
Foreign Language 5,756 30 5,786 4.2% 9 Philosophy 5,097 663 5,760 4.2% 9
Philosophy 4,986 675 5,661 4.1% 10 Foreign Language 5,694 15 5,709 4.1% 10
Physics 5,225 20 5,245 3.8% 11 Geography, Planning and Envir 5,296 140 5,436 3.9% 11
Anthropology 4,774 194 4,968 3.6% 12 Physics 4,773 4,773 3.5% 12
Political Science 4,656 193 4,849 3.5% 13 Geological Sciences 4,355 4,355 3.2% 13
Geography, Planning and Envir 4,367 324 4,691 3.4% 14 Anthropology 4,070 129 4,199 3.0% 14
Geological Sciences 4,056 4,056 2.9% 15 Political Science 3,978 204 4,182 3.0% 15
Subtotal Arts & Sciences Departments 132,315 5,569 137,884 100.0% Subtotal Arts & Sciences Departments 126,894 5,926 132,820 100.0%
Religious Studies 1,506 1,506 29.8% 1 Religious Studies 1,659 1,659 32.8% 1
Classical Studies 953 953 18.8% 2 Classical Studies 850 850 16.8% 2
Honors College 661 661 13.1% 3 Honors College 677 677 13.4% 3
Leadership Studies 378 378 7.5% 4 Women's Studies 366 366 7.2% 4
Women's Studies 321 321 6.3% 5 Gerontology 186 144 330 6.5% 5
International Studies 231 231 4.6% 6 International Studies 210 210 4.2% 6
Ethnic Studies 117 45 162 3.2% 7 African/African American Studies 138 138 2.7% 7
Gerontology 72 78 150 3.0% 8 Ethnic Studies 132 132 2.6% 8
African/African American Studies 144 144 2.8% 9 Costal Resource Management 123 1 124 2.5% 9
Costal Resource Management 114 114 2.3% 10 Coastal Studies 99 99 2.0% 10
Coastal Studies 108 108 2.1% 11 Biomedical Science 52 52 1.0% 11
Asian Studies 72 72 1.4% 12 Biological Sciences 44 44 0.9% 12
Medieval and Renaissance 66 66 1.3% 13 Russian Studies 42 42 0.8% 13
Biomedical Science 56 56 1.1% 14 Interdisciplinary Neuroscience 39 39 0.8% 14
Great Books 54 54 1.1% 15 Multidisciplinary Studies 33 33 0.7% 15
Biological Sciences 42 42 0.8% 16 Great Books 33 33 0.7% 15
Interdisciplinary Neuroscience 24 24 0.5% 17 Medieval and Renaissance 24 24 0.5% 17
Multidisciplinary Studies 15 15 0.3% 18 Asian Studies 21 21 0.4% 18
Leadership Studies 6 6 0.1% 19
Total Interdisciplinary SCH 4,934 123 5,057 100.0% Total Interdisciplinary SCH 4,734 145 4,879 100.0%
Grand Total SCH 281,222 42,516 323,738 Grand Total SCH 278,897 43,946 322,843
Source: Student Courseload File submitted to UNC-GA, Fall 2012 & 2013.
Note: Schools and departments are ranked by SCH production as a percent of total SCH.
Note: Does not include Brody School of Medicine MD program, School of Dental Medicine DMD program, or nonfundable SCHs.
Arts & Sciences Departments Arts & Sciences Departments
Interdisciplinary Studies Interdisciplinary Studies
Student Credit HoursProduced by Units in the Fall Semester
Fall 2013
Rank
Fall 2012
Rank
84

Faculty & Staff
Highlights In the Fall 2013 semester:
ECU employed 2,043 full-time, part-time, and temporary faculty.
47% of the faculty were women.
13% of the faculty were ethnic minorities (Hispanic of any race, American Indian or Alaska Native, Asian, Black or African American, or Native Hawaiian or Other Pacific Islander).
51% of the faculty were under the age of 50; the average age of faculty members of
all ranks was 50.
83% of non-administrative faculty (including temporary faculty but excluding Brody School of Medicine and School of Dental Medicine) were employed on a full-time basis, and 60% of were tenured or on tenure track.
The average salary for all ranks of faculty (excluding Brody School of Medicine and
School of Dental Medicine) was $72,203.
35% of ECU’s total workforce was faculty.
20% of the total workforce were ethnic minorities (Hispanic of any race, American Indian or Alaska Native, Asian, Black or African American, or Native Hawaiian or Other Pacific Islander).
ECU employed 3,566 (62%) women and 2,232 (38%) men.
85

Rank N % of Rank N % of Rank N % of Total
Professor 91 23.3% 299 76.7% 390 19.1%Associate Professor 259 42.1% 356 57.9% 615 30.1%Assistant Professor 345 55.6% 275 44.4% 620 30.3%Instructor 267 63.9% 151 36.1% 418 20.5%
Total 962 47.1% 1,081 52.9% 2,043 100.0%
Source: Personnel Data File, Fall 2013.
Note: Faculty headcount includes BSOM, School of Dental Medicine, and temporary positions; but does not include ROTC faculty, faculty on leave without pay, or faculty serving as administrators.
Full and Part-Time Facultyby Rank and Gender
Women Men Total
0
50
100
150
200
250
300
350
400
Professor Associate Professor Assistant Professor Instructor
Women Men
86

% of % of % of % of % of % of % of % of % ofRank N Rank N Rank N Rank N Rank N Rank N Rank N Rank N Rank N Rank N FTE
Professor 1 0.3% 12 3.1% 5 1.3% 0 0.0% 16 4.1% 12 3.1% 0 0.0% 341 87.4% 3 0.8% 390 367.8Associate Professor 4 0.7% 9 1.5% 10 1.6% 3 0.5% 60 9.8% 32 5.2% 1 0.2% 494 80.3% 2 0.3% 615 599.3Assistant Professor 3 0.5% 147 23.7% 12 1.9% 3 0.5% 42 6.8% 32 5.2% 0 0.0% 379 61.1% 2 0.3% 620 591.0Instructor 0 0.0% 52 12.4% 5 1.2% 0 0.0% 8 1.9% 17 4.1% 0 0.0% 334 79.9% 2 0.5% 418 300.7
Total and % of Total 8 0.4% 220 10.8% 32 1.6% 6 0.3% 126 6.2% 93 4.6% 1 0.0% 1,548 75.8% 9 0.4% 2,043 1,858.7
Source: Personnel Data File, Fall 2013.
Note: Race/ethnicity reported using the new race/ethnicity categories as required by IPEDS.
Note: Faculty headcount includes BSOM, School of Dental Medicine, and temporary positions; but does not include ROTC faculty, faculty on leave without pay, or faculty serving as administrators.
Full and Part-Time Facultyby Race/Ethnicity
Black or African
American
Native Hawaiian or Other Pacific
WhiteTwo or more races
TotalNon
Resident Alien
UnknownHispanic
of any race
American Indian or Alaska Native
Asian
0
20
40
60
80
100
120
140
160
Professor Associate Professor Assistant Professor Instructor
Number of Minority Faculty
Non Resident Alien Unknown Hispanic of any race
American Indian or Alaska Native Asian Black or African American
Native Hawaiian or Other Pacific Islander Two or more races
87

Age Interval N % of Total N % of Total N % of Total
Under 25 0 0.2% 7 0.0% 3 0.3%25-29 55 2.9% 77 2.7% 42 3.8%30-39 415 22.1% 450 20.7% 426 22.0%40-49 525 25.4% 518 26.2% 535 25.3%50-59 567 28.7% 577 28.3% 528 28.2%60-65 300 13.9% 278 15.0% 313 13.6%
Over 65 142 6.9% 138 7.1% 196 6.7%
Total 2,004 100.0% 2,045 100.0% 2,043 100.0%
Source: Personnel Data Files, Fall 2011 through 2013.
Note: Faculty headcount includes BSOM, School of Dental Medicine, and temporary positions; but does not include ROTC faculty, faculty on leave without pay, or faculty serving as administrators.
201320122011
Full and Part-Time Faculty by Age Interval
0
100
200
300
400
500
600
700
Under 25 25‐29 30‐39 40‐49 50‐59 60‐65 Over 65
2011 2012 2013
88

Rank N Average Age N Average Age N Average Age
Professor 91 60 299 61 390 61Associate Professor 259 52 356 52 615 52Assistant Professor 345 44 275 42 620 43Instructor 267 46 151 47 418 47
All Ranks 962 48 1,081 51 2,043 50
Source: Personnel Data File, Fall 2013.
Note: Faculty headcount includes BSOM, School of Dental Medicine, and temporary positions; but does not include ROTC faculty, faculty on leave without pay, or faculty serving as administrators.
Women Men Total
Full and Part-Time Faculty Average Ageby Rank and Gender
0
10
20
30
40
50
60
70
Professor Associate Professor Assistant Professor Instructor
Faculty Average Age by Rank and Gender
Women Men Total
89
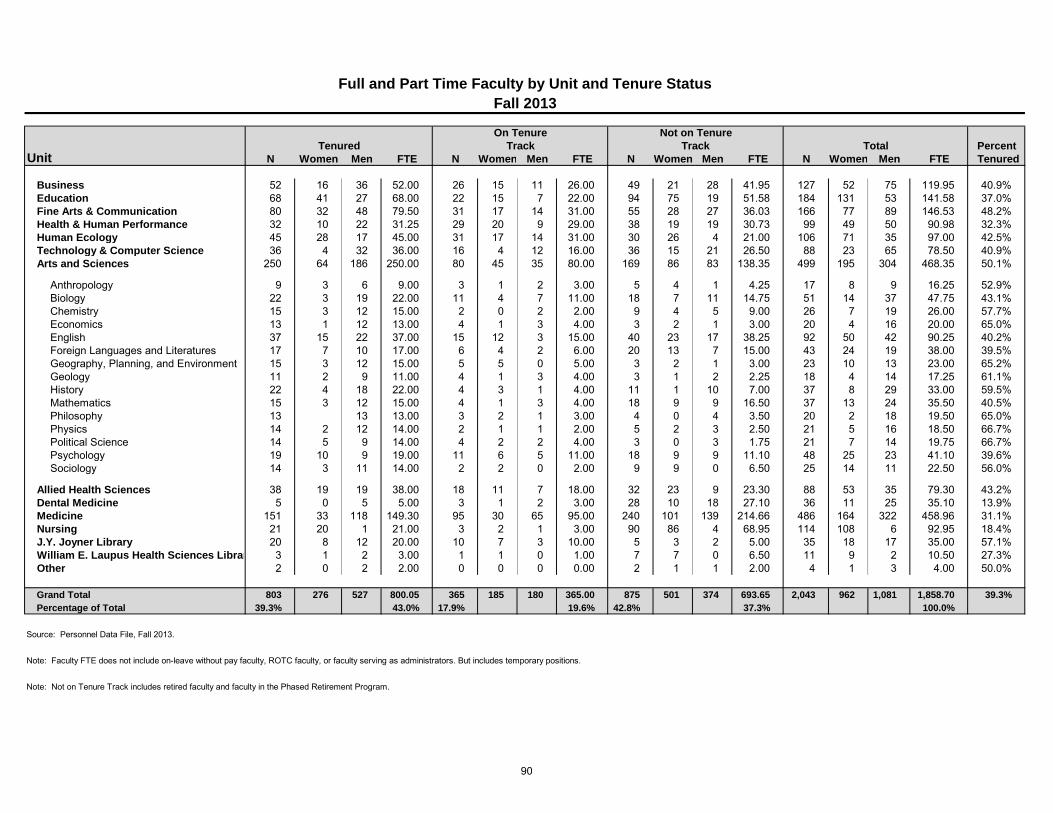
Percent
N Women Men FTE N Women Men FTE N Women Men FTE N Women Men FTE Tenured
Business 52 16 36 52.00 26 15 11 26.00 49 21 28 41.95 127 52 75 119.95 40.9%
Education 68 41 27 68.00 22 15 7 22.00 94 75 19 51.58 184 131 53 141.58 37.0%
Fine Arts & Communication 80 32 48 79.50 31 17 14 31.00 55 28 27 36.03 166 77 89 146.53 48.2%
Health & Human Performance 32 10 22 31.25 29 20 9 29.00 38 19 19 30.73 99 49 50 90.98 32.3%
Human Ecology 45 28 17 45.00 31 17 14 31.00 30 26 4 21.00 106 71 35 97.00 42.5%
Technology & Computer Science 36 4 32 36.00 16 4 12 16.00 36 15 21 26.50 88 23 65 78.50 40.9%
Arts and Sciences 250 64 186 250.00 80 45 35 80.00 169 86 83 138.35 499 195 304 468.35 50.1%
Anthropology 9 3 6 9.00 3 1 2 3.00 5 4 1 4.25 17 8 9 16.25 52.9%
Biology 22 3 19 22.00 11 4 7 11.00 18 7 11 14.75 51 14 37 47.75 43.1%
Chemistry 15 3 12 15.00 2 0 2 2.00 9 4 5 9.00 26 7 19 26.00 57.7%
Economics 13 1 12 13.00 4 1 3 4.00 3 2 1 3.00 20 4 16 20.00 65.0%
English 37 15 22 37.00 15 12 3 15.00 40 23 17 38.25 92 50 42 90.25 40.2%
Foreign Languages and Literatures 17 7 10 17.00 6 4 2 6.00 20 13 7 15.00 43 24 19 38.00 39.5%
Geography, Planning, and Environment 15 3 12 15.00 5 5 0 5.00 3 2 1 3.00 23 10 13 23.00 65.2%
Geology 11 2 9 11.00 4 1 3 4.00 3 1 2 2.25 18 4 14 17.25 61.1%
History 22 4 18 22.00 4 3 1 4.00 11 1 10 7.00 37 8 29 33.00 59.5%
Mathematics 15 3 12 15.00 4 1 3 4.00 18 9 9 16.50 37 13 24 35.50 40.5%
Philosophy 13 13 13.00 3 2 1 3.00 4 0 4 3.50 20 2 18 19.50 65.0%
Physics 14 2 12 14.00 2 1 1 2.00 5 2 3 2.50 21 5 16 18.50 66.7%
Political Science 14 5 9 14.00 4 2 2 4.00 3 0 3 1.75 21 7 14 19.75 66.7%
Psychology 19 10 9 19.00 11 6 5 11.00 18 9 9 11.10 48 25 23 41.10 39.6%
Sociology 14 3 11 14.00 2 2 0 2.00 9 9 0 6.50 25 14 11 22.50 56.0%
Allied Health Sciences 38 19 19 38.00 18 11 7 18.00 32 23 9 23.30 88 53 35 79.30 43.2%
Dental Medicine 5 0 5 5.00 3 1 2 3.00 28 10 18 27.10 36 11 25 35.10 13.9%
Medicine 151 33 118 149.30 95 30 65 95.00 240 101 139 214.66 486 164 322 458.96 31.1%
Nursing 21 20 1 21.00 3 2 1 3.00 90 86 4 68.95 114 108 6 92.95 18.4%
J.Y. Joyner Library 20 8 12 20.00 10 7 3 10.00 5 3 2 5.00 35 18 17 35.00 57.1%
William E. Laupus Health Sciences Library 3 1 2 3.00 1 1 0 1.00 7 7 0 6.50 11 9 2 10.50 27.3%
Other 2 0 2 2.00 0 0 0 0.00 2 1 1 2.00 4 1 3 4.00 50.0%
Grand Total 803 276 527 800.05 365 185 180 365.00 875 501 374 693.65 2,043 962 1,081 1,858.70 39.3%
Percentage of Total 39.3% 43.0% 17.9% 19.6% 42.8% 37.3% 100.0%
Source: Personnel Data File, Fall 2013.
Note: Not on Tenure Track includes retired faculty and faculty in the Phased Retirement Program.
Note: Faculty FTE does not include on-leave without pay faculty, ROTC faculty, or faculty serving as administrators. But includes temporary positions.
Full and Part Time Faculty by Unit and Tenure Status
Fall 2013
UnitTenured Track
On Tenure
Track
Not on Tenure
Total
90

Full-Time Part-Time Full-Time Part-Time Total
Unit FTE FTE FTE FTE FTE
Business 47.0 1.8 68.0 3.2 119.95
Education 80.0 17.5 37.0 7.1 141.58
Fine Arts & Communication 58.0 8.4 73.0 7.2 146.53
Health & Human Performance 43.0 2.1 44.0 1.9 90.98
Human Ecology 59.0 5.3 32.0 0.8 97.00
Technology & Computer Science 16.0 2.0 58.0 2.5 78.50
Arts and Sciences 168.0 13.6 270.0 16.8 468.35
Anthropology 6.0 1.3 9.0 0.0 16.25Biology 13.0 0.5 32.0 2.3 47.75Chemistry 7.0 0.0 19.0 0.0 26.00Economics 4.0 0.0 16.0 0.0 20.00English 47.0 1.8 40.0 1.5 90.25Foreign Languages and Literatures 19.0 3.0 14.0 2.0 38.00Geography, Planning, and Environment 10.0 0.0 13.0 0.0 23.00Geology 4.0 0.0 13.0 0.3 17.25History 8.0 0.0 21.0 4.0 33.00Mathematics 11.0 1.0 23.0 0.5 35.50Philosophy 2.0 0.0 16.0 1.5 19.50Physics 3.0 0.8 14.0 0.8 18.50Political Science 7.0 0.0 11.0 1.8 19.75Psychology 18.0 2.9 18.0 2.3 41.10Sociology 9.0 2.5 11.0 0.0 22.50
Allied Health Sciences 43.0 3.3 32.0 1.0 79.30
Dental Medicine 10.0 0.8 24.0 0.3 35.10
Medicine 133.0 18.7 292.0 15.3 458.96
Nursing 75.0 12.0 6.0 0.0 92.95
J.Y. Joyner Library 18.0 0.0 17.0 0.0 35.00
William E. Laupus Health Sciences Library 8.0 0.5 2.0 0.0 10.50
Other 1.0 0.0 3.0 0.0 4.00
Grand Total 759.0 85.8 958.0 55.9 1,858.70
Percentage of Total 40.8% 4.6% 51.5% 3.0%
Note: Faculty counts are based on home department assignments as recorded in the Personnel Data File, and are calculated in conformance to UNC-GA policy, which assumes that one faculty member does not exceed one full-time equivalent (FTE).
Source: Personnel Data File, Fall 2013.
Women Men
Faculty FTE (Full-Time Equivalent)by Unit, Gender, and Full or Part-Time Status
Note: Faculty FTE does not include on-leave without pay faculty, ROTC faculty, or faculty serving as administrators. But includes temporary positions.
91

Type of % Row % Row % Row % Row % Row % RowYear Employee N FTE N FTE FTE N FTE N FTE FTE N FTE N FTE FTE N FTE
2013 Faculty 645 47.3% 2 0.8 0.05% 267 19.6% 0 0.0 0.00% 346 25.4% 261 105.9 7.76% 1,521 1,364.6Admin. 31 97.6% 0 0.0 0.00% 0 0.00% 0 0.0 0.00% 0 0.0% 2 0.8 2.36% 33 31.8Total 676 48.4% 2 0.8 0.05% 267 19.1% 0 0.0 0.00% 346 24.8% 263 106.6 7.64% 1,554 1,396.4
2012 Faculty 626 45.6% 7 3.8 0.27% 295 21.5% 1 1.0 0.07% 331 24.1% 286 114.7 8.36% 1,546 1,371.4Admin. 33 97.1% 0 0.0 0.00% 0 0.00% 0 0.0 0.00% 1 2.9% 0 0.0 0.00% 34 34.0Total 659 46.9% 7 3.8 0.27% 295 21.0% 1 1.0 0.07% 332 23.6% 286 114.7 8.16% 1,580 1,405.4
2011 Faculty 640 46.5% 6 4.4 0.32% 310 22.5% 0 0.0 0.00% 325 23.6% 234 97.6 7.09% 1,515 1,377.0Admin. 33 94.5% 1 0.9 2.66% 1 2.86% 0 0.0 0.00% 0 0.0% 0 0.0 0.00% 35 34.9Total 673 47.7% 7 5.4 0.38% 311 22.0% 0 0.0 0.00% 325 23.0% 234 97.6 6.91% 1,550 1,412.0
2010 Faculty 630 43.7% 3 1.3 0.09% 347 24.1% 0 0.7 0.05% 355 24.6% 258 108.0 7.49% 1,593 1,442.0Admin. 33 100.0% 0 0.0 0.00% 0 0.0% 0 0.0 0.00% 0 0.0% 0 0.0 0.00% 33 33.0Total 663 45.0% 3 1.3 0.08% 347 23.5% 0 0.7 0.05% 355 24.1% 258 108.0 7.32% 1,626 1,475.0
2009 Faculty 593 42.3% 3 1.3 0.09% 378 26.9% 0 0.0 0.00% 349 24.9% 207 81.6 5.81% 1,530 1,402.8Admin. 36 100.0% 0 0.0 0.00% 0 0.0% 0 0.0 0.00% 0 0.0% 0 0.0 0.00% 36 36.0Total 629 43.7% 3 1.3 0.09% 378 26.3% 0 0.0 0.00% 349 24.3% 207 81.6 5.67% 1,566 1,438.8
2008 Faculty 559 38.3% 5 2.0 0.14% 419 28.7% 1 0.0 0.00% 361 24.8% 292 116.6 8.00% 1,637 1,457.6Admin. 24 100.0% 0 0.0 0.00% 0 1.0% 0 0.0 0.00% 0 0.0% 0 0.0 0.00% 24 24.0Total 583 39.3% 5 2.0 0.14% 419 28.3% 1 0.0 0.00% 361 24.4% 292 116.6 7.87% 1,661 1,481.6
2007 Faculty 514 37.2% 1 0.3 0.02% 393 28.5% 3 1.3 0.09% 361 26.1% 274 111.6 8.08% 1,546 1,381.2Admin. 38 95.0% 0 0.0 0.00% 1 1.0% 0 0.0 0.00% 1 2.5% 0 0.0 0.00% 40 40.0Total 552 38.8% 1 0.3 0.02% 394 27.7% 3 1.3 0.09% 362 25.5% 274 111.6 7.85% 1,586 1,421.2
2006 Faculty 446 34.3% 6 4.0 0.31% 376 28.9% 8 5.3 0.41% 371 28.5% 253 99.0 7.61% 1,460 1,301.4Admin. 55 79.3% 1 0.8 1.21% 3 3.0% 0 0.0 0.00% 10 14.4% 1 0.5 0.72% 70 69.3Total 501 36.6% 7 4.9 0.35% 379 27.6% 8 5.3 0.39% 381 27.8% 254 99.5 7.26% 1,530 1,370.7
2005 Faculty 448 37.1% 14 8.1 0.67% 325 26.9% 6 3.7 0.31% 331 27.4% 239 92.1 7.62% 1,363 1,207.9Admin. 61 72.7% 2 1.3 1.60% 2 2.4% 0 0.0 0.00% 19 22.6% 1 0.6 0.71% 85 83.9Total 509 39.4% 16 9.4 0.73% 327 25.3% 6 3.7 0.29% 350 27.1% 240 92.7 7.17% 1,448 1,291.8
2004 Faculty 440 37.8% 10 5.3 0.45% 317 27.2% 3 1.9 0.16% 322 27.7% 192 78.3 6.72% 1,284 1,164.5Admin. 55 70.9% 0 0.0 0.00% 3 3.9% 0 0.0 0.00% 19 24.5% 1 0.6 0.77% 78 77.6Total 495 39.9% 10 5.3 0.42% 320 25.8% 3 1.9 0.15% 341 27.5% 193 78.9 6.35% 1,362 1,242.1
Note: Faculty count excludes BSOM, School of Dental Medicine, and ROTC faculty.
Source: Personnel Data Files, Fall 2004 through Fall 2013; totals may be inexact due to rounding.
Note: Tenured and tenure-track faculty who are on leave-without-pay to work on other projects or grants are included. Not on Tenure Track includes faculty who were tenured or on tenure track but are now retired but still teaching, or are in the phased retirement program.
Note: Total faculty shown in this table may differ from other IPAR tables due to the inclusion of faculty in administrative positions. Faculty who meet the following criteria are included: currently employed in an EPA position; coded as Faculty, Executive Administrators, or 3 Academics & Professionals w/ Administrative Assignments with rank of Professor, Associate Professor, Assistant Professor, Instructor, or Lecturer; and have a rank modifier of None, Distinguished, Clinical, Research, Librarian, Visiting, or Teaching.
TotalPart-timePart-timePart-time
Longitudinal Profile of Faculty Tenure Status(Brody School of Medicine and School of Dental Medicine Excluded)
Full-time Full-time Full-time
On Tenure TrackTenured Not on Tenure Track
92
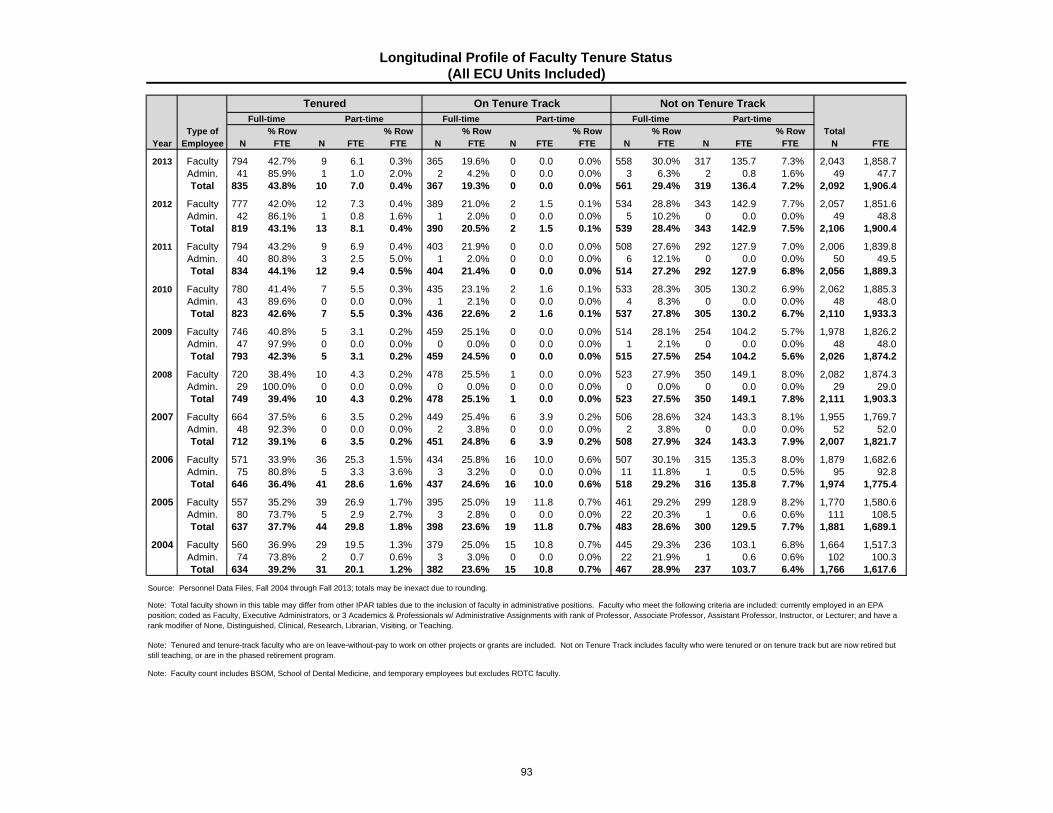
Type of % Row % Row % Row % Row % Row % Row TotalYear Employee N FTE N FTE FTE N FTE N FTE FTE N FTE N FTE FTE N FTE
2013 Faculty 794 42.7% 9 6.1 0.3% 365 19.6% 0 0.0 0.0% 558 30.0% 317 135.7 7.3% 2,043 1,858.7Admin. 41 85.9% 1 1.0 2.0% 2 4.2% 0 0.0 0.0% 3 6.3% 2 0.8 1.6% 49 47.7Total 835 43.8% 10 7.0 0.4% 367 19.3% 0 0.0 0.0% 561 29.4% 319 136.4 7.2% 2,092 1,906.4
2012 Faculty 777 42.0% 12 7.3 0.4% 389 21.0% 2 1.5 0.1% 534 28.8% 343 142.9 7.7% 2,057 1,851.6Admin. 42 86.1% 1 0.8 1.6% 1 2.0% 0 0.0 0.0% 5 10.2% 0 0.0 0.0% 49 48.8Total 819 43.1% 13 8.1 0.4% 390 20.5% 2 1.5 0.1% 539 28.4% 343 142.9 7.5% 2,106 1,900.4
2011 Faculty 794 43.2% 9 6.9 0.4% 403 21.9% 0 0.0 0.0% 508 27.6% 292 127.9 7.0% 2,006 1,839.8Admin. 40 80.8% 3 2.5 5.0% 1 2.0% 0 0.0 0.0% 6 12.1% 0 0.0 0.0% 50 49.5Total 834 44.1% 12 9.4 0.5% 404 21.4% 0 0.0 0.0% 514 27.2% 292 127.9 6.8% 2,056 1,889.3
2010 Faculty 780 41.4% 7 5.5 0.3% 435 23.1% 2 1.6 0.1% 533 28.3% 305 130.2 6.9% 2,062 1,885.3Admin. 43 89.6% 0 0.0 0.0% 1 2.1% 0 0.0 0.0% 4 8.3% 0 0.0 0.0% 48 48.0Total 823 42.6% 7 5.5 0.3% 436 22.6% 2 1.6 0.1% 537 27.8% 305 130.2 6.7% 2,110 1,933.3
2009 Faculty 746 40.8% 5 3.1 0.2% 459 25.1% 0 0.0 0.0% 514 28.1% 254 104.2 5.7% 1,978 1,826.2Admin. 47 97.9% 0 0.0 0.0% 0 0.0% 0 0.0 0.0% 1 2.1% 0 0.0 0.0% 48 48.0Total 793 42.3% 5 3.1 0.2% 459 24.5% 0 0.0 0.0% 515 27.5% 254 104.2 5.6% 2,026 1,874.2
2008 Faculty 720 38.4% 10 4.3 0.2% 478 25.5% 1 0.0 0.0% 523 27.9% 350 149.1 8.0% 2,082 1,874.3Admin. 29 100.0% 0 0.0 0.0% 0 0.0% 0 0.0 0.0% 0 0.0% 0 0.0 0.0% 29 29.0Total 749 39.4% 10 4.3 0.2% 478 25.1% 1 0.0 0.0% 523 27.5% 350 149.1 7.8% 2,111 1,903.3
2007 Faculty 664 37.5% 6 3.5 0.2% 449 25.4% 6 3.9 0.2% 506 28.6% 324 143.3 8.1% 1,955 1,769.7Admin. 48 92.3% 0 0.0 0.0% 2 3.8% 0 0.0 0.0% 2 3.8% 0 0.0 0.0% 52 52.0Total 712 39.1% 6 3.5 0.2% 451 24.8% 6 3.9 0.2% 508 27.9% 324 143.3 7.9% 2,007 1,821.7
2006 Faculty 571 33.9% 36 25.3 1.5% 434 25.8% 16 10.0 0.6% 507 30.1% 315 135.3 8.0% 1,879 1,682.6Admin. 75 80.8% 5 3.3 3.6% 3 3.2% 0 0.0 0.0% 11 11.8% 1 0.5 0.5% 95 92.8Total 646 36.4% 41 28.6 1.6% 437 24.6% 16 10.0 0.6% 518 29.2% 316 135.8 7.7% 1,974 1,775.4
2005 Faculty 557 35.2% 39 26.9 1.7% 395 25.0% 19 11.8 0.7% 461 29.2% 299 128.9 8.2% 1,770 1,580.6Admin. 80 73.7% 5 2.9 2.7% 3 2.8% 0 0.0 0.0% 22 20.3% 1 0.6 0.6% 111 108.5Total 637 37.7% 44 29.8 1.8% 398 23.6% 19 11.8 0.7% 483 28.6% 300 129.5 7.7% 1,881 1,689.1
2004 Faculty 560 36.9% 29 19.5 1.3% 379 25.0% 15 10.8 0.7% 445 29.3% 236 103.1 6.8% 1,664 1,517.3Admin. 74 73.8% 2 0.7 0.6% 3 3.0% 0 0.0 0.0% 22 21.9% 1 0.6 0.6% 102 100.3Total 634 39.2% 31 20.1 1.2% 382 23.6% 15 10.8 0.7% 467 28.9% 237 103.7 6.4% 1,766 1,617.6
Longitudinal Profile of Faculty Tenure Status(All ECU Units Included)
Full-timeFull-time Full-time Part-timePart-time
Tenured On Tenure Track Not on Tenure Track
Note: Tenured and tenure-track faculty who are on leave-without-pay to work on other projects or grants are included. Not on Tenure Track includes faculty who were tenured or on tenure track but are now retired but still teaching, or are in the phased retirement program.
Note: Faculty count includes BSOM, School of Dental Medicine, and temporary employees but excludes ROTC faculty.
Part-time
Source: Personnel Data Files, Fall 2004 through Fall 2013; totals may be inexact due to rounding.
Note: Total faculty shown in this table may differ from other IPAR tables due to the inclusion of faculty in administrative positions. Faculty who meet the following criteria are included: currently employed in an EPA position; coded as Faculty, Executive Administrators, or 3 Academics & Professionals w/ Administrative Assignments with rank of Professor, Associate Professor, Assistant Professor, Instructor, or Lecturer; and have a rank modifier of None, Distinguished, Clinical, Research, Librarian, Visiting, or Teaching.
93

Rank 2009 2010 2011 2012 2013
Women $92,613 $91,606 $92,046 $95,435 $94,089Men $97,043 $97,088 $96,935 $97,537 $95,755Average $96,022 $95,772 $95,723 $97,014 $95,318
Women $74,065 $73,836 $73,783 $74,940 $73,235Men $75,962 $75,970 $75,617 $76,407 $76,487Average $75,179 $75,081 $74,849 $75,804 $75,091
Women $64,400 $64,939 $64,977 $64,778 $65,539Men $68,410 $68,146 $68,883 $69,838 $71,351Average $66,277 $66,418 $66,673 $66,832 $68,007
Women $61,450 $45,772 $50,931 $54,685 $68,033Men $61,583 $70,667 $82,250 $90,000 $65,000Average $61,500 $58,219 $66,590 $63,514 $67,022
Women $71,973 $72,316 $72,648 $73,205 $67,586Men $80,248 $80,271 $81,044 $81,662 $77,823Average $76,824 $77,204 $77,508 $78,017 $77,856
Note: AAUP (American Association of University Professors) Faculty excludes BSOM and School of Dental Medicine
Note: "All Ranks Combined" does not include lecturers or other faculty.
Average Salary History for Full-Time 9-10 MonthAAUP Faculty (Brody School of Medicine and School of Dental Medicine Excluded)
Source: UNC-GA ECU AAUP Report 2009-2013.
Four Ranks Combined
Professor
Associate Professor
Assistant Professor
Instructor
$0
$10,000
$20,000
$30,000
$40,000
$50,000
$60,000
$70,000
$80,000
$90,000
2009 2010 2011 2012 2013
Women Men
94

Women --- --- --- --- --- --- --- $93,646 --- $93,669Men --- --- --- --- $86,634 $99,787 --- $95,309 --- $95,365Average --- $103,204 --- --- $86,634 $98,084 --- $94,826 --- $94,883
Women --- --- --- --- $71,495 $81,385 --- $72,483 --- $72,670Men --- --- $64,769 --- $79,805 $76,213 --- $75,631 --- $75,531Average --- --- $68,191 --- $76,713 $78,119 --- $74,222 --- $74,300
Women --- $62,034 --- --- $65,118 $72,601 --- $61,480 --- $62,605Men --- $68,424 --- --- $73,064 --- --- $63,229 --- $66,476Average --- $65,041 $70,368 --- $68,429 $73,986 --- $62,163 --- $64,209
Women --- $58,923 --- --- --- --- --- $46,395 --- $47,532Men --- $61,006 --- --- --- --- --- $52,785 --- $53,809Average --- $59,964 --- --- --- $47,458 --- $49,134 --- $50,318
Women --- $63,095 $66,372 --- $68,364 $73,764 --- $67,570 --- $67,352Men --- $69,603 $75,410 --- $78,754 $80,916 --- $77,027 --- $76,345Average $69,775 $66,221 $72,828 --- $75,033 $77,130 --- $72,662 $59,253 $72,203
Source: Personnel Data File, Fall 2013.
Note: Permanent Faculty includes faculty on leave with pay, but does not include ROTC faculty, temporary positions, faculty on leave without pay, or faculty serving as administrators.
Note: All salaries are converted to full-time, 9 month equivalent salaries using the 9/11 conversion convention.
Note: All Ranks Combined does not include lecturers or other faculty.
Note: Race/ethnicity reported using the new race/ethnicity categories as required by IPEDS.
Note: Averages shown are weighted.
Note: Some categories are left blank because there are too few observations (less than 5) to yield a meaningful result.
American Indian or Alaska Native
Asian
Associate Professor
Assistant Professor
Instructor
All Ranks Combined
Average Salaries of Full and Part-Time Faculty(Brody School of Medicine and School of Dental Medicine Excluded)
Professor
RankBlack or African
American
Native Hawaiian or Other Pacific
WhiteTwo or
more racesAll
Non Resident
AlienUnknown
Hispanic of any race
95

Women --- --- --- --- --- --- --- $177,407 --- $173,951Men --- --- --- --- $254,520 --- --- $197,086 --- $194,124Average --- --- --- --- $254,520 --- --- $194,519 --- $191,650
Women --- --- --- --- --- --- --- $131,617 --- $123,795Men --- --- --- --- $128,718 --- --- $169,158 --- $168,299Average --- --- --- --- $112,327 $193,880 --- $157,836 --- $153,279
Women --- $83,867 --- --- --- --- --- $118,515 --- $117,997Men --- $139,521 --- --- $120,499 --- --- $134,551 --- $132,911Average --- $118,116 --- --- $131,357 --- --- $129,851 --- $128,151
Women --- --- --- --- --- --- --- --- --- ---Men --- --- --- --- --- --- --- --- --- ---Average --- --- --- --- --- --- --- --- --- ---
Women --- $83,866 --- --- $133,415 --- --- $138,424 --- $130,624Men --- $128,721 --- --- $147,854 $158,352 --- $174,099 --- $167,153Average --- $113,769 $131,874 --- $145,275 $149,448 --- $166,060 --- $158,118
Source: Personnel Data File, Fall 2013.
Note: Permanent Faculty includes faculty on leave with pay, but does not include ROTC faculty, temporary positions, faculty on leave without pay, or faculty serving as administrators.
Note: All salaries are converted to full-time, 9 month equivalent salaries using the 9/11 conversion convention.
Note: All Ranks Combined does not include lecturers or other faculty.
Note: Race/ethnicity reported using the new race/ethnicity categories as required by IPEDS.
Note: Averages shown are weighted.
Note: Some categories are left blank because there are too few observations (less than 5) to yield a meaningful result.
American Indian or Alaska Native
Asian
Associate Professor
Assistant Professor
Instructor
All Ranks Combined
Average Salaries of Full and Part-Time Faculty(Brody School of Medicine and School of Dental Medicine Only)
Professor
RankBlack or African
American
Native Hawaiian or Other Pacific
WhiteTwo or
more racesAll
Non Resident
AlienUnknown
Hispanic of any race
96

Female Male Female Male Female Male Female Male
1 Executive Administrators 38 53 37.01 52.01 37 52 35.76 51.51
2 Faculty and Academics 967 1,076 836.01 1,000.12 962 1,081 844.76 1,013.94
3 Academics and Professionals with Administrative Assignments 39 47 37.65 44.51 49 43 48.25 41.30
4 Functional Professionals 684 369 670.77 366.43 705 392 692.73 388.18
5 Office or Clerical Staff and Managers 1,163 102 1,145.66 100.50 1,228 103 1,210.13 100.63
6 Technical and Paraprofessional Staff 392 186 387.21 184.50 414 194 408.05 192.13
7 Skilled Crafts Staff and Managers 4 155 4.00 154.75 4 148 4.00 147.75
8 Service or Maintenance Staff and Supervisors 158 213 157.50 213.00 167 219 166.50 218.50
Total by Gender 3,445 2,201 3,275.81 2,115.82 3,566 2,232 3,410.18 2,153.94
Grand Total
Source: Personnel Data File, Fall 2013.
5,646 5,391.63 5,798 5,564.12
University Personnel Historyby UNC-GA Job Category (JCAT) and Gender
2012 2013
n FTEFaculty and Staff by UNC-GA Job Category (JCAT)
n FTE
‐
500
1,000
1,500
2,000
2,500
ExecutiveAdministrators
Faculty andAcademics
Academics andProfessionals withAdministrativeAssignments
FunctionalProfessionals
Office or ClericalStaff and Managers
Technical andParaprofessional
Staff
Skilled Crafts Staffand Managers
Service orMaintenance Staffand Supervisors
2012 2013
97

OccupationalCategory Gender N FTE N FTE N FTE N FTE N FTE N FTE N FTE N FTE N FTE N FTE
Executive Administrators Women 0 0.0 2 2.0 0 0.0 0 0.0 0 0.0 4 4.0 0 0.0 30 28.8 1 1.0 37 35.8
Men 0 0.0 5 5.0 0 0.0 1 1.0 0 0.0 1 1.0 0 0.0 45 44.5 0 0.0 52 51.5
Total 0 0.0 7 7.0 0 0.0 1 1.0 0 0.0 5 5.0 0 0.0 76 74.3 1 1.0 89 87.3
Faculty and Academics Women 3 2.5 120 104.1 13 13.0 3 3.0 44 42.6 53 46.1 1 1.0 720 627.5 5 5.0 962 844.8
Men 5 5.0 100 94.4 19 18.3 3 3.0 82 80.5 40 39.1 0 0.0 828 769.7 4 4.0 1,081 1,013.9
Total 8 7.5 220 198.5 32 31.3 6 6.0 126 123.1 93 85.2 1 1.0 1,547 1,396.2 9 9.0 2,043 1,858.7
Academics & Prfsnls. Women 0 0.0 5 5.0 0 0.0 0 0.0 2 1.5 5 5.0 0 0.0 37 36.8 0 0.0 49 48.3
w/ Admin. Assignments Men 0 0.0 1 1.0 0 0.0 0 0.0 1 1.0 1 1.0 0 0.0 40 38.3 0 0.0 43 41.3
Total 0 0.0 6 6.0 0 0.0 0 0.0 3 2.5 6 6.0 0 0.0 77 75.1 0 0.0 92 89.6
Functional Professionals Women 0 0.0 54 52.6 3 3.0 3 3.0 11 10.8 82 81.8 0 0.0 548 537.5 4 4.0 705 692.7
Men 0 0.0 44 43.5 3 2.5 0 0.0 12 11.5 30 30.0 0 0.0 300 297.7 3 3.0 392 388.2
Total 0 0.0 98 96.1 6 5.5 3 3.0 23 22.3 112 111.8 0 0.0 848 835.2 7 7.0 1,097 1,080.9
Office or Clerical Staff Women 0 0.0 94 92.1 11 11.0 4 4.0 5 5.0 304 301.4 2 2.0 796 782.9 12 11.8 1,228 1,210.1
and Managers Men 0 0.0 4 4.0 2 2.0 0 0.0 0 0.0 22 22.0 0 0.0 75 72.6 0 0.0 103 100.6
Total 0 0.0 98 96.1 13 13.0 4 4.0 5 5.0 326 323.4 2 2.0 871 855.5 12 11.8 1,331 1,310.8
Technical and Para- Women 0 0.0 43 42.3 6 6.0 3 3.0 11 11.0 101 99.7 0 0.0 250 246.1 0 0.0 414 408.1
professional Staff Men 0 0.0 14 14.0 3 2.5 0 0.0 5 4.6 24 24.0 0 0.0 144 143.0 4 4.0 194 192.1
Total 0 0.0 57 56.3 9 8.5 3 3.0 16 15.6 125 123.7 0 0.0 394 389.1 4 4.0 608 600.2
Skilled Crafts Staff Women 0 0.0 2 2.0 0 0.0 0 0.0 0 0.0 1 1.0 0 0.0 1 1.0 0 0.0 4 4.0
and Managers Men 0 0.0 16 16.0 1 1.0 0 0.0 0 0.0 24 24.0 0 0.0 107 106.8 0 0.0 148 147.8
Total 0 0.0 18 18.0 1 1.0 0 0.0 0 0.0 25 25.0 0 0.0 108 107.8 0 0.0 152 151.8
Service or Maintenance Women 0 0.0 15 15.0 2 2.0 0 0.0 0 0.0 130 129.5 0 0.0 20 20.0 0 0.0 167 166.5
Staff and Supervisors Men 0 0.0 43 43.0 0 0.0 2 2.0 1 1.0 101 100.5 0 0.0 71 71.0 1 1.0 219 218.5
Total 0 0.0 58 58.0 2 2.0 2 2.0 1 1.0 231 230.0 0 0.0 91 91.0 1 1.0 386 385.0
TOTALS 8 7.5 562 535.9 63 61.3 19 19.0 174 169.5 923 910.1 3 3.0 4,012 3,824.1 34 33.8 5,798 5,564.1
Full and Part-Time University Personnelby UNC-GA Job Category (JCAT), Gender, and Ethnicity
Non Resident
Alien
Two or more races
Source: Personnel Data File, Fall 2013.
UnknownHispanic
of any race
American Indian or Alaska Native
AsianBlack or African
American
Native Hwaiian or
Other Pacific
White Total
98

Women MenJob Full-time Part-time Full-time Part-timeCategory N N FTE N N FTE N FTE
Executive Admin. 35 2 0.8 51 1 0.5 89 87.3
Faculty & Academics 759 203 85.8 958 123 55.9 2,043 1,858.7
Acad/Prfsnl w/ Admin. 47 2 1.3 39 4 2.3 92 89.6
Functional Prfsnl. 671 34 21.7 386 6 2.2 1,097 1,080.9
Office or Clerical 1,178 50 32.1 98 5 2.6 1,331 1,310.8
Tech. & Paraprfsnl. 393 21 15.1 189 5 3.1 608 600.2
Skilled Crafts 4 0 0.0 147 1 0.8 152 151.8
Service or Maint. 166 1 0.5 218 1 0.5 386 385.0
Totals 3,253 313 157.2 2,086 146 67.9 5,798 5,564.1
University Personnel by UNC-GA Job Category (JCAT),
Total
Gender, and Full or Part-Time Status
Source: Personnel Data File, Fall 2013.
0
200
400
600
800
1,000
1,200
1,400Full-Time Personnel by Job Category and Gender
Women Men
99

Female Male Female Male Female Male Female Male
11 Management Occupations 74 107 71.91 103.52 86 95 84.26 93.31
13 Business and Financial Operations Occupations 169 62 166.35 61.50 181 65 178.60 64.50
15 Computer and Mathematical Occupations 44 99 43.80 99.00 40 107 39.80 106.50
17 Architecture and Engineering Occupations 2 26 2.00 26.00 3 24 3.00 24.00
19 Life, Physical, and Social Science Occupations 110 53 107.79 52.00 112 50 110.12 48.75
21 Community and Social Service Occupations 29 2 28.50 2.00 95 25 94.25 25.00
23 Legal Occupations 9 2 9.00 2.00 7 2 7.00 2.00
25 Education, Training, and Library Occupations 1,140 1,140 1,006.11 1,064.12 1,061 1,132 942.26 1,064.94
27 Arts, Design, Entertainment, Sports, and Media Occupations 46 81 43.75 79.75 47 84 45.50 82.00
29 Healthcare Practitioners and Technical Occupations 288 48 281.62 47.18 297 47 287.61 45.56
31 Healthcare Support Occupations 120 3 119.20 3.00 153 6 152.15 6.00
33 Protective Service Occupations 13 49 13.00 49.00 12 47 12.00 47.00
35 Food Preparation and Serving Related Occupations 2 1 2.00 1.00 2 1 2.00 1.00
37 Building and Grounds Cleaning and Maintenance Occupations 136 141 135.50 141.00 144 147 143.50 146.50
39 Personal Care and Service Occupations 23 13 23.00 13.00 23 20 23.00 20.00
41 Sales and Related Occupations 1 0 1.00 0.00 1 0 1.00 0.00
43 Office and Administrative Support Occupations 1,179 106 1,161.66 104.00 1,247 109 1,229.13 106.13
47 Construction and Extraction Occupations 1 79 1.00 79.00 1 74 1.00 74.00
49 Installation, Maintenance, and Repair Occupations 55 164 54.62 164.00 50 169 50.00 169.00
51 Production Occupations 2 18 2.00 17.75 2 18 2.00 17.75
53 Transportation and Material Moving Occupations 2 7 2.00 7.00 2 10 2.00 10.00
Total by Gender 3,445 2,201 3,275.81 2,115.82 3,566 2,232 3,410.18 2,153.94
Grand Total
Note: SOC codes are based on the UNC-GA crosswalk from Job Category Code (JCAT).
Source: Personnel Data File, Fall 2013.
University Personnel Historyby IPEDS Standard Occupational Classification (SOC) and Gender
5,646 5,391.63 5,798 5,564.12
2012 2013
n FTEFaculty and Staff by Standard Occupational Classification (SOC)
n FTE
0
500
1000
1500
2000
2500
Business and FinancialOperations Occupations
Education, Training, andLibrary Occupations
Healthcare Practitionersand Technical Occupations
Building and GroundsCleaning and Maintenance
Occupations
Office and AdministrativeSupport Occupations
All Others
2012 2013
100

OccupationalCategory Gender N FTE N FTE N FTE N FTE N FTE N FTE N FTE N FTE N FTE N FTE
Management Women 0 0.0 6 6.0 0 0.0 0 0.0 1 0.5 6 6.0 0 0.0 72 70.8 1 1.0 86 84.3
Men 0 0.0 8 8.0 0 0.0 1 1.0 0 0.0 2 2.0 0 0.0 84 82.3 0 0.0 95 93.3
Total 0 0.0 14 14.0 0 0.0 1 1.0 1 0.5 8 8.0 0 0.0 156 153.1 1 1.0 181 177.6
Business & Financial Women 0 0.0 2 2.0 1 1.0 0 0.0 1 1.0 20 20.0 0 0.0 157 154.6 0 0.0 181 178.6
Operations Men 0 0.0 4 4.0 0 0.0 0 0.0 1 1.0 4 4.0 0 0.0 55 54.5 1 1.0 65 64.5
Total 0 0.0 6 6.0 1 1.0 0 0.0 2 2.0 24 24.0 0 0.0 212 209.1 1 1.0 246 243.1
Computer & Mathematical Women 0 0.0 0 0.0 0 0.0 1 1.0 1 0.8 7 7.0 0 0.0 31 31.0 0 0.0 40 39.8
Men 0 0.0 4 4.0 1 1.0 0 0.0 2 1.5 11 11.0 0 0.0 89 89.0 0 0.0 107 106.5
Total 0 0.0 4 4.0 1 1.0 1 1.0 3 2.3 18 18.0 0 0.0 120 120.0 0 0.0 147 146.3
Architecture & Engineering Women 0 0.0 0 0.0 0 0.0 0 0.0 0 0.0 0 0.0 0 0.0 3 3.0 0 0.0 3 3.0
Men 0 0.0 1 1.0 0 0.0 0 0.0 3 3.0 1 1.0 0 0.0 19 19.0 0 0.0 24 24.0
Total 0 0.0 1 1.0 0 0.0 0 0.0 3 3.0 1 1.0 0 0.0 22 22.0 0 0.0 27 27.0
Life, Physical, & Social Women 0 0.0 9 9.0 1 1.0 1 1.0 11 11.0 19 18.6 0 0.0 70 68.5 1 1.0 112 110.1
Science Men 0 0.0 5 5.0 1 0.5 0 0.0 3 3.0 4 4.0 0 0.0 35 34.3 2 2.0 50 48.8
Total 0 0.0 14 14.0 2 1.5 1 1.0 14 14.0 23 22.6 0 0.0 105 102.8 3 3.0 162 158.9
Community & Social Service Women 0 0.0 7 7.0 0 0.0 1 1.0 0 0.0 16 16.0 0 0.0 71 70.3 0 0.0 95 94.3
Men 0 0.0 1 1.0 0 0.0 0 0.0 0 0.0 4 4.0 0 0.0 19 19.0 1 1.0 25 25.0
Total 0 0.0 8 8.0 0 0.0 1 1.0 0 0.0 20 20.0 0 0.0 90 89.3 1 1.0 120 119.3
Legal Women 0 0.0 1 1.0 0 0.0 0 0.0 0 0.0 0 0.0 0 0.0 6 6.0 0 0.0 7 7.0
Men 0 0.0 1 1.0 0 0.0 0 0.0 0 0.0 0 0.0 0 0.0 1 1.0 0 0.0 2 2.0
Total 0 0.0 2 2.0 0 0.0 0 0.0 0 0.0 0 0.0 0 0.0 7 7.0 0 0.0 9 9.0
Education, Training, Library Women 3 2.5 130 114.1 13 13.0 4 4.0 47 45.6 68 61.1 1 1.0 790 696.0 5 5.0 1,061 942.3
Men 5 5.0 108 102.4 20 19.3 3 3.0 86 84.5 42 41.1 0 0.0 863 804.7 5 5.0 1,132 1,064.9
Total 8 7.5 238 216.5 33 32.3 7 7.0 133 130.1 110 102.2 1 1.0 1,653 1,500.7 10 10.0 2,193 2,007.2
Full and Part-Time University Personnelby IPEDS Standard Occupational Classification (SOC), Gender, and Ethnicity
Non Resident
Alien
Two or more races
UnknownHispanic
of any race
American Indian or Alaska Native
AsianBlack or African
American
Native Hwaiian or
Other Pacific
White
Continued Next Page…
Total
101

OccupationalCategory Gender N FTE N FTE N FTE N FTE N FTE N FTE N FTE N FTE N FTE N FTE
Full and Part-Time University Personnelby IPEDS Standard Occupational Classification (SOC), Gender, and Ethnicity
Non Resident
Alien
Two or more races
UnknownHispanic
of any race
American Indian or Alaska Native
AsianBlack or African
American
Native Hwaiian or
Other Pacific
White Total
Arts, Design, Entertainment, Women 0 0.0 7 7.0 0 0.0 0 0.0 0 0.0 1 1.0 0 0.0 39 37.5 0 0.0 47 45.5
Sports, & Media Men 0 0.0 14 13.5 1 1.0 0 0.0 1 1.0 11 11.0 0 0.0 57 55.5 0 0.0 84 82.0
Total 0 0.0 21 20.5 1 1.0 0 0.0 1 1.0 12 12.0 0 0.0 96 93.0 0 0.0 131 127.5
Healthcare Practitioners Women 0 0.0 29 26.9 2 2.0 0 0.0 5 5.0 33 32.3 0 0.0 226 219.4 2 2.0 297 287.6
& Technical Men 0 0.0 5 5.0 0 0.0 0 0.0 2 1.6 1 1.0 0 0.0 39 37.9 0 0.0 47 45.6
Total 0 0.0 34 31.9 2 2.0 0 0.0 7 6.6 34 33.3 0 0.0 265 257.3 2 2.0 344 333.2
Healthcare Support Women 0 0.0 27 27.0 1 1.0 1 1.0 0 0.0 61 60.6 0 0.0 63 62.6 0 0.0 153 152.2
Men 0 0.0 0 0.0 0 0.0 0 0.0 0 0.0 2 2.0 0 0.0 4 4.0 0 0.0 6 6.0
Total 0 0.0 27 27.0 1 1.0 1 1.0 0 0.0 63 62.6 0 0.0 67 66.6 0 0.0 159 158.2
Protective Service Women 0 0.0 0 0.0 0 0.0 0 0.0 0 0.0 5 5.0 0 0.0 7 7.0 0 0.0 12 12.0
Men 0 0.0 3 3.0 0 0.0 1 1.0 0 0.0 9 9.0 0 0.0 33 33.0 1 1.0 47 47.0
Total 0 0.0 3 3.0 0 0.0 1 1.0 0 0.0 14 14.0 0 0.0 40 40.0 1 1.0 59 59.0
Food Preparation & Women 0 0.0 0 0.0 0 0.0 0 0.0 0 0.0 1 1.0 0 0.0 1 1.0 0 0.0 2 2.0
Serving Related Men 0 0.0 0 0.0 0 0.0 0 0.0 0 0.0 0 0.0 0 0.0 1 1.0 0 0.0 1 1.0
Total 0 0.0 0 0.0 0 0.0 0 0.0 0 0.0 1 1.0 0 0.0 2 2.0 0 0.0 3 3.0
Building/Grounds Cleaning Women 0 0.0 15 15.0 2 2.0 0 0.0 0 0.0 120 119.5 0 0.0 7 7.0 0 0.0 144 143.5
& Maintenance Men 0 0.0 37 37.0 0 0.0 1 1.0 1 1.0 82 81.5 0 0.0 26 26.0 0 0.0 147 146.5
Total 0 0.0 52 52.0 2 2.0 1 1.0 1 1.0 202 201.0 0 0.0 33 33.0 0 0.0 291 290.0
Personal Care & Service Women 0 0.0 4 4.0 0 0.0 0 0.0 0 0.0 3 3.0 0 0.0 15 15.0 1 1.0 23 23.0
Men 0 0.0 4 4.0 0 0.0 0 0.0 0 0.0 0 0.0 0 0.0 16 16.0 0 0.0 20 20.0
Total 0 0.0 8 8.0 0 0.0 0 0.0 0 0.0 3 3.0 0 0.0 31 31.0 1 1.0 43 43.0
Sales & Related Women 0 0.0 0 0.0 0 0.0 0 0.0 0 0.0 0 0.0 0 0.0 1 1.0 0 0.0 1 1.0
Men 0 0.0 0 0.0 0 0.0 0 0.0 0 0.0 0 0.0 0 0.0 0 0.0 0 0.0 0 0.0
Total 0 0.0 0 0.0 0 0.0 0 0.0 0 0.0 0 0.0 0 0.0 1 1.0 0 0.0 1 1.0
Continued Next Page…
102

OccupationalCategory Gender N FTE N FTE N FTE N FTE N FTE N FTE N FTE N FTE N FTE N FTE
Full and Part-Time University Personnelby IPEDS Standard Occupational Classification (SOC), Gender, and Ethnicity
Non Resident
Alien
Two or more races
UnknownHispanic
of any race
American Indian or Alaska Native
AsianBlack or African
American
Native Hwaiian or
Other Pacific
White Total
Office & Administrative Women 0 0.0 95 93.1 15 15.0 5 5.0 5 5.0 306 303.4 2 2.0 807 793.9 12 11.8 1,247 1,229.1
Support Men 0 0.0 5 5.0 3 2.5 0 0.0 0 0.0 22 22.0 0 0.0 78 75.6 1 1.0 109 106.1
Total 0 0.0 100 98.1 18 17.5 5 5.0 5 5.0 328 325.4 2 2.0 885 869.5 13 12.8 1,356 1,335.3
Construction & Extraction Women 0 0.0 1 1.0 0 0.0 0 0.0 0 0.0 0 0.0 0 0.0 0 0.0 0 0.0 1 1.0
Men 0 0.0 9 9.0 0 0.0 0 0.0 0 0.0 14 14.0 0 0.0 51 51.0 0 0.0 74 74.0
Total 0 0.0 10 10.0 0 0.0 0 0.0 0 0.0 14 14.0 0 0.0 51 51.0 0 0.0 75 75.0
Installation, Maintenance, Women 0 0.0 2 2.0 0 0.0 0 0.0 2 2.0 11 11.0 0 0.0 35 35.0 0 0.0 50 50.0
& Repair Men 0 0.0 14 14.0 2 2.0 0 0.0 2 2.0 20 20.0 0 0.0 130 130.0 1 1.0 169 169.0
Total 0 0.0 16 16.0 2 2.0 0 0.0 4 4.0 31 31.0 0 0.0 165 165.0 1 1.0 219 219.0
Production Women 0 0.0 0 0.0 0 0.0 0 0.0 0 0.0 1 1.0 0 0.0 1 1.0 0 0.0 2 2.0
Men 0 0.0 3 3.0 0 0.0 0 0.0 0 0.0 7 7.0 0 0.0 8 7.8 0 0.0 18 17.8
Total 0 0.0 3 3.0 0 0.0 0 0.0 0 0.0 8 8.0 0 0.0 9 8.8 0 0.0 20 19.8
Transportation & Material Women 0 0.0 0 0.0 0 0.0 0 0.0 0 0.0 2 2.0 0 0.0 0 0.0 0 0.0 2 2.0
Moving Men 0 0.0 1 1.0 0 0.0 0 0.0 0 0.0 7 7.0 0 0.0 2 2.0 0 0.0 10 10.0
Total 0 0.0 1 1.0 0 0.0 0 0.0 0 0.0 9 9.0 0 0.0 2 2.0 0 0.0 12 12.0
TOTALS 8 7.5 562 535.9 63 61.3 19 19.0 174 169.5 923 910.1 3 3.0 4,012 3,824.1 34 33.8 5,798 5,564.1
Note: SOC codes are based on the UNC-GA crosswalk from Job Category Code (JCAT).
Source: Personnel Data File, Fall 2013.
103

Total Percent
Arts and Sciences 499 407 81.6%
Business 127 84 66.1%
Education 184 126 68.5%
Fine Arts & Communication 166 127 76.5%
Health & Human Performance 99 61 61.6%
Human Ecology 106 76 71.7%
Technology & Computer Science 88 59 67.0%
Allied Health Sciences 88 69 78.4%
Dental Medicine 36 36 100.0%
Medicine 486 466 95.9%
Nursing 114 37 32.5%
J.Y. Joyner Library 35 28 80.0%
William E. Laupus Health Sciences Library 11 6 54.5%
Other 4 4 100.0%
Grand Total 2,043 1,586 77.6%
Source: Personnel Data File, Fall 2013.
Full and Part-Time Faculty by DegreesFall 2013
Unit# Holding a
Doctorate or Other Terminal Degrees
Note: Faculty count includes temporary positions, but does not include faculty on leave without pay, ROTC faculty, or faculty serving as administrators.
104

Arts and Sciences 431 412 95.6%
Business 114 108 94.7%
Education 117 108 92.3%
Fine Arts & Communication 142 134 94.4%
Health & Human Performance 86 79 91.9%
Human Ecology 88 82 93.2%
Technology & Computer Science 77 68 88.3%
Allied Health Sciences 72 67 93.1%
Medicine 458 405 88.4%
Nursing 86 81 94.2%
Dental 30 30 100.0%
J.Y. Joyner Library 35 30 85.7%
William E. Laupus Health Sciences Library 10 9 90.0%
Other 9 3 33.3%
Grand Total 1,755 1,616 92.1%
Source: Personnel Data File, Fall 2012-2013.
Note: Faculty count includes permanent positions and faculty on leave with pay, does not include temporary positions, faculty on leave without pay, ROTC faculty, or faculty serving as administrators.
Permanent FacultyFrom 2012 to 2013
Unit# Returned in
2013# of Faculty in
2012Percent Returned
105