facilitating survey sampling in low- and middle-income ... · pdf filefacilitating survey...
TRANSCRIPT

Facilitating Survey Sampling
in Low- and Middle-Income
Contexts Through Satellite
Maps and Basic Mobile
Computing Technology
6th European Survey Association ConferenceSurvey Research in Developing CountriesSession 3
Marco HaenssgenOxford Department of Int‘l Development
16 July 2015
Contents
Approaches to Survey Sampling
Setting and Challenges
Process Description
Discussion
Benefits
Locational, technical, logistical prerequisites
Challenges
Conclusion
16 July 2015ICT in Survey
Research Page 2

APPROACHES TO SURVEY SAMPLING
16 July 2015ICT in Survey
Research Page 3
Approaches to Survey SamplingTraditional Approaches
In absence of registers as sampling frames, rural household surveys in
LMICs are often based on random walk procedures or household
listing. For example, health surveys in LMICs:
First-level cluster selection Based on census data, proportional to population size
Second-level household selection
Household listing and mapping Select segments and list every inhabited structure
Choose starting point and interval
Random walk Drop pin to select starting household
Choose interval and follow road, “spin the bottle” at each intersection
16 July 2015ICT in Survey
Research Page 4

Approaches to Survey SamplingSatellite-Aided Approaches
Satellite-based approaches are gradually emerging in survey research.
Cluster random sampling Wampler et al. (2013) in Haiti
Google Earth ArcMap Excel GPS units
Simple random sampling Escamilla et al. (2014) in Malawi; Shannon et al. (2012) in Lebanon
GPS GIS Google Earth Digipoint 2 GIS Hawth’s Tools GPS
(Escamilla et al., 2014)
Selection of starting point for random walk Galway et al. (2012) in Iraq; Flynn et al. (2013) in Canada
GIS Google Earth / Maps Printed maps (Galway et al., 2012)
Other (Disease and programme surveillance) Chang et al. (2009), Gammino et al. (2014), Morland & Evenson (2009)
GPS Google Maps / GIS GPS
16 July 2015ICT in Survey
Research Page 5
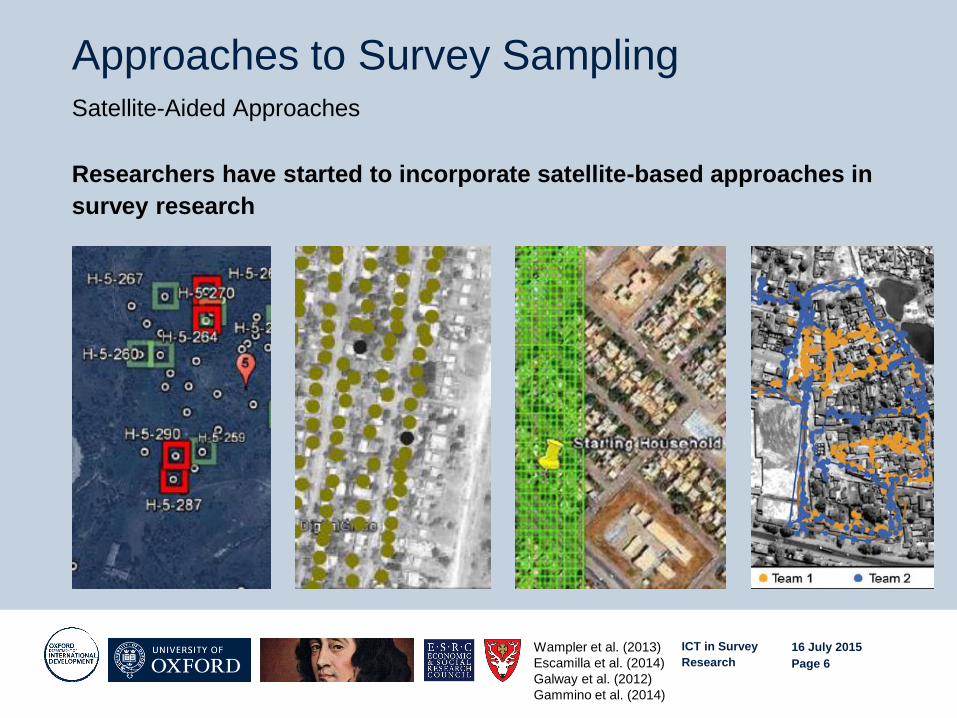
Approaches to Survey SamplingSatellite-Aided Approaches
Researchers have started to incorporate satellite-based approaches in
survey research
16 July 2015ICT in Survey
Research Page 6
Wampler et al. (2013)
Escamilla et al. (2014)
Galway et al. (2012)
Gammino et al. (2014)

Approaches to Survey SamplingIssues
16 July 2015ICT in Survey
Research Page 7
Traditional Approaches
Time and money intensive
Segmentation to manage workload
Clustering, high street bias in
random walk
Verification problems
Satellite-Aided Approaches
Specialised (though open-source)
software/s
Professional equipment
Spatial considerations focus mainly
on catchment
Random walk issues remain

SETTING ANDCHALLENGES
16 July 2015ICT in Survey
Research Page 8

Setting and ChallengesSurvey Data Collection
Survey data to be collected from 16 villages each in Rajasthan and
Gansu.
16 July 2015ICT in Survey
Research Page 9
Udaipur District
Rajsamand District
Jaipur (Capital)
Lanzhou District
Baiyin District
Lanzhou (Capital)Dingxi District
Wikimedia Commons
(2013)
Setting and ChallengesData Collection in Rajasthan
Rajasthani sample selection was based on 3-stage stratified cluster
random sampling, using mostly conventional methods.
Eligibility: Ordinary village resident (>6m), 18 years and above
4 steps in sample selection process
Purposive selection of representative sub-districts in two districts
Random selection of 16 villages in these districts
Random selection of 25 households in each village through interval sampling
Random selection of one respondent in each household
60-minute questionnaires + PSU checklist
Team of 6 fieldworkers and two supervisors
16 July 2015ICT in Survey
Research Page 10

Setting and ChallengesChallenges in Gansu
Owing to administrative and resource constraints, the process could
not be replicated in Gansu.
Administrative Challenges
Absence of village population data (village name register from census)
Absence of geographical village information
Resource challenges
Higher labour and transportation costs
Limited team time per village
16 July 2015ICT in Survey
Research Page 11

PROCESSDESCRIPTION
16 July 2015ICT in Survey
Research Page 12

Process DescriptionVillage Selection
Satellite maps were used to extract village locations for spatial
stratification.
1,736 sites in eight sub-districts in register
Locate villages in Google Maps using Chinese names
Manually extract coordinates into Microsoft Excel
Calculate distance to assigned and nearest township
Drop or reclassify outliers
1,553 villages in sampling frame, 16 plus 32 replacements drawn
16 July 2015ICT in Survey
Research Page 13

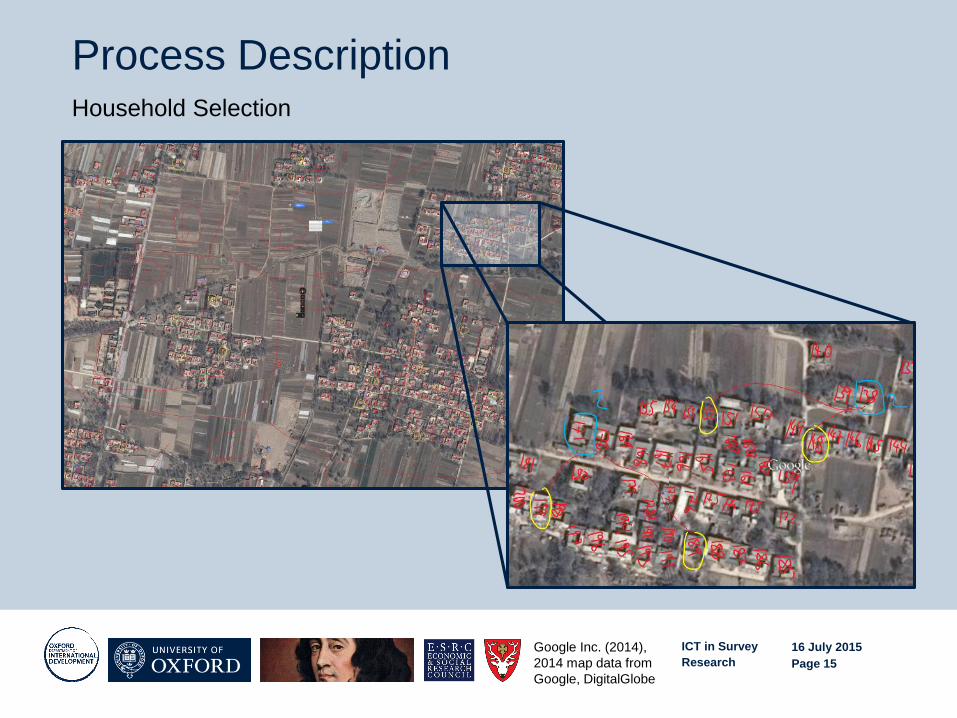
Process DescriptionHousehold Selection
High-resolution aerial maps of selected villages were extracted to build
village-level sampling frames.
High-resolution village maps on Google Maps or Bing Maps
Screen-cap highest-resolution maps (up to 1:670), 1km catchment
Paste screenshots into Microsoft PowerPoint
Assemble complete high-resolution area map (5-40 individual maps)
Village maps contained up to 950 households (380 on average)
16 July 2015ICT in Survey
Research Page 14
Process DescriptionHousehold Selection
16 July 2015ICT in Survey
Research Page 15
Google Inc. (2014),
2014 map data from
Google, DigitalGlobe

Process DescriptionHousehold Selection
Village-level sampling frames were built through complete enumeration
of identifiable housing structures.
Homogeneous housing conditions, absence of apartment buildings
Segment village maps to ensure spatial representativeness
Number housing structures consecutively in PowerPoint
Assign placeholders for unidentified structures
Interval-sample 25 plus 50 replacement households based on
number of structures per segment
16 July 2015ICT in Survey
Research Page 16

Process DescriptionImplementation and Monitoring
Not only sample selection but also implementation logistics benefitted
from digital aides.
Satellite maps facilitated upfront planning
Village approach via chartered unchartered roads using Bing/Here Maps
Plan deployment/drop-off and pick-up
Assign investigators according to fitness in difficult terrain
Village maps to facilitate field investigator work
Pre-label questionnaires with assigned households
Facilitate household location for fieldworkers (provided training, compass)
Field investigators to record GPS coordinates using cheap (£18) handhelds
Supervisors using geo-coordinates to verify correct households
16 July 2015ICT in Survey
Research Page 17

DISCUSSION
16 July 2015ICT in Survey
Research Page 18

DiscussionBenefits: Financial
Digital aides enabled low-cost sampling and streamlined logistics.
Savings (“realistic” scenario):
Reduced travel, investigator work, insurance, researcher allowance
Saved 25% of main survey time, 80 labour days
Total savings: £4,300
Expenses
Actual: Smartphone, printing, network charges
Optional: Touchscreen laptop, labour, GPS units
Total expenditures: £170 to £2,000
Bottom line: Savings of £2,300 to £4,100
16 July 2015ICT in Survey
Research Page 19

DiscussionBenefits: Methodological
ICT-aided sampling and implementation can also improve survey
quality.
Complete listing, even for spatially marginalised households
Spatial representativeness (superimposed grids)
Less clustering, thereby improving effective sample size
Stronger adherence to pre-selected households
16 July 2015ICT in Survey
Research Page 20

DiscussionBenefits: Methodological
In absence of spatial autocorrelation, spatial stratification /
segmentation is at least as accurate as simple random sampling.
16 July 2015ICT in Survey
Research Page 21
Delmelle (2009: 186-
189)

DiscussionRequirements
Researchers need to meet specific conditions to realise these benefits.
Locational requirements Up-to-date, high resolution imagery
Identifiable, consistent, stable living conditions
Local knowledge of field sites
Economic viability
Technical requirements Off-the-shelf ICT
Lowest-cost GPS units, compasses
2G connectivity
Logistical requirements Training on map reading
Detailed team instructions prior to village visit
Information from local leaders
16 July 2015ICT in Survey
Research Page 22
DiscussionChallenges
Reliance on technical aides can have methodological implications.
Village selection Reliance on incomplete village registers can curtail sampling frame
Insensitivity of population size produces bias towards smaller villages
Remedies: Visual inspection of maps, expand catchment areas, ex-post
weighting
Household selection Abandoned and shared housing units can influence sampling interval
(223 locked households, up to 29 per village)
Manual household listing can create trust that is forgone in ICT-aided sampling
(38 refusals, up to 4 per village)
Remedies: on-the-spot updates of village maps, revisits
16 July 2015ICT in Survey
Research Page 23

CONCLUSION
16 July 2015ICT in Survey
Research Page 24
Conclusion
Applicable in contexts that have
Lack of administrative data for sampling frame
High survey costs
Homogeneous and identifiable dwelling units
Quality satellite maps (Google, Bing/Here, Apple, …?)
Transparent, efficient, low-cost alternative to random walk and
household listing
Saved £4,000, making survey feasible
No specialised equipment / skills required
Suitable for student researchers and resource-constrained studies
16 July 2015ICT in Survey
Research Page 25
