the rise of survey sampling
TRANSCRIPT
Statistics Netherlands
Discussion paper (09015)
The rise of survey sampling
0800u
08080808urvey samplingey sampliey sampliey sampli
Jelke Bethlehem
The Hague/Heerlen, 2009
The views expressed in this paper are those of the author(s)and do not necessarily refl ect the policies of Statistics Netherlands

Explanation of symbols
. = data not available* = provisional fi gurex = publication prohibited (confi dential fi gure)– = nil or less than half of unit concerned– = (between two fi gures) inclusive0 (0,0) = less than half of unit concernedblank = not applicable2005-2006 = 2005 to 2006 inclusive2005/2006 = average of 2005 up to and including 20062005/’06 = crop year, fi nancial year, school year etc. beginning in 2005 and ending in 20062003/’04–2005/’06 = crop year, fi nancial year, etc. 2003/’04 to 2005/’06 inclusive
Due to rounding, some totals may not correspond with the sum of the separate fi gures.
PublisherStatistics NetherlandsHenri Faasdreef 3122492 JP The Hague
Prepress Statistics Netherlands - Facility Services
CoverTelDesign, Rotterdam
InformationTelephone .. +31 88 570 70 70Telefax .. +31 70 337 59 94Via contact form: www.cbs.nl/information
Where to orderE-mail: [email protected] .. +31 45 570 62 68
Internetwww.cbs.nl
ISSN: 1572-0314
© Statistics Netherlands, The Hague/Heerlen, 2009.Reproduction is permitted. ‘Statistics Netherlands’ must be quoted as source.
6008309015 X-10
3
The rise of survey sampling
Jelke Bethlehem
Summary: This paper is about the history of survey sampling. It describes how
sampling became an accepted scientific method. From the first ideas in 1895 it
took some 50 years before the principles of probability sampling were widely
accepted. This papers has a focus on developments in official statistics in The
Netherlands, but it also pays attention use of sampling techniques in market
research
Keywords: Sampling, Probability sampling, History
1. Introduction
By a small sample we may judge the whole piece. This is a well-known quote from
the English translation of the famous book “Don Quixote” by the Spanish writer
Miguel de Cervantes (1547-1616). It is but one example of a method that is probably
as old as mankind. Other familiar examples are the cook in the kitchen taking a
spoonful of soup to determine its taste, and the brewer needing only a sip of beer to
test its quality.
The Dutch word for sample is “steekproef”. The origin of this word is unclear. Some
believe it is a translation of the German word “Stichprobe”. The word is composed
of two parts: “Stich” means to dig, stab or cut, and “Probe” means to test or to try.
The word is mentioned in Germany literature already in 1583. It describes a
“Stichprobe” as a technique used in mining. A kind of spoon (“Problöffel”, test
spoon) was used to take a small amount from a melted substance to determine the
amount of metal contained in it. In the 19th century it was also used in other branches
of industry, like manufacturing paper.
Others believe the word “steekproef” goes back to cheese making. Cheese has been
produced in The Netherlands since prehistoric times. There already have been
cheese markets in The Netherlands since the Middle Ages. The cheese master cut
(“steken” = to cut) a sample from a cheese and tasted (“proeven”= to taste) its
quality.
Intuitive application of the principles of sampling in science has been taken place for
a long time. However, it was not called sampling but inductive reasoning. Many
scientific results are based on observations in just a few experiments. Apparently, it
was possible to generalize these experimental results. Although inductive reasoning
has been commonly applied both in everyday life and in science for a long time,
sampling as a well-defined statistical method is fairly young. Its history started just
more than a century ago, in the year 1895.
4
This paper describes how sampling became an accepted scientific method. It
concentrates on the use of sampling in official statistics, i.e. statistics that are
collected by government agencies, and are used for policy making and scientific
research. However, also some attention is paid to the introduction of sampling in
public opinion polls. It is interesting to see how market research agencies went
through their own development process, and learned the hard way that wrong use of
sampling may lead to fatal mistakes.
The paper starts with a description of some general early historic developments in
official statistics in section 2. Section 3 describes some early developments in the
application of sampling to describe demographic phenomena. Graunt (1662) and
Laplace (1812) applied the principles of sampling in an intuitive way, but there was
no proper scientific foundation. This section also describes the period before 1895. It
shows how the first foundations of modern statistical methods emerged from
developments in what was called “political arithmetic”. Section 4 explains that the
birth of sampling theory was what Kuhn (1975) calls an “intellectually violent
revolution”. Section 5 is devoted to the “Representative Method” of Anders Kiaer
and the discussion it caused in the international statistical community. Section 6
shows how random sampling slowly emerged as a way to obtain representative
samples. It made it possible to apply probability theory. As a consequence the
accuracy of estimates could be determined. Section 7 continues to describe how
slowly but gradually the ideas behind survey sampling were implemented in
practice. Section 8 provides an overview of developments in the Netherlands.
Finally, section 9 is devoted to the introduction of sampling methods in the area of
market research.
2. Some history of official statistics
The history of official statistics is already very old. As far back as Babylonian times
censuses of agriculture were taken. This took place fairly shortly after the art of
writing was invented. Ancient China counted its people to determine the revenues
and the military strength of its provinces. There are also accounts of statistical
overviews compiled by Egyptian rulers long before Christ. Rome regularly took a
census of people and of property. The data were used to establish the political status
of citizens and to assess their military and tax obligations to the state. And of course,
there was numbering of the people of Israel, at the time of the birth of Jesus in the
small town of Bethlehem.
Censuses were rare in the Middle Ages. The most famous one was the census of
England taken by the order of William the Conqueror, King of England. The
compilation of this Domesday Book started in the year 1086 AD. The book recorded
a wealth of information about each manor and each village in the country. There was
information about more than 13,000 places, and on each county there were more
than 10,000 facts.
5
To collect all this data, the country was divided into a number of regions, and in
each region a group of commissioners was appointed from among the greater lords.
Each county within a region was dealt with separately. Sessions were held in each
county town. The commissioners summoned all those required to appear before
them. They had prepared a standard list of questions. For example, there were
questions about the owner of the manor, the number of free man and slaves, the area
of woodland, pasture and meadow, the number of mills and fishponds, to the total
value, and the prospects of getting more profit. The Domesday Book still exists and
many county data files are available on CD-ROM or the Internet.
Another interesting example of the history of official statistics can be found in the
Inca Empire that existed between 1000 and 1500 AD. Each Inca tribe had its own
statistician, called the Quipucamayoc. This man kept records of e.g. the number of
people, the number of houses, the number of llamas, the number of marriages and
the number of young men that could be recruited for the army. All these facts were
recorded on quipus, a system of knots in coloured ropes. A decimal system was used
for this.
At regular intervals, couriers brought the quipus to Cusco, the capital of the
kingdom, where all regional statistics were compiled into national statistics. The
system of Quipucamayocs and quipus worked remarkably well. Unfortunately, the
system vanished with the fall of the empire.
An early census also took place in Canada in 1666. Jean Talon, the intendant
(governor) of New France, ordered an official census of the colony to measure the
increase in population since the founding of Quebec in 1608. The enumeration,
which recorded a total of 3,215 persons, included the name, age, sex, marital status
and occupation of every person.
Early censuses in Europe were undertaken in the Nordic countries: The first census
in Sweden-Finland took place in 1746. It had been already suggested earlier, but the
initiative was rejected because “… it corresponded to the attempt of King David
who wanted to count his people”. The first census in Denmark-Norway was carried
out in 1769.
In 1795, at the time of the Batavian Republic under Napoleon’s influence, the first
integral enumeration of the population of The Netherlands took place. The new
centralised administration wanted to gather quantitative information or devise a new
system of electoral constituencies (see Den Dulk and Van Maarseveen, 1990).
It is clear that for a very long time, records of population and related matters have
been collected. Usually, the main purpose of these statistical activities has been to
increase bureaucratic efficiency. Without detailed records, centralized administration
is almost inconceivable. The census in its modern form can be closely associated
with the rise of democracy, because a periodic count of the population was essential
for a truly representative government. According to Porter (1986), the modern
periodic census was first introduced in the most advanced states of Europe and
America. This took place around the beginning of the nineteenth century, at the end
6
of the industrial revolution (1750-1840). The use of censuses spread over much of
the world in subsequent years.
3. Some early developments in survey sampling
The first known attempt to make statements about a population using only
information about part of it was made by the English merchant John Graunt (1620 –
1674). In his famous tract (Graunt, 1662) he describes a method to estimate the
population of London based on partial information.
Graunt surveyed families in a sample of parishes where the registers were well kept.
He found that on average there were 3 burials per year in 11 families. Assuming this
ratio to be more or less constant for all parishes, and knowing the total number of
burials per year in London to be about 13,000, he concluded that the total number of
families was approximately 48,000. Putting the average family size at 8, he
estimated the population of London to be 384,000. Although Graunt was aware of
the fact that averages like the number of burials per families varied in space and
time, he did not make any provisions for this phenomenon. Lacking a proper
scientific foundation for his method, John Graunt could not make any statements
about the accuracy of his method.
John Graunt carried out many different demographic studies, and not only to
estimate the size of the population in London. He used methods he had developed by
himself or together with William Petty (1620 – 1683). Therefore, John Graunt has
frequently been merited as the founder of demography. John Graunt invented also
two concepts that later turned out to be very important for survey sampling:
• He observed and then applied the fact that some social and demographic
indicators remained stable in time and space. This stability is an essential
assumption, without which making inference based on data collected by social
surveys would not be justified. For instance, he discovered that nearly the same
proportion of boys and girls were born, though slightly more boys. This
proportion remained constant in all parishes in London and in the countryside
nearby, and it remained also constant over time.
• Graunt used averages to estimate total values. Essential to his methods was the
observation that the proportion of burials in a year remained around 3 to 11
families, and that the average family size was 8 persons.
The second time a survey-like method was applied was more than a century later.
Pierre Simon Laplace (1749 – 1827) realised that it was important to have some
indication of the accuracy of the estimate of the French population (Laplace, 1812).
He implemented an approach that was more or less similar to that of John Graunt.
He selected 30 departments distributed over the area of France. Two criteria
controlled the selection process. First, he saw to it that all types of climate were
represented. In this way, he could compensate for climate effects. Second, he
selected departments for which the mayors of the communes could provide accurate
7
information. Using the Central Limit Theorem, he proved that his estimator had a
normal distribution. Unfortunately, he overlooked the fact that he used a cluster
sample instead of a simple random sample, and moreover communes were selected
within departments purposively, and not at random. These problems made
application of the Central Limit Theorem at least doubtful. The work of Laplace was
buried in oblivion in the course of the 19th century.
Another development that turned out to be important for official statistics was the
invention of political arithmetic by William Petty (1620 – 1683) in the middle of
the17th century. It led to a discipline of empirical collection of population records
and preparation of accurate life tables. In the Netherlands, important contributions to
political arithmetic were made by Nicolaas Struyck (1687-1769) and Willem
Kersseboom (1691-1771), see Stamhuis (1989).
Nicolaas Struyck published a book in 1740 chiefly containing contributions to
astronomy and geography, but also with several observations on vital statistics, see
Struyck (1740). He estimated the world population to be 500 million, and the
number of deaths in every hour 2,000 (a death rate of 35 per 1,000). He provided no
scientific bases for his estimates. More solid were his computations of age and sex
specific death rates. He also investigated differences in mortality rates of males and
females, partly based on observations from Germany. In a later publication, Struyck
(1753) collected more vital statistics on Holland and other countries. He attempted
to relate mortality in childbed to age at death. He also investigated the number of
twins and multiple births, and mortality of sailors on the journey from Holland to the
Cape.
In the literature on the history of statistics in the Netherlands, Willem Kersseboom is
more frequently referred to than his contemporary Struyck. Kersseboom did not
have as much mathematical training as Struyck. Also, his publications were more of
a polemic nature. Since he was too much engaged in a process of attack and defence,
he was not able to develop a systematic treatment of statistical problems. He was
particularly interested in estimating the size of the population of the provinces of
Holland and Westfriesland, see Kersseboom (1738-1742). Using a large amount of
material, he correctly computed the number of people exposed to risk at each age.
Using these results he made life tables for the well-to-do people in the seventeenth
and early part of the eighteenth century. He found the mean life expectancy to be 35
years, and he calculated the birth rate to be 29 per 1,000. This was a rather low birth
rate for this period, and therefore there was much criticism. He made the mistake of
transferring his results for the well-to-do people to the whole population. Also he
saw no problem in making inference for other countries based on Dutch data.
Political arithmetic dominated statistical thinking up to the beginning of the
nineteenth century. Gradually it turned into a new social science of statistics (“social
calculus”).
In the period until the late 1880’s, there were many applications of partial
investigations. These were statistical inquiries in which not a complete human
population was investigated, but only part of it. The selection from the population
8
came to hand incidentally, or was made specifically for the investigation. Generally,
the selection mechanism was unclear and undocumented. While by that time
considerable progress had already been made in the area of probability theory and
mathematical statistics, little or no attention was paid to applying these theoretical
developments to survey sampling. Nevertheless, gradually probability theory found
its way in official statistics. Important roles were played by the Dutch/Belgian
scientist Lambert Adolphe Jacques Quetelet (1796-1874), and the Dutch statistician
Rehuel Lobatto (1797-1866). Both were involved in the first attempt in 1826 to
establish a Netherlands Central Bureau of Statistics. In 1830 Belgium separated
from the Netherlands, and Quetelet continued his work in Belgium.
Quetelet was the supervisor of statistics for Belgium (from 1830), in which position
he developed many of the rules governing modern census taking. He also stimulated
statistical activities in other countries. The Belgian census of 1846, directed by him,
has been claimed to be the most influential in its time because it introduced careful
analysis and critical evaluation of the data compiled. Quetelet dealt only with
censuses and did not carry out any partial investigations.
According to Quetelet, many physical and moral data have a natural variability.
This variability can be described by a normal distribution around a fixed, true value.
He assumed the existence of something called the true value. He proved that this
true value could be estimated by taking the mean of a number of observations.
Quetelet introduced the concept of average man (“l’homme moyenne”) as a person
of which all characteristics were equal to the true value, see Quetelet (1835, 1846).
Lobatto was a friend of Quetelet. They remained in contact after Belgium separated
from The Netherlands. Lobatto was the first to compile statistical yearbooks for The
Netherlands. He also proposed to carry out a census every 10 years. Indeed, starting
from 1829, his proposal was put into practice. Lobatto also applied probability in his
work. He used the same concept of true value, and computed the accuracy of the
mean of a number of observations as an estimate of the true value, see Lobatto
(1860)
In the second half of the19th century so called monograph studies or surveys became
popular. They were based on Quetelet’s idea of the average man, see Desrosiéres
(1998). According to this idea, it suffices to collect information only on typical
people. Investigation of extreme people was avoided. This type of inquiry was still
applied widely at the beginning of the 20th century. It was an “officially” accepted
method.
Industrial revolution was also an important era in the history of statistics. It brought
about drastic and extensive changes in society, as well as in science and technology.
Among many other things, urbanisation started from industrialisation, and also
democratisation and the emerging social movements at the end of the industrial
revolution created new statistical demands. The rise of statistical thinking originated
partly from the demands of society and partly from work and innovations of men
like Quetelet. Harald Westergaard (1932) called the period from 1830 to 1849 the
“era of enthusiasm” in the history of statistics. In this period, the foundations for
9
many principles of modern social statistics were laid. Several central statistical
bureaus, statistical societies, conferences, and journals, were established soon after
this period.
4. On the birth of sampling theory
Sampling theory was not invented suddenly but in a continuum together with the
development of other statistical methods. New methods are not born in isolation
from other related methods, and not in isolation from the development of society,
either. Usually methods are developed stepwise, by the same author or by other
authors in the same field. Each new idea is based - in one way or another - on
previous knowledge or ideas. However, every now and then there are remarkable
points in time at which development takes a new direction, or development splits
into two different paths. In Kuhn’s (1975) terminology, these points are called
“intellectually violent revolutions”. A classical example of this is Darwin’s
Evolution Theory that replaced Christian theory. Another example is Einstein’s
Relativity Theory that came in the place of Newton’s Theory of Gravity. However,
most examples are not as remarkable. Science usually develops in smaller steps, but
the changes, according to Kuhn, are similar.
Although sampling theory has become a separate, grown-up branch in modern
statistical science, this was certainly not the case at the beginning. The roots of
survey sampling are more in official statistics and social statistics than in the
probability theory and experimental design. Especially political arithmetic and later
social calculus have been important activities in early stages that gave rise at a later
stage to developments finally leading to modern sampling theory. However, only
after the probability theory had become an inherent component of the sampling
theory, it has been regarded as a genuine branch of statistical science. The history of
survey sampling is longer, though.
To understand the history of sampling we should first ask where the history of
statistics begins. This also was the title of a paper by Kendall (1960). He claims that
it is always difficult to trace the roots of specific themes back to the past, because
developments usually have no clear-cut starting point. Only much later is it possible
to see and understand what has influenced a discipline to be born. By looking back it
is possible to assess the importance and impact of various factors, and trace crucial
innovations. However, the reasons and motives usually remain uncertain because
they are partly concluded by way of conjecture, and all affecting facts and factors
may not be known at all. In addition, early scientific reports contained little
reference to sources. This makes it difficult to follow paths to sources of ideas. All
this applies to the history of survey sampling as well.
A general problem in understanding history development of ideas and science is that
it is difficult to know what was known, and what was not known. There is always a
risk that we project our present knowledge and ways of thinking to the past, and that
may be wrong in many cases.
10
Yet, if a year must be chosen as a starting point for statistical sampling, 1895 would
be a good candidate. There are many reasons to claim that this year marks the
beginning of modern survey sampling. If there is one man that should be given
credit for starting the development leading to the widespread use of sampling as a
scientific method, it is Anders Kiaer, the director of the Norwegian Statistical
Bureau. Many respected authors share this view, but different views also exist (see
e.g. Stephan 1948).
5. The Representative Method
Anders Kiaer (1838-1919), the founder and first director of Statistics Norway, was
the founder and advocate of the survey method that is now widely applied in official
statistics and social research. With the first publication of his ideas in 1895 he
started the process that ended in the development of modern survey sampling theory
and methods.
Section 3 shows that there have been earlier examples of scientific investigations
based on samples, but they were lacking proper scientific foundations. In addition,
they were often combined with censuses. Kiaer was the first to use a sampling
survey on its own. The survey was an investigation carried out throughout Norway
on a proposed retirement and sickness insurance scheme.
What was Kiaer’s method like? What he did was to give an account of how a survey
had been set up in Norway using his Representative Method. The approach may be
described as intuitive. He did not give any theoretical description of his method in
any of his presentations or writings. The absence of any theoretical treatment of the
problem probably was one of the reasons why Kiaer often has not been attributed as
one of the innovators of the sampling method. Another problem might be that there
are no references in Kiaer’s papers. Therefore, they appear to be more technical
descriptions than scientific reports.
The idea behind the survey was that enumerators (hired only for this purpose) would
fill in a total of 120,000 forms about the adult population in Norway according to the
rules Kiaer had laid out. About 80,000 of the forms were collected by the
Representative Method and 40,000 forms by a special (but analogue) method in the
areas where the working class people lived.
For the first sample of 80,000 respondents, the households in Norway were divided
into two strata based on the 1891 census. Approximately 20,000 respondents were
selected from cities and the rest from rural areas. The actual sample was selected by
a different method in cities and rural areas.
From the 61 cities in Norway, 13 representative cities were selected so that all the
five cities having more than 20,000 inhabitants were included, and also eight cities
representing the medium sized and small towns (e.g. Lillehammer). The proportion
of respondents in cities varied: in the middle sized and small cities the proportion
was greater that in the big cities. Kiaer motivated this choice by the fact that the
11
middle sized and small cities did not represent only themselves but a larger number
of similar cities. In Kristiania (nowadays Oslo) the proportion was 1/16, in the
medium sized towns the proportion varied between 1/12-1/9, and in the small towns
it was 1/4 or 1/3 of the population.
Based on the census, it was known how many people lived in each of the 400 streets
of Kristiania, the capital of Norway. The streets were sorted in four categories
according to the number of inhabitants. A selection scheme was then specified for
each category: the whole adult population was enumerated in 1 out of 20 for the
smallest streets. In the second category, the adult population was enumerated in half
of the houses in 1 out of 10 of streets. In the third category, the enumeration
concerned 1/4 of the streets and every fifth house was enumerated; and in the last
category of the biggest streets, the adult population was enumerated on half of the
streets and in 1 out of 10 houses in them.
In selecting the streets their distribution over the city was taken into account to
ensure the largest possible dispersion and the “representative character” of the
enumerated areas.
In the medium sized towns, the sample was selected using the same principles,
though in a slightly simplified manner. In the smallest towns, the whole adult
population in three or four houses was enumerated.
Also, in the rural area the number of informants in each of the 18 counties of
Norway was decided on the basis of census data. To obtain representativity,
municipalities in each county were classified according to their main industry, either
as agricultural, forestry, industrial, seafaring, or fishing municipalities. In relation to
the population as a whole, the representative municipalities in each category and
also the number of informants were determined so that each industry attained a
correct weight. In addition, the geographical distribution was taken into account.
The total number of the representative municipalities amounted to 109, which is six
in each county on average. The total number of municipalities was 498.
The selection of informants in a municipality was done in relation to the population
in different parishes, and so that all different municipalities were covered. The final
step was to instruct enumerators to follow a specific path. In addition, enumerators
were instructed to visit different houses situated close to each other. That is, they
were supposed to visit not only middle class houses, but also well-to-do houses,
poor-looking houses and one-person houses.
Kiaer does not explain in his papers how he calculated estimates. The main reason
probably was that the representative sample was constructed as a miniature of the
population. Therefore, calculation of estimates is trivial: the sample mean is the
estimate of the population mean, and the estimate of the population total could be
attained simply by multiplying the sample total by the inverse of sampling fraction.
A more detailed description of Kiaer’s method can be found in the paper read before
a meeting of the Historical Philosophical Section of the Academy of Norway, in
1897, see Kiaer (1997), or in Kiaer’s papers read before ISI meetings, see Kiaer

12
(1895, 1897, 1901). Even this short description of Kiaer’s representative survey
method shows that it resembles the methods of modern sampling theory. The main
difference is that there was no explicit random selection mechanism but some kind
of purposive sampling under constraints of representativity.
The major innovation in Kiaer’s method, compared e.g. to monograph studies, was
that the variation in population was considered an essential characteristic. The
sample was selected in such a manner that the variation was covered in correct
proportions.
With his visions Kiaer was way ahead of his time, which can be seen in the reactions
his paper raised at the ISI meeting in Bern in 1895. The last sentence of a lengthy
comment by the influential Bavarian statistician von Mayr almost became a catch
phrase: “Il faut rester ferme et dire: pas de calcul là où l'obervation peut être faite”
(do not use calculations if you can have observations). The Italian statistician Bodio
supported Von Mayr’s views. The Austrian statistician Rauchberg said that further
discussion of the matter was unnecessary. And the Swiss statistician Milliet
demanded that incomplete surveys should not be granted a status equal to “la
statistique serieuse”. The criticism was almost shattering and Kiaer was not
completely insensitive to it, see Kiaer (1997). Nonetheless, Kiaer developed the
method further and gave papers about it at several ISI meetings.
6. From purposive sampling to random sampling
Despite the hard criticism, professor Arthur Bowley of the University of London
soon became attracted to the Kiaer’s Representative Method. He carried out research
on its merits, especially in the context of a large-sample survey. See e.g. Bowley
(1913). Bowley also played a decisive role in persuading the ISI to endorse Kiaer’s
ideas in a resolution in 1901.
A basic problem of the Representative Method was that there was no way of
establishing the accuracy of estimates. The method lacked a formal theory of
inference, and Bowley made the first steps in this direction. Already very early, he
stressed the importance of applying random sampling (Bowley, 1906). Bowley
showed that for large samples, selected at random from the population, estimates
have an approximately normal distribution. Vital for his results was the assumption
that every element in the population had the same chance of being selected.
Noteworthy in Bowley’s work is that he already presented the notion of a confidence
interval.
After Bowley’s contribution in the ISI meeting of 1924, there were two accepted
methods of sample selection. The first one was Kiaer’s Representative Method,
based on purposive selection, in which representativity played a crucial role, and for
which a rough measure of accuracy of the estimates could be obtained only for the
variables that were present in a census. The second was Bowley’s approach, based
on random sampling with equal probabilities, and for which an indication of the
13
accuracy of estimates could be computed for all variables. Both methods existed side
by side for a number of years.
In 1924 The International Statistical Institute appointed a commission “for the
purpose of studying the application of the Representative Method in Statistics”.
Jensen was appointed reporter of the commission and the other members were
Bowley, Gini, March, Verrijn Stuart, and Zizek. The report starts ‘Three decades
have elapsed since our late lamented colleague, the Norwegian A.N. Kiaer, for the
first time placed this matter on the agenda for the session of the institute…”.
Jensen (1926) writes in the report: “The investigations made by A.N. Kiaer in the
nineties, which form the starting point for the discussion on the Representative
Method at a number of meetings of the International Institute of Statistics, were
representative in the truest sense of the word.”
Verrijn Stuart, Director of Statistics Netherlands, makes a number of noteworthy
comments, see Verrijn Stuart (1926). He starts by remarking that a sample survey
can never be better than a census. He admits that sometimes it is very difficult to
carry out a census, and then a sample survey can be a useful alternative. He also
mentions that the costs of collecting statistical data are increasing. To carry out the
work within a given budget means either publishing less statistics, or going from
censuses to sample surveys.
Verrijn Stuart continues to remark that in some sense statistical offices are already
using the Representative Method. They publish statistics for a certain period, but the
data are collected at one point in this period. Apparently, these data are considered
to be representative for the whole period. Moreover, several statistical quantities,
like e.g. price index numbers, can only computed using samples and interpolation.
He also admits that statistical offices sometimes do things that are even worse than
sample surveys. On of these things is making assumptions that cannot be checked.
An example is assuming that male/female ratio is the same everywhere in the
population.
Notwithstanding some critical remarks, Verrijn Stuart concludes that it is often
possible to use sample surveys without losing quality. He cannot give general
recommendations for every survey. Possible application should always be carefully
tested. And also detailed documentation should be produced, so that one can always
find out at some later date how certain results have been obtained.
With respect to sampling, Verrijn Stuart advocates random selection. In his views,
purposive sampling always reflects subjective decisions. This can be avoided using
random samples. And one has not to be afraid of skew samples. The Law of Large
Numbers will reduce the risk of such samples to almost zero.
It took almost 30 years until in 1924, five years after his death, Kiaer’s
Representative Method was approved as a valid statistical method. According to
Porter (1986), the distrustful attitude of statisticians towards sampling was not
surprising. Until the end of the19th century they emphasized the importance of
complete enumeration at every opportunity. This scepticism of statisticians about
14
inference from samples was not wholly unjustified. In the absence of reliable
information about the population as a whole it was difficult to know if a particular
sample was adequately representative.
The coexistence of the two selection methods (purposive and random selection)
lasted until 1934, in which year the Polish scientist Jerzy Neyman read his now
famous paper in front of the Royal Statistical Society (Neyman, 1934). He had
developed a new theory of estimation based on the concept of confidence intervals.
One of the basic ideas was to apply the same methods in social surveys as Fisher had
applied in agricultural experiments, especially randomisation and inclusion
probabilities.
The contribution of Neyman was not only that he invented the estimation method
based on confidence intervals. By making an empirical evaluation of Italian census
data, he could also prove that the Representative Method based on purposive
sampling could produce unsatisfactory estimates of population characteristics. The
result of Neyman’s evaluation of purposive sampling was that the method fell into
disrepute. He had established the superiority of random sampling (also referred to as
probability sampling) over purposive sampling.
It should be remarked that the concept of random sampling not only emerged in
Western Europe. The literature on the history of statistics often seems to overlook
the role played by Russian statisticians in the Zemstva, see Mespoulet (2001).
After the reform of 1864, district and provincial assemblies (Zemstva) were created
in the rural parts of Russia. The members of the district assemblies were elected by
their inhabitants. District assemblies then elected delegates for the provincial
assemblies. The Zemstva were responsible for administration, local education,
public health, etc. The quantity and the diversity of statistical data needed by
Zemstva administrators stimulated development of a methodology for sample
surveys in Russia between 1875 and 1930. From 1890 on, sample surveys were
conducted by statisticians who were seeking solutions to practical administrative
problems, and their sampling techniques evolved as Russian administrators put these
statistical surveys to use.
The first samples were selected in a systematic way, using lists provided by village
heads. In 1896, the Zemstva statistician A.V. Peshekhonov, conducted a budget
survey in the province of Kaluga, where the sample was selected at random. The
reason he did this was that he lacked any other information that could help him in
getting a representative sample.
Mespoulet (2001) also mentions the work of Kovalevskiy. His mathematical
treatment of the theory of stratified sampling was published in 1924 (10 years before
Jerzy Neyman’s famous paper). Kovalevskiy’s work is in fact a synthesis of the
practical work of statisticians in the Zemstva and the theoretical work of Russian
university statisticians before 1917.
Looking back to the first applications of applying probability in official statistics, it
should be noted that a fundamental change has taken place. Statisticians like
15
Quetelet and Lobatto introduced randomization as uncertainty in the measurement
process. They considered observed values as being random variations around a true
value. They used probability theory to prove that the average of a number of such
observations had a normal distribution. By contrast, sampling theory as developed
by Bowley, Neyman and their successors, saw observations as fixed values
measured without uncertainty. Randomization was introduced by the sampling
mechanism. This is “man-made randomization”. Since the sampling mechanism is
completely under control of the statistician, he can apply probability theory to
compute all sampling distributions exactly. No assumptions need to be made.
Therefore, modern sampling theory provides a very robust instrument for making
valid inference about a population.
7. Putting theory into practice
Random selection became an essential element of survey sampling. Although
theoretically very attractive, it was not very simple to realise this in practical
situations. How to randomly select a sample of thousands of persons from a
population of several millions? How to generate thousands of random numbers? To
avoid this problem, systematic samples were selected often. Using a list of elements
in the population, a starting point and a step size were specified. By stepping
through this list from the starting point, elements were selected. Provided the order
of the elements is more or less arbitrary, this systematic selection resembles random
selection. W.G. and L.H. Madow made the first theoretical study of the precision of
systematic sampling only in 1944, see Madow and Madow (1944). The use of the
first tables of random numbers published by Tippet (1927) also made it easier to
select real random samples.
In 1943, Hansen and Hurvitz published their theory of multi-stage samples. In the
first stage, primary sampling units are selected with probabilities proportional to
their size. Within selected primary units, a fixed number of secondary units are
selected. This proved to be a useful extension of the survey sampling theory. On the
one hand, this approach guaranteed every secondary unit to have the same
probability of selection in the sample, and on the other, the sampled units were
distributed over the population in such a way that the fieldwork could be carried out
efficiently. This theory still forms the basis of the sample designs of e.g. the
household surveys of Statistics Netherlands: first, municipalities are selected with
probabilities proportional to the number of inhabitants, and then an equal number of
inhabitants are selected in each selected municipality.
The United Nations Statistical Commission established the Sub-commission on
Statistical Sampling in 1947. The work of the Commission consisted of drawing up
standards that would assist national statistical institutes in improving their statistics
by using modern sampling procedures. The first publication of the Sub-commission
was a paper on “The Preparation of Sampling Survey Reports”, see United Nations
Statistical Commission (1950). This historically significant document provides a set
16
of suggestions for the preparation of sampling survey reports. It is one of the earliest
set of international guidelines which dealt with the use of technical terminology in
various aspects of the sampling process. Members of the Sub-commission were the
famous statisticians Darmois, Deming, Mahalanobis, Yates and Fisher. The
suggestions in this paper still provide a useful guide for achieving clarity,
comprehensiveness, and international comparability in sample survey reporting. The
paper promotes probability sampling. If researchers decide not to use random
selection, they should provide evidence on which they rely for adapting alternative
procedures. Purposive sampling and quota sampling are not regarded as equivalents
to random selection.
Mahalanobis was the driving force behind the United Nations Sub-commission on
Statistical Sampling. With the vision of a pioneer he perceived how sampling
methods could overcome the otherwise insoluble problems of obtaining accurate
information about a vast and still largely illiterate country like India. Mahalanobis
(1950) showed that with an acceptable level of precision the costs of sample surveys
are only about 10% of that of a complete enumeration.
Fisher (1950) made four claims for application of sampling procedures. Three more
obvious ones are adaptability, speed, and economy. His fourth claim is that sampling
is a more scientific method than complete enumeration. The roots of sampling are in
mathematical theory. This allows for a careful design of sample surveys with a
preset level of precision.
The classical theory of survey sampling was more or less completed in 1952.
Horvitz and Thompson (1952) developed a general theory for constructing unbiased
estimates. Whatever the selection probabilities are, as long as they are known and
positive, it is always possible to construct a useful estimate. Horvitz and Thompson
completed the classical theory, and the random sampling approach was almost
unanimously accepted. Most of the classical books about sampling were also
published by then (Cochran, 1953; Deming, 1950, Hansen, Hurwitz and Madow
1953, Yates 1949).
8. Developments in the Netherlands
Statisticians in The Netherlands followed the discussions about sample surveys
closely. Still, sampling was not a topic that could be found in textbooks about
statistics that were published early in the 20th century. For example, the concept of
sampling was not mentioned in Verrijn Stuart (1910). Van Zanten (1927) mentions
Kiaer’s Representative Method, and the discussion about it during the ISI sessions in
1903 and 1925. He notes that this method was not completely rejected, and could
have some merits if some conditions were satisfied. He did not mention probability
sampling as means to overcome some of the difficulties of Kiaer’s approach.
Only in the third revision of his book, Bakker (1941) includes the notion of random
sampling. He argues that it is not necessary to investigate a complete population. A
17
sample may suffice as long as its element are selected “blindly”. He points that some
indication of the accuracy of estimates can be obtained by repeating the sampling
experiments a number of times. Bakker does not mention the confidence interval.
However, he gives the formula for the standard error of the sample mean, and states
that the “error” in the sample mean can never be larger than three times the standard
error. It should be remarked that initially Bakker considered use of sampling
techniques only for quality control in industrial production processes. In a later
book, Bakker (1948a) proposes the use of sampling in social-cultural research and
opinion research. By reducing the number of observations, more in-depth
investigations can be carried out, and this will also create the possibility to do
research in other fields.
In May 1924, Jensen accepted to be rapporteur of the ISI commission “for the
purpose of studying the application of the Representative Method in Statistics”. In
August of the same year, Methorst (Director of the Netherlands Central Bureau of
Statistics) writes to Jensen, explaining that he is in favour of the Representative
Method. According to Methorst, “the method helps to save a great deal of expense
and labour in these times of economic stress”. Methorst (1924) tested the
Representative Method on mortality statistics in the province of Noord-Brabant. He
formed two groups of municipalities. The first group consisted of 143 small
municipalities with at most 5,000 inhabitants. The second group contained all 29
municipalities with a number of inhabitants between 5,000 and 20,000. In each
group he ordered the municipalities alphabetically by name, and subsequently
divided the group into 5 sub-groups. In this way he obtained five samples in each
group. He computed estimates by taking various combinations of a sample from the
first group and a sample from the second group.
The conclusions of Methorst were that the Representative Method did not work in
this application. The variations in the estimates for the age distribution and the
mortality distributions were too large. He judged the method completely useless for
estimating age specific mortality distributions. Moreover, in his opinion, application
of the Representative Method did not save time.
Van der Waerden (1924) also applied the Representative Method in an experimental
setting. Like Methorst, he divided the municipalities of the province of Noord-
Brabant in three size groups. He concentrated on the group of municipalities with
5,000 to 20,000 inhabitants. Using a selection of 5 to 7 municipalities from the
group of 31 municipalities, he attempted to estimate the number of illegitimate
children. It is unclear how he selected municipalities. Van der Waerden concluded
that the obtained estimates lacked sufficient accuracy. The main reason, according to
Van der Waerden, was that the probability of getting an illegitimate child is not the
same in every municipality. He attempted to improve his estimates by incorporating
data on the previous year. So, he used a kind of ratio estimator. This estimator
performed better, but still accuracy was low. His conclusion was that the
Representative Method could not be used for this kind of statistics.

18
In the period until the Second World War little attention is paid to applying proper
sampling designs to obtain representative samples. One example is a survey about
leisure activities by workers, see Blonk and Kruijt (1936). The target population
consisted of all people of age 10 and older with a regular job. Media and labour
unions made calls to participate. At the local level, teachers, clergymen and board
members of organisations helped in persuading people to fill in forms. Sometimes,
local leaders filled in many forms on behalf of others. All in all, 742 forms were
received, only 50 of which were completed by women. This amount was considered
too small for analysis, and therefore these forms were discarded. The researchers
realised that their survey could not be considered representative, because a
substantial amount of lower-class people were illiterate, or at least had difficulty
writing down answers to questions.
A first test of a real sample survey using random selection was carried out by
Statistics Netherlands in 1941, see CBS (1948). Using a simple random sample of
size 30,000 from the population of 1.75 million tax payers, it was shown that
estimates were accurate. Also, confidence intervals were computed. CBS (1948) also
paid attention to stratified samples, but the underlying theory was considered to be
rather complicated. This publication already contained a warning that the
phenomenon of non-response may lead to biased estimates. The Budget Survey was
used as an example. Finally, allocation of the sample for stratified sampling was
discussed. It was shown that allocation proportional to the total of the variable
produced more accurate estimates than proportional allocation.
Notwithstanding the above mentioned studies, all statistics published in the 19th and
the first halve of the 20th century were based on a complete enumeration. Either data
was collected by means of a population census, or the data was obtained from
population registers. This is clearly shown by Idenburg (1952a), who describes the
history of statistics in The Netherlands between Word War I and II. Words like
‘sample’ or ‘sample survey’ are not mentioned at all. Real use of sample surveys at
Statistics Netherlands did not start until after World War II.
Even in 1952, there was a plea by the Director-General of Statistics Netherlands for
the use of sample surveys. In a paper for the Central Statistical Commission, he
explained how scientific developments had made it possible to compute accurate
estimates, see Idenburg (1952b). He also responded to the criticism that sample
surveys do not treat everybody equally, by stating that a random selection gives
everyone the same probability to contribute to statistics.
One of the first real applications of sampling took place with respect to income
statistics of 1947. In 1946, a complete enumeration had been carried out. It meant
processing of data on 4 million tax administration cards. Since the quality of the data
on the cards was not very good, a lot of manual editing had to take place. To reduce
the size of this immense effort, it was decided to use sampling methods for the next
years. All large towns were included in the survey. In these towns, either a
systematic or a random sample of cards was selected. For the rest of the country, a
sample of towns was selected, and in these towns all cards were processed. Later
19
income surveys were partly based on a sample of households from the population
administration of the municipalities.
In the same post-war period, Statistics Netherlands used sample survey methods in
agricultural statistics, see Snoep (1950), Idenburg and Ignatius (1949), and Idenburg
(1952b). Starting in 1947, surveys were carried out to estimate agricultural
production. Samples were selected from a sampling frame consisting of a list of
addresses of farms. These lists were compiled in the agricultural census (a complete
enumeration) that was conducted every year in the month of May. A stratified
sample was selected, where strata were formed based on province and size of farms.
Within each stratum, systematic samples were selected. The total sample size was
10,000 to 20,000 farms. The size of the sample was small compared to the size of
the census (in the order of magnitude of 500,000 farms). Nevertheless, it allowed for
early estimates for the type and size of agricultural production.
One of the most important economic indicators produced by Statistics Netherlands is
the consumer price index. To be able to compute this statistic, information from two
types of sources is required. In the first place, there must be information about prices
of products and services. Such information is collected by means of price surveys.
To monitor changes over time, these surveys must take place at frequent intervals. In
the second place, consumption of products and services by households must be
measured. This is done by means of expenditure surveys. Usually, these surveys are
carried out at less frequent intervals, as consumption patters vary less over time than
prices. Also, expenditure surveys are much more complex and more expensive to
carry out.
The computation of consumer price indices started somewhere during World War I.
This work was mainly done by the municipal statistical bureaus of large towns like
Amsterdam and The Hague. Work at the national level started in 1935. In this and
the following year, the first national expenditure survey was carried out by Statistics
Netherlands. The number of households in the sample was 598. This was not a
random sample. Two recruitment techniques were used. In the first place,
households were recruited through labour unions, farmer’s associations, housewife
unions, etc. This was a cause of selectivity, because only the more active members
agreed to participate. In the second, place, households were recruited through
advertisements in local newspapers. Also here, the same type of selectivity was
observed. Until 1956, this selection strategy was used, although the size of the
selection was increased. Then selection procedures changed. The basic selection was
obtained by means of a random sample from the population registers of the
municipalities. Due to non-response and attrition, the effective sample size reduced.
A backup sample of recruited volunteers was used to fill gaps. For more information
about budget surveys, see CBS (1967).
Efforts through the following years have been aimed at moving more and more in
the direction of random samples. Due to high non-response rates in expenditure
surveys, it remained difficult to consider the effective sample as representative.
20
Thus, it remained hard to apply survey sampling theory to compute accurate
estimates.
9. Sampling in market research
Up until know, the introduction of sampling in official statistics has been described.
But that was not the only area were sampling was introduced. Opinion polls can be
seen as a special type of sample surveys, in which attitudes or opinions of a group of
people are measured on political, economic or social topics. The history of opinion
polls in the United States goes back to 1824. In that year, two newspapers, the
Harrisburg Pennsylvanian and the Raleigh Star, attempted to determine political
preferences of voters prior to the presidential election of that year. The early polls
did not pay much attention to sampling. Therefore, it was difficult to establish
accuracy of results. Such opinion polls were often called straw polls. This
expression goes back to rural America. Farmers would throw a handful of straws
into the air to see which way the wind was blowing. In the 1820s, newspapers began
doing straw polls in the streets to see how political winds blew.
It took until the 1920’s before more attention was paid to sampling aspects. At that
time, Archibald Crossley developed new techniques for measuring American
public's radio listening habits. And George Gallup worked out new ways to assess
reader interest in newspaper articles, see e.g. Linehard (2003). The sampling
technique used by Gallup, was quota sampling. The idea was to investigate groups
of people who were representative for the population. Gallup sent out hundreds of
interviewers across the country. Each interviewer was given quota for different types
of respondents: so many middle-class urban women, so many lower-class rural men,
etc. In total, approximately 3000 interviews were carried out for a survey.
Gallup’s approach was in great contrast with that of the Literary Digest magazine,
which was at that time the leading polling organisation. This magazine conducted
regular “America Speaks’ polls. It based its predictions on returned ballot forms that
were sent to addresses obtained from telephone directories books and automobile
registration lists. The sample size for these polls was very large: something like two
million people.
The presidential election of 1936 turned out to be decisive for both approaches, see
e.g. Utts (1999). Gallup correctly predicted Franklin Roosevelt to be the new
president, whereas Literary Digest predicted that Alf Landon would beat Franklin
Roosevelt. How could a prediction based on such a large sample be so wrong? The
explanation was a fatal flaw in the Literary Digest’s sampling mechanism. The
automobile registration lists and telephone directories where not representative
samples. In the 1930’s cars and telephones were typically owned by the middle and
upper classes. More well-to-do Americans tended to vote Republican, and the less
well-to-do were inclined to vote Democrat. Therefore, Republicans were over-
represented in the Literary Digest sample.
21
As a result of this historic mistake, the Literary Digest magazine ceased publication
in 1937. And opinion researchers learned that they should rely on more scientific
ways of sample selection. They also learned that the way a sample is selected, is
more important than the size of the sample.
Bakker (1948b) devotes one chapter in his book to opinion polls. He remarks that to
measure the opinion of the Dutch population, it is not necessary the question all 5.5
million Dutchmen. With a sample of, say, 2,000 to 10,000 people, a high degree of
accuracy can be obtained.
In the 1930’s, we see the emergence of the first market research agencies. Van
Ginneken (1993) describes how Unilever established an advertising agency called
Lintas (Lever’s International Advertising Services). Initially, this agency was mainly
engaged in design of advertisements, but in 1934 a market research department was
set up. A first market research project was carried out in The Netherlands in 1937
about the use of abrasives (“VIM”) and reading habits. The project was so
successful that Unilever founded a new market research agency in 1938. It was
called the “Instituut voor Huishoudelijk Onderzoek (IHO)”. In 1971 It was renamed
into “Social and Marketing Research (SOCMAR)”, and from 1987 it operated under
the name “Research International Nederland”. During the Second World War,
market research activities almost come to a halt, but they were resumed at a large
scale after the war. In 1946 a panel of approximately 600 housewives was
established to regularly measure consumer opinions. It is unclear how these
housewives were selected, and whether the panel could be considered representative.
In 1940, another market research agency was established: “Nederlandse Stichting
voor Statistiek (NSS)”, see Van der Bie (2001). It was the commercial ‘sister’ of the
Netherlands Central Bureau of Statistics (CBS). Among the board members were
Idenburg (Director-General of the CBS) and Tinbergen (at that time professor in
Rotterdam). Main activities of NSS were market research, opinion polls, business
consultancy, and correspondence courses in statistics. The first national opinion
survey of NSS was carried out in 1947. It is described in NSS (1947). A sample of
5861 households answered questions about the consumer goods. The sample was
stratified into four strata: the largest three cities and the rest of the country. There
were 375 interviewers, distributed all over the country, who collected the data. The
sample selection was carried by the interviewers according to specific instructions.
The documentation is unclear about the sample selection mechanism. There is no
indication that a form of probability sampling has been applied. However, formulae
are given for the accuracy of estimates that assume simple random sampling.
In 1945 yet another market research agency was founded: the “Nederlands Instituut
voor de Publieke Opinie (NIPO)”. Related to this institute was the “Vereeniging
voor Opinie-onderzoek”. Its objective was to disseminate results of opinion polls,
and to publish reflective articles about opinion polls. For several polls conducted in
this year, some form of sampling was applied, but sometimes in a primitive way. For
example, Vereeniging voor Opinie-onderzoek (1945) gives an account of a mail
survey carried out in the town of Eindhoven, in which the sample consisted of all
22
persons of age 21 and over of which the last name started with the letter A. The
response rate turned out to be 78%.
In 1946, a new magazine (“De Publieke Opinie”) was published by NIPO and the
“Instituut voor Marktverkenning” in Amsterdam. The first issue explains that long
experience and laws of statistics have shown that a sample size of 100,000 people is
not require for reliable outcomes of opinion polls, see NIPO (1946a). Samples of
size 2,000 to 10,000 suffice as long as two conditions are satisfied:
• Face-to-face interviewing should be used, and not mail interviewing;
• The distribution of the sample over rural and urban areas, and also over
population groups determined by income, occupation, age and sometimes
religion, should match the corresponding population distribution.
Mail interviewing was advised against. Response rates were low, and people
completing and returning questionnaire forms were assumed to be more interested in
the topics of the polls because their intelligence and social-economic position was
above average.
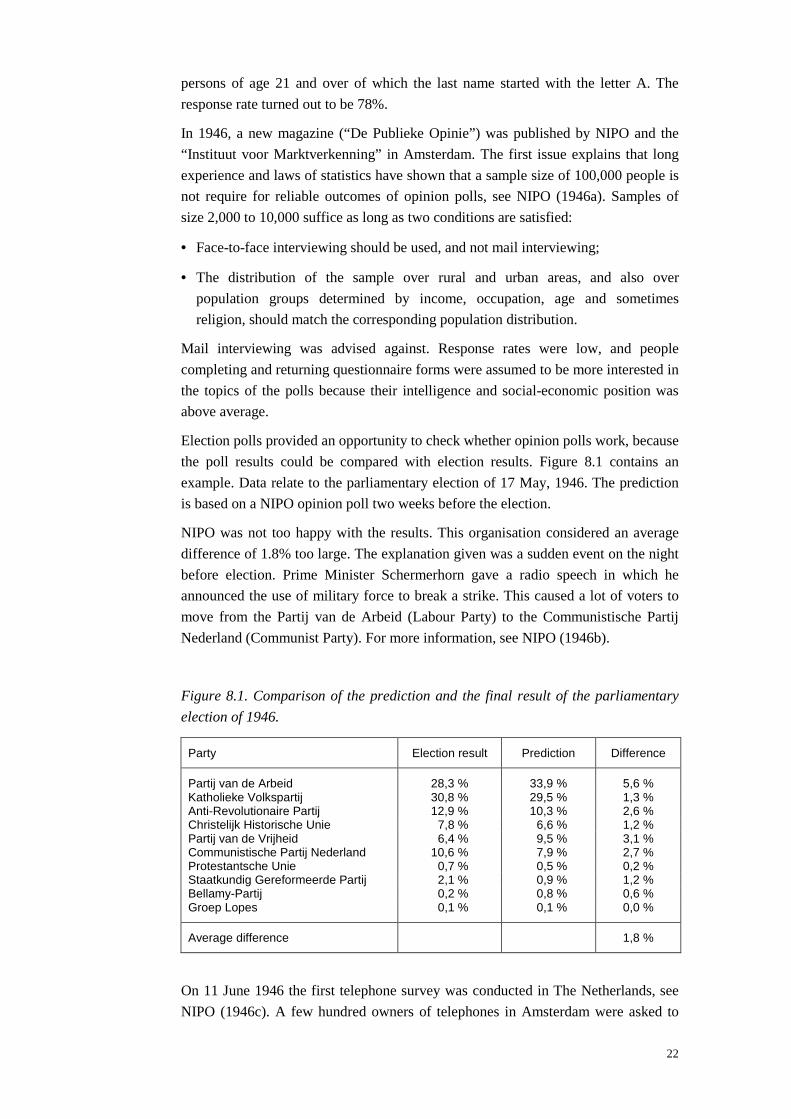
Election polls provided an opportunity to check whether opinion polls work, because
the poll results could be compared with election results. Figure 8.1 contains an
example. Data relate to the parliamentary election of 17 May, 1946. The prediction
is based on a NIPO opinion poll two weeks before the election.
NIPO was not too happy with the results. This organisation considered an average
difference of 1.8% too large. The explanation given was a sudden event on the night
before election. Prime Minister Schermerhorn gave a radio speech in which he
announced the use of military force to break a strike. This caused a lot of voters to
move from the Partij van de Arbeid (Labour Party) to the Communistische Partij
Nederland (Communist Party). For more information, see NIPO (1946b).
Figure 8.1. Comparison of the prediction and the final result of the parliamentary
election of 1946.
Party Election result Prediction Difference
Partij van de Arbeid 28,3 % 33,9 % 5,6 %Katholieke Volkspartij 30,8 % 29,5 % 1,3 %Anti-Revolutionaire Partij 12,9 % 10,3 % 2,6 %Christelijk Historische Unie 7,8 % 6,6 % 1,2 %Partij van de Vrijheid 6,4 % 9,5 % 3,1 %Communistische Partij Nederland 10,6 % 7,9 % 2,7 %Protestantsche Unie 0,7 % 0,5 % 0,2 %Staatkundig Gereformeerde Partij 2,1 % 0,9 % 1,2 %Bellamy-Partij 0,2 % 0,8 % 0,6 %Groep Lopes 0,1 % 0,1 % 0,0 %
Average difference 1,8 %
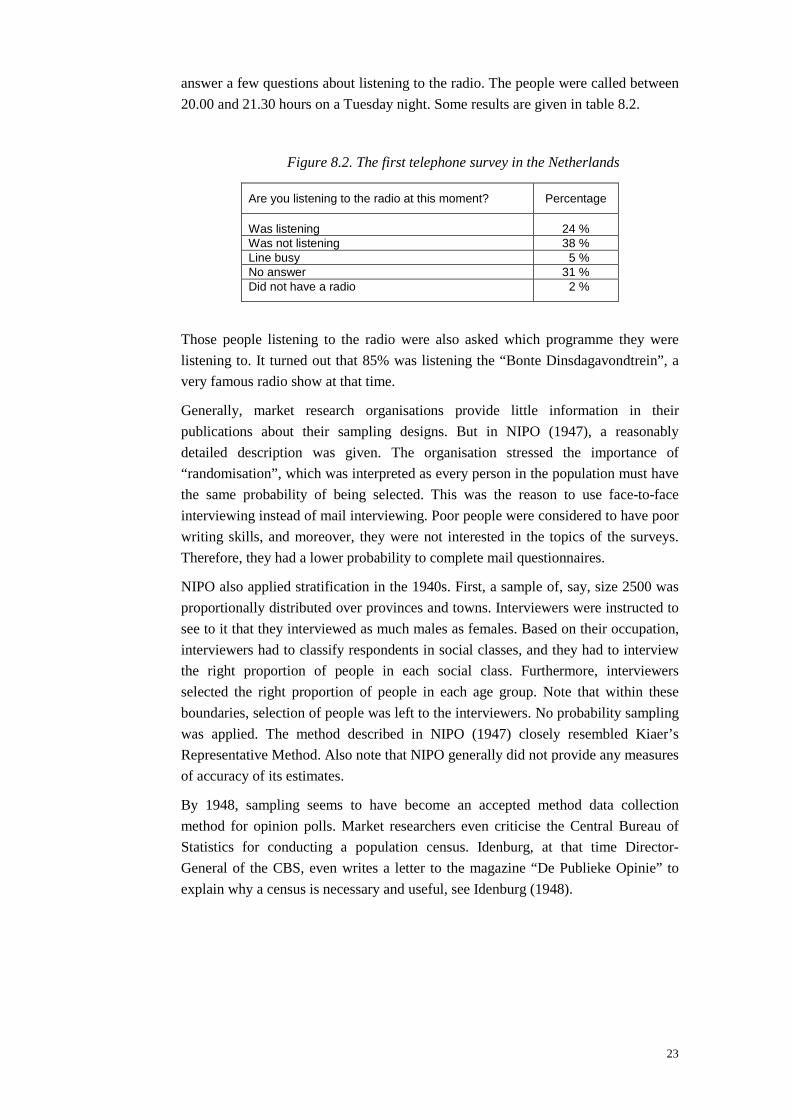
On 11 June 1946 the first telephone survey was conducted in The Netherlands, see
NIPO (1946c). A few hundred owners of telephones in Amsterdam were asked to
23
answer a few questions about listening to the radio. The people were called between
20.00 and 21.30 hours on a Tuesday night. Some results are given in table 8.2.
Figure 8.2. The first telephone survey in the Netherlands
Are you listening to the radio at this moment? Percentage
Was listening 24 %Was not listening 38 %Line busy 5 %No answer 31 %Did not have a radio 2 %
Those people listening to the radio were also asked which programme they were
listening to. It turned out that 85% was listening the “Bonte Dinsdagavondtrein”, a
very famous radio show at that time.
Generally, market research organisations provide little information in their
publications about their sampling designs. But in NIPO (1947), a reasonably
detailed description was given. The organisation stressed the importance of
“randomisation”, which was interpreted as every person in the population must have
the same probability of being selected. This was the reason to use face-to-face
interviewing instead of mail interviewing. Poor people were considered to have poor
writing skills, and moreover, they were not interested in the topics of the surveys.
Therefore, they had a lower probability to complete mail questionnaires.
NIPO also applied stratification in the 1940s. First, a sample of, say, size 2500 was
proportionally distributed over provinces and towns. Interviewers were instructed to
see to it that they interviewed as much males as females. Based on their occupation,
interviewers had to classify respondents in social classes, and they had to interview
the right proportion of people in each social class. Furthermore, interviewers
selected the right proportion of people in each age group. Note that within these
boundaries, selection of people was left to the interviewers. No probability sampling
was applied. The method described in NIPO (1947) closely resembled Kiaer’s
Representative Method. Also note that NIPO generally did not provide any measures
of accuracy of its estimates.
By 1948, sampling seems to have become an accepted method data collection
method for opinion polls. Market researchers even criticise the Central Bureau of
Statistics for conducting a population census. Idenburg, at that time Director-
General of the CBS, even writes a letter to the magazine “De Publieke Opinie” to
explain why a census is necessary and useful, see Idenburg (1948).
24
10. Conclusion
The theory of survey sampling has been developed over a period of more than 100
years. By now, the paradigm of probability sampling has shown to work well in
social research, official statistics and market research. It has allowed researchers to
produce well-founded and reliable survey results.
Survey sampling is a now a well-established scientific method. Nevertheless, there
are still surveys in which the fundamental principles of probability sampling are not
applied. This is particularly true for web surveys. Online data collection is cheap and
fast. It also offers easy access to large groups of potential respondents. At first sight,
online surveys seem to have much in common with other types of surveys. It is just
another mode of data collection. Questions are not asked face-to-face or by
telephone, but over the Internet. What is different for many online surveys, however,
is that the principles of probability sampling have not been applied. This can have a
major impact on survey results.
One of the problems is under-coverage. Since not everyone has access to the
Internet, specific groups in the population will be under-represented in a web survey.
An even more serious problem is that many web surveys rely on self-selection of
respondents instead of on probability sampling. The researcher has not control at all
over the selection process. Selection probabilities are unknown, and therefore it is
not possible to contract unbiased estimates.
It is important that survey researchers are transparent about the way in which their
surveys are carried out. Following Fowler (2002), researchers should explain to the
users of their survey results how the sample was drawn. They should point out that
estimates are likely biased in the direction of availability and willingness to be
interviewed, and that the normal assumptions for calculating sampling errors do not
apply. Unfortunately, such warnings are not common. Therefore, non-probability
samples are often misrepresented seriously, and that constitutes a serious problem
for the credibility of survey research.
11. References
Bakker, O. (1941), Statistiek, Een Inleiding Tot De Statistische Methode En Haar
Toepassingen, Deel I, De Statistische Methode, 3th Edition. J. Muuses,
Purmerend.
Bakker, O. (1948a), Statistiek, Een Inleiding Tot De Statistische Methode En Haar
Toepassingen, Deel II, De Toepassingen Der Statistische Methode, 5th
Edition. J. Muuses, Purmerend.
Bakker, O. (1948b), Statistiek, Een Inleiding Tot De Statistische Methode En Haar
Toepassingen, Deel III, Marktonderzoek. J. Muuses, Purmerend.
Bie, R. van der (2001), Boeiende statistiek. Index 5, June 2001, Statistics
Netherlands, Voorburg, The Netherlands, pp. 24-25.
25
Blonk, A. and Kruijt, J.P. (1936), De besteding van vrije tijd door de Nederlandse
arbeiders. Nutsuitgeverij, Amsterdam
Bowley, A.L. (1906), Address to the Economic Science and Statistics Section of the
British Association for the Advancement of Science. Journal of the Royal
Statistical Society 69, pp. 548-557.
Bowley, A.L. (1913), Working-class Households in Reading. Journal of the Royal
Statistical Society 76, pp. 672-701.
CBS (1948), Enige beschouwingen over steekproeven. Reprint from: Statistische en
Economische Onderzoekingen 3, Statistics Netherlands, The Hague.
CBS (1967), Nationaal Budgetonderzoek 1963/’65, Deel 5: Geschiedenis van het
budgetonderzoek in Nederland. Centraal Bureau voor de Stataistiek, Den
Haag.
Cochran, W.G. (1953), Sampling Techniques. John Wiley & Sons, New York.
Deming, W. E. (1950), Some Theory of Sampling. John Wiley & Sons, New York.
Den Dulk, K. and Van Maarseveen, J. (1990), The population censues in the
Netherlands. In: J. van Maarseveen and M. Gircour (eds.): A Century of
Statistics, Counting, accounting and recounting in The Netherlands. Statistics
Netherlands, Voorburg, The Netherlands.
Desrosières, A. (1998), The Politics of Large Numbers; A History of Statistical
Reasoning. Harvard University Press, Cambridge, Massachusetts.
Fisher, R.A. (1950), The Sub-commission on Statistical sampling of the United
Nations. Bulletin of the International Statistical Institute, XXVI, Book 2, pp.
207-209.
Fowler, Floyd J. Jr. (2002) Survey Research Methods, 3rd Edition. Thousand Oaks,
California: Sage Publications.
Ginneken, J. van (1993), De uitvinding van het publiek, De opkomst van het opinie-
en marktonderzoek in Nederland. Otto Cramwinckel Uitgever, Amsterdam
Graunt, J. (1662), Natural and political observations upon the bills of mortality.
Martyn, London.
Hansen, M.H. and Hurvitz, W.N. (1943), On the theory of sampling from a finite
population. Annals of Mathematical Statistics 14, pp. 333-362.
Hansen, M.H., Hurvitz, W.N. Madow, W.G. (1953), Survey sampling methods and
theory. John Wiley & Sons, New York.
Horvitz, D.G. and Thompson, D.J. (1952), A generalization of sampling without
replacement from a finite universe. Journal of the American Statistical
Association 47, pp. 663-685.
Idenburg, Ph. J. (1948), De Papierwinkel. De Publieke Opinie, 2e jaargang, No.19, p.
3.
26
Idenburg, Ph. J. (1952a), Geschiedenis der Nederlandsche statistiek. In: De
Nederlandse Volkshuishouding tussen de twee Wereldoorlogen, Deel 1,
Nummer 2. Utrecht.
Idenburg, Ph. J. (1952b), Steekproeven. Internal CBS report S.708-CC-52. Statistics
Netherlands, The Hague.
Idenburg, Ph. J. and Ignatius, J.G.W. (1949), Statistics of agriculture in the
Netherlands. Bulletin of the International Statistical Institute, XXXII, Book 2,
pp. 256-258
Jensen, A. (1926), Report on the Representative Method in Statistics. Bulletin of the
International Statistical Institute, XXII, Book 1, pp. 359-378.
Kendall, M.G. (1960), Where shall the history of statistics begin? Biometrika, 47,
pp. 447-449.
Kersseboom, W. (1738-1742), Proeve van Politique Rekenkunde, vervat in drie
Verhandelingen over de Meenigte des Volks in de Provintie van Hollandt en
Westfreislandt; de Probale Leeftijt der Weduwen, de Duurzaamheid der
Huwelijken, de relatie van de Meenigte des Vols tegen het Getal. Den Haag
Kiaer, A. N. (1895-1896), Observations et expériences concernant des
dénombrements représentatives. Bulletin of the International Statistical
Institute, IX, Book 2, pp. 176-183.
Kiaer, A. N. (1897), Sur les méthodes représentatives ou typologiques appliquées à
la statistique. Bulletin of the International Statistical Institute, XI, pp. 180-
189.
Kiaer, A. N. (1901): Sur les méthodes représentatives ou typologiques. Bulletin of
the International Statistical Institute, Book 3, pp. 66-78.
Kiaer, A. N. (1997 reprint): Den repräsentative undersökelsesmetode. Christiania
Videnskabsselskabets Skrifter. II. Historiskfilosofiske klasse, Nr 4 (1897).
English translation: The Representative Method of Statistical Surveys,
Statistics Norway.
Kuhn T.S. (1975), The Structure of Scientific Revolutions, 2nd Edition. The
University of Chicago Press, Chicago, Michigan.
Laplace, P.S. (1812), Théorie analytique des probabilités. Oevres complètes, Vol. 7,
Gauthier-Villar, Paris.
Linehard, J.H. (2003), The Engines of Our Enginuity, An Engineer Looks at
Technology and Culture. Oxford University Press, Oxford, UK.
Lobatto, R. (1860), Over de Waarschijnlijkheid van Gemiddelde Uitkomsten uit een
Groot Aantal Waarnemingen. Archief van het Wiskundig Genootschap II, pp.
96-127.
Madow, W.G. and Madow, L.H. (1944): On the theory of systematic sampling.
Annals of Mathematical Statistics, 15, 1-24.

27
Mahalanobis, P.C. (1950), Cost and accuracy of results in sampling and complete
enumeration. Bulletin of the International Statistical Institute, XXVI, Book 2,
pp. 210-213.
Mespoulet, M. (2001), Statistique Administrative et usages du Sondage en Russie
entre 1880 et 1930. In : Droesbeke, J.J. and Lebart, L., Enquêtes, Modèles et
Applications. Dunod, Paris.
Methorst, H.W. (1924), Toepassing der Representatieve Methode in de Sterfte-
statistiek binnen de Provinciale Grenzen. Internal CBS Report, Statistics
Netherlands, The Hague.
Neyman, J. (1934), On the two different aspects of the representative method: the
method of stratified sampling and the method of purposive selection. Journal
of the Royal Statistical Society 97, pp. 558-606.
NIPO (1946a), Wat denkt het publiek ervan? De Publieke Opinie, 1e jaargang, No.
1, pp. 1-2.
NIPO (1946b), Rekening en Verantwoording? De Publieke Opinie, 1e jaargang,
No.2, p. 1.
NIPO (1946c), Eerste Telefonische Enquête in Nederland verricht door NIPO. De
Publieke Opinie, 1e jaargang, No. 4, p. 1.
NIPO (1947), De Techniek van het Gallup-ondezoek. De Publieke Opinie, 2e
jaargang, No.1, pp. 1-5.
NSS (1947), Consumentenonderzoek voor Nederland, Najaar 1947, Nederlandse
Stichting voor de Statistiek, ’s Gravenhage / Leidschendam.
Porter T. M. (1986), The Rise of Statistical Thinking 1820-1900. Princeton
University Press.
Quetelet, L.A.J. (1835), Sur l’Homme et le Développement de ses Facultés, Essai de
Physique Sociale. Paris.
Quetelet, L.A.J. (1846), Lettre à S.A.R. le Duc Régant de Saxe Coburg et Gotha sur
la Théorie des Probabilités, Appliquée aux Sciences Morales at Politiques.
Brussels.
Snoep, J. (1950), De steekproef als hulpmiddel voor het verkrijgen van
landbouwstatistieken, Landbouwkundig tijdschrift 62, pp. 152-165
Stamhuis, I.H. (1989), Cijfer en Aequaties en Kennis der Staatskrachte, Statistiek in
Nederland in de Negentiende Eeuw. Rodopi, Amsterdam-Atlanta.
Stephan, F.F. (1948), History of the uses of modern sampling theory and practice.
Journal of the American Statistical Association, 43, pp. 12-39.
Struyck, N. (1740), Inleiding tot de Algemene Geographie benevens eenige
Sterrekundige en andere Verhandelingen. Amsterdam
Struyck, N. (1753), Vervolg van de Beschryving der Staartsterren, en Andere
Ontdekkingen omtrent den Staat van’t Menschelyk Geslacht. Amsterdam
28
Tippet, L.C. (1927), Random sampling numbers. Tracts for computers, XV, Harvard
University Press, Cambridge, Massachusetts.
United Nations Statistical Commission (1950), The Preparation of Sampling Survey
Reports. Statistical Papers, Series C, no. 1, Lake Success, New York.
Utts, J.M. (1999), Seeing Through Statistics. Duxburry Press, Belmont, CA.
Vereeniging voor Opinie-onderzoek (1945), Enquête over de samenstelling van de
gemeenteraad te Eindhoven. Mededeelingenblad, Vereeniging voor Opinie-
onderzoek, ’s Gravengae, november 1945. p. 8.
Verrijn Stuart, C.A. (1910), Inleiding tot de Beoefening der Statistiek. De Erven F.
Bohn, Haarlem.
Verrijn Stuart, C.A. (1926), Note sur l’application de la Méthode Représentative.
Bulletin of International Statistical Institute, XXII, Book 1, pp. 440-443.
Waerden, B.L. van der (1924), Rapport over de Nauwkeurigheid der
Representatieve Methode, Toegepast op de Nederlandsche Statistiek. Internal
CBS Report, Statistics Netherlands, The Hague.
Westergaard, H. (1932), Contributions to the History of Statistics. P.S. King & Sons,
Ltd, London
Yates,F.( 1949), Sampling Methods for Censuses and Surveys. Charles Griffin & Co,
London.
Zanten, J.H. van (1927), Leerboek der Statistische Methode. N. Samsom, Alphen a/d
Rijn.