f and al o surface co-modi cation ni mn...
TRANSCRIPT
Understanding the Role of NH4F and Al2O3 Surface Co-modificationon Lithium-Excess Layered Oxide Li1.2Ni0.2Mn0.6O2
Haodong Liu,† Danna Qian,† Michael G. Verde,† Minghao Zhang,† Loïc Baggetto,‡ Ke An,§ Yan Chen,§
Kyler J. Carroll,† Derek Lau,† Miaofang Chi,∥ Gabriel M. Veith,‡ and Ying Shirley Meng*,†
†Department of NanoEngineering, University of California San Diego, La Jolla, California 92121-2460, United States‡Materials Science and Technology Division, §Chemical and Engineering Materials Division, and ∥Center for Nanophase MaterialsSciences, Oak Ridge National Laboratory, Oak Ridge, Tennessee 37831, United States
*S Supporting Information
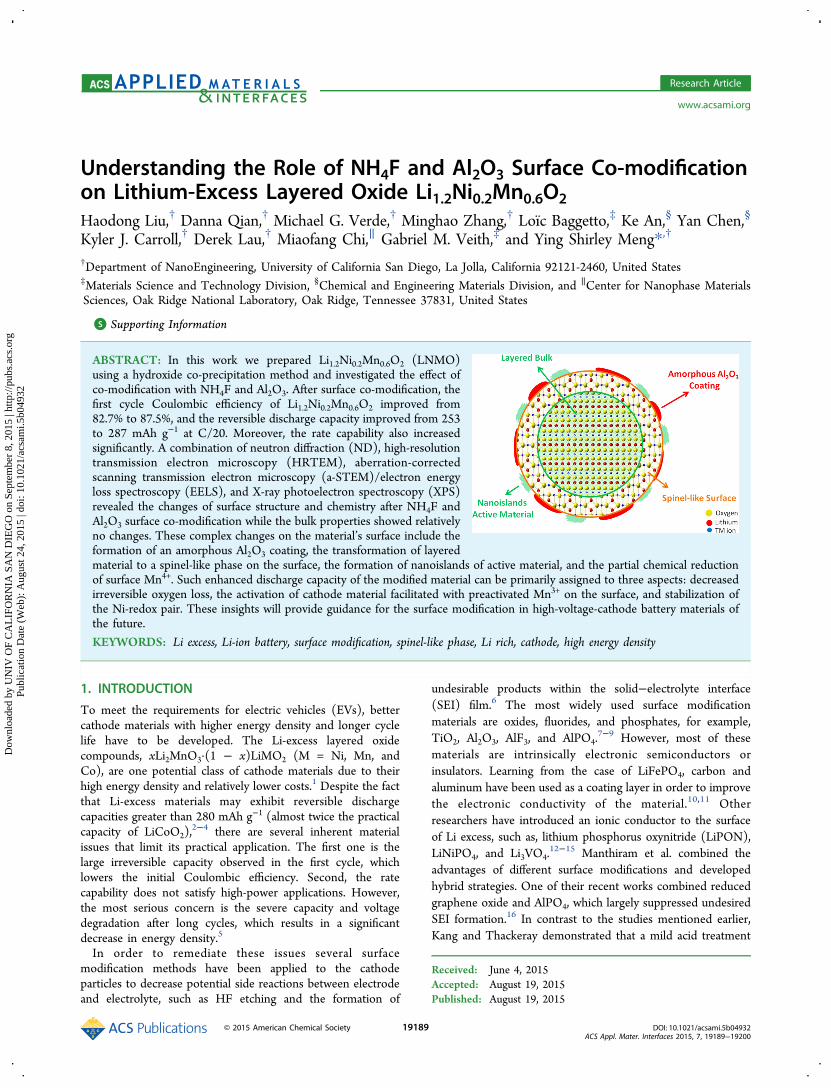
ABSTRACT: In this work we prepared Li1.2Ni0.2Mn0.6O2 (LNMO)using a hydroxide co-precipitation method and investigated the effect ofco-modification with NH4F and Al2O3. After surface co-modification, thefirst cycle Coulombic efficiency of Li1.2Ni0.2Mn0.6O2 improved from82.7% to 87.5%, and the reversible discharge capacity improved from 253to 287 mAh g−1 at C/20. Moreover, the rate capability also increasedsignificantly. A combination of neutron diffraction (ND), high-resolutiontransmission electron microscopy (HRTEM), aberration-correctedscanning transmission electron microscopy (a-STEM)/electron energyloss spectroscopy (EELS), and X-ray photoelectron spectroscopy (XPS)revealed the changes of surface structure and chemistry after NH4F andAl2O3 surface co-modification while the bulk properties showed relativelyno changes. These complex changes on the material’s surface include theformation of an amorphous Al2O3 coating, the transformation of layeredmaterial to a spinel-like phase on the surface, the formation of nanoislands of active material, and the partial chemical reductionof surface Mn4+. Such enhanced discharge capacity of the modified material can be primarily assigned to three aspects: decreasedirreversible oxygen loss, the activation of cathode material facilitated with preactivated Mn3+ on the surface, and stabilization ofthe Ni-redox pair. These insights will provide guidance for the surface modification in high-voltage-cathode battery materials ofthe future.
KEYWORDS: Li excess, Li-ion battery, surface modification, spinel-like phase, Li rich, cathode, high energy density
1. INTRODUCTION
To meet the requirements for electric vehicles (EVs), bettercathode materials with higher energy density and longer cyclelife have to be developed. The Li-excess layered oxidecompounds, xLi2MnO3·(1 − x)LiMO2 (M = Ni, Mn, andCo), are one potential class of cathode materials due to theirhigh energy density and relatively lower costs.1 Despite the factthat Li-excess materials may exhibit reversible dischargecapacities greater than 280 mAh g−1 (almost twice the practicalcapacity of LiCoO2),
2−4 there are several inherent materialissues that limit its practical application. The first one is thelarge irreversible capacity observed in the first cycle, whichlowers the initial Coulombic efficiency. Second, the ratecapability does not satisfy high-power applications. However,the most serious concern is the severe capacity and voltagedegradation after long cycles, which results in a significantdecrease in energy density.5
In order to remediate these issues several surfacemodification methods have been applied to the cathodeparticles to decrease potential side reactions between electrodeand electrolyte, such as HF etching and the formation of
undesirable products within the solid−electrolyte interface(SEI) film.6 The most widely used surface modificationmaterials are oxides, fluorides, and phosphates, for example,TiO2, Al2O3, AlF3, and AlPO4.
7−9 However, most of thesematerials are intrinsically electronic semiconductors orinsulators. Learning from the case of LiFePO4, carbon andaluminum have been used as a coating layer in order to improvethe electronic conductivity of the material.10,11 Otherresearchers have introduced an ionic conductor to the surfaceof Li excess, such as, lithium phosphorus oxynitride (LiPON),LiNiPO4, and Li3VO4.
12−15 Manthiram et al. combined theadvantages of different surface modifications and developedhybrid strategies. One of their recent works combined reducedgraphene oxide and AlPO4, which largely suppressed undesiredSEI formation.16 In contrast to the studies mentioned earlier,Kang and Thackeray demonstrated that a mild acid treatment
Received: June 4, 2015Accepted: August 19, 2015Published: August 19, 2015
Research Article
www.acsami.org
© 2015 American Chemical Society 19189 DOI: 10.1021/acsami.5b04932ACS Appl. Mater. Interfaces 2015, 7, 19189−19200
Dow
nloa
ded
by U
NIV
OF
CA
LIF
OR
NIA
SA
N D
IEG
O o
n Se
ptem
ber
8, 2
015
| http
://pu
bs.a
cs.o
rg
Pub
licat
ion
Dat
e (W
eb):
Aug
ust 2
4, 2
015
| doi
: 10.
1021
/acs
ami.5
b049
32

can also reduce the first cycle irreversible capacity of Li-excesslayered oxides.17
Although these surface modifications improved the electro-chemical performance of Li excess, the fundamental role interms of their chemical and structural effects is still not wellunderstood. In this work, we prepared Li-excess layered oxidewith composition of Li1.2Ni0.2Mn0.6O2 (LNMO) using a routinehydroxide co-precipitation method. A mild acid, NH4F, andmetal precipitant, Al3+, were used together to modify thesurface of Li excess. Our analysis focuses on a mechanistic studyaimed to determine the reasons for the electrochemicalenhancement. First, the bulk crystal structures and morphol-ogies of these materials were examined. Then, a series of surfacesensitive characterizations were carried out to investigate thechemical and structural changes after surface co-modification.The combination of electrochemical analyses and physicalcharacterization enabled us to explain how the NH4F and Al2O3surface co-modification improved the initial Coulombicefficiency, rate capability, and changed cycling stability of Liexcess. These findings help us understand the workingmechanisms of surface modifications which will shed light ondesigning reasonable surface modifications for high-voltage-cathode materials in the future.
2. EXPERIMENTAL METHODS2.1. Synthesis and Surface Modification. A co-precipitation
reaction, followed by two-step calcination was used for the synthesis ofthe Li-excess layered oxides.18,19 Transition metal (TM) nitrates,Ni(NO3)2·6H2O (ACROS Organics, 99%), and Mn(NO3)2·4H2O(Alfa Aesar, 98%), were dissolved into deionized water and thentitrated into LiOH·H2O (Fisher) solution. The precipitated TMhydroxides were then subjected to vacuum filtration and washed threetimes with deionized water. The collected TM hydroxides were driedin an oven at 180 °C for 10 h in air. The dried TM precursors werethen mixed with a stoichiometric amount of LiOH·H2O (Fisher). Thismixture was ground for 30 min to ensure adequate mixing and thenplaced into a furnace at 480 °C for 12 h. Later, the precalcinedpowders were calcinated at 900 °C for 12 h in air, to achieve the finalproduct.The procedure for preparing NH4F and Al2O3 surface co-modified
Li excess (NALNMO) was adapted from work by Zheng et al.7 Thespecific amounts of NH4F and Al3+ in this work were 3 and 1 mol % ofthe Li1.2Ni0.2Mn0.6O2 powders, respectively. To prepare NH4F andAl2O3 surface co-modified Li1.2Ni0.2Mn0.6O2 powders, NH4F (Aldrich,99.99%) and Al(NO3)3·9H2O (Aldrich, 99.997%) were separatelydissolved in deionized water. First, the Li1.2Ni0.2Mn0.6O2 powders weredispersed into the aluminum nitrate solution by continuous magneticstirring at the controlled temperature of 80 °C. Then, the NH4
+
solution was slowly dropped into the solution, followed by a slowevaporation of solvent. The obtained precursor was heated at 400 °Cin a tube furnace for 5 h under the flow of nitrogen gas.2.2. Neutron Diffraction. The time-of-fight (TOF) powder
neutron diffraction data were collected at the VULCAN instrumentat Spallation Neutron Sources (SNS), Oak Ridge National Laboratory(ORNL).20 Around 0.6 g of powder was filled into a vanadium samplecan. An incident beam (5 mm × 12 mm) of 0.7−3.5 Å bandwidth,allowing 0.5−2.5 Å d-space in the diffracted pattern of the ±90° 2θdetector banks, was selected using the double-disk choppers at 30 Hzfrequency. High-resolution mode was employed with Δd/d ∼ 0.25%.The SNS was at nominal, 1100 KW, power.20 Powder neutrondiffraction data were collected in high-resolution mode for a durationof 3 h and processed using VDRIVE software.21 Full pattern Rietveldrefinement was performed to extract the structure parameters usingGSAS software with EXPGUI interface.22,23
2.3. Scanning Electron Microscopy. The particle morphologyand size distribution of the synthesized powders were determinedusing an FEI XL30 ultrahigh-resolution scanning electron microscope
(UHR SEM) system with a Sirion column, which enables very highresolution imaging at low acceleration voltage. All images werecollected under an accelerating voltage of 15 kV. The powders weresuspended on double-sided carbon tape, placed on a specimen holder.
2.4. High-Resolution Transmission Electron Microscopy.HRTEM images were collected using an FEI Tecnai G2 Polaracryoelectron microscope with a field emission gun and a voltage of 300kV. The powders were suspended on a 300-mesh copper grid withlacey carbon.
2.5. Electrochemical Test. Electrochemical properties weremeasured using an Arbin battery cycler in galvanostatic mode between4.8 and 2.0 V. Cathodes were prepared by mixing the active material,LNMO or NALNMO, with 10 wt % Super P carbon (TIMCAL) and10 wt % poly(vinylidene fluoride) (PVDF) in N-methylpyrrolidone(NMP, 99% extra pure, ACROS Organics). The slurry was cast ontoan Al foil using a doctor blade and dried in a vacuum oven overnight at80 °C. The electrode discs were punched and dried again at 80 °C for6 h before storing them in an argon-filled glovebox (O2, H2O level < 1ppm). 2016-type coin cells were used to electrochemically cycleLNMO and NALNMO to different cycles. The coin cells wereprepared in the same argon-filled glovebox using lithium metal ribbonas anode and 1 M LiPF6 in ethylene carbonate/dimethyl carbonate(EC:DMC in 1:1 volume ratio) electrolyte solution (Novolyte).Celgard polymer film (C480, Celgard Inc., Charlotte, NC, USA) wereused as the separator. The loading of active material was around 3.7mg cm−1 for both LNMO and NLNMO. Multiple cells wereelectrochemically tested to confirm reproducibility.
The cycled samples were recovered by disassembling cycledbatteries in an argon-filled glovebox. The cathode was washed withDMC three times and then allowed to dry in argon atmosphereovernight. The cathodes were transferred to the XPS chamber using anairtight vacuum transfer system. For TEM samples, the powders weresuspended on a copper grid with lacey carbon. The approximate timeof sample exposed to air (from a sealed environment to themicroscope column) was less than 5 s.
2.6. X-ray Photoelectron Spectroscopy. Surface chemistry wasprobed using a PHI 3056 X-ray photoelectron spectrometer equippedwith a dual Al Kα (1486.7 eV) and Mg Kα (1256.6 eV) anode source,operated at 350 W, and with sample chamber pressure below 10−8
Torr. Samples were dissembled in an argon-filled glovebox, rinsed witha small quantity of anhydrous DMC (Sigma-Aldrich), and transferredto the XPS chamber using an airtight vacuum transfer system. High-resolution scans were acquired using a pass energy of 23.5 eV and anenergy step of 0.05 or 0.075 eV. Survey scans were measured using apass energy of 93.5 eV and a 0.5 eV energy step. The binding energieswere calibrated by setting the hydrocarbon C 1s (C−C, C−H) signalto 284.6 eV, which corresponds mainly to the carbon black in thecomposite electrode and adventitious carbon. C signal was measuredbefore and after any other signal to precisely calibrate the energy scale.The data were analyzed using CasaXPS software, and all peaks were fitusing a Shirley-type background.
2.7. a-STEM/EELS. Electron microscopy work was carried out on aCs-corrected FEI Titan 80/300 kV TEM/STEM microscope,equipped with a Gatan Image Filter Quantum-865. All STEM imagesand EELS spectra were acquired at 300 kV and with a beam size of∼0.7 Å. EELS spectra shown in this work were acquired from a squarearea of ∼0.5 × 0.5 nm2 using an acquisition time of 2 s and a collectionangle of 35 mrad. High-angle annular dark field (HAADF) imageswere obtained at a convergence angle of 30 mrad and a large innercollection angle of 65 mrad. Images acquired by an HAADF detectorwith a small convergence angle and a relatively large inner collectionangle are also called “Z-contrast” images, where the contrast isproportional to Z1.7.24,25
To minimize possible electron beam irradiation effects, EELS andHAADF figures presented in this work were acquired from areaswithout prebeam irradiation. Mn L3 to L2 intensity ratio analysis wasperformed using the method described by Wang et al.26
ACS Applied Materials & Interfaces Research Article
DOI: 10.1021/acsami.5b04932ACS Appl. Mater. Interfaces 2015, 7, 19189−19200
19190
Dow
nloa
ded
by U
NIV
OF
CA
LIF
OR
NIA
SA
N D
IEG
O o
n Se
ptem
ber
8, 2
015
| http
://pu
bs.a
cs.o
rg
Pub
licat
ion
Dat
e (W
eb):
Aug
ust 2
4, 2
015
| doi
: 10.
1021
/acs
ami.5
b049
32

3. RESULTS3.1. Bulk Crystal Structure and Morphology Charac-
terization. Figure 1 represents the SEM images of the LNMO
and NALNMO. Both materials show secondary particles with awide size distribution, ranging from 1 to 10 μm; the primaryparticle size distribution ranges from 80 to 150 nm. The SEMimages show no morphology or particle size difference betweenLNMO and NALNMO. The presence of Al was confirmedusing EDS, which is shown in Supporting Information (SI)Figure S1.Due to the low scattering cross-section of lithium in X-ray
scattering, neutron diffraction was carried out on both LNMOand NALNMO powders in order to carefully investigate theircrystal structures.27 Figure 2 shows the neutron diffraction andRietveld refinement of both samples. The major diffractionpeaks of these two materials are indexed according to theparent hexagonal structure with R3̅m space group. The patternsindicate that both samples adopt a well-layered structure withlittle Li/Ni mixing, as evidenced by the existence of doublets at(006)/(012) and (018)/(110).28,29 No obvious changes wereobserved in these peaks after NH4F and Al2O3 surface co-modification, indicating that the layered phase is well-maintained. In addition, there are no extra peaks observed inNALNMO.Table 1 lists the summary of Rietveld refinement results. The
lattice parameters of LNMO are a = 2.8615(1) Å and c =14.2580(6) Å, which are in good agreement with our previousXRD studies.30 The refined oxygen position of the pristinematerial is (0, 0, 0.2417(7)), and there is 3.7(4)% Ni in the Lilayer. As a comparison, the lattice parameters of NALNMOsurface co-modified material are a = 2.8623(1) Å and c =14.2621(6) Å, which are only slightly larger (<0.03%) thanthose of the LNMO. The oxygen position after NH4F andAl2O3 surface co-modification is unchanged at (0, 0,0.2416(7)), and there is slightly more Ni2+ in the Li layer,which is 3.9(4)%. In summary, the neutron diffraction studyshows that the surface co-modification by NH4F and Al2O3does not change the bulk structure of Li1.2Ni0.2Mn0.6O2; thelayered O3 structure is well-maintained after the surfacemodification. The process introduces only slight changes inthe material’s lattice parameters and Li/Ni interlayer mixing.
3.2. Electrochemical Performance. Figure 3a comparesthe first charge/discharge voltage profiles of LNMO andNALNMO within the voltage window of 2−4.8 V, at 12.5 mAg−1 (C/20). The surface modified sample shows the samecharacteristic profile, with a sloping region (to 4.4 V)corresponding to the oxidation of nickel from Ni2+ to Ni4+,followed by the oxidation of oxygen from the lattice during thevoltage plateau region.3,30−32 Even without deducting theweight of nonactive Al2O3 in NALNMO, the surface modifiedmaterial still shows higher charge and discharge specificcapacity than the pristine material. After NH4F and Al2O3surface co-modification, charge and discharge capacities areincreased from 306 ± 6 to 328 ± 4 mAh g−1 and from 253 ± 2to 287 ± 6 mAh g−1, respectively, as well as Coulombicefficiency from 82.7% to 87.5%. More importantly, theirreversible capacity was reduced from 53 ± 8 (∼17%) to 41± 10 mAh g−1 (∼12%). It is interesting and surprising that theNALNMO electrodes shows a longer plateau region, which isrelated to either oxygen loss and/or the oxidation of latticeoxygen,31,32 while the observed irreversible capacity decreases.Parts b and c of Figure 3 represent the discharge profiles of
both materials subject to different rates, from 12.5 (C/20) to500 mA g−1 (2C); the charge current remained 12.5 mA g−1 in
Figure 1. SEM images: (a and b) LNMO; (c and d) NALNMO.
Figure 2. ND patterns of (a) LNMO and (b) NALNMO. The blackcrosses represent the observed pattern, the red line corresponds to thecalculated diffraction pattern, and the blue line shows the differencesbetween observed and calculated patterns.
ACS Applied Materials & Interfaces Research Article
DOI: 10.1021/acsami.5b04932ACS Appl. Mater. Interfaces 2015, 7, 19189−19200
19191
Dow
nloa
ded
by U
NIV
OF
CA
LIF
OR
NIA
SA
N D
IEG
O o
n Se
ptem
ber
8, 2
015
| http
://pu
bs.a
cs.o
rg
Pub
licat
ion
Dat
e (W
eb):
Aug
ust 2
4, 2
015
| doi
: 10.
1021
/acs
ami.5
b049
32

all cases. The NALNMO electrode delivered higher dischargecapacity than LNMO at all testing rates. Even at 500 mA g−1
current density, the surface modified material still shows adischarge capacity as high as 181 mAh g−1.The long-term cycling performance of both materials were
compared by charging and discharging each at a current densityof 25 mA g−1 (C/10), which is represented in Figure 4. TheNALNMO electrode exhibits higher discharge capacity in earlycycles but becomes similar to the pristine material after 80cycles. The capacity difference between the two materials after80 cycles is only 8 mAh g−1, which is much smaller than the 44mAh g−1 of the first cycle. The voltage decay upon cyclingexists in both materials but is slightly better in NALNMO,which is described in more detail later.
The discharge voltage profiles and corresponding dQ/dVplots of both materials upon cycling are shown in Figure 5. Bycomparing their dQ/dV, we can better understand how thecapacity and voltage decay occur in each material. From thoseplots, we can clearly see three peaks during discharge. The firstpeak is above 4.0 V, the second peak sits between 3.5 and 4.0 V,and the third peak is below 3.5 V. The first and second peaksare a result of Ni4+ to Ni2+, and possible oxygen reduction.32−35
The third peak, on the other hand, is considered to be acombination of Mn4+ to Mn3+ and oxygen reduction as a resultof Li insertion back into the bulk structure, as several authorshave previously reported.1,3,33,36 By comparing Figure 5b,d, wecan see that the third peak area of pristine material is muchsmaller than that of the modified material. The changes that
Table 1. Rietveld Refinement Results of Neutron Diffraction Data for LNMO and NALNMO Powders
a (Å) c (Å) Li/Ni mixing oxygen coordinates Rp (%) Rwp (%)
LNMO 2.8615(1) 14.2580(6) 0.037(4) 0, 0, 0.2417(7) 4.29 5.77NALNMO 2.8623(1) 14.2621(6) 0.040(4) 0, 0, 0.2416(7) 3.81 5.22
Figure 3. Comparison of electrochemical performances between LNMO and NALNMO: (a) first cycle charge/discharge voltage profile, (b) voltageprofile of LNMO under different current density, and (c) voltage profile of NALNMO under different current density. The voltage range is 2.0−4.8V at 1 C = 250 mA g−1.
ACS Applied Materials & Interfaces Research Article
DOI: 10.1021/acsami.5b04932ACS Appl. Mater. Interfaces 2015, 7, 19189−19200
19192
Dow
nloa
ded
by U
NIV
OF
CA
LIF
OR
NIA
SA
N D
IEG
O o
n Se
ptem
ber
8, 2
015
| http
://pu
bs.a
cs.o
rg
Pub
licat
ion
Dat
e (W
eb):
Aug
ust 2
4, 2
015
| doi
: 10.
1021
/acs
ami.5
b049
32

occur in that peak over 80 cycles are quite distinct for eachmaterial as well. Whereas the third peak area of LNMO exhibitsa continuous increase during cycling, the NALNMO peak areaonly increases during the initial 10 cycles. In contrast to thepristine material, the third peak area of modified materialcontinues to decrease after 10 cycles. Another major differenceis that the second peak of NALNMO remains relatively stablethroughout cycling. Though it decreases in magnitude, itsposition remains constant. The second peak of LNMO not onlydecreases in area but also shifts to lower voltage and loses itsprominence. The voltage fade in this region is demonstrated inFigure 4b as well. The first peak area of LNMO continuouslydecreases during cycling and shifts toward lower voltage. On
the other hand, the peak area of NALNMO increases duringthe first 10 cycles, then decreases thereafter. Its peak positiondecreases, but not by as much as LNMO, as it remains muchmore narrow. The NH4F and Al2O3 surface co-modificationstabilized the first and second peak regions; a detailedunderstanding of these phenomena will be discussed later.
3.3. Surface Structure and Chemical Species Charac-terization. Neutron diffraction and SEM analysis demon-strated that the crystal structure and particle morphology ofboth materials were quite similar; however, they exhibited largedifferences in electrochemical performance. Advanced techni-ques, such as HRTEM, a-STEM/EELS, and XPS, were carried
Figure 4. Comparison of (a) capacity and (b) discharge voltage, between LNMO and NALNMO, after 80 cycles. The voltage range is 2.0−4.8 V atC/10 = 25 mA g−1.
Figure 5. Discharge and corresponding dQ/dV profiles of (a and b) LNMO and (c and d) NALNMO, over the course of 80 cycles.
ACS Applied Materials & Interfaces Research Article
DOI: 10.1021/acsami.5b04932ACS Appl. Mater. Interfaces 2015, 7, 19189−19200
19193
Dow
nloa
ded
by U
NIV
OF
CA
LIF
OR
NIA
SA
N D
IEG
O o
n Se
ptem
ber
8, 2
015
| http
://pu
bs.a
cs.o
rg
Pub
licat
ion
Dat
e (W
eb):
Aug
ust 2
4, 2
015
| doi
: 10.
1021
/acs
ami.5
b049
32

out to investigate the surface structure and chemistry of bothmaterials in more detail.High-resolution transmission electron microscopy was used
to identify the Al2O3 coating on surface modified material. Partsa and b of Figure 6 present HRTEM images of LNMO and
NALNMO, respectively. The TEM images of both materialsshow very good layered crystal structure. Amorphous films areobserved on the surface of NALNMO, while the LNMO showsa very clean surface. More than 20 particles were analyzed toexamine the amorphous film. As shown in Figure 6b, thisamorphous film is unevenly coated on the surface, withthickness ranging from 0 to 2.5 nm. As our recent studyindicates, the surface chemistry of LNMO varies with different
preparation methods.37 We also applied the same NH4F andAl2O3 surface co-modification on LNMO prepared using acarbonate synthesis method,37 and interestingly the formedAl2O3 coating exhibited a uniform coating of 1 nm thickness, asshown in SI Figure S2. This shows that surface modificationsand treatments have a degree of dependency of the specificsynthesis route for even the same materials. It would be of greatinterest to explore this dependence further. In addition to theamorphous coating, there are isolated nanoislands sitting on thesurface of particles, as illustrated in Figure 6c, which are notobserved in our pristine Li1.2Ni0.2Mn0.6O2. Figure 6d depicts theTEM image of these nanoislands at higher magnification. Theyexhibit a well-layered crystal structure with particle size around20 nm. EELS was performed on the isolated nanoislands toverify that they were the active material instead of Al-relatedcompounds, as shown in SI Figure S3.Figure 7 depicts the differences between the bulk and surface
structure of NALNMO. Multiple grains were selected for study,and the results were consistent; therefore, only representativedata are shown here. Shown in Figure 7a the atomistic surfacestructure of the NALNMO, however, is distinct from the bulkregion, with extra bright spots in the lithium layer. In order tobetter visualize the difference, fast Fourier transform (FFT) wascarried out from both bulk (red square) and surface (bluesquare) as illustrated. The extra spots in FFT images from thesurface (Figure 7c) indicate a spinel-like structure compared tothe pure layered structure of the bulk (Figure 7b). The atomicmodel insets in Figure 7d,e better illustrate the contrastdifferences. The spinel-like phase on the surface is around 3 nmthickness after the co-modification.In addition to direct visualization of the crystal structure
changes, EELS was carried out to obtain chemical information.Two representative NALNMO particles were observed andstudied. One consists of the C2/m phase, measured along the(101 ̅) zone axis; this electron diffraction pattern is representedby the inset of Figure 8a. The other is R3̅m phase measuredalong the (010) zone axis, which is presented in Figure 8d.EELS was performed on NALNMO from bulk to surface, usinga step size of ∼1 nm; the region of analysis is represented bythe red rectangles in Figure 8a,d. The L3- and L2-edges of
Figure 6. TEM and STEM photographs of LNMO and NALNMO:(a) TEM of LNMO, (b and c) TEM of NALNMO, and (d) STEM ofNALNMO.
Figure 7. High-resolution STEM images of NALNMO: (a) NALNMO, (d) bulk region, and (e) surface region. Fast Fourier transform (FFT): (b)bulk region and (d) surface region. (The inset crystal structures in d and e: green, Li; red, O; purple, transition metal).
ACS Applied Materials & Interfaces Research Article
DOI: 10.1021/acsami.5b04932ACS Appl. Mater. Interfaces 2015, 7, 19189−19200
19194
Dow
nloa
ded
by U
NIV
OF
CA
LIF
OR
NIA
SA
N D
IEG
O o
n Se
ptem
ber
8, 2
015
| http
://pu
bs.a
cs.o
rg
Pub
licat
ion
Dat
e (W
eb):
Aug
ust 2
4, 2
015
| doi
: 10.
1021
/acs
ami.5
b049
32
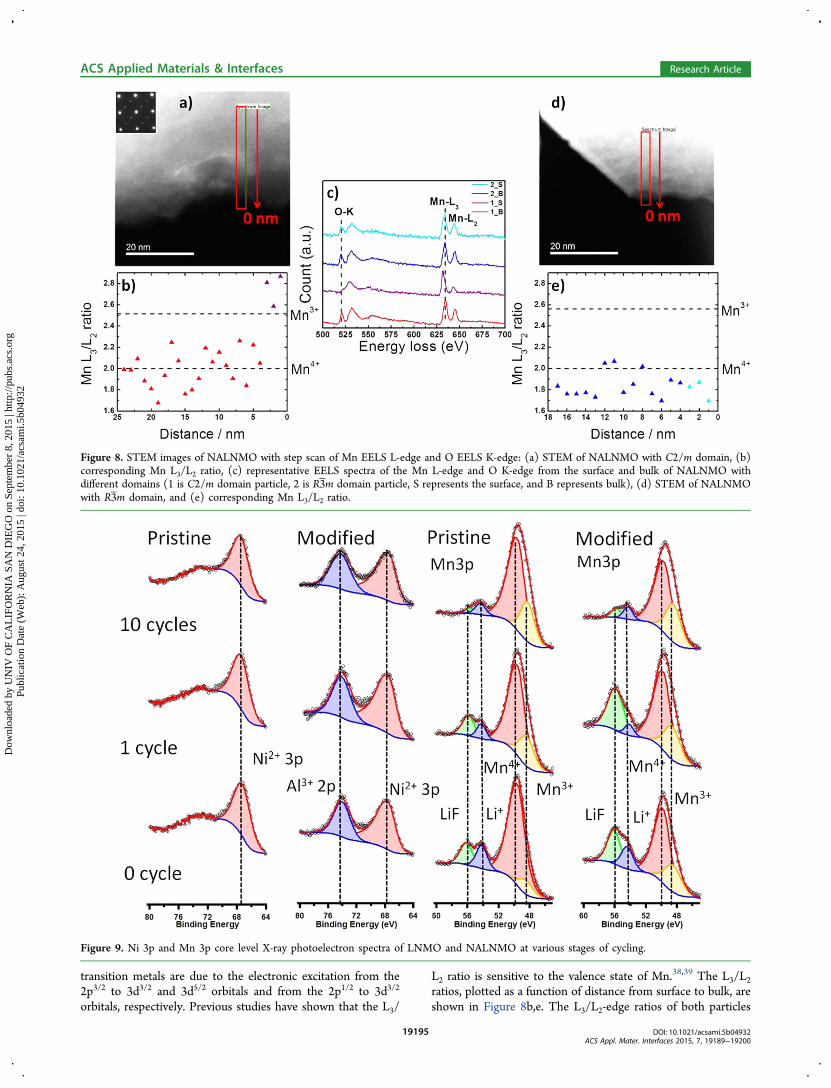
transition metals are due to the electronic excitation from the2p3/2 to 3d3/2 and 3d5/2 orbitals and from the 2p1/2 to 3d3/2
orbitals, respectively. Previous studies have shown that the L3/
L2 ratio is sensitive to the valence state of Mn.38,39 The L3/L2ratios, plotted as a function of distance from surface to bulk, areshown in Figure 8b,e. The L3/L2-edge ratios of both particles
Figure 8. STEM images of NALNMO with step scan of Mn EELS L-edge and O EELS K-edge: (a) STEM of NALNMO with C2/m domain, (b)corresponding Mn L3/L2 ratio, (c) representative EELS spectra of the Mn L-edge and O K-edge from the surface and bulk of NALNMO withdifferent domains (1 is C2/m domain particle, 2 is R3̅m domain particle, S represents the surface, and B represents bulk), (d) STEM of NALNMOwith R3̅m domain, and (e) corresponding Mn L3/L2 ratio.
Figure 9. Ni 3p and Mn 3p core level X-ray photoelectron spectra of LNMO and NALNMO at various stages of cycling.
ACS Applied Materials & Interfaces Research Article
DOI: 10.1021/acsami.5b04932ACS Appl. Mater. Interfaces 2015, 7, 19189−19200
19195
Dow
nloa
ded
by U
NIV
OF
CA
LIF
OR
NIA
SA
N D
IEG
O o
n Se
ptem
ber
8, 2
015
| http
://pu
bs.a
cs.o
rg
Pub
licat
ion
Dat
e (W
eb):
Aug
ust 2
4, 2
015
| doi
: 10.
1021
/acs
ami.5
b049
32
reveal that the Mn oxidation state remains 4+ in the bulk, as itdoes in pristine LNMO.30 However, the C2/m domain particle(Figure 8a) shows Mn oxidation state reduced to 3+ within a 3nm region of the surface. The corresponding O K-edge of thebulk and surface are plotted in red and purple, respectively. Theprepeak in the O K-edge is due to the transition of 1s electronsto the unoccupied 2p orbitals, which hybridize with the TM 3dorbitals. The decrease in the prepeak intensity of the C2/mdomain particle agrees with the evidence that Mn at the surfaceis reduced.32 The EELS study shows that the surface Mn in theC2/m region is getting preactivated.While STEM-EELS were used to examine small local regions,
XPS was performed on soaked and cycled samples in order toinvestigate the overall chemical changes on the surface uponcycling. Figure 9 shows Ni 3p and Mn 3p XPS spectra of bothLNMO and NALNMO after soaking in electrolyte, after onecycle, and after 10 cycles. The Mn 3p peak is composed of twocomponents, with the main signal ∼49.7 eV assigned to Mn4+
and a weaker signal at lower binding energy ∼48.5 eV related toMn3+.40 The relative percents of these components are given inTable 2. These results illustrate that soaking electrodes in the
electrolyte will induce the formation of Mn3+, even withoutcharge/discharge. Before cycling, NALNMO shows almostthree times more Mn3+ at the surface than LNMO. The degreeof Mn3+ is shown to continuously increase upon cycling forboth materials. At any given cycle, however, the degree of Mn3+
is consistently greater for modified material, compared to thepristine. SI Figure S4 shows each material’s Mn 3s regions. Thedifference in binding energy between those peaks (ΔE, SI TableS1) has been used to approximate the average Mn oxidationstate (AOS) by the equation, AOS = 8.956 − 1.126ΔE.41 SIFigure S4 shows that the peak separation of NALNMO powderis larger than LNMO powder. The calculated approximateaverage Mn oxidation states for LNMO powder is 4+, whilethat of NALNMO is Mn3.74+. After 10 cycles, the splittingincreases for both LNMO and NALNMO, corresponding tothe approximate average oxidation states of Mn3.36+ andMn3.17+, respectively. The XPS of the Mn 3s region agreeswell with that of the Mn 3p region; both indicate a loweraverage oxidation state of Mn at the surface of NALNMO.The Li 1s peaks are detected above the Mn 3p region around
55 eV. The green peaks at 56 eV correspond to LiF, and theblue peaks at 54.3 eV correspond to Li−O in the lattice.42 Bycomparing both soaked electrodes, NALNMO exhibits moreLiF on the surface than pristine LNMO.All of the Ni 3p peaks sit at a binding energy of 67.5 eV,
indicating that the oxidation states of surface Ni ions are 2+.43
This result is expected because the valence of Ni in thedischarged states should be reduced from Ni4+ to Ni2+. TheNALNMO shows an extra peak at 74 eV, which is assigned toAl 2p. The position of this peak suggests that the coating is Al3+
in Al2O3, as demonstrated by Baggetto et al.40 Because the peak
does not shift in binding energy through 10 cycles, theamorphous Al2O3 coating likely remains chemically unalteredon the sample to this point.
4. DISCUSSION
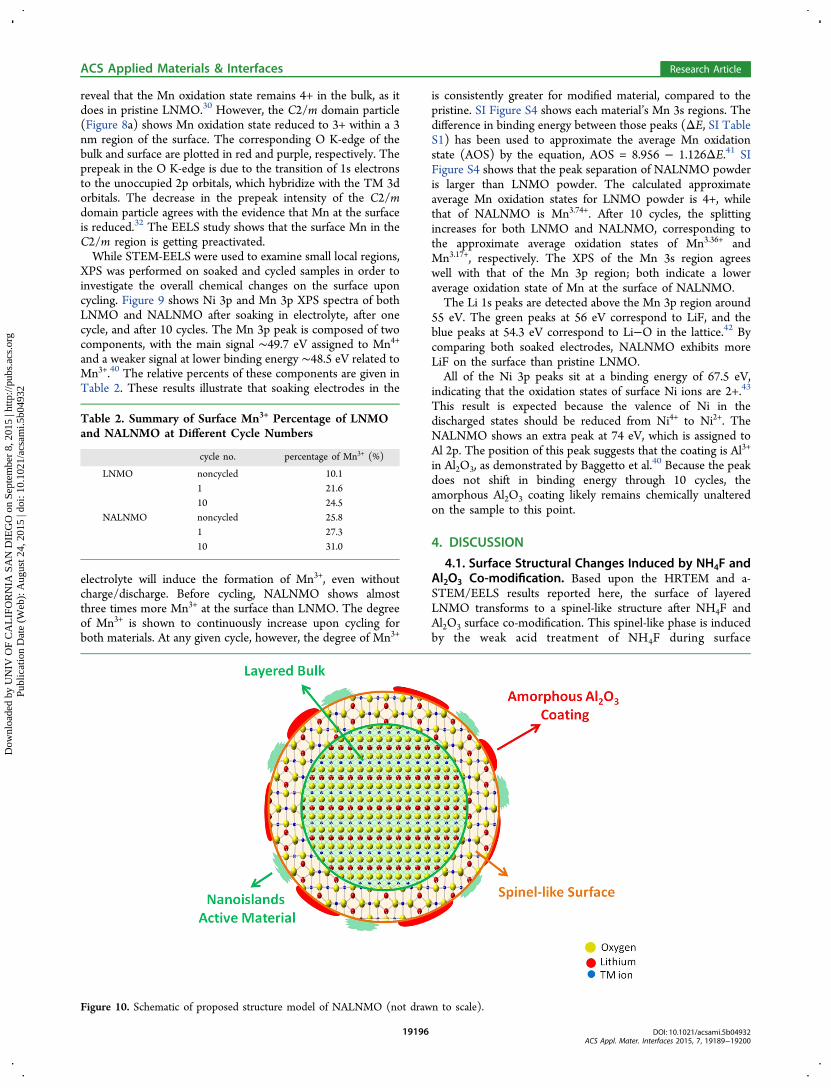
4.1. Surface Structural Changes Induced by NH4F andAl2O3 Co-modification. Based upon the HRTEM and a-STEM/EELS results reported here, the surface of layeredLNMO transforms to a spinel-like structure after NH4F andAl2O3 surface co-modification. This spinel-like phase is inducedby the weak acid treatment of NH4F during surface
Table 2. Summary of Surface Mn3+ Percentage of LNMOand NALNMO at Different Cycle Numbers
cycle no. percentage of Mn3+ (%)
LNMO noncycled 10.11 21.610 24.5
NALNMO noncycled 25.81 27.310 31.0
Figure 10. Schematic of proposed structure model of NALNMO (not drawn to scale).
ACS Applied Materials & Interfaces Research Article
DOI: 10.1021/acsami.5b04932ACS Appl. Mater. Interfaces 2015, 7, 19189−19200
19196
Dow
nloa
ded
by U
NIV
OF
CA
LIF
OR
NIA
SA
N D
IEG
O o
n Se
ptem
ber
8, 2
015
| http
://pu
bs.a
cs.o
rg
Pub
licat
ion
Dat
e (W
eb):
Aug
ust 2
4, 2
015
| doi
: 10.
1021
/acs
ami.5
b049
32
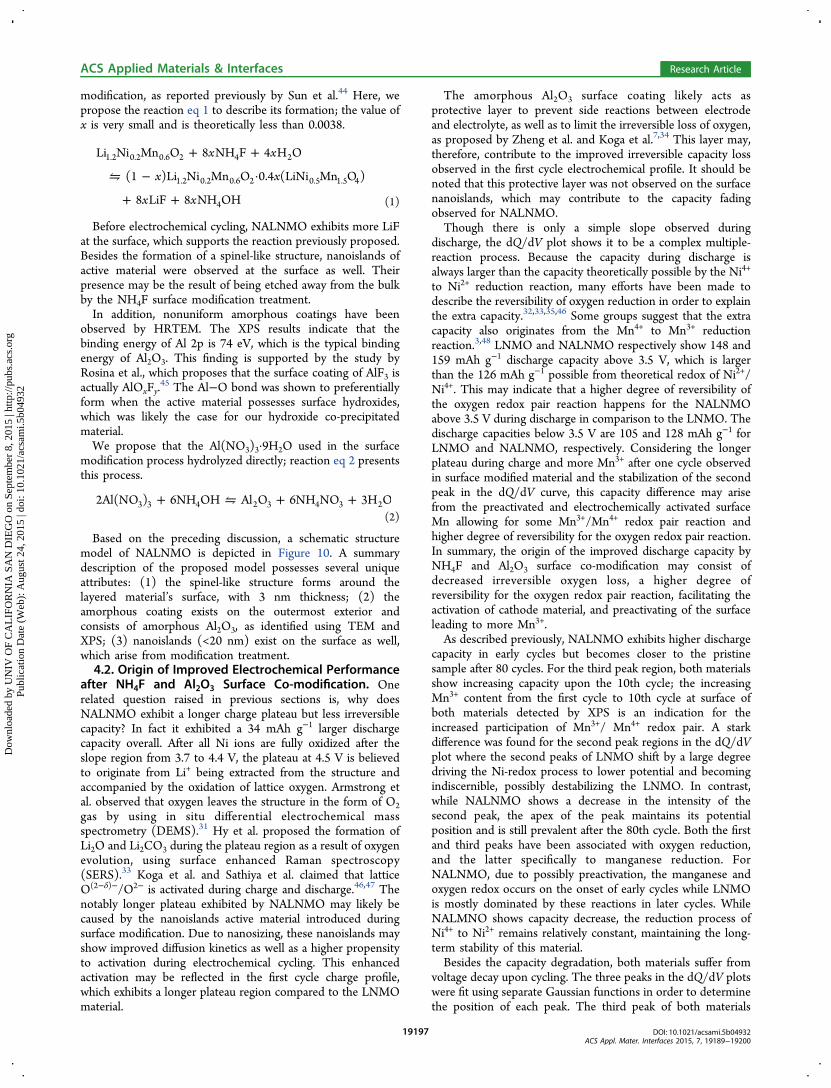
modification, as reported previously by Sun et al.44 Here, wepropose the reaction eq 1 to describe its formation; the value ofx is very small and is theoretically less than 0.0038.
+ +
⇋ − ·
+ +
x x
x x
x x
Li Ni Mn O 8 NH F 4 H O
(1 )Li Ni Mn O 0.4 (LiNi Mn O )
8 LiF 8 NH OH
1.2 0.2 0.6 2 4 2
1.2 0.2 0.6 2 0.5 1.5 4
4 (1)
Before electrochemical cycling, NALNMO exhibits more LiFat the surface, which supports the reaction previously proposed.Besides the formation of a spinel-like structure, nanoislands ofactive material were observed at the surface as well. Theirpresence may be the result of being etched away from the bulkby the NH4F surface modification treatment.In addition, nonuniform amorphous coatings have been
observed by HRTEM. The XPS results indicate that thebinding energy of Al 2p is 74 eV, which is the typical bindingenergy of Al2O3. This finding is supported by the study byRosina et al., which proposes that the surface coating of AlF3 isactually AlOxFy.
45 The Al−O bond was shown to preferentiallyform when the active material possesses surface hydroxides,which was likely the case for our hydroxide co-precipitatedmaterial.We propose that the Al(NO3)3·9H2O used in the surface
modification process hydrolyzed directly; reaction eq 2 presentsthis process.
+ ⇋ + +2Al(NO ) 6NH OH Al O 6NH NO 3H O3 3 4 2 3 4 3 2(2)
Based on the preceding discussion, a schematic structuremodel of NALNMO is depicted in Figure 10. A summarydescription of the proposed model possesses several uniqueattributes: (1) the spinel-like structure forms around thelayered material’s surface, with 3 nm thickness; (2) theamorphous coating exists on the outermost exterior andconsists of amorphous Al2O3, as identified using TEM andXPS; (3) nanoislands (<20 nm) exist on the surface as well,which arise from modification treatment.4.2. Origin of Improved Electrochemical Performance
after NH4F and Al2O3 Surface Co-modification. Onerelated question raised in previous sections is, why doesNALNMO exhibit a longer charge plateau but less irreversiblecapacity? In fact it exhibited a 34 mAh g−1 larger dischargecapacity overall. After all Ni ions are fully oxidized after theslope region from 3.7 to 4.4 V, the plateau at 4.5 V is believedto originate from Li+ being extracted from the structure andaccompanied by the oxidation of lattice oxygen. Armstrong etal. observed that oxygen leaves the structure in the form of O2gas by using in situ differential electrochemical massspectrometry (DEMS).31 Hy et al. proposed the formation ofLi2O and Li2CO3 during the plateau region as a result of oxygenevolution, using surface enhanced Raman spectroscopy(SERS).33 Koga et al. and Sathiya et al. claimed that latticeO(2−δ)−/O2− is activated during charge and discharge.46,47 Thenotably longer plateau exhibited by NALNMO may likely becaused by the nanoislands active material introduced duringsurface modification. Due to nanosizing, these nanoislands mayshow improved diffusion kinetics as well as a higher propensityto activation during electrochemical cycling. This enhancedactivation may be reflected in the first cycle charge profile,which exhibits a longer plateau region compared to the LNMOmaterial.
The amorphous Al2O3 surface coating likely acts asprotective layer to prevent side reactions between electrodeand electrolyte, as well as to limit the irreversible loss of oxygen,as proposed by Zheng et al. and Koga et al.7,34 This layer may,therefore, contribute to the improved irreversible capacity lossobserved in the first cycle electrochemical profile. It should benoted that this protective layer was not observed on the surfacenanoislands, which may contribute to the capacity fadingobserved for NALNMO.Though there is only a simple slope observed during
discharge, the dQ/dV plot shows it to be a complex multiple-reaction process. Because the capacity during discharge isalways larger than the capacity theoretically possible by the Ni4+
to Ni2+ reduction reaction, many efforts have been made todescribe the reversibility of oxygen reduction in order to explainthe extra capacity.32,33,35,46 Some groups suggest that the extracapacity also originates from the Mn4+ to Mn3+ reductionreaction.3,48 LNMO and NALNMO respectively show 148 and159 mAh g−1 discharge capacity above 3.5 V, which is largerthan the 126 mAh g−1 possible from theoretical redox of Ni2+/Ni4+. This may indicate that a higher degree of reversibility ofthe oxygen redox pair reaction happens for the NALNMOabove 3.5 V during discharge in comparison to the LNMO. Thedischarge capacities below 3.5 V are 105 and 128 mAh g−1 forLNMO and NALNMO, respectively. Considering the longerplateau during charge and more Mn3+ after one cycle observedin surface modified material and the stabilization of the secondpeak in the dQ/dV curve, this capacity difference may arisefrom the preactivated and electrochemically activated surfaceMn allowing for some Mn3+/Mn4+ redox pair reaction andhigher degree of reversibility for the oxygen redox pair reaction.In summary, the origin of the improved discharge capacity byNH4F and Al2O3 surface co-modification may consist ofdecreased irreversible oxygen loss, a higher degree ofreversibility for the oxygen redox pair reaction, facilitating theactivation of cathode material, and preactivating of the surfaceleading to more Mn3+.As described previously, NALNMO exhibits higher discharge
capacity in early cycles but becomes closer to the pristinesample after 80 cycles. For the third peak region, both materialsshow increasing capacity upon the 10th cycle; the increasingMn3+ content from the first cycle to 10th cycle at surface ofboth materials detected by XPS is an indication for theincreased participation of Mn3+/ Mn4+ redox pair. A starkdifference was found for the second peak regions in the dQ/dVplot where the second peaks of LNMO shift by a large degreedriving the Ni-redox process to lower potential and becomingindiscernible, possibly destabilizing the LNMO. In contrast,while NALNMO shows a decrease in the intensity of thesecond peak, the apex of the peak maintains its potentialposition and is still prevalent after the 80th cycle. Both the firstand third peaks have been associated with oxygen reduction,and the latter specifically to manganese reduction. ForNALNMO, due to possibly preactivation, the manganese andoxygen redox occurs on the onset of early cycles while LNMOis mostly dominated by these reactions in later cycles. WhileNALMNO shows capacity decrease, the reduction process ofNi4+ to Ni2+ remains relatively constant, maintaining the long-term stability of this material.Besides the capacity degradation, both materials suffer from
voltage decay upon cycling. The three peaks in the dQ/dV plotswere fit using separate Gaussian functions in order to determinethe position of each peak. The third peak of both materials
ACS Applied Materials & Interfaces Research Article
DOI: 10.1021/acsami.5b04932ACS Appl. Mater. Interfaces 2015, 7, 19189−19200
19197
Dow
nloa
ded
by U
NIV
OF
CA
LIF
OR
NIA
SA
N D
IEG
O o
n Se
ptem
ber
8, 2
015
| http
://pu
bs.a
cs.o
rg
Pub
licat
ion
Dat
e (W
eb):
Aug
ust 2
4, 2
015
| doi
: 10.
1021
/acs
ami.5
b049
32

shifted to ∼3.0 V after 80 cycles, which is 0.3 V lower than theirfirst cycle. The changes in position of the first and second peaksrevealed different trends in both materials upon cycling. Thesecond peak of LNMO lowered by ∼0.4 V, while the same peakof NALNMO decreased by only ∼0.1 V. There is a ∼ 0.2 Vshift of the first peak to lower voltage for LNMO, but only ∼0.1V for the NALNMO. Based upon analysis of the dQ/dV plotsand surface characterization of pristine and surface modifiedmaterials, we can draw the conclusion that the NH4F and Al2O3surface co-modification partly stabilized the first and secondpeak regions, in terms of capacity and voltage, but the thirdpeak region continues to show degradation upon cycling.This detailed study of the role of NH4F and Al2O3 surface co-
modification suggests that each treatment during themodification process can dramatically transform the materials’surface structure and chemistry. Those changes havecontributed to the electrochemical performance of the finalsamples from different aspects. Adding mild acid introduced thesurface spinel-like structure and etched nanoislands formations,which will facilitate the activation of the cathode material,leading to a higher discharge capacity. An amorphous surfacecoating reduced the direct reaction between electrode andelectrolyte, resulting in less irreversible oxygen loss. Moresurface modification works are undergoing study in order todiscover an ideal surface modification method.
5. CONCLUSION
In this work, we reveal that the surface chemistry of cathodematerials will significantly affect the uniformity and chemistryof coating layer. The surface co-modifications brought changesto the material’s surface, from both a structural and chemicalaspect. In order to identify these sophisticated changes,multimodality surface sensitive tools were applied in an attemptto obtain a complete picture. NH4F promoted the trans-formation of a surface spinel-like phase, as well as the formationof isolated nanoislands of active material, which facilitated theactivation of the cathode material, leading to higher dischargecapacity. At the same time, amorphous Al2O3 surface coatingreduced the side reaction between electrode and electrolyte,and also irreversible oxygen loss, thus reducing the irreversiblecapacity. In particular, while the Mn3+/Mn4+ redox pair stillshowed an increase indicating destabilization, the surface co-modification stabilized the Ni2+/Ni4+ region in terms ofcapacity and voltage. The fundamental understandings of thiswork not only may be widely used to explain the role of othersurface modifications used for high-voltage-cathode materialsbut also could guide us in designing better cathode materialswith higher energy density.
■ ASSOCIATED CONTENT
*S Supporting InformationThe Supporting Information is available free of charge on theACS Publications website at DOI: 10.1021/acsami.5b04932.
EDS spectrum of NALNMO starting material, TEMphotographs of pristine NALNMO prepared fromcarbonate method, EELS spectrum of crystalline nano-islands at the surface of NALNMO. XPS Mn 3s regionsof LNMO and NALNMO pristine and cycled electrodematerials, and XPS Mn 3s region peak separations ofLNMO and NALNMO pristine and cycled electrodematerials (PDF)
■ AUTHOR INFORMATION
Corresponding Author*E-mail: [email protected].
NotesThe authors declare no competing financial interest.
■ ACKNOWLEDGMENTS
UCSD’s efforts are supported by the Assistant Secretary forEnergy Efficiency and Renewable Energy, Office of VehicleTechnologies of the U.S. Department of Energy (DOE) underContract No. DE-AC02-05CH11231, Subcontract No.7073923, under the Advanced Battery Materials Research(BMR) Program. The neutron experiments benefited from theSNS user facility, sponsored by the office of Basic EnergySciences (BES), the Office of Science of the DOE. H.L.acknowledges the financial support from the China ScholarshipCouncil under Award No. 2011631005. Y.C., L.B., and G.M.V.acknowledge the support from U.S. DOE’s Office of BasicEnergy Sciences, Material Science and Engineering Division. Aportion of the TEM was performed at the UCSD Cryo-Electron Microscopy Facility. The STEM/EELS work wascarried out through a user project, supported by ORNL’sCenter for Nanophase Materials Sciences (CNMS), which issponsored by the Scientific User Facilities Division, Office ofBasic Energy Sciences, U.S. DOE.
■ ABBREVIATIONS
a-STEM, aberration-corrected scanning transmission elec-tron microscopyEELS, electron energy loss spectroscopyHRTEM, high-resolution transmission electron microscopyLNMO, Li1.2Ni0.2Mn0.6O2NALNMO, NH4F and Al2O3 surface co-modified Li excessND, neutron diffractionXPS, X-ray photoelectron spectroscopy
■ REFERENCES(1) Thackeray, M. M.; Kang, S. H.; Johnson, C. S.; Vaughey, J. T.;Benedek, R.; Hackney, S. A. Li2MnO3-Stabilized LiMO2 (M = Mn, Ni,Co) Electrodes for Lithium-ion Batteries. J. Mater. Chem. 2007, 17,3112−3125.(2) Ohzuku, T.; Makimura, Y. Layered Lithium Insertion Material ofLiCo1/3Ni1/3Mn1/3O2 for Lithium-ion Batteries. Chem. Lett. 2001, 1,642−643.(3) Lu, Z. H.; Dahn, J. R. Understanding the Anomalous Capacity ofLi/Li[NixLi(1/3−2x/3)Mn(2/3‑x/3]O2 Cells Using In Situ X-ray Diffractionand Electrochemical Studies. J. Electrochem. Soc. 2002, 149, A815−A822.(4) Lin, F.; Markus, I. M.; Nordlund, D.; Weng, T.-C.; Asta, M. D.;Xin, H. L.; Doeff, M. M. Surface Reconstruction and ChemicalEvolution of Stoichiometric Layered Cathode Materials for Lithium-Ion Batteries. Nat. Commun. 2014, 5, 3529.(5) Yu, H. J.; Zhou, H. S. High-Energy Cathode Materials (Li2MnO3-LiMO2) for Lithium-Ion Batteries. J. Phys. Chem. Lett. 2013, 4, 1268−1280.(6) Robertson, A. D.; Bruce, P. G. Overcapacity of Li-[NixLi1/3−2x/3Mn2/3‑x/3]O2 Electrodes. Electrochem. Solid-State Lett.2004, 7, A294−A298.(7) Zheng, J. M.; Zhang, Z. R.; Wu, X. B.; Dong, Z. X.; Zhu, Z.; Yang,Y. The Effects of AlF3 Coating on the Performance of Li-[Li0.2Mn0.54Ni0.13Co0.13]O2 Positive Electrode Material for Lithium-Ion Battery. J. Electrochem. Soc. 2008, 155, A775−A782.
ACS Applied Materials & Interfaces Research Article
DOI: 10.1021/acsami.5b04932ACS Appl. Mater. Interfaces 2015, 7, 19189−19200
19198
Dow
nloa
ded
by U
NIV
OF
CA
LIF
OR
NIA
SA
N D
IEG
O o
n Se
ptem
ber
8, 2
015
| http
://pu
bs.a
cs.o
rg
Pub
licat
ion
Dat
e (W
eb):
Aug
ust 2
4, 2
015
| doi
: 10.
1021
/acs
ami.5
b049
32

(8) Wu, Y.; Manthiram, A. Effect of Surface Modifications on theLayered Solid Solution Cathodes (1-z) Li[Li1/3Mn2/3]O2−(z) Li-[Mn0.5‑yNi0.5‑yCo2y]O2. Solid State Ionics 2009, 180, 50−56.(9) Zheng, J. M.; Li, J.; Zhang, Z. R.; Guo, X. J.; Yang, Y. The Effectsof TiO2 Coating on the Electrochemical Performance of Li-[Li0.2Mn0.54Ni0.13Co0.13]O2 Cathode Material for Lithium-ion Battery.Solid State Ionics 2008, 179, 1794−1799.(10) Liu, J.; Wang, Q.; Reeja-Jayan, B.; Manthiram, A. Carbon-Coated High Capacity Layered Li[Li0.2Mn0.54Ni0.13Co0.13]O2 Cath-odes. Electrochem. Commun. 2010, 12, 750−753.(11) Liu, J.; Reeja-Jayan, B.; Manthiram, A. Conductive SurfaceModification with Aluminum of High Capacity Layered Li-[Li0.2Mn0.54Ni0.13Co0.13]O2 Cathodes. J. Phys. Chem. C 2010, 114,9528−9533.(12) Martha, S. K.; Nanda, J.; Kim, Y.; Unocic, R. R.; Pannala, S.;Dudney, N. J. Solid Electrolyte Coated High Voltage Layered-LayeredLithium-Rich Composite Cathode: Li1.2Mn0.525Ni0.175Co0.1O2. J. Mater.Chem. A 2013, 1, 5587−5595.(13) Fu, Q.; Du, F.; Bian, X.; Wang, Y.; Yan, X.; Zhang, Y.; Zhu, K.;Chen, G.; Wang, C.; Wei, Y. Electrochemical Performance andThermal Stability of Li1.18Co0.15Ni0.15Mn0.52O2 Surface Coated with theIonic Conductor Li3VO4. J. Mater. Chem. A 2014, 2, 7555−7562.(14) Kang, S.-H.; Thackeray, M. M. Enhancing the Rate Capability ofHigh Capacity xLi2MnO3·(1-x)LiMO2 (M = Mn, Ni, Co) Electrodesby Li−Ni−PO4 Treatment. Electrochem. Commun. 2009, 11, 748−751.(15) Li, J. C.; Baggetto, L.; Martha, S. K.; Veith, G. M.; Nanda, J.;Liang, C. D.; Dudney, N. J. An Artificial Solid Electrolyte InterphaseEnables the Use of a LiNi0.5Mn1.5O4 5 V Cathode with ConventionalElectrolytes. Adv. Energy. Mater. 2013, 3, 1275−1278.(16) Kim, I. T.; Knight, J. C.; Celio, H.; Manthiram, A. EnhancedElectrochemical Performances of Li-rich Layered Oxides by SurfaceModification with Reduced Graphene Oxide/AlPO4 Hybrid Coating.J. Mater. Chem. A 2014, 2, 8696−8704.(17) Kang, S. H.; Thackeray, M. M. Stabilization of xLi2MnO3·(1-x)LiMO2 Electrode Surfaces (M = Mn, Ni, Co) with Mildly Acidic,Fluorinated Solutions. J. Electrochem. Soc. 2008, 155, A269−A275.(18) Fell, C. R.; Carroll, K. J.; Chi, M.; Meng, Y. S. Synthesis−Structure−Property Relations in Layered, “Li-excess” Oxides ElectrodeMaterials Li[Li1/3−2x/3NixMn2/3−x/3]O2 (x = 1/3, 1/4, and 1/5). J.Electrochem. Soc. 2010, 157, A1202−A1211.(19) Liu, H. D.; Fell, C. R.; An, K.; Cai, L.; Meng, Y. S. In-situNeutron Diffraction Study of the xLi2MnO3·(1-x)LiMO2 (x= 0, 0.5;M= Ni, Mn, Co) Layered Oxide Compounds During ElectrochemicalCycling. J. Power Sources 2013, 240, 772−778.(20) An, K.; Skorpenske, H. D.; Stoica, A. D.; Ma, D.; Wang, X.-L.;Cakmak, E. First In Situ Lattice Strains Measurements Under Load atVULCAN. Metall. Mater. Trans. A 2011, 42, 95−99.(21) An, K.; Wang, X. L.; Stoica, A. D. Vulcan Data Reduction andInteractive Visualization Software, ORNL Report ORNL-TM-2012-621;Oak Ridge National Laboratory: Oak Ridge, TN, USA, 2012.(22) Larson, A. C.; Von Dreele, R. B. General Structure AnalysisSystem (GSAS), Los Alamos National Laboratory Report LAUR 86-748; Los Alamos National Laboratory: Los Alamos, NM, USA, 2004.(23) Toby, B. H. EXPGUI, a Graphical User Interface for GSAS. J.Appl. Crystallogr. 2001, 34, 210−213.(24) Pennycook, S. J. Z-Contrast Stem for Materials Science.Ultramicroscopy 1989, 30, 58−69.(25) James, E. M.; Browning, N. D. Practical Aspects of AtomicResolution Imaging and Analysis in STEM. Ultramicroscopy 1999, 78,125−139.(26) Wang, Z. L.; Yin, J. S.; Jiang, Y. D. EELS Analysis of CationValence States and Oxygen Vacancies in Magnetic Oxides. Micron2000, 31, 571−580.(27) Cai, L.; Liu, Z. C.; An, K.; Liang, C. D. Probing Li-Ni CationDisorder in Li1‑xNi1+x‑yAlyO2 Cathode Materials by NeutronDiffraction. J. Electrochem. Soc. 2012, 159, A924−A928.(28) Meng, Y. S.; Ceder, G.; Grey, C. P.; Yoon, W. S.; Jiang, M.;Breger, J.; Shao-Horn, Y. Cation Ordering in Layered O3 Li-
[NixLi1/3−2x/3Mn2/3‑x/3]O2 (0 ≤ x ≤ 1/2) Compounds. Chem. Mater.2005, 17, 2386−2394.(29) Breger, J.; Jiang, M.; Dupre, N.; Meng, Y. S.; Shao-Horn, Y.;Ceder, G.; Grey, C. P. High-resolution X-ray Diffraction, DIFFaX,NMR and First Principles Study of Disorder in the Li2MnO3-Li[Ni1/2Mn1/2]O2 Solid Solution. J. Solid State Chem. 2005, 178,2575−2585.(30) Fell, C. R.; Qian, D. N.; Carroll, K. J.; Chi, M. F.; Jones, J. L.;Meng, Y. S. Correlation Between Oxygen Vacancy, Microstrain, andCation Distribution in Lithium-Excess Layered Oxides During theFirst Electrochemical Cycle. Chem. Mater. 2013, 25, 1621−1629.(31) Armstrong, A. R.; Holzapfel, M.; Novak, P.; Johnson, C. S.;Kang, S. H.; Thackeray, M. M.; Bruce, P. G. Demonstrating OxygenLoss and Associated Structural Reorganization in the Lithium BatteryCathode Li[Ni0.2Li0.2Mn0.6]O2. J. Am. Chem. Soc. 2006, 128, 8694−8698.(32) Carroll, K. J.; Qian, D.; Fell, C.; Calvin, S.; Veith, G. M.; Chi, M.F.; Baggetto, L.; Meng, Y. S. Probing the Electrode/ElectrolyteInterface in the Lithium Excess Layered Oxide Li1.2Ni0.2Mn0.6O2. Phys.Chem. Chem. Phys. 2013, 15, 11128−11138.(33) Hy, S.; Felix, F.; Rick, J.; Su, W. N.; Hwang, B. J. Direct In situObservation of Li2O Evolution on Li-Rich High-Capacity CathodeMaterial, Li[NixLi(1−2x)/3Mn(2‑x)/3]O2 (0 ≤ x ≤ 0.5). J. Am. Chem. Soc.2014, 136, 999−1007.(34) Koga, H.; Croguennec, L.; Menetrier, M.; Mannessiez, P.; Weill,F.; Delmas, C. Different Oxygen Redox Participation for Bulk andSurface: A Possible Global Explanation for the Cycling Mechanism ofLi1.20Mn0.54Co0.13Ni0.13O2. J. Power Sources 2013, 236, 250−258.(35) Yabuuchi, N.; Yoshii, K.; Myung, S. T.; Nakai, I.; Komaba, S.Detailed Studies of a High-Capacity Electrode Material forRechargeable Batteries, Li2MnO3-LiCo1/3Ni1/3Mn1/3O2. J. Am. Chem.Soc. 2011, 133, 4404−4419.(36) Hy, S.; Cheng, J.-H.; Liu, J.-Y.; Pan, C.-J.; Rick, J.; Lee, J.-F.;Chen, J.-M.; Hwang, B. J. Understanding the Role of Ni in Stabilizingthe Lithium-Rich High-Capacity Cathode Materia l Li-[NixLi(1−2x)/3Mn(2‑x)/3]O2(0 ⩽x⩽ 0.5). Chem. Mater. 2014, 26,6919−6927.(37) Verde, M. G.; Liu, H. D.; Carroll, K. J.; Baggetto, L.; Veith, G.M.; Meng, Y. S. Effect of Morphology and Manganese Valence on theVoltage Fade and Capacity Retention of Li[Li2/12Ni3/12Mn7/12]O2.ACS Appl. Mater. Interfaces 2014, 6, 18868−18877.(38) Kurata, H.; Colliex, C. Electron-Energy-Loss Core-EdgeStructures in Manganese Oxides. Phys. Rev. B: Condens. MatterMater. Phys. 1993, 48, 2102−2108.(39) Riedl, T.; Gemming, T.; Wetzig, K. Extraction of EELS White-line Intensities of Manganese Compounds: Methods, Accuracy, andValence Sensitivity. Ultramicroscopy 2006, 106, 284−291.(40) Baggetto, L.; Dudney, N. J.; Veith, G. M. Surface Chemistry ofMetal Oxide Coated Lithium Manganese Nickel Oxide Thin FilmCathodes Studied by XPS. Electrochim. Acta 2013, 90, 135−147.(41) Carabineiro, S. A. C.; Bastos, S. S. T.; Orfao, J. J. M.; Pereira, M.F. R.; Delgado, J. J.; Figueiredo, J. L. Carbon Monoxide OxidationCatalysed by Exotemplated Manganese Oxides. Catal. Lett. 2010, 134,217−227.(42) Shaju, K. M.; Rao, G. V. S.; Chowdari, B. V. R. X-rayPhotoelectron Spectroscopy and Electrochemical Behaviour of 4 VCathode, Li(Ni1/2Mn1/2)O2. Electrochim. Acta 2003, 48, 1505−1514.(43) Allen, G. C.; Harris, S. J.; Jutson, J. A.; Dyke, J. M. A Study of aNumber of Mixed Transition-Metal Oxide Spinels Using X-RayPhotoelectron-Spectroscopy. Appl. Surf. Sci. 1989, 37, 111−134.(44) Sun, Y. K.; Lee, M. J.; Yoon, C. S.; Hassoun, J.; Amine, K.;Scrosati, B. The Role of AlF3 Coatings in Improving ElectrochemicalCycling of Li-enriched Nickel-Manganese Oxide Electrodes for Li-ionBatteries. Adv. Mater. 2012, 24, 1192−1196.(45) Rosina, K. J.; Jiang, M.; Zeng, D.; Salager, E.; Best, A. S.; Grey,C. P. Structure of Aluminum Fluoride Coated Li[Li1/9Ni1/3Mn5/9]O2
Cathodes for Secondary Lithium-ion Batteries. J. Mater. Chem. 2012,22, 20602−20610.
ACS Applied Materials & Interfaces Research Article
DOI: 10.1021/acsami.5b04932ACS Appl. Mater. Interfaces 2015, 7, 19189−19200
19199
Dow
nloa
ded
by U
NIV
OF
CA
LIF
OR
NIA
SA
N D
IEG
O o
n Se
ptem
ber
8, 2
015
| http
://pu
bs.a
cs.o
rg
Pub
licat
ion
Dat
e (W
eb):
Aug
ust 2
4, 2
015
| doi
: 10.
1021
/acs
ami.5
b049
32

(46) Koga, H.; Croguennec, L.; Menetrier, M.; Mannessiez, P.; Weill,F.; Delmas, C.; Belin, S. Operando X-ray Absorption Study of theRedox Processes Involved upon Cycling of the Li-Rich Layered OxideLi1.20Mn0.54Co0.13Ni0.13O2 in Li Ion Batteries. J. Phys. Chem. C 2014,118, 5700−5709.(47) Sathiya, M.; Rousse, G.; Ramesha, K.; Laisa, C. P.; Vezin, H.;Sougrati, M. T.; Doublet, M. L.; Foix, D.; Gonbeau, D.; Walker, W.;Prakash, A. S.; Ben Hassine, M.; Dupont, L.; Tarascon, J. M. ReversibleAnionic Redox Chemistry in High-Capacity Layered-Oxide Electrodes.Nat. Mater. 2013, 12, 827−835.(48) Croy, J. R.; Kim, D.; Balasubramanian, M.; Gallagher, K.; Kang,S. H.; Thackeray, M. M. Countering the Voltage Decay in HighCapacity xLi2MnO3·(1-x)LiMO2 Electrodes (M = Mn, Ni, Co) for Li+-Ion Batteries. J. Electrochem. Soc. 2012, 159, A781−A790.
ACS Applied Materials & Interfaces Research Article
DOI: 10.1021/acsami.5b04932ACS Appl. Mater. Interfaces 2015, 7, 19189−19200
19200
Dow
nloa
ded
by U
NIV
OF
CA
LIF
OR
NIA
SA
N D
IEG
O o
n Se
ptem
ber
8, 2
015
| http
://pu
bs.a
cs.o
rg
Pub
licat
ion
Dat
e (W
eb):
Aug
ust 2
4, 2
015
| doi
: 10.
1021
/acs
ami.5
b049
32