electrolyte competition controls surface binding of …...electrolyte competition controls surface...
TRANSCRIPT

doi.org/10.26434/chemrxiv.7929038.v1
Electrolyte Competition Controls Surface Binding of CO Intermediates toCO2 Reduction CatalystsAnna Wuttig, Jaeyune Ryu, Yogesh Surendranath
Submitted date: 31/03/2019 • Posted date: 02/04/2019Licence: CC BY-NC-ND 4.0Citation information: Wuttig, Anna; Ryu, Jaeyune; Surendranath, Yogesh (2019): Electrolyte CompetitionControls Surface Binding of CO Intermediates to CO2 Reduction Catalysts. ChemRxiv. Preprint.
Adsorbed CO is a critical intermediate in the electrocatalytic reduction of CO2 to fuels. Contemporary methodsfor probing the thermodynamics of CO adsorption ignore the role of the electrolyte. Using in situ infraredspectroelectrochemistry, we disclose the contrasting influence of electrolyte competition on reversible CObinding to Au and Cu catalysts. Whereas reversible CO binding to Au surfaces is driven by substitution andreorientation of adsorbed water, CO binding to Cu requires the reductive displacement of adsorbed carbonateanions. Through variable temperature studies, we find that CO binding to Cu is enthalpically favored by ~36 kJmol–1 relative to CO adsorption on Au. The divergent CO adsorption stoichiometry on Au and Cu explainstheir disparate reactivity: water adsorption drives CO liberation from Au surfaces, impeding further reduction,whereas carbonate desorption drives CO accumulation on Cu, allowing for further reduction to hydrocarbons.These studies provide direct insight into how electrolyte constituents can serve as powerful designparameters for fine-tuning of CO surface populations and, thereby, CO2-to-fuels reactivity.
File list (2)
download fileview on ChemRxivCOThermo_Manuscript_Final_Final.pdf (1.18 MiB)
download fileview on ChemRxivSI_COThermo_Final.pdf (4.21 MiB)

Electrolyte Competition Controls Surface Binding of CO Intermediates to CO2 Re-duction Catalysts
Anna Wuttig,1,2 Jaeyune Ryu,1 and Yogesh Surendranath1* 1 Department of Chemistry, Massachusetts Institute of Technology, Cambridge, Massachusetts, United States 2 Department of Chemistry, University of California, Berkeley, California, United States
ABSTRACT Adsorbed CO is a critical intermediate in the electrocatalytic reduction of CO2 to fuels. Contemporary methods for prob-
ing the thermodynamics of CO adsorption ignore the role of the electrolyte. Using in situ infrared spectroelectrochemistry, we disclose the contrasting influence of electrolyte competition on reversible CO binding to Au and Cu catalysts. Whereas re-versible CO binding to Au surfaces is driven by substitution and reorientation of adsorbed water, CO binding to Cu requires the reductive displacement of adsorbed carbonate anions. Through variable temperature studies, we find that CO binding to Cu is enthalpically favored by ~36 kJ mol–1 relative to CO adsorption on Au. The divergent CO adsorption stoichiometry on Au and Cu explains their disparate reactivity: water adsorption drives CO liberation from Au surfaces, impeding further re-duction, whereas carbonate desorption drives CO accumulation on Cu, allowing for further reduction to hydrocarbons. These studies provide direct insight into how electrolyte constituents can serve as powerful design parameters for fine-tuning of CO surface populations and, thereby, CO2-to-fuels reactivity.
MAIN CO2 electroreduction would allow for the storage of intermittent renewable electricity in energy-dense chemical fuels.1,2
The dominant mechanistic paradigm for CO2 reduction at heterogeneous catalysts invokes surface bound CO as a critical intermediate. Thus, the surface population of and catalyst’s affinity for CO are expected to correlate with the efficiency and selectivity of fuel formation. Indeed, it has been postulated that a catalyst’s CO affinity determines whether this key interme-diate is liberated as the final product or reduced further to higher order hydrocarbons and oxygenates.3–5 Furthermore, theoret-ical studies establish that CO affinities also scale linearly with the adsorption energies of other CO2RR intermediates, 4,6–18 making the CO adsorption energy a powerful descriptor of CO2RR reactivity.19 Despite the widespread appreciation of the importance of the CO adsorption thermodynamics, it has never been directly examined for CO2 reduction catalysts under electrochemical conditions. Instead, the CO adsorption energy of various known and postulated catalysts have been inferred primarily from theoretical studies4,7,14,20 or ultra-high vacuum (UHV) analysis.17 However, both of these methods apply a sim-ple gas-solid model of adsorption, in which CO binds to unoccupied surface sites (Scheme 1a).7
This gas-solid model does not accurately represent the CO binding chemistry that dominates during catalysis at a polarized solid-liquid interface. Under reaction conditions, CO binding, by necessity, involves the displacement and/or rearrangement of solvent (Scheme 1b, S) and electrolyte ions (Scheme 1 b, An–), and this aggregate equilibrium defines the CO surface population.21 Critically, analysis of the potential-dependence of CO binding must consider the key roles of S and/or An– because changes in the magnitude and sign of the interfacial electric field alters the stability of solvent dipoles and/or drives electron-transfer-mediated ion adsorption or desorption.22–25 Indeed, it is well-established that the potential-dependent binding of S and/or An– alters the surface’s affinity for neutral small molecules such as benzene and ethylene.21–29 This precedent suggests that the potential-dependent affinity of the surface for competing water and electrolyte ions (e.g. (bi)carbonate) is expected to be a dominant contributor in defining the CO surface population during CO2RR. Yet, a systematic understanding of the reaction
Scheme 1. (a) Gas-solid model for CO binding in ultra-high vac-cuum. (b) Electrochemical model for CO binding shown here.

2
stoichiometry and resulting thermochemistry of CO binding (Scheme 1b) across materials remains elusive. Together, these knowledge gaps impede directed efforts to control CO affinity and tune CO2RR selectivity.
Here, we directly probe the CO adsorption stoichiometry and thermochemistry by simultaneously tracking the adsorption of CO, water, and (bi)carbonate using in-situ surface-enhanced infrared absorption spectroscopy (SEIRAS) in an attenuated total reflectance (ATR) mode.30–33 In SEIRAS, nanostructured electrode surfaces amplify IR absorption by adsorbed molecules with transition dipole moments perpendicular to the surface.30–33 This technique is ideally suited to quantify CO affinity in situ because ATR-SEIRAS provides: (a) linear response in adsorbate coverage and signal intensity;34 (b) large spectral range; and (c) unrestricted mass transport to the catalyst surface, all of which are preserved over wide temperature ranges35.
In this work, we use SEIRAS to compare the reversible CO adsorption stoichiometry and thermochemistry on Au and Cu CO2RR catalysts. Au and Cu offer an ideal platform for investigating trends in CO binding affinity because (1) they display reversible CO binding under electrochemical conditions36–41 and (2) they display radically different CO2RR product distribu-tions. Au catalyses the production of CO as the major product42 whereas Cu is unique in catalysing the formation of CH4 and C2H4
43. This divergent reactivity has been explained by differences in the enthalpy of CO adsorption computed on idealized closed-packed Au and Cu surfaces in UHV (~30 kJ mol–1).4 Therefore, we were motivated to measure if this difference persists under electrochemical conditions and determine the influence of competing solvent and electrolyte ions in defining the CO population, and thus catalyst reactivity. In the following sections, we show the divergent reactivity profiles of Au and Cu can be explained by differing solvent/electrolyte reaction equilibria. On Au surface, water adsorption drives CO liberation, imped-ing further reduction. In contrast, on Cu surfaces, carbonate desorption drives CO accumulation, allowing for further reduction to hydrocarbons. To this best of our knowledge, we apply this understanding to, for the first time, quantify the intrinsic enthalpy and entropy of CO adsorption to these CO2RR catalysts under electrochemical conditions. These studies provide a molecular basis for explaining CO2RR reactivity trends across materials and designing improved catalysts.
RESULTS AND DISCUSSION CO Binding Equilibria on Polarized Au Surfaces. We investigated the CO adsorption dynamics on Au films in CO-
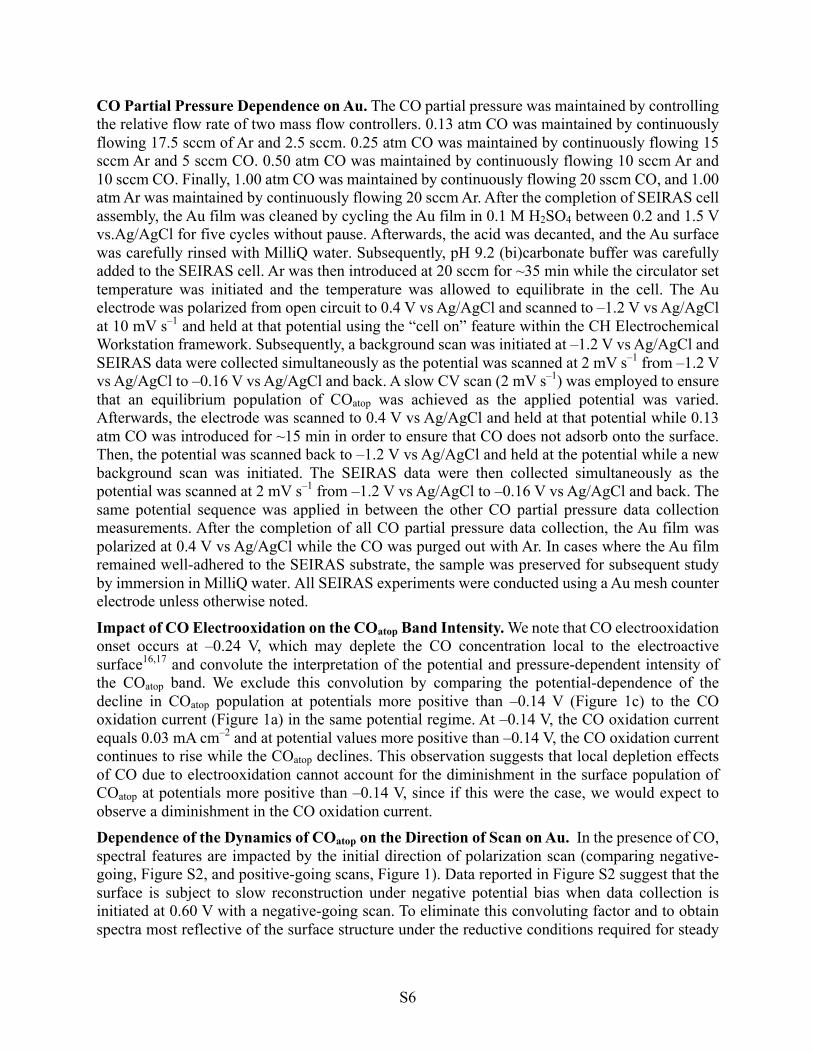
saturated 0.1 M (bi)carbonate buffer, pH 9.2, (unless otherwise stated, all data collected employ this electrolyte, Ci). At this alkaline pH, the low equilibrium concentration of CO2 minimizes convoluting CO2RR,39 and consistent with negligible CO2RR, we observe featureless SEIRA spectra in the CO region, 1700 to 2200 cm–1 when using Ar-saturated Ci (Figure S1). Figures 1a and b show the cyclic voltammogram (CV) and SEIRA spectra of a Au film where the background was recorded at –1.00 V under CO-saturation (this potential was chosen for reasons discussed in the SI and Figure S2). We observe a peak at 2079 cm–1 that appears at –0.57 V, reaches a maximum value at –0.14 V (Figure 1c), and declines monotonically at more positive potentials. This peak exhibits a 49 cm–1 V–1 Stark tuning slope, Figure S3a. Both the Stark tuning slope and the band position are in line with our previous assignment of linearly-bonded CO to Au (COatop).37 On the reverse-going (blue) trace, the poten-tial-dependence of the COatop band is identical to the forward-going (red) trace, Figure 1c, indicating that COatop exhibits reversibility with respect to changes in applied potential. In addition, we observe that the COatop population increases as the potential is swept from –1.00 to –0.14 V and then decays in a symmetric fashion as the applied potential approaches 0.04 V (Figure 1c). We find that as the PCO is reduced, the population of COatop at a given potential systematically decreases, indicative of reversible COatop binding under these conditions (Figure 2a and S4). Other observed CO binding motifs are irreversible and described in Figures S2, S3, S5-S7, and the SI. Thus, the foregoing thermodynamic analyses focus on the reversible COatop band.
The potential dependence of reversible COatop electrosorption at every PCO examined exhibits a bell-shape behavior. This behavior is a well-documented phenomenon for the electrosorption of various organic molecules in aqueous electrolytes.26,28,29 Theoretical models capture this bell-shape dependence by describing the electrosorption process as a competition between the adsorption and reorientation of interfacial water and the adsorption of the organic molecule.21–27 Due to the relatively large
Figure 1. (a) Cyclic voltammogram (CV) obtained on a Au film at 2 mVs–1 in 1.00 atm CO-saturated 0.1 M sodium bicarbonate electrolyte, pH 9.2 ± 0.1, 24 ± 1 ̊C (a). CV scans were initiated at –1.00 V vs. SHE in a positive-going (red) direction and the reverse negative-going (blue) direction is also shown. (b) Simultaneously acquired SEIRA spectra with the shaded regions denoting peaks corresponding to reversi-ble, COatop, and irreversible CO adsorption. (c) Integrated band intensities for adsorbed COatop. Background spectra were recorded at –1.00 V.
3
dipole moment of water (1.83 D), the models predict that the potential-dependence of organic molecules reflects changes in the aggregate orientation of interfacial water dipole moments as the applied potential is swept positive and negative of the potential of zero-charge (PZC).21–27 Thus, maximum adsorption is expected at the PZC of the working electrode, where the interfacial field is the weakest. Our observation of bell-shaped potential dependence of COatop electrosorption indicates that this model could also describes the system examined here. Indeed, the peak potential (Emax) of the bell-shaped curve at –0.16 V corresponds to the measured PZC of Au of around –0.10 V44 in NaClO4 electrolytes. Together, this analysis suggests that interfacial water reorientation mediates CO binding.
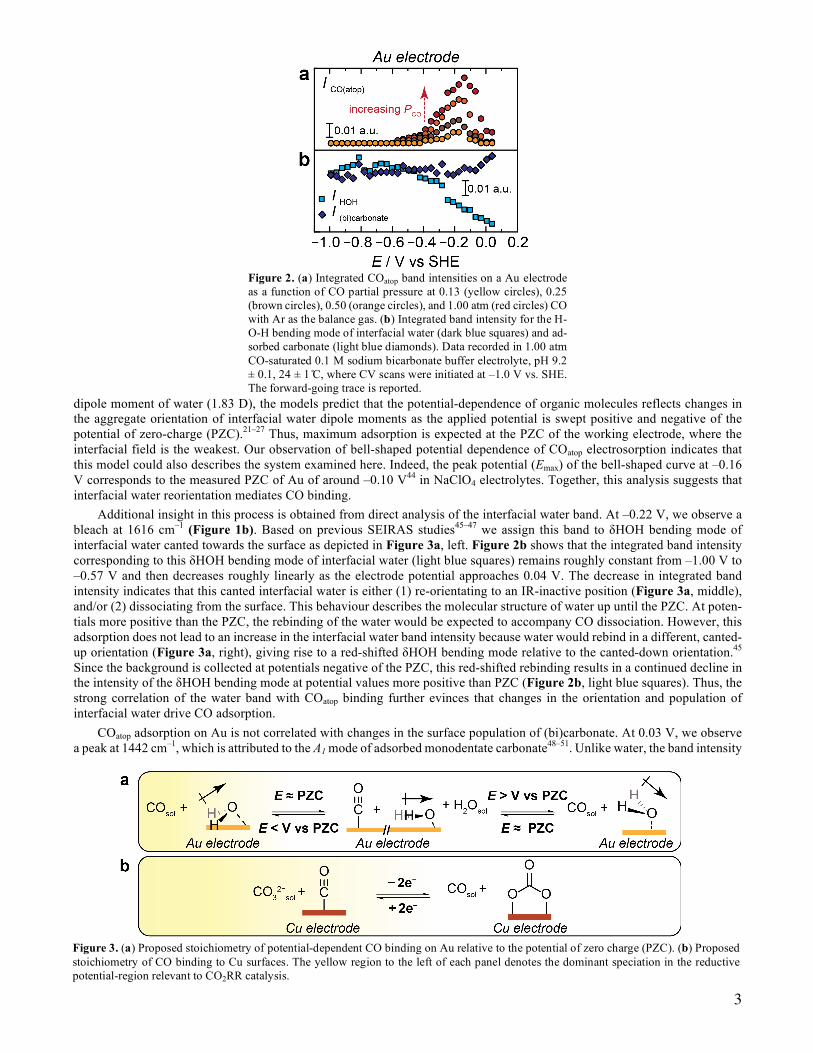
Additional insight in this process is obtained from direct analysis of the interfacial water band. At –0.22 V, we observe a bleach at 1616 cm–1 (Figure 1b). Based on previous SEIRAS studies45–47 we assign this band to δHOH bending mode of interfacial water canted towards the surface as depicted in Figure 3a, left. Figure 2b shows that the integrated band intensity corresponding to this δHOH bending mode of interfacial water (light blue squares) remains roughly constant from –1.00 V to –0.57 V and then decreases roughly linearly as the electrode potential approaches 0.04 V. The decrease in integrated band intensity indicates that this canted interfacial water is either (1) re-orientating to an IR-inactive position (Figure 3a, middle), and/or (2) dissociating from the surface. This behaviour describes the molecular structure of water up until the PZC. At poten-tials more positive than the PZC, the rebinding of the water would be expected to accompany CO dissociation. However, this adsorption does not lead to an increase in the interfacial water band intensity because water would rebind in a different, canted-up orientation (Figure 3a, right), giving rise to a red-shifted δHOH bending mode relative to the canted-down orientation.45 Since the background is collected at potentials negative of the PZC, this red-shifted rebinding results in a continued decline in the intensity of the δHOH bending mode at potential values more positive than PZC (Figure 2b, light blue squares). Thus, the strong correlation of the water band with COatop binding further evinces that changes in the orientation and population of interfacial water drive CO adsorption.
COatop adsorption on Au is not correlated with changes in the surface population of (bi)carbonate. At 0.03 V, we observe a peak at 1442 cm–1, which is attributed to the A1 mode of adsorbed monodentate carbonate48–51. Unlike water, the band intensity
Figure 2. (a) Integrated COatop band intensities on a Au electrode as a function of CO partial pressure at 0.13 (yellow circles), 0.25 (brown circles), 0.50 (orange circles), and 1.00 atm (red circles) CO with Ar as the balance gas. (b) Integrated band intensity for the H-O-H bending mode of interfacial water (dark blue squares) and ad-sorbed carbonate (light blue diamonds). Data recorded in 1.00 atm CO-saturated 0.1 M sodium bicarbonate buffer electrolyte, pH 9.2 ± 0.1, 24 ± 1 ̊C, where CV scans were initiated at –1.0 V vs. SHE. The forward-going trace is reported.
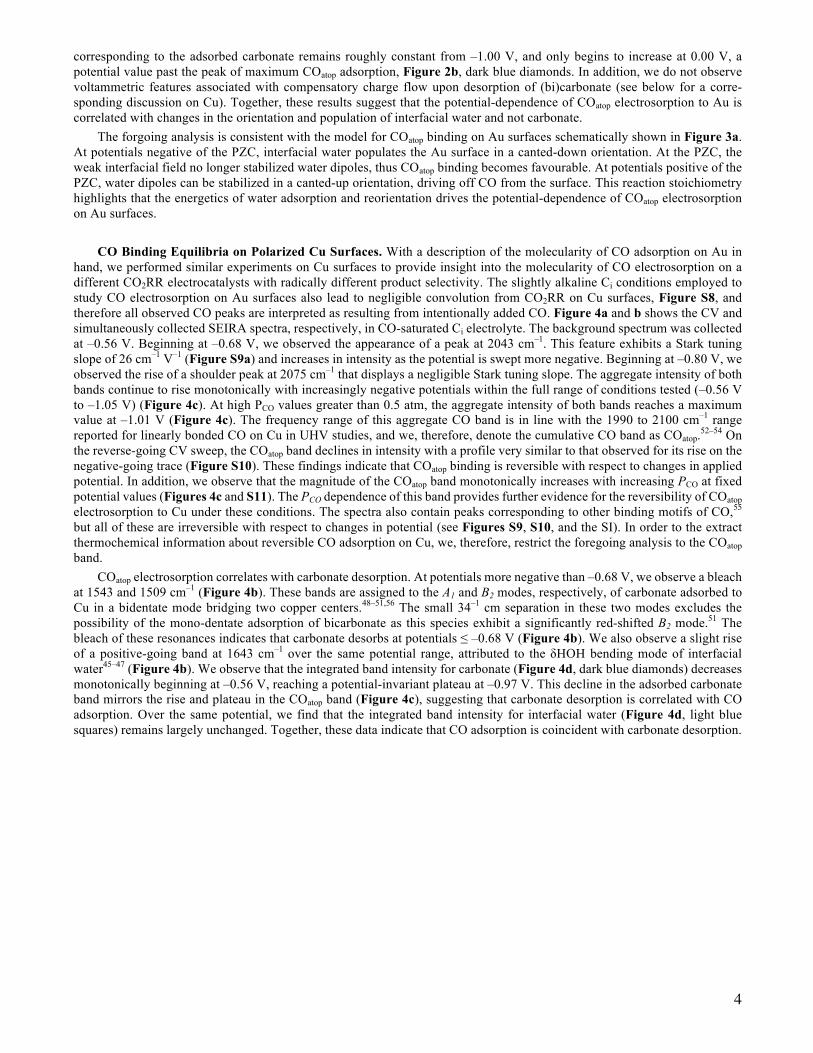
Figure 3. (a) Proposed stoichiometry of potential-dependent CO binding on Au relative to the potential of zero charge (PZC). (b) Proposed stoichiometry of CO binding to Cu surfaces. The yellow region to the left of each panel denotes the dominant speciation in the reductive potential-region relevant to CO2RR catalysis.
4
corresponding to the adsorbed carbonate remains roughly constant from –1.00 V, and only begins to increase at 0.00 V, a potential value past the peak of maximum COatop adsorption, Figure 2b, dark blue diamonds. In addition, we do not observe voltammetric features associated with compensatory charge flow upon desorption of (bi)carbonate (see below for a corre-sponding discussion on Cu). Together, these results suggest that the potential-dependence of COatop electrosorption to Au is correlated with changes in the orientation and population of interfacial water and not carbonate.
The forgoing analysis is consistent with the model for COatop binding on Au surfaces schematically shown in Figure 3a. At potentials negative of the PZC, interfacial water populates the Au surface in a canted-down orientation. At the PZC, the weak interfacial field no longer stabilized water dipoles, thus COatop binding becomes favourable. At potentials positive of the PZC, water dipoles can be stabilized in a canted-up orientation, driving off CO from the surface. This reaction stoichiometry highlights that the energetics of water adsorption and reorientation drives the potential-dependence of COatop electrosorption on Au surfaces.
CO Binding Equilibria on Polarized Cu Surfaces. With a description of the molecularity of CO adsorption on Au in
hand, we performed similar experiments on Cu surfaces to provide insight into the molecularity of CO electrosorption on a different CO2RR electrocatalysts with radically different product selectivity. The slightly alkaline Ci conditions employed to study CO electrosorption on Au surfaces also lead to negligible convolution from CO2RR on Cu surfaces, Figure S8, and therefore all observed CO peaks are interpreted as resulting from intentionally added CO. Figure 4a and b shows the CV and simultaneously collected SEIRA spectra, respectively, in CO-saturated Ci electrolyte. The background spectrum was collected at –0.56 V. Beginning at –0.68 V, we observed the appearance of a peak at 2043 cm–1. This feature exhibits a Stark tuning slope of 26 cm–1 V–1 (Figure S9a) and increases in intensity as the potential is swept more negative. Beginning at –0.80 V, we observed the rise of a shoulder peak at 2075 cm–1 that displays a negligible Stark tuning slope. The aggregate intensity of both bands continue to rise monotonically with increasingly negative potentials within the full range of conditions tested (–0.56 V to –1.05 V) (Figure 4c). At high PCO values greater than 0.5 atm, the aggregate intensity of both bands reaches a maximum value at –1.01 V (Figure 4c). The frequency range of this aggregate CO band is in line with the 1990 to 2100 cm–1 range reported for linearly bonded CO on Cu in UHV studies, and we, therefore, denote the cumulative CO band as COatop.52–54 On the reverse-going CV sweep, the COatop band declines in intensity with a profile very similar to that observed for its rise on the negative-going trace (Figure S10). These findings indicate that COatop binding is reversible with respect to changes in applied potential. In addition, we observe that the magnitude of the COatop band monotonically increases with increasing PCO at fixed potential values (Figures 4c and S11). The PCO dependence of this band provides further evidence for the reversibility of COatop electrosorption to Cu under these conditions. The spectra also contain peaks corresponding to other binding motifs of CO,55 but all of these are irreversible with respect to changes in potential (see Figures S9, S10, and the SI). In order to the extract thermochemical information about reversible CO adsorption on Cu, we, therefore, restrict the foregoing analysis to the COatop band.
COatop electrosorption correlates with carbonate desorption. At potentials more negative than –0.68 V, we observe a bleach at 1543 and 1509 cm–1 (Figure 4b). These bands are assigned to the A1 and B2 modes, respectively, of carbonate adsorbed to Cu in a bidentate mode bridging two copper centers.48–51,56 The small 34–1 cm separation in these two modes excludes the possibility of the mono-dentate adsorption of bicarbonate as this species exhibit a significantly red-shifted B2 mode.51 The bleach of these resonances indicates that carbonate desorbs at potentials ≤ –0.68 V (Figure 4b). We also observe a slight rise of a positive-going band at 1643 cm–1 over the same potential range, attributed to the δHOH bending mode of interfacial water45–47 (Figure 4b). We observe that the integrated band intensity for carbonate (Figure 4d, dark blue diamonds) decreases monotonically beginning at –0.56 V, reaching a potential-invariant plateau at –0.97 V. This decline in the adsorbed carbonate band mirrors the rise and plateau in the COatop band (Figure 4c), suggesting that carbonate desorption is correlated with CO adsorption. Over the same potential, we find that the integrated band intensity for interfacial water (Figure 4d, light blue squares) remains largely unchanged. Together, these data indicate that CO adsorption is coincident with carbonate desorption.

5
Electrochemical data provide additional support for the role of carbonate desorption in gating CO adsorption. Desorption of the carbonate dianion would give rise to compensatory charge flow from the external circuit and a corresponding voltam-metric feature. Indeed, CO adsorption in phosphate electrolytes is accompanied by a reversible voltammetric feature for the desorption of phosphate from the Cu surface.57–62 Surface redox waves have also been shown for polycrystalline Cu electrodes cycled in CO-saturated (bi)carbonate electrolytes at pH 10.3 and have been correlated to the appearance of CO bands in FTIR spectra.60 We reasoned that we should also be able to observe similar voltammetric features on Cu under the conditions used in this study. While the large catalytic wave observed in the slow CV scans recorded during SEIRAS measurements obscure the observation of surface electrodesorption waves, Cu foil electrodes examined at a higher scan rate under identical conditions display two broad and reversible voltammetric features at –0.71 and –0.89 V (Figure 4a, dotted lines). These redox waves shift by –40 mV per log[CO3
2–] (Figure 4a, inset), indicating that they involve CO32– desorption from the surface. The obser-
vation of two reversible voltammetric features in Figure 4a suggests that there are two reversible CO sites. Indeed, at potential values ≤ –0.80 V, we observe the rise of a sharp shoulder in the COatop band at 2079 cm–1, Figure 4b. This transition also coincides with an inflection point at roughly –0.80 V in the COatop integrated band intensity, Figure 4c, suggesting that the COatop band predominately reflects one Cu binding site a potentials more positive than –0.80 V and another site at potentials more negative than –0.80 V. While the asymmetry and the large width of the aggregate COatop peak may also suggest Fano-type coupling of CO vibrations with metal-based absorptions,63–67 the correlation with the voltammetry waves suggest that two distinct CO binding environments are contributing to the observed peak shape. Together, the data are consistent with carbonate desorption accompanying reversible COatop adsorption to two distinct environments on the Cu surface.
The data in Figure 4 are consistent with an electrosorptive process for COatop adsorption on Cu surfaces described by the following expression and schematically shown in Figure 3b,
Cu-COatop + CO32–
sol ⇌ 2e– + COsol + Cu-CO3, where COaq is the CO dissolved in the electrolyte, Cu-CO3 denotes specifically-adsorbed carbonate molecules, Cu-COatop
denotes surface-bound COatop, CO32–
aq denotes carbonate anions in the bulk solution. This equilibrium expression highlights that reversible COatop binding to Cu surfaces is accompanied by carbonate desorption. The equilibrium potential for this reac-tion is given by,
𝐸 = 𝐸% + 𝑅𝑇2𝐹
ln𝜃./0𝑎./
𝜃./2345𝑎./067
where E0 refers to the standard state potential for the reaction, 𝜃./0 refers to the surface coverage of carbonate, aCO refers to the activity of CO, θCOatop refers to the surface coverage of COatop, 𝑎./067 refers to the activity of carbonate, and the other constants take their usual meaning. This expression captures the ~30 mV/log[𝑐./067] dependence on the electrosorptive process, observed experimentally. In line the SEIRAS data described above, this data also serves to exclude bicarbonate as the desorbing ion, which would give rise to a ~60 mV/log[HCO3
–] slope. The above equilibrium indicates that the CO surface population is governed by both the CO affinity at a given surface site and the corresponding binding energy of carbonate. Thus, the ~200 mV separation between the two surface waves reflects difference in the free energy of binding CO or CO3
2– or both to the two distinct surface environments.
Figure 4. (a) Cyclic voltammograms (CV) obtained on a Cu film at 2 mV s–1 in 1.00 atm CO-saturated 0.1 M sodium bicarbonate electrolyte, pH 9.2 ± 0.1, 24 ± 1 ̊C. CV scans were initiated at –0.56 V vs SHE in a negative-going (solid line, blue) direction. Overlaid CV obtained on a Cu foil recorded at 150 mV s–1 and initiated at –0.43 V in a negative-going (dotted line, blue) direction. Half-wave potential (E1/2) of the two voltammetric waves vs logarithm of the carbonate concentration (inset). (b) Simultaneously acquired SEIRA spectra for the Cu film with the shaded regions denoting peaks corresponding to reversible, COatop, and irreversible CO adsorption. (c) Integrated COatop band inten-sities as a function of CO partial pressure at 0.13 (yellow circles), 0.25 (brown circles), 0.50 (orange circles), and 1.00 (red circles) atm CO with Ar as the balance gas. (d) Integrated band intensity for the H-O-H bending mode of interfacial water (light blue squares) and adsorbed (bi)carbonate (dark blue diamonds).

6
Comparison of Molecularity of CO Electrosorption on Au and Cu. The above studies establish the molecular basis for reversible CO binding to Au and Cu surfaces. Our studies highlight that, unlike for gas-solid interfaces, in an electrochemical environment, competitive binding of solvent and electrolyte defines the potential-dependent surface CO affinity. On Au sur-faces, we show that COatop electrosorption is in competition with interfacial water and that the large dipole moment of water stabilizes the interfacial field better than bound CO at potentials positive or negative of the PZC. Thus, water adsorption drives CO desorption under the negative potentials required for CO2RR, Figure 3a (yellow shaded region), explaining the wide-spread observation of selective CO production on Au surfaces.37 In contrast, on Cu surfaces, COatop binding is driven by car-bonate desorption, and the potential dependence of the latter serves to define the CO surface population during CO2RR, Figure 3b (yellow shaded region). The electrochemically driven desorption of carbonate allows for the accumulation of CO on the Cu surface, priming this critical intermediate for subsequent reduction to higher order hydrocarbons and oxygenates. Together, our studies demonstrate that competing interactions with solvent and electrolyte define the equilibria that dictate CO surface population and provide a basis for explaining the divergent CO2 reduction reactivity profiles of Au and Cu surfaces.
Entropy and Enthalpy of CO Electrosorption on Au. With a molecular picture of CO binding in hand, we quantified
the intrinsic enthalpy and entropy of CO binding at potentials where competing solvent and electrolyte adsorption is strongly disfavored. These thermochemical parameters were obtained by quantifying changes in the CO surface population as a function of temperature. Using a thermostated cell (Figure S12), SEIRA spectra and CV traces were collected over a temperature (T) range spanning 10-50 ̊C. Temperature-dependent changes in the CO solubility and reference electrode potential were corrected for by using known relationships,68,69 as plotted in Figure S13 and S14. Using this setup, we first confirmed, on Au electrodes, that the COatop adsorption remains reversible with respect to changes in the applied potential over the entire temperature range (Figure S15). Interestingly, we observe a shift in the peak potential of COatop adsorption as a function of T. We observe that the potential correspond to maximum COatop adsorption (Emax) shifts from –0.12 V to –0.24 V as the temperature is increased from 10 to 50 ̊C. Over this temperature range we find a linear relationship between temperature and peak potential with a slope, dEmax/dT, of –3 mV K–1 (R2 = 0.933). According to the model discussed above, the maximum COatop adsorption is observed at the PZC, and thus dEmax/dT estimates the dependence of PZC on T. Our observation is in line with the –0.142 mV K–1 value for dEPZC/dT measured on Au(210) in the presence of electrolytes of comparable ionic strength,70 suggesting that this shift is an intrinsic property of the Au-electrolyte interface.70–73 These data evince reversible COatop adsorption across the measured T range.
Fitting the CO isotherm across the temperature range provides an estimate of the intrinsic enthalpy and entropy of CO binding in an electrochemical environment. Figure 5 plots the COatop surface coverage (θCOatop) at Emax as a function of the dissolved CO concentration (cCO) over a range of temperatures (Figure 5, blue to red). We translated the observed COatop band intensity to θCOatop by methods detailed in the SI and Figures S16-S17. In short, integrated band intensity data were normalized to the maximum value observed and translated to θCOatop by estimating the molar adsorption coefficient using the COirreversible band. Figure 5 and S17 reveal a non-linear relationship between θCOatop and cCO across the entire T range. These non-linear dependencies can be captured using a Langmuir adsorption model to fit the data. While a more complex adsorption model that considers adsorbate-adsorbate interactions could also be used to fit the data in Figure 5, the lack of significant frequency shift of the COatop band with changes in PCO, Figure S18, suggest that dipole-dipole coupling and other lateral CO-CO interactions are minimal. These Langmuir isotherm fits (Figure 5, solid lines) were then used to extract a binding equilibrium constant, K,
Figure 5. Surface coverage of COatop (θCOatop) on Au surfaces vs the CO concentration at the potential of maximum adsorption. Solid lines denote fits to a Langmuir adsorption isotherm. (Inset) Temperature-dependence of standard free energy of adsorption. Solid line is a linear fit to the data.
7
and a corresponding standard free energy for CO adsorption (Figure 5, inset, Table S1-3). The ∆𝐺%.<% corresponds to a standard
state of 0.5 coverage and 1 M dissolved CO,74,75 and we estimate values of –15±2, –14±2, –13±1, and –12±1 kJ mol–1 for data collected at 10, 24, 38, and 50 ̊C, respectively. These ∆𝐺%.<% values are linearly correlated with T (Figure 5, inset) allowing us to estimate a standard enthalpy of adsorption, ∆𝐻%.<% , of –35±1 kJ mol–1 and a standard entropy of adsorption, ∆𝑆%.<% , of –71±3 J mol–1 K–1 from the slope and intercept, respectively. This analysis reveals that COatop electrosorption, Figure 3a, is enthalpi-cally favorable but entropically unfavorable. These values constitute, to the best of our knowledge, the first experimental measurements of CO adsorption thermochemistry to Au under conditions relevant to CO2RR and can provide a basis for benchmarking theoretical studies. Interestingly, the enthalpy of adsorption we measure is close to the value of ~ –33 kJ mol–1 reported for CO adsorption to a Au(110)-(1 × 2) in UHV at a coverage close to 0.576, is within the range of values (15 to 58 kJ mol–1) measured in UHV for Au(100) as a function of coverage,77 and ~16 kJ mol–1 lower than that measured for polycrystalline Au78. The foregoing analysis provides the first quantitative insights into the intrinsic thermochemistry of reversible CO ad-sorption on Au, providing a basis for quantitative benchmarking of this key descriptor.
Entropy and Enthalpy of CO Electrosorption on Cu. SEIRA spectra also provide quantitative insight into the enthalpy
and entropy of CO binding to Cu at potentials where carbonate adsorption is strongly disfavored. SEIRA spectra and CV traces were collected at 10, 17, and 24 ̊C and reveal T-dependent COatop band intensities (Figure S19). We note that above 24 ̊C, SEIRAS-active Cu films began to exfoliate, preventing us from probing the same T range as that for Au films. Nonetheless, at each accessible temperature, COatop adsorption remains reversible with respect to changes in the applied potential providing a basis for analysis of the CO binding thermochemistry.
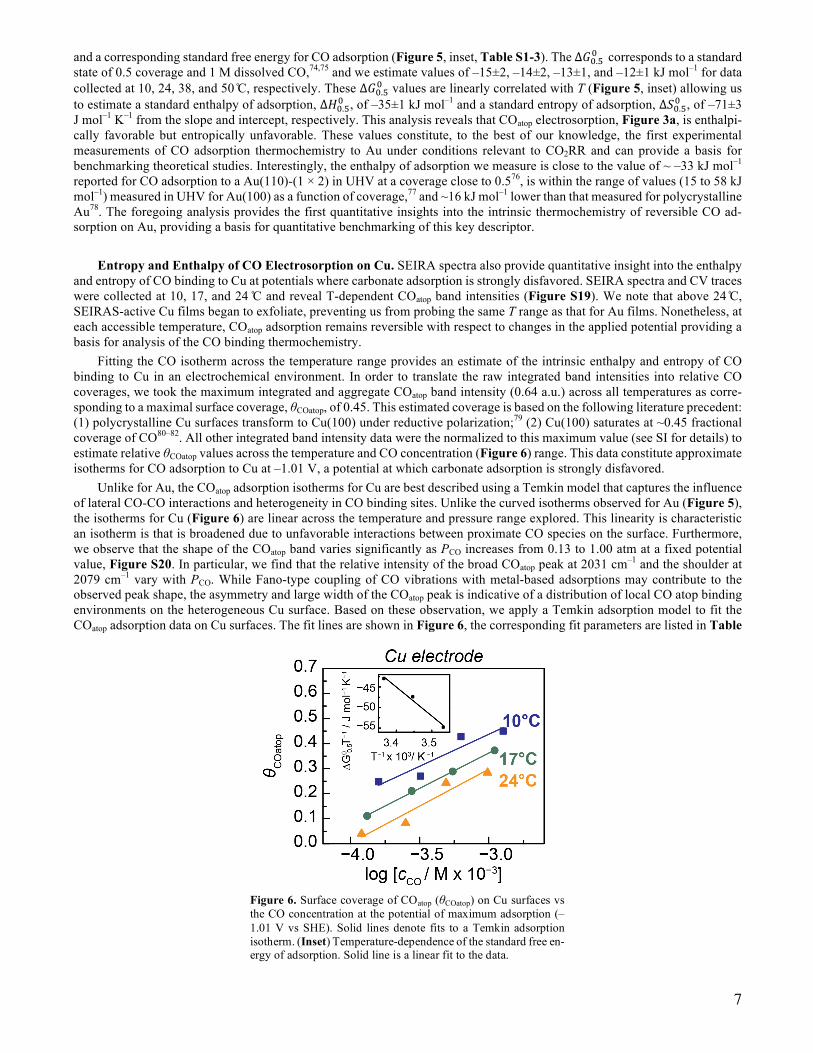
Fitting the CO isotherm across the temperature range provides an estimate of the intrinsic enthalpy and entropy of CO binding to Cu in an electrochemical environment. In order to translate the raw integrated band intensities into relative CO coverages, we took the maximum integrated and aggregate COatop band intensity (0.64 a.u.) across all temperatures as corre-sponding to a maximal surface coverage, θCOatop, of 0.45. This estimated coverage is based on the following literature precedent: (1) polycrystalline Cu surfaces transform to Cu(100) under reductive polarization;79 (2) Cu(100) saturates at ~0.45 fractional coverage of CO80–82. All other integrated band intensity data were the normalized to this maximum value (see SI for details) to estimate relative θCOatop values across the temperature and CO concentration (Figure 6) range. This data constitute approximate isotherms for CO adsorption to Cu at –1.01 V, a potential at which carbonate adsorption is strongly disfavored.
Unlike for Au, the COatop adsorption isotherms for Cu are best described using a Temkin model that captures the influence of lateral CO-CO interactions and heterogeneity in CO binding sites. Unlike the curved isotherms observed for Au (Figure 5), the isotherms for Cu (Figure 6) are linear across the temperature and pressure range explored. This linearity is characteristic an isotherm is that is broadened due to unfavorable interactions between proximate CO species on the surface. Furthermore, we observe that the shape of the COatop band varies significantly as PCO increases from 0.13 to 1.00 atm at a fixed potential value, Figure S20. In particular, we find that the relative intensity of the broad COatop peak at 2031 cm–1 and the shoulder at 2079 cm–1 vary with PCO. While Fano-type coupling of CO vibrations with metal-based adsorptions may contribute to the observed peak shape, the asymmetry and large width of the COatop peak is indicative of a distribution of local CO atop binding environments on the heterogeneous Cu surface. Based on these observation, we apply a Temkin adsorption model to fit the COatop adsorption data on Cu surfaces. The fit lines are shown in Figure 6, the corresponding fit parameters are listed in Table
Figure 6. Surface coverage of COatop (θCOatop) on Cu surfaces vs the CO concentration at the potential of maximum adsorption (–1.01 V vs SHE). Solid lines denote fits to a Temkin adsorption isotherm. (Inset) Temperature-dependence of the standard free en-ergy of adsorption. Solid line is a linear fit to the data.

8
S4. From these fits, we estimate that heterogeneity and lateral interactions lead to an average change in the heat of adsorption, (r), of 20.1±1.0 kJ mol–1 across the range from low to high coverage. The fits also return ∆𝐺%% values, corresponding to a standard state of 0 coverage and 1 M CO, of –25.6±4.6, –23.8±0.5, and –22.8±3.9 kJ mol–1 for data collected at 10, 17, and 24 ̊C, respectively. The Au data was fit using the Langmuir isotherm (see above), which defines a different standard state surface coverage of 0.5. Therefore, in order to directly compare the adsorption Gibbs energy values of CO binding to both metals under these conditions at a common standard state,83 we also estimated ∆𝐺%.<%
at 0.5 coverage for Cu. By assuming a linear dependence of ∆𝐺?%
with the surface coverage and slope defined by the average interaction parameter, r, we estimate ∆𝐺%.<% values, corresponding to a standard state of 0.5 coverage and 1 M CO, of –15.5±4.7, –13.8±0.7, and –12. 8±3.9 kJ mol–
1 for data collected at 10, 17, and 24 ̊C, respectively. The T-dependence of COatop electrosorption on Cu reveals the thermochemical values for this reversible process. A plot
of ∆𝐺%.<% T–1 vs T–1 (Figure 6, inset) is linear, allowing extraction of an adsorption enthalpy, ∆𝐻%.<% , of –71±9 kJ mol–1 and entropy, ∆𝑆%.<% , of –196±32 J mol–1 K–1 from the slope and the intercept, respectively. This heat of adsorption value is in line with the values of ~ –71 kJ mol–1 and ~ –67 kJ mol–1 reported in UHV for low coverage CO adsorption to Cu(100)80 and low coverage CO adsorption to highly polycrystalline oxide-derived Cu17, respectively. In addition, the enthalpy we measure is ~16 kJ mol–1 higher than that measured on Cu(110) in UHV.84 Our analysis provides, to the best of our knowledge, the first in-situ measurements of CO thermochemistry on Cu under conditions relevant to CO2RR, and provides a basis for the quantitative benchmarking of this key descriptor.
Comparison of Entropy and Enthalpy of CO Electrosorption on Cu and Au. We quantified the CO binding thermo-
chemistry under conditions at which solvent and electrolyte competing reactions are strongly disfavored, serving to reveal the intrinsic CO affinity of the surface. By choosing appropriate potentials at which water and carbonate binding is minimized, we were able to extract the intrinsic CO affinity of Au and Cu surfaces in an electrochemical environment. We find that the standard enthalpy of CO adsorption to Cu is ~36 kJ mol–1 (0.37 eV) more favorable than the corresponding value for Au at their respective potentials of maximum adsorption. Given the variability of surface structures present under electrochemical conditions, the value is remarkably close to that predicted by theory on close-packed Au and Cu surfaces in UHV (30 kJ mol–
1)4 and on some polycrystalline and low index facets of the two metals measured in UHV (see above discussion). This enthalpic difference explains why CO accumulates on Cu surfaces at negative potentials36 and cannot be displaced by interfacial water. Together, our studies advance the SEIRAS method to allow elucidation the intrinsic thermochemistry of CO adsorption under electrochemical conditions and provide a basis for understanding opposing CO2RR reactivity across materials.
CONCLUSION In this work, we utilize variable temperature in situ infrared spectroelectrochemistry to examine the intrinsic thermody-
namics of CO electrosorption to Au and Cu surfaces under conditions relevant to CO2RR catalysis. Consistent with contem-porary hypotheses that estimate that CO binding is more favourable on Cu than on Au electrocatalysts, we measure that the standard enthalpy of CO adsorption is ~36 kJ mol–1 more favorable on Cu than on Au at their respective potentials of maximum CO adsorption. Our studies show, however, that the CO surface population is not governed by these thermochemical differ-ences alone, but is actually reflective of different CO binding equilibria for Au and Cu under electrochemical conditions. On Au, reversible CO binding is driven by substitution and reorientation of adsorbed water. In contrast, CO binding to Cu requires the reductive displacement of adsorbed carbonate anions. These divergent CO adsorption equilibria on Au and Cu explain their disparate CO surface population and thus CO2RR reactivity: water adsorption drives CO liberation from Au catalysts, impeding further reduction, whereas carbonate desorption drives CO accumulation on Cu, allowing for further reduction to higher order products.
Our observations provide a rational basis for CO2RR electrocatalyst design. First, optimization of the CO affinity, a rec-ognized descriptor for CO2RR catalysis, is insufficient without also considering correlated changes in the binding affinity for solvent and electrolyte species. The ideal catalyst will not only have an optimal CO binding affinity but also display a low affinity for competing solvent and/or electrolyte species in order to display CO2RR catalysis with lowered overpotentials. Thus, the insights provided here introduce additional descriptors that can be used to drive computational investigations of new cata-lyst targets, as has been recently shown for the hydrogen evolution reaction85. Likewise, the experimental design of the elec-trolyte environment can be used to direct catalyst selectivity. By choosing strongly coordinating electrolyte ions, solvents and/or additives that compete effectively for adsorbed CO, one can turn off downstream reduction pathways. Alternatively, by pairing weakly coordinating electrolytes and solvents with appropriate catalysts such as Cu, CO species will accumulate at lower overpotentials, thereby exposing more efficient catalysis for highly reduced hydrocarbons and oxygenates. In aggregate, this study highlights, that at both a theoretical and experimental level, the directed design of efficient CO2RR catalysts requires a revised paradigm that emphasizes the potential-dependent competitive binding of intermediates, electrolyte, and solvent in defining the free-energy profile of CO2-to-fuels catalysis.
METHODS

9
Full experimental details and methods are listed in the SI. Spectra at various CO partial pressures and temperatures, accompa-nying cyclic voltammagrams, Stark tuning slopes, control experiments without CO addition, cell design, peak normalization strategy, adsorption isotherm fitting parameters and fitting errors are contained in the SI.
AUTHOR CONTRIBUTIONS A.W. collected voltammetric and spectroscopic data. J. R. collected voltammetric data. A.W. analyzed the data. A.W. and Y.S. wrote the manuscript.
ACKNOWLEDGMENT We gratefully acknowledge Thejas S. Wesley, Sahr Khan, Michael Pegis, and Daniel Nocera for insightful discussions. This research was supported by the Air Force Office of Scientific Research under AFOSR Award No. FA9550-18-1-0420.
MATERIALS AND CORRESPONDANCE *[email protected]
COMPETING INTRESTS The authors declare no competing interests.
REFERENCES (1) Whipple, D. T.; Kenis, P. J. A. Prospects of CO 2 Utilization via Direct Heterogeneous Electrochemical Reduction. J.
Phys. Chem. Lett. 2010, 1 (24), 3451–3458. (2) Olah, G. A.; Prakash, G. K. S.; Goeppert, A. Anthropogenic Chemical Carbon Cycle for a Sustainable Future. J. Am.
Chem. Soc. 2011, 133 (33), 12881–12898. (3) Kortlever, R.; Peters, I.; Balemans, C.; Kas, R.; Kwon, Y.; Mul, G.; Koper, M. T. M. Palladium-Gold Catalyst for the
Electrochemical Reduction of CO2 to C-1-C-5 Hydrocarbons. Chem. Commun. 2016, 52 (67), 10229–10232. (4) Kuhl, K. P.; Hatsukade, T.; Cave, E. R.; Abram, D. N.; Kibsgaard, J.; Jaramillo, T. F. Electrocatalytic Conversion of
Carbon Dioxide to Methane and Methanol on Transition Metal Surfaces. J. Am. Chem. Soc. 2014, 136 (40), 14107–14113.
(5) Eilert, A.; Cavalca, F.; Roberts, F. S.; Osterwalder, J.; Liu, C.; Favaro, M.; Crumlin, E. J.; Ogasawara, H.; Friebel, D.; Pettersson, L. G. M.; Nilsson, A. Subsurface Oxygen in Oxide-Derived Copper Electrocatalysts for Carbon Dioxide Reduction. J. Phys. Chem. Lett. 2017, 8 (1), 285–290.
(6) Hori, Y.; Kikuchi, K.; Suzuki, S. Production of CO and CH4 in Electrochemical Reduction of CO2 at Metal Electrodes in Aqueous Hydrogencarbonate Solution. Chem. Lett. 1985, No. 11, 1695–1698.
(7) Peterson, A. A.; Nørskov, J. K. Activity Descriptors for CO 2 Electroreduction to Methane on Transition-Metal Catalysts. J. Phys. Chem. Lett. 2012, 3 (2), 251–258.
(8) Gattrell, M.; Gupta, N.; Co, A. A Review of the Aqueous Electrochemical Reduction of CO2 to Hydrocarbons at Copper. J. Electroanal. Chem. 2006, 594 (1), 1–19.
(9) Kortlever, R.; Shen, J.; Schouten, K. J. P.; Calle-Vallejo, F.; Koper, M. T. M. Catalysts and Reaction Pathways for the Electrochemical Reduction of Carbon Dioxide. J. Phys. Chem. Lett. 2015, 6 (20), 4073–4082.
(10) Zhu, W.; Zhang, Y.-J.; Zhang, H.; Lv, H.; Li, Q.; Michalsky, R.; Peterson, A. A.; Sun, S. Active and Selective Conversion of CO2 to CO on Ultrathin Au Nanowires. J. Am. Chem. Soc. 2014, 136 (46), 16132–16135.
(11) Mistry, H.; Reske, R.; Zeng, Z.; Zhao, Z.-J.; Greeley, J.; Strasser, P.; Cuenya, B. R. Exceptional Size-Dependent Activity Enhancement in the Electroreduction of CO2 over Au Nanoparticles. J. Am. Chem. Soc. 2014, 136 (47), 16473–16476.
(12) Zhu, W.; Michalsky, R.; Metin, O.; Lv, H.; Guo, S.; Wright, C. J.; Sun, X.; Peterson, A. A.; Sun, S. Monodisperse Au Nanoparticles for Selective Electrocatalytic Reduction of CO2 to CO. J. Am. Chem. Soc. 2013, 135 (45), 16833–16836.
(13) Liu, M.; Pang, Y.; Zhang, B.; De Luna, P.; Voznyy, O.; Xu, J.; Zheng, X.; Dinh, C. T.; Fan, F.; Cao, C.; De Arquer, F. P. G.; Safaei, T. S.; Mepham, A.; Klinkova, A.; Kumacheva, E.; Filleter, T.; Sinton, D.; Kelley, S. O.; Sargent, E. H. Enhanced Electrocatalytic CO2reduction via Field-Induced Reagent Concentration. Nature 2016, 537 (7620), 382–386.
(14) Hansen, H. A.; Varley, J. B.; Peterson, A. A.; Nørskov, J. K. Understanding Trends in the Electrocatalytic Activity of Metals and Enzymes for CO 2 Reduction to CO. J. Phys. Chem. Lett. 2013, 4 (3), 388–392.
(15) Shi, C.; Hansen, H. A.; Lausche, A. C.; Nørskov, J. K. Trends in Electrochemical CO2 Reduction Activity for Open and Close-Packed Metal Surfaces. Phys. Chem. Chem. Phys. 2014, 16 (10), 4720–4727.

10
(16) Kim, D.; Resasco, J.; Yu, Y.; Asiri, A. M.; Yang, P. Synergistic Geometric and Electronic Effects for Electrochemical Reduction of Carbon Dioxide Using Gold-Copper Bimetallic Nanoparticles. Nat. Commun. 2014, 5, 4948.
(17) Verdaguer-Casadevall, A.; Li, C. W.; Johansson, T. P.; Scott, S. B.; Joseph, M.; Kumar, M.; Stephens, I. E. L.; Kanan, M. W.; Chorkendorff, I. Probing the Active Surface Sites for CO Reduction on Oxide- Derived Copper Electrocatalysts. J. Am. Chem. Soc. 2015, 137, 9808–9811.
(18) Asadi, M.; Kim, K.; Liu, C.; Addepalli, A. V.; Abbasi, P.; Yasaei, P.; Phillips, P.; Behranginia, A.; Cerrato, J. M.; Haasch, R.; Zapol, P.; Kumar, B.; Klie, R. F.; Abiade, J.; Curtiss, L. A.; Salehi-Khojin, A. Nanostructured Transition Metal Dichalcogenide Electrocatalysts for CO2 Reduction in Ionic Liquid. Science (80-. ). 2016, 353 (6298), 467–470.
(19) Nørskov, J. K.; Bligaard, T.; Logadottir, A.; Kitchin, J. R.; Chen, J. G.; Pandelov, S.; Stimming, U. Trends in the Exchange Current for Hydrogen Evolution. J. Electrochem. Soc. 2005, 152, J23.
(20) Huang, Y.; Handoko, A. D.; Hirunsit, P.; Yeo, B. S. Electrochemical Reduction of CO2 Using Copper Single-Crystal Surfaces: Effects of CO∗ Coverage on the Selective Formation of Ethylene. ACS Catal. 2017, 7 (3), 1749–1756.
(21) Gileadi, E. Electrosorption. In Physical Electrochemistry, Fundamentals, Techniques and Applications; Wiley-VCH: Weinheim, 2011; pp 175–194.
(22) Bockris, J. O.; Devanathan, M. A. V.; Muller, K. On the Structure of Charged Interfaces. Proc. R. Soc. A Math. Phys. Eng. Sci. 1963, 274 (1356), 55–79.
(23) Bockris, J. O.; Reddy, A.; Gambou-Aldeco, M. E. The Electrified Interface. In Modern Electrochemistry 2A Fundamentals of Electrodics; Kluwer Academic/Plenum Publishers: New York, 2002; pp 933–984.
(24) Gileadi, E. The Combined Adsorption Isotherm. Electrochim. Acta 1987, 32 (2), 221–229. (25) Gileadi, E. On the Potential Dependence of Electrosorption of Neutral Organic Molecules. J. Electroanal. Chem. 1971,
30 (1), 123–128. (26) Bockris, J. O.; Jeng, K. T. In-Situ Studies of Adsorption of Organic Compounds on Platinum Electrodes. J. Electroanal.
Chem. 1992, 330 (1–2), 541–581. (27) Blomgren, E.; Bockris, J. O. M.; Jesch, C. The Adsorption of Butyl, Phenyl and Naphthyl Compounds at the Interface
Mercury-Aqueous Acid Solution. J. Phys. Chem. 1961, 65 (11), 2000–2010. (28) Heiland, W.; Gileadi, E.; Bockris, J. O. M. Kinetic and Thermodynamic Aspects of the Electrosorption of Benzene on
Platinum Electrodes. J. Phys. Chem. 1966, 70 (4), 1207–1216. (29) Gileadi, E.; Rubin, B. T.; Bockris, J. O. M. Electrosorption of Ethylene on Platinum as a Function of Potential,
Concentration, and Temperature. J. Phys. Chem. 1965, 69 (10), 3335–3345. (30) Osawa, M. Dynamic Processes in Electrochemical Reactions Studied by Surface-Enhanced Infrared Absorption
Spectroscopy(SEIRAS). Bull. Chem. Soc. Jpn. 1997, 70, 2861–2880. (31) Osawa, M. Surface Enhanced Infrared Absorption Spectroscopy. In Handbook of Vibrational Spectroscopy; Chalmers,
J. M., Griffiths, P. R., Eds.; Wiley-VCH: Chichester, UK, 2002; pp 785–800. (32) Osawa, M. In-Situ Surface-Enhanced Infrared Spectroscopy of the Electrode/Solution Interface. In Diffraction and
Spectroscopic Methods in Electrochemistry (Advances in Electrochemical Science and Engineering, Vol.9); Alkire, R. C., Kolb, D. M., Lipkowski, J., Ross, P. N., Eds.; Wiley-VCH: New York, 2006; pp 269–314.
(33) Osawa, M. Surface-Enhanced Infrared Absorption. In Near-Field Optics and Surface Plasmon Polaritons. Topics in Applied Physics; Kawata, S., Ed.; Springer: Berlin, 2001; Vol. 81, pp 163–187.
(34) Samjeské, G.; Komatsu, K.; Osawa, M. Dynamics of CO Oxidation on a Polycrystalline Platinum Electrode: A Time-Resolved Infrared Study. J. Phys. Chem. C 2009, 113, 10222–10228.
(35) Chen, Y.-X.; Ye, S.; Heinen, M.; Jusys, Z.; Osawa, M.; Behm, R. J. Application of in-Situ ATR-FTIR Spectroscopy for the Understanding of Complex Reaction Mechanism and Kinetics: Formic Acid Oxidation on a Pt Electrode at Elevated Temperatures. J. Phys. Chem. B 2006, 110, 9534–9544.
(36) Wuttig, A.; Liu, C.; Peng, Q.; Yaguchi, M.; Hendon, C. H.; Motobayashi, K.; Ye, S.; Osawa, M.; Surendranath, Y. Tracking a Common Surface-Bound Intermediate during CO 2 -to-Fuels Catalysis. ACS Cent. Sci. 2016, 2 (8), 522–528.
(37) Wuttig, A.; Yaguchi, M.; Motobayashi, K.; Osawa, M.; Surendranath, Y. Inhibited Proton Transfer Enhances Au-Catalyzed CO 2 -to-Fuels Selectivity. Proc. Natl. Acad. Sci. 2016, 113 (32), E4585–E4593.
(38) Gunathunge, C. M.; Li, X.; Li, J.; Hicks, R. P.; Ovalle, V. J.; Waegele, M. M. Spectroscopic Observation of Reversible Surface Reconstruction of Copper Electrodes under CO2 Reduction. J. Phys. Chem. C 2017, 121 (22), 12337–12344.
(39) Dunwell, M.; Lu, Q.; Heyes, J. M.; Rosen, J.; Chen, J. G.; Yan, Y.; Jiao, F.; Xu, B. The Central Role of Bicarbonate in the Electrochemical Reduction of Carbon Dioxide on Gold. J. Am. Chem. Soc. 2017, 139, 3774–3783.
(40) Heyes, J.; Dunwell, M.; Xu, B. CO2 Reduction on Cu at Low Overpotentials with Surface-Enhanced in Situ Spectroscopy. J. Phys. Chem. C 2016, 120 (31), 17334–17341.
(41) Zhu, S.; Jiang, B.; Cai, W. Bin; Shao, M. Direct Observation on Reaction Intermediates and the Role of Bicarbonate Anions in CO2 Electrochemical Reduction Reaction on Cu Surfaces. J. Am. Chem. Soc. 2017, 139 (44), 15664–15667.
(42) Hori, Y.; Murata, A. 1985; Ira; Kikuchi, K.; Suzuki, S. Electrochemical Reduction of Carbon Dioxides to Carbon Monoxide at a Gold Electrode in Aqueous Potassium Hydrogen Carbonate. J. Chem. Soc. Chem. Commun. 1987, No. 10, 728–729.
(43) Hori, Y.; Murata, A.; Takahashi, R. Formation of Hydrocarbons in the Electrochemical Reduction of Carbon Dioxide at a Copper Electrode in Aqueous Solution. J. Chem. Soc. Faraday Trans. 1 Phys. Chem. Condens. Phases 1989, 85

11
(8), 2309–2326. (44) Bode, D. D.; Andersen, T. N.; Eyring, H. Anion and pH Effects on the Potentials of Zero Charge of Gold and Silver
Electrodes. J. Phys. Chem. 1967, 71 (4), 792–797. (45) Ataka, K.; Yotsuyanagi, T.; Osawa, M. Potential-Dependent Reorientation of Water Molecules at an
Electrode/Electrolyte Interface Studied by Surface-Enhanced Infrared Absorption Spectroscopy. J. Phys. Chem. 1996, 100, 10664–10672.
(46) Ataka, K.; Osawa, M. In Situ Infrared Study of Water−Sulfate Coadsorption on Gold(111) in Sulfuric Acid Solutions. Langmuir 1998, 14 (4), 951–959.
(47) Osawa, M.; Tsushima, M.; Mogami, H.; Samjeské, G.; Yamakata, A. Structure of Water at the Electrified Platinum−Water Interface: A Study by Surface-Enhanced Infrared Absorption Spectroscopy. J. Phys. Chem. C 2008, 112, 4248–4256.
(48) Berná, A.; Rodes, A.; Feliu, J. M.; Illas, F.; Gil, A.; Clotet, A.; Ricart, J. M. Structural and Spectroelectrochemical Study of Carbonate and Bicarbonate Adsorbed on Pt(111) and Pd/Pt(111) Electrodes. J. Phys. Chem. B 2004, 108, 17928–17939.
(49) Arihara, K.; Kitamura, F.; Ohsaka, T.; Tokuda, K. Characterization of the Adsorption State of Carbonate Ions at the Au(111) Electrode Surface Using in Situ IRAS. J. Electroanal. Chem. 2001, 510 (1–2), 128–135.
(50) Krishnamurty, K. V.; Harris, G. M.; Sastri, V. S. The Chemistry of the Metal Carbonato Complexes. Chem. Rev. 1970, 70 (2), 171–197.
(51) Fujita, J.; Martell, A. E.; Nakamoto, K. Infrared Spectra of Metal Chelate Compounds. VIII. Infrared Spectra of Co (III) Carbonato Complexes. J. Chem. Phys. 1962, 36 (2), 339–345.
(52) Wang, H.-F.; Yan, Y.-G.; Huo, S.-J.; Cai, W.-B.; Xu, Q.-J.; Osawa, M. Seeded Growth Fabrication of Cu-on-Si Electrodes for in Situ ATR-SEIRAS Applications. Electrochim. Acta 2007, 52, 5950–5957.
(53) Pritchard, J.; Catterick, T.; Gupta, R. K. Infrared Spectroscopy of Chemisorbed Carbon Monoxide on Copper. Surf. Sci. 1975, 53 (1), 1–20.
(54) Salimon, J.; Hernández-Romero, R. M.; Kalaji, M. The Dynamics of the Conversion of Linear to Bridge Bonded CO on Cu. J. Electroanal. Chem. 2002, 538–539, 99–108.
(55) Gunathunge, C. M.; Ovalle, V. J.; Li, Y.; Janik, M. J.; Waegele, M. M. Existence of an Electrochemically Inert CO Population on Cu Electrodes in Alkaline pH. ACS Catal. 2018, 8 (8), 7507–7516.
(56) Greenaway, A. M.; Dasgupta, T. P.; Koshy, K. C.; Sadler, G. G. A Correlation between Infrared Stretching Mode Absorptions and Structural Angular Distortions for the Carbonato Ligand in a Wide Variety of Complexes. Spectrochim. Acta Part A Mol. Spectrosc. 1986, 42 (9), 949–954.
(57) Hori, Y.; Murata, A.; Tsukamoto, T.; Wakebe, H.; Koga, O.; Yamazaki, H. Adsorption of Carbon Monoxide at a Copper Electrode Accompanied by Electron Transfer Observed by Voltammetry and IR Spectroscopy. Electrochim. Acta 1994, 39, 2495–2500.
(58) Hori, Y.; Koga, O.; Yamazaki, H.; Matsuo, T. Infrared Spectroscopy of Adsorbed CO and Intermediate Species in Electrochemical Reduction of CO2 to Hydrocarbons on a Cu Electrode. Electrochim. Acta 1995, 40 (16), 2617–2622.
(59) Koga, O.; Watanabe, Y.; Tanizaki, M.; Hori, Y. Specific Adsorption of Anions on a Copper (100) Single Crystal Electrode Studied by Charge Displacement by CO Adsorption and Infrared Spectroscopy. Electrochim. Acta 2001, 46 (20–21), 3083–3090.
(60) Hori, Y.; Koga, O.; Watanabe, Y.; Matsuo, T. FTIR Measurements of Charge Displacement Adsorption of CO on Poly- and Single Crystal (100) of Cu Electrodes. Electrochim. Acta 1998, 44 (8–9), 1389–1395.
(61) Hori, Y.; Wakebe, H.; Tsukamoto, T.; Koga, O. Adsorption of CO Accompanied with Simultaneous Charge Transfer on Copper Single Crystal Electrodes Related with Electrochemical Reduction of CO2 to Hydrocarbons. Surf. Sci. 1995, 335 (C), 258–263.
(62) Koga, O.; Matsuo, T.; Hoshi, N.; Hori, Y. Charge Displacement Adsorption of Carbon Monoxide on [110] Zone Copper Single Crystal Electrodes in Relation with PZC. Electrochim. Acta 1998, 44 (6–7), 903–907.
(63) Wu, C.-X.; Lin, H.; Chen, Y.-J.; Li, W.-X.; Sun, S.-G. Abnormal IR Effects of Pt Nanostructured Surfaces upon CO Chemisorption due to Interaction and Electron-Hole Damping. J. Chem. Phys. 2004, 121, 1553–1556.
(64) Su, Z.-F.; Sun, S.-G.; Wu, C.-X.; Cai, Z.-P. Study of Anomalous Infrared Properties of Nanomaterials through Effective Medium Theory. J. Chem. Phys. 2008, 129, 44707-1–6.
(65) Krauth, O.; Fahsold, G.; Magg, N.; Pucci, A. Anomalous Infrared Transmission of Adsorbates on Ultrathin Metal Films: Fano Effect near the Percolation Threshold. J. Chem. Phys. 2000, 113, 6330–6333.
(66) Wang, H. C.; Sun, S. G.; Yan, J. W.; Yang, H. Z.; Zhou, Z. Y. In Situ STM Studies of Electrochemical Growth of Nanostructured Ni Films and Their Anomalous IR Properties. J. Phys. Chem. B 2005, 109, 4309–4316.
(67) Priebe, A.; Sinther, M.; Fahsold, G.; Pucci, A. The Correlation between Film Thickness and Adsorbate Line Shape in Surface Enhanced Infrared Absorption. J. Chem. Phys. 2003, 119, 4887–4890.
(68) Sander, R. Compilation of Henry’s Law Constants (Version 4.0) for Water as Solvent. Atmos. Chem. Phys. 2015, 15 (8), 4399–4981.
(69) Bard, A. J.; Parsons, R.; Jordan, J. Standard Potentials in Aqueous Solution; IUPAC-Marcel Dekker Inc.: New York, 1985.
(70) Hamelin, A.; Stoicoviciu, L.; Silva, F. The Temperature Dependence of the Double-Layer Properties of Gold Faces in

12
Perchloric Acid Solutions. Part I. the (210) Gold Face. J. Electroanal. Chem. 1987, 229 (1–2), 107–124. (71) Aloisi, G.; Guidelli, R. A Three-Dimensional Model for Water Molecules against a Charged Interface. J. Electroanal.
Chem. 1989, 260 (2), 259–267. (72) Sosa, M. I.; Posadas, D.; Arvía, A. J. Temperature Dependence of the Potential of Zero Charge at the
Mercury/potassium Iodide Aqueous Solution Interface. J. Electroanal. Chem. Interfacial Electrochem. 1981, 130 (10), 323–326.
(73) Silva, F.; Sottomayor, M. J.; Hamelin, A. The Temperature Coefficient of the Potential of Zero Charge of the Gold Single-Crystal Electrode/aqueous Solution Interface. Possible Relevance to Gold-Water Interactions. J. Electroanal. Chem. 1990, 294 (1–2), 239–251.
(74) Liu, Y. Is the Free Energy Change of Adsorption Correctly Calculated? J. Chem. Eng. Data 2009, 54 (7), 1981–1985. (75) Conway, B. E.; Angerstein-Kozlowska, H.; Dhar, H. P. On Selection of Standard States in Adsorption Isotherms.
Electrochim. Acta 1974, 19 (8), 455–460. (76) Meier, D. C.; Bukhtiyarov, V.; Goodman, D. W. CO Adsorption on Au(110)−(1 × 2): An IRAS Investigation. J. Phys.
Chem. B 2003, 107 (46), 12668–12671. (77) McElhiney, G.; Pritchard, J. The Adsorption of Xe and CO on Au (100). Surf. Sci. 1976, 60, 397–410. (78) Kottke, M. L.; Greenler, R. G.; Tompkins, H. G. An Infrared Spectroscopic Study of Carbon Monoxide Adsorbed on
Polycrystalline Gold Using the Reflection-Absorption Technique. Surf. Sci. 1972, 32 (1), 231–243. (79) Kim, Y.-G.; Baricuatro, J. H.; Javier, A.; Gregoire, J. M.; Soriaga, M. P. The Evolution of the Polycrystalline Copper
Surface, First to Cu(111) and Then to Cu(100), at a Fixed CO₂ RR Potential: A Study by Operando EC-STM. Langmuir 2014, 30 (50), 15053–15056.
(80) Truong, C. M.; Rodriguez, J.; Goodman, D. W. CO Adsorption Isotherms on Cu(100) at Elevated Pressures and Temperatures Using Infrared Reflection Absorption Spectroscopy. Surf. Sci. 1992, 271 (3), L385–L391.
(81) Ryberg, R. Carbon Monoxide Adsorbed on Cu(100) Studied by Infrared Spectroscopy. Surf. Sci. 1982, 114 (2–3), 627–641.
(82) Horn, K.; Pritchard, J. Infrared Spectrum of CO Chemisorbed on Cu(100). Surf. Sci. 1976, 55 (2), 701–704. (83) Torrent, J.; Sanz, F. The Standard Adsorption Gibbs Energy from Several Adsorption Isotherms. J. Electroanal. Chem.
1990, 286 (1–2), 207–215. (84) Horn, K.; Hussain, M.; Pritchard, J. The Adsorption of CO on Cu(110). Surf. Sci. 1977, 63 (C), 244–253. (85) Cheng, T.; Wang, L.; Merinov, B. V.; Goddard, W. A. Explanation of Dramatic pH-Dependence of Hydrogen Binding
on Noble Metal Electrode: Greatly Weakened Water Adsorption at High pH. J. Am. Chem. Soc. 2018, 140 (25), 7787–7790.

download fileview on ChemRxivCOThermo_Manuscript_Final_Final.pdf (1.18 MiB)

S1
Supporting Information
Electrolyte Competition Controls Surface Binding of CO Intermediates to CO2 Reduction Catalysts
Anna Wuttig,1,2 Jaeyune Ryu,1 and Yogesh Surendranath*1
1Department of Chemistry, Massachusetts Institute of Technology, Cambridge, Massachusetts,
United States 2Department of Chemistry, University of California, Berkeley, California, United States

S2
Index Page
Experimental Methods S4-7
Description of Other Observed CO Bonding Geometries S8-9
Normalization Methods S10-11
Description of Langmuir and Temkin Fits S12
Fig. S1. Cyclic voltammogram and SEIRA spectra collected on Au films in Ar-saturated 0.1 M sodium bicarbonate, pH 9.2, 24 ̊C with a –1.00 V vs SHE starting potential.
S13
Fig. S2. Cyclic voltammogram, SEIRA spectra, and integrated CO band intensities collected on Au films in CO-saturated 0.1 M sodium bicarbonate, pH 9.2, 24 ̊C with a 0.60 V vs SHE starting potential.
S13
Fig. S3. Stark tuning slopes for adsorbed CO species observed on Au films in CO-saturated 0.1 M sodium bicarbonate, pH 9.2, 24 ̊C. S14
Fig. S4. Cyclic voltammograms and SEIRA spectra collected on Au films at different partial pressures of CO in 0.1 M sodium bicarbonate, pH 9.2, 24 ̊C with a –1.00 V vs SHE starting potential.
S15
Fig. S5. Corresponding integrated band intensities for adsorbed COatop, CObridge, and COhollow species on Au films for data reported in Figure 1. S16
Fig. S6. Cyclic voltammogram and SEIRA spectra collected on Au films in CO-saturated 0.1 M sodium bicarbonate, pH 9.2, 24 ̊C, with and without CO2 with a –1.00 V vs SHE starting potential and Pt counter.
S16
Fig. S7. Comparison of surface terminations of Au films using Pb UPD. S17
Fig. S8. Cyclic voltammogram and SEIRA spectra collected on Cu films in Ar-saturated 0.1 M sodium bicarbonate, pH 9.2, 24 ̊C with a –0.56 V vs SHE starting potential.
S17
Fig. S9. Stark tuning slopes for adsorbed CO species observed on Cu films in CO-saturated 0.1 M sodium bicarbonate, pH 9.2, 24 ̊C. S18
Fig. S10. Corresponding integrated band intensities for adsorbed COatop and CObridge, species on Cu films for data reported in Figure 4. S18
Fig. S11. Cyclic voltammograms and SEIRA spectra collected on Cu films at different partial pressures of CO in 0.1 M sodium bicarbonate, pH 9.2, 24 ̊C with a –0.56 V vs SHE starting potential.
S19
Fig. S12. Experimental setup for temperature-dependent SEIRAS data collection. S20
S3
Fig. S13. Temperature-dependent correction of Ag/AgCl reference electrodes. S20
Fig. S14. Temperature-dependent correction of CO solubility. S21
Fig. S15. Temperature-dependence of integrated COatop band intensities on Au films in CO-saturated 0.1 M sodium bicarbonate, pH 9.2 at various CO partial pressures. S22
Fig. S16. Cyclic voltammograms and SEIRA spectra collected on Au films in CO2-saturated 0.1 M sodium bicarbonate, pH 9.2, 24 ̊C with a 0.60 V vs SHE starting potential.
S23
Fig. S17. Langmuir Adsorption isotherms for COatop on Au assuming different values for the extinction coefficient. S24
Table S1. Fitting parameters for Langmuir adsorption isotherm of COatop on Au films at Ep assuming the extinction coefficient is the average value, 0.2 nmol–1 cm2
. S24
Table S2. Fitting parameters for Langmuir adsorption isotherm of COatop on Au films at Ep assuming the extinction coefficient is the low limit, 0.1 nmol–1 cm2
. S24
Table S3. Fitting parameters for Langmuir adsorption isotherm of COatop on Au films at Ep assuming the extinction coefficient is the high limit, 0.3 nmol–1 cm2
. S25
Fig. S18. COatop band shape on Au films in CO-saturated 0.1 M sodium bicarbonate, pH 9.2, 24 ̊C at various CO partial pressures. S25
Fig. S19. Temperature-dependence of integrated COatop band intensities on Cu films in CO-saturated 0.1 M sodium bicarbonate, pH 9.2 at various CO partial pressures. S26
Fig. S20. COatop band shape on Cu films in CO-saturated 0.1 M sodium bicarbonate, pH 9.2, 24 ̊C at various CO partial pressures. S26
Table S4. Fitting parameters for Tempkin adsorption isotherm of COatop on Cu films. S27
References S28-S29

S4
Experimental Methods
Materials. Na2CO3 (≥ 99.9999 % TraceSELECT®), 2-2� bipyridine (≥ 99 %), Na[AuCl4] •2H2O (99.0 %), NH4Cl (99.5 %, ACS regent), Na2SO3 (98.0 %, BioUltra, anhydrous), Na2S2O3 (98.0 %, anhydrous), NaOH (semiconductor grade, 99.99 %), HF (48% aqueous solution, ACS reagent), NaClO4•H2O (99.99%), and NH4F (40% aqueous solution, semiconductor grade) were purchased from Sigma Aldrich. Sulfuric acid (OmniTrace®) and Na2EDTA (OmniPur®, Calbiochem) were purchased from EMD Millipore. CO2 (Ultra High Purity), Ar (Ultra High Purity), and CO (Ultra High Purity) were purchased from Airgas. CuSO4•5H2O (99.999 %) was purchased from Strem Chemicals. HCHO (37% assay, stabilized with 7-8% methanol) was purchased from Alfa Aesar. All chemicals were used as received without further purification. Millipore Type 1 water (18.2 MΩ) was used throughout the study. In all cases, electrolytes were purified using regenerated Chelex100 (Bio-Rad), according to the manufacturer’s protocol with slight modifications.1 Bicarbonate electrolytes (0.1 M NaHCO3) were prepared by sparging CO2 through a purified Na2CO3 solution with a concentration half that of the desired final bicarbonate concentration. Preparation of Au films for Surface Enhanced Infrared Spectroscopy (SEIRAS) Analyses. Au films were prepared on undoped Si hemicylinders (Pier Optics) using the “double deposition method” as previously detailed2 with the following modification. After the first Au layer deposition on a freshly cleaned Si surface, instead of exposing the Au to 40% NH4F, the initial Au layer was directly dissolved in yellow-colored aqua regia for ~11s until the gold color on the Si surface was no longer visible by eye. Afterwards, the Si surface containing residual Au seeds was reimmersed into the heated Au deposition bath as described previously.2 We found that this modification led to the synthesis of reproducible and uniform Au films in our hands. Data collected in Figures 1-2, S1-S5, 5 (24 °C and 50 °C), S15 (50 °C), S17 (24 °C and 50 °C), and S18 were prepared on the same Au film. Another Au film, prepared using the same procedure, was used to collect data in Figures 5 (10 °C and 38 °C), S15 (10 °C and 38 °C), and S17 (10 °C and 38 °C). Another Au film, prepared using the same procedure, was used to collect data in Figures S6 and S16. Another Au film, prepared in a similar fashion but on a Si wafer (University Wafers) was connected to a Ti wire and used to collect data in Figure S7b. Preparation of Cu Films for Surface Enhanced Infrared Spectroscopy (SEIRAS) Analyses. SEIRAS-active Cu Films were prepared on undoped Si hemicylinders (Pier Optics) as described previously3 with the following modification. After the freshly cleaned Si surface was immersed in 40% NH4F for ~25 s to create a H-terminated hydrophobic surface, the resulting Si surface was immediately immersed into a ~30 mL MilliQ bath. It was found that if the deposition procedure is conducted inside a fume hood, prolonged exposure of a freshly H-terminated Si surface to air can result in a Cu films with poor adhesion. From the MilliQ bath, the H-terminated Si surface was quickly dried under flowing N2 and then immediately immersed in the Cu seed solution. This solution has been described previously.3 All subsequent steps were unmodified relative to our previous report.3 Data collected in Figures 4, S8-S11, S20, and 6 (24 °C) made use of the same Cu film. Another Cu film, prepared using the same procedure, was used to collect data in Figure 6 (10 °C) and S19 (10 °C). Another Cu film, prepared using the same procedure, was used to collect data in Figure 6 (17 °C) and S19 (17 °C).
Electrochemical Methods. Electrochemical experiments were conducted using a CHI 760E or a Biologic VSP 16-channel potentiostat, a leakless Ag/AgCl electrode (eDAQ), and a high surface area Au mesh (Alfa Aesar, 99.99%) or Pt-mesh (Alfa Aesar, 99.997 %) counter electrode . Ag/AgCl

S5
reference electrodes were stored in Millipore water between measurements and were periodically checked relative to pristine reference electrodes to ensure against potential drift. All experiments were performed at 24±1 ̊C unless otherwise noted. Electrode potentials were converted to the standard hydrogen electrode (SHE) scale using the conversion shown in Figure S13. The uncompensated Ohmic loss (iRu) was measured using the Ru test function in the CHI Electrochemical Workstation Version 14.08 and was roughly ~110 ohms. Current density values are reported relative to the geometric surface area of the exposed working electrode film. The three-compartment spectroelectrochemical cell held ~55 mL of electrolyte. The SEIRAS cell configuration in attenuated reflectance mode4–8 was modified (James Glass Inc.) to: (1) insert a thermometer in an air-tight fashion roughly ~1 cm away from the working electrode; and (2) regulate the temperature of the electrolyte with a surrounding water jacket as shown in Figure S12. We note that similar insulated housing for infrared spectroelectrochemical measurements have been previously reported.9,10 Prior to assembly, the cell was cleaned for at least 1 hour in a concentrated H2SO4:HNO3 mixture, rinsed with Millipore water thoroughly, sonicated for at least 1 hour in Millipore water, and stored in fresh Millipore water prior to all experiments. The Au- or Cu-coated Si hemicylinder was sealed to cell body with a Kalrez vacuum O-ring (i.d.= 15 mm). The counter electrode was housed in a counter compartment separated from the working chamber by a porous glass frit. Unless otherwise stated, experiments on Au films were conducted using a Au counter electrode to eliminate the possibility of adventitious Pt that has been postulated to leak from the counter.11
Surface-Enhanced Infrared Absorption Spectroscopy (SEIRAS). SEIRA spectra were recorded in the Kretschmann attenuated total reflection (ATR) configuration using a Brucker Tensor 27 spectrometer equipped with a HgCdTe (MCT) detector (Ref/2x Gain Setting) and a homemade single-reflection accessory (incident angle of 60˚). The Brucker spectrometer was operated in chromatography mode (20 kHz). Spectra were sequentially acquired with a spectral resolution of 4 cm–1 at every 3.56 s interval. A single beam spectrum (100 scans) collected at the starting potential was used as the reference spectrum. All ATR-SEIRA spectra are reported in absorbance units defined as A=−log (I/I0), where I and I0 stand for the sample and reference single-beam spectra, respectively. Temperature-Dependent SEIRAS Setup. The temperature of the electrolyte was controlled by flowing deionized water through the SEIRAS cell water jacket Figure S12 at controlled temperatures using a Thermo Scientific ARCTIC AC150 A25 bath circulator. The flow rate settings on the circulators were set to the low option. The SEIRAS cell was covered by glass wool for insulation. The temperature in the electrolyte was monitored by reading the thermometer installed ~1 cm away from the SEIRAS-active film. A stable temperature readout was obtained ~35 min after a setpoint was designated on the circulator. The temperature gradient between the thermometer installed in the SEIRAS cell and the positioning of the reference electrode was measured at 10, 24, 38, and 50 °C. No temperature gradient was observed between 24 and 50 °C. A 6 ̊C temperature gradient was measured for the 10 °C point. Pb Underpotential Deposition Measurements. Surface terminations of SEIRAS-active films were analyzed using lead underpotential deposition.12–15 The samples were cycled from −0.2V to −0.7 V vs Ag/AgCl at a scan rate of 50 mV s–1 in N2-saturated 0.1 M NaOH electrolyte containing 0.1 mM Pb(NO3)2 to obtain the data shown in Figure S7. The third CV cycle is reported.
S6
CO Partial Pressure Dependence on Au. The CO partial pressure was maintained by controlling the relative flow rate of two mass flow controllers. 0.13 atm CO was maintained by continuously flowing 17.5 sccm of Ar and 2.5 sccm. 0.25 atm CO was maintained by continuously flowing 15 sccm Ar and 5 sccm CO. 0.50 atm CO was maintained by continuously flowing 10 sccm Ar and 10 sccm CO. Finally, 1.00 atm CO was maintained by continuously flowing 20 sscm CO, and 1.00 atm Ar was maintained by continuously flowing 20 sccm Ar. After the completion of SEIRAS cell assembly, the Au film was cleaned by cycling the Au film in 0.1 M H2SO4 between 0.2 and 1.5 V vs.Ag/AgCl for five cycles without pause. Afterwards, the acid was decanted, and the Au surface was carefully rinsed with MilliQ water. Subsequently, pH 9.2 (bi)carbonate buffer was carefully added to the SEIRAS cell. Ar was then introduced at 20 sccm for ~35 min while the circulator set temperature was initiated and the temperature was allowed to equilibrate in the cell. The Au electrode was polarized from open circuit to 0.4 V vs Ag/AgCl and scanned to –1.2 V vs Ag/AgCl at 10 mV s–1 and held at that potential using the “cell on” feature within the CH Electrochemical Workstation framework. Subsequently, a background scan was initiated at –1.2 V vs Ag/AgCl and SEIRAS data were collected simultaneously as the potential was scanned at 2 mV s–1 from –1.2 V vs Ag/AgCl to –0.16 V vs Ag/AgCl and back. A slow CV scan (2 mV s–1) was employed to ensure that an equilibrium population of COatop was achieved as the applied potential was varied. Afterwards, the electrode was scanned to 0.4 V vs Ag/AgCl and held at that potential while 0.13 atm CO was introduced for ~15 min in order to ensure that CO does not adsorb onto the surface. Then, the potential was scanned back to –1.2 V vs Ag/AgCl and held at the potential while a new background scan was initiated. The SEIRAS data were then collected simultaneously as the potential was scanned at 2 mV s–1 from –1.2 V vs Ag/AgCl to –0.16 V vs Ag/AgCl and back. The same potential sequence was applied in between the other CO partial pressure data collection measurements. After the completion of all CO partial pressure data collection, the Au film was polarized at 0.4 V vs Ag/AgCl while the CO was purged out with Ar. In cases where the Au film remained well-adhered to the SEIRAS substrate, the sample was preserved for subsequent study by immersion in MilliQ water. All SEIRAS experiments were conducted using a Au mesh counter electrode unless otherwise noted.
Impact of CO Electrooxidation on the COatop Band Intensity. We note that CO electrooxidation onset occurs at –0.24 V, which may deplete the CO concentration local to the electroactive surface16,17 and convolute the interpretation of the potential and pressure-dependent intensity of the COatop band. We exclude this convolution by comparing the potential-dependence of the decline in COatop population at potentials more positive than –0.14 V (Figure 1c) to the CO oxidation current (Figure 1a) in the same potential regime. At –0.14 V, the CO oxidation current equals 0.03 mA cm–2 and at potential values more positive than –0.14 V, the CO oxidation current continues to rise while the COatop declines. This observation suggests that local depletion effects of CO due to electrooxidation cannot account for the diminishment in the surface population of COatop at potentials more positive than –0.14 V, since if this were the case, we would expect to observe a diminishment in the CO oxidation current. Dependence of the Dynamics of COatop on the Direction of Scan on Au. In the presence of CO, spectral features are impacted by the initial direction of polarization scan (comparing negative-going, Figure S2, and positive-going scans, Figure 1). Data reported in Figure S2 suggest that the surface is subject to slow reconstruction under negative potential bias when data collection is initiated at 0.60 V with a negative-going scan. To eliminate this convoluting factor and to obtain spectra most reflective of the surface structure under the reductive conditions required for steady

S7
state CO2RR catalysis, we have deliberately collected all spectra following initial polarization at –1.00 V with subsequent scanning in the positive direction.
CO Partial Pressure Dependence on Cu. The CO partial pressure was maintained by controlling the relative flow rate of two mass flow controllers. 0.13 atm CO was maintained by continuously flowing 17.5 sccm of Ar and 2.5 sccm. 0.25 atm CO was maintained by continuously flowing 15 sccm Ar and 5 sccm CO. 0.50 atm CO was maintained by continuously flowing 10 sccm Ar and 10 sccm CO. Finally, 1.00 atm CO was maintained by continuously flowing 20 sscm CO, and 1.00 atm Ar was maintained by continuously flowing 20 sccm Ar. Following the completion of SEIRAS cell assembly, the pH 9.2 (bi)carbonate buffer was carefully added to the SEIRAS cell. Ar was then introduced at 20 sccm for ~35 min while the circulator set temperature was initiated and the temperature was allowed to equilibrate in the cell. The Cu electrode was polarized from open circuit to –0.9 V vs Ag/AgCl and back to open circuit at 20 mV s–1 to clean the Cu surface. The Cu electrode was then scanned from open circuit to –0.75 V at 10 mV s–1 and held at that potential using the “cell on” feature within the CH Electrochemical Workstation framework. Subsequently, a background scan was initiated at –0.75 V vs Ag/AgCl and SEIRAS data were collected simultaneously as the potential was scanned at 2 mV s–1 from –0.75 V vs Ag/AgCl to –1.25 V vs Ag/AgCl and back. A slow CV scan (2 mV s–1) was employed to ensure that an equilibrium population of COatop was achieved as the applied potential was varied. The electrode potential was held at –0.75 V vs Ag/AgCl while 0.13 atm CO was introduced for ~15 min in order to ensure that CO does not adsorb onto the surface and the Cu does not delaminate. A new background trace was then initiated at –0.75 V vs Ag/AgCl, and the SEIRAS data were collected simultaneously as the potential was scanned at 2 mV s–1 from –0.75 V vs Ag/AgCl to –1.25 V and back. The same potential sequence was applied in between the other CO partial pressure data collection measurements. After the completion of all CO partial pressure data collection, the Cu film was polarized at 0.00 V vs Ag/AgCl while the CO was purged out with Ar. This positive polarization caused simultaneously film delamination. All SEIRAS experiments on Cu surfaces were conducted using a Pt mesh counter electrode. Voltammetric Experiments on Cu. Charge displacement redox features were recorded by voltammetry of polycrystalline Cu electrodes. Prior to use, Cu foils (Alfa Aesar, 99.999%) were electropolished for 5 min at 2 V vs a Ti counter in 85% phosphoric acid. The electrode was rinsed with MilliQ several times, and then introduced into pH 9.2 (bi)carbonate electrolytes of varying concentration in the presence of excess 0.5 M NaClO4. For each concentration, 0.5 M NaClO4 was used to preserve solution conductivity and to rule out diffuse double layer effects. Experiments were conducted at ambient temperature and pressure. The first cyclic voltammograms were initiated at open circuit, and scanning to –1.25 V revealed the reduction of a surface oxide layer. Subsequent scans were initiated at –0.6 V. Cu foils were freshly cleaned prior to each subsequent measurement at varying (bi)carbonate electrolyte strength.

S8
Discussion of Spectroscopic Features for Irreversibly Adsorbed CO Irreversible CO Binding Modes on Au. We observe two additional CO features in SEIRA spectra, which exhibit irreversibility with respect to changes in applied potential. First, we observe a second CO band at 1933 cm–1, which appears at –0.92 V and remains at a roughly constant intensity value as the potential is swept more positive (Figure S5b). This band exhibits a 125 cm–
1 V–1 of Stark tuning slope, Figure S3b. The position and Stark tuning slope of this band are slightly offset from values analyzed during scans initiated at 0.60 V (Figures S2 and S3e) because in the forward scan initiated at –1.00 V, a significant population of this species is already observed. Both the Stark tuning slope and the band position of this feature are in line with our previous assignment18 of bridge-bonded CO on Au (CObridge). While the weakness of the CObridge peak impedes precise integration of this band, the reverse-going (Figure S5, blue) trace displays increased band intensity at the most negative potentials, pointing to irreversibility with respect to changes in applied potential. Second, we observed a third CO band at 1879 cm–1. This band appears beginning at –0.99 V and increases in intensity as the potential is swept more positively, reaching a saturation value at–0.41 V (Figure S5c). This peak exhibits a 65 cm–1 V–1 of Stark tuning slope, Figure S3c. Similar to CObridge, the position, shape, and Stark tuning slope of this band are slightly offset from values analyzed during scans initiated at 0.60 V (Figures S2 and S3f) because in the forward scan initiated at –1.00 V, a significant population of this species is already observed. This peak is attributed to a CO bound to 3-fold hollow sites (COhollow). The observed separation of 165-250 cm–1 (Figures S2 and S3d-f, see below) between COatop and COhollow is in line with both observed19 and calculated20,21 frequency separations between these two binding motifs on various Au facets. On the return scan to more negative potentials, COhollow population decreases more gradually (Figure S5c, blue), pointing to irreversibly with respect to changes in applied potential. Together, the data indicate that Au surfaces bind CO in three configurations, and only COatop is reversible with respect to changes in applied potential. Thus, the thermodynamic analyses in this study focus on the reversible COatop species. We note that the relative band intensities of COhollow, CObridge, and COatop differ slightly from that observed previously by our group. In our earlier report,18 we did not observe a clear peak for COhollow; the spectra were instead dominated by peaks for COatop and CObridge. These spectral changes were observed regardless of the composition of the counter electrode (Au, Figure S4 (e & f) or Pt, Figure S6 (a & b)). Therefore, we do not attribute these changes to the surface contamination of the Au film surface by adventitious deposition of metal ions from the counter electrode.11 In addition, similar spectral differences were obtained regardless of the pH of the electrolyte and the intentional addition of CO2, Figure S6, suggesting that these changes also do not result from differences in the pH. These results suggest that spectral variation could result from changes in the film preparation and structure (see above for synthesis procedure) that appear to lead to an enrichment in Au(110) facets. This facet enrichment is corroborated by lead under-potential deposition measurements (Figure S7). Indeed, Au(110) surfaces are known to display COhollow, CObridge, and COatop in intensity ratios comparable to what we observe.19 Importantly, the film preparation conditions used here reproducibly generate these spectra irrespective of the counter electrode and pH.
Irreversible CO Binding Modes on Cu. Upon polarization to –0.68 V, we also observe a distinct second CO band centered at 1827 cm–1. This feature exhibit a 28 cm–1 V–1 Stark tuning slope (Figure S9b) and increases in band intensity as the potential is swept more negative until it reaches a maximum value at –0.94 V (Figure S10b). On the return trace, this band does not decline to the baseline, indicating that, in contrast to COatop band, this peak is irreversible with respect to changes in applied potential. The ~216 cm–1 red shift of this feature relative to the main COatop band is

S9
consistent with the 149 to 248 cm–1 red shift between linear and bridge-bonded CO on Cu observed experimentally and computationally.22–24 We, therefore, assign this band to bridge bonded, CObridge, species.

S10
Normalization Methods Normalization of Integrated Band Intensities Across Different Au Film Preparations. CO band intensities between differently prepared Au films were compared using the following normalization strategy. CO partial pressure-dependent data were collected on the same Au film (film A) for the 24 °C and 50 °C data. A different Au film, film B, prepared by an identical method, was used to collect the CO partial pressure-dependent data at 10 °C and 38 °C. Following the data collection, film B was used to collect 1 atm CO-saturated data at 24 ̊C. The integrated band intensity for COatop at Ep for film B in 1 atm CO-saturated 0.1 M (bi)carbonate electrolyte at 24 °C was 1.6 times larger than the same experiment collected on film A. Therefore, integrated band intensities for COatop for data collected on film A were multiplied by 1.6.
Estimation of extinction coefficient for COatop on Au. In order to translate the observed, normalized, COatop band intensity into COatop surface coverage, θCOatop, we must first estimate an extinction coefficient (ε) for COatop on Au. We estimated this value by first using the previously determined voltammetric stripping charge associated with the two-electron oxidation of irreversibly bound CObridge and COhollow species to CO2.18 This integrated charge provides a quantitative measure of the surface concentration of these irreversible adsorbed CO species, 0.4 nmol cm–2. Importantly, this charge integration was performed in the absence of CO to avoid convolution from oxidation of solution CO. Thus, we recollected SEIRAS data on a Au films synthesized using the method described above under CO2-saturated conditions (Figure S16 f-i) and divided the integrated band intensity (0.05 au) for irreversible bonded COhollow (Figure S16 i) by 0.4 nmol cm–2 to estimate ε. The ε value we obtain is 0.13 nmol–1 cm2. This same film under CO saturated conditions displays CO band intensities that 1.6 and 2.6 fold smaller than the films A (0.08 au) and B (0.13 au), respectively. Thus, to account for the variability in CO band intensities across different film preparations (see above) we conservatively estimate an average value of ε for COhollow as 0.2±0.1 nmol–1 cm2, assuming that the surface concentration of the irreversible adsorbed CO species are similar in all cases (~0.4 nmol cm–2). We account for this variability in the error analysis of the obtained enthalpy and entropy values (see below). Based on literature precedent of CO adsorption on Pt(111), where ε was found to be roughly independent of the bonding geometry of the adsorbed CO and NO,25,26 we assume that the ε for COatop equals that other CO binding modes on Au.
Calculation of Surface Coverage on Au. In order to translate integrated COatop band intensities into surface coverages, θCOatop, we applied the following equation:
θCOatop = (Intatop/ ε)(1/ Γmax-CO) where Intatop is the integrated band intensity for atop CO under any given set of conditions, ε is the estimated extinction coefficient (see above), and Γmax-CO is given by the total reported monolayer coverage of CO, irrespective of CO binding mode, (1.8 nmol cm–2).
19 For the Langmuir fits shown in Figure 5, we used the average ε value of 0.2 nmol–1 cm2. To account for the substantial error in the ε value, we also show Langmuir fits using ε values of 0.1 (Figure S17a) and 0.3 (Figure S17b) nmol–1 cm2. For all these calculations, we assume that the ε value is independent of temperature. Normalization of Integrated Band Intensities and Calculation of CO Surface Coverage on Cu. CO band intensities between different Cu film preparations were compared using the following normalization strategy. CO partial pressure-dependent data were collected on different Cu films for 24 ̊C (film A), 17 ̊C (film B), and 10 ̊C (film C) data. After collecting data at 17 ̊C and 10 ̊C on films B and C, respectively, the electrolyte bath temperature was raised to 24 ̊C and SEIRA

S11
spectra were collected in 1 atm CO-saturated 0.1 M (bi)carbonate electrolyte. The integrated band intensity for COatop at –1.02 V vs SHE for film B in 1 atm CO-saturated 0.1 M (bi)carbonate electrolyte at 24 ̊C was 3.3 times smaller than the same experiment collected on film A. Therefore, integrated band intensities for COatop for data collected on film A were multiplied by 3.3. The integrated band intensity for COatop at –1.02 V vs SHE for film C in 1 atm CO-saturated 0.1 M (bi)carbonate electrolyte at 24 ̊C was 33.4 times smaller than the same experiment collected on film A. Therefore, integrated band intensities for COatop for data collected on film A were multiplied by 33.4. The maximum integrated band intensities for COatop (amongst the normalized values for the 3 films) was 0.64 a.u. and this maximum value was observed for the data collected at 10 °C under 1 atm CO-saturated (bi)carbonate buffer at potentials more negative than –0.98 V vs SHE. We take this maximum intensity to correspond to an upper-limit COatop surface coverage, θCOatop, for 0.45. This is a reasonable upper-limit estimate because of the following literature precedent: (1) polycrystalline Cu surfaces transform to Cu(100) under reductive polarization;27 (2) Cu(100) saturates at ~0.45 fractional coverage of CO28–30 with IR peak positions28 in line with COatop. This analysis was used to estimate the surface coverage values reported in Figure 6.

S12
Langmuir and Temkin Adsorption Fits. The following equation was used to fit Langmuir isotherm (Figure 5, Figure S17).
𝜃 = 𝐾%𝐶
1 + 𝐾%𝐶
where KL is the Langmuir constant, C is the concentration of solution-dissolved CO, and θ is the surface coverage of COatop. For neutral adsorbates, KL can be used to estimate the free energy of adsorption.31 The equilibrium constants extracted from these fits for all three values of ε at each temperature are shown in Table S1-S3. For each temperature, the average and standard deviation of the KL values across the three ε values were used to generate average and standard deviation values for the Gibbs free energy of adsorption that are plotted in Figure 5, inset.
The following equation was used to fit Temkin isotherms (Figure 6, Table S4).
𝜃 = 2.303𝑅𝑇
𝑟(𝑙𝑜𝑔𝐾4 + 𝑙𝑜𝑔𝐶)
where KT is the Temkin constant, C is the concentration of solution-dissolved CO, r is change in the heat of adsorption due to the effect of surface heterogeneity, θ is the surface coverage of COatop, and the other constants take on their usual meaning. The Gibbs free energy value represents a value at a reference state that is independent of coverage.32
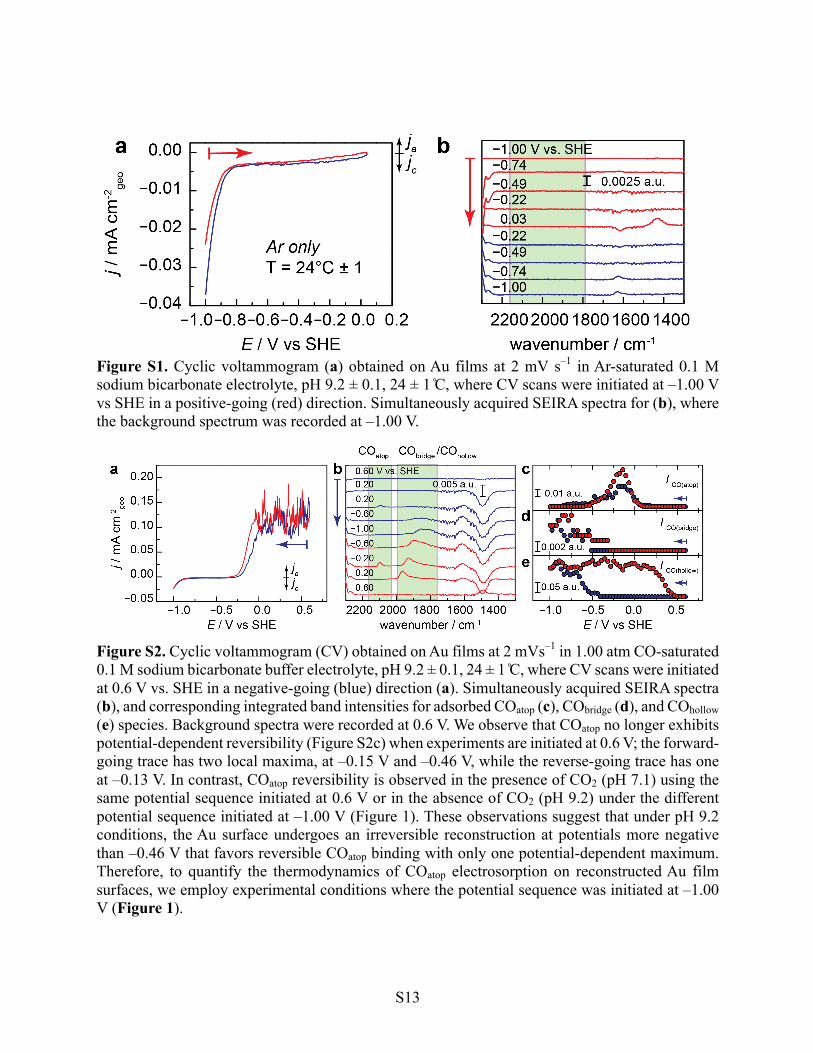
S13
Figure S1. Cyclic voltammogram (a) obtained on Au films at 2 mV s–1 in Ar-saturated 0.1 M sodium bicarbonate electrolyte, pH 9.2 ± 0.1, 24 ± 1 ̊C, where CV scans were initiated at –1.00 V vs SHE in a positive-going (red) direction. Simultaneously acquired SEIRA spectra for (b), where the background spectrum was recorded at –1.00 V.
Figure S2. Cyclic voltammogram (CV) obtained on Au films at 2 mVs–1 in 1.00 atm CO-saturated 0.1 M sodium bicarbonate buffer electrolyte, pH 9.2 ± 0.1, 24 ± 1 ̊C, where CV scans were initiated at 0.6 V vs. SHE in a negative-going (blue) direction (a). Simultaneously acquired SEIRA spectra (b), and corresponding integrated band intensities for adsorbed COatop (c), CObridge (d), and COhollow (e) species. Background spectra were recorded at 0.6 V. We observe that COatop no longer exhibits potential-dependent reversibility (Figure S2c) when experiments are initiated at 0.6 V; the forward-going trace has two local maxima, at –0.15 V and –0.46 V, while the reverse-going trace has one at –0.13 V. In contrast, COatop reversibility is observed in the presence of CO2 (pH 7.1) using the same potential sequence initiated at 0.6 V or in the absence of CO2 (pH 9.2) under the different potential sequence initiated at –1.00 V (Figure 1). These observations suggest that under pH 9.2 conditions, the Au surface undergoes an irreversible reconstruction at potentials more negative than –0.46 V that favors reversible COatop binding with only one potential-dependent maximum. Therefore, to quantify the thermodynamics of COatop electrosorption on reconstructed Au film surfaces, we employ experimental conditions where the potential sequence was initiated at –1.00 V (Figure 1).

S14
Figure S3. Stark tuning slope of COatop (a), CObridge (b), and COhollow (c) for SEIRA spectra collected simultaneously during cyclic voltammograms obtained at 2 mV s–1 in 1 atm CO-saturated 0.1 M sodium bicarbonate buffer electrolyte, pH 9.2 ± 0.1, 24 ± 1 ̊C, where CV scans were initiated at –1.0 V vs. SHE in a positive-going direction (Figure 1 a-e). Data reported from the reverse-going trace (–1.0 V to 0.03 V vs SHE). It is noted for (b) and (c) the Stark tuning slope is calculated based on the peak of the additionally adsorbed CObridge and COhollow because a population of the two is already present at –1.0 V vs. SHE. Stark tuning slope of COatop (d), CObridge (e), and COhollow (f) for SEIRA spectra collected simultaneously during cyclic voltammograms obtained at 2 mV s–
1 in 1 atm CO-saturated 0.1 M sodium bicarbonate buffer electrolyte, pH 9.2 ± 0.1, 24 ± 1 ̊C on Au films, where CV scans were initiated at 0.6 V vs. SHE in a negative-going direction (Figure S2 a-e). Data reported from the reverse-going trace (–1.0 V to 0.6 V vs SHE).

S15
Figure S4. Cyclic voltammograms (CV) recorded on Au films at 2 mV s–1 in 0.13 atm (a), 0.25 atm (c) and 0.50 atm (e) CO-saturated 0.1 M sodium bicarbonate electrolyte, pH 9.2 ± 0.1, 24 ± 1 ̊C, where CV scans were initiated at –1.0 V vs SHE in a positive-going (red) direction. The balance was Ar. Simultaneously acquired SEIRA spectra for 0.13 atm (b), 0.25 atm (d) and 0.50 atm (f) CO-saturated 0.1 M sodium bicarbonate electrolyte, pH 9.2 ± 0.1. Background spectra were recorded at –1.0 V.

S16
Figure S5. Corresponding integrated band intensities for adsorbed COatop (a), CObridge, (b), and COhollow (c) species on Au films for data reported in Figure 1. Integrated band intensities were taken from SEIRA spectra recorded during cyclic voltammograms (CV) obtained at 2 mVs–1 in 1.00 atm CO-saturated 0.1 M sodium bicarbonate electrolyte, pH 9.2 ± 0.1, 24 ± 1 ̊C, where CV scans were initiated at –1.00 V vs. SHE in a positive-going (red) direction (a). Background spectra were recorded at –1.00 V. It is noted that for (b) and (c), the integrated band intensities are determined based on the peak of the additionally (add.) adsorbed CObridge and COhollow because significant population are already present at –1.00 V vs SHE. CVs initiated at 0.60 V vs. SHE are reported in Figure S2.
Figure S6. Cyclic voltammograms (CV) (a & c) and acquired SEIRA spectra (b & d) obtained on Au films at 2 mVs–1 in 0.1 M sodium bicarbonate electrolyte, 24 ± 1 ̊C. Data recorded in the presence of 0.50 atm CO, 0.5 atm Ar, pH 9.2 ± 0.1 (a & b) and 0.50 atm CO2, 0.5 atm CO, pH 6.9 ± 0.1 (c & d). Background SEIRA spectra were recorded at –1.0 V. Data were collected with a Pt counter electrode and Figure S6 (a & b) showed no difference relative to data collected with a Au counter electrode, Figure S4 (e & f).

S17
Figure S7. Surface faceting of Au film used in prior studies18 (a) and used in this study (b). Cyclic voltammograms of films reported in 0.1 M NaOH/ 0.1 mM Pb(NO3)2. CVs were recorded at 50 mV s–1 with a negative direction of scan. The CV displays two deposition and stripping features centered at ~0.44 and ~0.56 V Ag/AgCl. The less positive wave is diagnostic of lead deposition/stripping from exposed Au(111) facets, whereas the latter corresponds to that from Au(110) facets.12–15 Materials used in this study display higher surface populations of Au(110) facets relative to that observed in prior studies18, suggesting that SEIRAS-active Au films used in this study are Au(110) enriched.
Figure S8. Cyclic voltammogram (a) obtained on Cu films at 2 mVs–1 in Ar-saturated 0.1 M sodium bicarbonate electrolyte, pH 9.2 ± 0.1, 24 ± 1 ̊C, where CV scans were initiated at –0.56 V vs SHE in a negative-going (blue) direction. Simultaneously acquired SEIRA spectra for (b), where the background spectrum was recorded at –0.56 V.

S18
Figure S9. Stark tuning slope of COatop (a) and CObridge (b) for SEIRA spectra collected simultaneously during cyclic voltammograms obtained at 2 mV s–1 in 1 atm CO-saturated 0.1 M sodium bicarbonate buffer electrolyte, pH 9.2 ± 0.1, 24 ± 1 ̊C, on Cu films, where CV scans were initiated at –0.56 V vs SHE in a negative-going direction (Figure 4). Data reported from the forward-going trace.
Figure S10. Corresponding integrated band intensities for adsorbed COatop (a) and CObridge, (b), species on Cu films for data reported in Figure 4. Integrated band intensities were taken from SEIRA spectra recorded during cyclic voltammograms (CV) obtained on Cu film at 2 mV s–1 1.00 atm CO-saturated 0.1 M sodium bicarbonate electrolyte, pH 9.2 ± 0.1, 24 ± 1 ̊C, where CV scans were initiated at –0.56 V vs SHE in a negative-going (blue) direction. Background spectra were recorded at –0.56 V.

S19
Figure S11. Cyclic voltammograms (CV) obtained on Cu films at 2 mVs–1 in 0.13 atm (a), 0.25 atm (c) and 0.50 atm (e) CO-saturated 0.1 M sodium bicarbonate electrolyte, pH 9.2 ± 0.1, 24 ± 1 ̊C, where CV scans were initiated at –0.56 V vs SHE in a positive-going (red) direction. The balance was Ar. Simultaneously acquired SEIRA spectra for 0.13 atm (b), 0.25 atm (d) and 0.50 atm (f) CO-saturated 0.1 M sodium bicarbonate electrolyte, pH 9.2 ± 0.1. Background spectra were recorded at –0.56 V vs SHE.

S20
Figure S12. Experimental setup for temperature-dependent SIERAS measurements (left) depicting (a) potentiostat, (b) circulator, (c) mass flow controllers, (d) IR spectrometer, (e) optical chamber housing single-reflection accessory, (f) SEIRAS cell, (g) dry purge air. Schematic diagram of SEIRAS cell-adapted for temperature-dependent studies (right).
Figure S13. Temperature-dependence of the 0 V vs. 3.4 M KCl Ag/AgCl reference electrode33. These values are used to correct for potential as a function of temperature.

S21
Figure S14. CO solubility in water as a function of temperature corrected using Henry’s Law constant.34 These values are used to correct for CO concentration as a function of temperature.

S22
Figure S15. Integrated COatop band intensities on Au films as a function of exogenous CO partial pressure at 0.13 (aqua downwards-facing triangles), 0.25 (dark blue upwards-facing triangles), 0.50 (red circles), and 1.00 atm (black squares) in 0.1 M sodium bicarbonate electrolyte, pH 9.2 ± 0.1, where CV scans were initiated at –1.0 V vs. SHE. Ar was used as the balance, and background spectra were recorded at –1.0 V. Data shown for the positive-going direction in 10 ± 1 ̊C (a), 38 ± 1 ̊C (c), and 50 ± 1 ̊C (e) electrolyte. Data shown for the negative-going direction in 10 ± 1 ̊C (b), 38 ± 1 ̊C (d), and 50 ± 1 ̊C (f) electrolyte. The integration values shown are not normalized for variations in film preparation.

S23
Figure S16. Cyclic voltammogram (CV) and simultaneously acquired SEIRA spectra (a-e) obtained on Au films at 2 mV s–1 in 0.50 atm CO and CO2 co-saturated 0.1 M sodium bicarbonate buffer electrolyte, pH 6.8 ± 0.1, 24 ± 1 ̊C. CV scans (a) were initiated at 0.6 V vs. SHE in a negative-going (blue) direction. SEIRA spectra (b), and corresponding integrated band intensities for adsorbed COatop (c) , CObridge (d), and COhollow (e) species. Background spectra were recorded at 0.6 V. CV and simultaneously acquired SEIRA spectra (f-i) obtained on Au films at 2 mV s–1 in 1.00 atm CO2-saturated 0.1 M sodium bicarbonate buffer electrolyte, pH 6.8 ± 0.1, 24 ± 1 ̊C. CV scans (f) were initiated at 0.6 V vs. SHE in a negative-going (blue) direction. SEIRA spectra (g), and corresponding integrated band intensities for adsorbed COatop (h), and COhollow (i) species. Background spectra were recorded at 0.6 V. Our previous studies under the same CO2RR conditions18 use CO stripping analysis to quantify the surface concentration of irreversibly adsorbed CO species, ΓCO_irreversible, and found a value of 0.4 nmol cm–2. We also observe irreversibly bonded electrogenerated COhollow during CO2RR under CO-free conditions using Au films prepared for this study. Equating the saturation value of COhollow band intensity (0.05 a.u.) to ΓCO_irreversible allows us to estimate the extinction coefficient (ε) for COhollow on Au at 0.125 nmol–1 cm2 for this film.

S24
Figure S17. Langmuir adsorption isotherms and fitting of COatop on polarized Au surfaces taken at the peak potential of maximum adsorption (Ep) when ε equals 0.1 nmol–1 cm2
(a) and 0.3 nmol–
1 cm2 (b).
Temperature R2 KL (L mol–1) KL standard error 10̊C 0.97167 517 39 24̊C 0.97364 255 16 38̊C 0.99661 138 3 50̊C 0.92131 90 8
Table S1. Table of fitting parameters for Langmuir adsorption isotherm of COatop on Au films in 0.1 M sodium bicarbonate buffer electrolyte, pH 9.2 ± 0.1, at the peak potential (Ep) for COatop adsorption, assuming the average ε value, 0.2 nmol–1 cm2. We observe that the Ep for COatop adsorption is –0.12 V, –0.16 V, –0.20 V, and –0.24 V vs SHE for data collected at 10, 24, 38, and 50 ̊C, respectively.
Temperature R2 KL (L mol–1) KL standard error 10̊C 0.90695 1506 306 24̊C 0.9716 594 46 38̊C 0.99292 289 10 50̊C 0.93302 182 16
Table S2. Table of fitting parameters for Langmuir adsorption isotherm of COatop on Au films in 0.1 M sodium bicarbonate buffer electrolyte, pH 9.2 ± 0.1, at the peak potential (Ep) for COatop adsorption, assuming the average ε value, 0.1 nmol–1 cm2. We observe that the Ep for COatop adsorption is –0.12 V, –0.16 V, –0.20 V, and –0.24 V vs SHE for data collected at 10, 24, 38, and 50 ̊C, respectively.

S25
Temperature R2 KL (L mol–1) KL standard error 10̊C 0.96217 323 25 24̊C 0.96961 172 11 38̊C 0.99687 95 2 50̊C 0.91742 63 6
Table S3. Table of fitting parameters for Langmuir adsorption isotherm of COatop on Au films in 0.1 M sodium bicarbonate buffer electrolyte, pH 9.2 ± 0.1, at the peak potential (Ep) for COatop adsorption, assuming the average ε value, 0.3 nmol–1 cm2. We observe that the Ep for COatop adsorption is –0.12 V, –0.16 V, –0.20 V, and –0.24 V vs SHE for data collected at 10, 24, 38, and 50 ̊C, respectively.
Figure S18. COatop band shape on Au films as a function of exogenous CO partial pressure at 0.13 (blue), 0.25 (green), 0.50 (red), and 1.00 atm (black) in 0.1 M sodium bicarbonate buffer electrolyte, 24 ± 1 ̊C, pH 9.2 ± 0.1, at –0.17 V vs. SHE. Ar was used as the balance, and background spectra were recorded at –1.0 V.

S26
Figure S19. Temperature-dependent integrated COatop band intensities on Cu films as a function of exogenous CO partial pressure at 0.13 (aqua downwards-facing triangles), 0.25 (dark blue upwards-facing triangles), 0.50 (red circles), and 1.00 atm (black squares) in 0.1 M sodium bicarbonate buffer electrolyte, pH 9.2 ± 0.1, where CV scans were initiated at –0.56 V vs. SHE. Ar was used as the balance, and background spectra were recorded at –0.56 V. Data shown for the negative-going direction in 10 ± 1 ̊C (a) and 17 ± 1 ̊C (c) electrolyte. Data shown for the positive-going direction in 10 ± 1 ̊C (b) and 17 ± 1 ̊C (d) electrolyte. Integration values shown are not normalized for variability in film preparation.
Figure S20. COatop band shape on Cu films as a function of exogenous CO partial pressure at 0.13 (blue), 0.25 (green), 0.50 (red), and 1.00 atm (black) in 0.1 M sodium bicarbonate buffer electrolyte, 24 ± 1 ̊C, pH 9.2 ± 0.1, at –0.91 V vs. SHE. Ar was used as the balance, and background spectra were recorded at –1.0 V.

S27
T / ̊C
intercept
(2.303RT/r)log(KT)
Standard error
slope
2.303RT/r
Standard error
R2 r /
kJ mol–1 ∆𝐺88 / kJ mol–1
∆𝐺8.98 /
kJ mol–1
10 1.20224 0.21799 0.25502 0.06481 0.82842 21.3±5.4 –25.6±4.6 –35.6±4.7
24 1.20818 0.02403 0.28196 0.007 0.99815 19.7±0.5 –23.8±0.5 –33.9±0.7
38 1.17998 0.20194 0.29413 0.05808 0.89148 19.3±3.8 –22.8±3.9 –32.9±3.9
Table S4. Table of fitting parameters for Tempkin adsorption isotherm of COatop on Cu films in 0.1 M sodium bicarbonate buffer electrolyte, pH 9.2 ± 0.1, at –1.01 V vs SHE. Errors for r and ∆𝐺88 are standard errors obtained from the fitting. ∆𝐺8.98 calculated using the relationship, ∆𝐺8.98 = ∆𝐺88 − 𝑟𝜃, where the average value of r, 20±1 kJ mol–1, was used.

S28
References
(1) Wuttig, A.; Surendranath, Y. ACS Catal. 2015, 5 (7), 4479.
(2) Yaguchi, M.; Uchida, T.; Motobayashi, K.; Osawa, M. J. Phys. Chem. Lett. 2016, 7 (16), 3097.
(3) Wuttig, A.; Liu, C.; Peng, Q.; Yaguchi, M.; Hendon, C. H.; Motobayashi, K.; Ye, S.; Osawa, M.; Surendranath, Y. ACS Cent. Sci. 2016, 2 (8), 522.
(4) Osawa, M. Bull. Chem. Soc. Jpn. 1997, 70, 2861.
(5) Osawa, M. In Handbook of Vibrational Spectroscopy; Chalmers, J. M., Griffiths, P. R., Eds.; Wiley-VCH: Chichester, UK, 2002; pp 785–800.
(6) Osawa, M. In Diffraction and Spectroscopic Methods in Electrochemistry (Advances in Electrochemical Science and Engineering, Vol.9); Alkire, R. C., Kolb, D. M., Lipkowski, J., Ross, P. N., Eds.; Wiley-VCH: New York, 2006; pp 269–314.
(7) Osawa, M. In Near-Field Optics and Surface Plasmon Polaritons. Topics in Applied Physics; Kawata, S., Ed.; Springer: Berlin, 2001; Vol. 81, pp 163–187.
(8) Osawa, M.; Ataka, K.; Yoshii, K.; Yotsuyanagi, T. J. Electron Spectros. Relat. Phenomena 1993, 64–65, 371.
(9) Kardash, D.; Huang, J.; Korzeniewski, C. J. Electroanal. Chem. 1999, 476 (2), 95.
(10) Chen, Y.-X.; Ye, S.; Heinen, M.; Jusys, Z.; Osawa, M.; Behm, R. J. J. Phys. Chem. B 2006, 110, 9534.
(11) Dunwell, M.; Lu, Q.; Heyes, J. M.; Rosen, J.; Chen, J. G.; Yan, Y.; Jiao, F.; Xu, B. J. Am. Chem. Soc. 2017, 139, 3774.
(12) Hamelin, A.; Lipkowski, J. J. Electroanal. Chem. Interfacial Electrochem. 1984, 171 (1–2), 317.
(13) Hamelin, A. J. Electroanal. Chem. Interfacial Electrochem. 1984, 165 (1–2), 167.
(14) Adzic, R.; Yeager, E.; Cahan, B. D. J. Electrochem. Soc. 1974, 121 (4), 474.
(15) Wang, Y.; Laborda, E.; Ward, K. R.; Tschulik, K.; Compton, R. G. Nanoscale 2013, 5 (20), 9699.
(16) Chen, D.-J.; Allison, T. C.; Tong, Y. J. J. Phys. Chem. C 2016, 120 (29), 16132.
(17) Chen, D.-J.; Tong, Y. J. J. Electroanal. Chem. 2017, 800, 39.
(18) Wuttig, A.; Yaguchi, M.; Motobayashi, K.; Osawa, M.; Surendranath, Y. Proc. Natl. Acad. Sci. 2016, 113 (32), E4585.
(19) Blizanac, B. B.; Arenz, M.; Ross, P. N.; Marković, N. M. J. Am. Chem. Soc. 2004, 126, 10130.

S29
(20) Hussain, A.; Curulla Ferré, D.; Gracia, J.; Nieuwenhuys, B. E.; Niemantsverdriet, J. W. Surf. Sci. 2009, 603 (17), 2734.
(21) Rodriguez, P.; Garcia-Araez, N.; Koverga, A.; Frank, S.; Koper, M. T. M. Langmuir 2010, 26 (14), 12425.
(22) Salimon, J.; Hernández-Romero, R. M.; Kalaji, M. J. Electroanal. Chem. 2002, 538–539, 99.
(23) Hayden, B. E.; Kretzschmar, K.; Bradshaw, A. M. Surf. Sci. 1985, 155 (2–3), 553.
(24) Gajdoš, M.; Eichler, A.; Hafner, J.; Meyer, G.; Rieder, K. H. Phys. Rev. B - Condens. Matter Mater. Phys. 2005, 71 (3).
(25) Hayden, B. E. Surf. Sci. 1983, 131 (2–3), 419.
(26) Hayden, B. E.; Bradshaw, A. M. Surf.Sci. 1983, 125, 787.
(27) Kim, Y.-G.; Baricuatro, J. H.; Javier, A.; Gregoire, J. M.; Soriaga, M. P. Langmuir 2014, 30 (50), 15053.
(28) Truong, C. M.; Rodriguez, J.; Goodman, D. W. Surf. Sci. 1992, 271 (3), L385.
(29) Ryberg, R. Surf. Sci. 1982, 114 (2–3), 627.
(30) Horn, K.; Pritchard, J. Surf. Sci. 1976, 55 (2), 701.
(31) Liu, Y. J. Chem. Eng. Data 2009, 54 (7), 1981.
(32) Bockris, J. O.; Jeng, K. T. J. Electroanal. Chem. 1992, 330 (1–2), 541.
(33) Bard, A. J.; Parsons, R.; Jordan, J. Standard Potentials in Aqueous Solution; IUPAC-Marcel Dekker Inc.: New York, 1985.
(34) Sander, R. Atmos. Chem. Phys. 2015, 15 (8), 4399.

download fileview on ChemRxivSI_COThermo_Final.pdf (4.21 MiB)