ßf 2^ c3 the magnitude and
TRANSCRIPT

ßf 2^ c3
Agriculture
Economic Research Services
Agricultural Economic Report Number 576
The Magnitude and Costs of Groundwater Contamination From Agricultural Chemicals A National Perspective
Elizabeth G. Nielsen Linda K. Lee
'->vk Ti ^>.
*^>; ./rV -
■^^■^
n^^mmm^. m^^^ry^ô^^'^m^m ■o;o:è^:p/5^
to ̂smñQ&Si§m o ö
Ml V- ■Q
»•■o 'o
^o-o i-.<á^
^mm-om^ñ ^x^mmmm^ P:; .^0
Oó:'
ffPiia'aOc^io .:0-, oM- ■o- P íC^ à: rÚ ç^&^'^'cf&é^^-
a ®?ÎS?isi^ïlAc?MMSi^iM:ëSg^ oFíJóoSsí^s
o o -p. 0^ ':¿? ^<^^r>Cí:óía^;oi:a^ía
■á o a
0^9 ■;Q-3
-■■-■rNO..Q.V>^-.o..U.^iJ
ö;;a^ >o<
O.c

Sales Information
Additional copies of this report can be purchased from the Superintendent of Documents, U.S. Government Printing Office, Washington, DC 20402. Order by title and stock number (001-019-00527-1). Write to the above address for price information, or call the GPO order desk at (202) 783-3238. You may also charge your purchase by telephone to your VISA, MasterCard, Choice, or GPO Deposit Account. Bulk discounts are available. Foreign customers, please add 25 percent extra for postage.
Microfiche copies ($6.50 each) can be purchased from the National Technical In- formation Service, 5285 Port Royal Road, Springfield, VA 22161. Order by title and series number. Enclose a check or money order payable to NTIS; add $3 handling charge for each order. Call NTIS at (703) 487-4650 and charge your purchase to your VISA, MasterCard, American Express, or NTÍS Deposit Account. NTIS will RUSH your order within 24 hours for an extra $10; call (800) 336-4700.
The Economic Research Service has no copies for free distribution.
Note
Use of company names in this publication is for identification only and does not imply endorsement by the U.S. Department of Agriculture.

The Magnitude and Costs of Groundwater Contamination From Agricultural Chemicals: A National Perspective. By Elizabeth G. Nielsen and Linda K. Lee. Resources and Technology Division, Econonriic Research Service, U.S. Depart- ment of Agriculture. Agricultural Economic Report No. 576.
Abstract
The drinking water of an estimated 50 million people in the United States comes from groundwater that is potentially contaminated from agricultural chemicals. Approximately 19 million of these people get their water from private wells, which are most vulnerable. Findings (based on analysis of synthesized data sources) suggest that potential contamination follows regional trends. Evidence in- dicates that pesticides and nitrates from fertilizers do not necessarily occur together in potentially affected areas, implying a need to target strategies. First- time monitoring costs range from $0.9 billion to $2.2 billion for households with private wells (mostly in rural areas) and approximate $14 million for com- munities with community groundwater systems.
Keywords: Groundwater contamination, agricultural chemicals, nitrates, pesticides, drinking water.
Acknowledgments
The authors acknowledge the help of Paul Andrilenas and Herman Delvo, Economic Research Service, USDA; Stuart Cohen, formerly with the Environmen- tal Protection Agency; Leonard Gianessi and Henry Peskin, Resources for the Future; Peter Kuch, Environmental Protection Agency; and David Moody, U.S. Geological Survey, in data collection and analysis.
For valuable review comments on earlier drafts, the authors thank George R. Hallberg, Iowa Geological Survey; Charles S. Helling, Ralph A. Leonard, H. B. Pionke, and R. Don Wauchope, Agricultural Research Service, USDA; Randall Kramer, Virginia Polytechnic Institute and State University; Matthew Lorber and Peter Kuch, Environmental Protection Agency; J. Walter Milon, University of Florida; Stephen E. Ragone, U.S. Geological Survey; and Robert Raucher, Energy and Resource Consultants.
The authors are grateful to Bill Lindamood and Chuck Little, Economic Research Service, USDA, who contributed expertise in data management and computer graphics.
Washington, DC 20005-4788 October 1987
III

Contents
Page Summary v
Introduction ^
Agriculture and Groundwater Quality 2
Potential Groundwater Contamination From Agricultural Sources 4
Pesticides • 4 Nitrates 10 Areas Potentially Affected 14 Population Potentially Affected 14 Summary 17
Potential Effects and Costs of Agriculturally Contaminated Groundwater 20
Assessing and Regulating Human Health Risks 20 Health Risks of Nitrates and Pesticides 21 Measuring Social Costs 22 Monitoring Costs ■ 23 Remedial Responses 28
Implications for Groundwater Protection Strategies 30
Conclusions 31
References 32
Appendix ^Data Sources for the Pesticides Assessment 36
IV

Summary
The drinking water of an estimated 50 million people in the United States comes from groundwater that is potentially contaminated from agricultural chemicals. Approximately 19 million of these people get their water from private wells, which are most vulnerable. Findings (based on analysis of synthesized data sources) suggest that potential contamination follows regional trends. Evidence in- dicates that pesticides and nitrates from fertilizers do not necessarily occur together in potentially affected areas, implying a need to target strategies. First- time monitoring costs range from $0.9 billion to $2.2 billion for households with private wells (mostly in rural areas) and approximate $14 million for com- munities with community groundwater systems.
Because there are no national data on levels of agricultural chemicals in ground- water, this study is a first attempt at synthesizing and analyzing available data sources to indicate which areas are potentially affected. The data do not define local- or county-level contamination potential, but allow an analysis of regional trends. Among the regions with potential pesticide contamination are the Eastern Seaboard, the gulf coast, and the Upper Midwest. Regions having a potential for nitrate contamination include the Great Plains and portions of the Northwest, Southwest, and the Corn Belt. Areas with potential for combined pesticide and nitrate pollution include portions of the Corn Belt, the Lake States, and the Northeast.
in those potentially contaminated regions, an estimated 50 million people rely on groundwater for their drinking needs. Of these people, nearly 19 million obtain their water from private wells. The remainder use public water systems. Private wells are more vulnerable to contamination because they are shallower than regulated public system wells and are often not built as well. Most of the people who rely on groundwater in potentially contaminated areas live where ground- water may contain pesticides or a combination of pesticides and nitrates.
Because monitoring groundwater contamination levels provides information on the need for remedial action, the report analyzes costs of testing for nitrates and pesticides in potentially contaminated areas. Using specific assumptions, re- searchers estimate that first-time monitoring costs for households with private wells range from $0.9 billion to $2.2 billion, with a "best" estimate of $1.4 billion. Monitoring costs for community groundwater systems are estimated to be much lower, approximately $14 million, because less sampling is required even though the number of people served is larger. As a result, individual well owners, who are often rural residents, will bear the highest monitoring costs.
These findings have important implications for policymakers and water users alike. Farmers, for example, have incentives to reduce contamination if their pesticides and fertilizers are affecting their own well water. Educational programs accompanied by expanded research on the effects of agricultural practices will consequently be important. Different strategies may be implied for different areas since data suggest that pesticides and nitrates from fertilizers are not necessarily found together in groundwater and may impose different costs on society. Finally, not all regions are vulnerable or equally dependent on groundwater. As a result, targeting of strategies will be important.

The Magnitude and Costs of G round water Contamination From Agricultural Chemicals: A National Perspective
Elizabeth G. Nielsen and Linda K. Lee'
Introduction
The United States relies heavily on groundwater: over 97 percent of rural America's drinking water taps underground sources, 55 percent of the country's livestock water comes from underground supplies, and 40 percent of all water used to irrigate crops is drawn from aquifers. Not only rural America relies heavily on groundwater. In 1980, 40 percent of the population served by public water supplies used groundwater, or nearly 74 million people. Moreover, reliance on groundwater is growing. Between 1950 and 1980, groundwater withdrawals increased 158 percent while surface withdrawals rose only 107 percent (65).^
Little is known about the scope of most groundwater contamination generated by human activities. The question, however, is critical (9). There are documented and suspected risks to human health from exposure to contaminated groundwater (46). Because groundwater moves slowly in many areas and some chemicals degrade slowly, contamination can persist for years or even centuries. Cleanup costs can be pro- hibitive. Moreover, the interaction between surface waters and groundwaters can mean that aquifer con- tamination ultimately may lead to pollution of streams, lakes, and estuaries in some areas.
Although groundwater contamination has many sources, evidence suggests that agricultural activity may be a significant source. Substantiating that link is a recently published report by the U.S. Office of Technology Assessment that summarizes groundwater contamination and its effects (69). The report cites
* Eiizabeth G. Nielsen is an agricultural economist and Linda K. Lee is a section leader with the Economic Research Service, U.S. Department of Agriculture.
^ Italicized numbers in parentheses refer to items cited in the References section.
agricultural pesticides and fertilizers as significant groundwater contaminants. The conclusion appears to be supported by documented incidents of contamina- tion attributed to agricultural chemicals In Penn- sylvania, Florida, Wisconsin, California, New York, Iowa, and other States {52, 37, 60, 61, 81, 8, 80, 28, 411
The problem is attracting public attention. According to a recent national poll, 80 percent of the U.S. popula- tion believes that groundwater pollution is a national problem, and 54 percent of the people think It Is a problem in their community. Of those surveyed, nearly 70 percent responded that they believe agricultural fer- tilillzers and pesticides cause water pollution (7).
This report assesses the scope and costs of ground- water contamination caused by agricultural fertilizers and pesticides In the United States. While other agricultural activities such as livestock operations may contaminate groundwater in some localities, we focus on crop chemicals because of their broad-scale use across diverse regions of the country.
We combine data from a variety of sources to develop an overview of regions potentially affected by agriculturally induced chemical contamination of groundwater. The report also summarizes the types of damage incurred by agriculturally polluted groundwater along with an appraisal of the costs of preventing potential damages to health and property. The costs of these damages represent the benefits of groundwater protection. The policies and programs now being put Into place by several States, Including Arizona, Califor- nia, and Wisconsin, and under discussion by other States and the U.S. Environmental Protection Agency (EPA), require a better understanding of the benefits of groundwater protection. Only when the benefits are well understood can they be compared with the social and agricultural costs of alternative prevention and control measures, leading to the identification of effi- cient policy options.

Agriculture and Groundwater Quality
The lack of a consistent and comprehensive data base has made it difficult to establish direct links between human activities and contamination episodes. This is particularly true with respect to diffuse or ''nonpoint" pollution sources, which characterize many agricultural activities such as chemical applications. It is clear, however, that several trends over the past 40 years have increased the potential for agriculturally caused groundwater contamination.
The use of inorganic nitrogen fertilizers, a major source of nitrate-nitrogen groundwater contamination, in- creased fourfold between 1960 and 1980 (fig. 1). A major cause was heavier fertilizer applications, with the per-acre rate doubling between 1965 and 1984. At the same time, the agricultural use of pesticides rose sharply, nearly tripling since 1964 (fig. 2). Figure 3 shows that herbicides accounted for most of the in- crease. They constituted 82 percent of all pesticide use on major field and forage crops in 1982 (72).
Other trends increased the potential for contamination from both diffuse and concentrated "point" sources, at least in some locations. Wastes generated in concen- trated livestock, dairy, and poultry operations have
stretched the land's waste assimilative capacity and created a potential for nitrate contamination, particular- ly in areas where commercial fertilizers are also ap- plied. This situation is particularly critical where the nitrogen content of animal manure the land receives is underestimated or ignored.
Cultivation practices may also contribute. An increase in conservation tillage, for instance, may imply an in- crease in both pesticide and fertilizer contamination of groundwater through increased water infiltration and reduced runoff, although the relationships are not well understood and may vary from one area to another (19, 20, 31). Expanding the amount of irrigated land over the years also may have contributed to ground- water contamination. Irrigation can increase the con- centration of salts, pesticides, and fertilizers in ground- water recharge, as well as in irrigation return flows (31, 39, 64).
The potential for groundwater contamination, as well as the magnitude, extent, and duration of contamina- tion, depend not only on land uses and agricultural practices, but also on climate, hydrogeology, and other conditions. These include soil characteristics, net aquifer recharge rate, depth to the water table, and characteristics of the unsaturated zone and the aquifer.
Figure 1
Trends in U.S. Agricultural Nitrogen Use, 1960-85
Million tons
12
10
0 I I I I I I I I L
1960 65 Sources: (70. 71, 73)
J L L I I I
70 75 80 85
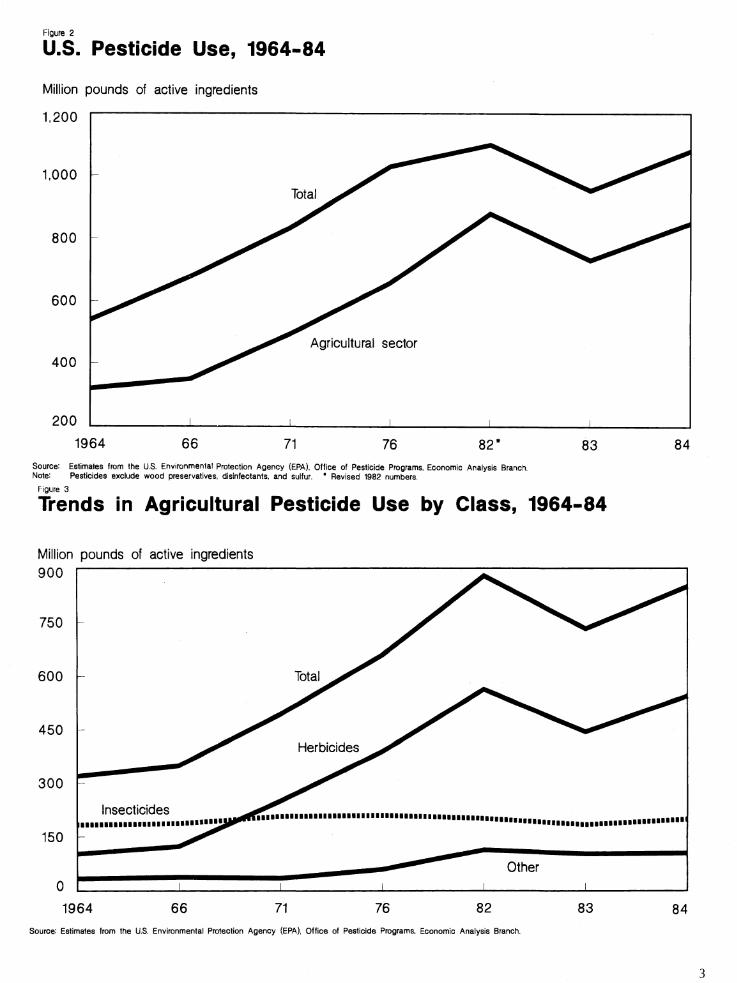
Figure 2
U.S. Pesticide Use, 1964-84
Million pounds of active ingredients
1,200
1,000
800
600
400
200
1964 66 71 76 82' 83 84 Source: Estimates from tlie U.S. Enviror^menlal Protection Agency (EPA), Office of Pesticide Programs. Economic Analysis Branch. Note: Pesticides exclude wood preservatives, disinfectants, and sulfur. " Revised 1982 numbers.
Figure 3
Trends In Agricultural Pesticide Use by Class, 1964-84
Million pounds of active ingredients 900
750 -
- Total^^^
^ Herbicides ^^^
Insecticides __^
Other 1 1 1
600
450
300
150
1964 66 71 76 82 Source: Estimates from the U.S. Environmental Protection Agency (EPA), Office of Pesticide Programs. Economic Analysis Branch.
83 84

The characteristics of a potential pollutant, such as water solubility, adsorption, and persistence, strongly affect its ultimate fate. In addition to increased pesticide and fertilizer use, changes in the types of pesticides applied (that is, generally less persistent, but less likely to attach to soil particles)^ may mean a greater likelihood of contamination. Pesticides that are less adsorbent and more soluble in water have more potential to move out of the root zone toward ground- water, particularly when recharge rates are high.^ The method and timing of chemical applications, in addi- tion to tillage and irrigation practices, also affect the likelihood that a chemical will move to groundwater. Also, accidents, leaks, and improper chemical disposal practices can lead to local point-source contamination episodes.
Predicting groundwater contamination clearly requires consideration of diverse factors which interplay in the process. Our data reflect the interaction of farming ac- tivities with physical vulnerability to aquifer contamina- tion from pesticides and nitrogen fertilizers. We com- bine these to evaluate the potential for regional groundwater contamination.
Potential Groundwater Contamination From Agricultural Sources
To estimate the areas in the United States potentially at risk to groundwater contamination from pesticides and fertilizers, we defined areas of potential contamination by using data on actual levels of contaminants in groundwater, where the data were available."^ If data were unavailable, potential contamination was defined by synthesizing information on physical vulnerability to contamination with data on chemical use. In both cases, the population in areas of potential contamina- tion is assumed to face a greater risk from agricultural chemicals in groundwater than the population in other regions. Because the costs associated with these risks largely depend on the population potentially exposed, we also made projections of the numbers and distribu- tion of people using groundwater in potentially con- taminated areas.
We based potentially contaminated areas on a synthesis of several data sources. Although each source has limitations which, taken together, lessen the sensitivity of localized analysis, we believe the regional trends depicted from the combined data sources reflect the best available information.
Pesticides
Because no national data base on pesticide levels in groundwater exists, we developed a method to simulate areas potentially affected by pesticides in groundwater resulting from agricultural chemical applications.
Approach and Data Sources. To simulate potential contamination, we synthesized two data sources. The first was the U.S. county-level "Pesticide DRASTIC assessment (2). DRASTIC is an index that allows analysts to rate an area's relative vulnerability to groundwater contamination based on the area's hydrogeologic characteristics. These characteristics form the basis for the acronym DRASTIC (D = depth to the water table; R = net recharge; A = aquifer media; S = soil media; T = topography; I = impact of the vadose zone; C = hydraulic conductivity). The Pesticide DRASTIC in- dex is a version of DRASTIC designed specifically to assess vulnerability to contamination from pesticide use. The second source was a data base on county- level pesticide use developed by an independent research organization. Resources for the Future (RFF).^
To focus on potential problem pesticides, we limited our analysis to those chemicals recommended for inclu- sion in EPA's national survey of pesticides in well water (termed by EPA priority A and B categories). Of the 45 chemicals, we eliminated 7. Three (EDB, DBCP, and 1, 2-dichloropropane) were not represented in the RFF file because EPA had banned them. Another four (tebuthiuron, prometone, propoxur, and pentachlor) were listed in the file but showed no agricultural uses. Table 1 lists the 38 pesticides used in our analysis along with information on the type and amount of use, the number of States in which each chemical has been found in groundwater, and other facts pertinent to EPA's classification of these chemicals as high-priority pesticides. These pesticides, which are primarily her- bicides, represent 60 percent of all agricultural pesticide applications accounted for in the RFF file.
Because voids exist in the current data and since so lit- tle is known about how groundwater becomes con- taminated, the process of identifying which pesticides are potential groundwater contaminants is a subjective one. In the absence of a definitively superior selection method, we chose to use the chemicals EPA has classified for its national water well survey as Priority A (recommended for inclusion) and Priority B (recom- mended, but subject to negotiation if the laboratory analytical method is difficult or unavailable).^
2 In 1982, over half of all herbicide use on major field and forage crops was accounted for by four chemicals—alachlor, atrazine, butyiate, and metolachlor (72)—all of which have a moderate to high potential to leach.
3 See (76), {32), (39), and (54) for discussions of chemical characteristics and other factors which affect contamination potential.
4 Alaska and Hawaii were not included in the analysis because the data sources used were not consistently available for these States.
5 The Appendix describes both the DRASTIC index and the RFF data base in more detail.
^ A series of internal memoranda describes the year-long selection process undertaken by EPA {10, / 7, 12, and 73). That information is available from the authors upon request.

Table 1—Pesticides included in the analysis^
Pesticide Type^ Estimated States in which pesticide
is found in groundwater EPA description
Thousand lbs.
Acifluorfen H 1,399 Alachlor H 85,015 Aldicarb l,N 2,271 Ametryn H 96 Atrazine H 77,316 Bentazon H 8,410 Bromacil H 1,234 Butylate H 55,095
Carbofuran lAN 7,695 Chloramben H 6,069 Chlordane 1 11
Cyanazine H 21,626 Cyc lóate H 52
Dalapon H 261 Dacthal/DCPA H 196 Dicamba H 4,158 2,4-D H 37,217 Dinoseb H 8,835 Diphenamid H 698
Disulfoton i,A 2,105 Diuron H 1,861 Fenamiphos l,N 348
Fluometuron H 2,943 Hexazinone H 11 Maleic Hydrazide H 287
MCPA H 9,861
Methomyl 1 425 Metolachlor H 37,940 Metribuzin H 10,603 Oxamy! lAN 51 Picloram H 549 Pronamide H 83 Propazine H 1,287 Propham H 445 Simazine H 3,975 2,4,5-T H 204 2,4,5-TP H 7 Terbacil H 833
Number
O 4
15 O 5 O 1 O
3 O O
O 2 1 2 O O O O 3 O O O
Leacher Leacher Mobile; marginal persistence Leacher Leacher Leacher; toxicological concern Leacher Mobile; uncertain persistence; toxicological concern
Leacher Leacher Persistent; possible direct con- tamination via termiticide use
Leacher Mobile; uncertain persistence; toxicological concern
Leacher Leacher Leacher Marginal leacher, heavy use Leacher Marginal leacher; toxicological
data gaps Leacher Leacher Moderate leacher; toxicological concern
Leacher Leacher Leacher; toxicological data
gaps Marginal leacher; possible
occurrence in groundwater Leacher Leacher Leacher Leacher Leacher Leacher Leacher Leacher Leacher Marginal leacher Marginal leacher Leacher
* indicates possible occurrence in groundwater. 1 Included pesticides are those in high-priority categories for EPA's national survey of pesticides in weil water. Other methods of identifying
potential groundwater contaminants might produce different results. 2 A = acaricide; H = herbicide; I = insecticide; N = nematicide. 3 Thousands of pounds of active ingredient per year used for agricultural purposes only.
Sources: {10, 13, 14, 59).

Groundwater Quality Terms
Adsorption—Adherence of molecules to the surface of the solids or liquids with which they are in contact.
Aquifer—A water-bearing geological formation.
Groundwater—Water that is found in the saturated zone.
Hydraulic conductivity—A measure of the ease with which a fluid will pass through a porous earth material.
Leaching—Passing through or out of by percolation. Agricultural chemicals leach when they move downward beyond the root zone with the flow of water. Chemical and environmental factors affect leaching.
Nonpoint source contamination—Pollution from broad areas, such as areas in which fertilizers have been applied, rather than from concentrated discharge points.
Persistence—A substance's "lasting power" or stability, usually measured in half-life, or the time it takes for one half of the substance to be degraded or transformed.
Point-source contamination—Pollution originating from a distinct source, such as the outflow from a pipe or concentrated animal production facilities.
Recharge (net)—The amount of water per unit of land that penetrates the ground surface and reaches the water table.
Root zone—The area of the unsaturated zone from which plant roots draw water and nutrients. Its thickness depends on the plant, soil, and climate.
Saturated zone—The subsurface area in which all the pore spaces in the rock or soil materials are filled with water.
Soil media—The uppermost portion of the unsaturated zone that has significant biological activity.
Unsaturated (vadose) zone—A geological subsurface area located above the water table.
Volatility—The loss of a compound to the atmosphere.
Water solubility—The amount (mass) of a substance that will dissolve in water under specific conditions.
Water table—The top of the saturated zone.

The 38 high-priority pesticides we used are described by EPA as potential 'leachers/' which means they have a high probability of moving to groundwater. Note, however, that the 38 included pesticides vary in terms of volatility, persistence, and the other basic characteristics of pesticides that affect leaching prob- ability. Each pesticide could behave differently under alternative climatic and agronomic conditions. However, we assigned them equal weights in our analysis so that each pound of active ingredient was assumed to contribute equally to the contamination potential, no matter what the pesticide. Equal weights were necessary because there is now no method available to accurately rate or rank pesticides according to their leaching potential.
We translated the total county-level pesticide use estimates into average per-acre applications, using cropland acres from the Census of AgricultureJ These ranged from 0 to 3.4 pounds of active ingredient per acre, with an average of 1.0 pound. We grouped them into high (greater than 1.2), medium (0.5 to 1.2), and low (less than 0.5) categories.^ We similarly grouped the pesticide DRASTIC scores, which had a maximum of 245 and averaged 133, into high (greater than 147), medium (107-147), and low (less than 107) categories. Using the hypothesis that the combined hydrogeologic and pesticide use factors provide more information on contamination potential than do either of the separate indexes, we then calculated three combinations of the high and medium categories for the two variables of per-acre applications and DRASTIC scores. Although the distinctions among the categories may be im- precise, particularly between the high pesticides/ medium DRASTIC and the medium pesticides/high DRASTIC categories, we plotted all categories separate- ly to give the reader added information on the factors that have caused areas to be identified as ''potentially contaminated.''
Results. Figure 4 shows which areas fall into the categories of ''potentially contaminated." Three hun- dred and sixty-one counties fall into both the high DRASTIC score and high pesticide use categories. The remaining areas highlighted by figure 4 have either a high DRASTIC score and medium pesticide applications or the reverse combination. In total, 1,128 counties are represented in figure 4, or roughly one-third of the counties in the conterminous States.
The southern Coastal Plain (including Florida), the cen- tral Atlantic region, the Mississippi Delta, the northern Corn Belt, western Kentucky, and the central valleys of
7 In counties where sugarcane is grown (in south Florida and Loui- siana), sugarcane acreages were first subtracted from the cropland acres reported in the Census of Agriculture. This was done to com- pensate for the fact that pesticide applications on sugarcane are not included in the RFF file. Thus, the average application rate estimates for these counties represent crops other than sugarcane.
ß We determined ranges by identifying patterns in the distribution of the variable for all U.S. counties.
California are the major regions that have high pesticide contamination potential. Other smaller areas in the Northeast, Texas, and Idaho also have potential contamination.
The regions depicted in figure 4 as having potential groundwater contamination from pesticides correspond with production of pesticide-intensive crops such as corn and soybeans. Tobacco, cotton, rice, and peanut production in the Southeast also show high pesticide use as do fruit- and vegetable-producing areas in Florida, California, and portions of the Northeast and Lake States.
Although figure 4 is not based on actual levels of con- taminants in groundwater, the data generally corres- pond to verified incidents of groundwater contamina- tion from normal agricultural pesticide use. Figure 5 pinpoints actual contamination incidents as of mid- 1986. Seventeen pesticides have been found in the groundwater of 23 States, with most located along the Eastern Seaboard, in the Midwest, and in some agri- cultural areas of the West. Because the data shown in figure 5 do not represent a random sample and because sampling incidence, frequency, and patterns vary dramatically from State to State, the data are best considered the lower bound on actual instances of groundwater contamination.
Data Limitations. The maps should not be used to single out individual counties, but rather should be viewed with regional trends in mind because of data limitations. For example, because DRASTIC data are averaged across counties, they mask factors that could point to contamination vulnerability at the subcounty level. Similarly, aggregating county-level pesticide use allows data on crops with high rates of pesticide ap- plications to be averaged in with data on applications to less pesticide-intensive crops grown in the same county. On the other hand, moderate to high pesticide use may put the entire county ''on the map'' even if the high-application area represents a small percentage of the total county land area.
When one or a small group of counties stands alone, as some do in figure 4, there are several possible ex- planations. First, the area actually may be more vulnerable than surrounding areas because of its sen- sitive local hydrogeologic conditions, the production of pesticide-intensive specialty crops, or both. Second, some counties may be quite similiar to surrounding counties but slightly exceed or fall short of cutoff points for pesticide use or for DRASTIC. Idaho's Lin- coln and Minnedoka counties, which are located within an intensively cropped area with medium DRASTIC scores, appear to slightly exceed the high DRASTIC cutoff point. The counties on the northern Missouri border, however, just fail to meet the high pesticide use cutoff, and thus do not appear on the map, even though their DRASTIC scores are similar to

* Figure 4
Potential Groundwater Contamination from Pesticide Use
High DRASTIC, High Pesticides High DRASTIC, Medium Pesticides Medium DRASTIC, High Pesticides

Figure 5
Numbers of Pesticides Found in Groundwater Caused by Agricultural Practices, 1986
^^
^AK
\
k"^ Source: (14)

scores in southern Iowa. Finally, an isolated county may appear on the map because of bias in the data bases, and may not be a true indicator of either a county or a regional vulnerability trend.
Biases may be introduced from several sources. First, averaging may introduce bias. Both data bases we used yield average values which may be highly variable. For example, hydraulic conductivities vary greatly over small geographic areas, yet an average value is used. Second, bias can originate from measurement errors and inconsistencies in the DRASTIC data base, although these are largely unknown because com- parisons with simulations or field data have not been conducted. FHowever, the DRASTIC distribution gener- ally corresponds with known hydrogeologic conditions (2). Finally, extrapolation techniques can introduce some distortions to estimates of regional crop pesticide use. Applying the coefficients derived from California's pesticide use on vegetables to all other States that grow these crops may be the most significant source of bias.^ We considered the alternative of implicitly assuming no pesticide applications in areas with poor data to be less attractive, however. In a similar way, distortion can be caused by applying State or regional coefficients to all counties within the area, thereby masking cross-county variations.
Nitrates
We estimated areas of potential contamination from nitrogen fertilizer use by synthesizing three data sources.
Approach and Data Sources. The primary data source we used for the analysis was the U.S. Geological Survey (USGS) National Water-Data Storage and Retrieval system (WATSTORE), which contains nitrate levels in samples collected over the past 25 years from 87,000 wells throughout the country. To that data base, USGS added statistical information on 36,000 wells ob- tained from the Texas Natural Resources Information System of the Texas Department of Water Resources. Because regional gaps exist in the USGS file, we sup- plemented the USGS data with a proxy for contam- ination developed from DRASTIC and fertilizer use data.
Starting with the USGS data, we used multiple criteria (based on metropolitan status and percent of county in cropland) to exclude from the analysis areas which have little or no agriculture. The exclusions were made to minimize the possibility that high nitrate levels caused by urban sources, such as septic tanks, would be attributed to agriculture. Thus, 753 counties, or one- fourth of the total, were eliminated. Counties with fewer than five wells sampled (661 counties) were also
omitted from the analysis because of insufficient infor- mation. We analyzed the 1,663 counties remaining in the data base for nitrate levels recorded in their groundwater. Well data were analyzed according to the following categories of nitrate-nitrogen levels:
0-3 mg/L (milligrams per liter) -
3.1-10 mg/L
More than 10 mg/L -
Assumed to represent natural background levels, with minimal human influence.
May indicate elevated con- centrations resulting from human activities.
Exceeds maximum concen- tration in EPA's National Interim Primary Drinking- Water Regulations.
We developed a contamination proxy to supplement the USGS data for those 661 counties with insufficient data. In an approach resembling the analysis of pesti- cide pollution potential described earlier, we combined DRASTIC index county ratings with nationally available estimates of nitrogen fertilizer applications for five crops: corn, cotton, soybeans, sorghum, and wheat.^°
The proxy is a rough measure of excess nitrogen ap- plied (amount added minus amount needed). Although the link between excessive nitrogen applications and nitrates in groundwater has been established^\ there are other important influences which cannot be ac- counted for by nitrogen use or DRASTIC data. These influences, which include irrigation practices, natural nitrate-bearing deposits, and natural vegetation, help to explain the results of the analysis, and are discussed later in the report.
We summed the county-level estimates of pounds of nitrogen fertilizer applied per acre across crops and distributed totals into high (greater than 103), medium (52-103), and low (less than 52) categories. Counties at the higher end of the scale tend to be those that grow corn or cotton, or rotate corn and soybeans. As a single crop, soybeans typically fall into the lower levels. Wheat falls into the medium range. Application rates and percentages of acres treated vary widely across States for the same crop, however.
The regular DRASTIC scores were generally lower than the pesticide DRASTIC scores, averaging 109 nationally and ranging from 48 to 214. We grouped these into three categories: high (greater than 121), medium (89-121) and low (less than 89). Combinations of high and medium categories were identified and mapped.
^ An alternative data base on pesticide use is available, based on survey information from Doane Marketing Research, Inc. While it avoids the problem of cross-regional extrapolation, it omits numerous crops. Since some of these crops, particularly vegetables, are often grown in areas vulnerable to contamination and are typically treated heavily with pesticides, we used the RFF data base for our analysis.
^0 At the recommendation of a developer of the DRASTIC index, we used the regular DRASTIC index ratings rather than the pesticide DRASTIC ratings for the nitrate assessment (3),
" See, for example, (27), [52], and {53).
10

Results. The USGS data indicate that of the 1,663 counties analyzed, there were 474 in which 25 percent or more of sampled wells had nitrate-nitrogen levels ex- ceeding 3 mg/L (fig. 6). Counties in which 25 percent or more of wells exceed 10 mg/L are a subset of these and total 87. Figure 6 also maps those 661 counties with insufficient data for which the DRASTIC and nitrogen fertilizer use scores are computed and presented later. Nonshaded areas represent both the 753 counties excluded from the analysis and the 1,189 counties which met the criteria for analysis but in which fewer than 25 percent of sampled wells ex- ceeded 3 mg/L of nitrate-nitrogen.
According to these data, groundwater contamination from nitrate-nitrogen appears to be concentrated in the Central Great Plains; the Palouse and Columbia Basin in Washington; portions of Montana; southwest Arizona; the irrigated fruit-, vegetable-, and cotton- growing areas of California; portions of the Corn Belt; southeast Pennsylvania; and parts of Maryland and Delaware. Within these regions, Kansas, west Texas, and southern Arizona have the highest recorded con- centrations, with 25 percent or more of sampled wells having nitrate-nitrogen levels exceeding 10 mg/L.
Some areas highlighted in figure 6 represent a com- bination of fertilizer applications and irrigation, par- ticularly in California, the Columbia Basin in Washington, northern Texas, and portions of Kansas and Oklahoma. However, not all areas with this com- bination appear as problem areas in figure 6. Florida is an important example.
A major source of the high recorded levels in areas such as the Great Plains and the Southwest may be naturally occurring accumulations. Available informa- tion is inadequate to separate the natural from the human influences, however. It is important to note, though, that human influences such as cultivation or ir- rigation can cause previously stationary natural nitrate deposits to leach to groundwater (44).
Numerous studies focusing on specific locations have confirmed the high nitrate levels shown in figure 6 and, in some cases, have linked these elevated levels to agricultural activities. Examples include Long Island, New York, and sections of Illinois, Nebraska, Iowa, Pennsylvania, California, and Wisconsin (/, 5, 25, 28, 52, 53, 62).
Figure 7 shows the outcome of the analysis based on nitrogen application and DRASTIC scores. Counties combining medium DRASTIC and high nitrogen ap- plications make up the majority of the 441 counties shown on the map. The 441 counties are situated primarily in the Corn Belt, eastern Pennsylvania, and California. Other areas identified as having potential contamination by these criteria are in Washington, Texas, Oklahoma, Georgia, North Carolina, and the Chesapeake Bay area.
Although figures 6 and 7 have many similarities, they do not closely correspond. In particular, figure 7 does not indicate the potential for elevated concentrations of nitrate-nitrogen in groundwater in the Great Plains States although figure 6 shows that they have high levels. The reason may be that the method used to generate figure 7 does not account for some agri- cultural and nonagricultural factors influencing nitrate levels, such as natural nitrate-nitrogen concentrations, livestock operations, differential crop uptakes, and fallowing effects.
Another lack of correspondence may be traced to hydrogeology and normal biological action. The in- vestigation based on the combination of nitrogen ap- plications to the soil and DRASTIC analysis predicts nitrate levels for Georgia's and eastern North Carolina's groundwater. This prediction is not borne out by the data displayed in figure 6, however. Eastern North Carolina and Georgia have high water tables, which may cause excess nitrate-nitrogen to be lost by denitrification or biological uptake by riparian vegeta- tion (35, 36). Furthermore, in areas where the rate of groundwater flow is high and/or where a clay layer underlies the topsoil, nitrate-laden groundwater may be flushed to surface waters fairly quickly [79).
Despite these limitations, we felt that the high levels of nitrogen fertilizer use in the areas such as the Corn Belt where USGS data were insufficient warranted an at- tempt to estimate the groundwater's potential for nitrate contamination from fertilizer, and we used DRASTIC and fertilizer use data only in areas where USGS data were poor. Some information suggests that the analysis based on nitrogen use and DRASTIC data may reflect trends in the Corn Belt. For example, one of the Corn Belt States in which nitrates in groundwater are predicted by the nitrogen use/DRASTIC analysis but for which there is insufficient USGS monitoring data is Il- linois. Several studies have found a statistical relation- ship between fertilizer use and nitrate levels in ground- water in certain parts of that State (7, 42). Similar results have been found in Iowa (27). Because the Corn Belt States are in general hydrogeologically similar (30), these studies might indicate larger regional trends, although the data are unavailable to test such a hypothesis.
We synthesized the two data analyses on potential nitrate contamination by supplementing the USGS data base with information from the nitrogen applications/ DRASTIC analysis. The 474 counties in which 25 per- cent or more of sampled wells exceeded 3 mg/L were identified as having elevated nitrate-nitrogen concentra- tions in groundwater due mainly to nitrogen fertilizer use. Those 661 counties with insufficient data shown in figure 6 were supplemented with information from the 441 counties identified through the analysis based on nitrogen applications and DRASTIC scores shown in figure 7. (Any identified county in figure 7 correspond- ing to a county with insufficient information in figure 6 became an additional county labeled as having poten-
11

Figure 6
Nitrate-Nitrogen Distribution in Groundwater in Agricultural Areas
High Nitrate Levels Moderate Nitrate Levels Insufficient Data

Figure 7
Combinations of Nitrogen Fertilizer Use and DRASTIC Ratings^
High DRASTIC, High Nitrogen High DRASTIC, Medium Nitrogen Medium DRASTIC, High Nitrogen
1/ Fertilizer use data include five crops: corn, wheat, soybeans, cotton, and sorghum.

tial nitrate problems.) The matching process identified 149 counties (principally in the Midwest) which, when added to the 474 counties in the USGS data base, pro- duced a total of 623 counties with nitrate-nitrogen in groundwater attributed chiefly to large nitrogen fer- tilizer applications.
Figure 8 maps the combined analysis. The first two categories, high and medium nitrate levels in ground- water, correspond to the first two categories in figure 6. The third category, vulnerable areas with insufficient USGS data, represents those 149 counties identified by the nitrogen use/DRASTIC analysis as potentially contaminated.
Data Limitatioos. The USGS data represented by figures 6 and 8 do not represent a random sample of all U.S. wells or aquifers because the types of wells sampled, the numbers of wells, the time period covered, and the areal coverage of sampling networks differ from State to State and within States (44). For ex- ample, the data from one county grouped in a high category may represent only observations from shallow wells in areas of suspected contamination while another county's data may reflect a more areally representative sample. Little information was available for portions of some States because data were not in a machine-readable form or there had been limited data collection and analysis efforts [44).
Nonagricultural influences cannot be completely eliminated, nor can those of natural background levels of nitrate-nitrogen and atmospheric deposition. All are unquantified and vary widely from one location to another. Moreover, agricultural influences independent of fertilization might be reflected in the data. For in- stance, intensive livestock operations such as dairy farming carried out in portions of Pennsylvania, New York, and Wisconsin, and feedlot operations in such areas as Texas and parts of the Southeast, may have in- fluenced the data. We expect these influences to be primarily local, however.
Because the nitrogen fertilizer application data used to supplement the USGS analysis reflected in figure 7 are limited to five crops in major producing areas, the data underestimate national commercial nitrogen fertilizer use. Since data on nitrogen fertilizers were used only as supplements to observed nitrate contamination levels in groundwater, however, the effect of this shortcoming is minimal. The Corn Belt and the Southeast are the major regions with missing USGS data. These are the regions for which it was possible to employ the sup- plemental nitrogen use/DRASTIC index analysis because they primarily grow the crops for which nitrogen fertilizer estimates are available.
Nitrogen application rates, as noted above, only roughly approximate excess nitrogen applied. Very high rates may not be excessive due to very high yields or the nature of the agronomic system. Low application
rates may be excessive if yields or plant nitrogen re- quirements are very low.
Furthermore, aggregated nitrogen application data, like the pesticide application data, were extrapolated to the county level based on crop acreages. As a result, in- dividual counties may actually receive applications significantly different from Statewide averages. Finally, the reader should note that the extent to which the DRASTIC index is appropriate for predicting potential contamination from nitrates is open to question because of the complexity of the factors and processes determining their fate. However, we believe the nitrogen use/DRASTIC index can provide useful sup- plemental data in some regions.
Areas Potentially Affected
Together, areas with potential groundwater contamina- tion from pesticide and/or fertilizer use account for 1,437 counties, or about 46 percent of the counties in the conterminous States. Figure 9 shows evidence of regional trends. Counties with only potential pesticide contamination total 814, and are located largely along the Eastern Seaboard, gulf coast, and the Upper Midwest. Counties with only potential nitrate con- tamination total 309, and are located principally in the Great Plains and portions of the Northwest and Southwest. Only 314 counties, or less than one-fourth of those identified as having potential contamination from agricultural chemicals, show both high pesticide and nitrate contamination potential. These are located chiefly in parts of the Corn Belt, the Lake States, and the Northeast.
These 1,437 counties with pesticide and/or nitrate con- tamination potential are cropped intensively, with 33 percent of all land area in crops compared with 16 per- cent nationwide. About 70 percent of the crop acreage in the sample is devoted to corn, wheat, and soybeans. Though strongly agricultural, these counties are heavily populated, with 27 percent of the land but 47 percent of the population.
Population Potentially Affected
People who live where the groundwater contamination potential from agriculture is high and consume mostly groundwater are most likely to incur the highest costs. To estimate the potentially affected population, we used data from the 1980 Census of Population and Housing on drinking water sources for the 1,437 poten- tially contaminated counties [74), The census provides data on populations using water from private wells and from public systems.^^ In its statistics on public sup-
^2 The term ''public system," as used in this report, refers to both public and private water supply systems which serve six or more households.
14

Figure 8
Potential Groundwater Contamination from Nitrogen Fertilizers
High Nitrates (USGS Data) Medium Nitrates (USGS Data) Potentially Contaminated (DRASTIC/Fertilizer Data)

^ Figure 9
Areas of Potential Groundwater Contamination from Agricultural Chemicals
Nitrates and Pesticides Nitrates Only Pesticides Only

plies, the census does not differentiate between surface water and groundwater sources.
Over 19 million people in these counties obtain their drinking water from private wells (table 2). Over 65 percent of these people (12.6 million) live in areas where only potential pesticide problems are predicted, while less than 10 percent (1.7 million) live in areas with only potential nitrate problems. The remainder (5.1 million) reside in areas with a potential for both pesticides and nitrates in groundwater.
Table 2—Population obtaining drinking water from private wells in potentially contaminated areas
Contamination type Persons
Nitrates only Pesticides only Nitrates and pesticides
Total
Thousands 1,674
12,592 5,075
19,341
Figure 10 depicts the geographic distribution of people relying on private wells. Counties with at least 40,000 people using private wells are found in parts of Florida and North Carolina; portions of the Northeast including areas in Delaware, New Jersey, northern Maine, Penn- sylvania, and northwestern New York; parts of the northern Midwest (particularly Michigan and Wiscon- sin); and in several portions of central California. Areas with at least 10,000 but fewer than 40,000 people us- ing private wells are usually found surrounding the counties having the highest populations using wells. Other counties in this range can be found in the Northwest, in Arizona, and in scattered parts of the Great Plains, Midwest, and Southeast. Areas con- sistently showing lower levels of population using private wells are predominantly in the Plains States, portions of the Midwest, and in western Kentucky.
In these 1,437 counties, 19 percent of the population relies on private wells for their drinking water. In con- trast, in all other countries in the conterminous United States (that is, all unshaded counties in figure 10), only 12 percent of the population use private wells as their drinking water source. Overall, private wells are more vulnerable to contamination than deeper, regulated public wells. Thus, not only do people in the areas we identified appear to face a greater likelihood of ground- water contamination from agricultural chemicals but they may also face a greater probability of exposure, given contamination, because of their heavy reliance on private wells.
Since a consistent county-level data base on the population relying on public groundwater supplies for drinking water needs is unavailable, we developed estimates based on State-level figures.^^ We derived ratios of persons served by public groundwater supplies to persons served by all public supplies from USGS data (65). We then applied these ratios to the county- level data on populations served by public water sup- plies. This methodology implicitly assumes that little or no within-State variability exists with respect to public
^3 The EPA Federal Reporting Data System data base (FRDS), which is collected primarily for regulatory purposes, contains information on all public water supplies in the country. We explored the possibility of using this system to obtain county-level data but found that critical data items such as population served were inconsistently reported across States, making a broad geographical analysis impossible.
groundwater supplies. As a result, there may be dis- crepancies between actual and estimated populations relying on public groundwater supplies in some areas.
An estimated 34.5 million people living in areas of potential contamination are served by public ground- water systems. Table 3 shows State-level statistics, derived by summing the individual county estimates. Florida, Illinois, Indiana, Ohio, California, Iowa, Min- nesota, Michigan, Wisconsin, New Jersey, New York, and Pennsylvania all have populations of at least 1 million estimated to depend on public drinking water supplies. Add to these the 19 million people who rely on drinking water from private wells, and there are a total of nearly 54 million people living in potentially contaminated counties who obtain their drinking water from underground sources, both public and private.
As with users of private wells, the majority of the 34.5 million people served by public groundwater systems (68 percent) reside in areas with only potential pesti- cide contamination. The rest are divided nearly equally into those living in areas of potential nitrate contamina- tion only and those living in areas of both potential pesticide and nitrate contamination. Table 4 breaks down the estimated population using public ground- water supplies according to type of potential contamination.
Summary
The data presented in figures 4-10 have several im- plications for defining the magnitude of groundwater contamination from agricultural chemicals. First, they indicate that groundwater contamination from agri- cultural chemicals is not national in scope. Areas of potential contamination appear to be regional, often ex- tending beyond local or State jurisdictions.
Second, they indicate that pesticides and nitrates in groundwater do not necessarily occur together. In fact, in three-fourths of the 1,437 potentially contaminated counties, pesticide and nitrate problems are not predicted simultaneously. The presence of nitrates may suggest pesticide problems and vice versa, but the association is weak. This finding suggests that strategies for controlling the entry of pesticides to groundwater may need to be different than those aimed at control- ling groundwater contamination due to nitrates.
17

œ Figure 10
Distribution of Population Using Private Wells in Potentially Contaminated Areas
0 - 9,999

Table 3—Population served by all public water supplies in potentially contaminated areas, by State
Persons served Persons served by publ ic water supplies by public sup-
plies with a Potentially in potentially contam inated counties
State groundwater contaminated Surface water and Groundwater only
source^ counties groundwater (estimated)^
Percent Number Percent^ Thou san ds
Alabama 41 38 57 1,579 648 Alaska 60 NA NA NA NA Arizona 61 2 14 1,547 944 Arkansas 52 17 23 386 201 California 43 16 28 4,115 1,769
Colorado 13 14 23 842 110 Connecticut 21 1 13 44 9 Delaware 51 3 100 446 227 Florida 87 60 91 7,600 6,612 Georgia 32 93 59 1,587 507
Hawaii 95 NA NA NA NA Idaho 83 6 14 271 225 Illinois 38 58 57 7,364 2,798 Indiana 57 83 91 3,679 2,097 Iowa 75 93 94 2,151 1,613
Kansas 52 88 74 1,741 905 Kentucky 15 95 80 1,674 251 Louisiana 59 31 50 1,166 688 Maine 21 4 25 223 47 Maryland 12 21 91 2,557 307
Massachusetts 29 1 8 99 29 Michigan 20 51 61 6,382 1,276 Minnesota 65 62 71 2,145 1,395 Mississippi 91 24 29 653 595 Missouri 32 10 9 293 94
Montana 35 5 9 85 30 Nebraska 78 69 74 980 764 Nevada 46 0 - - - New Hampshire 52 0 - - - New Jersey 46 13 62 2,696 1,240
New Mexico 91 1 3 8 7
New York 22 21 37 5,593 1,230
North Carolina 15 66 66 2,006 300
North Dakota 51 3 6 82 42
Ohio 33 60 68 6,089 2,009
Oklahoma 28 33 43 501 140
Oregon 29 1 3 53 15
Pennsylvania 25 43 65 5,093 1,273
Rhode Island 16 1 20 63 10
South Carolina 23 30 65 1,353 311
South Dakota 71 10 16 156 111
Tennessee 39 32 34 1,839 717
Texas 44 67 26 1,986 874
Utah 51 0 - - - Vermont 35 0
See notes at end of table.
19

Table 3—Population served by all public water supplies in potentially contaminated areas, by State—Continued
State
Persons served by public sup-
plies with a groundwater
source^
Potentially contaminated
counties
Persons served by public water supplies in potentially contaminated counties
Surface water ar id Gi roundwater or liy groundwater (estimated) 2
-Th( jusands-
1,182 213 484 310 105 32
2,718 1,441 7 3
Virginia Washington West Virginia Wisconsin Wyoming
TotaH
Percent
18 64 31 53 38
Number
43 13 4
50 1
1,437
Percent^
45 33
7 69
4
81,850 34,492
- Indicates that, according to the analysis, there are no potentially contaminated counties in the State. NA indicates States not included in the analysis. 1 Calculated as the total State population served by public groundwater supplies divided by the total State population served by all public
supplies. 2 Estimated by multiplying the number of people served by public surface water and groundwater supplies by the percentage of people served
by public supplies with a groundwater source. 3 Calculated as the number of potentially contaminated counties divided by the total number of counties in the State. 4 Totals may not add due to rounding.
Sources: (65, 74).
Table 4—Population using drinking water from public groundwater supplies in potentially contaminated areas^
Contamination type Persons
Nitrates only Pesticides only Nitrates and pesticides
Total
Thousands
5,401 23,450
5,641
34,492
1 Numbers are estimates.
Finally, according to this assessment, chemical con- tamination of groundwater from agriculture primarily af- fects farming and rural areas, but has a potential effect on a significant part of the entire U.S. population, 53.8 million people. This large potential effect results from the density of population in the affected areas and a heavy reliance on groundwater.
Potential Effects and Costs of Agriculturally Contaminated Groundwater
The economic significance of the findings shown in figures 4-10 is reflected in the costs that society and in- dividuals incur from agriculturally contaminated groundwater. Table 5 summarizes potential effects and documented incidents. As the table shows, the effects could be potentially very significant, particularly in terms of human health. However, available data on contamination occurrences and costs are very limited at the national or regional level, making direct assessment difficult. Some analysis has been undertaken to mea-
sure the environmental and social costs, although an examination of these estimates reveals problems in- herent in developing national cost assessments from ex- trapolations of limited or local data (51).
Assessing and Regulating Human Health Risks
The primary potential effects of agricultural chemicals in groundwater are human health risks. Evidence on human health risks associated with nitrates and pesticides in groundwater, however, is spotty and often contradictory for several major reasons.
First, while acute toxicities can be evaluated from laboratory research and accident case studies, risks from low-dose exposures over a long period of time are much more difficult to evaluate. If there is an effect, it may take years or decades to develop so that "cause and effect" is difficult to establish. Scientists, therefore, must often make inferences from high-dose responses to low-dose responses, or from animals to humans.
Second, synergistic effects, or reactions from chemicals in combination, are extremely difficult to analyze. A factor that further compounds risk assessment problems is the difficulty of detecting some water pollutants at very low concentrations.
Finally, people can be exposed to pesticides and nitrates in a variety of ways. Besides ingesting water, people may be exposed to pesticides and/or nitrates from the food they eat. Contaminated household water can also lead to exposure to some organic chemicals from inhalation or skin absorption during showering or bathing. Pesticide applicators are subject to potentially high exposure levels if they do not take adequate
20
precautions. In theory, all routes of exposure should be accounted for in risk analysis. In practice, risk assess- ment researchers normally assume that 20 percent of a person's daily intake of a particular drinking water con- taminant actually comes from drinking water (76).
EPA is responsible for developing primary regulations for pollutants that may adversely affect human health under the guidelines of the Safe Drinking Water Act. Under the act, Maximum Contaminant Level Goals (MCLG's) are set for certain drinking water con- taminants, based on established ''safe" levels. The MCLG is a nonenforceable health goal for chronic ex- posure to those contaminants and it is set to zero for carcinogens. The Maximum Contaminant Level (MCL) is an enforceable standard that is set as close to the MCLG as possible, given available treatment tech- nology. EPA also establishes Health Advisories (HA's) for some chemicals, which are nonenforceable stan- dards for short-term exposures.
EPA regulations apply to the 58,000 ''community" water supplies in the United States that serve 25 or
more people or have at least 15 service connections. "Noncommunity" systems, which serve transient populations (for instance, restaurants and campgrounds) must comply only with those regulations for pollutants thought to have potentially acute health risks (76). Monitoring requirements are stricter for systems draw- ing from surface water sources (such as reservoirs) than for groundwater systems. Residential water supplies, on the other hand, are unregulated by EPA.
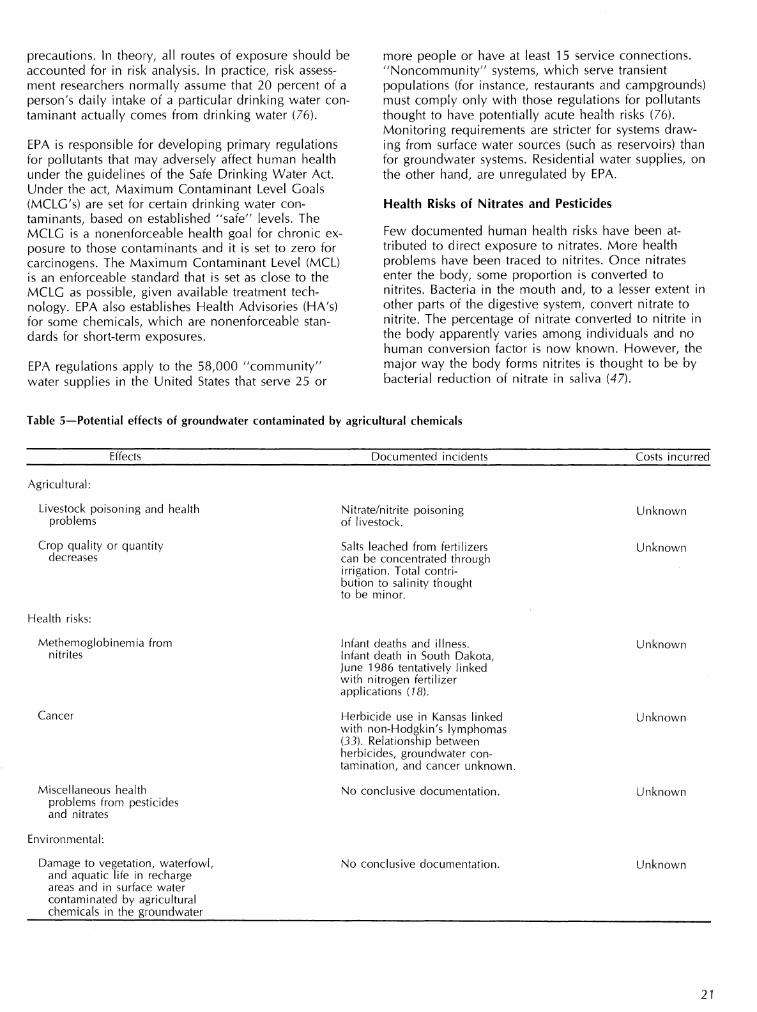
Health Risks of Nitrates and Pesticides
Few documented human health risks have been at- tributed to direct exposure to nitrates. More health problems have been traced to nitrites. Once nitrates enter the body, some proportion is converted to nitrites. Bacteria in the mouth and, to a lesser extent in other parts of the digestive system, convert nitrate to nitrite. The percentage of nitrate converted to nitrite in the body apparently varies among individuals and no human conversion factor is now known. However, the major way the body forms nitrites is thought to be by bacterial reduction of nitrate in saliva (47).
Table 5—Potential effects of groundwater contaminated by agricultural chemicals
Effects Documented incidents Costs incurred
Agricultural:
Livestock poisoning and health problems
Crop quality or quantity decreases
Nitrate/nitrite poisoning of livestock.
Salts leached from fertilizers can be concentrated through irrigation. Total contri- bution to salinity thought to be minor.
Unknown
Unknown
Health risks:
Methemoglobinemia from nitrites
Cancer
Miscellaneous health problems from pesticides and nitrates
Infant deaths and illness. Infant death in South Dakota, June 1986 tentatively linked with nitrogen fertilizer applications {18).
Herbicide use in Kansas linked with non-Hodgkin's lymphomas [33]. Relationship between herbicides, groundwater con- tamination, and cancer unknown.
No conclusive documentation.
Unknown
Unknown
Unknown
Environmental:
Damage to vegetation, waterfowl, and aquatic life in recharge areas and in surface water contaminated by agricultural
chemicals in the groundwater
No conclusive documentation. Unknown
21

The best documented human health risk from nitrites is infant methemoglobinemia. Nitrates are reduced to nitrites in an infant's digestive tract, apparently because a newborn lacks acidity in the stomach and upper part of its intestinal tract. Infants absorb nitrites into their bloodstream where the nitrites Interact with hemoglobin to produce methemoglobin. Because that substance does not carry oxygen to body cells, the body's oxygen supply is reduced. Very high concentra- tions of nitrates in drinking water can be fatal to in- fants, particularly within the first 3 months of life. Reported instances of deaths from infant methemo- globinemia in the United States are rare. However, the true incidence is unknown because cases are not re- quired to be reported. Several other categories of in- dividuals are susceptible to methemoglobinemia, in- cluding pregnant women. Bottled water is now recom- mended in the United States where nitrate levels in the water exceed the Interim MCL of 10 mg/L. The MCL for nitrates applies to both community and noncom- munity systems {76).
Though carcinogenic effects of nitrites have been in- vestigated, a more direct cancer link has been traced to nitrosamines than to nitrites. Nitrosamines can be formed when nitrites combine with other substances such as amines. Most researchers agree that it is beyond question that nitrosamines are potent car- cinogens for a wide range of target organs in many animal species (48).
However, because studies on humans are limited and in some cases produce contradictory results, it is dif- ficult to prove conclusively that nitrites or nitrosamines are true risk factors in the development of forms of human cancer. The weight of animal evidence and results of limited human studies suggest that an association between nitrate consumption and its re- duced forms of nitrites/nitrosamines and human cancer is plausible. Until further studies are conducted, no definitive conclusions can be reached.
The degree of risk associated with using and ingesting water containing pesticide residues is also much- studied but poorly understood. Since all pesticides are designed to be toxic to certain forms of life and because few are completely selective In their actions, most could adversely affect human health, depending on their concentrations. The degree of toxicity and the nature of the effects vary widely with the pesticide, as does the degree of knowledge about the mechanisms and effects of pesticide action {45).
Based on risk assessments, EPA canceled the uses of two nematicldes, EDB and DBCP, due to evidence that they cause genetic mutations, reproductive disorders, and cancer {76), Both chemicals have been found in groundwater. Other chemicals are currently being studied by EPA. For example, alachlor, an acetanllide herbicide widely used on corn and soybeans and found in groundwater in four States, has also shown
strong evidence of being a carcinogen (76). Triazine herbicides (for example, atrazine, cyanazine, and simazine) are groundwater contaminants and, though not known to be carcinogens, are suspected of causing long-term effects including central nervous system (CNS) disorders {22). Widely used phenoxy acid her- bicides which are potential leachers, such as 2,4-D, 2,4,5-T, and 2,4,5-TP (Silvex), are also suspected of causing CNS disorders and a variety of other chronic effects {22, 43). A recent study has linked the applica- tion of 2,4-D with certain forms of cancer in farmers (33). MCLG's have been established for six pesticides: endrin, llndane, methoxychlor, toxaphene, 2,4-D, and 2,4,5-TP. EPA is currently developing MCLG's and MCL's for additional pesticides and other organic chemicals (66).
While the actual risks from low-level exposure to agricultural pollutants are uncertain, the public percep- tion appears to be that they are significant. A recent national public opinion survey of randomly selected people found that only one person in five believes that drinking water which has small amounts of chemicals but which satisfies Government regulations is safe to drink. Moreover, one-third of the respondents said either that they thought their home drinking water was unclean or that they were not sure about Its safety. One-fourth either drank bottled water or used a filter- ing system for their household water (7). Readers of National Wildlife magazine, presumably a group with a higher than average awareness of environmental issues, rank drinking water contamination as the number one environmental threat, according to a 1986 survey {49). Avoiding drinking water contaminated by agricultural and other chemicals is a clear priority of many, despite the lack of definitive answers about health risks.
Measuring Social Costs
Because it is difficult to directly address the costs to society from chemicals in groundwater by means of a risk assessment process, researchers have estimated the social costs of preventing or avoiding groundwater con- tamination. Estimations can be based on expenditures associated with groundwater protection procedures. Raucher, for example, has examined the benefits and costs of groundwater contamination policies using a ''damages avoided" framework on a site-by-site basis (55, 56). Such an approach has several limitations, however, as Raucher notes. It ignores values that so- ciety may place on uncontaminated aquifers indepen- dent of current or anticipated use. Option values, existence values, or bequest values have been exten- sively discussed in the resource economics literature and some limited evidence suggests that the size of these benefits may be significant. Raucher also notes that the framework he proposes is useful for a case study analysis but may not be equally applicable to a more comprehensive analysis. The magnitude of benefits from protecting any one aquifer may be small In isolation, but the contamination of many aquifers could be extremely costly to society.
22

Recognizing the limitations, this report uses a ''dam- ages avoided" approach to evaluate macro-level costs of agriculturally induced groundwater contamination. One way to estimate what society must pay to reduce an unspecified contamination risk is to appraise avoidance costs. To do this, we analyzed avoidance costs for households using private wells and public systems. We studied the household sector because private wells are a significant water source in poten- tially contaminated areas, and the health risks faced by households are the most widely cited effect of ground- water contamination.
Figure 11 presents a framework for household decision- making in areas facing groundwater contamination. The first step in any decisionmaking process is to obtain in- formation about potential risks. In the case of ground- water, this information gathering is normally done by sampling well water and conducting laboratory tests. If positive test results are obtained and verified, households can assess the information based on their own risk preferences.
If the monitoring information indicates that ground- water contamination is a problem, or if a household decides that it faces significant risks, remedial action can then be taken. Bottled water, filters, or new wells are the most likely alternatives for rural households. Hooking up to deeper, public system wells may be an alternative for some households.
For a household situated in a potentially contaminated area where no immediate remedial action is needed, resampling for contaminants at periodic intervals is probably desirable. Remedial action may be necessary later.
A framework of this kind suggests that estimating what household monitoring costs will be is the first step in appraising groundwater contamination avoidance costs. Because appropriate remedial responses can only be determined on a site-specific basis, estimating remedial response costs for potentially contaminated counties is infeasible. Instead, we discuss a range of remedial op- tions for households and public systems.
Monitoring Costs
Using the framework shown in figure 11, the first step in estimating avoidance costs is to determine monitor- ing costs. We estimated monitoring costs for house- holds in potentially contaminated areas as well as those of public systems for comparative purposes.
Households. Not every household in a potentially con- taminated area would choose to undergo monitoring. Some would decide that any potential risk warrants remedial action, bypassing monitoring altogether. Others may decide that no matter what the monitoring results indicate, no action is necessary. Our current
data base does not allow us to determine individual risk preferences. Consequently, the household monitor- ing costs we provide are estimates of initial monitoring costs of all households served by private wells in areas of potential groundwater contamination, given the assumptions made in the analysis. These estimates can be used, however, to make comparisons between monitoring costs for pesticides and nitrates and be- tween monitoring costs for private wells and public systems. The comparisons have useful implications for public policies.
To estimate household monitoring costs, we obtained a list of laboratories from EPA which are capable of testing water for pesticides and nitrates.^"^ We selected a sample of those laboratories located in the 1,437 potentially contaminated counties and obtained price information on nitrate and pesticide testing. Since prices of public laboratories may not reflect market prices, only estimates from private laboratories were used in the analysis.
The laboratories provided cost analysis information on nitrates and pesticides that can be analyzed by four EPA-approved analytical methods. The pesticides were alachlor, metribuzen, bromacil, atrazine, aldicarb, car- bofuran, methomyl, dinoseb, and 2,4-D. These pesti- cides were selected from the 38 used in our analysis of potentially contaminated areas.
Based on discussions with the University Hygienic Laboratory of the University of Iowa and with private laboratories, we developed several criteria for deter- mining monitoring costs. These criteria and the assumptions we used are:
1. The number of chemical tests performed is a ma- jor determinant of monitoring costs. Although groups of pesticides can be analyzed with one laboratory method, each chemical requiring a separate procedure is priced individually. Thus, the number of tests performed rather than the number of chemicals analyzed determines the cost. We assumed that two chemical tests for pesticides were conducted.
2. The resampling required to assure quality control varies widely from laboratory to laboratory depending on the reliability of the analytic pro- cedure used. A 33-percent resampling rate for nitrates and pesticides was used in our analysis to allow for quality control analysis of positive results.
3. Pesticide testing costs vary widely across labo- ratories. No discernible regional patterns were
14 This list was provided by Maria Gomez-Taylor, Office of Drink- ing Water, EPA.
23

Figure 11
Household Decisionmaking in Areas with Potentiai Groundwater Contamination
Individual Perception of Risk
Informational Costs
—Groundwater Monitoring—
No Immediate Action
Remedial Action
Filters Bottled Water
New Well Hookup to
Public System
Resampling
4 ÍL
No Action Remedial Action
24

detected. Water sample bottles were sometimes included in the laboratory prices. The type of test performed was a major determinant of cost, but laboratories did not uniformly charge more for a particular test. Pesticide laboratory costs, in- cluding bottles, were estimated to average from $53 to $139 per test, with $84 a midpoint.
4. Testing for nitrates is a much simpler procedure than testing for pesticides. Our estimates on nitrate costs, including bottles, range from $10 to $25, averaging $16.
5. Shipping and labor costs add to monitoring costs because households must collect samples and mail them to laboratories. One-half hour of labor to collect samples was estimated at an hourly wage rate of $3.35, or $1.68. Shipping costs were estimated to be $1.30 for a 4-ounce nitrate sample, and $3.50 for an 8-pound pesticide sam- ple for two tests. Pesticide tests require larger water samples than do nitrate tests. A 100-mile distance was used to estimate shipping costs with both the United Parcel Service and the U.S. Postal Service. An average of the costs of the two shippers was developed. Estimated shipping and labor costs were $3.00 per well for nitrates and $5.18 per well for pesticides, with and without additional tests for nitrates.
five communities contained measurable amounts of pesticides, although the levels did not violate any MCL standards. Furthermore, the contamination often in- volved more than one chemical, in one case, a well contained six pesticides. The Iowa study suggests that many wells in potentially contaminated areas may have low concentrations of pesticides, possibly indicating a need for a higher resampling rate (greater than 33 per- cent) and more than two laboratory tests.
In addition, in cases where low concentrations of pesticides are detected, it is likely that monitoring will be an ongoing process rather than a one-time cost. Consequently, some portion of the initial estimate of $1.36 billion for monitoring costs could be spent
annually.
Table 8 presents monitoring costs by contaminant. Only $14 million of the $1.36 billion in monitoring costs are attributable to nitrates alone. Pesticides, alone or in combination with nitrates, represent the majority of monitoring costs because they affect a larger geographical area and incur higher laboratory costs.
Figure 12 shows how monitoring costs are distributed regionally. High-cost counties (those with $1 million or more in monitoring costs) account for nearly 74 per- cent of total monitoring costs nationwide and are con-
Table 6 shows cost estimates for monitoring various agricultural contaminants per private well. The wide- ranging costs for detecting pesticides reflect laboratory costs which were estimated by averaging data on four pesticides: alachlor, atrazine, aldicarb, and 2,4-D. Variations in nitrate costs also reflect laboratory cost
differences.
We multiplied the estimates of monitoring costs by private well in table 6 by estimates of the numbers of private wells in potentially contaminated areas derived from census data on nonpublic well systems (table 7). Approximately 10.9 million private well systems are in use in the 1,437 potentially contaminated counties. The calculations include a 33-percent resampling rate.
Data in table 7 reflect a range of initial monitoring costs for these private wells. The estimates range from a high of $2.2 billion to $0.9 billion, depending on the laboratory cost estimate used. The average or ''best" estimate is $1.36 billion. Although these estimates reflect the upper limits on the number of wells monitored, other assumptions in the analysis, such as the resampling rate and number of tests performed, may yield more conservative estimates. A study con- ducted by the Iowa Department of Water, Air, and Waste Management supported that view. The study reported that shallow wells serving six city water sup- plies in northwestern Iowa contain pesticides and other synthetic organic chemicals (38), Seven wells serving
Table 6—Monitoring cost estimates per private well by contaminant
Contaminant Low Average High
Pesticides and nitrates 123 Pesticides 113 Nitrates 13
Dollars
189 173
19
308 283
28
Table 7—Range of initial monitoring costs for private vyelis in areas of potential groundwater contamination
Monitoring cost assumptions Cost
High Average or Low
'best"
BiHion dollars
2.21 1.36
.89
Table 8—Initial monitoring costs, by contaminant, for private wells in areas of potential groundwater contamination
Contamination type Total cost Counties
Million dollars Number
Pesticides and nitrates Pesticides Nitrates
414 929
14
314 814 309
Total 1,357 1,437
25

Figure 12
Groundwater Monitoring Costs in Potentially Contaminated Areas
$1 million + $ 500,000 - $999,999 $ 125,000 - $499,999

centrated in Wisconsin, Michigan, Ohio, Pennsylvania, New York, Maine, parts of the southeastern Coastal Plain, Florida, and California. These areas are more densely populated than other potentially contaminated locales. They average 230 persons per square mile compared with 102 persons per square mile in all areas with potential groundwater contamination. These areas also have a slightly higher percentage of popula- tion using private wells: about 21 percent compared with 19 percent in potentially contaminated areas na- tionwide. Finally, the areas with high monitoring costs are those which have high predicted potential pesticide contamination, or where pesticides and nitrates are potentially found together.
Public Systems. Approximately 34 million people living in the areas with potential contamination obtain their water from public systems drawing on groundwater. Public wells are also subject to groundwater con- tamination from agricultural chemicals, although they are likely to intercept deeper aquifers and draw from much larger areas than a typical private well. Public systems are usually more highly regulated than private wells, which are subject to no Federal regulatory stan- dards. Nitrates, however, are the only agricultural chemical that community groundwater systems periodically analyze on a nationwide basis.
To compare contamination avoidance costs between private wells and public systems, we developed monitoring cost data for public systems in potentially contaminated areas. Because nitrates are monitored under an ongoing program, we analyzed only costs associated with pesticide monitoring. Our starting points were the county-level estimates of populations using public groundwater supplies, derived earlier in our analysis.
Because data were not available on the size distribu- tion of public groundwater systems, we assumed that the average public system in the study counties serves 3,300-10,000 people. Then we applied EPA assump- tions about a public system of this size.^^ por an analysis of the costs associated with implementing standards for volatile organic chemicals (VOC's), EPA assumed that a system of this size would be served by eight wells with four entry points. Further, samples are taken at each entry point, so that an average of four samples per year is taken for each chemical. EPA assumed a 30-percent resampling rate to screen for VOC's in systems serving more than 3,300 people.
We added to the EPA assumptions one more assump- tion made in the analysis of private wells; namely, that two chemical tests would be performed. We presumed a 5-percent quantity discount on laboratory costs for a system of this size. Monitoring costs for a typical system then became the product of:
^5 Unpublished data provided by Maria Gomez-Taylor, Office of Drinking Water, EPA.
$160 (the average cost of two chemical tests at $84 per test with a 5-percent quantity dis- count) and
4 (the number of entry points) and
4 (the number of samples per year),
or $2,560.
We do not know the number of public groundwater systems in the 1,437 potentially contaminated counties. There are, however, approximately 29 million people served by public groundwater systems in counties with pesticide contamination potential. Dividing $2,560 by the midpoint of the population served by a typical system (6,650) yields a monitoring cost estimate of $0.38 per person. Multiplying the per-person cost of $0.38 by 29 million people would result in a total of nearly $11 million in initial monitoring costs for a 1-year period. Assuming a 30-percent resampling rate to confirm positive samples, initial monitoring costs for public systems in potentially contaminated areas would be $14 million.
As with household monitoring costs, the choice of assumptions can determine cost estimates. If the average public system serves fewer than 3,300 people and/or if more than two chemical tests are performed, the estimate would increase. On the other hand, if the average system serves more than 10,000 people, the estimate would decrease. Limited data on public groundwater systems prevents developing more precise estimates. However, even if we allow for a confidence interval of ±100 percent for public system monitoring costs, those costs are significantly less than the $1.4-billion estimate developed for private wells in the same areas. The major reason for large differences in monitoring costs between private and public systems is that public groundwater systems afford economies of size.
Summary. The monitoring cost approach does not directly address the costs of damages society incurs from groundwater contamination caused by agricultural chemicals. Lack of documentation about health and other risks makes such an aggregate damage assessment difficult. The monitoring cost approach also ignores values society may place on uncontaminated ground- water for reasons independent of current or anticipated aquifer use.
We present the monitoring cost data to partially il- lustrate the costs households and communities incur in identifying risks. Monitoring is often the first, informa- tional step in an avoidance strategy. While measuring monitoring costs does not directly ascertain risk preferences of people in affected areas, it does allow useful comparisons among groundwater users in poten- tially contaminated counties.
27

The data suggest that the costs of avoiding risks im- posed by groundwater contamination from agricultural chemicals are potentially significant. Initial monitoring costs for households would range between $0.9 and $2.2 billion, with $1.4 billion being a "best" estimate. Monitoring for pesticides constitutes the major expense.
The data also clearly indicate that, within the poten- tially contaminated areas, the consequences created by agricultural chemicals in groundwater will be borne by the rural sector. Because monitoring costs are the same regardless of well size, communities with more and larger volume wells can spread monitoring costs over a network of users. In addition, quantity discounts are likely available. Private well owners, on the other hand, must directly bear all costs, whether they are for monitoring or remedial action. Thus rural residents who rely on private wells, and farmers in particular, will incur a large portion of the expenses.
Remedial Responses
Communities and households have a number of op- tions available to them in responding to known or suspected contamination (see fig. 10). Possible responses range from accepting perceived risks (con- tinuing to drink the water) to avoiding risk (adopting a remedial strategy). We provide only a brief overview of these options, not a decisionmaking guide.^^ We make no attempt to relate remedial costs to the identified potentially contaminated counties because the choice of remedial options depends on the risk preferences of individual well owners and on local conditions.
Households. Households seeking to avoid potential risks from chemicals in their drinking water may choose either to remove the contaminant(s) from the water or to obtain alternative drinking water supplies. The alternative chosen will depend on the costs and ef- fectiveness of the various options, and on household preferences. Table 9 summarizes the major options available and their estimated costs.
Installing home water treatment ("point-of-use") units can reduce contaminants in water that is publicly or privately supplied. The type of contaminant and the natural constituents in the water will determine which kind of device should be used. Pretreatment for natural substances such as iron might be necessary to ensure that treatment for pesticides or nitrates will be effective.
Cost ranges for treatment units shown in table 9 reflect in part the system's capacity and coverage (for exam-
ple, single-tap or whole-house treatment). Costs also vary with the way that dealers market their products, and while they may vary with the quality of the pro- duct, they do not necessarily reflect the unit's effec- tiveness. These units are not regulated by the Federal Government, nor are they regulated by many State governments.
Most treatment processes have periodic maintenance costs in addition to the purchase price. For instance, maintenance costs for activated carbon units include periodic filter replacement, which could cost from $200 to $350 annually for a whole-house system. An- nual costs of replacing membranes and filters in reverse osmosis units could cost $100 to $150. Ion exchange units also require periodic maintenance to assure con- tinued reduction of nitrates.
Households can obtain new sources of water by pur- chasing bottled water for drinking and cooking needs, connecting to a public water supply, or drilling a new
Table 9—Household remedial options to reduce agricultural chemicals in drinking water
Option Estimated costs
Water treatment unit:^
Activated carbon filtration (to reduce pesticides)
Distillation (to reduce pesticides and nitrates)
Ion exchange (to reduce nitrates)
Reverse osmosis (to reduce pesticides and nitrates)
Bottled water
New well
Hookup to public system
Faucet-mounted Under-the-sink Whole-house
$25-$50 $50-$300 $500-$800
Countertop: $300-$350 Automatic: $6ÜO-$800
Whole house: $500-$800
Single tap: $400-$600
$7-$ 15 weekly for a family of four^
$3.50-$4.50 per inch dia- meter per foot of depth, plus casing and pump costs^
$12,000+ per household depending on distance to water main, plus water payments'*
16 The descriptions and costs presented are based on information in published sources and from discussions with treatment unit manufac- turers and suppliers, water quality association representatives, and local public officials.
^ Cost ranges were estimated based on conversations with suppliers and trade representatives and information in published literature. (See boxed item i^or definitions of the various processes.) Estimates do not include maintenance costs.
2 Costs are based on use of 2 liters per person per day for drinking water only, with prices ranging from $0.13 to $0.26 per liter ($0.50 to $1.00 per gallon).
3. Costs are for a well up to 8 inches in diameter and up to 300 feet in depth. They will be higher if the ranges are exceeded. Prices were updated to 1986 levels with the Consumer Price Index. Source: (75).
4 Sources: (75, 34).
28

Water Treatment Terms
Activated carbon filtering—A process that relies on adsorption to remove gases, liquids, and/or suspended matter from water. The water is filtered through carbon, usually in the form of granular ac- tivated carbon (GAC). Faucet-mounted and under- the-sink units connect to a single tap, while whole- house units connect to the main water line.
Distillation—A process in which water is con- verted to its vapor state by heating, after which the vapor is cooled and condensed to the liquid state and collected. It is used to remove solids and other impurities from water. Water is poured by hand through countertop distillation units. Automatic units are connected directly to a water tap.
Ion exchange—A process that uses resins having an affinity for certain ions to draw particular substances from water. Anion exchange is the appropriate ion exchange process for reducing nitrates. Units are usually sold as whole-house models.
Reverse osmosis—A process in which pressure is used to force water through a semipermeable mem- brane which transmits water but rejects most other dissolved ions. Most household models have GAC filters attached, and connect to a single tap.
and deeper well. In some cases, bottled water is used as a short-term water source until a new permanent supply is secured.
Drilling a new well may be a feasible household re- sponse to contamination if an acceptable deeper water source is available. To jusify the expense, however, the probability of eventual contamination of the deeper source must be low. The costs of in- stalling a new well can be quite high, as table 9 indicates, and can vary depending on the season and the availability of local drillers {75). In the Big Spring area of northeast Iowa, where wells must be drilled 450 to 500 feet deep to reach uncon- taminated groundwater, a new well could cost, con- servatively, $6,750 (40).
Connecting to a public water system is often the safest alternative for owners of contaminated wells, although the expense may be prohibitive if water mains are not reasonably close. In Connecticut, the cost to extend water lines to houses with con- taminated wells was found to range from $12,000 to $20,000 (34). In areas where housing density is
lower and/or distances to water mains are greater, the costs could be substantially higher. Moreover, households connected to public systems usually must pay for their water, unlike those with private wells.
Even if distance to water lines and cost are not pro- hibitive, there may be other barriers or drawbacks. For example, some water districts do not have enough extra capacity to service new demand. Also, public water supplies are not necessarily free of all agricultural chemicals.
Public Systems. Communities, like households that find their water supply wells to be contaminated, have a number of potential remedial choices open to them. Some options to control point sources of contamination from hazardous waste sites, such as plume containment or control strategies, would like- ly be technically infeasible or unaffordable if used on agricultural nonpoint-source contamination.
Options which are sometimes workable include clos- ing contaminated wells while maintaining water supply from purer wells, drilling new wells, purchas- ing water from nearby suppliers, or tapping surface water sources. In some cases, water from con- taminated wells is blended with purer water to reduce the concentration of the contaminants by dilution. Conserving water also can help stretch ex- isting supplies.
The technical and economic feasibility of the various options varies widely from one place to another. Some options are very expensive. For instance, drill- ing a new large-capacity well can run into the tens of millions of dollars.'^
Like households, communities can reduce pesticide levels in their water with GAC filters. However, the process is not widely used at the community level; in 1984, the number of public water treatment plants using GAC adsorption for all purposes, in- cluding taste and odor control, was estimated to be between 50 and 60. (68). Table 10 presents estimated capital equipment costs and annualized per-unit GAC treatment costs for two system sizes. The operating expenses include periodic carbon regeneration. GAC filtering systems, as the table in- dicates, afford significant economies of size.
Treating community well water to reduce nitrates is uncommon. Because of high treatment costs, wells with high nitrate levels usually have been closed or their water has been mixed with water from other wells to bring nitrate levels to acceptable standards.
' See, for example (55) and (63).
29

Table 10—Public groundwater supply treatment technologies and their costs
Annualized Agricultural Capital costs per
Treatment contaminant System equipment 1,000 technology controlled size^ costs gallons^
M a ¡ion gaf/day Dollars
Granular activated carbon (GAC)3 pesticides
1 100
1,000,000 1.14 25,000,000 .23
Reverse osmosis^ nitrates 1 800,000 .99
Ion exchange^ nitrates
.5 1
<100,000 .17 <160,000 NA
NA indicates that data are unavailable. ' A 1-million-gallon-per-day (mgd) system serves approximately
5,000 people, while a 1,000-mgd system serves approximately 500,000 people.
2 Includes annual operating expenses plus amortized capital costs. 3 Costs are expressed in March 1980 dollars. 4 Costs are expressed in 1981 dollars, and annualized costs do not
include waste disposal expenses.
Sources: (7 7, 26).
individual treatment units to all affected households can result in lower capital outlays than those for central treatment, but an ongoing maintenance program is essential if all sites are to receive the desired quality of water (6).
Summary. The overview of remedial actions and their costs for households and public systems shows the range of options for treating contaminated groundwater or developing alternative drinking water sources. They vary widely in cost and effectiveness. Without precise knowledge of local conditions, it is impossible to predict how many households or communities would require remedial action or what type of action would be appropriate. Consequently, no national estimate of remedial costs in potentially contaminated areas is possible. The data presented in tables 9 and 10 do sug- gest, however, that some of the remedial actions could result in substantial costs to households with private wells and to small communities that rely on ground- water. Further, remedial actions that reduce both pesticides and nitrates in drinking water appear to be more costly than reducing only one contaminant. Areas with private wells and a simultaneous threat of pesticides and nitrates in their water thus could also face high monitoring and remedial costs.
The EPA Municipal Environmental Research Laboratory evaluated experimental reverse osmosis and ion ex- change units for single contaminated wells in small community systems to bring nitrate levels in the final water supply (treated water mixed with raw water) to drinking water standards (26). Table 10 shows the cost involved.
The study indicated that the ion exchange process is preferable to reverse osmosis for small systems because it has lower capital equipment costs and fewer me- chanical problems. Both systems generate wastes that require disposal, increasing potential unit costs by as much as 50 percent. Neither process for reducing nitrate levels was evaluated for larger systems, although the authors argued that economies of scale would make the processes more cost-effective for larger system sizes (26).
While these costs are only examples and can vary widely depending on location, they do show that treat- ment costs are potentially high. Costs vary and will be at the high end of the scale if supply systems are small and if the water contains both pesticides and nitrates. Because treatment costs for public water supplies can be high and because treatment is sometimes the only feasible alternative, programs that take a collective ap- proach to providing polnt-of-use treatment of public water supplies are being studied and initiated in several small communities with polluted groundwater sources (6). Under these circumstances, communities set up legal entities that assume responsibility for purchasing and installing all point-of-use units, overseeing monitor- ing activities, and supervising maintenance. Providing
Implications for Groundwater Protection Strategies
Despite limitations of the current data, the statistics presented In this report do serve as indicators of broad regional and national trends. These data have implica- tions for groundwater contamination protection strategies nationwide.
The information suggests that farmer education pro- grams can play a major role In preventing or minimiz- ing groundwater contamination. If incentives for farmers to take voluntary action are ever going to be effective, it is likely to be In the groundwater con- tamination area. Farmers are much more directly af- fected by agricultural pollution of groundwater than of surface water because their wells are likely to be close to the sources of contamination. Currently there is little advice to give to farmers about how agricultural prac- tices such as conservation tillage affect groundwater quality. The success of farmer education programs depends, in part, on well-documented research pro- grams, many of which are just getting started.
The statistics also suggest that different strategies may be appropriate for dealing with nitrates than with pesticides. In areas of nitrate contamination, taxing fer- tilizers may be sufficient to offset well monitoring costs or to provide alternative water sources for those af- fected. It is noteworthy that about 556,000 private wells are located in areas potentially affected only by nitrate contamination compared with 5.6 million
30

private wells in areas with a high potential pesticide contamination or combined pesticide and nitrate con- tamination potential. Moreover, monitoring costs for nitrates are relatively inexpensive, and the small number of private wells potentially affected may make a remedial program feasible.
In contrast, costs of monitoring for pesticides, whether alone or in combination with nitrates, are so high that a household monitoring program for 5.6 million wells, coupled with remedial actions, would be very costly. Prevention, rather than detection and remedial action, is a more probable strategy, particularly where pesticide contamination is to be avoided. Effective and economical onfarm prevention measures need to be developed.
The data clearly indicate that targeting is needed for any protection strategy. Not all regions are vulnerable. In those regions where agricultural chemicals are being used, not all are equally dependent on groundwater or are densely populated. The monitoring cost approach laid out in this report combines physical vulnerability characteristics, chemical use data, number of wells, and population data. Monitoring cost data shown in figure 12 suggest which regions should be given priority in targeting groundwater protection strategies.
Conclusions
The objective of this report was to define the physical and economic dimensions of the potential for ground- water contamination from agricultural chemicals in the United States. Major uncertainties remain concerning the human health risks and costs associated with con-
tamination. Despite limitations of the data and analysis presented, the report sets the stage for further, more detailed analyses of the economic issues associated with agriculture and groundwater contamination. The development of economic analysis would depend on the simultaneous development of improved data on the physical processes of groundwater contamination.
A major research issue that will have to be addressed is the relationship between the social benefits and social costs of groundwater protection programs and policies. In the absence of any broad-based research results, policymakers are beginning to propose and enact legislation designed to safeguard groundwater from agricultural chemicals and other contaminants. Arizona, Wisconsin, and other States have already enacted groundwater protection legislation, and EPA is now formulating a strategy aimed at protecting ground- water from agricultural chemicals. Other legislative and regulatory measures are sure to be forthcoming, some of which may impose restrictions on the agricultural sector.
The costs of these regulatory measures on the agri- cultural sector are not yet well understood. The rela- tionships among agricultural practices, farm income, and changes in groundwater contaminant levels remain to be defined and the economic damages to human health and property need to be directly addressed. All of this information is needed to compare the benefits of controlling societal damages from agriculturally induced groundwater contamination with the social costs of groundwater protection programs and policies. Such an analysis could lead to more efficient and effective strategies for controlling groundwater pollution from pesticides and fertilizers.
31

References
(1) Aldrich, S.R. "Nitrogen in Relation to Food, En- vironment and Energy." Special Publication 6^, Agricultural Experiment Station, College of Agriculture, University of Illinois, Urbana- Champaign, 1980.
(2) Alexander, W.J., and others. Ground-Water Vulnerability Assessment in Support of the First Stage of the National Pesticide Survey. Research Triangle Park: Research Triangle Institute (pre- pared for the U.S. Environmental Protection Agency), Feb. 14, 1986.
(3) Aller, Linda. National Water Well Association. Personal communication, March 28, 1986.
(4) Aller, L., and others (National Water Well Association). DRASTIC: A Standardized System for Evaluating Ground Water Pollution Potential Using Hydrogeologie Settings. Ada, OK: U.S. En- vironmental Protection Agency, Robert S. Kerr En- vironmental Research Laboratory (EPA/600/2-85/018), May 1985.
(5) Baier, J.H., and K.A. Rykbost. "The Contribution of Fertilizer to the Ground Water of Long Island." Ground Water, Volume 14, No. 5 (1976), 439-47.
(6) Bellen, G.E., M. Anderson, and R.A. Cottier. Proj- ect Summary: Point-of-Use Treatment to Control Organic and Inorganic Contaminants in Drinking Water. Cincinnati, OH: U.S. Environmental Pro- tection Agency, Water Engineering Research Lab- oratory (EPA 1600/S2-85/112), Jan. 1986.
(7) Center for Communication Dynamics. "Ground- v^ater Contamination: The Measure of Public Concern." Washington, DC: Center for Com- munication Dynamics, Feb. 1985.
(8) Cohen, D.B. "Ground Water Contamination by Toxic Substances: A California Assessment" in Evaluation of Pesticides in Ground Water. Eds. W.Y. Garner, R.C. Honeycutt, and H.N. Nigg, pp. 499-529. ACS Symposium Series 315. Washington, DC: American Chemical Society, 1986.
(9) Cohen, P., Chief Hydrologist, U.S. Geological Survey. Statement before the Subcommittee on Toxic Substances and Environmental Oversight of the Committee on Public Works, U.S. Senate, June 17, 1985.
(10) Cohen, S.Z., U.S. Environmental Protection Agency, Office of Pesticide Programs. Memoran- dum to I. Pomerantz (Environmental Protection Agency, Office of Drinking Water) on the criteria for chemical selection. Aug. 13, 1984.
(11)
(12)
(13)
(14)
(15)
(16)
(17)
. Memorandum to I. Pomerantz on the list of potential groundwater contaminants. Aug. 28, 1984.
. Memorandum to Work Group Members of the U.S. Environmental Protection Agency's Office of Drinking Water/Office of Pesticide Programs on the draft combined list of potential analytes, Oct. 9, 1984.
. Memorandum to H. Brass of the En- vironmental Protection Agency, Office of Drink- ing Water, on the revised list of analytes for the National Pesticides Survey. Aug. 2, 1985.
Cohen, S.Z., C. Eiden, and M.N. Lorber. "Monitoring Ground Water for Pesticides" in Evaluation of Pesticides in Ground Water. Eds. W.Y. Garner, R.C. Honeycutt and H.N. Nigg, pp. 170-96. ACS Symposium Series 315. Washington, DC: American Chemical Society, 1986.
Congressional Research Service. "Resource Losses from Surface Water, Groundwater, and Atmos- pheric Contamination: A Catalog." Prepared for the Committee on Environment and Public Works, U.S. Senate, 1980.
Council for Agricultural Science and Technology. "Agriculture and Groundwater Quality." Ames, lA: Council for Agricultural Science and Technology (Report No. 103), May 1985.
DeWolf, G., and others. "The Cost Digest—Cost Summaries of Selected Environmental Control Technologies." Research Triangle Park, NC: U.S. Environmental Protection Agency, Industrial En- vironmental Research Laboratory (EPA-600/8-84-010), Oct. 1984.
(18) Des Moines Register, July 29, 1986, p. 1.
(19) Donigan, A.S., Jr. (AQUA TERRA Consultants), "impact of Conservation Tillage on Nutrient Loadings in the Eastern Cornbelt." Prepared for the U.S. Environmental Protection Agency, Mar. 1986.
(20) Donigan, A.S., Jr. and C.S. Raju (AQUA TERRA Consultants), and R.F. Carsel (U.S. Environmental Protection Agency, Environmental Research Laboratory). "Impact of Conservation Tillage on Environmental Pesticide Concentrations in Three Agricultural Regions." Prepared for the American Management System, Inc. and the U.S. Environ- mental Protection Agency, Nov. 1986.
(21) Duffy, M. Pesticide Use and Practices, 1982. AIB-462. U.S. Dept. Agr., Econ. Res. Serv., Dec. 1983.
32

(22) Environ Corporation. ''Approaches to the Assess- ment of Health Impacts of Groundwater Con- taminants." Prepared for the U.S. Congress, Of- fice of Technology Assessment, Aug. 1983.
(23) Ferguson, W. "1979 Pesticide Use on Vegetables in Five Regions." ERS Staff Report No. AGES830920, U.S. Dept. Agr., Econ. Res. Serv., Sept. 1983.
(24) Gianessi, L.P., H.M. Peskin, and C.A. Puffer. "A National Data Base of Nonurban Nonpoint Source Discharges and their Effect on the Na- tion's Water Quality: Methodology." Washington, DC: Resources for the Future, Sept. 1985.
(25) Gormly, J.R., and R.F. Spalding. "Sources and Concentrations of Nitrate-Nitrogen in Ground- water of the Central Platte Region, Nebraska." Ground Water, Vol. 17, No. 3 (1979), 291-300.
(26) Guter, G.A. (Boyle Engineering Corp.). "Removal of Nitrate from Contaminated Water Supplies for Public Use: Final Report." Cincinnati: U.S. En- vironmental Protection Agency, Municipal En- vironmental Research Laboratory (EPA-600/S2-82-042), Aug. 1982.
(27) Hàllberg, G. "Agricultural Chemicals and Groundwater Quality in Iowa." Ames, lA: Iowa State University Cooperative Extension Service, 1984.
(28) , R.D. Libra, and B.E. Hoyer. "Nonpoint Source Contamination of Ground Water in Karst- Carbonate Aquifers in Iowa." Perspectives on Nonpoint Source Pollution, Proceedings of a Na- tional Conference. Washington, DC: U.S. En- vironmental Protection Agency, 1985.
(29) Haydu, J.J. "Pesticide Use in United States: Citrus Production, 1977." ERS Staff Report No. AGES810203, U.S. Dept. Agr., Econ. Res. Serv., Feb. 1981.
(30) hleath, R.C. Ground Water Regions of the United States. Washington, DC: U.S. Geological Survey (Water Supply Paper 2242), 1984.
(31) Helling, C.S. "Agricultural Pesticides and Ground Water Quality" in Agricultural Impacts on Ground Water Quality. Proceedings of a con- ference in Omaha, Neb. on August 11, 1986. Cincinnati: National Water Well Association, forthcoming.
(32) , and T.J. Gish. "Soil Characteristics Af- fecting Pesticide Movement into Groundwater" in Evaluation of Pesticides in Ground Water. Eds. W.Y. Garner, R.C. Honeycutt, and H.N. Nigg, pp. 14-38. ACS Symposium Series 315. Washington, DC: American Chemical Society, 1986.
(33) Hoar, S.K., and others. "Agricultural Herbicide Use and Risk of Lymphoma and Soft-Tissue Sar- coma." journal of the American Medical Associa- tion, Vol. 256, No. 9 (Sept. 1986), 1141-47.
(34) Hogan, B., Connecticut Dept. of Environmental Protection. Personal communication. Oct. 19, 1986.
(35) Hubbard, R.K., L.E. Asmussen, and H.D. Allison. "Shallow Groundwater Quality Beneath an Inten- sive Multiple-Cropping System Using Center Pivot Irrigation." Journal of Environmental Quality, Vol. 13, No. 1 (1984), 156-61.
(36) Jacobs, T.C., and J.W. Gilliam. "Riparian Losses of Nitrate from Agricultural Drainage Water." Journal of Environmental Quality, Vol. 14, No. 4 (1985), 472-78.
(37) Jones, R.L., and R.C. Back. "Monitoring Aidicarb Residues in Florida Soil and Water." Environmen- tal Toxiocology and Chemistry, Vol. 3 (1984), 9-20.
(38) Journal of Soil and Water Conservation. "In the News" column. Vol. 41, No. 4 (July-Aug. 1986), 243-44.
(39) Keeney, D.R. "Sources of Nitrates to Ground Water." CRC Critical Reviews in Environmental Control, Vol. 16, No. 3 (1986), 257-304.
(40) Kidwell, B. "Families Worry as Water Quality Drops." Progressive Farmer, Vol. 100, No. 9 (1985), 28-30.
(41) Kim, N.K., and others. "Two Ground Water Con- tamination Problems: Case Studies" in Evaluation of Pesticides in Ground Water. Eds. W.Y. Garner, R.C. Honeycutt, and H.N. Nigg, pp. 530-40. ACS Symposium Series 315. Washington, DC: American Chemical Society, 1986.
(42) Klepper, R. "Nitrogen Fertilizer and Nitrate Con- centrations in Tributaries of the Upper Sangamon River in Illinois." Journal of Environmental Qual- ity, Vol. 7, No. 1 (1978), 13-22.
(43) rLife Systems, Inc. "Pesticide Survey Chemical Profile Final Report." Prepared for the U.S. En- vironmental Protection Agency, Office of Drink- ing Water, Oct. 1985.
(44) Madison, R.J., and J. Brünett. "Overview of the Occurrence of Nitrate in Ground Water of the United States" in National Water Summary 1984. Washington, DC: U.S. Geological Survey (Water- Supply Paper 2275), 1985.
33

(45) Murphy, S.D. ''Pesticides" in Casarett and Doull's Toxiocology, The Basic Science of Poisons, 2nd ed. Eds. J. Doull, CD, Klaassen, and O. Amdur. New York: MacMillan, 1980.
(46) National Research Council. Drinking Water and Health. Washington, DC: National Academy Press, 1977.
(47)
(48)
(55)
(56)
(57)
(58)
Nitrates: An Environmental Assess- ment Washington, DC: National Academy Press, 1978.
The Health Effects of Nitrate, Nitrite, and N-Nitroso Compounds, Part 1. Washington, DC: National Academy Press, 1981.
(49) National Wildlife. "The 19th Annual Environmen- tal Quality Index," Vol. 25, No. 2 (Feb.-Mar. 1987), 33-40.
(50) Parks, j.R. "Pesticides Use on Fall Potatoes in the United States, 1979." ERS Staff Report No. AGES830113, U.S. Dept. Agr., Econ. Res. Serv., Jan. 1983.
(51) Pimentel, D., and others. "Environmental and Social Costs of Pesticides: A Preliminary Assess- ment." Oii<os, Vol. 34 (1980), 126-40.
(52) Pionke, H.B. and J.B. Urban. "Effect of Agri- cultural Land Use on Ground-Water Quality in a Small Pennsylvania Watershed." Ground Water, Vol. 23 (1985), 68-80.
(53) Pratt, P.P. "Nitrogen Use and Nitrate Leaching in Irrigated Agriculture" in Nitrogen in Crop Produc- tion. Ed. R.D. Hauck, pp. 319-33. Madison, Wl: American Society of Agronomy, 1984.
(54) Rao, P.S.C, and others. "Pesticides and Their Behavior in Soil and Water." Gainesville, FL: In- stitute of Food and Agricultural Sciences (Soil Science Fact Sheet SL 40), Sept. 1983.
Raucher, R.L, "The Benefits and Costs of Policies Related to Groundwater Contamination." Land Economics, Vol. 62, No. 1 (Feb. 1986), 33-45.
"A Conceptual Framework for Measur- ing the Benefits of Groundwater Protection. IVater Resources Research, Vol. 19, No. 2 (Apr. 1983), 320-26.
Research Triangle Institute. "National Nursery Pesticide Usage Survey." RTI/2766/06-0IF, Sept. 1984.
"National Urban Pesticide Application Survey: Final Report Overview and Results." RT1/2764/08-01F, Apr. 13, 1984.
(59) Resources for the Future. Unpublished data from the National Pesticide Usage Data Base, 1986.
(60) Rhodes, H.L. "The Emerging Role of Pesticide Regulation in Florida Due to Ground Water Con- tamination" in Evaluation of Pesticides in Ground Water. Eds. W.Y. Garner, R.C. Honeycutt, and H.N. Nigg, pp. 540-47. ACS Symposium Series 315. Washington, DC: American Chemical So- ciety, 1986.
(61) Rothschild, E.R., R.J. Manser, and M.P. Anderson. "Investigation of Aldicarb in Ground Water in Selected Areas of the Central Sand Plain of Wisconsin." Ground Water, Vol. 20, No. 4 (1982), 437-45.
(62) Saffigna, P.G., and D.R. Keeney. "Nitrate and Chloride in Ground Water Under Irrigated Agriculture in Central Wisconsin." Ground Water, Vol. 15, No. 2 (1977), 170-77.
(63) Schecter, M. "An Anatomy of a Groundwater Contamination Episode." Journal of Environmen- tal Economics and Management, Vol. 12 (1985), 72-88.
(64) Schmidt, K.D. "Protection of Ground Water from Nonpoint Sources of Pollution" in Drinking Water Quality Enhancement Through Source Pro- tection. Ed. R.B. Pojasek, pp. 257-73. Ann Arbor, Ml: Ann Arbor Science Publishers, 1978.
(65) Solley, W.B., E.B. Chase, and W.B. Mann, IV. Estimated Uses of Water in the United States in /9m Washington, DC: U.S. Geological Survey (Circular 1001), 1983.
(66) Stara, J.F., J. Patterson, and M.L. Dourson. "Risk Assessment Approaches for Ground Water Con- tamination by Pesticides and Other Organic Substances" in Evaluation of Pesticides in Ground Water. Eds. W.Y. Garner, R.C. hloneycutt, and H.N. Nigg pp. 445-61. ACS Symposium Series 315. Washington, DC: American Chemical So- ciety, 1986.
(67) State of California, Department of Food and Agriculture. "Pesticide Use Annual Report," Sacramento, 1981.
(68) Symons, J.M. "A History of the Attempted Federal Regulation Requiring GAC Adsorption for Water Treatment." journal of the American Water Works Association, Vol. 78, No. 8 (Aug. 1984), 34-43.
(69) U.S. Congress. Protecting the Nation's Ground Water from Contamination. Washington, DC: Of- fice of Technology Assessment (OTA-0-233), 1984.
34

(70) U.S. Department of Agriculture, Economic Research Service. Fertilizer Situation. FS-2. Jan. 1972,
(77) Office of Pesticide Programs, Economic Analysis Branch. Unpublished estimates.
(71) . Economic Research Service. Fertilizer Outlook and Situation. FS-13. Dec. 1982.
(72) . Economic Research Service. Inputs Outlook and Situation. IOS-2. Oct. 1983.
(78) Webb, S.H. "Preliminary Data: Pesticide Use on Deciduous Fruits in the United States, 1978." ERS Staff Report No. AGES810626. U.S. Dept. Agr., Econ. Res. Serv., July 1981.
(73)
(74)
(75)
(76)
Economic Research Service. Agricultural Resources, Inputs Outlook and Situa- tion Report. AR-1. Feb. 1986.
U.S. Department of Commerce, Bureau of the Census. U.S. Census of Population and Housing, 1980. Computer tape.
U.S. Department of the Interior, Water and Power Resource Service. Ground Water Manual, A Water Resources Technical Publication, 1981.
U.S. Environmental Protection Agency. "National Primary Drinking Water Regulations; Synthetic Organic Chemicals, Inorganic Chemicals and Microorganisms; Proposed Rule." (40 Code of Federal Regulations, Part 141). Published in the Federal Register, Vol. 50 (Nov. 13, 1985), 46935-47022.
(79) Yates, P., and J.M. Sheridan. "Estimating the Ef- fectiveness of Vegetated Floodplains of Wetlands as Nitrate-Nitrite and Orthophosphorus Filters." Agricultural Ecosystems and Environment, Vol. 9 (1983), 303-14.
(80) Zaki, M.H., D. Moran, and D. hiarris. "Pesticides in Groundwater: The Aldicarb Story in Suffolk County, New York." American journal of Public Health, Vol. 72 (1982), 1391-95.
(81) Zaporozec, A. "Nitrate Concentrations Under Ir- rigated Agriculture." Environmental Geology, Vol. 5 (1983), 35-38.
35

Appendix—Data Sources for the Pesticides Assessment
We used two major data sources, the DRASTIC index and the pesticide usage data base developed by Resources for the Future, for the analysis of potential contamination from pesticides.
The DRASTIC Index: County-Level Assessments
The DRASTIC index is a system for evaluating an area's relative vulnerability to groundwater contamination from various sources of pollution (4). The hydro- geologic factors which determine the DRASTIC score and which are the basis for the acronym ''DRASTIC" are: Depth to water, Recharge (net), Aquifer media, Soil media, Topography (slope), Impact of the vadose zone, and Conductivity (hydraulic) of the aquifer.
Each DRASTIC factor receives a rating for the geographic area under consideration. The rating is, in turn, multiplied by a weight which reflects the factor's relative importance to contamination potential. The weighted ratings are totaled, yielding the DRASTIC score. A higher score implies a higher degree of vulnerability.
Two sets of weights form the basis for two distinct DRASTIC indexes: the DRASTIC index for agricultural pesticides and the regular (generic) DRASTIC index for all other contaminants. Appendix table 1 shows the assigned weights for both the regular and pesticide DRASTIC indexes. The weights were derived by a com- mittee that used a Delphi or consensus approach. In the case of the agricultural pesticide index, the commit- tee arrived at the weights by considering characteristics of a "generic" pesticide (3).
Each DRASTIC factor is divided into either ranges or significant media types which have an impact on pollu- tion potential, and each range has a corresponding rating (app. table 2). The DRASTIC score (or pollution potential) for the area is determined by the following formula:
Appendix table 1—Assigned weights for DRASTIC features
DRASTIC SCORE = D^D^ + R^R^ + A^A^ + S^S w
+ TrTw + 'r'w + C^C^
where: r = rating w = weight.
County-level DRASTIC assessments were carried out in 1985 under an EPA-sponsored project. The county-level ratings were used to aid in sample stratification for EPA's national survey of pesticides in well water (2). To derive the DRASTIC scores which we subsequently used in our analyses, evaluators derived overall ratings for each DRASTIC factor by weighting each rating category by the percent of the county falling in the cor- responding range. Weighted ratings were totaled. All
Feature Regi jiar we ight Pesti cide weight
D = Depth to water table R = Net recharge A = Aquifer media S = Soil media T = Topography 1 = Impact of the vadose
5 4 3 2 1 5
5 4 3 5 3 4
zone C = Hydraulic conductivity
of the aquifer 3 2
ratings are meant to reflect the vulnerability of the county's first potable aquifer.
Resources for the Future Pesticide Usage Data Base
Resources for the Future (RFF) has drawn together a variety of data sources to make pesticide application estimates for all States and counties in the United States. 1Ö
State usage survey data for 13 major crops in 33 States were assembled from the 1982 Crop and Livestock Pesticide Usage Survey, which was conducted by the Economic Research Service (ERS) and reported in Duffy (2/) and other ERS publications. Other source material came from ERS reports covering national estimates of annual pesticide use for selected fruits, vegetables, potatoes, and citrus products (23, 29, 50, 78).
Annual pesticide use for all California crops was estimated from data contained in (67). Also, pesticide use by urban applicators and nurseries was estimated from survey results of the U.S. Environmental Protec- tion Agency, Office of Pesticide Programs (OPP) (57, 58). All solvents, banned and minor chemicals, and undefined substances were excluded from the file, which left a total of 184 pesticides accounted for in the data base.
RFF carried out a number of extrapolations to account for pesticide applications in States not covered in available surveys. They are summarized below.
1. For the 33 States included in the ERS survey of 13 major crops, State crop pesticides use estimates were divided by the corresponding State's har- vested crop acreage, as reported in the 1982 Cen- sus of Agriculture. Pesticide application coeffi- cients (in terms of Ibs/acre/year) from a nearby State were assigned to States not included in the ERS survey. By multiplying these coefficients by
^^ See {24) for a complete description of the methodology.
36
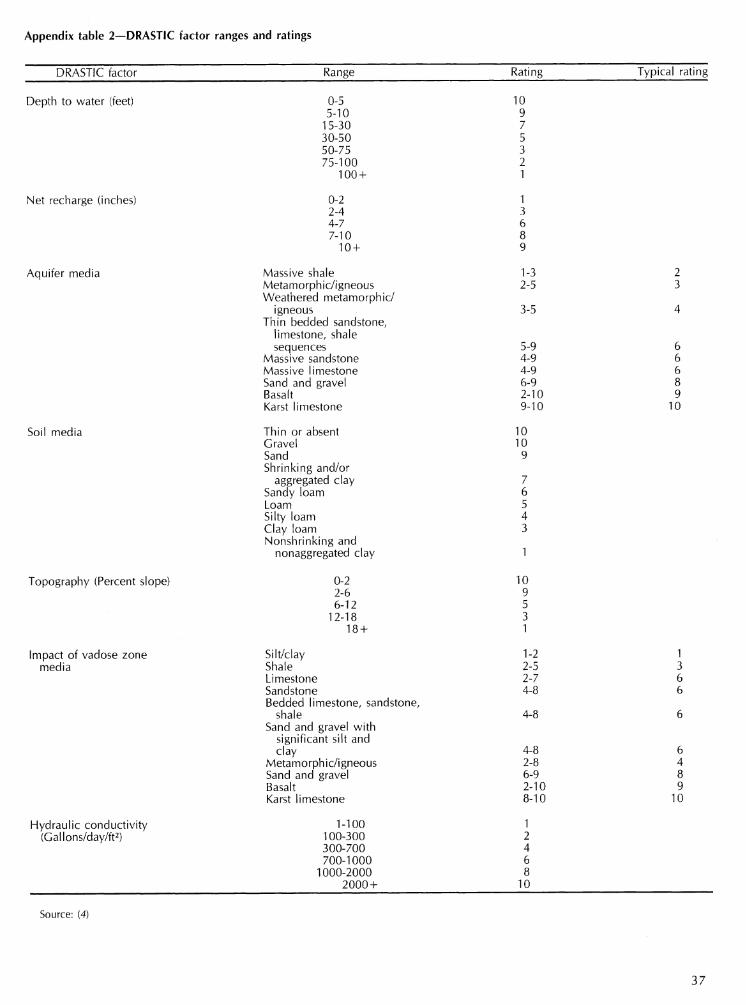
Appendix table 2—DRASTIC factor ranges and ratings
DRASTIC factor Range Rating Typical rating
Depth to water (feet) 0-5 5-10
15-30 30-50 50-75 75-100
100-h
10 9 7 5 3 2 1
Net recharge (inches) 0-2 2-4 4-7 7-10
10 +
Aquifer media
Soil media
Massive shale Metamorphic/igneous Weathered metamorph ic/
igneous Thin bedded sandstone,
limestone, shale sequences
Massive sandstone Massive limestone Sand and gravel Basalt Karst limestone
Thin or absent Grave! Sand Shrinking and/or
aggregated clay Sandy loam Loam Silty loam Clay loam Nonshrinking and
nonaggregated clay
3-5
5-9 4-9 4-9 6-9 2-10 9-10
10 10
9
7 6 5 4 3
6 6 6 8 9
10
Topography (Percent slope) 0-2 2-6 6-12
12-18 18-h
10 9 5 3 1
Impact of vadose zone media
Silt/clay Shale Limestone Sandstone Bedded limestone, sandstone,
shale Sand and gravel with
significant silt and clay
Metamorphic/igneous Sand and gravel Basalt Karst limestone
1-2 2-5 2-7 4-8
4-8
4-8 2-8 6-9 2-10 8-10
6 4 8 9
10
Hydraulic conductivity (Gallons/day/ft2)
1-100 100-300 300-700 700-1000
1000-2000 2000 +
1 2 4 6 8
10
Source: (4)
37

estimates of State harvested crop acreage, esti- mates of pesticide use for the 13 crops were ob- tained for all States that reported harvested, acreage in the 1982 Census of Agriculture.
2. For applications to citrus fruits, pesticide applica- tion coefficients were derived from the ERS data on Florida, Arizona, and Texas. Applications to citrus crops in Louisiana were estimated using the derived Texas coefficients.
3. For the fruits and vegetables (including potatoes) included in the ERS surveys, national pesticide use coefficients were derived and applied to the State level. Total harvested acreage for each crop was used to derive total State application estimates.
4. For those crops included only in the California report (that is, onions, celery, cauliflower, carrots, cabbage, brussels sprouts, broccoli, lettuce, can- taloupes, cucumbers, green peas, snap peas, and watermelon), pesticide use coefficients were de- rived by crop. The coefficients were applied to other States based on the reported harvested acreages of those crops.
5. For the pesticide use of nurseries and urban ap- plicators, the OPP national estimates were divided by the number of nurseries and single-unit hous- ing structures, respectively, to yield pesticide use coefficients. The coefficients were then multiplied by the number of nurseries and single-unit hous- ing structures, by State, to obtain estimates of Statewide applications for these categories.
Pesticide applications were estimated for a total of 76 crops (app. table 3). County-level estimates of pesticide applications on crops were obtained by prorating State- level estimates to the county level based on the num- ber of harvested acres.
Appendix table 3—Crops for which pesticide applications are included in the RPF pesticide usage data base
Alfalfa Almonds Apples Apricots Artichokes Asparagus Avocados Barley Beets Boysenberries Bro'ccoli Brussels sprouts Cabbages Cantaloupes Carrots Cauliflower Celery Cherries Citrus Collard Corn Cotton Cucumbers Dates Eggplants Figs
Garlic Grapefruits Grapes Green beans Kale Kiwi Lemons Lettuce Melons Mustard Nectarines Oats Okra Olives Onions Oranges Other hay Parsley Pasture/range Peaches Peanuts Pears Peas Pecans Peppers
Persimmons Pistachios Plums Pomegranates Potatoes Pumpkins Radishes Rice Rye Saff lower Sorghum Soybeans Spinach Squash Strawberries Sugar beets Sunflower Sweet corn Sweetpotatoes Tobacco Tomatoes Turnips Walnuts Watermelons Wheat
38 •Ù U.S. GOVERNMENT PRINTING OFFICE: 1987 - 716-000 - 1302/02098