c1 rough order of magnitude cost estimate c2 apm … c cost and revenue memos c1 rough order of...
TRANSCRIPT

Appendix C
Cost and Revenue Memos
C1 Rough Order of Magnitude Cost Estimate
C2 APM Cost Comparison Methodology Memo
C3 Alternative Revenue Sources Memo
C4 Potential Advertising Revenue Memo

M
\E
A
T
C
F
S
TmM
Memor
\\GLOBAL.ARUP.COM\AMERICESTIMATE_MEMO-FORMAT_20
Arup North America Ltd | F
To L
Copies W
From B
Subject S
1 B
1.1 GThis documemagnitude cMineta San
1.2 B The
procEngiInstit
This estimof Co
Capisumm
The colle
The budgprogthe C
This
See t
andum
AS\JOBS\S-F\210000\214704-00012 10 09_CLEAN.DOCX
F0.3
Laura Stuchink
William Baum
Bill Maddex, D
San José ATN
Basis of
General ent has been
cost estimateJosé Interna
Basis andEstimated Cedures agreeineers (AACtute of Chart
estimate is cmate classificost Engineer
ital costs havmary format
Estimate conected from co
estimate witget can only gram developClient;
project has
the attached
0\4 INTERNAL PROJECT DATA
ksy, Henry Se
mgardner, Aus
Dave Brogan
N Feasibility S
f Capex
Introducn prepared bye for the propational Airpo
d ContenCost is prepared by organi
CE), Americatered Survey
classified ascation matrixring (AACE
ve been provt;
ntained hereomparable c
thin this docube establish
ped by the Pr
been assume
sketches for
A\4-04 CALCULATIONS\COST E
ervin
stin Smith, Ga
Study Rough O
Cost Es
ction y Arup for thposed Automort.
nt of Estired in accordzations suchan Society oyors (RICS);
level 5 Roux which was) best practi
vided in Fede
e is based on cost data;
ument is noted once the roject Team
ed to be proc
r outline des
STIMATE\COST ESTIMATE SA
ary Hsueh
Order of Mag
stimate
he City of Samated Transi
mate dance with ah as The Assf Profession;
ugh Order ofs developed uces;
eral Transit A
1st Quarter
t intended toClient's brie, and the For
cured throug
sign informat
AN FRANCISCO\BASIS OF COS
gnitude Cost E
an José to prit Network P
accepted prosociation for nal Estimator
f Magnitude using the As
Administrat
2012 rates a
o set the budgef has been firecasted Cos
gh a Design
tion.
ST
Date
Octobe
Referenc
214704
File refer
Estimate (Rev
rovide a rougProject (ATN
ofessional stathe Advanc
rs (ASPE), a
estimate witssociation fo
tion - Standa
and benchma
get for the pfinalized, a dsts subseque
and Build ro
Pa
er 18, 2012
ce number
4-00
rence
vision H)
gh order of N) at Norman
andard and ement of Co
and The Roy
thin the Aruor the Advan
ard Cost Cate
ark unit cost
potential wordesign solutioently approve
oute;
age 1 of 9
n Y.
ost yal
up ncement
egories
ts
rks, the on and ed by

Memorandum
BASIS OF COST ESTIMATE_MEMO-FORMAT_2012 10 09_CLEAN.DOCXBASIS OF COST ESTIMATE_MEMO-FORMAT_2012 10 09_CLEAN.DOCX
Page 2 of 9Arup North America Ltd | F0.3
1.3 Exclusions The costs or impacts of latent environmental issues that result in litigations or development
delays;
Removal of any of the works at the end of their useful life – including allowance for any residual value;
Planning and enquiry costs including legal expenses and fees;
Local planning obligations and agreements;
Financing charges;
Credits for capital taxation allowances;
Owners direct management costs, running and maintenance costs;
Compensatory costs to other interested parties;
Construction administration and project management and other soft costs;
Hard rock excavations or the impact of encountering unfavorable soil conditions, hazardous materials, or poor working conditions during the construction process; and
Right of Way costs.
1.4 Assumptions Made In The Preparation of This Estimate All costs are based on 1st Quarter 2012 rates and prices; no allowance has been included for
inflation;
The estimate has been prepared utilizing cost estimating reference books such as RS Means and Caltrans 2011 Contract Cost Data;
The estimate assumes encountering normal ground conditions, and no allowances have been included for ground decontamination or discovery of archaeological artifacts and their consequential effect on the project;
The estimate assumes the development will have no detrimental impact to neighboring residential areas and no allowance has been included for compensatory works within the estimates;
The quantities in the estimate are preliminary in nature and are likely to change as more information becomes available and the design progresses;
Unit rates reflect the cost of direct construction and are including such costs as labor, equipment, and materials;
A Contingency allowance has been included. Contingency does not cover changes in scope; and
Other assumptions are listed in section 1.7.

Memorandum
BASIS OF COST ESTIMATE_MEMO-FORMAT_2012 10 09_CLEAN.DOCXBASIS OF COST ESTIMATE_MEMO-FORMAT_2012 10 09_CLEAN.DOCX
Page 3 of 9Arup North America Ltd | F0.3
1.5 Information Used In The Preparation of This Estimate
1.5.1 Internal References
Preliminary design information developed by Arup.
Measures based on prior experience by Arup in the United Kingdom.
1.6 Indirects, Add-ons on Costs and Contingency Arup has applied percentages based on experience to accommodate the following costs:
Contractor Indirects have been included at 15% of the direct total cost;
Contractor Overhead and Profit has been included at 15% of the direct total cost;
Design Engineering has been included at 10% of the total job value;
Project Insurance has been included at 3% of the total cost (direct and indirect);
Tax has been included at 2% of the total cost (direct and indirect); and
Bond has been included at 1.5% of the job value.
1.7 Structure of Estimate
1.7.1 Single Track Guideway
Due to the high level cost estimate required it has been assumed that all guideway is to be on elevated structure, as there is an insignificant quantity of guideway at grade.
Substructure
4’ diameter drilled concrete piles, 50’ deep, with 295 pounds of rebar per cubic yard of concrete. Piles at 80’ centers.
Superstructure
Reinforced 2’6” diameter concrete columns, 18’ high from ground level. Columns at 80’ centers;
Reinforced concrete Crossheads, 4’ by 3’ by deck width of guideway;
Reinforced concrete elevated structure as per sketch provided as Attachment A;
Arup developed a cost alternative for a steel supporting guideway with input from a specialized APM manufacturer, but this proved to be more expensive than the concrete option.

Memorandum
BASIS OF COST ESTIMATE_MEMO-FORMAT_2012 10 09_CLEAN.DOCXBASIS OF COST ESTIMATE_MEMO-FORMAT_2012 10 09_CLEAN.DOCX
Page 4 of 9Arup North America Ltd | F0.3
1.7.2 Double Track Guideway
Same assumptions as the single track guideway but doubled the price. See sketch provided as Attachment B.
1.7.3 Triple Track Guideway
Same assumptions as the single track guideway but tripled the price.
1.7.4 Minor Station
The estimate is based on a 3 berth station with angled berths similar to the design of the Heathrow ATN station.. The elevated station concourse measure is 131’ by 42’. The unit price has been derived from comparable material cost data in California.
1.7.5 Major Station
The estimate is based on a 20 berth station with four banks of five angled berths each.. The elevated station concourse measure is 262’ by 42’ multiplied by two to account for each side of the platform. The unit price has been derived from comparable construction cost data in California.
1.7.6 Maintenance Facility
An estimated square foot measure has been derived from information supplied by vendors and is based on a fleet size of 300 vehicles. The maintenance facility is assumed to have 16 maintenance bays and additional storage for 30 vehicles, and will house a control center and other staff facilities. The unit price has been derived from comparable construction cost data in California.
1.7.7 Utility Relocations
No design information is available for this, thus an allowance of $4,000,000 has been included based on prior experience, which is subject to change as the design progresses.
1.7.8 Subcontractor
Little design information is available on minor works packages, such as lighting, safety fencing, landscaping, retaining walls, etc. Therefore allowances totaling $12,500,000 have been included based on previous experience, which is subject to change as the design progresses.
1.7.9 Control Systems
Control system details are unknown at this stage but a review of ATN projects around the world suggests costs should be in the region of 25% of the base construction costs not including the stations and maintenance facility costs.

Memorandum
BASIS OF COST ESTIMATE_MEMO-FORMAT_2012 10 09_CLEAN.DOCXBASIS OF COST ESTIMATE_MEMO-FORMAT_2012 10 09_CLEAN.DOCX
Page 5 of 9Arup North America Ltd | F0.3
1.7.10 Vehicles
Cost data has been gathered from similar projects around the world and a large range was discovered from USD$63,000 to USD$200,000 per vehicle. A mean price of USD$130,000 was chosen for the Capex estimate. A maximum fleet size of 300 vehicles has been assumed at buildout based on input from Aerospace Corporation. Vehicles are assumed to be purchased in batches by alignment segment.

Memorandum
BASIS OF COST ESTIMATE_MEMO-FORMAT_2012 10 09_CLEAN.DOCXBASIS OF COST ESTIMATE_MEMO-FORMAT_2012 10 09_CLEAN.DOCX
Page 6 of 9Arup North America Ltd | F0.3
2 Basis of Opex Cost Estimate
2.1 General Introduction The operational costs are calculated based on four areas:
Staffing;
Maintenance;
Periodic Renewals; and
Energy use.
Opex costs have been estimated based on Operational Cost per annum, which has been split between the Segments for clarity. The overall operational life is 30 years from 2015, giving an intended operational end life of 2047.
2.2 Exclusions Financing charges;
Credits for capital taxation allowances.
2.3 Assumptions Made In The Preparation of This Estimate All costs are based on 1st Quarter 2012 rates and prices; no allowance has been included for
inflation;
A contingency between 8% and 37% has been included based on the level of detail known. This contingency does not cover scope changes or items not currently included in the estimate;
The quantities in the estimate are preliminary in nature and are likely to change as more information becomes available and the operational process develops; and
Other assumptions are listed in section 2.5.
2.4 Information Used In The Preparation of This Estimate Assumptions developed by Arup;
Comparable data gathered from London Heathrow, Masdar and Morgantown ATN projects; and
Bureau of Labor Statistics for wage estimates.

Memorandum
BASIS OF COST ESTIMATE_MEMO-FORMAT_2012 10 09_CLEAN.DOCXBASIS OF COST ESTIMATE_MEMO-FORMAT_2012 10 09_CLEAN.DOCX
Page 7 of 9Arup North America Ltd | F0.3
2.5 Structure of Estimate
2.5.1 Staffing
No detailed information is available on staffing levels, job duties or responsibilities. A “bottoms up” approach has therefore been employed in estimating an appropriate organizational structure. Actual staff salaries are taken from the United States Department of Labor website in the Bureau of Labor Statistics for California.
The following job roles with assumptions were developed:
Chief Executive – One staff member, working day shift only. Constant through Segments 1, 2 and 3;
Manager – One staff member, working day shift only. Constant through Segments 1, 2 and 3;
Marketing, Financial Clerk and HR – 3 staff in total, working day shift only. Constant through Segments 1, 2 and 3;
Supervisor – 2 staff members per manager, per shift. Supervisors to work full 22 hour operational day in 8 hour shifts, 40 hour weeks, rotating staff, no overtime allowed for;
Controller – 1 staff member per 30 operational pods, per shift. Controllers to work full 22 hour operational day in 8 hour shifts, 40 hour weeks, rotating staff, no overtime allowed for;
Service Engineer – Assumed 4 engineers per shift, working full 22 hour operational day in 8 hour shifts, 40 hour weeks, rotating staff, no overtime allowed for. This effort increases slightly in Segments 2 and 3;
Administrative / Office Clerk – 1 staff member per 30 operational vehicles, working day shift only;
Cleaners – 1 cleaner to clean 3 vehicles per hour; and
Security Guards – 2 staff members in Segment 1 and 2 working 24 hours a day in 8 hour shifts, 40 hour weeks, rotating staff, no overtime allowed for. An additional security guard added for Segment 3.
Benchmark data has been reviewed from similar ATNs such as London Heathrow, Masdar and Morgantown.
2.5.2 Maintenance
Maintenance has been split into 5 main categories:
Track maintenance, which is calculated pro-rata based on the length of track;
Station maintenance, which is calculated pro-rata based on the number of berths;
Depot maintenance, which is calculated pro-rata based on the number of berths in depot;

Memorandum
BASIS OF COST ESTIMATE_MEMO-FORMAT_2012 10 09_CLEAN.DOCXBASIS OF COST ESTIMATE_MEMO-FORMAT_2012 10 09_CLEAN.DOCX
Page 8 of 9Arup North America Ltd | F0.3
Total vehicle maintenance, which is calculated pro-rata based on the number of vehicles; and
Control system maintenance, which is calculated pro-rata based on the number of berths.
The unit costs estimated for maintenance are based on the information gathered for an ATN system in Europe, which have been pro-rated to be applicable for the San José application.
2.5.3 Periodic Renewals
In the absence of detailed information from operators, renewal costs are assumed to be broadly equivalent across all three systems and are based on information issued by one vendor for a possible European application. Estimates for renewals cost are based on four elements:
New vehicles once every eight years at a cost of USD$131,000 per vehicle, which is calculated based on renewing 50% of the vehicle fleet in accordance to the predicted procurement timeline over the alignment segments
IT system overhauls once every three years at a cost of USD$24,000 per control center, which is calculated pro-rata based on the number of control centers
Digital signal processors replaced in each berth once every four years at a cost of USD$4,000 per berth, which is calculated pro-rata based on the number of berths; and
Guideway inspections once every three years at a cost of USD$42,000 per mile, which is calculated pro-rata based on the length of guideway.
2.5.4 Energy
Energy data and assumptions are based on the energy consumption of a similar type of ATN project which has been converted to the San José ATN application, and energy cost for California is assumed at an average rate of $0.14 per kilowatt hour (kWh).
Subsequent, more detailed analysis has been conducted by Aerospace for vehicle propulsion and heating/cooling. Arup’s energy cost estimate accommodates the majority of the ATN vehicle energy demand scenarios analyzed by Aerospace in addition to an allowance for station escalator and elevator energy consumption.
The Project system is operational per annum, which has been assumed to be 22 hours a day, 365 days a year.

Memorandum
BASIS OF COST ESTIMATE_MEMO-FORMAT_2012 10 09_CLEAN.DOCXBASIS OF COST ESTIMATE_MEMO-FORMAT_2012 10 09_CLEAN.DOCX
Arup North America Ltd | F0.3
Attachments Table of Contents Attachment A: Sketch of hypothetical single guideway Attachment B: Sketch of hypothetical dual guideway Attachment C: Capital Cost Estimate by FTA Standard Cost Category Attachment D: Capital Cost Estimate by FTA Standard Cost Category by Segment Attachment E: Capital Cost Estimate Attachment F: Capital Cost Estimate by Segment Attachment G: Operating Cost Estimate

Attachment A: Sketch of hypothetical single guideway
Page A1

Attachment B: Sketch of hypothetical dual guideway
Page B1

MM A I N W O R K S H E E T - B U I L D A L T E R N A T I V E (Rev.14, August 5, 2011)
City of San Jose Today's Date 8/21/12
San José ATN Feasibility Study Yr of Base Year $ 2012
Yr of Revenue Ops 2047
Quantity Base YearDollars w/o Contingency
(X000)
Base Year Dollars
Allocated Contingency
(X000)
Base YearDollarsTOTAL(X000)
Base YearDollars Unit
Cost(X000)
Base Year Dollars
Percentageof
ConstructionCost
Base YearDollars
Percentageof
TotalProject Cost
10 GUIDEWAY & TRACK ELEMENTS (route miles) 6.39 103,718 0 103,718 $16,233 51% 32%10.01 Guideway: At-grade exclusive right-of-way 0
10.02 Guideway: At-grade semi-exclusive (allows cross-traffic) 0
10.03 Guideway: At-grade in mixed traffic 0
10.04 Guideway: Aerial structure 6.39 103,718 0 103,718 $16,233
10.05 Guideway: Built-up fill 0
10.06 Guideway: Underground cut & cover 0
10.07 Guideway: Underground tunnel 0
10.08 Guideway: Retained cut or fill 0
10.09 Track: Direct fixation 0
10.10 Track: Embedded 0
10.11 Track: Ballasted 0
10.12 Track: Special (switches, turnouts) 0
10.13 Track: Vibration and noise dampening 0
20 STATIONS, STOPS, TERMINALS, INTERMODAL (number) 10 38,901 0 38,901 $3,890 19% 12%20.01 At-grade station, stop, shelter, mall, terminal, platform 0
20.02 Aerial station, stop, shelter, mall, terminal, platform 10 38,901 0 38,901 $3,890
20.03 Underground station, stop, shelter, mall, terminal, platform 0
20.04 Other stations, landings, terminals: Intermodal, ferry, trolley, etc. 0
20.05 Joint development 0
20.06 Automobile parking multi-story structure 0
20.07 Elevators, escalators 0
30 SUPPORT FACILITIES: YARDS, SHOPS, ADMIN. BLDGS 6.39 8,518 0 8,518 $1,333 4% 3%30.01 Administration Building: Office, sales, storage, revenue counting 0
30.02 Light Maintenance Facility 8,518 0 8,518
30.03 Heavy Maintenance Facility 0
30.04 Storage or Maintenance of Way Building 0
30.05 Yard and Yard Track 0
40 SITEWORK & SPECIAL CONDITIONS 6.39 21,750 0 21,750 $3,404 11% 7%40.01 Demolition, Clearing, Earthwork 0
40.02 Site Utilities, Utility Relocation 5,085 0 5,085
40.03 Haz. mat'l, contam'd soil removal/mitigation, ground water treatments 040.04 Environmental mitigation, e.g. wetlands, historic/archeologic, parks 040.05 Site structures including retaining walls, sound walls 5,297 0 5,29740.06 Pedestrian / bike access and accommodation, landscaping 5,297 0 5,29740.07 Automobile, bus, van accessways including roads, parking lots 5,297 0 5,29740.08 Temporary Facilities and other indirect costs during construction 774 0 774
50 SYSTEMS 6.39 31,819 0 31,819 $4,980 16% 10%50.01 Train control and signals 31,819 0 31,819
50.02 Traffic signals and crossing protection 0
50.03 Traction power supply: substations 0
50.04 Traction power distribution: catenary and third rail 0
50.05 Communications 0
50.06 Fare collection system and equipment 0
50.07 Central Control 0
6.39 204,705 0 204,705 $32,039 100% 63%60 ROW, LAND, EXISTING IMPROVEMENTS 6.39 0 0 0 $0 0%
60.01 Purchase or lease of real estate 060.02 Relocation of existing households and businesses 0
70 VEHICLES (number) 300 39,000 0 39,000 $130 12%70.01 Light Rail 300 39,000 0 39,000 $130
70.02 Heavy Rail 0
70.03 Commuter Rail 0
70.04 Bus 0
70.05 Other 0
70.06 Non-revenue vehicles 0
70.07 Spare parts 0
80 PROFESSIONAL SERVICES (applies to Cats. 10-50) 6.39 36,721 0 36,721 $5,747 18% 11%80.01 Preliminary Engineering 0
80.02 Final Design 32,050 0 32,050
80.03 Project Management for Design and Construction 0
80.04 Construction Administration & Management 0
80.05 Professional Liability and other Non-Construction Insurance 4,671 0 4,671
80.06 Legal; Permits; Review Fees by other agencies, cities, etc. 0
80.07 Surveys, Testing, Investigation, Inspection 0
80.08 Start up 0
Subtotal (10 - 80) 6.39 280,426 0 280,426 $43,891 87%90 UNALLOCATED CONTINGENCY 43,700 13%Subtotal (10 - 90) 6.39 324,126 $50,730 100%100 FINANCE CHARGES 0 0%Total Project Cost (10 - 100) 6.39 324,126 $50,730 100%
ESTIMATED COST SCENARIO 1 (30th @Risk Percentile) 537,030
ESTIMATED COST SCENARIO 2 (80th @Risk Percentile) 757,645
ESTIMATED COST SCENARIO 3 (95th @Risk Percentile) 909,449
Allocated Contingency as % of Base Yr Dollars w/o Contingency 0.00%
Unallocated Contingency as % of Base Yr Dollars w/o Contingency 15.58%
Total Contingency as % of Base Yr Dollars w/o Contingency 15.58%
Unallocated Contingency as % of Subtotal (10 - 80) 15.58%
YOE Construction Cost per Mile (X000)YOE Total Project Cost per Mile Not Including Vehicles (X000)YOE Total Project Cost per Mile (X000)
Construction Subtotal (10 - 50)
Attachment C: Capital Cost Estimate by FTA Standard Cost Category
Page C1

MM A I N W O R K S H E E T - B U I L D A L T E R N A T I V E (Rev.14, August 5, 2011)
City of San Jose Today's Date 8/21/12
San José ATN Feasibility Study Yr of Base Year $ 2012
Yr of Revenue Ops 2047
Quantity SEGMENT 1 Base YearDollars w/o Contingency
(X000)
SEGMENT 2 Base YearDollars w/o Contingency
(X000)
SEGMENT 3 Base YearDollars w/o Contingency
(X000)
Base YearDollars w/o Contingency
(X000)
Base Year Dollars
Allocated Contingency
(X000)
Base YearDollarsTOTAL(X000)
Base YearDollars Unit
Cost(X000)
Base Year Dollars
Percentageof
ConstructionCost
Base YearDollars
Percentageof
TotalProject Cost
10 GUIDEWAY & TRACK ELEMENTS (route miles) 6.39 39,586 19,624 44,509 103,718 0 103,718 $16,233 51% 32%10.01 Guideway: At-grade exclusive right-of-way 0
10.02 Guideway: At-grade semi-exclusive (allows cross-traffic) 0
10.03 Guideway: At-grade in mixed traffic 0
10.04 Guideway: Aerial structure 6.39 39,586 19,624 44,509 103,718 0 103,718 $16,233
10.05 Guideway: Built-up fill 0
10.06 Guideway: Underground cut & cover 0
10.07 Guideway: Underground tunnel 0
10.08 Guideway: Retained cut or fill 0
10.09 Track: Direct fixation 0
10.10 Track: Embedded 0
10.11 Track: Ballasted 0
10.12 Track: Special (switches, turnouts) 0
10.13 Track: Vibration and noise dampening 0
20 STATIONS, STOPS, TERMINALS, INTERMODAL (number) 10 23,024 13,462 2,415 38,901 0 38,901 $3,890 19% 12%20.01 At-grade station, stop, shelter, mall, terminal, platform 0
20.02 Aerial station, stop, shelter, mall, terminal, platform 10 23,024 13,462 2,415 38,901 0 38,901 $3,890
20.03 Underground station, stop, shelter, mall, terminal, platform 0
20.04 Other stations, landings, terminals: Intermodal, ferry, trolley, etc. 0
20.05 Joint development 0
20.06 Automobile parking multi-story structure 0
20.07 Elevators, escalators 0
30 SUPPORT FACILITIES: YARDS, SHOPS, ADMIN. BLDGS 6.39 8,518 0 0 8,518 0 8,518 $1,333 4% 3%30.01 Administration Building: Office, sales, storage, revenue counting 0
30.02 Light Maintenance Facility 8,518 0 0 8,518 0 8,518
30.03 Heavy Maintenance Facility 0
30.04 Storage or Maintenance of Way Building 0
30.05 Yard and Yard Track 0
40 SITEWORK & SPECIAL CONDITIONS 6.39 9,217 4,754 7,779 21,750 0 21,750 $3,404 11% 7%40.01 Demolition, Clearing, Earthwork 0
40.02 Site Utilities, Utility Relocation 2,047 1,153 1,886 5,085 0 5,085
40.03 Haz. mat'l, contam'd soil removal/mitigation, ground water treatments 040.04 Environmental mitigation, e.g. wetlands, historic/archeologic, parks 040.05 Site structures including retaining walls, sound walls 2,132 1,201 1,964 5,297 0 5,29740.06 Pedestrian / bike access and accommodation, landscaping 2,132 1,201 1,964 5,297 0 5,29740.07 Automobile, bus, van accessways including roads, parking lots 2,132 1,201 1,964 5,297 0 5,29740.08 Temporary Facilities and other indirect costs during construction 774 0 0 774 0 774
50 SYSTEMS 6.39 12,007 6,610 13,201 31,819 0 31,819 $4,980 16% 10%50.01 Train control and signals 12,007 6,610 13,201 31,819 0 31,819
50.02 Traffic signals and crossing protection 0
50.03 Traction power supply: substations 0
50.04 Traction power distribution: catenary and third rail 0
50.05 Communications 0
50.06 Fare collection system and equipment 0
50.07 Central Control 0
6.39 92,351 44,450 67,904 204,705 0 204,705 $32,039 100% 63%60 ROW, LAND, EXISTING IMPROVEMENTS 6.39 0 0 0 0 0 0 $0 0%
60.01 Purchase or lease of real estate 060.02 Relocation of existing households and businesses 0
70 VEHICLES (number) 300 31,980 5,200 1,820 39,000 0 39,000 $130 12%70.01 Light Rail 300 31,980 5,200 1,820 39,000 0 39,000 $130
70.02 Heavy Rail 0
70.03 Commuter Rail 0
70.04 Bus 0
70.05 Other 0
70.06 Non-revenue vehicles 0
70.07 Spare parts 0
80 PROFESSIONAL SERVICES (applies to Cats. 10-50) 6.39 15,372 7,732 13,617 36,721 0 36,721 $5,747 18% 11%80.01 Preliminary Engineering 0
80.02 Final Design 13,417 6,748 11,885 32,050 0 32,050
80.03 Project Management for Design and Construction 0
80.04 Construction Administration & Management 0
80.05 Professional Liability and other Non-Construction Insurance 1,955 984 1,732 4,671 0 4,671
80.06 Legal; Permits; Review Fees by other agencies, cities, etc. 0
80.07 Surveys, Testing, Investigation, Inspection 0
80.08 Start up 0
Subtotal (10 - 80) 6.39 139,703 57,381 83,341 280,426 0 280,426 $43,891 87%90 UNALLOCATED CONTINGENCY 43,700 13%Subtotal (10 - 90) 6.39 324,126 $50,730 100%100 FINANCE CHARGES 0 0%Total Project Cost (10 - 100) 6.39 324,126 $50,730 100%
ESTIMATED COST SCENARIO 1 (30th @Risk Percentile) 537,030
ESTIMATED COST SCENARIO 2 (80th @Risk Percentile) 757,645
ESTIMATED COST SCENARIO 3 (95th @Risk Percentile) 909,449
Allocated Contingency as % of Base Yr Dollars w/o Contingency 0.00%
Unallocated Contingency as % of Base Yr Dollars w/o Contingency 15.58%
Total Contingency as % of Base Yr Dollars w/o Contingency 15.58%
Unallocated Contingency as % of Subtotal (10 - 80) 15.58%
YOE Construction Cost per Mile (X000)YOE Total Project Cost per Mile Not Including Vehicles (X000)YOE Total Project Cost per Mile (X000)
Construction Subtotal (10 - 50)
Attachment D: Capital Cost Estimate by FTA Standard Cost Category by Segment
D1

Job No: Sheet No:
Job Title: Base Date of Estimate
San José ATN Feasibility StudyCost Plan: Made by: Date:
Rough Order of Magnitude Cost Estimate
Description Quantity Unit Unit RateTotal
$
GRAND SUMMARY
SINGLE TRACK GUIDEWAY 15,625 FT 1,500 23,437,500
DOUBLE TRACK GUIDEWAY 15,564 FT 3,000 46,692,000
TRIPLE TRACK GUIDEWAY 2,546 FT 4,500 11,457,000
MINOR STATION (3 BERTH) 8 EACH 1,900,000 15,200,000
MAJOR STATION (20 BERTH) 2 EACH 7,700,000 15,400,000
MAINTENANCE FACILITY 1 EACH 6,700,000 6,700,000
UTILITY RELOCATIONS 1 LS 4,000,000 4,000,000
SUBCONTRACT 1 LS 12,500,000 12,500,000
Total Direct Cost 135,386,000
INDIRECT COSTS 15.0% of Direct Cost 20,308,000
Total Cost 155,694,000
OTHER ADDITIONS
DESIGN ENGINEERING 10.0% of Job Value 32,050,000
CONTRACTORS OVERHEAD & PROFIT 15.0% of Total Cost 23,354,000
INSURANCE 3.0% of Total Cost 4,671,000
CONTINGENCY / ELEMENTAL RISK 43,700,000
BOND 1,135,000
VEHICLES 39,000,000
CONTROL SYSTEMS 24,522,000
Sub-Total of OTHER ADDITIONS 168,432,000
Total Estimated Job Value 324,126,000
ESTIMATED COST SCENARIO 1 (30th @Risk Percentile) 537,030,000
ESTIMATED COST SCENARIO 2 (80th @Risk Percentile) 757,645,000
ESTIMATED COST SCENARIO 3 (95th @Risk Percentile) 909,449,000
DB Tuesday, August 21, 2012
214704-00.0Element:
Unit Cost Summary Q1 2012
Attachment E: Capital Cost Estimate
Page E1

Job No: Sheet No:
Job Title: Base Date of Estimate
San José ATN Feasibility StudyCost Plan: Made by: Date:
Rough Order of Magnitude Cost Estimate
DescriptionSEGMENT 1
$SEGMENT 2
$SEGMENT 3
$Total
$
GRAND SUMMARY
SINGLE TRACK GUIDEWAY 12,601,500 8,317,500 2,518,500 23,437,500
DOUBLE TRACK GUIDEWAY 9,525,000 4,674,000 32,493,000 46,692,000
TRIPLE TRACK GUIDEWAY 11,457,000 0 0 11,457,000
MINOR STATION (3 BERTH) 1,900,000 11,400,000 1,900,000 15,200,000
MAJOR STATION (20 BERTH) 15,400,000 0 0 15,400,000
MAINTENANCE FACILITY 6,700,000 0 0 6,700,000
UTILITY RELOCATIONS 1,674,500 842,200 1,483,300 4,000,000
SUBCONTRACT 5,232,700 2,631,900 4,635,400 12,500,000
Total Direct Cost 64,490,700 27,865,600 43,030,200 135,386,000
INDIRECT COSTS 15.0% 8,501,200 4,275,900 7,530,800 20,308,000
Total Cost 72,991,900 32,141,500 50,561,000 155,694,000OTHER ADDITIONS
DESIGN ENGINEERING 10.0% 13,416,600 6,748,200 11,885,100 32,050,000
CONTRACTORS OVERHEAD & PROFIT 15.0% 9,776,400 4,917,300 8,660,400 23,354,000
INSURANCE 3.0% 1,955,400 983,500 1,732,200 4,671,000
CONTINGENCY / ELEMENTAL RISK 18,293,500 9,201,200 16,205,300 43,700,000
BOND 475,100 239,000 420,900 1,135,000
VEHICLE 31,980,000 5,200,000 1,820,000 39,000,000
CONTROL SYSTEMS 10,122,700 4,116,400 10,282,600 24,522,000
Sub-Total of OTHER ADDITIONS 86,019,701 31,405,600 51,006,500 168,432,000
Total Estimated Job Value 159,011,601 63,547,100 101,567,500 324,126,000
ESTIMATED COST SCENARIO 1 (30th @Risk Percentile) 263,145,000 107,406,000 166,479,000 537,030,000
ESTIMATED COST SCENARIO 2 (80th @Risk Percentile) 371,246,000 151,529,000 234,870,000 757,645,000
ESTIMATED COST SCENARIO 3 (95th @Risk Percentile) 445,630,000 181,890,000 281,929,000 909,449,000
DB Tuesday, August 21, 2012
214704-00.0Element:
Segment Capex Summary Q1 2012
Attachment F: Capital Cost Estimate by Segment
Page F1

Job No: Sheet No:
Job Title: Base Date of Estimate
San José ATN Feasibility StudyCost Plan: Made by: Date:
Rough Order of Magnitude Cost Estimate
DescriptionSEGMENT 1
$SEGMENT 2
$SEGMENT 3
$Total
$
GRAND SUMMARY
STAFF COST 4,461,200 639,500 184,000 5,284,700
MAINTENANCE COST 1,755,100 423,300 190,800 2,369,200
PERIODIC RENEWAL COST 1,686,100 285,500 146,000 2,117,600
ENERGY COST 221,600 91,000 33,300 345,900
Sub-total 8,124,000 1,439,300 554,100 10,117,400
CONTINGENCY / ELEMENTAL RISK (incl below)
Total Estimated Cost per Annum 8,124,000 1,439,300 554,100 10,117,400
ESTIMATED COST SCENARIO 1 8% @ RISK CONTINGENCY 10,967,000
ESTIMATED COST SCENARIO 2 24% @RISK CONTINGENCY 12,509,000
ESTIMATED COST SCENARIO 3 37% @RISK CONTINGENCY 13,640,000
DB Tuesday, August 21, 2012
214704-00.0Element:
Segment Opex Summary Q1 2012
Attachment G: Operating Cost Estimate
Page G1

M
J
A
T
C
F
S
T
2
TEA
F
cr
A
2w
A
Memor
J:\S-F\210000\214704-00\4 INTE
Arup North America Ltd | F
To LH
Copies WR
From G
Subject S
This memorConstruction25 in the Ar
The cost forEstimate datAlignment h
• VTA to Termina
• Termina• Termina
Drive”) • Green Is
Boundar• Airport B
Clara Sta
For the cost estimate. Arconstructionrisk continge
Arup then esCost Index (2, 2012 (sincwas calculat
Attachments
• San Jose
• APM Co
andum
ERNAL PROJECT DATA\4-04 CA
F0.3
Laura StuchinsHenry Servin
Will BaumgarRichard Kerrig
Gary Hsueh, D
San José ATN
randum discun Costs (201rup Prelimina
r the AM is bted Septembheading and
Terminal B al / Above Teal B to Termial A to Green
sland to Airpry / ElevatedBoundary toation / Eleva
estimate calrup increasedn cost overruency for AT
scalated the (CCI). The ace the annuated to be 103
s:
e Internation
ost Estimate
ALCULATIONS\COST ESTIMAT
sky
dner, Bill Magan, Eloise Je
Dave Brogan
N Feasibility S
usses in mor12 $, Millionary Business
based on the ber 2001, pagconsist of th
(which in therminal Drivinal A (“Extn Island (“Ex
port Boundard”) o Santa Claraated”)
lculation, Ard the construuns. Arup theTN is 134%).
resulting totannual CCI ial was not ye386.04 divid
nal Airport A
Summary
TE\APM\APM COST COMPARIS
addex, Ignacioeanneau
Study APM C
re detail the cn) referenceds Case Mem
San Jose Inge 1. The seghe following
he cost estimve”) tension: Termxtension: Ol
ry (“Extensi
a (“Extension
rup includeduction continen added a c.
tal to 2012 dndex value f
et available) ded by 7399.
APM Projects
SON METHODOLOGY.DOCX
o Barandiaran
Cost Comparis
calculation fd in Table 21
mo.
nternational Agments chos:
mate is identif
minal to Oldd Terminal A
ion to Santa
n to Santa C
d the Subtotangency fromategorical ri
dollars using for San Franthe CCI was07, or 1.403
s Conceptua
n,
son Methodol
for Airport P1 in the Arup
Airport APMsen for comp
fied as “Initi
d Terminal AA to Green I
Clara Statio
Clara Station
al, E&I, and m 10% to 40%
isk contingen
the Engineencisco in 200s 10,386.04.695329 (app
al Cost Estim
Date
July 26
Referenc
214704
File refer
4-04
logy
People Movep Final Repo
M Projects Cparison are u
ial System: N
A / Above TeIsland / Abo
on: Green Isl
: Airport Bo
Real Estate % to reflect oncy of 40%
ering News R01 was 7,399. The resultinproximately
mate dated Se
Pa
6, 2012
ce number
4
rence
er Risk-Adjuort, and Tabl
Conceptual Cunder the Ele
North First S
erminal Drivve Terminal
land to Airpo
oundary to Sa
costs from tobserved, his(note the cat
Record Cons9.07, and forng increase fa 40% incre
eptember 20
age 1 of 1
usted les 4 and
Cost evated
Street to
ve”) l
ort
anta
the 2001 storical tegorical
struction r Quarter factor ease).
001, p. 1
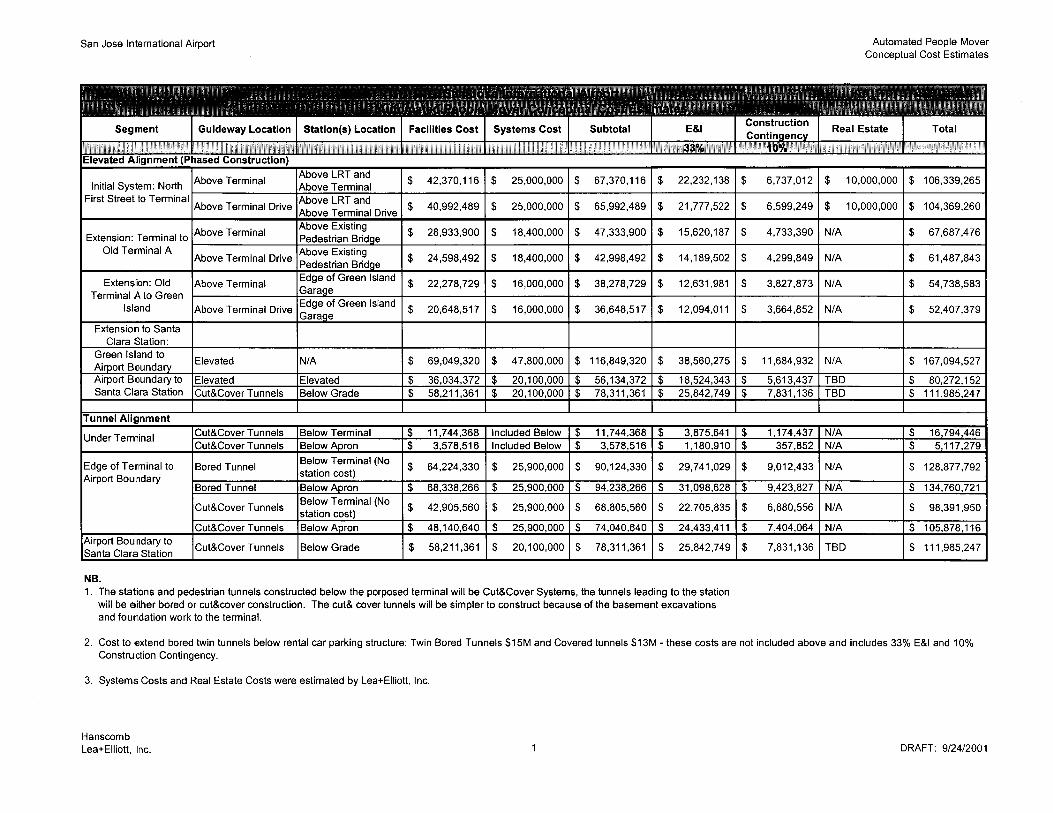
San Jose International Airport Automated People Mover Conceptual Cost Estimates
Extension: Terminal to Old Terminal A
NB. 1. The stations and pedestrian tunnels constructed below the porposed terminal will be Cut&Cover Systems, the tunnels leading to the station
will be either bored or cut&cover construction. The cut& cover tunnels will be simpler to construct because of the basement excavations and foundation work to the terminal.
2. Cost to extend bored twin tunnels below rental car parking structure: Twin Bored Tunnels $15M and Covered tunnels $13M - these costs are not included above and includes 33% E&l and 10% Construction Contingency.
3. Systems Costs and Real Estate Costs were estimated by Lea+Elliott, Inc.
Hanscomb Lea+Elliott, Inc. DRAFT: 9/24/2001

APM Cost Estimate Summary5/16/2012
Based on San Jose International Airport APM Projects Conceptual Cost Estimate, September 24, 2001Segments for Comparison with San Jose ATN Feasibility Study AlignmentSegment - Above grade alignment
Subtotal E&IConstruction Contingency
Categorical Risk Contingency Real Estate Total
33% 40% 40%VTA to Terminal B (above Terminal Dr) 66,000,000$ 21,780,000$ 26,400,000$ 26,400,000$ 10,000,000$ 150,580,000$ TB to TA (above Terminal Dr) 43,000,000$ 14,190,000$ 17,200,000$ 17,200,000$ 91,590,000$ TA to Green Island (above Terminal Dr) 37,000,000$ 12,210,000$ 14,800,000$ 14,800,000$ 78,810,000$ Green Island to Airport Boundary (Elevated) 117,000,000$ 38,610,000$ 46,800,000$ 46,800,000$ 249,210,000$ Airport Boundary to SC (Elevated) 56,000,000$ 18,480,000$ 22,400,000$ 22,400,000$ 119,280,000$ Total 319,000,000$ 105,270,000$ 127,600,000$ 127,600,000$ 10,000,000$ 689,470,000$
2012 PRICES 447,778,810$ 147,767,007$ 179,111,524$ 179,111,524$ 14,036,953$ 689,000,000$ Rounded967,146,082$ 2012 PRICES967,000,000$ 2012 Rounded
Cost Escalation from 2001 to 2012ENR CCI Data 2001 (San Francisco) 7399.07
ENR CCI Data 2012 (San Francisco, Q2) 10386.04 1.403695329 INCREASE FACTOR

M
J
A
T
C
F
S
T
T
rpc
A
T
F
AttA
Mp
b
Memor
J:\S-F\210000\214704-00\4 INTE
Arup North America Ltd | F
To L
Copies W
From G
Subject S
This memo psources for tThis memo funding progregionally-pprojects currcorridor.
Arup wrote San José AT
The other po
• Fare rev
• Parking
• Revenue
• Sales tax
Fare Re
According tothe conditionterminal/parAirport Flyestations are Metro/Airpoparking lots and VTA Flbe direct trip
andum
ERNAL PROJECT DATA\4-05 RE
F0.3 | July 2010
Laura Stuchins
William Baum
Gary Hsueh, D
San José ATN
provides a suthe Norman excludes tragrams, as the
prioritized trarently includ
a memo speTN Feasibilit
otential oper
enue
revenue
e from adjac
x revenue
evenue
o the Airporns of continurking lots aner bus route, assumed to sort stations. Iand to the C
lyer trips areps between t
EPORTS & NARRATIVES\ALTE
sky, Henry Se
mgardner
David Watkin
N Feasibility S
ummary andY. Mineta S
aditional fedee City has stansportationde the BART
cifically addty Study Pot
rating revenu
ent developm
rt Master Plaued certificad Caltrain/Vwhich woul
serve AirporIn addition,
Consolidatede currently fathe Santa Cla
RNATIVE REVENUE SOURCES
ervin
ns, Austin Sm
Study Alternat
d qualitative San José Inteeral capital ftated that it d
n projects thaT extension t
dressing potetential Adver
ue sources di
ment
an Air Resouation is to “PVTA train stald be replacert destinationall on-Airpo
d Rent-a-Carare-free, tripsara Caltrain
S\ALTERNATIVE REVENUE SO
ith
tive Revenue
discussion oernational Aifunding progdoes not inteat would be eto San José a
ential advertrtising Reve
iscussed in t
urces Board Provide free tations.” Thised in functions except forort shuttle bur center (Cons for which fand VTA M
OURCES MEMO_V5.DOCX
e Sources
of several poirport Autom
grams, and oend for the Aeligible for tand the elect
tising revenuenue and is d
this memo in
Certificationtransportatios condition isn by the ATr the Santa Cus trips, whicnRAC), are ffares might b
Metro/Airport
Date
August
Referenc
214704
File refer
4-05
otential opermated Transiother major rATN to compthose fundintrification of
ue for ATN. dated April 1
nclude:
n Status Repon connectins currently m
TN. For this eClara Caltraich connect thfree. While abe reasonablt stations. Th
Pa
t 24, 2012
ce number
4
rence
rating revenuit Network (Aregional and pete with othg sources. Sf the Caltrain
That memo 10, 2012.
port for 2011ng Airport met via the Vexercise, all in and VTA he two termiall on-Airpoly collected he estimated
age 1 of 9
ue ATN). state
her uch n
is titled
1, one of
VTA ATN
inals to rt trips would
d

Memorandum
J:\S-F\210000\214704-00\4 INTERNAL PROJECT DATA\4-05 REPORTS & NARRATIVES\ALTERNATIVE REVENUE SOURCES\ALTERNATIVE REVENUE SOURCES MEMO_V5.DOCX
Page 2 of 9Arup North America Ltd | F0.3 | July 2010
passenger demand for this link is 300 total daily passengers in 2011 and 650 total daily passengers in 2030, or approximately 5% of system total daily passenger trips in each case.
Currently the VTA Flyer is free for all trips, including between the Caltrain and LRT stations, while regular bus cash fares are $2. Monthly passes would reduce average per-trip fare revenue. Passenger price sensitivity is unknown for the ATN application and requires further study.
Opportunities include:
• ATN would offer a premium passenger experience compared to the VTA Flyer in terms of waiting time and travel time. ATN could reduce travel time between Light Rail and Caltrain in half.
• To lessen the impact of a fare to passengers, the ATN operator could arrange a fare reimbursement agreement with Caltrain and VTA. Passengers could ride ATN for free if they transfer to/from Caltrain or VTA, but the ATN operator would be reimbursed in part by the originating or destination transit agency for the fare. Both Caltrain and VTA offer their passengers free or discounted transfers for connecting transit services. On the other hand, the ATN operator would receive less revenue per passenger.
• The connection between Santa Clara Caltrain and VTA Metro/Airport station is a regional link. Although the two services meet at Diridon Station further south, there is a significant time penalty to make the transfer and travel through downtown San Jose via Light Rail. Therefore, passengers may be willing to pay for the convenience of traveling between Santa Clara Caltrain and VTA Metro/Airport stations.
Challenges include:
• Given the requirement for Airport trips to be free, only a very small proportion of ATN ridership has the potential to generate fare revenue.
• The existing VTA Flyer is free even for direct trips between Santa Clara Caltrain and VTA Metro/Airport station.
• Fare collection equipment and a fare media system would need to be provided, which carries additional capital and operating costs for equipment, media, and software integration and maintenance, including potential integration with the Bay Area’s Clipper smart transit fare card. This also introduces a level of hassle not currently experienced by passengers using the VTA Flyer.
Given the challenges outlined above, and to provide the best possible passenger experience, revenue from fares has not been assumed in the Preliminary Business Case Analysis.
Parking Revenue
Preliminary data from the PRT operation at Heathrow Airport Terminal 5 indicates that since commencement of PRT service, parking revenue has increased by 10 percent at the two business-class surface parking lots served by PRT due to increased patronage and an increase in parking fees. While this is an encouraging data point, the applicability of the experience at Heathrow to the San José Airport is questionable and would benefit from more study. A variety of factors both support and discount potential applicability and warrant further study.

Memorandum
J:\S-F\210000\214704-00\4 INTERNAL PROJECT DATA\4-05 REPORTS & NARRATIVES\ALTERNATIVE REVENUE SOURCES\ALTERNATIVE REVENUE SOURCES MEMO_V5.DOCX
Page 3 of 9Arup North America Ltd | F0.3 | July 2010
Opportunities include:
• Both Heathrow and San José Airport main terminal buildings are served by a large, multi-story parking garage. Despite this condition at Heathrow, parking demand and revenue at the remote parking lots served by PRT has increased.
• The travel time savings at Heathrow T5 are dramatic, with an average savings of 9.6 minutes (6.2 minute PRT trip compared to 15.8 minute shuttle bus trip)(Martin Lowson, 2010). At San José Airport, the Economy Lot offers great potential for reducing travel time and increasing travel time reliability. The lot is beyond walking distance from the terminals and it has a total of 7 bus stops arranged along its perimeter for the Airport shuttles, increasing trip time when multiple stops are served. In addition, the terminal-area roadways are one-way so trip times from the terminal area (7 to 16 minutes) are longer than trips from the Economy Lot to the terminals (2 to 13 minutes). The ATN could serve trips between the Economy Lot and the terminal area in as few as 3 minutes; could offer more balanced trip times; and offer better reliability because the ATN would not be subject to traffic congestion.
• The Heathrow surface lots served by PRT are intended for business customers, which value short travel times and convenience. They may also be reimbursed for travel expenses and therefore are less sensitive to fees. San José Airport notes that it serves a mix of business and non-business travelers and a number of its customers are sensitive to parking price. The people that do park on-Airport at San José essentially self-select by choosing the more expensive parking rates in exchange for quick access to terminals.
• The low travel times enabled by an ATN raises the possibility that the Airport could expand its parking capacity at surface parking lots located further from the terminal area, increasing its revenue-generating ability while avoiding substantial costs of building new structured parking close to the terminals.
Challenges include:
• Overall Airport passenger demand is unlikely to change as a result of the ATN (larger factors include the general economy, flight schedules, landing fees/pricing, etc.). Therefore, the ATN system is not expected to increase overall parking demand, though it may affect where people park.
• The Heathrow surface parking lots were previously underused and had spare capacity. The San José Airport Economy Lot, while having good potential for improvement, is well-used compared to other lots at the Airport, and it is unknown whether there is sufficient supply to recognize increases in revenue from increased demand at the Economy Lot.
• San José Airport staff acknowledges that on-Airport parking pricing is relatively high compared to off-Airport competitors. The Airport is currently limited in its ability to increase parking rates. A comparative parking pricing study could look at some of the factors discussed above.
• Because the ATN would connect to the VTA Light Rail station and to Santa Clara Caltrain/future BART station, the ATN may reduce parking demand and consequently parking revenue. On the other hand, it could be offset by creating capacity for travelers who value short, reliable travel times and convenience that on-Airport parking served by an ATN could provide.
Given the similarity of the passenger profile (high business travel), and the Airport’s location in Silicon Valley, a modest one-time increase in parking revenue seems justified. However, further study is

Memorandum
J:\S-F\210000\214704-00\4 INTERNAL PROJECT DATA\4-05 REPORTS & NARRATIVES\ALTERNATIVE REVENUE SOURCES\ALTERNATIVE REVENUE SOURCES MEMO_V5.DOCX
Page 4 of 9Arup North America Ltd | F0.3 | July 2010
warranted to determine the level of increase more precisely. For the purposes of the Preliminary Business Case Analysis, the Project Team has assumed a one-time increase of 10% (with no parking rate increase), and subsequent annual increase of 1.5% linked to airport passenger growth. The base parking revenue in all cases is assumed to continue to be used for general Airport (non-ATN) operations.
Revenue from Adjacent Development
The Airport-area ATN system analyzed in the Feasibility Study locates one station at the VTA Metro/Airport station, one station at Santa Clara Caltrain, and the remaining eight ATN stations all on Airport property. However, in-line stations could be added to the alignment. The network could also be extended in length to serve other destinations. But, that is beyond the scope of the San José ATN Feasibility Study. Two perspectives regarding revenue from development adjacent to hypothetical in-line stations are offered below.
Preliminary Land Use Analysis In early stages of the Feasibility Study, a GIS-based analysis identified walksheds from VTA LRT, Caltrain, and a hypothetical network of ATN stations to the west and east of the Airport. Walksheds for LRT and Caltrain were calculated assuming a maximum 1/3-mile walk from each station (consistent with City of San José and VTA planning guidance), and walksheds for ATN assumed a maximum ¼-mile walk from each station. ATN stations were placed with the intent of capturing as much development as possible except for avoiding the Guadalupe Gardens residential neighborhood immediately east of the Airport, which has in the past objected to the Airport APM.
Land use analysis of these walksheds revealed that land along the west edge of the Airport is zoned industrial, with the exception of the Santa Clara Caltrain/future BART station, which will be zoned to accommodate a mix of high-intensity retail, residential, and entertainment uses. Thus very low ridership would be expected at intermediate points between the Airport and the Santa Clara Caltrain station along a northern alignment. Ridership along a southern alignment could offer greater potential due to the anticipated redevelopment of the former FMC property bounded roughly by Brokaw Road, Coleman Avenue, the UPRR tracks, and Newhall Drive, which included discussion of building a new professional soccer stadium; however, for other reasons the northern alignment was chosen for further study. Land east of the Airport within the walksheds is zoned with a mix of industrial and commercial, although implementation of the Vision for North San Jose is expected to intensify land use along the North First Street corridor, particularly around each LRT station. See Figure 1 for a diagram of land use near the hypothetical ATN stations.
Ridership potential from adjacent land uses was assessed for three hypothetical ATN stations east of the Airport and one station south of the Airport (at Coleman Avenue near Hedding Street). Assumptions for the analysis were drawn from Arup’s experience in transit station planning in the Bay Area and included the following:
• 65 percent of land is developed (remaining land is occupied by roadways, utilities, parks, etc.)
• Site commercial floor-area ratios range between 0.1 and 0.5 (to generate low/high range)
• Employment density is 400 square feet per worker (typical for office workers)

Memorandum
J:\S-F\210000\214704-00\4 INTERNAL PROJECT DATA\4-05 REPORTS & NARRATIVES\ALTERNATIVE REVENUE SOURCES\ALTERNATIVE REVENUE SOURCES MEMO_V5.DOCX
Page 5 of 9Arup North America Ltd | F0.3 | July 2010
• There is an average of 1.5 trips per employee per day (accounting for 7 days a week and part-time workers)
• VTA system-wide (Santa Clara County) transit mode share is 3.5% of all transportation trips
The use of the above assumptions resulted in potential ridership ranges from 20 to 100 daily riders at hypothetical ATN stations. See Table 1 below. The low ridership is largely driven by the use of the VTA system-wide mode share. This is a reasonable assumption to use because the ATN analyzed in the Feasibility Study is primarily intended to serve specialized trips to the Airport, and any additional trips from last-mile connections would rely on the use of other transit services, namely LRT or Caltrain. The hypothetical ATN stations generally did not include residential areas, with the exception of the station near Coleman, so the opportunity for internal trip capture is limited. A predominance of commercial land uses at each of the hypothetical ATN station locations, some of which are offices oriented toward the North First Street corridor and others Airport-oriented such as hotels, indicates that work-destination trips are likely the largest component of the non-Airport-based trips.
An early conclusion from this analysis is that the relatively low magnitude of benefit (on the order of dozens or hundreds of riders a day), with the system analyzed in the Feasibility Study, would not likely drive developers to help fund an ATN.
Table 1. Early Analysis of Potential Ridership at Hypothetical ATN Stations
Hypothetical ATN Station
Population Infill Employment Total Employment Potential Daily Trips
Low High Low High Low High
Component 0 450 2200 450 2200 24 116
Karina 0 400 675 750 1025 39 54
Airport Pky 0 0 0 400 400 21 21
Coleman 525 65 275 75 285 32 42

Gish Station
Karina Station
Component Station
Santa Clara Station
Civic Center Station
College Park Station
Metro/Airport StationG
uadalupe River
£¤101
£¤101
¬«87
¬«87
1st St
4th St
Coleman Av
Hedding St
Taylo
r St
Airport Bl
Zanker RdCha
rcot A
v
Broka
w Rd
De
La C
ruz
Bl
Park Av
Trimble Rd
Airpor
t Py
Mon
roe
St
Skyport Dr
Washington St
San Pedro St
Lafayette St
The Alameda
Market St
New
Stre
et
1st St
The Alameda
The Alameda
Coleman Av
Market St
Old Bayshore Hy
Gis
h R
d
Old Bayshore Hy
§̈¦880
San José ATN Feasibility Study
0 0.25 0.5 0.75 10.125Mile±
Figure 1: Land-use Zoning MapSanta Clara Zoning
DuplexHeavy IndustrialLight IndustrialMedium Density Multiple DwellingMixed Use
Legend
A(PD)
CG CN CO
CO(PD)
CP HI IP
IP(PD) LI
R-1-8 R-2
R-2(PD)
R-M
San Jose Zoning
February 25, 2011
Exclusive ATN quarter mile walkshed
Potential ATN station

Memorandum
J:\S-F\210000\214704-00\4 INTERNAL PROJECT DATA\4-05 REPORTS & NARRATIVES\ALTERNATIVE REVENUE SOURCES\ALTERNATIVE REVENUE SOURCES MEMO_V5.DOCX
Page 7 of 9Arup North America Ltd | F0.3 | July 2010
Airport-Serving Hotels and Businesses According to an analysis of the City of San José Official Visitor Guide 2010, out of the approximately 3,250 hotel rooms within 20 hotel properties located proximate to the east side of the Airport, 2,650 rooms (81%) are served by a hotel shuttle at 13 of the hotel properties, while 7 properties with a total of 615 rooms do not offer shuttle services. It has been suggested that if ATN stations could offer Airport access to nearby hotels, then those hotels could discontinue their own shuttle services and contribute operating funds to the ATN instead. Other businesses located in office buildings and business parks in the area may also contribute towards ATN to provide improved access to the Airport for employees and guests. One method for accomplishing this is for area hotels and businesses to voluntarily create a local area transportation management association (TMA), which could collect and direct member contributions toward improvements in the area, including subsidizing ATN operations. This mechanism is commonly used in office/business parks, retail centers, and transit station node areas to subsidize shuttle services to reduce traffic congestion, encourage transit use, and draw shoppers.
However, there are also several potential reasons that hotels and local businesses may not support ATN financially. Further investigation can examine these potential issues and establish whether there would be sufficient benefit for hotels and businesses proximate to the Airport that they would agree to help fund ATN operations. Challenges might include:
• Most hotels in the area are small (all but two are less than 200 rooms each), and the incremental cost for a hotel to operate a shuttle on a part-time basis is low.
• Existing shuttle services and taxis are flexible and are likely to cover additional destinations than the ATN system, and therefore may still be needed in addition to ATN.
• Hotel shuttles and taxis offer a high level of service. They pick up at the hotel door and can be demand-responsive. An ATN would likely be more responsive to demand than hotel shuttles, but would need great station coverage to achieve a comparable degree of walk accessibility.
• Hotels see a competitive advantage to offering in-house shuttle services if they can offer better services than other hotels, for example if they are located more conveniently to the Airport. If they pay into an ATN, some competitive advantages may be negated, such as the potential for increased travel time and hassle (e.g., level changes, walk distance). Further, if the ATN operates in a public, fare-free or low-fare setting, there is even less benefit for businesses that pay than neighboring businesses that don’t pay.
• Even if area hotels and businesses were to pool resources via a transportation management association, they could decide to fund non-ATN services and projects, such as a jointly-funded shuttle bus system.
Further research is recommended to confirm attitudes and commitments of Airport-serving businesses. In the meantime, revenue from adjacent development has not been assumed in the Preliminary Business Case Analysis.
Sales Tax Revenue
The City of San José could consider levying a local sales tax measure to help fund ATN operations, or it could lobby VTA to include ATN on future county sales tax measures. A very strong political effort

Memorandum
J:\S-F\210000\214704-00\4 INTERNAL PROJECT DATA\4-05 REPORTS & NARRATIVES\ALTERNATIVE REVENUE SOURCES\ALTERNATIVE REVENUE SOURCES MEMO_V5.DOCX
Page 8 of 9Arup North America Ltd | F0.3 | July 2010
would be needed to convince local taxpayers to pay for ATN, considering the current economic climate, the fact that Santa Clara County already has sales tax measures in place for transportation, and larger regional projects need significant capital and operating funds (BART extension to San José and electrification of Caltrain). While this funding source does not seem to be a likely candidate in the near future, it may be worth revisiting later as the trend increases towards greater share of local funding for transportation. At this time, sales tax revenue has not been assumed in the Preliminary Business Case Analysis.
Summary
Table 2 summarizes the potential revenue sources discussed in this memo and whether revenues have been assumed in the Preliminary Business Case Analysis for the San José ATN Feasibility Study.
Table 2. Summary Table of Alternative Revenue Sources
Potential Revenue Source
Assumption in the San José ATN
Feasibility Study Notes
Fare Revenue Not included
Currently there is little justification for fare-based revenue. All Airport-related trips would essentially be free. Non-Airport trips represent a very small percentage of trips, and those trips currently are also free.
Parking Revenue Included
Parking revenues increased after the London-Heathrow Terminal 5 ATN began service, even after rates were raised. Further market study comparing San José to Heathrow may be justified.
Revenue from Adjacent
Development Not included
Early analysis indicated low potential ridership for non-Airport trips. Possibility for more in-depth analysis related to hotel shuttles, demonstration of benefit, and potential for TMA formation.
Sales Tax Revenue Not included Challenging environment to raise additional taxes to support ATN in the foreseeable future.

Memorandum
J:\S-F\210000\214704-00\4 INTERNAL PROJECT DATA\4-05 REPORTS & NARRATIVES\ALTERNATIVE REVENUE SOURCES\ALTERNATIVE REVENUE SOURCES MEMO_V5.DOCX
Page 9 of 9Arup North America Ltd | F0.3 | July 2010
Sources Considered
• Market Demand and Economic Viability of a Personal Rapid Transit System in Stockholm – the Use of EMME/2, October 1999
• Viability of Personal Rapid Transit in New Jersey, February 2007
• Daventry PRT Scoping Study, Phase 2 Report, February 2008
• [Morgantown / West Virginia University] PRT Facilities Master Plan, June 2010
• Feasibility of PRT in Ithaca, New York, Final Report, September 2010
• [Mineta San José International Airport] Annual Status Report on the Airport Master Plan, March 2012
• PRT: Business Case and Revenue Generation, Martin Lowson, presentation to Passenger Terminal Expo, March 2010

Memorandum
J:\S-F\210000\214704-00\4 INTERNAL PROJECT DATA\4-05 REPORTS & NARRATIVES\ADVERTISING REVENUE MEMO\POTENTIAL ADVERTISING REVENUE MEMO_V3.DOCX
Page 1 of 11Arup North America Ltd | F0.3 | July 2010
To Laura Stuchinsky Henry Servin
Date
April 10, 2012
Copies Reference number
214704
From Gary Hsueh Will Baumgardner
File reference
4-05
Subject San José ATN Feasibility Study Potential Advertising Revenue
This memo summarizes several methods for estimating potential advertising revenue for the ATN system.
These methods are drawn primarily from TCRP Synthesis 51 (2004), and recent consultation with VTA, the Airport, and Arup’s global skills networks.
Applicable Notes from TCRP Synthesis 51 Factors for Consideration
Media market: rates in the top 20 media markets are generally higher because of the higher level of national advertisers. San José (VTA) is in the San Francisco top 20 media market.
Restrictions on billboards in the San Francisco area (notably San Mateo County) has helped make exterior bus advertisements more valuable.
Revenue Guarantee: 92% of the 43 transit agencies surveyed included a minimum annual payment that their advertising sales contractor paid to the transit agency, regardless if the contractor sold that amount of advertising space. In 2002, guarantees for small- to medium-size agencies in top 20 media markets ranged from $17,000 to $2.1 million.
Revenue Share: 92% of agencies reported that their contracts included a revenue share, whereby the advertising sales contractor paid the transit agency a pre-defined percentage of their annual revenue. Revenue shares ranged from 25% to 65% for small- to medium-size agencies in top 20 media markets. However, it is also noted that in economically depressed times, the revenue guarantee is usually the greater number.
Rates vary by media market, exterior vs. interior advertising, positioning and size of an advertisement on a vehicle, and duration of a campaign.
Among large transit agencies in the top 20 media markets, exterior “king-sized” (the most common size, 30 inches by 144 inches) bus advertisements ranged from $520 to $735 per 4-week posting. For longer 52-week postings, rates were lower by $60 to $150.

Memorandum
J:\S-F\210000\214704-00\4 INTERNAL PROJECT DATA\4-05 REPORTS & NARRATIVES\ADVERTISING REVENUE MEMO\POTENTIAL ADVERTISING REVENUE MEMO_V3.DOCX
Page 2 of 11Arup North America Ltd | F0.3 | July 2010
In-vehicle advertising draws much lower rates than exterior advertising, because the ridership is so much lower. Interior car cards were priced at $16 to $24 per month.
In-vehicle electronic advertisements were too new to draw conclusions in the TCRP Synthesis.
Bus wraps and “station dominance/station blitz” are more proven forms of “nontraditional” forms of advertising. They command substantially higher rates, but are more limited in use because of cost to advertisers. Vehicle wrapping has been successful for certain types of events, product roll-outs, vehicles, or advertisers. Issues identified with bus wraps include visibility and safety; aesthetic concerns (leading to a limitation on the number of vehicles wrapped in a fleet); dilution of the agency brand; coordination issues with operations; and costs of repainting after wraps are removed.
Rates for full-bus wraps ranged from $5,300 to $7,700 per month; longer-term commitments of 12 weeks or more were expected.
The value of a full-bus wrap was approximately 4 times the value of conventional advertising at large transit agencies. Larger conventional side advertisements (“super king”) were $2,000 at San Francisco-area transit agencies, and full-back advertisements were priced between $1,200 and $2,500.
Revenue potential is affected by the size of the transit agency in terms of number of vehicles, and ridership.
At the time of writing in 2004, transit agencies realized much lower revenue levels after 2002 because of the economy.
Estimating Methods
Percentage of total operating funds: 0.1% to 3.2%, average of 1.5%
Percentage of fare revenues: 4.4% of revenues from fares, outliers include 10% and 20% of fares.
Revenue per passenger trip/based on ridership: average 3.5 cents per trip for large transit agencies. See Figure 12 from TCRP correlating revenue to ridership, below.

Memorandum
J:\S-F\210000\214704-00\4 INTERNAL PROJECT DATA\4-05 REPORTS & NARRATIVES\ADVERTISING REVENUE MEMO\POTENTIAL ADVERTISING REVENUE MEMO_V3.DOCX
Page 3 of 11Arup North America Ltd | F0.3 | July 2010
Revenue per vehicle/based on fleet size: strong correlation with fleet size for the 14 bus-only agencies surveyed; mostly between $1,100 and $1,800 per bus; average $1,472 per bus excluding highest and lowest values. See Figure 13 from TCRP correlating revenue to fleet size.
Revenue per vehicle for smaller transit agencies in large metropolitan areas: in 2002, average revenue of $4,900 per bus and 12.8 cents per passenger trip for agencies characterized by operating substantial commuter service into the central city or between suburbs, or both; benefit from attractive demographics of their own ridership and surrounding automobile drivers, which attract a higher-end mix of advertisers than central city bus systems.
At the end of this document, as an Appendix, is Table 6 from TCRP Synthesis 51, Summary of Advertising Revenue in 2002. Considering both ridership and fleet size, the ATN system would appear to fall into the category of “Other Transit Agencies in Top 20 Media Markets.”
San José Airport Rate Card The Mineta San José International Airport contracts with advertisement sales company Clear Channel. The rate card for several standard media types is copied below.

Memorandum
J:\S-F\210000\214704-00\4 INTERNAL PROJECT DATA\4-05 REPORTS & NARRATIVES\ADVERTISING REVENUE MEMO\POTENTIAL ADVERTISING REVENUE MEMO_V3.DOCX
Page 4 of 11Arup North America Ltd | F0.3 | July 2010
Additional information about media types and rates was obtained during a conversation with Clear Channel. Dioramas and mini-spectaculars are backlit; they are located on concourse and in gate hold areas. Current digital network consists of 18 screens (provide more movement and are vibrant); located primarily in baggage claim, with highest queue times, and 4 in concourses. Rate for digital network is $10,000 per month. Most advertisers mix digital and dioramas. Another offering is a high-end, stretchy banner – outdoor equivalent to billboards. These are located at security checkpoints and are offered at $20,000 per month (Clear Channel, 2012).
Qualitative Comparisons Between ATN and Other Transit Modes ATN vehicles are smaller than buses, and thus will have less visible area than a bus. ATN vehicles range
from 141 inches to 153 inches long and 57 to 83 inches tall. This places the effectiveness and revenue generation ability of an ATN vehicle wrap closer to a standard king-size bus exterior ad (30 inches by 144 inches) than a full-size bus wrap (6 feet tall by 40 feet long).
ATN vehicles operate on exclusive, grade-separated guideways. ATN vehicles will be less visible to non-users than buses that operate in mixed traffic. The guideway design may also affect visibility if vertical surfaces partially obscure vehicles, for example if there are raised curbs, crash barriers, and passenger safety fences.
The ATN guideway will be located in fairly prominent locations parallel to major Airport roads. Because the guideway is elevated, vehicles will be more visible when seen from afar rather than when they are directly overhead.
The ATN represents a new technology, and it should attract more attention and more media coverage than conventional transit. As a consequence, it may attract higher-tier advertisers in Silicon Valley including national-level advertisers (which typically pay more). However, because it is a new technology, it may also need to demonstrate a reliable track record before major advertisers sign on to more lucrative and visible opportunities such as vehicle wraps.
ATN has more vehicles per rider than conventional transit agencies. This affects estimates that are based on fleet size or ridership.
Conventional-sized advertisements are easier to sell because advertisers do not need to reformat their pre-designed ads. It is unlikely that ATN would support standard-size advertisements both for branding reasons as well as physical reasons (door openings). Custom wraps would likely be necessary.

Memorandum
J:\S-F\210000\214704-00\4 INTERNAL PROJECT DATA\4-05 REPORTS & NARRATIVES\ADVERTISING REVENUE MEMO\POTENTIAL ADVERTISING REVENUE MEMO_V3.DOCX
Page 5 of 11Arup North America Ltd | F0.3 | July 2010
Revenue Benchmarks Currently, the Airport receives a minimum revenue guarantee of $4.2 million per year for 100 advertising
sites, or an average of $42,000 per site. Occupancy rate is currently 30%. That contract is due to expire in 2014 and has one 3-year option to extend the contract to 2017 (Airport, 2012). Airport staff states that the option is at the Airport’s discretion and if they exercise it, the amount of the minimum revenue guarantee will not change. (Airport, 2012).
In 2002, VTA advertising revenue was $4.2 million with a ridership of 57.3 million and 493 buses and light rail vehicles, equating to 7.3 cents per passenger trip or $8,519 per vehicle (TCRP).
In 2010, VTA advertising revenue was $1.67 million (VTA 2012) with a ridership of 41.9 million and 361 buses and 47 light rail vehicles (NTD 2012), equating to 4 cents per passenger trip and $4,100 per vehicle. Total operating expenses were $262.8 million (VTA 2012). Estimated operating expenses for 2012 are $295.3 million and advertising revenue of $1.65 million (VTA 2012).
In 2002, SamTrans advertising revenue was $2.1 million with a ridership of 18.1 million trips and 278 buses, equating to 11.6 cents per passenger trip or $7,550 per bus (TCRP).
In 2010, SamTrans advertising revenue was $1.54 million (SamTrans 2012) with a ridership of 14.4 million and 255 buses (NTD 2012), equating to 10.7 cents per passenger trip and $6,040 per bus. Motor bus operating expenses were $90.7 million (SamTrans 2012). Budgeted revenue in FY12 is $900,000; with the same ridership and service levels, revenue would be 6.3 cents per trip and $3,530 per bus. Budgeted operating expenses are $99.4 million (SamTrans 2012).
In 2010, AC Transit advertising revenue was $1.15 million (AC Transit 2012) with a ridership of 61.4 million and 532 buses (NTD 2012), equating to 1.9 cents per passenger trip and $2,160 per bus. Operating expenses were $322.5 million (AC Transit 2012). Budgeted advertising revenue for FY2011 through 2013 is $1.25 million; with the same ridership and service levels revenue would be 2 cents per passenger trip and $2,350 per bus. Operating expenses are forecast at $309.1 million (AC Transit 2012).
In FY2012, BART advertising revenue was budgeted at $7.1 million (BART 2012) with a ridership of 110.2 million (estimated) and 534 vehicles (BART 2012), equating to 6.4 cents per passenger trip and $13,300 per vehicle. Operating expenses are forecast at $506.9 million (BART 2012).
Note that due to survey methodology, all vehicle quantities are based on vehicles in peak use.
Advertising Revenue Estimates Assumptions for ATN System
Number of vehicles at peak use: 300
Passenger trips per year: 5,000,000
Annual operating cost: $10,000,000
Annual farebox revenue: $0
Stations: 8 small/satellite stations, 2 large stations
Based on ridership and fleet size, ATN would most likely be considered a small-medium agency within a top 20 media market.

Memorandum
J:\S-F\210000\214704-00\4 INTERNAL PROJECT DATA\4-05 REPORTS & NARRATIVES\ADVERTISING REVENUE MEMO\POTENTIAL ADVERTISING REVENUE MEMO_V3.DOCX
Page 6 of 11Arup North America Ltd | F0.3 | July 2010
Estimate – Advertising Revenue as a Percentage of Total Operating Funds
This estimating method compares total annual advertising revenue to the annual operating cost. Using sample ratios, the potential advertising revenues for ATN are calculated below.
Assuming operating funds of $10,000,000 per year, times:
0.4%: $40,000 (AC Transit, 2010 and 2012)
0.5%: $50,000 (VTA 2012)
0.6%: $60,000 (VTA 2010)
0.9%: $90,000 (SamTrans 2012)
1.4%: $140,000 (BART 2012)
1.5%: $150,000 (TCRP survey average in 2002)
1.7%: $170,000 (SamTrans 2010)
3.1%: $310,000 (Singapore MRT; Arup 2012)
3.2%: $320,000 (TCRP survey max in 2002)
5.0%: $500,000 (general rule of thumb for metros; observed in Brazil and elsewhere; Arup 2012)
6.2%: $620,000 (Hong Kong; Arup 2012)
Commentary: The percentage revenue in the Bay Area is generally low compared to some other data points, which may point toward a combination of high cost of providing transit service plus low advertising revenue.
Estimate – Percentage of Farebox Revenues
N/A. No farebox revenues to compare to.
Estimate – Advertising Revenue per Passenger Trip
This estimating method compares annual advertising revenue to the total annual unlinked passenger trips to yield revenue per trip. Using sampled revenue rates, the potential advertising revenues for ATN are calculated below.
Assuming 5,000,000 trips per year, times:
2.0 cents per trip: $100,000 (AC Transit 2011)
4.0 cents per trip: $200,000 (VTA 2010)
6.3 cents per trip: $315,000 (SamTrans 2012)
6.6 cents per trip: $330,000 (BART 2010)
10.7 cents per trip: $535,000 (SamTrans 2010)
Commentary: This metric is most applicable to large transit agencies; see TCRP Figure 12 where there is a strong correlation of large agencies to revenue per passenger trip. As a “small-medium agency within a top 20 media market,” ATN could command a price premium compared to the larger transit agencies because of the air traveler / business traveler demographic rather than a more generalized urban/suburban transit setting.

Memorandum
J:\S-F\210000\214704-00\4 INTERNAL PROJECT DATA\4-05 REPORTS & NARRATIVES\ADVERTISING REVENUE MEMO\POTENTIAL ADVERTISING REVENUE MEMO_V3.DOCX
Page 7 of 11Arup North America Ltd | F0.3 | July 2010
However, ATN has minimal exterior advertising visibility (limited geographic area; small vehicles; small size of advertisements; exclusive elevated guideway); it is easier to imagine advertising focused on the user inside the vehicle. In-vehicle advertising would be expected to add value because a screen is dedicated to a small captive audience.
Estimate – Advertising Revenue by Fleet Size
This estimating method compares annual advertising revenue to the number of vehicles in service during peak hours. Using sampled revenue per vehicle, the potential advertising revenues for ATN are calculated below.
Assuming 300 ATN vehicles, times:
$1,500 per vehicle: $450,000 (TCRP 2002, average of bus-only agencies in smaller media markets)
$2,350 per vehicle: $705,000 (AC Transit 2012)
$3,500 per vehicle: $1,050,000 (SamTrans 2012)
$4,100 per vehicle: $1,230,000 (VTA 2010)
$5,000 per vehicle: $1,500,000 (TCRP 2002, average of smaller agencies in top 20 media markets)
$6,040 per vehicle: $1,812,000 (SamTrans 2010)
Commentary: The applicability to ATN of value per vehicle is questionable, considering the vehicle size and visibility issues discussed previously. As a potential lower bound, the $1,500 per vehicle corresponds with TCRP Figure 13, which is applicable to smaller media markets (generally lower rates than the top 20 media markets). It is doubtful that the $5,000 per vehicle representing the “smaller agencies in top 20 media markets” and that is most applicable to ATN is still at this level now. Separately, the downward shift for SamTrans from 2010 to 2012 is remarkable.
Additionally, at this time, the assumption for number of ATN vehicles is still a major variable.
Illustration of Revenue by Advertisement Type
In contrast to the above estimating methods, this section illustrates a bottoms-up approach to building up a revenue estimate. It is based on number of vehicles, various media types that could be applied to vehicles and stations, an average occupancy rate, and an assumed revenue share; which frankly are all highly speculative at this time.
300 vehicles times 30% occupancy rate (SJC 2012) times 45% revenue share (median between 25% and 65% reported revenue share in TCRP):
2 x vehicle exterior king size advertisements at $630 per 4-week posting, discounted by 50% from 2002 levels: $292,680 (TCRP 2002), or
1 full-back size (equal to the size of the back of a bus) advertisement at $1,850 per 4-week posting, discounted by 50% from 2002 levels: $449,550 (TCRP 2002), and
1 in-vehicle electronic advertising display (no information available).
8 small stations times 30% occupancy rate times 45% revenue share:
2 Dioramas at $4,665 per month: $120,915 (SJC Clear Channel 2012)

Memorandum
J:\S-F\210000\214704-00\4 INTERNAL PROJECT DATA\4-05 REPORTS & NARRATIVES\ADVERTISING REVENUE MEMO\POTENTIAL ADVERTISING REVENUE MEMO_V3.DOCX
Page 8 of 11Arup North America Ltd | F0.3 | July 2010
2 large stations times 30% occupancy rate times 45% revenue share:
8 Dioramas at $4,665 per month: $120,915 (SJC Clear Channel 2012), and
2 Wall Spectaculars at $14,650 per month: $94,932 (SJC Clear Channel 2012)
Commentary: Small changes in any of the vehicle-level assumptions (number of vehicles, occupancy rate, number of advertisements per vehicle, price per advertisement, length of posting) or station-level assumptions, and assumed revenue share, can result in large swings in the total revenues.
Preliminary Conclusions
TCRP Synthesis 51 provides an excellent, though somewhat dated, reference to understand how advertising is managed in small and large transit agencies in small and big media markets throughout the United States. Given that only conventional transit agencies were surveyed, the applicability to ATN is questionable, particularly given the technological and systemic differences of ATN, plus the lack of information about more modern advertising technologies including in-vehicle electronic displays.
When information from TCRP Synthesis 51 is combined with more recent budget and operating data gleaned from local Bay Area transit agencies and the National Transit Database, some benchmarks begin to seem more credible, though they are still based on conventional transit.
We have attempted to identify and describe some of the differences between ATN and conventional transit as they relate to advertising. The various qualitative differences do not yet seem to point to a clear inclination upward or downward of expected advertising revenues compared to conventional transit.
The method of estimating advertising revenue as a percentage of total operating funds seems to produce the most conservative estimate, especially when compared to other Bay Area transit agencies. On this basis, an annual percentage of less than 2% would be comparable to Bay Area transit operators; up to 5% would seem comparable with international practice; and beyond 5% would seem unlikely unless the ATN has an extraordinary marketing cachet.
The method of estimating advertising revenue by passenger trip is also generally conservative when compared to other nearby Bay Area transit operators. The most favorable rate of 10.7 cents per trip could potentially be justified if recent data for in-vehicle electronic advertising revenues can be found.
The method of estimating advertising revenue by fleet size seems to yield generous results due to old TCRP data, one outlier of recent SamTrans revenue, and the fact that the ATN fleet is assumed to be very large. The qualitative differences do not provide clear direction on this. A middle-of-the-road estimate of $3,500 per vehicle yields a number that is twice as high as the other two methods described above.
The illustration by advertisement type lists different components that could be included in the ATN system, with rudimentary pricing based on the Airport rate card. This type of build-up is extremely speculative at this point and should only be considered credible when a number of assumptions can be relied upon and rates are developed specifically to reflect the unique characteristics of an ATN system.
Based on the methods described above, with deference to percentage of total operating funds and revenue per passenger trip, an advertising revenue of $500,000 per year seems to be reasonably supported. This estimate should be refined to reflect more ATN-specific characteristics if available in the future.

Memorandum
J:\S-F\210000\214704-00\4 INTERNAL PROJECT DATA\4-05 REPORTS & NARRATIVES\ADVERTISING REVENUE MEMO\POTENTIAL ADVERTISING REVENUE MEMO_V3.DOCX
Page 9 of 11Arup North America Ltd | F0.3 | July 2010
References
Transit Cooperative Research Program (TCRP) Synthesis 51: Transit Advertising Sales Agreements, 2004
2010 National Transit Database, for SamTrans, AC Transit, VTA
SamTrans FY2012 Adopted Operating Budget
VTA Adopted Biennial Budget, Fiscal Years 2012 and 2013
AC Transit Adopted Biennial Budget, Fiscal Years 2011-12 and 2012-13
Arup presentation on Singapore MRT, 2012
Inputs from Arup global staff, 2012
Inputs from Airport staff, 2012
Inputs from Clear Channel (Airport advertising sales contractor), 2012
Appendix
Copied below is Table 6 from TCRP Synthesis 51, Summary of Advertising Revenue in 2002. It is interesting to compare the potential ATN system to other transit agencies in terms of trips and vehicles in peak-hour service, by advertising market.

Memorandum
J:\S-F\210000\214704-00\4 INTERNAL PROJECT DATA\4-05 REPORTS & NARRATIVES\ADVERTISING REVENUE MEMO\POTENTIAL ADVERTISING REVENUE MEMO_V3.DOCX
Page 10 of 11Arup North America Ltd | F0.3 | July 2010

Memorandum
J:\S-F\210000\214704-00\4 INTERNAL PROJECT DATA\4-05 REPORTS & NARRATIVES\ADVERTISING REVENUE MEMO\POTENTIAL ADVERTISING REVENUE MEMO_V3.DOCX
Page 11 of 11Arup North America Ltd | F0.3 | July 2010