eye-tracking with webcam-based setups: implementation of a real
TRANSCRIPT

�����������
��������
�������� ���
Master in Computer Vision and Artificial Intelligence
Report of the Master Project
Option: Computer Vision
Eye-Tracking withWebcam-Based Setups:
Implementation of a Real-TimeSystem and an Analysis of
Factors Affecting Performance
Author: Onur FerhatAdvisor: Fernando Vilariño

Acknowledgements
I would like to thank first my supervisor Dr. Fernando Vilariño for his continuous trust,
support and supervision throughout the master year and final project. I am very grateful to all
friends who willingly participated in our experiments and shared their valuable time with us.
Also, I want to thank all my colleagues from Centre de Visió per Computador for the comfortable
working environment, their friendship and all their help during the last year. I appreciate very
much the help of Dr. Oleg Komogortsev who shared his valuable Neural Network Eye Tracker
software with us. Later on, I would like to thank my flat-mates Aslı, Jonatan and Hannah for
providing me with the warmth and calmness of a home which made this work possible. Lastly,
I send my gratitude to my family whose teachings and cultural heritage I feel deep inside and
whose support could not be blocked despite distances.
i

ABSTRACT
In the recent years commercial eye-tracking hardware has become more common, with the introduc-tion of new models from several brands that have better performance and easier setup procedures. Acause and at the same time a result of this phenomenon is the popularity of eye-tracking research directedat marketing, accessibility and usability, among others. One problem with these hardware componentsis scalability, because both the price and the necessary expertise to operate them makes it practicallyimpossible in the large scale. In this work, we analyze the feasibility of a software eye-tracking sys-tem based on a single, ordinary webcam. Our aim is to discover the limits of such a system and to seewhether it provides acceptable performances. The significance of this setup is that it is the most commonsetup found in consumer environments, off-the-shelf electronic devices such as laptops, mobile phonesand tablet computers. As no special equipment such as infrared lights, mirrors or zoom lenses are used;setting up and calibrating the system is easier compared to other approaches using these components.Our work is based on the open source application Opengazer, which provides a good starting point forour contributions. We propose several improvements in order to push the system’s performance furtherand make it feasible as a robust, real-time device. Then we carry out an elaborate experiment involving18 human subjects and 4 different system setups. Finally, we give an analysis of the results and discussthe effects of setup changes, subject differences and modifications in the software.
Keywords: Computer vision, eye-tracking, gaussian process, feature selection, optical flow
ii

Contents
1 Introduction 11.1 Brief information on human visual system . . . . . . . . . . . . . . . . . . . . . . . . . . . 21.2 Current implementations of eye-trackers . . . . . . . . . . . . . . . . . . . . . . . . . . . . 3
2 An Eye-Tracking System for a Single Webcam Setup 62.1 Hardware baseline . . . . . . . . . . . . . . . . . . . . . . . . . . . . . . . . . . . . . . . . 72.2 Software architecture . . . . . . . . . . . . . . . . . . . . . . . . . . . . . . . . . . . . . . . 8
3 Implementation Details of the Eye-Tracking System 103.1 Search for a suitable camera . . . . . . . . . . . . . . . . . . . . . . . . . . . . . . . . . . . 103.2 Improvements in the components . . . . . . . . . . . . . . . . . . . . . . . . . . . . . . . . 11
3.2.1 Point selection . . . . . . . . . . . . . . . . . . . . . . . . . . . . . . . . . . . . . . 113.2.2 Point tracking . . . . . . . . . . . . . . . . . . . . . . . . . . . . . . . . . . . . . . 153.2.3 Eye image extraction . . . . . . . . . . . . . . . . . . . . . . . . . . . . . . . . . . . 163.2.4 Blink detection . . . . . . . . . . . . . . . . . . . . . . . . . . . . . . . . . . . . . . 163.2.5 Calibration . . . . . . . . . . . . . . . . . . . . . . . . . . . . . . . . . . . . . . . . 163.2.6 Gaze estimation . . . . . . . . . . . . . . . . . . . . . . . . . . . . . . . . . . . . . 19
4 Experimental Setup 204.1 Setup of the experiment environment . . . . . . . . . . . . . . . . . . . . . . . . . . . . . . 204.2 Building a complete experiment suite . . . . . . . . . . . . . . . . . . . . . . . . . . . . . . 224.3 Error calculation methodology . . . . . . . . . . . . . . . . . . . . . . . . . . . . . . . . . 22
5 Results 245.1 Effects of implemented modifications . . . . . . . . . . . . . . . . . . . . . . . . . . . . . . 245.2 Comparison of experimental setups . . . . . . . . . . . . . . . . . . . . . . . . . . . . . . . 275.3 Error distributions . . . . . . . . . . . . . . . . . . . . . . . . . . . . . . . . . . . . . . . . 275.4 Inter-subject variances . . . . . . . . . . . . . . . . . . . . . . . . . . . . . . . . . . . . . . 285.5 Qualitative analysis . . . . . . . . . . . . . . . . . . . . . . . . . . . . . . . . . . . . . . . 30
iii

iv
6 Discussion 31
7 Conclusions 33
A Building Steps of an Infrared Camera 37
B Information for Subjects Document 38
C Subject Information and Conditions Document 40
D Experiment Description Document 42

Chapter 1
Introduction
From a computer scientist’s aspect, human beings are machines which receive input from their sensorssuch as ears, eyes, skin and which interact with the world they live in through their actuators, which aretheir hands, feet, and so on. Therefore, as in the case of robots, one can understand the basis of theirreasoning by inspecting the input they receive and also how they direct the attention of their sensors,for instance by looking at specific locations or inspecting unknown objects by touching or smelling.
Eye-tracking studies build upon this insight and analyze the relation between the movements of aperson’s eyes and their attention, reasoning and feelings. These studies make use of special equipmentcalled eye-trackers, which either calculate the direction of a person’s gaze [1] or a point in the surroundingarea where the gaze is fixed at. This point may be located on a 2D plane [2] (i.e. the display of anelectronic device) or a 3D volume [3] and is also called the point of regard (PoR) [4]. There existseveral commercial models of eye-trackers [5, 6] which come with their software platforms to carry outeye-tracking research, also expertise for calibration and actual usage is provided through documentationand support.
Although the commercial components provide satisfactory performance for marketing or scientificresearch, the scalability of this methodology is problematic because these products require trained opera-tors and their price (starting from several thousands of Euros) makes them not suitable for this purpose.Therefore, the availability of a cheap, easy to setup alternative which does not require special hardwareand which provides comparable performance is a necessity.
Building this alternative constitutes the problem we address in this work, and it consists of un-derstanding where a subject is looking at using cheap components such as light sources, cameras and acomputer to run the eye-tracker software. Actually, these requirements are already met in many consumerelectronic devices such as laptops, smart-phones, tablet computers. We believe that the availability ofa system running on these machines will provide basis for a variety of applications. For example, theeye-tracker can be used as a new input method for the electronic device just like a mouse [7, 8], or itcan be used as a tool to enable remote marketing and usability research [9, 10]. The system can replace
1

CHAPTER 1. INTRODUCTION 2
commercial eye-tracking equipment to the extent allowed by its performance, and it can enable mobileapplications of these techniques. The uses of such a system is only limited by the imagination of softwaredevelopers, who will surely come up with many usage areas that we don’t discuss here in order not toget off our topic.
1.1 Brief information on human visual system
In order to be able to understand the methodologies behind eye-trackers, one should be familiarwith the human visual system (HVS), in particular with the human eye. Figure 1.1 shows the parts ofthe eye which are of interest for eye-trackers. The white part of the eye which is seen from outside iscalled sclera, and in the front part of the eye there exists cornea which is a transparent layer. Cornealets the light inside of the eye, which passes through an opening called pupil. Around pupil, we find theiris which is the colored part of the eye as seen from outside. Iris controls the amount of light whichpasses through pupil, and in a sense acts like the diaphragm of a camera. The light that enters the eyeis refracted by the eye lens, and then it falls onto the retina layer which covers the inner surface of theeyeball, forming the image of what is seen through the eyes. Here lies the fovea, which is the area whereeye’s light sensing cells are accumulated in huge numbers. The part of the image that corresponds to thisarea is special, in the sense that the human visual attention is mostly directed here [11]. In the figure,two axes are shown: the optical axis passes through the eyeball center (E) and the pupil center, whereasthe visual axis passes through the fovea and a special point called corneal center (C). This difference iscaused by the fact that fovea does not lie on the optical axis.
Figure 1.1: Structure of the human eye
Two other points important for software implementations of eye-trackers are the eye corners. Theseare the extreme points of sclera that are visible from the outside. As the iris and pupil change locationdue to the rotation of the eye, the corner points become important for the software because they aremostly stable and help understand the relative movement of the eyeball.
CHAPTER 1. INTRODUCTION 3
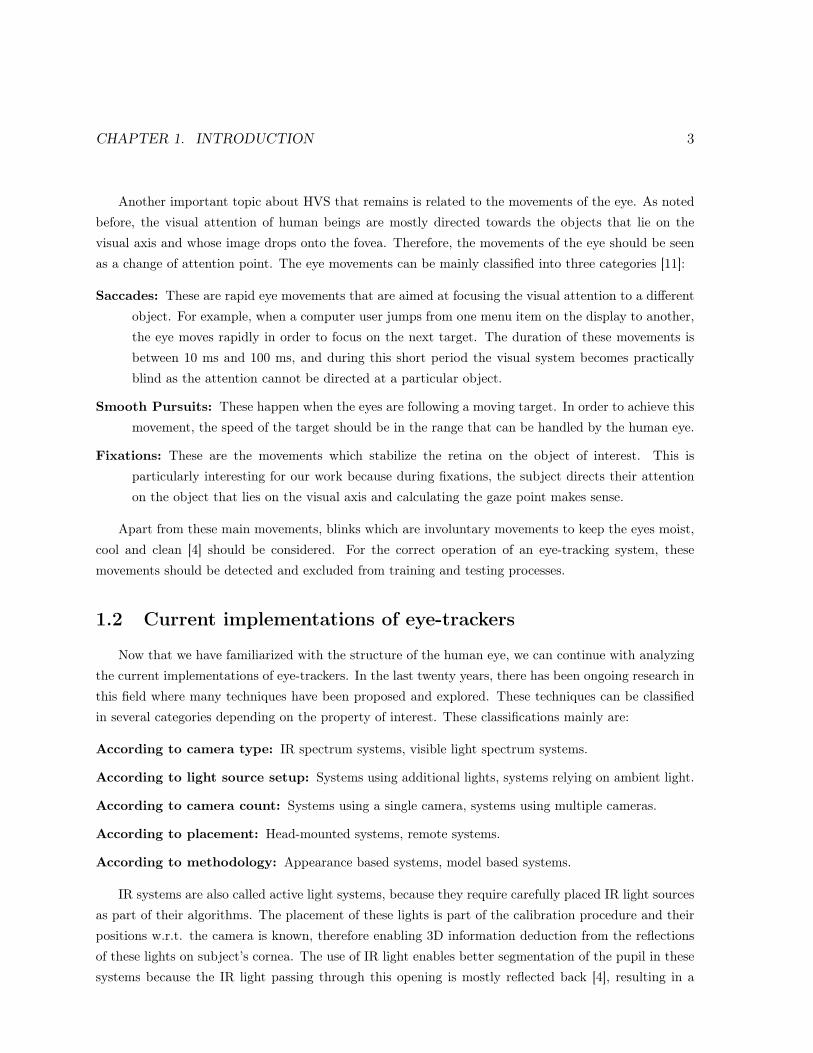
Another important topic about HVS that remains is related to the movements of the eye. As notedbefore, the visual attention of human beings are mostly directed towards the objects that lie on thevisual axis and whose image drops onto the fovea. Therefore, the movements of the eye should be seenas a change of attention point. The eye movements can be mainly classified into three categories [11]:
Saccades: These are rapid eye movements that are aimed at focusing the visual attention to a differentobject. For example, when a computer user jumps from one menu item on the display to another,the eye moves rapidly in order to focus on the next target. The duration of these movements isbetween 10 ms and 100 ms, and during this short period the visual system becomes practicallyblind as the attention cannot be directed at a particular object.
Smooth Pursuits: These happen when the eyes are following a moving target. In order to achieve thismovement, the speed of the target should be in the range that can be handled by the human eye.
Fixations: These are the movements which stabilize the retina on the object of interest. This isparticularly interesting for our work because during fixations, the subject directs their attentionon the object that lies on the visual axis and calculating the gaze point makes sense.
Apart from these main movements, blinks which are involuntary movements to keep the eyes moist,cool and clean [4] should be considered. For the correct operation of an eye-tracking system, thesemovements should be detected and excluded from training and testing processes.
1.2 Current implementations of eye-trackers
Now that we have familiarized with the structure of the human eye, we can continue with analyzingthe current implementations of eye-trackers. In the last twenty years, there has been ongoing research inthis field where many techniques have been proposed and explored. These techniques can be classifiedin several categories depending on the property of interest. These classifications mainly are:
According to camera type: IR spectrum systems, visible light spectrum systems.
According to light source setup: Systems using additional lights, systems relying on ambient light.
According to camera count: Systems using a single camera, systems using multiple cameras.
According to placement: Head-mounted systems, remote systems.
According to methodology: Appearance based systems, model based systems.
IR systems are also called active light systems, because they require carefully placed IR light sourcesas part of their algorithms. The placement of these lights is part of the calibration procedure and theirpositions w.r.t. the camera is known, therefore enabling 3D information deduction from the reflectionsof these lights on subject’s cornea. The use of IR light enables better segmentation of the pupil in thesesystems because the IR light passing through this opening is mostly reflected back [4], resulting in a

CHAPTER 1. INTRODUCTION 4
large intensity difference. The light wavelength used in IR setups can be captured in many commercialcameras, although some modifications in the hardware might be necessary. As this work focuses onvisible light spectrum systems, we leave out a more detailed overview of IR methods, and a good surveyincluding these methods can be found from Hansen and Ji [4].
Visible light methods are also called passive light methods, because it is not feasible to use additionallight sources in these setups. Such a setup would discomfort the subjects and cause the pupil of theireyes to shrink. However, lamps that are used to increase the ambient light should not be considered asa light source, as they are not used actively as part of the algorithm. The methods referenced below areexamples to visible light methods unless stated otherwise.
Often, multiple cameras are used in order to have 3D information about tracked feature points[12, 13]. In some cases, extra cameras may be used for different purposes such as head-pose estimation[14]. At this point, it should also be noted that some applications also make use of zoom-in cameras[14] and mirrors in their setups, in order to direct the camera onto the area of interest (e.g. tracking thesubject’s head or eyes). These techniques require extra calculations in order to make up for the use ofthese equipments and techniques.
Another classification criteria for eye-trackers is the type of placement that is employed in thebuilding phase. There exist systems that are placed on top of the subject’s head with a head band orwhich are placed inside of eyeglasses. However, as this equipment is sometimes heavy and may causediscomfort on the side of the subject, remote systems pose an alternative. These systems may either bebuilt into special monitors or they may be separate components that are placed near the monitor.
According to the techniques used in the software, we can classify the methods as appearance basedsystems and model based systems. In model based systems, the aim is to fit a 2D or 3D model ontothe eyes or face of the subject, and then calculate the gaze point making use of these models. In someworks, the iris boundaries are modeled as circles in 3D space and after the model is fitted, the normalvectors passing through the center of these circles are used to calculate gaze direction [14, 1]. In suchmethods, a zoom-in camera can be used to achieve a higher quality image of the eyes and thus, a betterperformance [14]. These types of techniques are also called ellipse algorithms, because the projectionof circles on the image are ellipses and the algorithms may fit an ellipse on the iris boundaries in theimage, then calculate the 3D positions from these projected ellipses. In these techniques, focal length ofthe camera should be known for the calculations of back projection.
Other model based techniques involve fitting a known 2D or 3D mesh structure onto subject’s face.In one implementation, a generic 3D face model consisting of 7 points (four for eye corners, two for nosetips and one for the corneal center of an eye) is fitted on the image and the gaze direction is computedas the vector connecting the corneal center and the pupil center [2]. In more flexible methods, a uniqueface model is calculated for the subject by asking them to move their head around for a while [15]. Thereexists a method involving flexible 3D face models called Active Appearance Models (AAMs) [16], whichmodel the whole face and allow linear shape changes [17].

CHAPTER 1. INTRODUCTION 5
On the other hand, appearance based models focus on the goal of determining the gaze point, withoutcalculating any models for eye or face features. One technique starts with detecting the face, eyes andiris boundaries, and the image region around the iris is fed to a neural network to map the image tothe point of regard [18]. In an open source alternative, the eye region image is mapped to the gazepoint through the use of Gaussian process interpolation [19]. There are also earlier records of the use ofneural network interpolation for this purpose [20]. It should be noted that these methods’ performancegenerally decreases when there is a change in head pose. However, when the assumption of fixed headpose holds, these methods give comparably better results.
We have described the problem and discussed the existing approaches to solve it. In Chapter 2 wecontinue with the approach we propose in this work. Chapter 3 dives into the detail of our work andChapter 4 proposes a setup to experimentally test the performance of this system. Chapter 5 providesthe results of these experiments, followed by a discussion in Chapter 6. Lastly, we will conclude withfinal remarks and point out directions for future research in this area.

Chapter 2
An Eye-Tracking System for a Single
Webcam Setup
We have seen several approaches which differ in the equipment and operation conditions they require,their performance and usage areas. Now, we are presenting an overview of the system that we try tobuild in this work and our motivations for making these decisions among others possibilities.
Most state-of-the-art examples use infrared (IR) methods where the subject’s face is actively illumi-nated with IR light sources. These systems provide great performance values and this methodology isalso almost exclusively used in the commercial eye-tracker models. However, our aim in this work is topresent a system which works in common setups, without requiring hardware such as IR lights and IRcameras that are not easily found in consumer environments. Therefore we have constrained ourselvesin the visible light methodologies in the rest of our work.
Another important feature that we wanted to have in our system is the ease of setup. Althoughthe commercial models have become more and more user-friendly, easy to setup recently, they stillrequire certain expertise and training in order to get up and running. Moreover, they have their owndevelopment environments which may make it harder to integrate into custom software applications.Considering the non-commercial IR eye-trackers which are results of ongoing research, we see that theseare generally hard to setup because the placement of the light sources requires expertise and there is aspecial calibration procedure before starting the actual usage.
In order to have an idea about the current situation of open source eye-tracker implementations, wecarried out a state-of-the-art research of these tools. The three applications that we have found are:
Opengazer: It is based on OpenCV [21] and written in C++ language. Supports Linux and Mac OS Xoperating systems. Has been developed by a research group at the University of Cambridge;however, is lastly updated three years ago. Uses a setup consisting of one webcam and has theinfrastructure to communicate the results to other client applications [19].
6

CHAPTER 2. AN EYE-TRACKING SYSTEM FOR A SINGLE WEBCAM SETUP 7
ITU Gaze Tracker: Based on .NET Framework and written in C# language, this software is stilldeveloped by a research group from IT University of Copenhagen. Uses IR cameras and providesa user-friendly interface to setup the system. Also provides the infrastructure to send the gazeestimation results to other programs [22].
TrackEye: Based on .NET Framework and OpenCV, it is developed as a personal project and publishedon the Internet. It is not under development and calculates only the angular gaze direction, butnot the gaze point [23].
2.1 Hardware baseline
As a result of our priorities and analysis of the state-of-the-art in free eye-tracker software tools, wehave decided on the following setup as the required hardware baseline for our system:
A regular webcam: With the increased availability of broadband Internet and popularity of onlinevideo communication tools, webcams have become a standard component of home computer se-tups. Moreover, high Internet speeds enabled the use of cameras with higher resolutions and betterimage qualities. Modern video chat applications and cameras support high-definition (HD) imageswith resolutions up to 1920×1080 pixels. Two other types of consumer electronic device that havegained popularity in the recent years are smart-phones and tablet computers. These gadgets oftencontain a built-in camera facing the user, which is intended for 3G video calls. Although theymight not always come with HD capabilities, we believe they still provide the necessary baselineto feed the system we propose. This baseline is defined by resolutions of 1280×720 and 640×480,which are the resolutions of iPad FaceTime camera and the common VGA cameras, respectively.We consider the differences in the camera placements and camera qualities of these equipments,therefore the effects of these variances will be analyzed in the coming chapters.
No special lighting: As we aim at working with visible spectrum cameras, usage of light sources iscompletely out of question. However, we make the assumption that the testing environment iswell-lit so that the camera can provide an acceptable image quality at an acceptable frame rate(≥ 10 fps).
A display: The display is unquestionably another compulsory component of these systems. Duringour experiments, we have placed the display at known distances away from the subject’s face,however in real world situations the distance is only limited by the camera’s point-of-view. In oursetup we only make two assumptions about this: that subject’s face is completely included in thecamera image and that it covers around half of the camera image vertically. This is the minimumconstraint of environment we have assumed in our setup.

CHAPTER 2. AN EYE-TRACKING SYSTEM FOR A SINGLE WEBCAM SETUP 8
2.2 Software architecture
After stating our assumptions about the required hardware setup, we continue with describing thegeneral architecture of the proposed system.
Among the open source eye-tracker software that we analyzed, Opengazer stood out as the systemthat mostly meets the requirements in a baseline. Although the codebase is not well-commented, itsmodular and simple structure enables building additional work upon the existing system. It has thefeature of transmitting the estimated gaze points through network, which enables accessing these resultsfrom other programs without dealing with application’s codes. It requires a manual calibration procedureand it does not handle head pose variations, which constitute its main flaws.
Table 2.1 shows the components of the Opengazer application that we take as basis for our work.We describe the original components and the improvements we propose to make in this work. In the lastcolumn, our motivations for implementing these changes are briefly explained. With these improvementswe believe that the proposed eye-tracking system can provide acceptable performance values and as aresult, many usage areas will arise such as mobile applications of eye-trackers and remote eye-trackingresearch with decreased cost.

CHAPTER 2. AN EYE-TRACKING SYSTEM FOR A SINGLE WEBCAM SETUP 9
Component Original Opengazer Proposed Improvements JustificationPointSelection:
-Manual selection offeature points
-Automatic selection ofpoints
Initialization of the systemshould be easier and indepen-dent of the operator.
PointTracking:
-Combination ofoptical flow (OF)and head pose basedestimation
-A different combi-nation which can re-cover from mistrackings-Apply a median filterbefore OF
The system’s recovery after amistracking should be improved.
Eye ImageExtraction:
-Extract the image of asingle eye
-Extract the image ofboth eyes
Second operation does notrequire much computationalpower and enables us to have asecond estimator.
BlinkDetection:
-A non-working detec-tor
-Get the detector running Blink detector is a crucial partof the system.
Calibration: -Calculate averagegrayscale eye imagesfor each target pointand train a Gaus-sian process (GP)interpolator
-Do not include blinkingframes in average images-Calculate and remove thecalibration errors causedby GP training
Blinking frames during trainingare considered noise and shouldbe removed. GP training errorscause shifts in estimations dur-ing the testing phase.
GazeEstimation:
-GP estimator-Calculate estimate fora single eye
-Calculate esti-mates for both eyes-Implement a neuralnetwork (NN) estimator
Average of both estimates willperform better. NN estimatorsare shown to have good perfor-mances [18].
Table 2.1: Components and methodology of original Opengazer application, shown side-by-sidewith the proposed improvements and the justifications of these choices.

Chapter 3
Implementation Details of the
Eye-Tracking System
In this chapter, we describe in detail the work we have done for this thesis. We start from the firststep of choosing suitable cameras for use in our systems, then, we continue with the improvements madein each component of the proposed system.
3.1 Search for a suitable camera
In order to find a suitable camera for our needs (high frame rate, high resolution, good image quality)we have tested several cameras: Logitech c615 (1080p), Logitech . . . (720p), Microsoft HD-3000 (720p)and several other cheaper models (from brands such as Trust, NIUM, Hercules) 1. We have seen thatwith the more expensive models we can get good HD quality images at acceptable frame rates (≥ 10
fps). The c615 model contained some flickering effect in the live preview, whereas the lower 720p modeldid not have this defect. However, we have seen that in better lighting conditions (ground floor of CVC)this effect is not perceived in a relevant way.
The UVC specification is a communication standard which regulates the control of webcams in avariety of operating systems such as Linux, Windows and Mac OS X. Linux contains the required driversfor controlling cameras which support this framework.
As we want to have full control of the camera so that we can change the frame rate and imageresolution, or remove the automatic adjustments made on the image before serving it to the clientapplication, we analyzed the necessary tools that enable us to use control our cameras to the limits.These applications are:
1Furthermore, we tried to convert a regular webcam into an IR camera. The details of this experiments areexplained in Appendix A.
10

CHAPTER 3. IMPLEMENTATION DETAILS OF THE EYE-TRACKING SYSTEM 11
guvcview: It allows changing the parameters of the camera via a GUI, where the image format, framerate, resolution, automatic image normalizations (white balance, etc.) can be specified. Also itacts as a photo taking or video recording application.
v4l2: This command line application can be used to determine which features a UVC compatible camerasupports and to change the supported settings. Some features which cannot be changed using theguvcview application (e.g. auto-exposure) can be changed in this program, thus allowing evenfurther control over the camera.
Using these programs, we could compare the frame rates and extra features of the cameras we hadprovided for this study. Moreover, we analyzed the effects of different image formats of webcams on theframe rate. We observed that although the frame rate can be set manually, high frame rates cannot beset or achieved when using image formats with low compression. Using these tools, we could unlock asetting in Logitech c615 camera related to exposure and it allowed us to select from a larger range ofexposure values.
After the comparison of the cameras using these tools, we chose the Logitech c615 camera as thecomponent of our system as it provided good frame rates and has a sensor with higher resolutioncapabilities. We identified 1280 × 720 and 640 × 480 as the baseline resolutions that we are going tocompare in the experiments, therefore the camera will support a higher frame rate compared to the fullresolution case.
3.2 Improvements in the components
3.2.1 Point selection
In the original Opengazer application, a set of feature points including the outer eye corners and atleast two other facial feature points should be selected by the user as part of the initialization routine. Asthis constitutes an inconvenience on the side of the user, and as it poses problems for the experimentalsetup that is described in the next chapter, we propose an automatic point selection method as ourcontribution which is described below.
As seen in Figure 3.1(d), we decided that 8 points are needed to be selected during initialization.In choosing these points, we considered how easily they can be selected in an automatic way and howstably they can be tracked over time. The first condition is related to the tools for feature detection.Regarding the condition of stability, we argue that stable points decrease the mistracking and thus havea direct effect on the overall performance of the system.
The first two points that are essential for our system are the outer eye corners. The system uses thesepoints to locate the image region containing the eyes, with the help of geometrical constraints of the facewhich will be explained below. The rest of the points are used to obtain 3D pose information of the faceand to correct the tracking estimations in case some points are lost during tracking. Therefore, a highernumber of well-tracked feature points is expected to improve the tracking performance. We chose the

CHAPTER 3. IMPLEMENTATION DETAILS OF THE EYE-TRACKING SYSTEM 12
two inner eyebrow corners, the two nose tips and the two mouth corner points as the remaining 6 points.These points are good candidates because there is more texture in these areas of the face compared toother parts (i.e. cheeks, forehead) and also they are not occluded at times like the ears.
The list of steps to select the feature points is as follows (see Figure 3.1). The methods used in eachstep will be explained afterwards.
Step 1: As shown in Figure 3.1(a), the system first locates the region containing both of the eyes. Theresult is the green rectangular area.
Step 2: Then the region containing single eyes are found in the right and left halves of the greenrectangle. The results are the blue rectangles inside the green rectangle.
Step 3: Finally, the outer side center points of these single eye regions are selected as the eye cornerpoints (red dots).
Step 4: In order to locate the nose, a square region starting from the eye corners’ level and expandingtowards the lower part of the face is selected as the search area (green square, second image).The length of the sides of this square is determined by the distance between two eye corner pointsselected before.
Step 5: Nose detector is then run (blue rectangle) and nose tips are selected using geometrical con-straints (red dots).
Step 6: In order to locate the mouth, a rectangular region starting from the extracted nose points’ leveland expanding down is selected as the search area for the mouth (green rectangle). This region’swidth is equal to the distance between the extracted eye corners, and the height is half of thisvalue.
Step 7: Next, a mouth detector is run (blue rectangle) and mouth corners are selected by geometricalconstraints (red dots).
Step 8: Eyebrow corners are selected in the same manner as nose tips and eye corners. This time, arectangular search area above the extracted eye corners is considered. The width of this area isequal to the distance between the extracted eye corners, and the height is one third of this value.In this case there is not a Haar cascade detector that works well, therefore we use corner pointselection method to choose the most important two corner points.
Here, point selection using geometrical constraints refers to a technique where the points are assumedto be located at a certain coordinate in the searched area. For example, mouth tips are assumed to belocated on the central horizontal line of the detected mouth rectangle. The detectors used to locate theregion containing two eyes, individual eyes, nose and mouth make use of Haar cascades [24, 25] and arebased on OpenCV [21].
This initial methodology does not work perfectly, because it is limited by the performance of itscomponent detectors. For instance, the single eye detector does not perform very well and causes the

CHAPTER 3. IMPLEMENTATION DETAILS OF THE EYE-TRACKING SYSTEM 13
(a) Eye corners (b) Nose tips (c) Mouth corners (d) Eyebrow corners
Figure 3.1: Sequence of control point selection
system to halt the selection process at this point. Therefore, we have analyzed other methods to replacethis module. The state-of-the-art methods for eye corner detection that we have encountered can begrouped in four categories:
Template matching methods: An eye corner image template is prepared and this is matched to theeye region image using correlation. However, it is argued that this is not accurate all the time [26].A variation which includes using deformable templates is proposed, however tuning the parametersis reported to be problematic.
Variance projection methods: Methods involving calculation of variance projections (the intensityvariance of horizontal and vertical pixels around an interest point) are also proposed [26]. Thisvariance feature is combined with Harris response for the pixels in order to weigh the effects ofpixels accordingly.
Semantic feature based methods: Another method is based on detecting corners using Harris andthen choosing the best corners using semantic features [27]. In order to choose among the candi-dates, lines are fitted for the eyelids in each candidate, then other discriminative features whichcapture the intensity difference between eyelids-sclera and sclera-iris are calculated w.r.t. the fittedlines.
Other types of semantic features have been proposed to make the choice among the candidates[28]. These features include ratio of other candidates below and above the analyzed candidate,the distance of the analyzed candidate to the intersection point of the curves fitted to the eyelidsand so on. This method is shown to perform better than template matching algorithms and itshows more invariance to rotation and focus.
Active appearance models: A generalized appearance model is created for eyes or whole face, then

CHAPTER 3. IMPLEMENTATION DETAILS OF THE EYE-TRACKING SYSTEM 14
Figure 3.2: Selection of the left and right eye corner points using geometrical heuristics afterHarris corner detection
this is deformed to fit the current image. The model contains a representation of the shape(vertices and edges) and the gray level appearance [16].
These state-of-the-art methods are results of work which pushes the limits to locate the eye cornersas accurate as possible. Therefore, because of the complexity of the methods they are left out of scope ofthis work. Instead, we propose a few simpler methods based on Harris corner detectors [29] which workwell for our purpose. It should also be noted that in our case, we do not necessarily need the localizationof the exact eye corner because this point is easily mistracked during blinks and other situations. Thepoint that is expected to work better for our system is a little further away from the eyes. The systemallows this point to have a small vertical offset because it does not matter for the eye image extractionvery much.
Corner selection based on eye center points
In this method, the same image region containing both of the eyes is processed and Harris cornersare detected as shown in Figure 3.2. At this point, the algorithm separates the points into two groups,according to which half of the image they are located at. The coordinates of the ones in the left part ofthe image are averaged to calculate the left eye center point, and the right center point is calculated fromthe remaining ones (blue points). Then, a geometrical calculation is employed and eye corner pointsare selected on the line that passes through these two center points (green points). In this calculation,first the distance between the two eye centers is calculated (d) and the points that are located d/3 awayfrom the eye centers are chosen as the corner points. Here, the ratio of 1/3 is used in both vertical andhorizontal coordinate calculations.
We implemented this method after validating that simpler methods such as choosing one of thepoints resulting from Harris corner detection does not perform very well.
CHAPTER 3. IMPLEMENTATION DETAILS OF THE EYE-TRACKING SYSTEM 15
3.2.2 Point tracking
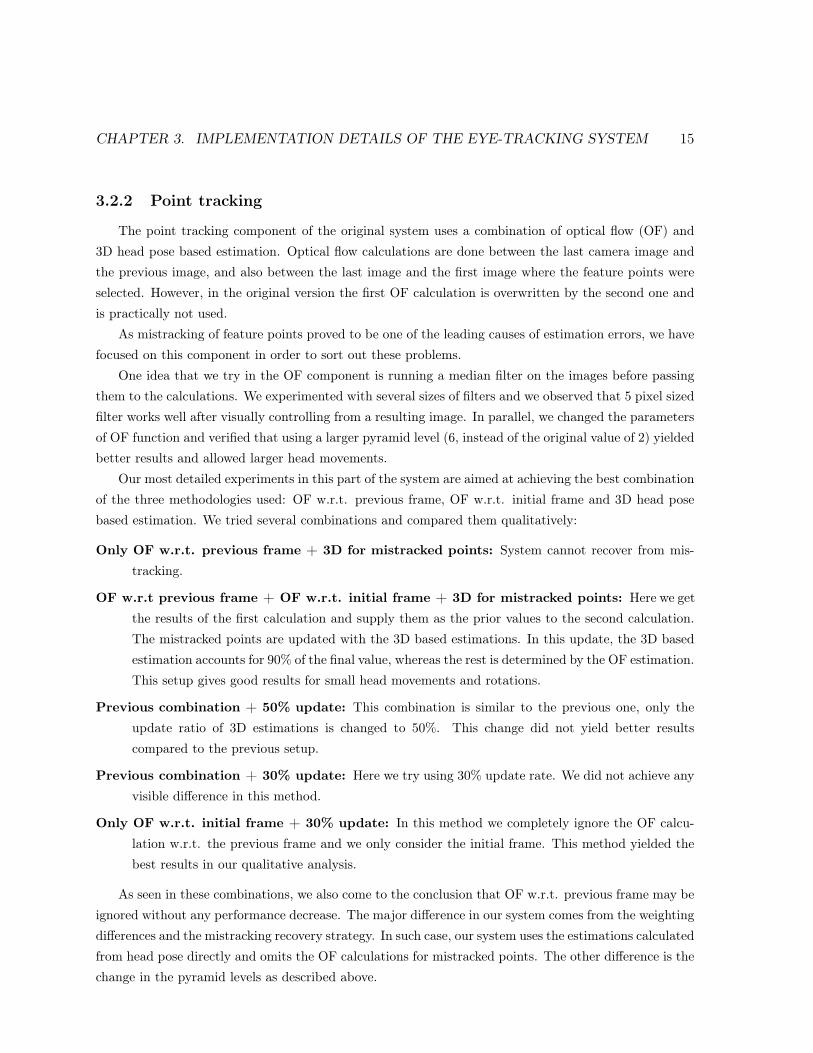
The point tracking component of the original system uses a combination of optical flow (OF) and3D head pose based estimation. Optical flow calculations are done between the last camera image andthe previous image, and also between the last image and the first image where the feature points wereselected. However, in the original version the first OF calculation is overwritten by the second one andis practically not used.
As mistracking of feature points proved to be one of the leading causes of estimation errors, we havefocused on this component in order to sort out these problems.
One idea that we try in the OF component is running a median filter on the images before passingthem to the calculations. We experimented with several sizes of filters and we observed that 5 pixel sizedfilter works well after visually controlling from a resulting image. In parallel, we changed the parametersof OF function and verified that using a larger pyramid level (6, instead of the original value of 2) yieldedbetter results and allowed larger head movements.
Our most detailed experiments in this part of the system are aimed at achieving the best combinationof the three methodologies used: OF w.r.t. previous frame, OF w.r.t. initial frame and 3D head posebased estimation. We tried several combinations and compared them qualitatively:
Only OF w.r.t. previous frame + 3D for mistracked points: System cannot recover from mis-tracking.
OF w.r.t previous frame + OF w.r.t. initial frame + 3D for mistracked points: Here we getthe results of the first calculation and supply them as the prior values to the second calculation.The mistracked points are updated with the 3D based estimations. In this update, the 3D basedestimation accounts for 90% of the final value, whereas the rest is determined by the OF estimation.This setup gives good results for small head movements and rotations.
Previous combination + 50% update: This combination is similar to the previous one, only theupdate ratio of 3D estimations is changed to 50%. This change did not yield better resultscompared to the previous setup.
Previous combination + 30% update: Here we try using 30% update rate. We did not achieve anyvisible difference in this method.
Only OF w.r.t. initial frame + 30% update: In this method we completely ignore the OF calcu-lation w.r.t. the previous frame and we only consider the initial frame. This method yielded thebest results in our qualitative analysis.
As seen in these combinations, we also come to the conclusion that OF w.r.t. previous frame may beignored without any performance decrease. The major difference in our system comes from the weightingdifferences and the mistracking recovery strategy. In such case, our system uses the estimations calculatedfrom head pose directly and omits the OF calculations for mistracked points. The other difference is thechange in the pyramid levels as described above.

CHAPTER 3. IMPLEMENTATION DETAILS OF THE EYE-TRACKING SYSTEM 16
3.2.3 Eye image extraction
Originally, Opengazer tracks the outer corners of both eyes, however only a single eye is used forthe gaze estimation. We tested using the second eye just like the other eye to come up with anotherestimation in order to decrease the uncertainty of the final estimation.
We applied the same method for single eye extraction and only modified it to extract the regionwhich contains the second eye. The resulting image is processed to train and use another gaze pointestimator using the method explained below.
3.2.4 Blink detection
Opengazer program that we chose as our base system is an open project, therefore it contains severalparts which are in draft version and not completed for use in the final version. The blink detector is anunfinished component and as we consider it a crucial part of our system, we continue with analyzing itand making the necessary modifications to get it running.
The blink detector is designed as a state machine with states representing the initial state, blinkingstate and double blinking state. The system switches between these states depending on the changesin eye images that are extracted as described in the previous section. These changes are obtained bycalculating the L2 norm between the eye images in consecutive frames. When the difference thresholdfor switching states is exceeded during several frames, the state machine switches to the next state andthe blink is detected. However, as noted above, this method was left in a draft version and requiredadditional work.
We built on this structure and completed the rules for the state switching mechanism. Moreover, weobserved that a state reset rule is required so that whenever the threshold criteria is not met at a certainframe, the system is reset to the initial state. We implemented this improvement in the final version.
3.2.5 Calibration
The calibrator component of our system works by displaying markers on several locations on thescreen until 20 frames can be captured from the camera and then training the estimator componentusing the eye images extracted during this time period. For each marker location, these correspondingeye images obtained from several frames are averaged to create a single grayscale image. This imagerepresents the average appearance of the eye while the marker was displayed. Lastly, a Gaussian processbased gaze estimator is trained using the supplied grayscale average images and the correspondingpositions on the screen.
We propose several improvements in the calibrator component in order to increase the gaze estimationperformance during testing. These contributions are:
1. Fix a small problem in the display of markers
2. Exclude the blinking frames from calibration

CHAPTER 3. IMPLEMENTATION DETAILS OF THE EYE-TRACKING SYSTEM 17
3. Apply a drift correction algorithm to correct the errors introduced by calibration
The first improvement is related to a minor defect that we encountered in the Opengazer application.We observed that the pointer which is shown on the display during calibration and testing is shown inthe wrong coordinates on the display. This is because the coordinates of the top-left corner are used insetting the location of the window on display. In the correct case, as the subject directly looks at thewindow’s center point, the images of user’s eyes should be mapped to this point’s coordinates. For testingpurposes, this does not pose a huge problem because the same problem exists in the gaze estimationcomponent and they cancel each other. However, when another program uses the estimate of Opengazer,the resulting coordinates will include a small shift which is half the height of the window vertically andhalf the width of the window horizontally. We fixed this issue in our version.
Later on, we made the modifications in the calibration code so that the frames which contain blinksare no longer included in the calibration procedure. This is crucial because previously these frames couldalter the average eye images calculated during calibration and therefore were reflected as noise in thecalibration procedure. However; as these frames are no longer available for calibration, we increased thenumber of frames that the pointer stays in the same location from 20 frames to 30 frames. With thenew, higher number of frames, we expect to provide the system with enough samples during calibration.
The last improvement that we propose for this component is the correction of calibration errors.Figure 3.3 illustrates this problem.
Here, each colored symbol corresponds to a target point displayed on the screen and the correspondinggaze estimations of our system, one for each frame. The larger symbols which are arranged in a 3 × 5
grid denote the actual targets, whereas the smaller signs of the same symbol type and color are theestimations of the gaze position. For each symbol group, a line of the same color connects the averageestimation and the target location. Therefore, the length and direction of this line gives us the magnitudeand direction of average testing error for each test point location. Apart from these colored symbols, 15blue lines that start from each target denote the direction of the calibration error for them. However,it should be noted that in order to easily observe the direction, the magnitude of the calibration errorsare increased by a factor of 5. In this figure, we see that for 9 points (1, 2, 3, 4, 10, 11, 13, 14, 15) thereis a clear correlation between the calibration error and average testing error. Since this correlation ispresent, we propose to apply a drift correction.
In order to calculate the calibration errors, we tried two different methods:
Method 1: In this algorithm, we store the average grayscale eye images that are calculated duringcalibration for each training target. Then, after calibration is finished, we pass these eye imagesto the gaze estimator component and calculate the gaze estimations that correspond to them. Weobserved that this method does not work very well in capturing the correlation between trainingand testing errors.
Method 2: Differently from the previous method, here we store the individual grayscale images whichare used to calculate the average images during calibration. Therefore, we save several images

CHAPTER 3. IMPLEMENTATION DETAILS OF THE EYE-TRACKING SYSTEM 18
Figure 3.3: Calibration errors and corresponding testing errors. The symbols with the sameshape and color show the gaze point estimations for the same target point. For each target, theblue lines show the calibration error direction and the line which has the target color shows thetest error direction.
corresponding to different frames for each calibration point. Similar to the previous case, aftercalibration the gaze estimations for these individual images are calculated and then they areaveraged to obtain the average estimation.
A qualitative analysis of these two methods showed that the second method is more successful incalculating the calibration error directions. After the calibration errors are calculated, we continue withremoving these errors during testing. For this purpose, we employ a multivariate interpolation method[30] which we train by passing the average gaze estimations calculated as described above and the actualtargets they belong to. An open source implementation of this method is available online [31]. After theinterpolation method is trained, we use it during testing to remove the effects of calibration errors. Wepass the calculated gaze point estimation of the current frame to the trained interpolator and use theoutput as the corrected gaze point estimation. The results of this correction is presented in Figure 3.4,where the estimations are clearly drawn towards the actual targets.

CHAPTER 3. IMPLEMENTATION DETAILS OF THE EYE-TRACKING SYSTEM 19
(a) Before correction (b) After correction
Figure 3.4: The drift correction moves the estimations towards the actual target.
3.2.6 Gaze estimation
The last component in the pipeline of our system is the gaze estimator, where the Gaussian process(GP) interpolator trained during calibration is used to estimate the gaze position. Here, we tested twodifferent approaches to improve the system:
1. A straightforward averaging of the gaze position estimations provided by both eyes
2. Implementation of a neural network based interpolator
In the first contribution, we simply use both of the extracted eye images to calculate two gaze pointestimations. Then, we combine these estimations by averaging.
Apart from this simple idea, we also consider the case where the Gaussian process interpolator usedhere is completely substituted. Neural network (NN) methods constitute a popular alternative for thispurpose. There exists recent implementations of this technique [18]. In the work that is mentioned,an eye tracker using NNs to map the eye image to gaze point coordinates is implemented and is madeavailable [32]. However author’s permission must be requested to be able to access the archive contentswhich are protected by a password.
We incorporated the NN method in our system by making use of the Fast Artificial Neural Network(FANN) library [33] and created a similar network structure, and a similar input-output system as theoriginal work. Our neural network had 2 levels where the first level contained 128 nodes (1 for eachpixel of 16 × 8 eye image) and the second level contained 2 nodes (one each for x and y coordinates).We scaled the pixel intensities to the interval [0, 1] because of the chosen sigmoid activation function.
Other changes that we implemented consist of normalizing the histogram of eye image before feedingit to NN, trying different training methods (incremental, batch, RPROP), trying different stoppingconditions for training (maximum iterations, upper limit for mean square error (MSE)), and testingdifferent learning rates. After these changes, the NN component successfully replaced the GP estimatorof our system. However, the GP interpolator showed better qualitative results that would have to betested in a quantitative analysis.

Chapter 4
Experimental Setup
4.1 Setup of the experiment environment
In this section, we describe the experimental setup we have created to test the performance of ourapplication. Variations in the setup are made to create separate experiments which allow us to see howthe system performs in different conditions. These experiments are carried out on 18 subjects during aperiod of four days. Figure 4.1 shows how the components of the experimental setup are placed in theenvironment.
On the left, we see the operator’s computer where the application is running. This computer isrotated in order not to distract the subject. The stimuli display faces the subject and it is raised by asupport which enables the subject to face the center of the display directly. The camera is placed at thetop of this display at the center (A), and it has an alternative location which is 19.5 cm towards the leftfrom the central location (B). An optional chinrest is placed at the specific distance of 80 cm away fromthe display, acting as a stabilizing factor for one of the experiments. Behind this we see the rigid chairplaced for the subject. Depending on which experiment is carried out at that time, the chair position isadjusted so that the distance between subject’s face and test display stays at the predefined value.
By introducing variations in this placement, we achieve several setups for different experiments.These have specific purposes in testing a different aspect of the system. These setups are:
Standard setup: Only the optional chinrest is removed from the setup shown in Figure 4.1. Subject’sface is 80 cm away from the display. The whole screen is used to display the 15 target points oneby one.
Extreme camera placement setup: This setup is similar to the previous one. The only difference isthat the camera is placed at its alternative location which is 19.5 cm shifted towards the left. Thepurpose of this setup is to test how the position of the camera affects the results.
Chinrest setup: A setup similar to the first one. The only difference is that the chinrest is employed.
20

CHAPTER 4. EXPERIMENTAL SETUP 21
Figure 4.1: Placement of the components in the experi-mental setup and the geometry involved in error calcula-tion
Figure 4.2: Test point distribu-tion for standard, extreme cam-era and chinrest setups
Figure 4.3: Test point distribu-tion for iPad setup
This experiment is aimed at testing the effects of head pose stability in the performance.
iPad setup: This setup is used to test the performance of our system simulating the layout of an iPadon the stimuli display. This background image contains an iPad image where the iPad screencorresponds to the active area in the experiment and is shown in a different color (see Figure 4.3).The distance of the subject is decreased to 40 cm, in order to simulate the use-case of an actualiPad. The camera stays in the central position; and it was tilted down as seen necessary in orderto center the subject’s face in the camera image.
We chose this set of experiments in order to see how our system performs in real situations. Forexample, in the case of carrying out a remote usability research of a given website over the Internet, wedo not have the control over the camera position for all the subjects in the study. The second setupaddresses this issue and is designed to find an answer to whether this constraint constitutes a problemfor our program. The third setup tests the performance of our system in a mobile environment wherethe screen size is smaller and the user watches the screen from a shorter distance. The last setup isintended to evaluate how successful the subjects are in keeping their heads still and as a result it willtell us whether head pose variance is a must-have feature in applications like this one.
We also analyze the effect of different camera resolutions in these setups. This is done in an offlinemanner by resizing the webcam video stream. The original 1280 × 720 high-definition image, whichcorresponds to the iPad’s FaceTime frontal camera resolution, was downsampled to 640 × 480 (VGA
CHAPTER 4. EXPERIMENTAL SETUP 22
quality).Several constraints made us decide on this specific setup. For example, the usage of two cameras
in parallel was considered; however, the complexity of synchronizing the camera control and setting upthe system was considered out of the scope of this work. The alternative location of the camera waspreviously closer to the corner of the display; but as the geometrical problems prevented the automaticpoint selection component from functioning correctly in this case, this final position has been decided.
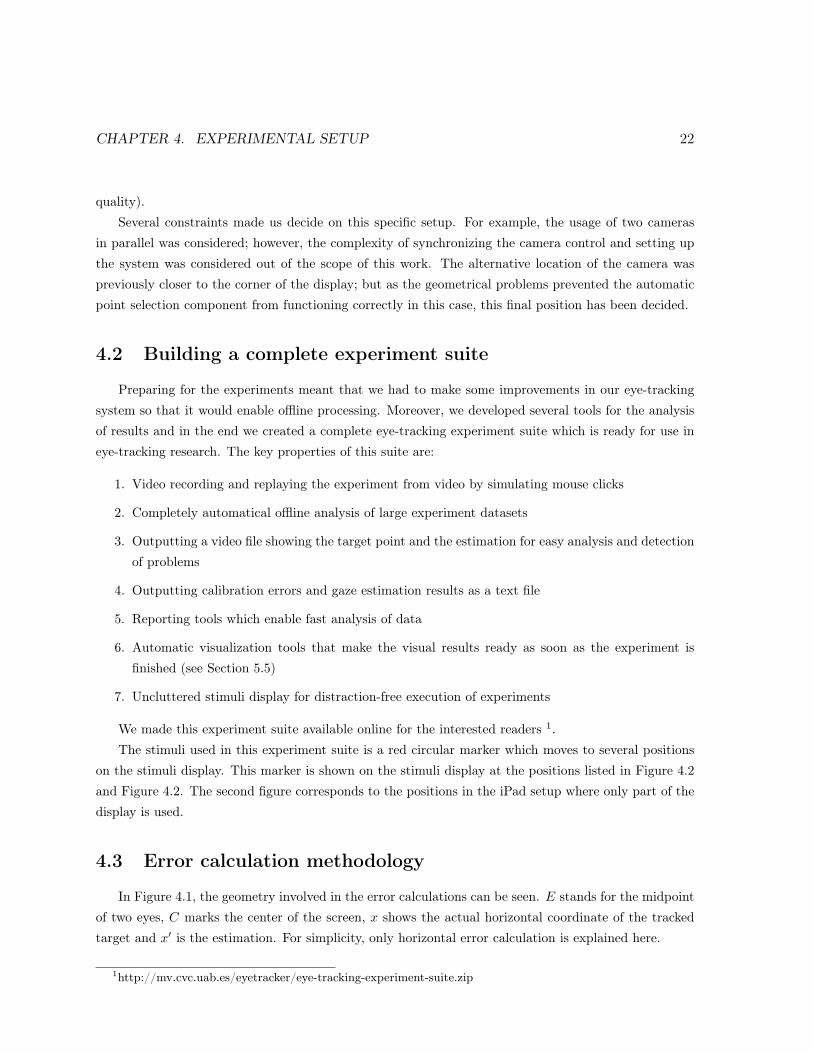
4.2 Building a complete experiment suite
Preparing for the experiments meant that we had to make some improvements in our eye-trackingsystem so that it would enable offline processing. Moreover, we developed several tools for the analysisof results and in the end we created a complete eye-tracking experiment suite which is ready for use ineye-tracking research. The key properties of this suite are:
1. Video recording and replaying the experiment from video by simulating mouse clicks
2. Completely automatical offline analysis of large experiment datasets
3. Outputting a video file showing the target point and the estimation for easy analysis and detectionof problems
4. Outputting calibration errors and gaze estimation results as a text file
5. Reporting tools which enable fast analysis of data
6. Automatic visualization tools that make the visual results ready as soon as the experiment isfinished (see Section 5.5)
7. Uncluttered stimuli display for distraction-free execution of experiments
We made this experiment suite available online for the interested readers 1.The stimuli used in this experiment suite is a red circular marker which moves to several positions
on the stimuli display. This marker is shown on the stimuli display at the positions listed in Figure 4.2and Figure 4.2. The second figure corresponds to the positions in the iPad setup where only part of thedisplay is used.
4.3 Error calculation methodology
In Figure 4.1, the geometry involved in the error calculations can be seen. E stands for the midpointof two eyes, C marks the center of the screen, x shows the actual horizontal coordinate of the trackedtarget and x′ is the estimation. For simplicity, only horizontal error calculation is explained here.
1http://mv.cvc.uab.es/eyetracker/eye-tracking-experiment-suite.zip

CHAPTER 4. EXPERIMENTAL SETUP 23
The angular error is defined as the difference between the actual α angle (the angle formed by x, Eand C) and the estimated angle α′ (the angle formed by x′, E and C). To calculate these angles, twodistances should be calculated first:
DxC : Distance between x and C (in cm)
Dx′C : Distance between x′ and C (in cm)
These distances are converted from pixel units to cm units using the information already gatheredabout the display: width and height in cm, and resolution in pixels which was 1920×1080 for our display.Using these distances and distance of the eye center (E) to the display center point (C), the error indegrees is calculated as follows:
Err = abs(arctan(DxC/DEC)− arctan(Dx′C/DEC))

Chapter 5
Results
In order to carry out our experiments on the setup described before, we recruited 18 subjects andconducted our experiments in 4 days. The subjects were presented a short informative document aboutthe experiment they took part in (see Appendix B), and they were requested to sign a consent form fortheir participation in this experiment (see Appendix C). This document document asks for basic contactinformation, and permissions to share the recorded videos and other non-personal information publicly.Moreover, the conditions of the experiments and their rights are explained here. Another document thatwas created for these experiments is a methodology document which was intended for our usage (seeAppendix D).
5.1 Effects of implemented modifications
In this section, we present the results which show the effects of the proposed changes on the perfor-mance. In order to achieve this, we reflect our changes on the original Opengazer code one by one andcompare the results for all four experiments. Here, we compare 6 different versions of the system whichreflect certain phases of our system over time:
1. [ORIG] Original Opengazer applications with automatic point selection and blink detection dur-ing testing applied
2. [2-EYE] Previous case + estimation using 2 eyes
3. [TRACK] Previous case + tracking changes
4. [BLINK] Previous case + excluding blinks during calibration
5. [CORR] Previous case + calibration error correction
6. [NN] Previous case + neural network estimator
24

CHAPTER 5. RESULTS 25
Horizontal err. Vertical err.◦(σ) Px ◦(σ) Px
ORIG 1.82 (1.40) 95 1.56 (0.81) 80
2-EYE 1.56 (1.28) 82 1.48 (0.86) 75
TRACK 1.73 (1.37) 91 1.58 (0.78) 81
BLINK 1.73 (1.37) 91 1.58 (0.76) 80
CORR 1.62 (1.40) 85 1.50 (0.77) 76
NN 5.12 (2.26) 266 2.26 (0.92) 115
Horizontal err. Vertical err.◦(σ) Px ◦(σ) Px
ORIG 2.07 (1.69) 109 1.73 (1.04) 88
2-EYE 1.94 (2.14) 101 1.67 (1.07) 85
TRACK 1.77 (1.52) 93 1.50 (0.80) 76
BLINK 1.78 (1.53) 93 1.49 (0.80) 76
CORR 1.68 (1.56) 88 1.43 (0.80) 73
NN 5.33 (2.83) 277 2.09 (0.89) 107
(a) (b)
Table 5.1: Standard experimental setup results for (a) 480 and (b) 720 camera
Horizontal err. Vertical err.◦(σ) Px ◦(σ) Px
ORIG 2.02 (1.45) 106 1.82 (0.73) 93
2-EYE 1.54 (0.99) 81 1.65 (0.57) 84
TRACK 2.02 (1.39) 106 1.90 (0.60) 97
BLINK 2.01 (1.39) 106 1.90 (0.59) 97
CORR 1.88 (1.37) 98 1.78 (0.58) 91
NN 4.59 (1.87) 239 2.35 (0.73) 120
Horizontal err. Vertical err.◦(σ) Px ◦(σ) Px
ORIG 2.22 (1.68) 116 2.07 (0.77) 106
2-EYE 1.70 (1.30) 89 1.82 (0.75) 93
TRACK 1.88 (1.15) 99 1.86 (0.66) 95
BLINK 1.89 (1.14) 99 1.88 (0.68) 96
CORR 1.76 (1.15) 92 1.78 (0.67) 91
NN 4.93 (2.48) 257 2.15 (0.46) 110
(a) (b)
Table 5.2: Extreme camera placement experimental setup results for (a) 480 and (b) 720 camera
In all versions of the application, gaze is not estimated during blinks detected through the statemachine explained previously.
The resulting performances are grouped according to the experimental setups (standard, extremecamera placement, chinrest, iPad) and presented in the following tables. Moreover, for each case, wehave run the experiment both using the original HD videos and using the resized VGA videos. For eachcase and camera resolution, average horizontal and vertical errors for all suspects and all readings aregiven both in degrees and in pixels. For the errors in degrees, the standard deviation is also supplied inparentheses.
In Table 5.1, the results for standard setup is given. Especially for the high definition case, theimprovements we have made on the system have affected the performance. Table 5.2 shows the perfor-mance values of the system in the experimental setup where the camera is placed towards the extremeend of the display. Here, the performance is inferior to the standard setup as we expected.
The performance of the setup where the chinrest was employed can be seen in Table 5.3. In com-parison with the standard setup, we can observe the stabilizing effect of the chinrest in the lower errorrates.

CHAPTER 5. RESULTS 26
Horizontal err. Vertical err.◦(σ) Px ◦(σ) Px
ORIG 1.29 (0.62) 68 1.53 (0.62) 78
2-EYE 1.04 (0.64) 55 1.37 (0.47) 70
TRACK 1.37 (0.85) 72 1.64 (0.45) 84
BLINK 1.38 (0.85) 73 1.62 (0.44) 83
CORR 1.25 (0.78) 66 1.53 (0.44) 78
NN 4.06 (1.25) 212 2.04 (0.66) 104
Horizontal err. Vertical err.◦(σ) Px ◦(σ) Px
ORIG 1.35 (0.63) 71 1.61 (0.71) 82
2-EYE 1.18 (0.82) 62 1.46 (0.54) 75
TRACK 1.27 (0.85) 67 1.48 (0.56) 75
BLINK 1.27 (0.85) 67 1.47 (0.56) 75
CORR 1.14 (0.79) 60 1.36 (0.53) 69
NN 4.19 (1.03) 218 2.12 (0.64) 108
(a) (b)
Table 5.3: Chinrest experimental setup results for (a) 480 and (b) 720 camera
Horizontal err. Vertical err.◦(σ) Px ◦(σ) Px
ORIG 3.18 (2.13) 81 2.64 (1.38) 68
2-EYE 2.88 (2.22) 74 2.43 (1.20) 63
TRACK 2.61 (1.63) 67 2.27 (1.03) 58
BLINK 2.60 (1.63) 66 2.25 (1.01) 58
CORR 2.49 (1.64) 64 2.08 (0.92) 54
NN 5.12 (2.26) 266 2.26 (0.92) 115
Horizontal err. Vertical err.◦(σ) Px ◦(σ) Px
ORIG 2.87 (1.66) 73 2.49 (0.91) 64
2-EYE 2.54 (1.64) 65 2.46 (1.05) 63
TRACK 2.32 (1.29) 59 2.17 (0.75) 56
BLINK 2.31 (1.30) 59 2.14 (0.77) 55
CORR 2.15 (1.32) 55 2.02 (0.76) 52
NN 5.33 (2.83) 277 2.09 (0.89) 107
(a) (b)
Table 5.4: iPad experimental setup results for (a) 480 and (b) 720 camera
CHAPTER 5. RESULTS 27
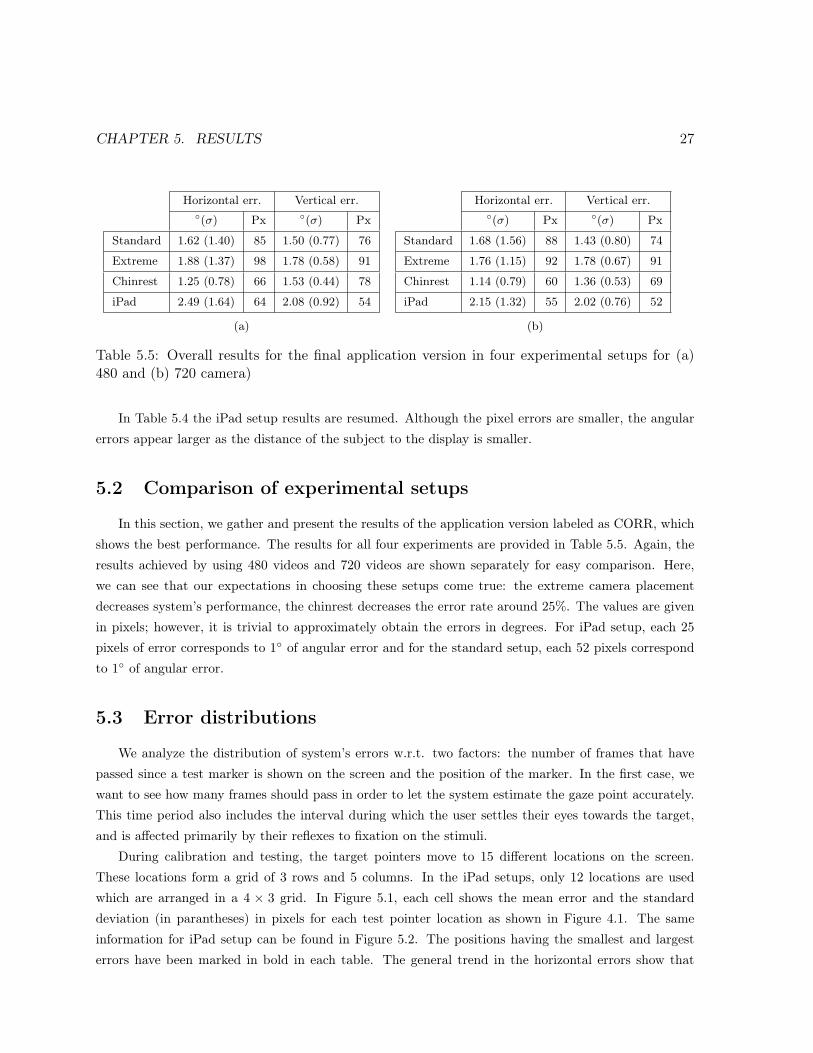
Horizontal err. Vertical err.◦(σ) Px ◦(σ) Px
Standard 1.62 (1.40) 85 1.50 (0.77) 76
Extreme 1.88 (1.37) 98 1.78 (0.58) 91
Chinrest 1.25 (0.78) 66 1.53 (0.44) 78
iPad 2.49 (1.64) 64 2.08 (0.92) 54
Horizontal err. Vertical err.◦(σ) Px ◦(σ) Px
Standard 1.68 (1.56) 88 1.43 (0.80) 74
Extreme 1.76 (1.15) 92 1.78 (0.67) 91
Chinrest 1.14 (0.79) 60 1.36 (0.53) 69
iPad 2.15 (1.32) 55 2.02 (0.76) 52
(a) (b)
Table 5.5: Overall results for the final application version in four experimental setups for (a)480 and (b) 720 camera)
In Table 5.4 the iPad setup results are resumed. Although the pixel errors are smaller, the angularerrors appear larger as the distance of the subject to the display is smaller.
5.2 Comparison of experimental setups
In this section, we gather and present the results of the application version labeled as CORR, whichshows the best performance. The results for all four experiments are provided in Table 5.5. Again, theresults achieved by using 480 videos and 720 videos are shown separately for easy comparison. Here,we can see that our expectations in choosing these setups come true: the extreme camera placementdecreases system’s performance, the chinrest decreases the error rate around 25%. The values are givenin pixels; however, it is trivial to approximately obtain the errors in degrees. For iPad setup, each 25pixels of error corresponds to 1◦ of angular error and for the standard setup, each 52 pixels correspondto 1◦ of angular error.
5.3 Error distributions
We analyze the distribution of system’s errors w.r.t. two factors: the number of frames that havepassed since a test marker is shown on the screen and the position of the marker. In the first case, wewant to see how many frames should pass in order to let the system estimate the gaze point accurately.This time period also includes the interval during which the user settles their eyes towards the target,and is affected primarily by their reflexes to fixation on the stimuli.
During calibration and testing, the target pointers move to 15 different locations on the screen.These locations form a grid of 3 rows and 5 columns. In the iPad setups, only 12 locations are usedwhich are arranged in a 4 × 3 grid. In Figure 5.1, each cell shows the mean error and the standarddeviation (in parantheses) in pixels for each test pointer location as shown in Figure 4.1. The sameinformation for iPad setup can be found in Figure 5.2. The positions having the smallest and largesterrors have been marked in bold in each table. The general trend in the horizontal errors show that

CHAPTER 5. RESULTS 28
error rates are generally higher along the edge of the display. However, we cannot come to the sameconclusion in the iPad results as the points in the first and third columns do not have similar results.
118 (128) 76 (106) 52 (48) 46 (54) 135 (209)
115 (184) 73 (87) 54 (48) 57 (63) 61 (110)
178 (246) 129 (144) 84 (81) 68 (54) 104 (130)
(a) Horizontal
58 (70) 56 (65) 73 (137) 43 (59) 75 (136)
90 (63) 95 (76) 60 (57) 72 (78) 80 (61)
81 (68) 83 (106) 63 (76) 81 (170) 62 (103)
(b) Vertical
Figure 5.1: Standard experimental setup error distribution w.r.t. test point locations (pixels)
101 (78) 54 (49) 55 (67)
87 (88) 40 (40) 25 (33)
114 (138) 43 (29) 30 (50)
121 (85) 59 (44) 35 (44)
(a) iPad horizontal
60 (64) 36 (51) 72 (102)
71 (51) 53 (56) 54 (59)
72 (65) 54 (50) 54 (58)
41 (38) 47 (44) 67 (82)
(b) iPad vertical
Figure 5.2: iPad experimental setup error distribution w.r.t. test point locations (pixels)
In Figure 5.3, both of these aspects can be seen more easily. For each sub-chart, the horizontal axisshows the number of frames that has passed since the test point has been shown on the screen. Thevertical axis shows the errors for both horizontal (blue) and vertical (red) directions. These charts showthat only after the 10th frame, the error becomes stable; meaning that the subject needs this amount oftime to be able to focus on the displayed marker.
5.4 Inter-subject variances
In Figure 5.4, the inter-subject variances are plotted. Here, the medium red lines show the medianand the box limits show the 25th and 75th percentiles for each case. The black lines above and belowthe boxes denote the extreme data points which are not considered outliers. The outliers are shownwith a red plus sign. The plot contains 8 sub-plots: standard experimental setup (horizontal, vertical),chinrest setup (horizontal, vertical), extreme camera placement setup (horizontal, vertical), iPad setup(horizontal, vertical).
The figure shows that in the horizontal case, the boxes are mostly overlapping and they are notseparable. Therefore, the errors in pixels follow the same trend. However, in the extreme cameraplacement setup, the variance is higher and the differences between subjects are larger. In the verticalerrors, it can be argued that the extreme camera placement setup should be considered as an outliergroup; however, it must be validated by further statistical analysis.

CHAPTER 5. RESULTS 29
Figure 5.3: Error distribution w.r.t. frames and test point locations. Each sub-chart shows thedistribution of horizontal (blue) and vertical (red) errors for the test point that is displayed atthe corresponding location on the screen. Horizontal axis denotes the number of frame (1-20)and vertical axis denotes the error in pixels (max. 500 shown).
(a) Horizontal (b) Vertical
Figure 5.4: Distribution of errors in pixels w.r.t. subjects shown on a box plot. The sub-plotsshow the errors of four experimental setups (standard, chinrest, extreme camera, iPad). Thered lines denote the median and the blue box shows the 25th-75th percentile range. The outliersubject performances are shown with red plus signs.

CHAPTER 5. RESULTS 30
(a) Heatmap for experiments using the entire screen area (b) Heatmap for iPadsetup
Figure 5.5: Heatmap visualization of results. Areas with high intensity show the accumulatedgaze point estimations around the same point. Square white markers denote the target points.
5.5 Qualitative analysis
In the previous sections, numerical performance values of our system were provided. Here, we showsome examples of the visualization techniques we have used to assess the performance qualitatively.
In Figure 3.3, the first technique that we employ to visualize the numerical performance values isshown. Here, every target point and the estimations belonging to it are displayed by a colored symbol(triangles, squares, etc.). The whole image represents the testing screen, and target points are shown attheir corresponding locations on the image. The pointss can be differentiated from the estimates by theirlarger size. In results with good performances such as this one, the estimates are mostly accumulatednear the target itself. Also, the magnitude of the error can be easily seen by checking the length of theline which connects the average estimation center to the target point. In experiments where the systemcannot estimate the gaze very well, the estimate symbols may appear further away from the targetpoint and large lines can be seen in the image. One last feature of this representation is the displayof calibration errors, which are the blue plus signs located close to each test point. These signs showwhether the calibration errors are correlated with the testing errors.
Another, simpler representation makes use of heatmaps as seen in Figure 5.5(a). Heatmaps werecreated in Matlab by first accumulating the gaze estimations on an image representing the display, andthen filtering the resulting image with a Gaussian filter of 10× 10 pixels. Final representation is createdby adjusting the intensities so that the area with the highest intensity is shown by the white color.Therefore, the brighter areas in these images denote the locations where estimations are accumulatedin higher number and we expect these locations to be close to the test targets in a well-performingexperiment. The test targets are shown by small white dots for easy comparison and analysis of the visual.

Chapter 6
Discussion
The results of the experiments that we have carried out contain the answers we asked ourselves whenstarting this work. Is the performance level acceptable compared to commercial eye-trackers? Does thedifference in setups change the performance of the system? Now, we will analyze the results and searchfor the answers to these questions and many others.
To begin with, considering the 1.68◦ horizontal and 1.43◦ vertical errors of the final system inthe standard experimental setup, we can conclude that we have improved the original system by 18%horizontally and 17% vertically. The performance difference in the same experiment done with VGAcameras (11% horizontally, 4% vertically) is comparably lower than the first case, which shows us thatour contributions in this work show their true performance with the increased image quality. Fromanother aspect, it means that the future advancements in cameras will favor the methods we proposed.
Commercial remote eye-trackers have a performance of between 0.1 and 1◦. One popular model,Tobii X1 Light Eye Tracker, is reported to have an accuracy of 0.5◦ under ideal conditions [34]. With upto 300 Hz sampling rates, these devices are crucial for research studies where these speeds are necessary.However, as even their rental prices are starting from thousands of euros, and as this sampling rate is notneeded in all use cases, we believe that our system poses a good alternative with promising performancelevels.
By analyzing the distributions of errors w.r.t. test point locations, we come to several conclusions.First, the horizontal errors are higher along the sides of the screen. In the vertical direction, the sameis true for the lower parts of the screen. However, in the second case the difference is not as huge as inthe first one. These observations should be taken into account when using the eye-tracker for practicalpurposes. For example, if the buttons of a graphical user interface (GUI) is to be controlled by gazing,the buttons should not be of the same size in all parts of the screen. Instead, the buttons closer tothe sides should be given larger sizes. Our guess on this distribution of errors is that the Gaussianprocess (GP) estimator cannot generalize very well outside the screen area covered by the test points.For instance, the test pointers are located at least around 90 pixels away from the screen edges and it
31

CHAPTER 6. DISCUSSION 32
is possible that the area between the pointers and the edges are not trained perfectly. In order to verifythis, a new experimental setup may be prepared where pysical pointers are used to calibrate the systemfor out-of-bounds locations.
When analyzing the distribution of errors among the subjects, we see that the chinrest acted as astabilizing factor and decreased the variance of errors. However, there is not a clear separation among thesetups in the horizontal direction. In the vertical direction, the error rates of extreme camera placementsetup is higher compared to others, and also the variance is larger. This is mostly caused by problemsin detecting and tracking points from an angle.
Going into more detail, we see that in the tables where we evaluate the progressive improvements wehave made on the system, we see that mostly we are pushing the performance in the positive direction.We observed that excluding the blink frames from the calibration process (application version labeledBLINK) did not have a perceivable effect on the performance. We argue that the averaging step in thecalibration procedure already takes care of the outlier images. The other component that failed ourexpectations is the neural network estimator, which performed up to 2.5 times worse than the Gaussianprocess estimator. As we tried several methods while implementing this component, and as we had asample implementation at hand, at this time we are not clear about the reasons of this failure.
An aim of this work was to analyze the factors which have an effect on the performance. Here, weconclude with a list of the factors that we have analyzed and our conclusions on their effects:
Camera resolution: Using a higher camera resolution improves the results between 6% and 14% inthe last three setups. However, in the standard setup we observed a descrease in performance inall versions of the application. Still, comparing the effects of our contributions, we see that thesethe improved CORR version recovers most of the performance lost in the ORIG (see Table 5.1).
Camera position: Shifting the camera from the top center of the display decreased the performance by5% horizontally and 24% vertically. Moreover, the error rate is higher in the horizontal directionin the setup where the VGA camera is used. Therefore, we conclude camera position affects theperformance and that lower resolution cameras are affected more.
Stability: The use of a chinrest improves the performance by 32% horizontally compared to the standardsetup. Also the variance among subjects is reduced, which increases the reliability of this setupfor experimental purposes. We also observed that in the vertical errors, this difference is not assignificant.
Subjects: As seen in Figure 5.4, there are not many outliers among our subjects. In most of the cases,the same subject is the only one for whom we have the higher error rates. Thus, we conclude thatmostly the subjects will not have problems in taking part in this kind of experiments.
Lighting conditions: The ambient light is an important factor as it affects both the camera framerate, and the image quality. During our experiments, we have observed that a change in thisfactor may effect especially corner detection algorithms and part detectors, as shadows and othernoise appear in the webcam image.

Chapter 7
Conclusions
In this work, we built an eye-tracking system which is ready to use for experimental purposes andwhich has all the necessary tools to analyze the results, repeat the experiments and automate theseprocedures. Although the final performance is not on the same level as commercial eye-trackers, wehave come a long way with our contributions. We believe that it poses a cheap alternative working inreal-time which requires only a webcam (70 Euros in our setup) and we also believe that it has potentialusage areas.
The fact that a simple improvement of estimating the gaze point for both eyes and then averagingthem is left out of the base system shows us that there are many unexplored aspects of the system whichare waiting for improvements. Therefore, we believe there is still much work to do and the achievedperformance levels can be taken even further.
From the experiments, we learned that resolution, subject stability, camera position all have an effecton the performance. We believe that in practical applications of this system, these conditions should bechanged to keep the performance as high as possible. Moreover; lighting conditions, which tend to varyduring the day even at the same location, also affect the error rates and therefore constitutes a problemthat should be addressed.
Our final system is not head-pose invariant; therefore, the changes in subject’s head-pose are reflectedin the errors directly. We believe that one of the next steps to take should be building a real-timeface tracker and implementing one of the model-based methods analyzed in the Introduction. Thisimprovement will remove many constraints from the system such as camera placement, subject stabilityand it will enable more practical uses.
Coming to an end of a study which continued for several months, we strongly believe that we havelearned a lot and at the same time created valuable contributions. The experiment suite is availablefor download publicly, and a dataset gathered during the experiments will be published which will onlycontain the experiments of the subjects who willingly consented to their videos being shared.
33

Bibliography
[1] H. Wu, Q. Chen, and T. Wada, “Conic-based algorithm for visual line estimation from one image.”in FGR. IEEE Computer Society, 2004, pp. 260–265.
[2] J. Chen and Q. Ji, “3D gaze estimation with a single camera without IR illumination.” in ICPR.IEEE, 2008, pp. 1–4.
[3] S. M. Munn and J. B. Pelz, “3D point-of-regard, position and head orientation from a portablemonocular video-based eye tracker.” in ETRA. ACM, 2008, pp. 181–188.
[4] D. W. Hansen and Q. Ji, “In the eye of the beholder: A survey of models for eyes and gaze.” IEEETrans. Pattern Anal. Mach. Intell., vol. 32, no. 3, pp. 478–500, 2010.
[5] (2012, Sep.) Tobii eye-trackers. [Online]. Available: http://www.tobii.com/
[6] (2012, Sep.) SensoMotoric Instruments eye-trackers. [Online]. Available:http://www.smivision.com/
[7] K. Toyama, ““Look, ma–no hands!” Hands-free cursor control with real-time 3D face tracking,” inWorkshop Perceptual User Interfaces. IEEE Computer Society, 1998, pp. 49–54.
[8] E. Y. Kim, S. K. Kang, K. Jung, and H. J. Kim, “Eye mouse: mouse implementation using eyetracking,” in Consumer Electronics, 2005. ICCE. 2005 Digest of Technical Papers. InternationalConference on, jan. 2005, pp. 207 – 208.
[9] (2012, Sep.) Gazehawk website. [Online]. Available: http://www.gazehawk.com
[10] (2012, Sep.) EyeTrackShop website. [Online]. Available: http://www.eyetrackshop.com
[11] A. T. Duchowski, Eye tracking methodology – theory and practice. Springer, 2003.
[12] R. Newman, Y. Matsumoto, S. Rougeaux, and A. Zelinsky, “Real-time stereo tracking for head poseand gaze estimation.” in FG. IEEE Computer Society, 2000, pp. 122–128.
[13] Y. Matsumoto and A. Zelinsky, “An algorithm for real-time stereo vision implementation of headpose and gaze direction measurement.” in FG. IEEE Computer Society, 2000, pp. 499–505.
[14] J.-G. Wang and E. Sung, “Gaze determination via images of irises.” in BMVC, M. Mirmehdi andB. T. Thomas, Eds. British Machine Vision Association, 2000.
34

BIBLIOGRAPHY 35
[15] H. Yamazoe, A. Utsumi, T. Yonezawa, and S. Abe, “Remote gaze estimation with a single camerabased on facial-feature tracking without special calibration actions.” in ETRA. ACM, 2008, pp.245–250.
[16] T. F. Cootes, G. J. Edwards, and C. J. Taylor, “Active appearance models.” IEEE Trans. PatternAnal. Mach. Intell., vol. 23, no. 6, pp. 681–685, 2001.
[17] T. Ishikawa, S. Baker, I. Matthews, and T. Kanade, “Passive driver gaze tracking with active ap-pearance models,” in Proceedings of the 11th World Congress on Intelligent Transportation Systems,vol. 3, 2004.
[18] C. Holland and O. V. Komogortsev, “Eye tracking on unmodified common tablets: challenges andsolutions.” in ETRA, C. H. Morimoto, H. O. Istance, S. N. Spencer, J. B. Mulligan, and P. Qvarfordt,Eds. ACM, 2012, pp. 277–280.
[19] P. Zielinski. (2012, Sep.) Opengazer: open-source gaze tracker for ordinary webcams (software).[Online]. Available: http://www.inference.phy.cam.ac.uk/opengazer/
[20] L.-Q. Xu, D. Machin, and P. Sheppard, “A novel approach to real-time non-intrusive gaze finding.”in BMVC, J. N. Carter and M. S. Nixon, Eds. British Machine Vision Association, 1998.
[21] G. Bradski, “The OpenCV Library,” Dr. Dobb’s Journal of Software Tools, 2000.
[22] J. S. Agustin, H. H. T. Skovsgaard, E. Møllenbach, M. Barret, M. Tall, D. W. Hansen, and J. P.Hansen, “Evaluation of a low-cost open-source gaze tracker.” in ETRA, C. H. Morimoto, H. O.Istance, A. Hyrskykari, and Q. Ji, Eds. ACM, 2010, pp. 77–80.
[23] Z. Savas. (2012, Sep.) TrackEye: Real-Time Tracking of Human Eyes Using a Webcam.[Online]. Available: http://www.codeproject.com/Articles/26897/TrackEye-Real-Time-Tracking-Of-Human-Eyes-Using-a
[24] M. Castrillón-Santana. (2012, Sep.) Modesto castrillón-santana. [Online]. Available:http://mozart.dis.ulpgc.es/Gias/modesto.html?lang=0
[25] S. Hameed. (2012, Sep.) Haar cascade for eyes. [Online]. Available: http://www-personal.umich.edu/ shameem
[26] X. Haiying and Y. Guoping, “A novel method for eye corner detection based on weighted varianceprojection function,” in Image and Signal Processing, 2009. CISP ’09. 2nd International Congresson, oct. 2009, pp. 1 –4.
[27] C. Xu, Y. Zheng, and Z. Wang, “Semantic feature extraction for accurate eye corner detection.” inICPR. IEEE, 2008, pp. 1–4.
[28] G. Santos and H. Proenca, “A robust eye-corner detection method for real-world data,” in Biometrics(IJCB), 2011 International Joint Conference on, oct. 2011, pp. 1 –7.

BIBLIOGRAPHY 36
[29] C. Harris and M. Stephens, “A combined corner and edge detector,” in Proceedings of the 4th AlveyVision Conference, 1988, pp. 147–151.
[30] Q. Wang, P. Moin, and G. Iaccarino, “A high order multivariate approximation scheme for scattereddata sets,” Journal of Computational Physics, vol. 229, no. 18, pp. 6343 – 6361, 2010.
[31] (2012, Sep.) MIR | Free software download at SourceForge.net. [Online]. Available:http://sourceforge.net/projects/mvinterp
[32] O. V. Komogortsev. (2012, Sep.) Identifying fixations and saccades in eye tracking protocols.[Online]. Available: http://cs.txstate.edu/ ok11/nnet.html
[33] S. Nissen, “Implementation of a Fast Artificial Neural Network Library (fann),” Report, Departmentof Computer Science University of Copenhagen (DIKU), vol. 31, 2003.
[34] (2012, Sep.) Specification of Gaze Precision and Gaze Ac-curacy, Tobii X1 Light Eye Tracker. [Online]. Available:http://www.tobii.com/Global/Analysis/Marketing/Brochures/ProductBrochures/Tobii_X1_Light_Eye_Tracker_Technical_Specifcation_Leaflet.pdf

Appendix A
Building Steps of an Infrared Camera
(a) IR-only filter, camera lensand camera body
(b) Camera lens with IRblocking filter removed
Figure A.1: Parts of the built IR camera and the detail of the lens
Many webcams come with sensors which can capture infrared (IR) lights as well. However, as thelights in this wavelength are seen as noise in visible spectrum images, a filter which blocks IR light isused in these cameras. Based on this idea, we tried to build our own IR camera by removing the filterin the camera’s lens system and placing another filter which only lets in IR lights in front of the camera.
We can group the cameras in two according to the structure of the IR filter: those that have thefilter in the form of a coating attached to the lens, those that have a separate glass part which containsthe filter. The filters in the second group are easier to remove, therefore we took the Trust Spotlightwebcam which is of this structure and removed its filter. After placing the IR-only filter in front of it,we could take IR images with it.
37

Appendix B
Information for Subjects Document
38

APPENDIX B. INFORMATION FOR SUBJECTS DOCUMENT 39

Appendix C
Subject Information and Conditions
Document
40

APPENDIX C. SUBJECT INFORMATION AND CONDITIONS DOCUMENT 41

Appendix D
Experiment Description Document
42

APPENDIX D. EXPERIMENT DESCRIPTION DOCUMENT 43