extraction, identification and utilization of pigments …€¦ · needed to complete the...
TRANSCRIPT

International Journal of Science and Research (IJSR) ISSN (Online): 2319-7064
Index Copernicus Value (2013): 6.14 | Impact Factor (2015): 6.391
Volume 5 Issue 5, May 2016
www.ijsr.net Licensed Under Creative Commons Attribution CC BY
Extraction, Identification and Utilization of
Pigments Extracted from Citrus Wastes
Shukla P.S.1, Gawande S.S.
2, Thorat A.V.
3
1,2 Research Scholar, Department of Food Process Engineering of Vaugh School of Agriculture, Engineering and Technology, Sam
Higginbottom Institute of Agriculture, Technology and Sciences (Deemed-To-Be-University)
3 Assistant Professor, K. K. Wagh college of Food Technology, Nashik
Abstract: Food processing wastes may impose heavy burden on factories and cause enormous environmental problems. Citrus wastes
typically are about 45-50% of the weight of citrus original and the percentage of waste to 30-50% for vegetables and fruits in general.
Natural color plays a significant role in determining the degree of consumer acceptance of the product. In addition, carotenoids (vitamin
A precursor) have high nutritional values which are important for human nutrition. The efficiency of different organic solvents such as
acetone 85%, hexane, petroleum ether, ethyl acetate and ethanol 90% in the extraction of pigments from citrus peel was studied. Ethyl
acetate is the best solvent in extracting carotenoids from citrus peel, followed by ethanol 90%. HPLC was used to identify the extracted
pigments and their components. The extracted natural pigments were mixed with different carriers such as starch, lactose, dextrin,
arabic gum, and it was noted that lactose is the best one, followed by starch compared with different tested carriers. It was also found
that Alpha-tocopherol was relatively more stable than Butylated hydroxy toluene (BHT) antioxidant (an artificial compound). Natural
extracted pigments were used in food product (e.g. jelly) evaluations and gave better values for the color, flavor and taste compared to
commercial samples with artificial additives.
Keywords: Citrus wastes, Carotenoids, HPLC, Organic solvents, Artificial additives
1. Introduction
Citrus is a common term and genus (Citrus) of flowering
plants in the Rue family, Rutaceae. Citrus fruits are non-
climacteric and respiration slowly declines and the
production and release of ethylene is gradual.
India ranks sixth in the production of citrus fruits in the
world. It is of particular interest because of its high content
of vitamin
C and refreshing juice. Citrus wastes typically are about 45-
50% of the weight of citrus original and the percentage of
waste to 30-50% for vegetables and fruits in general. Natural
color plays a significant role in determining the degree of
consumer acceptance of the product. In addition, carotenoids
(vitamin A precursor) have high nutritional values which are
important for human nutrition. Francis and Isaksen (1988)
stated that carotenoids play a very important role for
extraction as for protection of health against cancer,
cardiovascular and eye disease and as anti-oxidant.
Natural extracted pigments are being used in food product
(e.g. jelly) evaluations and gave the better values for the
color, flavor and taste compared to commercial samples with
artificial additives. Citrus by-products and wastes such as
molasses, concentrated citrus peel juice, and pulp wash can
be subjected to fermentation, pectolytic treatment and
extraction with alcohol to obtain natural beverage clouds
and also to improve cloud strength and stability. Most of the
citrus fruits grown worldwide are oranges of various
varieties. More than half of these are processed and have
their juice extracted. Orange, one of the famous citrus fruits,
is commonly consumed in world. About 50% of the
processed oranges turn out in the form of orange peels.
The citrus processing industry yearly generates tons of
residues, including peel and segment membranes, from the
extraction of citrus juice in industrial plants. The
management of these wastes, which produce odor and soil
pollution, represents a major problem for the food industry.
Orange peel contains soluble sugars and pectin as the main
components. the orange peel is in fact constituted by soluble
sugars, 16.9 % wt; starch, 3.75 % wt; fiber (cellulose, 9.21
% wt; hemicelluloses, 10.5 % wt; lignin 0.84 % wt; and
pectin, 42.5 % wt), ashes, 3.50 % wt; fats, 1.95 % wt; and
proteins, 6.50 % wt. The total sugar content of orange peel
varies between 29 and 44 %, soluble and insoluble
carbohydrates being the most abundant and economically
interesting constituents of this residue. Approximately 50 %
of the dry weight of orange is soluble in alcohol , and
soluble sugars are the major components also of this
fraction. Glucose, fructose and sucrose are the main sugars,
although xylose can also be found in small quantities in
orange peel. Insoluble polysaccharides in orange peel are
composed of pectin, cellulose and hemicelluloses. Pectin
and hemicelluloses are rich in galacturonic acid, arabinose
and galactose, but they also contain small amounts of
xylose, glucose, and perhaps rhamnose . Glucose is the
dominant sugar in the cellulosic fraction, which also
contains some quantities of xylose and arabinose, traces of
galactose and uronic acids, and in some instances mannose.
On the other hand, lignin seems to be absent in these tissues.
Consequently, a mixture of cellulases and pectinases is
needed to complete the conversion of all polysaccharides to
monosaccharides . However the outer layer usually called,
flavedo in comparison with the inner layer of the peels
usually called albedo contains considerable amounts of the
natural pigments.
Carotenoids play important roles in human nutrition through
their provitamin A activity, but also by acting as
antioxidants, for prevention of age-related macular
degeneration or skin protection against UV radiation. The
antioxidant capacity of carotenoids was proved for pure
Paper ID: NOV163451 840

International Journal of Science and Research (IJSR) ISSN (Online): 2319-7064
Index Copernicus Value (2013): 6.14 | Impact Factor (2015): 6.391
Volume 5 Issue 5, May 2016
www.ijsr.net Licensed Under Creative Commons Attribution CC BY
compounds as well as for plant extracts and food. Recent
studies investigate the profile of carotenoids in some Italian
grape varieties and the effect of lightening and irrigation on
carotenoids concentration.The main objective of this
research work is extraction, determination and identification
of natural colorants from different citrus wastes (citrus peel).
Also to study the effects of pH and oxygen on the stability
of extracted pigments and determination of the specific
carriers for the extracted pigments using solid matrices
(starch, dextrin, arabic gum and flour).
The feasibility of using produced pigments in manufacturing
of food product (Jelly). Rousseff et.al., (1992) employed
liquid- liquid extraction sample preparation with non-
aqueous reverse phase HPLC and photo-diode array
detection to separate and quantify lycopene, beta- carotene,
phytoene and phytofluene in newer red grapefruit cultivars.
These cultivars contained appreciably higher concentrations
of both visible and colorless carotenoids when compared to
the Ruby red cultivar. Lycopene and beta-carotene were
found in highest concentrations in the Star Ruby cultivar.
Mean lycopene (all trans) levels were Star Ruby (33
microg/g), Ray (21 microg/g), and Flame (7.9 microg/g).
Lycopene levels in the comparison Ruby Red grapefruit
were 2.9(interior) and 1.6microg/g (Indian River).Mean beta
carotene levels in decreasing order were Star Ruby (9.6
microg/g), Flame (8.6 microg/g) and Ray (7.0microg/g). The
comparison Ruby Red Fruits were both 4.2microg/g. These
cultivars could serve as important dietary sources of beta-
carotene. The natural colors of carrots to improve the color
of children candy. Six treatments were investigated; three of
them were prepared using fresh yellow carrot after
blanching in water, blanching by steam and without
blanching. Each sample of these three treatments was dried
and grounded to a fine powder, which was added to the
candy in 5%. The other three treatments were prepared using
fresh red carrot, which was dried and grounded to a fine
powder. Two of them were prepared by extracting the
pigment from red carrot powder (10 grams /each) using 0.8
and 1.0% citric acid respectively. Meanwhile, the last
treatment was prepared by adding 10 grams of powder to
500g candy. The candy samples analyzed directly after
production and the organoleptic evaluation of different
samples indicated that the yellow and red carrot could be
good natural colorant for candy (Hanaa et.al., 1993)
Lee et.al. (2001) applied high-performance liquid
chromatography with photodiode array detection for the
separation and characterization of carotenoids from a red-
fleshed navel orange (Cara Cara). Carotenoid pigments were
extracted using hexane/acetone/ethanol and saponified using
10% methanolic potassium hydroxide. More than 29
carotenoid pigments were separated within 60 min using a
ternary gradient (75% acetonitrile/25% methanol,
methyl tert-butyl ether, and water) elution on a
C30 reversed-phase column. The presence of lycopene (3.9
± 1.1 ppm) and a relatively large percentage of β-carotene
were distinct differences in the pigment profile of this red
navel orange juice as compared to the profile of standard
navel orange juice. The juice color in the red navel was
much deeper orange than that from navel orange; hue angle
ranged from 84.1 to 89.4 for red navel compared to 98.2 to
100.5 for standard navel.
Negi and Jayaprakasha (2001) extracted Citrus
paradisi peels with hexane, chloroform, acetone and
methanol using a Soxhlet extractor for 8 h each. Thin layer
chromatography (TLC) of hexane and chloroform extracts
showed three spots with different concentrations; hence both
the extracts were mixed and fractionated into alcohol soluble
and insoluble fractions. Naringin was isolated from acetone
and methanol extracts by column chromatography and its
structure was confirmed by 1H and
13C NMR spectroscopic
studies. Antibacterial activity of these fractions was
evaluated against different bacteria. The alcohol soluble
fraction was found to possess maximum activity followed by
hexane extract. Extracts were more effective against Gram-
positive than Gram-negative bacteria.
2. Materials and Methods
This chapter deals with the materials and methods involve
during this work. The investigation and analysis was
conducted at the Department of Food Process Engineering
of Vaugh School of Agriculture, Engineering and
Technology, Sam Higginbottom Institute of Agriculture,
Technology and Sciences (Deemed-To-Be-University). The
following chart shows actual process of jelly making using
extracted pigments.
Figure 1: Jelly Making Using Extracted Pigments
Procurement of raw materials
Fresh citrus fruit varieties i.e. Sour orange (Citrus
aurantium) and Grape fruit (Citrus paradisi) were purchased
from local market of Allahabad. At the time of fruit selection
care was taken that fruits should be tender and free from
damage.
Experimental plan
Based upon reported literature, the experimental plan was
devised. Fruits were cleaned, washed and peeled. The peels
were treated with antioxidants and dried. After drying, the
carotenoid pigments were extracted and identified by HPLC.
Further, the stability of pigments was analyzed by studying
the effect of pH, oxidation and adsorption of concentrated
pigments on solid supports. Finally the jelly was prepared
using the extracted pigments and its sensory analysis was
done. Experimental variables / parameters and there levels
and descriptions are given in following table:-
Paper ID: NOV163451 841

International Journal of Science and Research (IJSR) ISSN (Online): 2319-7064
Index Copernicus Value (2013): 6.14 | Impact Factor (2015): 6.391
Volume 5 Issue 5, May 2016
www.ijsr.net Licensed Under Creative Commons Attribution CC BY
Table 1: Experimental Plan
Sr. No. Parameters/
Variables
Levels Description
1.
2.
3.
4.
Product
Raw materials
Ingredients
Treatments
1
2
3
4
Jelly prepared with the
extracted pigments.
Peels of two citrus varieties:
Sour orange and Grapefruit
Water, Sugar, Pectin, Citric
acid, Extracted pigments
from Sour orange and
Grape fruit peels.
Extraction and
identification of carotenoid
pigments, Studying the
effect of pH and oxygen on
the pigments, Selection of a
suitable carrier,
Organoleptic evaluation of
the prepared jelly from the
extracted pigments.
2.1 Equipment Used
Electric grinder, Oven, Rotary evaporator,
Spectrophotometer MODEL NO.305 (Range: 340-960 nm),
SHIATS used for the measurement of transmittance.
2.2 Methods
2.2.1 Sample preparation
The outer layer called flavedo of two mature citrus varieties
i.e. Sour orange and grape fruit were prepared as follows:
Each sample was divided into three parts; the first part was
treated with 0.1% of α-tocopherol (w/w) as natural
antioxidant. The second part was treated with 0.1% of
butylated hydroxy toluene (BHT, w/w) as artificial
antioxidant. The third part was untreated sample (as control).
The samples were dried in oven at 45˚C for 72 hours and
ground into fine powders in an electric grinder. Three
replicates per sample were taken for further analysis.
Figure 1: Drying of peels in hot air oven
Figure 2: Powder obtained from dried peels
2.2.2 Extraction of natural pigments
Colorants were extracted from citrus samples using high-
performance liquid chromatography. A known volume of
some solvents (30ml of each ) (Acetone, Petroleum ether,
Hexane, Ethanol 90%, Ethyl acetate, Methylene chloride)
was mixed with a known weight of dry samples(0.5 gm.) in
dark bottles and kept overnight and then filtered on paper
Whatman No.1. The filtrate was made upto a known volume
(100ml.) by the same solvent. The absorbance was measured
by a spectrophotometer, Model no. 305(Range:-340-960nm)
at 440, 644 and 662 nm.
2.2.3 Identification of natural pigments
Carotenoid pigments extracted from citrus samples were
identified by High Performance Liquid Chromatography
(HPLC) apparatus in the following ways;-
2.2.3.1 Chromatography
The HPLC system comprised of a dual piston solvent
delivery pump. The column system consisted of a 10 mm, 5
pm ODS2 metal-free guard column, with a 100 X 4.6 mm, 5
pm 0DS2 metal-free column connected to a 250 x 4.6 mm, 5
mm analytical modified by the replacement of metal frits
with ‘bio-compatible’ Teflon frits. Column connections
were made with PEEK (poly ether ether ketone) tubing. The
column temperature was maintained at 22.5˚+0.1˚C using a
column water jacket, with a thermostatically controlled
circulating water bath. The mobile phase consisted of
acetonitrile, methanol, dichloromethane
(MeCN:MeOH:DCM) 75 : 20 : 5 v/v/v, containing 0.1%
butylated hydroxytoluene (BHT) as an antioxidant and
0.05% triethylamine (TEA). The methanol contained 0.05 M
ammonium acetate. The prepared mobile phase was filtered
through a 0.5 pm PTFE membrane filter and degassed using
ultrasonic agitation. The solvent reservoir was equipped
with a helium degassing facility. The flow rate was 1.5
ml/min. Samples were injected via a syringe loading sample
injector fitted with a 50 µl loop. Peak responses were
measured at 450 nm using a variable wavelength UV/Vis
monitor with an output to a chromatographic data handling
system which permitted manual manipulation of peak
integration. A diode array detector was coupled to the
UV/Vis monitor to assess peak homogeneity and confirm
spectral identity of carotenoids.
2.2.3.2 Sample extraction
Duplicate 10 g aliquots of the ground sample were placed in
conical flasks together with 1 g solid magnesium carbonate
Paper ID: NOV163451 842

International Journal of Science and Research (IJSR) ISSN (Online): 2319-7064
Index Copernicus Value (2013): 6.14 | Impact Factor (2015): 6.391
Volume 5 Issue 5, May 2016
www.ijsr.net Licensed Under Creative Commons Attribution CC BY
(Fisons) to neutralize any organic acids. Fifty ml of
tetrahydrofuran and methanol (1: 1 v/v THF : MeOH) were
added along with an internal standard(/3-apo-8’-carotenal or
echinenone) appropriate for the type of sample. Carotenoids
were extracted from the food matrix by homogenizing for 1
min using an ultra-turrax homogenizer The resulting
suspension was filtered through a glass fibre filter pad in a
buchner funnel under vacuum. The flask and homogenizer
were washed with 50 ml THF/MeOH and the washing
filtered. The filter pad was washed with two further 50 ml
aliquots of THF : MeOH. The combined THF : MeOH
filtrates were transferred to a separating funnel. Fifty ml
petroleum ether (40-60’ fraction, containing 0.1% BHT) and
50 ml 10% sodium chloride solution were added and mixed
by careful shaking. The lower THF/MeOH/aqueous phase
was drawn off and the upper petroleum ether phase was
transferred to a 250 ml evaporating flask. The
THF/MeOH/aqueous phase was extracted two more times
with 50 ml aliquots of petroleum ether. The petroleum ether
phases were combined in the flask and evaporated at 35°C in
a rotary evaporator to near dryness. Ten to fifteen ml of
petroleum ether was added and the residue redissolved by
ultrasonic agitation, transferred to a 25 ml evaporating flask
and evaporated just to dryness. The residue was redissolved,
by ultrasonic agitation, to a final volume of 5 ml in DCM. If
necessary this extract was saponified as described below,
otherwise it was diluted with the mobile phase to a suitable
concentration for HPLC analysis and filtered through a
0.45ppm PVDF syringe filter. All manipulations were
carried under gold fluorescent lighting.
2.2.3.3 Saponification
Four ml of the DCM extract from the extraction procedure
was saponified with an equal volume of loo/o potassium
hydroxide in MeOH (under nitrogen, in the dark) for 1 h at
room temperature. The carotenoids were extracted from the
KOH/methanolic phase by careful shaking with 20 ml
petroleum ether (40-60” fraction, containing 0.1% BHT),
and 20 ml 10% sodium chloride solution in a separating
funnel. The lower KOH/MeOH/aqueous phase was removed
to another separating funnel and was extracted two more
times with 20 ml aliquots of petroleum ether. The petroleum
ether phases were combined in a separating funnel and
washed with water until washings were neutral to pH paper.
The petroleum ether phase was transferred to a 100 ml
round-bottomed flask and dried in a rotary evaporator at
35°C. Ten to fifteen ml of petroleum ether were added and
the residue redissolved by ultrasonic agitation, transferred to
a 25 ml evaporating flask and evaporated just to dryness.
The residue was redissolved by ultrasonic agitation in 4 ml
DCM, diluted with mobile phase to a suitable concentration
for HPLC analysis and filtered through a 0.4 pm PVDF
syringe filter. All manipulations were carried out under gold
fluorescent lighting.
2.2.3.4 Internal standards
An internal standard was used to assess losses during the
extraction procedures. One of two standards was used
depending on the carotenoid profile of the sample. P-apo-
8’carotenal was used where possible. Both standards showed
similar recoveries during the extraction procedure.
2.2.3.5 Preparation of standard carotenoid solutions and
calibration
Lutein, α-carotene, β-carotene and β-apo-8’-carotenal were
dissolved in chloroform and made to volume with hexane to
give a final solvent ratio of 1 : 9 v/v. Echinenone and β-
cryptoxanthin were dissolved in 1 : 1 v/v
chloroform/hexane. Zeaxanthin was dissolved in
chloroform. All solvents contained 0.1% BHT. All solutions
were stored in air-tight screw-topped brown bottles.
Under nitrogen at -18°C. Prior to measuring absorbance, the
stock solutions were brought to room temperature and
filtered through a 0.45 pm PVDF syringe filter. An aliquot
of the solution was evaporated under nitrogen and diluted in
the appropriate solvent to give an approximate absorbance
reading of 0.5 AU and the exact absorbance measured using
a spectrophotometer equipped with a wavelength scanner to
assess the spectrum. The concentrations were calculated
using the appropriate extinction coefficients. Individual
working solutions of around 0.5-1.0 µg/ml were prepared
from stock solutions by evaporating an aliquot under
nitrogen and making to volume with mobile phase and their
‘purity’ assessed by HPLC analysis. ‘Purity’ of a carotenoid
was expressed as the peak area of that carotenoid as a
percentage of the total area of the chromatogram. The
concentration calculated from the absorbance reading was
corrected accordingly. The concentration of the stock
standard solutions and their purity were measured each time
a new working standard was prepared. A mixed working
standard solution was prepared, in mobile phase, from
individual stock solutions.
2.2.4 Stability of pigments
2.2.4.1 Effect of pH
Degradation of carotenoids extracted from citrus samples
caused by different pH values were measured. The retention
of carotenoids extracted from Sour orange and Grape fruit,
after seven days of refrigeration at 4˚C using different buffer
solution with pH values ranged from 2 to 9 was calculated.
Samples were prepared by dissolving appropriate amounts
of pigment in a 0.1M citric-phosphate buffer at a specific pH
value. Buffer solutions with pH values of 2.0 and 9.0 were
prepared by the addition of 1N HCL or 1N NaOH,
respectively. Percent pigment retention was calculated in
terms of:
% Pigment Retention= A2/A1 *100
Where: A1 is the initial light absorption value and A2 is the
light absorption value after 7 days of storage at 4°C.
2.2.4.2 Effect of oxidation
Samples of the carotenoids pigment solution were divided
into groups, the first group was exposed to aeration for 4
hours, and the other was exposed to nitrogen gas for 4 h,
then absorbance measurements were read by
spectrophotometer.
2.2.4.3 The adsorption of concentrated pigments on solid
supports
The collected extracts of carotenoids were concentrated by
removal of solvent in a rotary vacuum evaporator at 40˚C.
The concentrated pigments were adsorbed to solid matrices
(starch, dextrin, flour, lactose and arabic gum) in different
Paper ID: NOV163451 843

International Journal of Science and Research (IJSR) ISSN (Online): 2319-7064
Index Copernicus Value (2013): 6.14 | Impact Factor (2015): 6.391
Volume 5 Issue 5, May 2016
www.ijsr.net Licensed Under Creative Commons Attribution CC BY
ratios (1:1, 1:2, 1:3 and 1:4 carrier/pigment) and the
mixtures were dried in oven at 40˚C for 24 hours.
Plate 3: Pigment powders
2.2.5 Jelly Preparation
Jelly was prepared in the laboratory in the laboratory.
2.2.6 Organoleptic evaluation of jelly Samples of jelly were subjected to organoleptic evaluation.
The analysts were asked to evaluate color (10), clarity (10),
flavor (10), taste (10), texture (10), shape (10) and overall
acceptability (10).
2.2.7 Statistical analysis of the experimental results The results were analyzed by Two Way Anova by using
Statistical 7.0 software. Significant differences (p<0.05)
were determined by Duncans multiple range test.
3. Results and Discussion
3.1 Extraction of natural pigments
Carotenoid pigments content of Sour orange and Grape
fruits are shown in Table 4.1. The tabulated results showed
that, ethyl acetate was the most efficient solvent in extract of
carotenoid pigments from Sour orange and Grape. In Sour
orange samples, the total carotenoids was 5.35,4.23, 3.56,
4.55, and 3.00 mg/L for ethyl acetate, acetone 85%,
petroleum ether, n-hexane and ethanol, while in Grape fruit
samples, carotenoids were, 1.18, 1.23, 1.05, 0.45 and 0.31
mg/L for ethanol, respectively.
Therefore, it could be concluded that, the higher the
extraction yield of carotenoid pigments in Sour orange
referred to such samples could be considered as a good
source of carotenoids comparing to grape fruit.
Table 4.1: Effect of some solvents on extraction of
pigments (mg/L) Citrus
peels
Solvents Chlorophyll
A
Chlorophyll
B
Total
carotenoids
Sour
orange
Ethyl acetate 0.15 0.12 5.35
Acetone 85% 0.15 0.12 4.23
Petroleum ether 0.06 0.29 3.56
n-hexane 0.11 0.03 4.55
Ethanol 90% 0.02 0.31 3.00
Grape
fruit
Ethyl acetate 0.08 0.03 1.18
Acetone 85% 0.17 0.11 1.23
Petroleum ether 0.23 0.02 1.05
n-hexane 0.14 0.23 0.45
Ethanol 90% 0.08 0.18 0.31
Fig.4.1.1 Effect of some solvents on extraction of
pigments from Sour orange peels
Fig.4.1.2 Effect of some solvents on extraction of
pigments from Grapefruit peels
3.1.1 Determination and identification of carotenoids
The technique of HPLC has been widely applied to
investigate the composition of carotenoids extracted with
ethyl acetate method. HPLC is characterized by short
analysis time, high resolution, good reproducibility, and
little structural modification.
Data in Table 4.1.1 shows the carotenoid pigments
composition of Sour orange and Grape fruits, which were
separated based on their functional groups into nine
fractions for the Sour orange and six fractions for Grape
fruit.
Paper ID: NOV163451 844

International Journal of Science and Research (IJSR) ISSN (Online): 2319-7064
Index Copernicus Value (2013): 6.14 | Impact Factor (2015): 6.391
Volume 5 Issue 5, May 2016
www.ijsr.net Licensed Under Creative Commons Attribution CC BY
Table 4.1.1: Identification of carotenoid pigments of Sour
orange and Grape fruit. Types of Citrus peels Modified carotenoids %
Sour orange
Capsorubin 38.67
Zeaxanthin 3.90
Crytptoxanthin 4.49
Unidentified 0.23
Unidentified 0.52
Lutein 2.98
Canthaxanthin 4.90
Capsanthin 33.90
β-carotene 4.20
Grape fruit
Antheraxanthin 3.95
Violaxanthin 35.75
Lutein 3.92
Zeaxanthin 45.22
Cryptoxanthin 3.50
β-carotene 4.92
Figure 4.1.1: Identification of carotenoid pigments from
Sour Orange peels
Figure 4.1.2: Identification of carotenoid pigments from
Grapefruit peels
3.2 Stability of Pigments
3.2.1 The effect of pH value
The retention of carotenoids extracted from Sour orange and
Grape fruit, after seven days of refrigeration at 4˚C using
different buffer solution with pH values ranged from 2to 9
was calculated and the results are presented in Table 4.2.1.
The tabulated results showed that, increasing in pH value
increased retention of carotenoids (97.13%) until pH 7.0.
However, the retention percentage was increased from 45.36
and 39.53 at pH 2.0 to 97.13 and 96.43 at pH 7.0 for Sour
orange and Grape fruit, respectively. Then the retention
percentage was decreased to 79.36 and 77.76 at pH 9.0 for
the same samples, respectively.
Table 4.2.1: The effect of pH value on the stability of
carotenoids extracted from Sourorange pH
value
Sour orange peels Grape Fruit Peels
Retention
(%)
Degradation
(%)
Retention
(%)
Degradation
(%)
2 45.36 54.32 39.53 60.53
3 55.02 45.33 52.66 47.12
4 71.33 28.36 70.12 29.87
5 82.25 17.82 80.54 19.32
6 93.31 6.11 96.51 3.56
7 97.13 2.77 96.43 3.45
8 86.54 13.16 78.21 22.32
9 79.36 20.11 77.76 22.21
Figure 4.2.1: Effect of pH on the pigments extracted from
Sour Orange peels
Figure 4.2.2: Effect of pH on the pigments extracted from
Grapefruit peels
3.2.2 The effect of oxygen on carotenoids stability The results presented in Table 4.2.2 showed the effect of
oxygen on stability of carotenoids extracted from Sour
orange and Grape fruits treated with antioxidant (α-
tocopherol as natural antioxidant and BHT as synthetic
antioxidant) in solution of pH 7.0 after exposing to air for 4h
in comparison with that kept under nitrogen gas, then
absorption spectra was measured.
Concerning the data of untreated samples showed in Table
4.2.2, the retention rate of carotenoid extracted from Sour
orange was 89.90% followed 86.23% (Grape fruit) when
these samples were exposed to air for 4 h. Meanwhile, this
retention rate of Sour orange and Grape fruits carotenoids
was 95.62 and 98.87 % respectively, under nitrogen
conditions. In other words, the degree of degradation in Sour
orange carotenoids was lower than that of the Grape fruit;
meanwhile there was no pronounced decrease in the content
of these pigments when kept under untreated conditions.
Regarding to retention rate of carotenoids extracted from
Sour orange treated with α-tocopherol and BHT presented in
Paper ID: NOV163451 845

International Journal of Science and Research (IJSR) ISSN (Online): 2319-7064
Index Copernicus Value (2013): 6.14 | Impact Factor (2015): 6.391
Volume 5 Issue 5, May 2016
www.ijsr.net Licensed Under Creative Commons Attribution CC BY
Table 4.2.2. The rate increases from 90.20% (control
sample) to 98.26% (α-tocopherol) and 93.11% (BHT), after
exposing to air for 4 h. Meanwhile, this retained reached to
100% under nitrogen gas conditions for either α-tocopherol
treatment or BHT treatment.
The retention rate of carotenoids from Grape fruit treated
with α-tocopherol and BHT presented in Table 4.2.2. After
exposing to air for 4 h, it was increased from 88.83%
(control) to 93.22% and93.11% respectively. On the other
hand, the retention rate of Grape fruit carotenoids recorded
maximum value (100%) when nitrogen gas was used for
both carotenoids treated with α-tocopherol treatment or
BHT. However, it can be concluded that α-tocopherol
treatment had the highest desirable effect on the carotenoid
stability followed by BHT treatment then control samples
for Sour orange and Grape fruits.
Table 4.2.2: Effect on the stability of carotenoids extracted
from Sour orange and Grape fruit.
Citrus Peels
Exposure to
air for 4 h
Under nitrogen
gas for 4 h
Retained
%
Degradation
%
Retained
%
Degradation
%
Sour orange
(Control)
90.20 9.80 95.62 4.38
Sour orange (α-
tocopherol)
98.26 1.74 99.87 0.13
Sour orange
(BHT)
95.34 4.66 99.64 00.36
Grape fruit
(Control)
89.53 10.47 98.87 1.13
Grape fruit (α-
tocopherol)
92.80 7.20 100 0.00
Grape fruit
(BHT)
92.90 8.10 99.82 00.18
Figure 4.2.1: Effect on the stability of carotenoids extracted
from Sour orange
Figure 4.2.2: Effect on the stability of carotenoids extracted
from Grapefruit
3.3 Adsorption of colorants
Trials were made to select a suitable carrier for coating the
carotenoid to keep and store it in a way by which it could be
easily used. The data obtained for the adsorption of
carotenoids extracted from Sour orange as a natural food
(1:1, 2:1, 3:1, 4:1 pigment: carrier w/w) are given in Table
4.3. These results indicated that, lactose adsorbent had the
highest carotenoid concentrations (1550, 1900, 2150 and
2500 mg/100 gm) at all studied ratios, respectively, followed
by starch. Also, from the same table it could be noticed that
Arabic gum had the lowest carotenoid concentrations at all
studied ratios. Lactose was the most effective adsorbent
coated carrier material for red colorant extracted from Sour
orange followed by starch. On the other hand, it could be
observed from Table 7 that the adsorption of carotenoids
extracted from Grape fruit recorded the maximum
concentrations when starch was used as carrier, while the
minimum concentrations were recorded with Arabic gum.
Generally, the obtained results proved that, the best carrier
for yellow pigment extracted from Grape fruit was the
starch, while the worst carrier was the Arabic gum.
Table 4.3: Color concentration (mg/100gm carrier) of
extracted carotenoids from Sour orange and Grape fruits
with different carriers at different ratios (w/w) Pigment/
carrier (w/w)
Applied Carriers
Lactose Starch Flour Dextrin Arabic gum
Sour orange mg/100gm
1:1 1550 950 856 750 82.28
2:1 1900 1200 850 910 127.76
3:1 2150 1700 1260 1350 435.25
4:1 2500 2110 1450 1480 623.9
Grape fruit mg/100gm
1:1 400 375 370 320 84.8
2:1 780 760 690 550 122.4
3:1 1000 1200 985 728 163.8
4:1 1244 1550 1340 936 195.2
3.4 Organoleptic evaluation of jelly
Sensory properties of jelly with different ratios (0.0066,
0.0133 and 0.0266%) of carotenoid pigments extracted from
Sour orange peels were evaluated. Organoleptic
characteristics of jelly samples were determined in respect to
Paper ID: NOV163451 846
International Journal of Science and Research (IJSR) ISSN (Online): 2319-7064
Index Copernicus Value (2013): 6.14 | Impact Factor (2015): 6.391
Volume 5 Issue 5, May 2016
www.ijsr.net Licensed Under Creative Commons Attribution CC BY
commercial jelly sample as control samples and the results
were tabulated in Table 4.4. From the noticed data, it could
be noticed that, addition of carotenoids by 0.0066% led to
insignificant increase in recorded color value comparing to
control sample. On the other hand, only the third addition
ratio had significant decrease in respect to control sample.
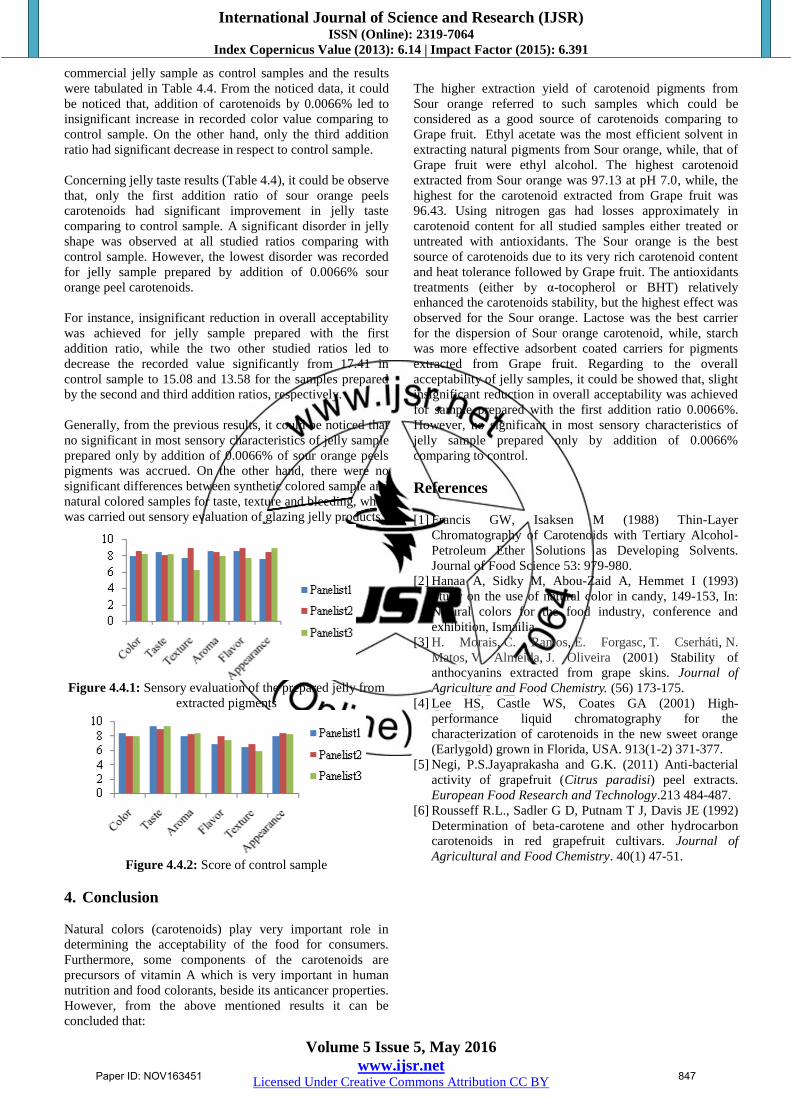
Concerning jelly taste results (Table 4.4), it could be observe
that, only the first addition ratio of sour orange peels
carotenoids had significant improvement in jelly taste
comparing to control sample. A significant disorder in jelly
shape was observed at all studied ratios comparing with
control sample. However, the lowest disorder was recorded
for jelly sample prepared by addition of 0.0066% sour
orange peel carotenoids.
For instance, insignificant reduction in overall acceptability
was achieved for jelly sample prepared with the first
addition ratio, while the two other studied ratios led to
decrease the recorded value significantly from 17.41 in
control sample to 15.08 and 13.58 for the samples prepared
by the second and third addition ratios, respectively.
Generally, from the previous results, it could be noticed that
no significant in most sensory characteristics of jelly sample
prepared only by addition of 0.0066% of sour orange peels
pigments was accrued. On the other hand, there were no
significant differences between synthetic colored sample and
natural colored samples for taste, texture and bleeding, when
was carried out sensory evaluation of glazing jelly products.
Figure 4.4.1: Sensory evaluation of the prepared jelly from
extracted pigments
Figure 4.4.2: Score of control sample
4. Conclusion
Natural colors (carotenoids) play very important role in
determining the acceptability of the food for consumers.
Furthermore, some components of the carotenoids are
precursors of vitamin A which is very important in human
nutrition and food colorants, beside its anticancer properties.
However, from the above mentioned results it can be
concluded that:
The higher extraction yield of carotenoid pigments from
Sour orange referred to such samples which could be
considered as a good source of carotenoids comparing to
Grape fruit. Ethyl acetate was the most efficient solvent in
extracting natural pigments from Sour orange, while, that of
Grape fruit were ethyl alcohol. The highest carotenoid
extracted from Sour orange was 97.13 at pH 7.0, while, the
highest for the carotenoid extracted from Grape fruit was
96.43. Using nitrogen gas had losses approximately in
carotenoid content for all studied samples either treated or
untreated with antioxidants. The Sour orange is the best
source of carotenoids due to its very rich carotenoid content
and heat tolerance followed by Grape fruit. The antioxidants
treatments (either by α-tocopherol or BHT) relatively
enhanced the carotenoids stability, but the highest effect was
observed for the Sour orange. Lactose was the best carrier
for the dispersion of Sour orange carotenoid, while, starch
was more effective adsorbent coated carriers for pigments
extracted from Grape fruit. Regarding to the overall
acceptability of jelly samples, it could be showed that, slight
insignificant reduction in overall acceptability was achieved
for sample prepared with the first addition ratio 0.0066%.
However, no significant in most sensory characteristics of
jelly sample prepared only by addition of 0.0066%
comparing to control.
References
[1] Francis GW, Isaksen M (1988) Thin-Layer
Chromatography of Carotenoids with Tertiary Alcohol-
Petroleum Ether Solutions as Developing Solvents.
Journal of Food Science 53: 979-980.
[2] Hanaa A, Sidky M, Abou-Zaid A, Hemmet I (1993)
Study on the use of natural color in candy, 149-153, In:
Natural colors for the food industry, conference and
exhibition, Ismailia.
[3] H. Morais, C. Ramos, E. Forgasc, T. Cserháti, N.
Matos, V. Almeida, J. Oliveira (2001) Stability of
anthocyanins extracted from grape skins. Journal of
Agriculture and Food Chemistry. (56) 173-175.
[4] Lee HS, Castle WS, Coates GA (2001) High-
performance liquid chromatography for the
characterization of carotenoids in the new sweet orange
(Earlygold) grown in Florida, USA. 913(1-2) 371-377.
[5] Negi, P.S.Jayaprakasha and G.K. (2011) Anti-bacterial
activity of grapefruit (Citrus paradisi) peel extracts.
European Food Research and Technology.213 484-487.
[6] Rousseff R.L., Sadler G D, Putnam T J, Davis JE (1992)
Determination of beta-carotene and other hydrocarbon
carotenoids in red grapefruit cultivars. Journal of
Agricultural and Food Chemistry. 40(1) 47-51.
Paper ID: NOV163451 847