extending the supercontinuum spectrum down to 200nm with few-cycle
TRANSCRIPT

Extending the supercontinuum spectrum down to200 nm with few-cycle pulses
N Aközbek1, S A Trushin2, A Baltuska2, W Fuß2,5,E Goulielmakis2, K Kosma2, F Krausz2, S Panja2,M Uiberacker2, W E Schmid2, A Becker3, M Scalora4
and M Bloemer4
1 Time Domain Corporation, 7057 Old Madison Pike, Huntsville,AL 35806, USA2 Max-Planck-Institut für Quantenoptik, D-85748 Garching, Germany3 Max-Planck Institut für Physik Komplexer Systeme, Nöthnitzer Str.,D-01187 Dresden, Germany4 Charles M. Bowden Research Center, Research Development and EngineeringCenter, Redstone Arsenal, AL 35898, USAE-mail: [email protected] and [email protected]
New Journal of Physics 8 (2006) 177Received 26 May 2006Published 5 September 2006Online at http://www.njp.org/doi:10.1088/1367-2630/8/9/177
Abstract. By focusing 805 nm pulses of low energy (0.2–1 mJ) intoatmospheric-pressure argon, a supercontinuum is generated with a short-wavelength cutoff of 640, 250 and 210 nm for initial pulse durations of 45, 10 and6 fs, respectively. It is shown numerically that the large shift of the UV cutoff andmany features of the spectrum are caused by terms beyond the slowly-varying-envelope approximation (SVEA). Their effect on pulse compression and filamentlength is also discussed.
5 Author to whom any correspondence should be addressed.
New Journal of Physics 8 (2006) 177 PII: S1367-2630(06)25619-21367-2630/06/010177+12$30.00 © IOP Publishing Ltd and Deutsche Physikalische Gesellschaft

2 DEUTSCHE PHYSIKALISCHE GESELLSCHAFT
Contents
1. Introduction 22. Experimental method and results 33. Theoretical results and discussion 44. Conclusion 10Acknowledgments 10References 10
1. Introduction
Supercontinuum generation is a phenomenon first observed 36 years ago [1] and since then hasbeen widely studied in various optical media including gases, condensed matter and engineeredmicrostructures such as photonic crystal fibres [2, 3]. Some of the latest developments can befound in a special issue on continuum generation in [3], and recent reviews on self-focusingand filamentation of femtosecond pulses are available [4, 5]. Spectral broadening, generating thecontinuum, is in general described by self-phase modulation [6]. In bulk media, there is a certainpower threshold above which continuum generation is initiated, which in general coincides withthe threshold of self-focusing [2]. Furthermore, it has been shown that in solid media there is aband-gap energy threshold, below which no continuum generation is observed [7]. In additionto self-phase modulation, other effects such as self-steepening and space-time focusing [8] maybecome important. Therefore, the physical mechanisms that contribute to continuum generationcan be complex. An important feature of continuum generation is the UV cutoff wavelength. Itseems to be limited by a number of effects such as intensity clamping and plasma generation[9], as well as linear chromatic dispersion [10]. However, using long pulses (50–150 fs) and highpowers it was recently shown that a third harmonic is generated in air, which undergoes spectralbroadening due to cross phase modulation [11]–[13]. It was suggested in these studies that the UVcutoff of the continuum spectra can thereby be further extended into the UV, when the broadenedspectra of the fundamental and third harmonic in air [12, 13] and of higher-order harmonics inargon [14, 15] merge together. We show below that with few-cycle pulses, harmonics are notrequired to explain the observed spectra.
Recently we demonstrated that focusing of 10 fs Ti-sapphire laser pulses of moderate energy(�0.3 mJ) into atmospheric-pressure argon (focal length 1 m) produces collimated radiationwith a continuous spectrum (supercontinuum) extending down to 250 nm [16]. The radiationis produced under conditions where self-focusing and filamentation occur. Increasing the pulseenergy to slightly above 0.35 mJ caused a breakdown into multiple filaments and a shift of theUV cutoff to longer wavelengths. With longer pulses (50–150 fs), UV cutoffs of similar or evenshorter wavelengths have only been obtained with 10–100 times higher powers under conditionsof multiple filamentation in air and other gases [13]–[15]. In addition, much longer interactionlengths are required in these cases. Clearly, ultrashort pulse durations down to a few cycles arethe reason that only moderate powers were needed in our study [16]. In a simple theory basedon self-phase modulation by the optical Kerr effect only, the total frequency spread �ω of thesupercontinuum is predicted to be �ω ∝ τ−1
p z, that is, proportional to the inverse pulse durationand the interaction length at high intensity [17]. To check how far the cutoff can actually be
New Journal of Physics 8 (2006) 177 (http://www.njp.org/)

3 DEUTSCHE PHYSIKALISCHE GESELLSCHAFT
pushed into the UV, we measured supercontinuum spectra using pulses of τp = 45 fs down to6 fs and different interaction lengths z. A simple proportionality to τ−1
p z is not confirmed andin principle cannot be expected, because continuum generation in the case of few-cycle pulsesinvolves effects beyond a simple self-phase modulation model. Hence, we use a model thatincludes higher-order terms such as self-steepening and show that many features of the observedspectra can be reproduced. The experimental results thus provide a simple test case for themodel. In contrast to previous studies, complications such as multiple filamentation, averagingover many pulses or molecular effects such as stimulated Raman scattering are avoided in ourexperiment.
The supercontinuum produced by the short pulses not only provides a large bandwidth forspectroscopy, but might also be an attractive and rugged source of short or compressible pulsestunable over such a wide wavelength range. In fact, the range near 800 nm has been furthercompressed in Zürich to 5.1 fs [18]. However, valence excitation of molecules usually requireswavelengths in the UV spectral region. The supercontinuum is broad enough that pulses in thisregion with near 1 fs duration could be calculated in the transform limit (which would requirea smooth spectral phase). Sub-femtosecond pulses in the soft x-ray region, suitable for probingafter such an excitation, are already available [19]. On the other hand, our first attempt at pulsecompression using radiation cut out near the UV cutoff reached a pulse duration of 70 fs, whichis still far from the transform limit [16]. It would therefore be desirable to understand in moredetail the properties of this radiation, in particular near the UV cutoff, and how it depends on theinitial laser pulse parameters. The model calculations presented here also serve this purpose.
2. Experimental method and results
The experimental method is described in [16]. Briefly, we focused up to 1 mJ of the 45 fs pulses ofa commercial Ti-saphire laser system (800 nm) by an f = 2 m concave mirror into a windowlessfirst glass cell (length 1.5 m) with slowly flowing argon at ambient pressure (950 mbar). Afterrecollimation and reflection from chirped mirrors, the pulses had a duration of 10 fs. By a variablediaphragm they were reduced in diameter (�5 mm) and energy (�0.35 mJ) and then refocused(f = 1 m) into a second such cell. The emerging radiation was integrated over its cross-sectionbefore analysis took place in a spectrograph. The resulting spectrum ‘10 fs, 0.35 mJ’ is shownin figure 1(a). The spectrum ‘45 fs, 1 mJ’ in this figure was obtained in the same setup byskipping the first cell and the chirped mirrors. The results with the pulse length τp = 6 fs andenergy 0.2 mJ were obtained by focusing pulses of this duration (from the laser system LWS01 atGarching, described in [20]) into the second cell. The two shorter pulses have the same peak power(33–35 GW) and the longer one is slightly weaker (22 GW).
It is obvious from figure 1(a) that the shorter the pulses, the farther in the UV is the cutoff.It is pushed from 250 to 210 nm in going from 10 to 6 fs. This displacement is much smallerthan for the pair 45/10 fs. It is also smaller than a frequency extension �ω proportional to τ−1
p ,that was suggested in [16] (see also [17]). This expectation was based on the idea that Kerr-effect self-phase modulation contains the derivative of the intensity I and that the maximumdI/dt ∝ τ−1
p . However, in such a simple model ignoring higher-order terms and propagationeffects, the shifts of the phase and frequency should also be ∝ z, the interaction length at highintensity [16, 17]. We found that the length zf of the luminescing filament was indeed shorter withthe shortest pulses, as roughly judged by inspection: zf = 8–10, 12 and 7.5 cm for τp = 45, 10
New Journal of Physics 8 (2006) 177 (http://www.njp.org/)

4 DEUTSCHE PHYSIKALISCHE GESELLSCHAFT
200 300 400 500 600 700 800 900 1000
1E-3
0.01
0.1
1
Nor
mal
ized
inte
nsity
Wavelength / nm
Argonfocal length 1 m
6 fs, 0.2 mJ
10 fs, 0.35 mJ45 fs, 1 mJ
(a)
200 250 300 350 400 450 500 550
Wavelength / nm
0.01
0.1
1
Nor
mal
ized
inte
nsity
(b)
106
104
102
100
98D = 97 cm
Figure 1. (a) Spectra measured with different pulse durations by a broad-bandspectrometer. (b) Spectra measured by a UV spectrometer with τp = 10 fs,terminating filamentation at different distances D from the focusing mirror(the starting point for the calculations, z = 0, is at about D = 92 cm). The spectrain (a) are normalized at 800 nm, those in (b) at 520 nm. In (a), the featurewith maximum at 350 and minimum at 344 nm is an artefact of the broad-bandspectrometer.
and 6 fs, respectively; the reduced zf can thus partially compensate the larger shift by pulseshortening. The present calculation not only reproduces the spectra but also the change of thefilament length (see below).
Figure 1(b) shows the effect of controlling the filament length zf , using the 10 fs pulses.This length was varied by terminating filamentation by a pinhole of diameter 150 µm, placedin the focal region at various distances D from the focusing mirror [16]; the effect is based oneliminating the background reservoir (lower-intensity regions of the beam profile [21]–[23]) bythe pinhole [4, 24]. It can be seen that increasing D (increasing zf ) in fact initially shifts thecutoff to shorter wavelengths. But the last centimetres only give rise to an intensity increasearound 300–330 nm. (The maximum at 320 nm can also be recognized in figure 1(a) in the 10 fsspectrum.) This is also found in the calculations (see below).
We also checked whether the carrier-envelope phase of the 6 fs pulses has any effecton the spectrum. But the spectra were indistinguishable, whether sine or cosine pulses wereemployed. Hence the carrier-envelope phase does not play a significant role in the generation ofthe supercontinuum.
3. Theoretical results and discussion
In order to get insight into the various nonlinear contributions to the continuum generation, wecalculate numerically the propagation of the electric field E(r, z, t) = A(r, z, t)e−iω0t+ikz + c.c.,where A(r, z, t) is an envelope function (normalized so that |A|2 is the intensity). Here, we adapta propagation equation (equation (1)) for A, that reaches beyond the slowly-varying-envelopeapproximation (SVEA). It was introduced by Brabec and Krausz [25, 26] and is referred to as theslowly-evolving-wave approximation. It was shown to be valid even for one-cycle pulses, if the
New Journal of Physics 8 (2006) 177 (http://www.njp.org/)

5 DEUTSCHE PHYSIKALISCHE GESELLSCHAFT
difference of group and phase velocities is small enough [25]. Here, the underlying envelopepropagation equation is written in the retarded coordinate frame (τ = t − z/vg) as in [27].
(i∂
∂z+
1
2kT−1∇2
⊥ − k′′
2
∂2
∂τ2− i
k′′
6
∂3
∂τ3+ Tn2k0|A|2 − e2
2ε0kmec2Ne
)A(r, z, τ) = 0 (1)
This equation contains higher-order terms going beyond the SVEA in the form of the operator
T =(
1 + i 1ω0
∂
∂τ
). The SVEA is recovered by setting T = 1. The derivative terms in T are expected
to become more important with shorter pulses (initial duration τp), in particular if the numberof cycles per pulse (= ω0τp/2π) is small. These terms are responsible for effects such as self-steepening and space-time focusing [8], [25]–[27].
As compared to [27], we have neglected any time dependence of the nonlinear refractiveindex n2 (which would be caused by the Raman effect in molecular gases). However, equation (1)includes all the main linear and nonlinear effects such as self-focusing, diffraction, plasmageneration, group-velocity dispersion, and self-steepening. Plasma (electron density Ne)generation is calculated by
∂Ne
∂τ= (N0 − Ne)σ
(n)|A|2n, (2)
where N0 is the neutral gas density. The ionization rate is fitted by a power law of the form σ(n)In
with σ(n) = 1.93 × 10−104 s−1(cm2 W−1)n and n = 8.22 as in [28]. For the nonlinear index ofAr, we used n2 = 1.4 × 10⁻¹⁹ cm2 W−1 [29]. A convenient parameter is the critical power forself-focusing Pcr, for which we use Pcr = λ2/2πn2 = 7.3 GW (λ = 800 nm). Both second- andthird-order group velocity dispersion (with coefficients k′′ = 0.2 fs2 cm−1 and k′′′ = 0.1 fs3 cm−1)are included in equation (1). Group velocity dispersion is not negligible in the current case, eventhough the nonlinear interaction length (filament length ≈ 10 cm) is clearly shorter than thedispersion length (Ldis = τ2
p/(4 ln2k′′) = 180 cm for an initial pulse duration of τp = 10 fs).The numerical simulations were carried out using input conditions close to those of the
experiment. Since up to the self-focusing distance, the propagation could mainly be describedby linear effects, the input field for the calculations was taken as a collimated beam with a beamradius of 0.2 mm, which is taken as starting point (z = 0) for the propagation. This point is at adistance from the focusing mirror of D ≈ 92 cm. Different values of the critical power Pcr andthe power itself P0 were tried out. With Pcr = 7.3 GW, which is based on the published [29]n2 value (see above) and P0 = 3Pcr, we obtain the best agreement with the experiment for thecutoff wavelength and the position of the maximum near 300 nm.
Figure 2 shows spectra for the three pulse durations, calculated at different propagationdistances z, integrated over the beam cross-section. In particular in the short-wavelength part,the spectra and their dependence on τp and z are very well reproduced. (See below for the regionnear 800 nm.) The cutoff is strongly pushed to the UV on going from 45 to 10 fs and only alittle more on reducing the pulse duration to 6 fs, just as in the experiment. Even the absolutevalues of the cutoff wavelengths agree with the experiment. Also the shapes of the spectra fitwell: on increasing the pathlength z with the 10 fs pulses (figure 2(c)), the cutoff is not muchshifted between z = 10 and 15 cm (to be discussed below); instead, the intensity around 320 nmincreases, eventually giving rise to a maximum. With 6 fs, there is no clearly developed maximumin this region. Obviously, the model calculations recapture most of the experimentally observed
New Journal of Physics 8 (2006) 177 (http://www.njp.org/)

6 DEUTSCHE PHYSIKALISCHE GESELLSCHAFT
200 300 400 500 600 700 800 900 1000 1100 1200
1E-3
0.01
0.1
1
45 fs, 30 cm
10 fs, 20 cm
6 fs,15 cm
P0= 3Pcr, Pcr= 7.3 GW
Nor
mal
ized
inte
nsity
Wavelength / nm
(a)
200 300 400 500 600 700 800 900 1000 1100 1200
1E-3
0.01
0.1
1
6 fs, 3Pcr
z = 5, 7.5, 10, 12.5, 15 cm
Nor
mal
ized
inte
nsity
Wavelength / nm
(b)
200 300 400 500 600 700 800 900 1000 1100
1E-3
0.01
0.1
1
10 fs, 3Pcr
z = 5, 7.5, 10, 12.5, 15, 17.5, 20 cm
Nor
mal
ized
inte
nsity
Wavelength / nm Wavelength / nm
(c)
200 300 400 500 600 700 800 900 1000 1100
1E-3
0.01
0.1
1
45 fs, 3Pcr
z = 5, 10, 15, 20, 25, 30 cm
Nor
mal
ized
inte
nsity
(d)
Figure 2. (a) Spectra calculated for different pulse durations. (b) Spectracalculated for 6 fs at different z. (c) Spectra calculated for 10 fs at different z.(d) Spectra calculated for 45 fs at different z.
spectral features in the UV and we obtain a more than qualitative agreement between theory andexperiment.
The calculated halfwidths (�100 nm with 10 fs, for instance; figure 2) near 800 nm arelarger than observed (50–100 nm; figure 1). Also the maxima in this region, relative to the UVpart, are lower in the calculation. We believe that this difference is caused by low-intensityspatial (and temporal) wings of the beam, deviating from a Gaussian profile. In fact in [16], a red(800 nm) outer ring was observed, probably caused by diffraction at the input diaphragm. Dueto its low intensity, it is not expected to be greatly broadened, so that it contributes a narrow-halfwidth component to the spatially integrated spectrum. Another minor deviation concerns themodulations that are seen in the spectrum in particular between 800 and 500 nm. They have acoarser structure in the calculations (figure 2) than in the experiments (figure 1). However, theyare believed to result from interferences depending only on fine details of the propagation of theradiation [17], which do not carry much information.
It is worth mentioning that the calculations were done for a single laser pulse. In themeasurements, the spectra were averaged over 2 to about 10000 pulses, the latter only withthe broad-band spectrometer (which has low sensitivity in the UV) in the region of the UVcutoff. In the high-intensity region of the spectra of figure 1(a) (broad-band spectrometer) and inthe spectra with the UV spectrometer (figure 1(b)), where comparison is possible, no difference
New Journal of Physics 8 (2006) 177 (http://www.njp.org/)

7 DEUTSCHE PHYSIKALISCHE GESELLSCHAFT
200 300 400 500 600 700 800 900 1000 1100
1E-3
0.01
0.1
110 fs, P = 3Pcr
non-SVEAz = 20 cm
20
1510 z = 5 cm
Nor
mal
ized
inte
nsity
Wavelength / nm
Figure 3. SVEA spectra calculated for 10 fs at different z. The thinner line showsfor comparison the non-SVEA spectrum at z = 20 cm from figure 2(a).
could be recognized between different degrees of averaging. In particular, fine spectral featuressuch as the modulations are fully reproducible. This is in contrast to previous experiments underconditions of multiple filamentation, where large pulse-to-pulse variations of the spectra wereobserved (e.g. in [14]) and smooth spectra were only obtained by averaging.
It is also worth noting that the good agreement in the UV (obtained for the few-cycle pulses)is obtained without taking any third-harmonic generation into account. Previous observationsof such broad continua (at higher powers in air with longer pulses) invoked co-propagationof the third harmonic with the fundamental, its broadening by cross-phase modulation andeventual merging with the longer-wavelength continuum [11]–[13]. Moreover, this process couldbe noncritically phase matched, and the third-harmonic frequency can be shifted [30]. However,in our experiment with few-cycle pulses and relatively weak power and a single filament withlong paths in Ar, a third harmonic was weaker by at least two orders of magnitude than thesupercontinuum (Trushin et al, to be published).
Continuum generation usually involves many effects, and in some cases it is difficult toisolate the individual contributions. To obtain further physical insight, we compare the spectralbroadening in the framework of the usual SVEA with the non-SVEA propagation models. In theformer, we omitted from equation (1) the non-SVEA term by setting T = 1. The comparison isshown in figure 3.
Obviously the SVEA model gives rise to much less broadening than observed, the cutoff issteadily blue-shifted in contrast to the experiment, and the calculated spectra do not have muchsimilarity with the UV part of the measured spectrum. (The halfwidth is practically unaffectedby the non-SVEA terms.) This is in contrast to the non-SVEA calculations (figure 2(c)), whichreproduce the broadening and every spectral feature in the UV. These features can therefore beconsidered as a clear signature of the crucial role of the non-SVEA terms for the propagationof few-cycle pulses, at least for the current set of parameters. This also gives credibility to thecalculated pulse shapes (see below), which are shortened by self-steepening due to the non-SVEAterms. These results are also in good agreement with the calculations of Gaeta [8] who was thefirst to show that even with longer pulses (100 cycles) self-steepening and space-time focusingeffects are important, which causes the steepening of the trailing edge of the pulse, resulting ina broad blue-shifted pedestal spectrum (see also [27]).
New Journal of Physics 8 (2006) 177 (http://www.njp.org/)
8 DEUTSCHE PHYSIKALISCHE GESELLSCHAFT
0 5 10 15 20 25 30
0.0
0.2
0.4
0.6
0.8
1.0
1.2
1.4
1.6
1.8
45 fs
10 fs
6 fs
P0 = 3Pcr
On-
axi
sel
ect
ron
dens
ity/1
017cm
−3
z cm−1
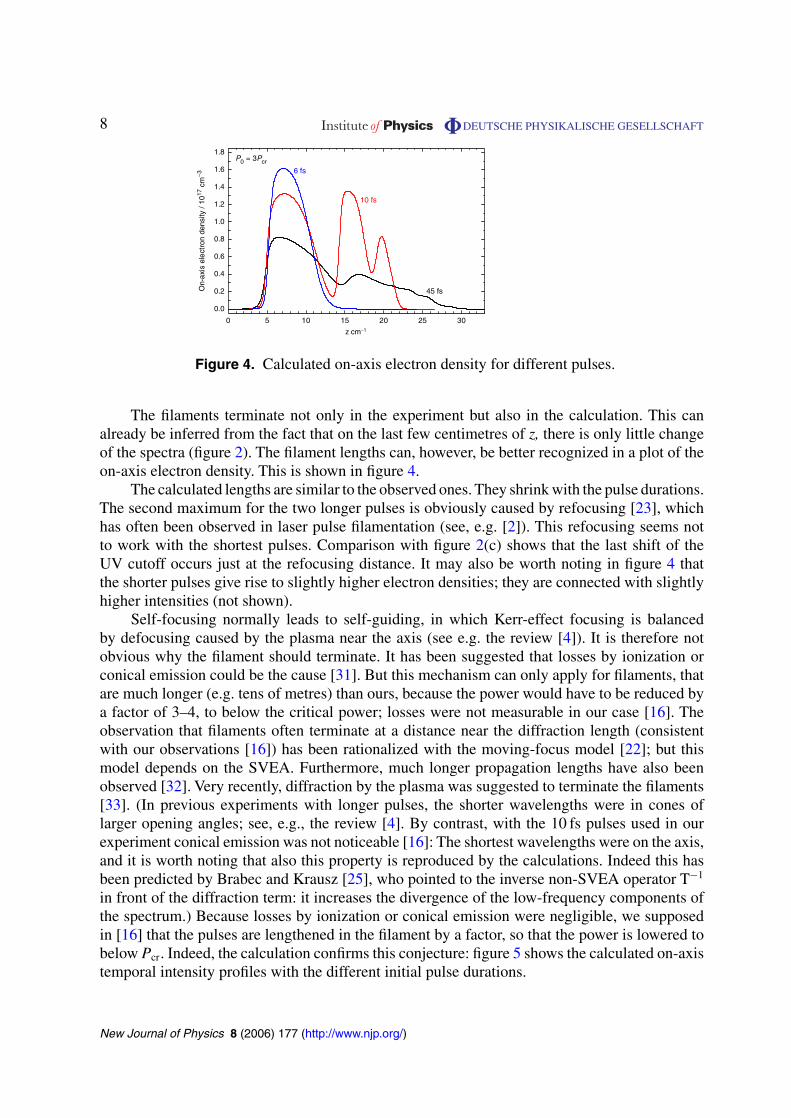
Figure 4. Calculated on-axis electron density for different pulses.
The filaments terminate not only in the experiment but also in the calculation. This canalready be inferred from the fact that on the last few centimetres of z, there is only little changeof the spectra (figure 2). The filament lengths can, however, be better recognized in a plot of theon-axis electron density. This is shown in figure 4.
The calculated lengths are similar to the observed ones. They shrink with the pulse durations.The second maximum for the two longer pulses is obviously caused by refocusing [23], whichhas often been observed in laser pulse filamentation (see, e.g. [2]). This refocusing seems notto work with the shortest pulses. Comparison with figure 2(c) shows that the last shift of theUV cutoff occurs just at the refocusing distance. It may also be worth noting in figure 4 thatthe shorter pulses give rise to slightly higher electron densities; they are connected with slightlyhigher intensities (not shown).
Self-focusing normally leads to self-guiding, in which Kerr-effect focusing is balancedby defocusing caused by the plasma near the axis (see e.g. the review [4]). It is therefore notobvious why the filament should terminate. It has been suggested that losses by ionization orconical emission could be the cause [31]. But this mechanism can only apply for filaments, thatare much longer (e.g. tens of metres) than ours, because the power would have to be reduced bya factor of 3–4, to below the critical power; losses were not measurable in our case [16]. Theobservation that filaments often terminate at a distance near the diffraction length (consistentwith our observations [16]) has been rationalized with the moving-focus model [22]; but thismodel depends on the SVEA. Furthermore, much longer propagation lengths have also beenobserved [32]. Very recently, diffraction by the plasma was suggested to terminate the filaments[33]. (In previous experiments with longer pulses, the shorter wavelengths were in cones oflarger opening angles; see, e.g., the review [4]. By contrast, with the 10 fs pulses used in ourexperiment conical emission was not noticeable [16]: The shortest wavelengths were on the axis,and it is worth noting that also this property is reproduced by the calculations. Indeed this hasbeen predicted by Brabec and Krausz [25], who pointed to the inverse non-SVEA operator T−1
in front of the diffraction term: it increases the divergence of the low-frequency components ofthe spectrum.) Because losses by ionization or conical emission were negligible, we supposedin [16] that the pulses are lengthened in the filament by a factor, so that the power is lowered tobelow Pcr. Indeed, the calculation confirms this conjecture: figure 5 shows the calculated on-axistemporal intensity profiles with the different initial pulse durations.
New Journal of Physics 8 (2006) 177 (http://www.njp.org/)
9 DEUTSCHE PHYSIKALISCHE GESELLSCHAFT
−12 −10 −8 −6 −4 −2 0 2 4 6 8 10 12 14 16 180
1
2
3
4
56 fs, P0 = 3Pcr
Leading edge
0
10
5
z = 15 cm
Nor
mal
ized
on-
axis
inte
nsity
(t 0−z/c) / fs
(a)
z = 20 cm
(t0−z/c) / fs
−20 −15 −10 −5 0 5 10 15 20 25 30
0
1
2
3
4
5
10 fs, P0 = 3Pcr
0
5
10 15
Leading edge
Nor
mal
ised
on-
axis
inte
nsity
(b)
z = 30 cm
45 fs, P0 = 3Pcr
(t0−z/c) / fsLeading edge
Nor
mal
ised
on-
axis
inte
nsity
(c)
0.0
0.5
1.0
1.5
2.0
2.5
3.0
3.5
0
5
10
15
20
25
−100 −80 −60 −40 −20 0 20 40 60 80 100 120
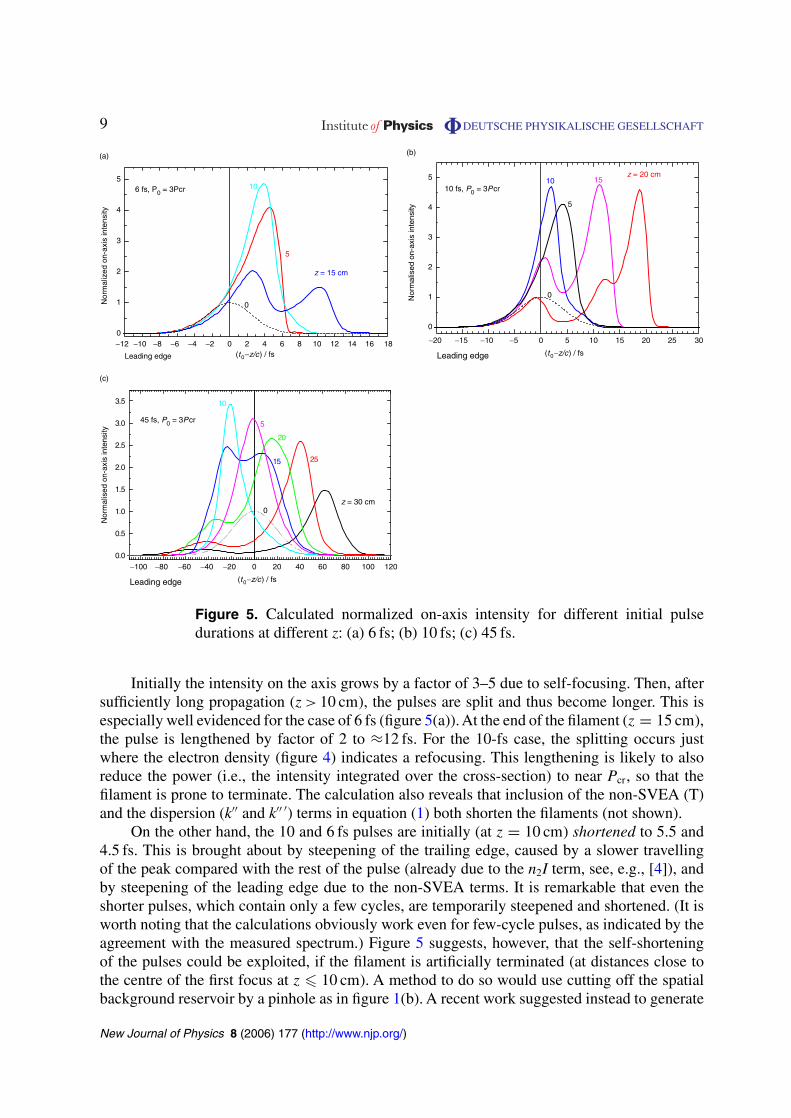
Figure 5. Calculated normalized on-axis intensity for different initial pulsedurations at different z: (a) 6 fs; (b) 10 fs; (c) 45 fs.
Initially the intensity on the axis grows by a factor of 3–5 due to self-focusing. Then, aftersufficiently long propagation (z > 10 cm), the pulses are split and thus become longer. This isespecially well evidenced for the case of 6 fs (figure 5(a)). At the end of the filament (z = 15 cm),the pulse is lengthened by factor of 2 to ≈12 fs. For the 10-fs case, the splitting occurs justwhere the electron density (figure 4) indicates a refocusing. This lengthening is likely to alsoreduce the power (i.e., the intensity integrated over the cross-section) to near Pcr, so that thefilament is prone to terminate. The calculation also reveals that inclusion of the non-SVEA (T)and the dispersion (k′′ and k′′ ′) terms in equation (1) both shorten the filaments (not shown).
On the other hand, the 10 and 6 fs pulses are initially (at z = 10 cm) shortened to 5.5 and4.5 fs. This is brought about by steepening of the trailing edge, caused by a slower travellingof the peak compared with the rest of the pulse (already due to the n2I term, see, e.g., [4]), andby steepening of the leading edge due to the non-SVEA terms. It is remarkable that even theshorter pulses, which contain only a few cycles, are temporarily steepened and shortened. (It isworth noting that the calculations obviously work even for few-cycle pulses, as indicated by theagreement with the measured spectrum.) Figure 5 suggests, however, that the self-shorteningof the pulses could be exploited, if the filament is artificially terminated (at distances close tothe centre of the first focus at z � 10 cm). A method to do so would use cutting off the spatialbackground reservoir by a pinhole as in figure 1(b). A recent work suggested instead to generate
New Journal of Physics 8 (2006) 177 (http://www.njp.org/)
10 DEUTSCHE PHYSIKALISCHE GESELLSCHAFT
a filament in a pressure gradient [34]. Another recent calculation predicted a pulse shorteningonly after (instead of before, as in our study) a pulse splitting [35]. The latter work describes thepropagation by an equation where the time dependence has been transformed to the frequencydomain; it also contains self-steepening terms. These terms could be checked by the spectralfeatures in the UV (which are easier to measure than the pulse shapes). Previous observation ofpulse self-compression, starting from longer pulses, invoked a higher-order refractive index (n4)[36]. (For other influences on pulse shortening also in condensed media, see [37] and literaturequoted there.)
From a practical point of view, it is important to know whether such short pulse durations arealso feasible all over the spectral region of this supercontinuum. The spectral phase dependencewas not investigated. However, the fact, that the whole pulse splitting can increase the pulseduration at the end of the filament by not more than a factor of two, gives an upper limit. Infull agreement with this limit, we were recently able to compress a spectral cut (halfwidth 9 nm)from the supercontinuum at 280 nm to about 30 fs, which is only twice as long as the pump pulse[38]. However, it is not clear whether this pulse duration is limited by intrinsic properties of thesupercontinuum or by the prism compressor.
4. Conclusion
We demonstrated experimentally and theoretically that already by focusing pulses of moderatepowers into argon—under conditions of self-focusing with only a single filament—a super-continuum is produced, whose UV cutoff is pushed to shorter wavelengths the shorter the pulses,reaching 210 nm starting with 6 fs. (A preliminary calculation indicates that with 4 fs pulses, onecould extend the spectrum far into the vacuum UV.) The calculations reproduce the observedspectra in the UV in all details. They also find that the filaments are shorter with shorter pulses,as observed. The filaments terminate due to group-velocity dispersion (although the dispersionlengths are much longer than the filaments) and non-SVEA terms. The calculations do notinvolve production (and co-propagation) of any third harmonic; its contribution to the spectraseems negligible, if one starts with few-cycle pulses. It was shown that non-SVEA terms alsoplay a crucial role for the continuum spectra generated by few-cycle pulses. The spectral featuresnear the UV cutoff can even be considered as a clear signature of these terms. They also causeself-compression of the pulses. To exploit this shortening, one should, however, limit the lengthof the filaments. It must still be investigated whether such short pulse durations are also feasibleall over the spectral region of this supercontinuum.
Acknowledgments
This work was supported by the Deutsche Forschungsgemeinschaft (project FU 363/1) and theEuropean Union’s Human Potential Program under contract MRTN-CT-2003-505138 (XTRA).
References
[1] Alfano R R and Shapiro S L 1970 Phys. Rev. Lett. 24 584–7[2] Alfano R R 1989 The Supercontinuum Laser Source (New York: Springer)[3] Zheltikov A 2003 Appl. Phys. B 77 143–59 (special issue on supercontinuum generation)
New Journal of Physics 8 (2006) 177 (http://www.njp.org/)

11 DEUTSCHE PHYSIKALISCHE GESELLSCHAFT
[4] Chin S L et al 2005 Can. J. Phys. 83 863–905[5] Kandidov V P, Kosareva O G, Golubtsov I S, Liu W, Becker A, Aközbek N, Bowden C M and Chin S L 2003
Appl. Phys. B 77 149–65[6] Agrawal G P 1995 Nonlinear Fiber Optics (San Diego, CA: Academic)[7] Brodeur A and Chin S L 1998 Phys. Rev. Lett. 80 4406–9
Brodeur A and Chin S L 1999 J. Opt. Soc. Am. B 16 637–50[8] Gaeta A L 2000 Phys. Rev. Lett. 84 3582–5[9] Liu W, Petit S, Becker A, Aközbek N, Bowden C M and Chin S L 2002 Opt. Commun. 202 189–97
Becker A, Aközbek N, Vijayalakshmi K, Oral E, Bowden C M and Chin S L 2001 Appl. Phys. B 73 287–90[10] Kolesik M, Katona G, Moloney J V and Wright E M 2003 Phys. Rev. Lett. 91 043905[11] Aközbek N, Iwasaki A, Becker A, Scalora M, Chin S L and Bowden C M 2002 Phys. Rev. Lett. 89 143901
Yang H et al 2003 Phys. Rev. E 67 015401 (R)Theberge F, Aközbek N, Liu W, Gravel J F and Chin S L 2005 Opt. Commun. 245 399–405Alexeev I, Ting A C, Gordon D F, Briscoe E, Hafizi B and Sprangle P 2005 Opt. Lett. 30 1503–5Theberge F, Liu W, Hosseini S A, Luo Q, Sharifi S M and Chin S L 2005 Appl. Phys. B 81 131–4Theberge F, Luo Q, Liu W, Hosseini S A, Sharifi S M and Chin S L 2005 Appl. Phys. Lett. 87 081108
[12] Aközbek N, Becker A, Scalora M, Chin S L and Bowden C M 2003 Appl. Phys. B 77 177–83[13] Theberge F, Liu W, Luo Q and Chin S L 2005 Appl. Phys. B 80 221–5
Berge L, Skupin S, Mejean G, Kasparian J, Yu J, Frey S, Salmon E and Wolf J P 2005 Phys. Rev. E 71 016602Mejean G, Kasparian J, Yu J, Frey S, Salmon E, Ackerman R, Wolf J P, Berge L and Skupin S 2006 Appl.
Phys. B 82 341–5[14] Nishioka H, Odajima W, Ueda K and Takuma H 1995 Opt. Lett. 20 2505–7[15] Nishioka H and Ueda K 2003 Appl. Phys. B 77 171–5[16] Trushin S A, Panja S, Kosma K, Schmid W E and Fuß W 2005 Appl. Phys. B 80 399–403[17] Manassah J T 1989 Simple models of self-phase and induced phase modulation The Supercontinuum Laser
Source ed R R Alfano (New York: Springer)[18] Hauri C P, Kornelis W, Helbing F W, Heinrich A, Couairon A, Mysyrowicz A, Biegert J and Keller U 2004
Appl. Phys. B 79 673–7Hauri C P, Guandalini A, Eckle P, Kornelis W, Biegert J and Keller U 2005 Opt. Express 13 7541–7
[19] Hentschel M, Kienberger R, Spielberger C, Reider G A, Milosevic N, Brabec T, Corkum P B, Heinzmann Uand Drescher M 2001 Nature 414 509–13
Baltuska A et al 2003 Nature 42 611–5Kienberger R et al 2004 Nature 427 817–21
[20] Kienberger R, Hentschel M, Spielmann C, Reider G A, Milosevic N, Heinzmann U, Drescher Mand Krausz F 2002 Appl. Phys. B 74 S3–9
[21] Nibbering E T J, Curley P F, Grillon G, Prade B S, Franco M A, Salin F and Mysyrowicz A 1996 Opt. Lett.21 62–4
Braun A, Korn G, Liu X, Du D, Squier J and Mourou G 1995 Opt. Lett. 20 73–5Mlejnek M, Kolesik M, Moloney J V and Wright E M 1999 Phys. Rev. Lett. 83 2938–41
[22] Brodeur A, Chien C Y, Ilkov F A, Chin S L, Kosareva O G and Kandidov V P 1997 Opt. Lett. 22 304–6[23] Mlejnek M, Wright E M and Moloney J V 1998 Opt. Lett. 23 382–4[24] Liu W, Gravel J F, Theberge F, Becker A and Chin S L 2005 Appl. Phys. B 80 857–60
Liu W, Theberge F, Arevalo E, Gravel J F, Becker A and Chin S L 2005 Opt. Lett. 30 2602–4[25] Brabec T and Krausz F 1997 Phys. Rev. Lett. 78 3282–5[26] Brabec T and Krausz F 2000 Rev. Mod. Phys. 72 545–91[27] Aközbek N, Scalora M, Bowden C M and Chin S L 2001 Opt. Commun. 191 353–62[28] Becker A, Plaja L, Moreno P, Nurhuda M and Faisal F H M 2001 Phys. Rev. A 64 023408[29] Nibbering E T J, Grillon G, Francois M A, Prade B S and Mysyrowicz A 1997 J. Opt. Soc. Am. B 14 650–60[30] Zheltikov A M 2005 Phys. Rev. A 72 043812
New Journal of Physics 8 (2006) 177 (http://www.njp.org/)

12 DEUTSCHE PHYSIKALISCHE GESELLSCHAFT
[31] Couairon A 2003 Appl. Phys. B 76 789–92[32] Lange H R, Grillon G, Ripoche J F, Franco M A, Lamouroux B, Prade B S, Mysyrowicz A, Nibbering E T J
and Chiron A 1998 Opt. Lett. 23 120–2[33] Liu W, Luo Q, Theberge F, Xu H L, Hosseini S A, Sarifi S M and Chin S L 2006 Appl. Phys. B 82 373–6[34] Couairon A, Franco M, Mysyrowicz A, Biegert J and Keller U 2005 Opt. Lett. 30 2657–9[35] Couairon A, Biegert J, Hauri C P, Kornelis W, Helbing F W, Keller U and Mysyrowicz A 2006 J. Mod. Opt.
53 75–85[36] Koprinkov I P, Suda A, Wang P Q and Midorikawa K 2000 Phys. Rev. Lett. 84 3847–50[37] Li R, Chen X, Liu J, Leng Y, Zhu Y, Ge X, Lu H, Lin L and Xu Z 2005 SPIE Proc. 5708 102–11[38] Trushin S A, Fuß W, Kosma K and Schmid W E 2006 Appl. Phys. B (doi 10.1007/S00340)
New Journal of Physics 8 (2006) 177 (http://www.njp.org/)