blue extension of optical fibre supercontinuum generation · blue extension of optical fibre...
TRANSCRIPT

Blue extension of optical fibre supercontinuum generation
This article has been downloaded from IOPscience. Please scroll down to see the full text article.
2010 J. Opt. 12 113001
(http://iopscience.iop.org/2040-8986/12/11/113001)
Download details:
IP Address: 155.198.206.144
The article was downloaded on 06/02/2011 at 12:52
Please note that terms and conditions apply.
View the table of contents for this issue, or go to the journal homepage for more
Home Search Collections Journals About Contact us My IOPscience

IOP PUBLISHING JOURNAL OF OPTICS
J. Opt. 12 (2010) 113001 (19pp) doi:10.1088/2040-8978/12/11/113001
REVIEW ARTICLE
Blue extension of optical fibresupercontinuum generationJ C Travers
Femtosecond Optics Group, Department of Physics, Imperial College London, Prince ConsortRoad, London SW7 2AZ, UK
E-mail: [email protected]
Received 9 June 2010, accepted for publication 13 September 2010Published 29 October 2010Online at stacks.iop.org/JOpt/12/113001
AbstractSupercontinuum generation in optical fibres pumped with high power pulse sources in themodulation instability regime is reviewed. The physical mechanisms and supercontinuumdynamics are described in detail. Routes to optimized output in terms of spectral flatness andparticularly blue and ultraviolet spectral extent are presented, including the use of cascaded andtapered photonic crystal fibres.
Keywords: supercontinuum generation, nonlinear fibre optics, solitons, modulation instability,four-wave mixing, photonic crystal fibre, fibre lasers
(Some figures in this article are in colour only in the electronic version)
1. Introduction
The use of picosecond and nanosecond duration laser pumppulses for supercontinuum generation in optical fibres hasenabled the creation of extremely high average power andbroadband light sources. Along with the inherent directionalityof supercontinuum sources, these properties are of clearpractical use. Perhaps more interesting is the soliton dynamicsinvolved in the supercontinuum generation, and our ability totailor the optical fibre design and pump source characteristicsto best harness these dynamics. That is the subject of thisreview.
A number of previous reviews of supercontinuumgeneration have been written, and a very large body of researchhas been devoted to understanding the physical processesinvolved. A comprehensive review was provided by Dudleyet al (2006) and one specific to fibre-based pump sources wasprovided by Genty et al (2007a). More recently the mainmechanisms have been concisely reviewed by Skryabin andGorbach (2010). Several books have also been published:Alfano (2006) provides an overview of supercontinuumgeneration, mostly concentrating on bulk optical set-ups andDudley and Taylor (2010) concentrates specifically on thesupercontinuum in optical fibres. Additionally the classic
reference texts of Agrawal (2007) and Taylor (1992) providea detailed overview of nonlinear fibre optics and solitonpropagation.
In this review, I specifically look at the modulationinstability initiated supercontinuum regime. This is generallyaccessed with pump pulses on the scale of picosecondsor longer (strictly speaking, it is related to the equivalentsoliton order of the pump pulse, see section 2.6). Thispump regime is relatively less represented in the literaturethan the femtosecond case, but provides easier access toa range of desirable supercontinuum properties, includinga high degree of spectral flatness and power, and relativesimplicity in implementation. The main disadvantage of thispump regime is the lack of mutual coherence between thespectral content of the continuum, which can be useful in anumber of situations; Genty et al (2007a) addresses this barrierspecifically. As a further specialization, after an overviewof the supercontinuum formation process, I review the maintechniques which have been applied to extend picosecond–nanosecond scale supercontinuum generation into the blue andultraviolet (UV) spectral regions, a focus of the last severalyears.
I proceed as follows. In the following section 2, I reviewthe general supercontinuum formation mechanism. In the
2040-8978/10/113001+19$30.00 © 2010 IOP Publishing Ltd Printed in the UK & the USA1

J. Opt. 12 (2010) 113001 Review Article
interests of focusing on the most important core stages inthe supercontinuum formation, I make no attempt to reviewthe essential nonlinear fibre optics theory required for a fullunderstanding, and reference should be made to the papers andbooks mentioned above for full details. Section 3 providesa brief historical review of the literature specific to ourparameter regime. Again, a comprehensive literature review ofsupercontinuum generation is beyond our scope, and the abovereferences, particularly chapter 1 of Dudley and Taylor (2010),should be consulted. Section 4 then goes on to review the useof cascaded fibres and tapered fibres as the primary, and mostsuccessful, route to blue and UV supercontinuum expansion,although a number of other techniques are also discussed.
2. Soliton-driven supercontinuum generationmechanisms
There is no exact definition of what constitutes a supercon-tinuum. In some cases pure self-phase modulation (SPM) isconsidered a supercontinuum and this is perfectly reasonablewhen one is generating octave-spanning SPM spectra. Infact, what can be regarded as the first demonstration ofsupercontinuum was produced by SPM (Alfano and Shapiro1970). However, the majority of supercontinua are drivenby soliton dynamics, and this is, in fact, always the case forlong pump pulses in the anomalous dispersion region (negativegroup velocity dispersion).
In the following subsections I walk through a set ofsimulations of a high power picosecond pulse propagatingthrough a fibre and generating a supercontinuum. Theparticular type of optical fibre used in an experiment isimportant in two respects: its linear optical properties,most essentially the dispersion of the fibre and its nonlinearproperties, a result of the nonlinear refractive index of the fibrematerial, and the effective area of the fibre (see appendix A).Whether the fibre is a conventional fibre, a photonic crystalfibre structure (PCF; see, e.g., (Knight 2003, Russell 2003) forreviews), or even a tapered conventional fibre, is of secondaryimportance. The physics is the same. By controlling, inparticular, the dispersion, one can exert great control over thesupercontinuum evolution, as we are about to see. Photoniccrystal fibres are popular simply because they provide readyaccess to this control.
In the simulations of this section, I use an examplePCF with an air-hole pitch � = 3.5 μm and an air-holediameter to pitch ratio of d/� = 0.8. These values are notparticularly special, they simply provide a physically concretefibre structure, similar to many of the fibres used in theexperiments described later. I also choose as an example pumpwavelength, 1070 nm, as obtained from ytterbium-doped fibreamplified systems, the most common and a very successfulpump source for visible, picosecond pumped supercontinuumgeneration (Rulkov et al 2005). Here I use a 10 ps, 12.6 kW(N = 600) soliton input. Again, these parameters are notspecial, but simply close to common experimental conditions.
The dispersion curve of the reference fibre is shownin figure 1(a). At 1070 nm this fibre is anomalouslydispersive (negative group velocity dispersion), with D =
Figure 1. The linear optical properties of the reference fibre used inmost of the simulations: (a) dispersion, (b) group velocity and(c) effective area.
24.6 ps nm−1 km−1 (in engineering units, alternatively β2 =∂2ωβ = −0.015 ps2 m−1, see appendix A). The zero-
dispersion wavelength is at 975 nm. From the frequencydependence of the effective mode area, shown in figure 1(c),and assuming a value of n2 = 2.74 × 10⁻²⁰ m2 W −1,(Milam 1998), this fibre has a nonlinear coefficient of γ =0.014 W−1 m−1 at 1070 nm. Note that the effective areachanges between 400 and 2000 nm, and this variation canbe strongly enhanced in tighter PCF structures. As we shallsee, the shape of the dispersion curve strongly affects thesupercontinuum evolution: it determines which frequencies arephase-matched and can therefore undergo coherent nonlinearprocesses; it also determines which frequencies are matchedin group velocity. The group velocity curve is shown infigure 1(b). This curve describes which frequencies can havesustained nonlinear interactions.
Figure 2 shows the spectral power evolution of thissimulation. The spectral smoothness as exhibited in thissupercontinuum is typical for this parameter regime, and oneof the great benefits of long pulse pumped supercontinua. Thesupercontinuum develops as follows:
(i) In the initial stages modulation instability (section 2.2)breaks the 10 ps input pulse into a series of ∼10 fs,∼ 100 kW peak power fundamental solitons (section 2.1).
2

J. Opt. 12 (2010) 113001 Review Article
Figure 2. The spectral power evolution of a 10 ps (FWHM) 12.6 kWpeak power (N = 600) soliton propagating through the referencefibre. The full colour scale is 60 dB. The dashed white lines indicatematched group velocity wavelengths.
(ii) The solitons excite dispersive waves in the normal disper-sion region through four-wave mixing and dispersive wavegeneration (section 2.3) and then start to self-frequencyshift due to intra-pulse Raman scattering (section 2.4).
(iii) While doing this they may trap the dispersive waves(section 2.5) and push them to shorter wavelengths. Atno point is soliton fission (section 2.6) observed to occur.
The trapping of the dispersive waves turns out to bea critical driver of the evolution of the short wavelengthedge of the supercontinuum in a single, constant core, fibre(Gorbach and Skryabin 2007a). The clearest evidence of thisoccurring, as will be explained in section 2.5, is the matching ingroup velocity between the solitons and dispersive waves. Toillustrate this, figure 2 shows the measured long wavelengthedge of the supercontinuum and shows an estimated lineof where the short wavelength edge would follow if groupvelocity matching was preserved (estimated using the groupvelocity curve of figure 1). It is clear that the calculations agreevery well with the numerical simulations.
We now consider each of these stages in detail in thefollowing subsections.
2.1. Soliton propagation
Supercontinuum generation, in which at least some part of thespectrum lies in the anomalous dispersion region, will involvesolitons. In fact, they are usually the dominant entity involvedin the supercontinuum dynamics. Rarely are ideal solitonsdirectly excited in a fibre, instead a pump pulse will eitherfission from a high-order soliton solution (see section 2.6)
or evolve due to modulation instability (see section 2.2).However, it is useful to review the basic properties of solitonsbefore approaching these topics.
The envelope field of a soliton is given by
Esol(z, t) = √P0sech
(t
τ0
)exp
(iz
β2
2τ 20
)(1)
where P0 is the soliton power and τ0 is the soliton duration.The soliton propagates with a shift of phase β2/(2τ 2
0 ); usingthe soliton equation given below in (3) we see that thisphase shift is equal to γ P0/2 and is therefore related tothe nonlinear refractive index, which modifies the solitonpropagation constant. Solitons propagate unchirped, thus allfrequency components of the soliton move with the groupvelocity of the soliton central frequency. This means thatthe effective propagation constant of a soliton with centralfrequency wsol at ω is
βsol(ω) = β(ωsol) + ∂ωβ(ωsol)[ω − ωsol] + γ P0
2. (2)
This means that βsol(ω) �= β(ω). This inequality leads to aninteresting interaction with dispersive waves, described below.The soliton power, P0, is given by
N2 = γ P0τ20
|β2| (3)
where the integer N is the soliton order. For N = 1the soliton is said to be fundamental and does not showany variation on propagation, except the acquisition of aflat phase. Higher-order solitons undergo periodic evolutionwith an order-independent length called the soliton period:zs = πτ 2
0 /(2|β2|). High-order solitons are simply collectionsof co-propagating fundamental solitons with identical groupvelocity, but they have, however, different peak powers anddurations. There is no binding energy between them and smallperturbations can lead to a rapid fissioning of the constituentsolitons.
2.2. Modulation instability
In many physical systems nonlinear waves suffer an instabilitywhich leads to the spread of energy from the central wavefrequency to neighbouring frequencies. In the time domainthis is characterized by the splitting of the wave intoshorter temporal features. This process is termed modulationinstability (MI) or, in some other systems, Benjamin–Feirinstability (Lighthill 1965, Benjamin and Feir 1967). For anice historical review see (Zakharov and Ostrovsky 2009).The physical parameters required for such instabilities tooccur are the same as those for soliton propagation or, moregenerally, self-trapping of a wave. This is when the dispersiveor diffractive effect of the medium acts opposed to thenonlinear wave spreading. These conditions naturally leadto the formation of solitons (Karpman 1967, Hasegawa andBrinkman 1980, Tai et al 1986, Itoh et al 1989).
To illustrate this process, figure 3 shows a close upof the temporal power evolution of the early stages of the
3

J. Opt. 12 (2010) 113001 Review Article
Figure 3. A subset of the temporal power evolution of a 10 ps(FWHM) 12.6 kW peak power (N = 600) soliton propagatingthrough the reference fibre. The timescale is zoomed in to show thefast soliton formation. The propagation lengths were: (a) 0 cm,(b) 5 cm and (c) 10 cm. Note that the power scales vary betweensubplots.
supercontinuum shown in figure 2. Figure 3(a) shows a closeup of the input power over a 1 ps period. Figure 3(b) showshow, after 5 cm, modulations are beginning to appear. Finally,figure 3(c) shows how after 10 cm over 60 kW peak powersolitons have formed, with durations as short as 8 fs. Notethat this distance corresponds to the initial spectral expansionobserved in figure 2.
The modulation frequency is given by (4) (Hasegawa andBrinkman 1980)
ωMI =√
2γ P
|β2| , (4)
and the maximum side-band gain is simply 2γ P , where Pis the pump power. The modulation instability period is thensimply given by TMI = 2π/(ωMI).
This period is critical for determining the supercontinuumdynamics. In section 2.6 we will see that it determines if solitonfission or modulation instability is the dominant process forthe supercontinuum initiation. From energy conservation, theenergy contained within one modulation period must entirelyend up in the soliton that emerges from that period (Dianov
et al 1992, Kutz et al 2005):
E0 = 2P0τ0 = EMI = PTMI (5)
where E0, P0 and τ0 are the soliton energy, peak power andduration, respectively. Equation (5) shows that the solitonduration and peak power are related to the fibre properties;in particular, if we minimize the MI period (i.e. maximize itsbandwidth) we can expect to generate the shortest solitons. Wecan estimate the duration of the solitons emitted from MI fromthis as
τ0 = 1
π2TMI, (6)
i.e. the soliton full width at half-maximum duration isapproximately TMI/5. A similar result was shown by Dianovet al (1992). For the values of the simulations shown in figure 3we indeed obtain a soliton duration of 8 fs, in good agreement.In fact, an N = 1, 7.5 fs soliton would have a peak power of62 kW in this fibre, also in good agreement: for comparison,an N = 2 soliton would have a peak power of ∼250 kW.
Considering again figure 3(c), it is clear that the solitonpeak powers and durations are not regular. This is fundamentalto modulation instability, which is a noise-seeded process. Theimplications of this are significant in two ways: firstly, it isthis which provides the extremely smooth spectral featuresof the continuum, as each soliton contributes to a slightlydifferent region of the continuum spectrum; and, secondly, themodulation instability destroys any temporal coherence whichthe pump pulse may have possessed.
The frequency modulation introduced through MI isvisible in the early stages of the spectral evolution shownin figure 2, at around 0.1 m of propagation. Slices of thatevolution are shown in figure 4(a). After 4 cm of propagationthe classic MI side-lobes have appeared, they are external to thepump spectrum and have grown from the background noise.The long wavelength side-lobe is located around 1159 nm andthe short wavelength one around 993 nm, both correspondingto ∼22 THz. The prediction for the MI side-lobe frequencyfrom (4) is 23.8 THz. The small difference is caused by theneglect of high-order dispersion terms in (4) and the variationin peak pump power over the pulse envelope. After 6 cmof propagation secondary sidebands have started to emerge,formed through a cascaded MI process involving the initialsidebands and the initial pump source. After 8 cm, the spectrahas essentially become a supercontinuum and expanded wellinto the normal dispersion region below 966 nm.
Modulation instability is just one manifestation of a widerset of nonlinear processes described by four-wave mixing(Stolen and Bjorkholm 1982, Stolen et al 1989a), involvingtwo pump waves with frequencies ω1 and ω2 and a Stokesand an anti-Stokes, with frequencies ω3 and ω4. From energyconservation the frequencies are constrained to the followingcondition:
ω3 + ω4 = ω1 + ω2. (7)
In addition, due to momentum conservation between the fourinteracting photons, the phase mismatch between the pumpwaves must be zero:
k = β(ω3) + β(ω4) − β(ω1) − β(ω2) + 2γ P0 = 0 (8)
4

J. Opt. 12 (2010) 113001 Review Article
Figure 4. (a) Slices of the spectral power evolution of thesupercontinuum shown in figure 2, at (1, blue) 4 cm, (2, red) 6 cmand (3, green) 8 cm of propagation. The spectra have been convolvedwith a 5 nm resolution filter to remove shot-to-shot noise spikes andobtain traces similar to those observed on an optical spectrumanalyser. (b) The four-wave mixing phase-matching curves, for thereference fibre, for (1, blue) no pump power and (2, red) 12.6 kWpump power. The dashed black line indicates the zero-dispersionwavelength.
where the last term, 2γ P0, accounts for the nonlinear phaseshift from the intensity-dependent refractive index. In mostcases it is assumed that ωP = ω1 = ω2, i.e. a degeneratepump, and it is common to expand k around the commonpump frequency so that (7) is implicitly included:
k = 2∞∑
n=1
β2n(ωP)
(2n)! 2n + 2γ P0 = 0, (9)
where = ωP − ωS = ωAS − ωP, with ωS andωAS the Stokes (longer wavelength) and anti-Stokes (shorterwavelength) frequencies, respectively. The β2n are the 2nthderivatives of β(ω). The phase-matching condition for ourreference fibre is shown in figure 4(b) for both zero pumppower and for the pump power used in the simulations. Thefigure is read as follows: a vertical line drawn for a givenpump wavelength crosses the phase-matching curves at twopoints, the vertical coordinate of these crossings indicatesthe Stokes (longer) and anti-Stokes (shorter) wavelengths thatphase-match for the given pump wavelength. At zero pumppower in this fibre, when there is no nonlinear contributionto the phase-matching we can get four-wave mixing onlyin the normal dispersion region (however, it is possibleto get phase-matching in the anomalous region in doublezero-dispersion fibres (Andersen et al 2004)). When weinclude the nonlinear contribution, modulation instability in
the anomalous region becomes possible. For our initial pumpwavelength of 1070 nm, the phase-matched Stokes and anti-Stokes wavelengths in figure 4(b) do coincide with the MIside-lobes in figure 4(a). Subsequent cascaded processes occurwith a pump photon contributed from the short wavelengthside-lobe at 993 nm, enabling four-wave mixing to anti-Stokeswavelengths in the visible spectral region.
Note that here we are considering four-wave mixingbetween linear (dispersive) waves only and not solitons, forwhich, due to their additional phase shift, a different set ofphase-matching conditions must be met, as described below.
2.3. Dispersive wave generation
The term ‘dispersive waves’ applies to any field componentwhich is not part of a soliton. As pump sources rarelycorrespond to exact soliton solutions of the NLSE, somedispersive radiation is always present in the fibre. However,the more interesting dynamics are found when dispersivewaves are generated as the by-product of nonlinear processeswithin the fibre, rather than simply as part of the initialpump source. This can occur when, for example, a solitonundergoes non-adiabatic transformations. In such situations,a stable soliton state may re-emerge, but any excess energywill be shed as dispersive radiation. One particularly importantprocess occurs when parts of a soliton meet regions ofnormal dispersion (Wai et al 1986, Akhmediev and Karlsson1995). In fact, this is such an important component ofsupercontinuum generation, it has become known as dispersivewave generation. Dispersive waves located at certain phase-matched frequencies and overlapping with the soliton spectrumreceive a transfer of power from the soliton. This clearlyrequires the soliton to be relatively broad band (or shortduration) and to be propagating close to the zero-dispersionwavelength. It can be understood within the framework offour-wave mixing (Skryabin and Yulin 2005), but it is uniqueto solitons as it depends on the extra nonlinear phase a solitonpossesses. It can be understood as a tunnelling effect from theself-trapping soliton to free propagating radiation (Karpman1993) and is analogous to Cherenkov radiation (Akhmedievand Karlsson 1995). It is, in fact, only one of a wholeset of soliton four-wave mixing processes (Gorbach et al2006, Skryabin and Yulin 2005), but it is the only one thatdoes not depend on additional continuous-wave components tooccur; another process is discussed in section 4.1. The phase-matching condition is simply βsol(ω) = β(ωr), with βsol(ω)
defined by equation (2), and ωr the frequency of the dispersivewave. If we expand β(ωr) around the soliton central frequencyωsol, this condition can be written as
βsol(ω)−β(ωr) = γ P0
2−
∑
n�2
βn(ωsol)
n! [ωr−ωsol]n = 0. (10)
As β2 must be negative for soliton propagation, we seethat without any higher-order dispersion terms the phase-matching condition cannot be met. However, if β3 isnon-zero phase-matching can be achieved. When β3 ispositive, then phase-matching to higher frequencies is possible.This is the conventional situation where wavelengths in the
5
J. Opt. 12 (2010) 113001 Review Article
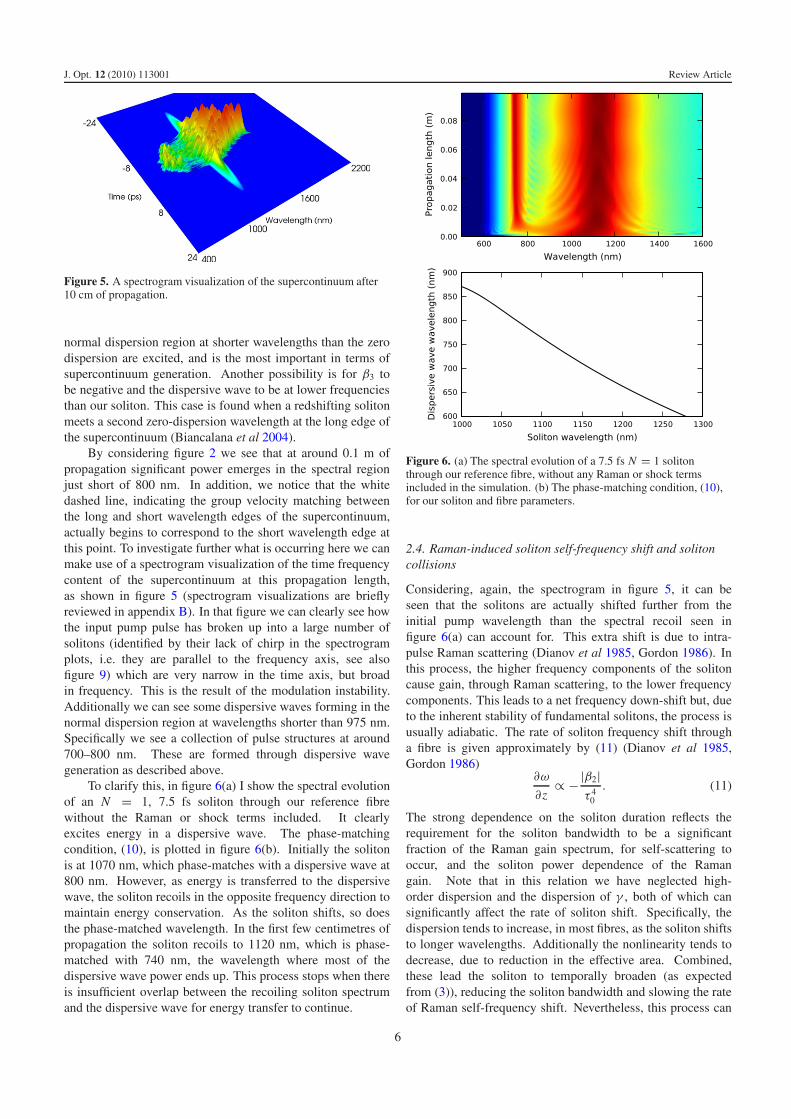
Figure 5. A spectrogram visualization of the supercontinuum after10 cm of propagation.
normal dispersion region at shorter wavelengths than the zerodispersion are excited, and is the most important in terms ofsupercontinuum generation. Another possibility is for β3 tobe negative and the dispersive wave to be at lower frequenciesthan our soliton. This case is found when a redshifting solitonmeets a second zero-dispersion wavelength at the long edge ofthe supercontinuum (Biancalana et al 2004).
By considering figure 2 we see that at around 0.1 m ofpropagation significant power emerges in the spectral regionjust short of 800 nm. In addition, we notice that the whitedashed line, indicating the group velocity matching betweenthe long and short wavelength edges of the supercontinuum,actually begins to correspond to the short wavelength edge atthis point. To investigate further what is occurring here we canmake use of a spectrogram visualization of the time frequencycontent of the supercontinuum at this propagation length,as shown in figure 5 (spectrogram visualizations are brieflyreviewed in appendix B). In that figure we can clearly see howthe input pump pulse has broken up into a large number ofsolitons (identified by their lack of chirp in the spectrogramplots, i.e. they are parallel to the frequency axis, see alsofigure 9) which are very narrow in the time axis, but broadin frequency. This is the result of the modulation instability.Additionally we can see some dispersive waves forming in thenormal dispersion region at wavelengths shorter than 975 nm.Specifically we see a collection of pulse structures at around700–800 nm. These are formed through dispersive wavegeneration as described above.
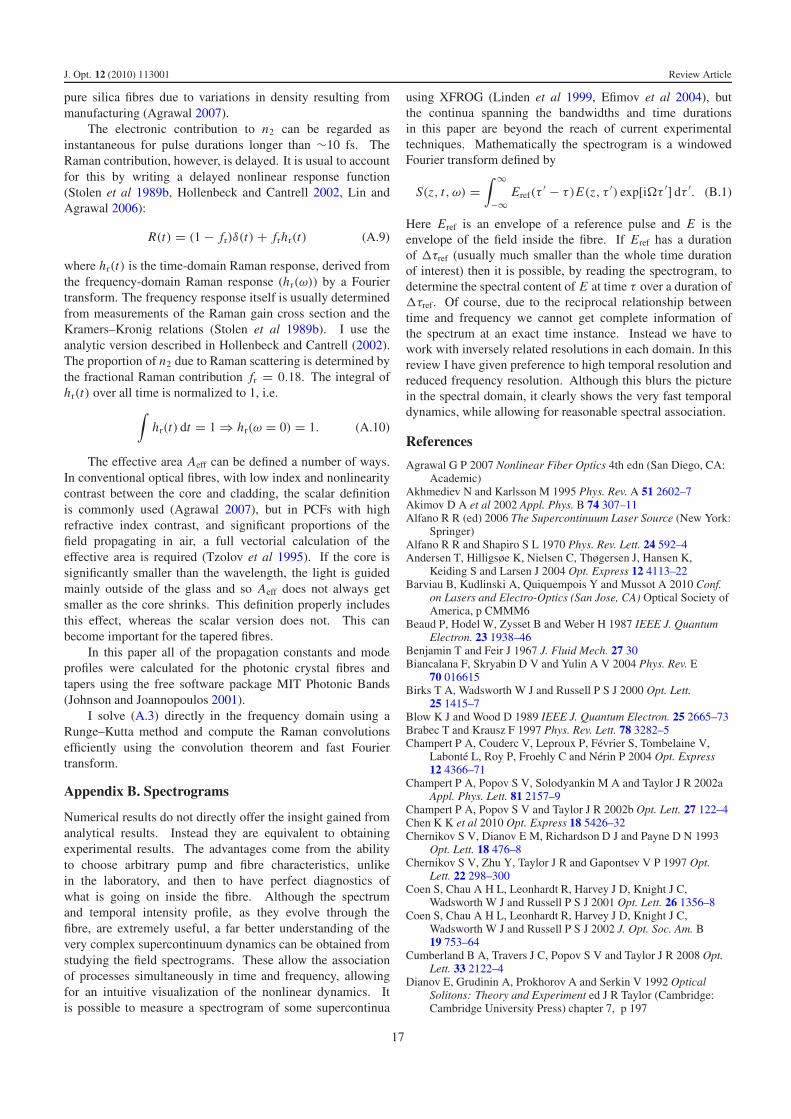
To clarify this, in figure 6(a) I show the spectral evolutionof an N = 1, 7.5 fs soliton through our reference fibrewithout the Raman or shock terms included. It clearlyexcites energy in a dispersive wave. The phase-matchingcondition, (10), is plotted in figure 6(b). Initially the solitonis at 1070 nm, which phase-matches with a dispersive wave at800 nm. However, as energy is transferred to the dispersivewave, the soliton recoils in the opposite frequency direction tomaintain energy conservation. As the soliton shifts, so doesthe phase-matched wavelength. In the first few centimetres ofpropagation the soliton recoils to 1120 nm, which is phase-matched with 740 nm, the wavelength where most of thedispersive wave power ends up. This process stops when thereis insufficient overlap between the recoiling soliton spectrumand the dispersive wave for energy transfer to continue.
Figure 6. (a) The spectral evolution of a 7.5 fs N = 1 solitonthrough our reference fibre, without any Raman or shock termsincluded in the simulation. (b) The phase-matching condition, (10),for our soliton and fibre parameters.
2.4. Raman-induced soliton self-frequency shift and solitoncollisions
Considering, again, the spectrogram in figure 5, it can beseen that the solitons are actually shifted further from theinitial pump wavelength than the spectral recoil seen infigure 6(a) can account for. This extra shift is due to intra-pulse Raman scattering (Dianov et al 1985, Gordon 1986). Inthis process, the higher frequency components of the solitoncause gain, through Raman scattering, to the lower frequencycomponents. This leads to a net frequency down-shift but, dueto the inherent stability of fundamental solitons, the process isusually adiabatic. The rate of soliton frequency shift througha fibre is given approximately by (11) (Dianov et al 1985,Gordon 1986)
∂ω
∂z∝ −|β2|
τ 40
. (11)
The strong dependence on the soliton duration reflects therequirement for the soliton bandwidth to be a significantfraction of the Raman gain spectrum, for self-scattering tooccur, and the soliton power dependence of the Ramangain. Note that in this relation we have neglected high-order dispersion and the dispersion of γ , both of which cansignificantly affect the rate of soliton shift. Specifically, thedispersion tends to increase, in most fibres, as the soliton shiftsto longer wavelengths. Additionally the nonlinearity tends todecrease, due to reduction in the effective area. Combined,these lead the soliton to temporally broaden (as expectedfrom (3)), reducing the soliton bandwidth and slowing the rateof Raman self-frequency shift. Nevertheless, this process can
6

J. Opt. 12 (2010) 113001 Review Article
Figure 7. (a) The spectral evolution of a 7.5 fs N = 1 solitonthrough our reference fibre, with Raman but not shock terms includedin the simulation. (b) The corresponding temporal evolution.
be responsible for significant spectral shift and is responsiblefor the majority of spectral expansion to the long wavelengthside of a supercontinuum. It has been described as the Raman-soliton continuum (Dianov et al 1985, 1992, Gourvia-Netoet al 1989, Gouveia-Neto et al 1989, 1988, Islam et al 1989a).
Figure 7(a) shows the spectral evolution of a 7.5 fs, N = 1soliton propagating through our reference fibre. After 1 m ofpropagation it has shifted over 300 nm. In the time domain,shown in figure 7(b), this is accompanied by a strong delayin the soliton as, in anomalous dispersion, shifting to longerwavelengths leads to a deceleration in group velocity. Notethat in figure 7(a) the dispersive wave has been pushed slightlyshorter in comparison to that in figure 6(a). This is due to thesoliton trapping mechanism to be discussed in section 2.5.
One problem with the above description of the Raman-soliton continuum, is that the single soliton shifts only toaround 1370 nm, whereas the full supercontinuum simulationin figure 2 expands to 2000 nm in a shorter length. This isdespite the fact that our single soliton is amongst the shortestduration, and hence should shift the furthest, of all thosegenerated in the initial MI development. The explanation forthis is the phenomenon of inelastic soliton collisions mediatedthrough the Raman effect. In this process any solitons whichtemporally collide, while having a frequency separation withinthe Raman gain band, will interact through inter-pulse Ramanscattering to enhance the energy of the frequency down-shiftedsoliton. Importantly, the two solitons can be separated quitewidely, near to the Raman gain peak of ∼13 THz, and hencethis interaction can be very strong. Figure 8 shows thecollision between two fundamental solitons at 1070 nm and
Figure 8. The temporal evolution of two fundamental solitons in ourreference fibre at 1070 nm and 1120 nm, with initial energies of80 pJ and 100 pJ, respectively, and equal peak powers. The 1120 nmsoliton is initially 0.5 ps ahead of the 1070 nm but, due to its lowergroup velocity, it collides with the 1070 nm soliton.
Figure 9. A spectrogram visualization of the supercontinuum after70 cm of propagation.
1120 nm, with initial energies of 80 pJ and 100 pJ, respectively,and equal peak powers. The 1120 nm soliton is initially0.5 ps ahead of the 1070 nm one, but due to dispersion ithas a lower group velocity, and hence the 1070 nm solitoneventually catches up with it and they collide after 0.36 m ofpropagation. After the collision, they have energies of 60 pJand 120 pJ, respectively. This exchange of energy leads thelower frequency soliton to become shorter, with an enhancedpeak power, and hence to undergo stronger self-frequencydown-shift. This results in deceleration of the soliton (dueto anomalous dispersion) and hence a greater chance forfurther collisions with frequency up-shifted solitons. In MI-induced supercontinua with a very large number of solitons,this process can lead to extreme enhancement of some solitons,which go on to form the extended long wavelength edge of thesupercontinuum (Islam et al 1989b, Frosz et al 2006, Korneevet al 2008). Occasionally, some of these solitons can obtainan exceptionally high energy and these have been comparedto freak or rogue waves in the ocean (Solli et al 2007, 2008,Dudley et al 2008). However, it has recently become apparentthat this analogy may be misleading and it may actually be thesoliton collisions themselves which correspond to rogue waves(Erkintalo et al 2010, Ruban et al 2010). This is still a veryactive area of research.
7

J. Opt. 12 (2010) 113001 Review Article
2.5. Soliton trapping
As noted in the above sections, the expansion of thesupercontinuum to shorter wavelengths in the normaldispersion region, through either four-wave mixing ordispersive wave generation, is limited by the fibre dispersionand pump wavelength. Further expansion requires a differentmechanism. Over the last few years the dominant processfor such expansion has become known as soliton trapping ofdispersive waves (Beaud et al 1987, Nishizawa and Goto 2002,Genty et al 2004, Gorbach and Skryabin 2007b, 2007c).
This process begins when a suitably intense solitontemporally overlaps with a dispersive wave with the samegroup velocity, but in the normal dispersion region. In this caseintra-pulse four-wave mixing (Gorbach and Skryabin 2007b,2007c) can cause the dispersive wave to slightly blueshift andthe soliton to slightly redshift. But note that there is no netenergy transfer between the two. With normal dispersion ablueshift leads to a deceleration for the dispersive wave andso it slows with respect to the soliton. The soliton, however,will also redshift due to the Raman-soliton self-frequency shift,and as it is in the anomalous region it will also decelerate.Eventually it will decelerate enough to overlap again with thedispersive wave and the process will repeat. It will eventuallybe limited, usually by a second zero-dispersion wavelength,preventing the soliton from further deceleration or simplyextremely high losses on the long wavelength edge preventingfurther soliton redshift.
Evidence of this process is visible in the spectrogram offigure 9, where long wavelength solitons align with bunches ofdispersive waves, which are slightly delayed with respect to thesolitons. Additional support is provided by mapping the group-velocity-matched wavelength of the long wavelength edge of asupercontinuum, and comparing it to the short edge. This hasbeen done in figure 2 and they show remarkable agreement.
Using this understanding we can make reasonablepredictions of the short wavelength extent of a supercontinuumfrom the group velocity curve of the fibre we are pumping,assuming we are pumping with sufficient power in theanomalous dispersion region to generate both a Raman-solitonlong wavelength continuum and some initial dispersive waves.We look at this in later sections as we discuss cascaded fibresand tapered fibres.
2.6. Soliton fission or modulation instability?
In a large number of works on supercontinuum generationreference is made to a process described as soliton fission asbeing the primary mechanism for spectral expansion. Solitonfission does indeed play this role for a large number ofexperiments. The soliton fission process occurs in the initialstages of high-order soliton propagation, when the solitonspectrum is expanded. Either higher-order dispersion termsor Raman scattering can cause perturbations to the constituentfundamental solitons of the pump pulse, leading them tomove with differing group velocities, and hence break apart,or fission. For this process to dominate, then modulationinstability must not occur. MI will occur if the modulationinstability period is sufficiently smaller than the pump pulse
duration. Due to the fact that this period scales with peakpower, we cannot define a fixed pump pulse duration belowwhich soliton fission occurs. However, due to the similarity inscaling we can reasonably define it in terms of soliton order.For a perfectly shaped high-order soliton input, the ratio ofpump pulse duration to MI period (calculated for the peaksoliton power) is given by
τ0
TMI= N√
2π. (12)
For the minimum condition that τ0 � TMI we find thatN � 4.4. However, this is the most extreme limit. Frominspection of the sech2 pulse shape, the peak power is onlylocally maintained for a fraction of the pulse duration, choosinga constraint of τ0/TMI ∼ 5 seems appropriate, leading toN ∼ 22 for the upper limit on N for soliton fission. The solitonfission cutoff has, alternatively, been found numerically to becloser to N = 15 (Genty et al 2007a), in reasonable agreement.
The N ∼ 22 parameter range is readily accessible toultra-short pulse sources such as mode-locked Ti:sapphireoscillators. But for the pump sources we are considering in thispaper, we would not expect soliton fission to occur. Picosecondscale pulses would be of very low power to correspond to N =22 solitons, and little spectral broadening would be expected.In comparison, the pump lasers typically used for high powerpicosecond pumped supercontinuum, to be discussed below,correspond to N ∼ 600.
One other point of confusion, often found in the literature,is whether the products of the modulation instability processcan themselves undergo soliton fission. The answer isclearly negative, when one takes into account the fact thatonly fundamental solitons are created from MI. This doesnot, however, rule out the role of dispersive waves inpicosecond pumped supercontinuum generation. On thecontrary, dispersive wave excitation from MI-induced solitonsis one of the key processes in achieving visible and UVsupercontinua from picosecond pump sources in the near-infrared.
3. High power long pulse pumped supercontinuumgeneration
Early work with 1–100 kW peak power nanosecond sourcesshowed the possibility of an extreme broadband supercontin-uum, covering the entire 300–2100 nm transparency regionof conventional silica fibres (Lin and Stolen 1976, Lin andNguyen 1978, Fujii et al 1980). Apart from the readyidentification of four-wave mixing and Raman processesoccurring, the role of solitons in these results was not fullyunderstood until the Raman-continuum dynamics had beendiscovered (Dianov et al 1985, 1992, Gourvia-Neto et al1989, Gouveia-Neto et al 1989, 1988, Islam et al 1989a),although smooth supercontinuum expansion in the anomalousdispersion region of a fibre, clearly of solitonic origin, had beenobserved much earlier (Washio et al 1980).
The first ytterbium fibre laser based supercontinuumsource, now one of the most successful supercontinuumpump sources, was an intra-cavity Q-switched supercontinuum
8

J. Opt. 12 (2010) 113001 Review Article
spanning 700–2000 nm (Chernikov et al 1997). But it was onlyafter the seminal paper by Ranka et al (2000) that renewedinterest in supercontinuum generation occurred. Between2000 and 2003 a large amount of work was published withrespect to supercontinuum generation and complete reviewsare provided by Dudley et al (2006), Genty et al (2007a),Taylor (2010). Of particular relevance to this review paperis the work by Coen et al (2001), (2002), in which anearly look at long pulse duration pumped supercontinuumgeneration pumped directly in the visible with a mode-lockedkrypton laser emitting 60 ps pulses was performed and byChampert et al (2002a), (2002b) in which very high averagepower from either a ytterbium fibre amplifier based masteroscillator power amplifier source (MOPFA) or frequency-doubled erbium MOPFA source produced supercontinua ofover 3.8 W between 1000 and 1400 nm or a continuum between700 and 1000 nm, respectively.
In terms of high power visible supercontinuum generation,with long pulse duration, 1060 nm pump conditions, thefirst key result used bulk Nd:glass pumping to achieve a500–1800 nm supercontinuum with over 5 W of outputpower (Schreiber et al 2003). This was followed by athorough investigation of the role of modulation instabilityand four-wave mixing in visible supercontinuum generationfrom 1060 nm pumped PCFs (Wadsworth et al 2004). Adual-pump scheme was also reported, where a 1060 nm pumpand its second harmonic were used to generate a white-lightsupercontinuum (Champert et al 2004).
The first high spectral power supercontinuum pumpedwith an integrated fibre laser was reported by Rulkov et al(2005). A supercontinuum spanning from 520–1750 nmwith an average spectral power of over 1 mW nm−1 wasreported. In a further development, tapered conventionalfibres were pumped with a long pulse 1060 nm source (Teipelet al 2005b, 2005a), utilizing a technique previously reportedwith femtosecond pump sources (Birks et al 2000). Theresulting supercontinua extended down to just below 500 nm.This was followed by (Travers et al 2005), where cascadedphotonic crystal fibres were used to generate high spectralpower supercontinua from below 400 nm. This work is lookedat in more detail in section 4.1, along with the results of Xionget al (2006), who used a similar approach.
The use of higher-order modes for extended phase-matching conditions to below 400 nm was demonstrated inTombelaine et al (2005), and further investigations of the roleof pump chirp (Rusu et al 2005) and dispersion profiles (Tseet al 2006) were reported. Also in 2006 Kudlinski et al (2006)reported the use of a long tapered photonic crystal fibre togenerate high spectral power supercontinua down to 320 nmwith unprecedented flatness and power. This result is discussedin section 4.2.
The use of secondary cores in a PCF have also been usedto achieve enhanced parametric effects based on birefringentphase-matching (Dupriez et al 2007). In a similar vein, multi-mode PCF structures have also been used for enhanced four-wave mixing, leading to supercontinuum generation down to400 nm (Lesvigne et al 2007).
A very novel approach to extending the blue/UV edgeof the supercontinuum is to modify the glass material of the
optical fibre to allow for extended group velocity matchingbetween solitons and dispersive waves (Frosz et al 2008).Particular care is needed to selectively increase the groupvelocity at short wavelengths with respect to the longerwavelengths and hence increase the group velocity matching.In Frosz et al (2008) it was found that, with a fibre made fromsilica doped with 13% B2O3, some blue extension could beachieved.
Alternatively Stone and Knight (2008), by carefullyconsidering the soliton trapping mechanism, realized thatreducing the loss at long wavelengths should allow theredshifting solitons to propagate further and hence continueto trap the dispersive waves, creating a stronger blueshift.Doing this, along with carefully designing the photonic crystalfibre structure to obtain greater group velocity matching,they obtained a supercontinuum in a single length of fibre,which spanned from 400 to 2450 nm. Utilizing the sametechnique, but with a highly amplified pump source, Chen et al(2010) obtained a 400–2250 nm supercontinuum with up to30 mW nm−1 spectral power.
Working in the opposite direction, a number of reports ofhigh power supercontinuum extension to the mid-infrared havealso been achieved, using either fluoride glass fibres (Hagenet al 2006, Xia et al 2006) or soft glass fibres (Omenetto et al2006, Price et al 2007).
It should also be noted that continuous-wave (CW)pumped supercontinuum generation (Travers 2010) followsquite similar dynamics (there are some qualitative differencesdue to the much lower pump powers and longer fibrelengths required, which affect the number and distributionof Raman solitons (Travers 2009)) and therefore somesimilar techniques for short wavelength extension can beused. In particular, through high power pumping and carefuldispersion engineering some visible CW supercontinua havebeen generated (Cumberland et al 2008, Travers et al 2008),and with carefully tapered photonic crystal fibres CW-pumpedwhite-light supercontinua have been achieved (Kudlinski andMussot 2008, Mussot and Kudlinski 2009, Barviau et al 2010).
4. Enhanced blue and UV supercontinuumgeneration
In this section we consider in more detail several techniquesfor enhancing and extending the short wavelength edge ofthe generated supercontinuum. In section 4.1 we look at thecombined use of several optical fibres with different dispersionproperties. In section 4.2 we look at the use of tapered fibresto improve the cascaded results and specifically at how theygreatly enhance the soliton trapping process.
4.1. Cascaded fibres
Long pulse pumped supercontinuum generation can be roughlyseparated into two stages. The first is the generation ofan initial Raman-soliton continuum and simultaneously theexcitation of dispersive waves in the normal dispersion region.This stage requires sufficient pump power, at a wavelength inthe anomalous dispersion region, but relatively close to the
9

J. Opt. 12 (2010) 113001 Review Article
Figure 10. The properties of the first-and second-stage fibres in thecascaded set-up. (a) The dispersion curves for (1, blue) the first-stagefibre, (2, red) HF790, (3, green) HF810; (b) and (c) are thenon-solitonic four-wave mixing phase-matching curves for HF790and HF810, respectively. After Travers et al (2005).
dispersion zero. The second stage, that of soliton trappingof dispersive waves to extend the short wavelength extent ofthe continuum, requires broad group velocity matching to theshortest wavelength possible or the satisfaction of some otherphase-matched process to achieve short wavelength extension.Although with some recent developments both stages can beobtained in a single constant photonic crystal fibre structure asdescribed above (Stone and Knight 2008, Frosz et al 2008),often better and more flexible results can be obtained bydoing the two stages in separate fibres (the subject of thissection) or in one fibre with a changing structure (the subjectof section 4.1.1).
4.1.1. The first stage. The first stage can be obtainedfollowing the descriptions provided in section 2. The results weuse in what follows are similar to those achieved in Rulkov et al(2005) which formed the first stage in the main experimentalresults to be shown below (Travers et al 2005).
The corresponding experimental set-up was based on anall-fibre master oscillator power amplifier system (Rulkov et al2005). The oscillator was an all-normal dispersion-mode-locked ytterbium fibre laser, based on nonlinear polarizationevolution, the output of which was amplified to 8 W average
Figure 11. (a) The output of stage 1. (b) The spectra achieved whenpumping the stage 2 fibres directly with the pump laser (2, red)HF790 and (3, green) HF810. (c) The spectra achieved whenpumping the stage 2 fibres with the output of stage 1 (numbering asfor (b)). After Travers et al (2005).
power. The output pulses had a duration of approximately8 ps and a peak power of approximately 25 kW. Usuallyaround 60% of this was coupled into the first photonic crystalfibre. The properties of the first-and second-stage fibres areshown in figure 10. The first-stage fibre had a zero-dispersionwavelength at 1040 nm and a nonlinear coefficient of∼10 W−1 km−1 at 1065 nm.
The proximity of the pump wavelength (1065 nm) to thezero-dispersion point and the peak powers involved lead toa high power supercontinuum generated from below 600 nmto beyond 1700 nm (Rulkov et al 2005). A typical outputspectrum is shown in figure 11(a). It should be noted that thelength of fibre used for this stage (0.6 m) was not optimized formaximum supercontinuum width at the first-stage output, butfor optimal power to be in the region of pump power requiredfor a cascaded four-wave mixing process in the second fibre(Travers et al 2005). The power in the region 600–800 nm iswhat is required for success in the cascaded approach.
4.1.2. The second stage. The original goal of the second-stage fibre, during the work resulting in Travers et al (2005),was to provide better continuous-wave four-wave mixing
10

J. Opt. 12 (2010) 113001 Review Article
Figure 12. The output spectrum from HF790, pumped with thesupercontinuum generated in stage 1, on a linear scale and withextended spectral range measured with a monochromator and PbSdetector. After Travers et al (2005).
phase-matching to shorter wavelengths. To achieve this goal,fibres with shorter zero-dispersion wavelengths were used forthe second stage. Some properties of these fibres, labelledHF790 and HF810, as they have zero-dispersion wavelengthsat 790 nm and 810 nm, respectively, are also shown infigure 10.
The results of pumping these second-stage fibres directlywith the pump laser described above are shown in figure 11(b).No significant up-conversion is achieved, apart from somedispersive wave generation around 500 nm. As stated above,the reason for this is that, due to the large separation betweenthe pump wavelength and the zero-dispersion wavelength, littlespectral power is excited into dispersive waves for subsequentsoliton trapping. Figures 10(b) and (c) show the non-solitonic four-wave mixing phase-matching curves for HF790and HF810, respectively. From these it is clear that if powerwere available around 600–800 nm up-conversion down to theblue spectral region might be expected. To attempt this, thesefibres were pumped with the output of stage 1 (Travers et al2005) and the results are shown in figure 11(c). In contrast tothe direct pumping, a full supercontinuum spanning the rangeof the spectrum analyser used in this experiment is achievedand, of most importance, over 200 nm shorter than achieved instage 1 alone.
There is a significant difference between HF790 andHF810, in that the latter has only a single zero-dispersionwavelength, whereas the former has two. From figure 10(a)we see that the dispersion curve drops down and a secondzero dispersion occurs at 1560 mm. The second zero-dispersion point prevents further extension of the Raman-soliton continuum beyond 1560 nm and instead a dispersivewave is formed beyond it at 1740 nm. This is most clearlyseen in the spectrum shown in figure 12 which has an extendedspectral range on a linear scale. Even on a linear scale thecontinuum is reasonably flat; there is considerable spectralpower across the whole range between 450 and 1950 nm.In particular, there is over 0.5 mW nm−1 across the visibleregion with a strong peak of over 2 mW nm−1 in the blue.As we just noted, on the long wavelength edge there is avery strong peak at 1740 nm formed after the second zero-dispersion wavelength.
Figure 13. Curves representing possible short wavelength extensionprocesses in (1, blue) the stage 1 fibre, (2, red) HF790 and (3, green)HF810. (a) Phase-matching curves for direct dispersive wave(Cherenkov) generation. (b) Group velocity matching curves.(c) Soliton four-wave mixing phase-matching curves, with a pumpwavelength around 750 nm.
Since this work was completed, due to better understand-ing of the short wavelength supercontinuum evolution process,some questions over the exact mechanisms for the enhancedshort wavelength generation have arisen (Frosz et al 2010).It is possible that the short wavelength extension is actuallydue to dispersive wave generation, or Cherenkov emission,as described in section 2.3, but seeded by the first-stagecontinuum. Alternatively, maybe soliton trapping of dispersivewaves by solitons, as described in section 2.5, is dominant.Finally, one problem with the non-solitonic four-wave mixinghypothesis is that the Stokes wavelengths required from thediagrams in figures 10(b) and (c) can be in the anomalousdispersion region, and maybe soliton effects occur. Thereforemodified phase-matching conditions are needed (Skryabinand Yulin 2005, Gorbach et al 2006). We examine thesepossibilities in what follows, with reference to figure 13.
(i) As described in Frosz et al (2010), direct dispersive wave(Cherenkov) generation from solitons, as described insection 2.3, could be responsible for the short wavelengthextension. The phase-matching curves for this process inour fibres are shown in figure 13(a). Direct pumping of
11

J. Opt. 12 (2010) 113001 Review Article
the stage 1 fibre ((1) in the figure) could lead to significantshort wavelength extension from solitons up to 2000 nm,but as the efficiency of dispersive wave generation fallsoff exponentially as the soliton shifts further from thezero-dispersion wavelength, this is too inefficient to occur.When direct pumping HF810 though, some dispersivewave generation is observed (see figure 11(b)) and agreeswell with the phase-matching requirements in figure 13(a);however, it is of very low efficiency. In the cascadedapproach, one could imagine that the dispersive wavesare seeded from the continuum in the first stage andare therefore enhanced when propagating in the second-stage fibre. Coupled with the clear phase-matchingdown to 400 nm and 300 nm in HF790 and HF810,respectively, this is an appealing explanation for thecascaded extension. However, the first-stage output onlyhas significant spectral power at wavelengths longer than600 nm, so it is hard to see how this can seed dispersivewaves around 400 nm.
(ii) The group velocity matching between solitons anddispersive waves in the second-stage fibre is extendedto shorter wavelengths due to the shorter zero-dispersionwavelengths, as shown in figure 13(b). In those curveswe see that in the first-stage fibre we can only groupvelocity match to 550 nm and this corresponds quitewell to the continuum achieved in this stage. In thesecond-stage fibres, this is extended to 500 nm andat least 400 nm in HF790 and HF810, respectively.This means that in HF810 soliton trapping could indeedexplain the continuum extension. However, because ofthe second zero-dispersion wavelength in HF790, thegroup velocity matching to dispersive waves is curtailedat 500 nm and therefore soliton trapping cannot explainthe continuum achieved experimentally in that fibre(figures 11(c) and 12).
(iii) Soliton four-wave mixing, between the Raman-continuumsolitons generated in the first and second stages, pumpdispersive waves around 700–800 nm and blueshifteddispersive waves can occur according to a soliton four-wave mixing phase-matching condition (Gorbach et al2006):
β(ω) = β(ωp) + βsol(ω) − βsol(ωp), (13)
where β(ω) is just the fibre propagation constant at ω,the frequency of our potentially phase-matched dispersivewave, βsol(ω) is the propagation constant of the soliton,given by equation (2), at frequency ω and ωp is thepump frequency, also a dispersive wave. This condition isshown in figure 13(c) for HF790 and HF810. We see thatthese curves can very well explain the short wavelengthextension when pumping with the output of stage 1. Inaddition, unlike for Cherenkov generation, the seed powerin the region of 600–800 nm is directly used and willenhance this process. I therefore expect that this processcould occur strongly in these fibres.
(iv) Figure 10(b) shows the non-solitonic four-wave mixingphase-matching diagram for HF790. It can be seen fromthis that the blue peak at 480 nm (figure 12) is directly
phase-matched with the peak at 1740 nm with a pumpwavelength of 764 nm. This indicates that non-solitonicfour-wave mixing may, in fact, be responsible for thevery strong blue peak, as all required wavelengths in theinteraction are outside of the anomalous dispersion regionand so solitons are not involved. The efficiency of thisprocess may be enhanced by the fact that the dispersivewave generated at 1740 nm is at a fixed wavelength. Itis worth noting that, if this mechanism is correct, theintense blue light is a direct result of the second zero-dispersion wavelength. If there were no second zero thena smoother continuum would result, like that in HF810.Therefore, tailoring of the second zero-dispersion pointwould allow one to selectively enhance certain areas ofthe visible continuum, should this be desired.
In reality, all of these mechanisms may play a role, anddespite the question over the exact blue extension mechanism,this technique works very well. It has allowed high spectralpower supercontinua, pumped with a high power ytterbiumfibre oscillator, to reach the blue spectral region and couldperhaps be extended further according to the numerical resultsin Frosz et al (2010).
4.1.3. A normally dispersive first stage. An alternativeapproach, first reported by Xiong et al (2006), is to use anormally dispersive first-stage fibre. In Xiong et al (2006) apump source at 1060 nm and a first-stage fibre with a zero-dispersion wavelength of 1103 nm was used. Due to narrowband phase-matching criteria, this resulted in direct four-wavemixing to around 742 nm with relatively little broadening. The742 nm signal was then used to pump a second fibre with azero at 700 nm, producing a broad and flat continuum acrossthe visible spectrum as described above. Although in thiscase the spectral power was not high, using this scheme withthe picosecond laser described here, higher powers could beachieved.
4.2. Tapered fibres
The natural progression from using discrete cascaded fibres isto attempt a continuous longitudinal variation of dispersion andnonlinearity. To achieve this we use tapered fibres. Such werebeing discussed and analysed as early as 1970 (Snyder 1970).However, their use for controlling propagation characteristicsvia dispersion and nonlinearity was not discussed until the late1980s (Tajima 1987). Subsequent to this a great deal of workwent into the design and use of tapered optical fibres, primarilyfor adiabatic soliton compression (Chernikov et al 1993).
There are two main techniques to fabricate tapers: eitherduring manufacture or by post-processing the fibre. Duringmanufacture the speed at which the fibre is drawn and otherdrawing conditions determine the transverse fibre structure;this technique can produce arbitrary long tapers at the expenseof losing control on very short length scales. Subsequent tomanufacture, heating of the fibre and stretching can be usedto reduce the transverse fibre dimensions; this can be used toprecisely control small tapered regions of fibre. For ultra-shortpump systems this latter technique had been well established
12

J. Opt. 12 (2010) 113001 Review Article
in a number of results (Dumais et al 1993, Birks et al 2000,Wadsworth et al 2002, Akimov et al 2002, Leon-saval et al2004, Foster and Gaeta 2004, Wadsworth et al 2005, Teipelet al 2005a) but, apart from Lu et al (2005), and some workon coherent supercontinuum generation (Tamura et al 2000,Tamura and Nakazawa 1999), most of these results used justthe constant core region, and the main benefit of the taper wasto enhance coupling of intense laser light into the small tapercore region.
In contrast to the post-processed fibres, fibres taperedat the drawing tower can be as long as the fibre drawingequipment permits—up to kilometres. This allows for slowerand more controlled transitions and allows for changingthe fibre characteristics as the supercontinuum develops,something only possible with ∼10–100 fs pulses with post-processed fibre tapers (Lu et al 2005). This leads to an extradegree of control on the nonlinear processes which can beachieved. In this section we discuss work on using longlengths of tapered PCF fibres manufactured at the drawingtower for efficient supercontinuum generation to the blue/UVwavelengths from a 1065 nm pump source (Kudlinski et al2006, Travers et al 2006, 2007).
The tapered fibres were drawn by Kudlinski et al(2006), directly from a small (3 mm diameter) preform, byadjusting the drawing parameters so as to decrease the outerdiameter, while keeping the air-filling fraction in the claddingalmost constant. As a result the fibre pitch decreased bythe same fraction as the outer diameter, so that the outerdiameter measurements acquired during fibre fabrication givean accurate description of the variation of the pitch along thefibre length.
Figure 14(a) shows the variation in pitch for the twotapers we will discuss. For taper T1, the initial change inpitch is quite steep and approximately linear with the fibrelength. At the input it is ∼4.5 μm, changing to ∼2.1 μmat 1 m. At around 0.75–1 m the rate of change of the fibrepitch slows and, for further fibre lengths, tends towards aconstant value of ∼1.1 μm. The air-hole diameter to pitch ratiowas constant along the taper at 0.71. The input pitch valuescorrespond quite closely to the fibre used as the initial stage ofthe cascade in section 4.1. The second stage of the cascadecorresponds to the parameters at a length of approximately1 m of the taper. Figure 14(b) shows how the zero-dispersionwavelength of taper T1 decreases with fibre length. It followsthe shape of the pitch curve, initially rapidly moving to shortwavelengths at the start of the fibre and then levelling off atlonger lengths. At 1.5–2 m the taper has a zero dispersionwhich is the same as the second stage of the cascaded fibre set-up described above. Along with the changing dispersion andphase-matching curves, the reduction in pitch along the fibreincreases the nonlinear coefficient as the effective area shrinks.The nonlinear coefficient extends from 0.01 W−1 m−1 at theinput to over 0.1 W−1 m−1 after 6 m through the taper. At thelength of 1 m it is around 0.04 W−1 m−1.
In figure 15 we plot the calculated group velocitydispersion curves of taper T1 at various positions along itslength. For the large input pitch at the start of the taper, the zerodispersion is very close to the pump wavelength of 1060 nm.
Figure 14. (a) The variation of the pitch of the tapered fibres (1, blue)T1 and (2, red) T2 with length and (b) the corresponding variation ofzero-dispersion wavelength. After Kudlinski et al (2006).
As the pitch is reduced, the dispersion at the pump wavelengthis increased, the zero-dispersion wavelength moves shorter andeventually the second zero-dispersion wavelength moves intoour spectral region of interest.
The supercontinuum produced by Kudlinski et al (2006)in taper T1 under the same pump conditions as the cascadedapproach of the last section is shown in figure 16. Thesupercontinuum is exceptionally flat and extends to below400 nm. Figure 16(b) shows close ups of the spectra measuredfor the visible part of the supercontinuum. The vertical axisis scaled with the measured spectral power. It is apparentthat a very high spectral power was achieved across the wholevisible spectrum. For the output at 0.84 m the spectral powerwas above 2 mW nm−1 across this region. With a peakof 5 mW nm−1 near 400 nm. The total output power ofthe supercontinuum at this length was over 3.5 W. Furtherpropagation induced gaps in the spectrum, visible in the curvesof figure 16(b) around 600 nm, before the full spectral extentof the supercontinuum is reached. This was unfortunate, as itmeant that a compromise must be made between the spectralflatness and the short wavelength extension. However, theshortest wavelength edge of the continuum extends to below380 nm, a significant improvement over the cascaded fibre set-up. Figure 16(c) shows the long wavelength spectrum of thesupercontinuum generated in taper T1. The lines near 1800 nmare due to water absorption in the spectrometer used and notfeatures of the continuum spectrum. The continuum extendsup to 2400 nm at the −20 dB level, although the −10 dBedge is only at 2200 nm. This is expected due to the veryhigh losses in silica glass at these wavelengths. The dip just
13

J. Opt. 12 (2010) 113001 Review Article
Figure 15. Further properties of taper T1 at various lengths. (a) Thecalculated dispersion curves. (b) The corresponding group velocitycurves. (c) The group velocity matching curves. The fibre lengthswere (1) 0 m, (2) 0.27 m, (3) 0.44 m, (4) 0.55 m, (5) 1.06 m and(6) 3.53 m.
beyond 2200 nm is probably due to the second dispersionwavelength which will limit self-Raman scattering of solitonsto longer wavelengths, the extended spectral power being dueto dispersive wave generation in the normal dispersion regionbeyond this point.
The result of a numerical simulation of the continuumextension through the taper is also shown in figure 16(a). Theshort wavelength edge of the continuum is well reproduced.As the simulations included only the fundamental mode, thisindicates that no multi-mode dynamics are required to achievethese short wavelengths. This was confirmed experimentallyby using band-pass filters and looking at the mode profile ofa variety of tight bend radii. The long wavelength region isless well reproduced, which can be readily explained by thefact that loss, particularly the confinement loss of the taper,was not included in the simulations. The largest discrepancyconcerns the pump depletion; the experimental spectrum showssignificant power remaining near the pump wavelength, whichis not reproduced in the simulated results. The model of thepump laser used did not account for amplified spontaneousemission which is likely the cause of this spectral spike.
The primary mechanism for the supercontinuum extensionto the blue/UV was soliton trapping, confirmed by looking
Figure 16. (a) Comparison between the experimental and simulatedspectrum after propagation through 0.9 m of taper T1. (b) Thespectral power in the visible part of the supercontinuum for selectedspectral slices of the cutback results through T1: (1) 0.24 m,(2) 0.39 m, (3) 0.69 m, (4) 0.84 m and (5)1.14 m. (c) The longwavelength edge of the supercontinuum, measured with amonochromator and PbS detector. After Kudlinski et al (2006).
at the spectrograms from the numerical results. However,the taper can modify the soliton trapping mechanism in adramatic way as described in detail in Travers and Taylor(2009). Firstly, the fibre dispersion properties at the start ofthe taper are well suited to the initial generation of dispersivewaves in the normal dispersion regime, after modulationinstability has broken up the pump pulse into ultra-shortsolitons. Subsequently soliton trapping of dispersive wavesleads to a blueshift in the short wavelength edge. Thelimit to this process, as discussed above, is when the groupvelocity matching is broken down between the long and shortwavelength edges of the supercontinuum. The first role of thetapers is to adjust the fibre group velocity properties so thatgroup velocity matching is enabled for shorter wavelengthsthan the input, constant core fibre would provide. Thiscan be seen in figure 15(c) which shows that, although theproperties at the input to taper T1 only allow matching down to500 nm, the fibre properties at ∼1 m allow matching to below400 nm, in reasonable agreement with our experiments. Thesecond role of the tapers is to greatly enhance the decelerationexperienced by the solitons as they propagate through the
14

J. Opt. 12 (2010) 113001 Review Article
Figure 17. Map of the shortest group velocity matched wavelength(in μm) as a function of pitch (�) and hole diameter to pitch ratio(d/�). Darker blue indicates shorter wavelength matching.
fibre. By considering figure 15(b), a soliton which remainedfixed at 1500 nm, but propagating through the taper, wouldbe decelerated to a group velocity actually unachievable in afibre with the constant characteristics of the input to the taper,even if it shifted all the way to 2500 nm. This decelerationdue to the changing group velocity of the taper was shownin Travers and Taylor (2009) to allow soliton trapping even inthe complete absence of Raman scattering in the fibre. It bothgreatly shortens the length scale over which the process canoccur and enables trapping by solitons which by themselveswould not significantly redshift.
One question which arises, however, is what are theoptimal taper properties to obtain the broadest continuum.It can be reasonably argued that the input properties shouldproduce the greatest transfer of power to dispersive waves,and therefore a zero-dispersion wavelength close to the pumpis desirable. The taper output properties are perhaps moredifficult to pin down, but it is reasonable to suggest thatthe dispersion which allows group velocity matching to theshortest wavelength would be good. Shown in figure 17 is adensity map of the shortest group velocity matched wavelengthas a function of the two fibre parameters, pitch (�) and holediameter to pitch ratio (d/�). It is clear that a pitch ofaround 2 μm gives the shortest matched wavelength almostindependently of d/�. For larger pitches, the group velocitycurve on the long wavelength edge increases, because thefield is less confined to the core of the fibre and hence hasa larger overlap with air. For smaller pitches, the secondzero-dispersion wavelength moves down to this spectral region.This means that there is a minimum in the group velocitycurve and hence a limit as to how small the group velocityon this long wavelength edge can be: 2 μm appears to bea compromise between these two positions. In terms of theratio d/�, the larger the ratio, the shorter the group velocitymatched wavelength becomes. There is, however, a practicallimit as to how large this ratio can be: fibres with d/� ∼ 0.95are readily available. Therefore we can see that taper T1, withd/� = 0.71, was not optimal for UV generation. The optimalshape of the pitch transition region, or taper profile, is less easyto estimate.
From this plot we can see that taper T2 (figure 14(a))should be more optimal as the final pitch value of the taper
Figure 18. Short wavelength edge of the supercontinuum producedin taper T2 (Kudlinski et al 2006, Travers et al 2006, 2007).
is closer to 2 μm and the taper flattens there and allowsgreater propagation distances in these conditions, rather thancontinuing to smaller pitch sizes as taper T1 does. The holediameter to pitch ratio was between d/� = 0.87 and 0.89, alsoan improvement over taper T1, and the start pitch was 6.0 μm.
Figure 18 shows the short wavelength edge of thesupercontinuum achieved by Kudlinski et al (2006) whenpumping taper T2. We can see that a significant extensionbelow 380 nm is achieved. The cutoff of the continuum isbetween 320 and 340 nm. The peak at 360 nm had a spectralpower over 2 mW nm−1. This taper had a final pitch valueof ∼2.4 μm which, according to figure 16, is still not at theoptimum value.
In summary:
(i) The initial taper conditions should be designed foroptimum transfer of pump power to dispersive waves inthe normal dispersion region, and to redshifting Ramansolitons.
(ii) The subsequent taper profile should then be chosen toenhance the group velocity matching conditions betweenthe redshifting Raman solitons and short wavelengthdispersive waves. The taper profile can also significantlyenhance the soliton trapping process by accelerating thesolitons more than Raman scattering alone.
(iii) Although reasonable estimates of the best start and endtaper conditions can be chosen as described above, theoptimal taper profile between these conditions is stillunknown.
5. Conclusion
The combination of current fibre laser technology providinghigh average and peak power pulsed-laser systems with longpulse durations, and specifically tailored photonic crystalfibres, allows for the generation of supercontinua withexceptionally high spectral powers across the visible, near-UV and near-mid-infrared spectral regions. The primarymechanisms driving this process are modulation instability,leading to a break up of the long input pulse into ultra-shortsolitons and the formation of the Raman-soliton continuum,coupled with soliton dispersive wave dynamics, particularly
15

J. Opt. 12 (2010) 113001 Review Article
soliton trapping. By carefully choosing the pump conditions,fibre parameters and system design to include either cascadedfibres, or tapered fibres, a significantly enhanced blue/UVspectral extent can be achieved.
Acknowledgments
I am deeply indebted to my current and past colleaguesProfessor J R Taylor, Dr S V Popov, Dr A B Rulkov,Dr B A Cumberland, Dr R E Kennedy and E J R Kelleherfor entertaining and illuminating discussions and theirpatience. I would also like to thank Professor J M Dudley,Professor J C Knight, Dr A Kudlinski and Dr J Stone for usefuldiscussions and collaborations. This work has been partiallysupported by the UK Engineering and Physical SciencesResearch Council, and I am currently supported by an ImperialCollege Junior Research Fellowship.
Appendix A. Numerical simulations
The propagation of an electromagnetic wave travelling throughan optical fibre, as for any medium, can be described byMaxwell’s equations, from which a wave equation can bederived. In the nonlinear fibre optics community it isusual to simplify matters by deriving a first-order envelopeequation for pulse propagation. This allows for bothgreater phenomenological insight, and also easier numericalimplementation. Several different derivations have beendescribed, with the most widely used being (Blow andWood 1989, Mamyshev and Chernikov 1990, Francois 1991).Recently, a number of groups have put effort into re-deriving these and similar propagation equations with carefulconsideration of the assumptions involved (Brabec and Krausz1997, Karasawa et al 2001, Ferrando et al 2005, Laegsgaard2007, Genty et al 2007b): for a good review see (Kinsler 2008).The equation used in what follows most closely corresponds tothe results in Laegsgaard (2007).
We define our propagation equation in terms of a linearlypolarized, complex spectral envelope E(z,), where z isthe axial distance along the fibre and = ω − ω0 isthe angular frequency with respect to our chosen referencefrequency ω0. In this form, we assume that the transversefield profile is defined by a constant fibre mode shape, whichcan be factored out of the propagation dynamics into twoconstants, the fibre propagation constant β(ω), correspondingto an eigenvalue of Maxwell’s equations for the transverse fibrestructure, and the effective area Aeff, defined by integratingover the corresponding eigenvector. A time-domain envelopecan be obtained from this via a Fourier transform defined by
E(z, t) = F−1{E(z,)} (A.1)
= 1
2π
∫ ∞
−∞E(z,) exp [−it] dω. (A.2)
We define the field envelope amplitude such that |E(z, t)|2gives the instantaneous power in watts. The propagationequation for E(z,) is then (Laegsgaard 2007)
∂z E ′ = iγ (ω) exp(−L(ω)z)
× F{
E(z, t)∫ ∞
−∞R(t ′)|E(z, t − t ′)|2 d dt ′
}, (A.3)
with the variable changes
E(z, t) = F−1
{E(z, ω)
A1/4eff (ω)
}
, (A.4)
andE ′(z,) = E(z,) exp(−L(ω)z). (A.5)
In these equations, L(ω) is the linear operator, given byL(ω) = i(β(ω) − β(ω0) − β1(ω0)) − α(ω)/2, neff(ω) =cβ(ω)/ω is the effective index of the mode and n0 is the linearrefractive index at ωo. The βn are the nth derivatives of β
with respect to ω and α(ω) is the power attenuation (or gain)coefficient. The frequency-dependent nonlinear coefficient isdefined as
γ (ω) = n2n0ω
cneff(ω)A1/4eff (ω)
, (A.6)
where n2 is the nonlinear refractive index given by n2 =3χ(3)/(4ε0cn2
0) with χ(3) the third-order susceptibility of themedium and ε0 the vacuum permittivity. Finally R(t) definesthe time-dependent nonlinear response.
Equation (A.3) is a version of the generalized nonlinearSchrodinger equation. It can be reduced to the moreconventional time-domain nonlinear Schrodinger equation byignoring the frequency dependence of the effective area,effective mode index and attenuation coefficient. Doing thiscorresponds to the transformation γ → γ = n2ω0/(cAeff),where γ is the conventional nonlinear coefficient. Using this,and substituting equations (A.5) and (A.4) into (A.3), andperforming an inverse Fourier transform we obtain
∂z E(z, τ ) =∞∑
k=2
ik+1βk(ω0)
k! ∂kτ E(z, τ )
− α
2E(z, τ ) + γ
(i − 1
ω0∂τ
)
× E(τ, z)∫ t
−∞R(t ′)|E(τ−t ′)|2 dt ′, (A.7)
where τ = t − β1z.If the time derivative (corresponding to the dispersion of
the nonlinearity, and leading to optical shock formation) anddelayed nonlinearity (Raman term) are removed from (A.7),along with higher-order dispersion and attenuation, we recoverthe conventional nonlinear Schrodinger equation:
∂z E(z, τ ) = −iβ2
2∂2τ E(z, τ ) + iγ E(τ, z)|E(τ − t ′)|2, (A.8)
which can be analytically solved for the soliton solutions(Zakharov and Shabat 1972).
The nonlinear refractive index has been found experimen-tally to be n2 = 2.74 × 10⁻²⁰ m2 W−1, which was determinedfrom an extensive review of measured values (Milam 1998).We should note here, however, that the precise value changesdue to the glass composition (i.e. dopants), and even for
16
J. Opt. 12 (2010) 113001 Review Article
pure silica fibres due to variations in density resulting frommanufacturing (Agrawal 2007).
The electronic contribution to n2 can be regarded asinstantaneous for pulse durations longer than ∼10 fs. TheRaman contribution, however, is delayed. It is usual to accountfor this by writing a delayed nonlinear response function(Stolen et al 1989b, Hollenbeck and Cantrell 2002, Lin andAgrawal 2006):
R(t) = (1 − fr)δ(t) + frhr(t) (A.9)
where hr(t) is the time-domain Raman response, derived fromthe frequency-domain Raman response (hr(ω)) by a Fouriertransform. The frequency response itself is usually determinedfrom measurements of the Raman gain cross section and theKramers–Kronig relations (Stolen et al 1989b). I use theanalytic version described in Hollenbeck and Cantrell (2002).The proportion of n2 due to Raman scattering is determined bythe fractional Raman contribution fr = 0.18. The integral ofhr(t) over all time is normalized to 1, i.e.
∫hr(t) dt = 1 ⇒ hr(ω = 0) = 1. (A.10)
The effective area Aeff can be defined a number of ways.In conventional optical fibres, with low index and nonlinearitycontrast between the core and cladding, the scalar definitionis commonly used (Agrawal 2007), but in PCFs with highrefractive index contrast, and significant proportions of thefield propagating in air, a full vectorial calculation of theeffective area is required (Tzolov et al 1995). If the core issignificantly smaller than the wavelength, the light is guidedmainly outside of the glass and so Aeff does not always getsmaller as the core shrinks. This definition properly includesthis effect, whereas the scalar version does not. This canbecome important for the tapered fibres.
In this paper all of the propagation constants and modeprofiles were calculated for the photonic crystal fibres andtapers using the free software package MIT Photonic Bands(Johnson and Joannopoulos 2001).
I solve (A.3) directly in the frequency domain using aRunge–Kutta method and compute the Raman convolutionsefficiently using the convolution theorem and fast Fouriertransform.
Appendix B. Spectrograms
Numerical results do not directly offer the insight gained fromanalytical results. Instead they are equivalent to obtainingexperimental results. The advantages come from the abilityto choose arbitrary pump and fibre characteristics, unlikein the laboratory, and then to have perfect diagnostics ofwhat is going on inside the fibre. Although the spectrumand temporal intensity profile, as they evolve through thefibre, are extremely useful, a far better understanding of thevery complex supercontinuum dynamics can be obtained fromstudying the field spectrograms. These allow the associationof processes simultaneously in time and frequency, allowingfor an intuitive visualization of the nonlinear dynamics. Itis possible to measure a spectrogram of some supercontinua
using XFROG (Linden et al 1999, Efimov et al 2004), butthe continua spanning the bandwidths and time durationsin this paper are beyond the reach of current experimentaltechniques. Mathematically the spectrogram is a windowedFourier transform defined by
S(z, t, ω) =∫ ∞
−∞Eref(τ
′ − τ )E(z, τ ′) exp[iτ ′] dτ ′. (B.1)
Here Eref is an envelope of a reference pulse and E is theenvelope of the field inside the fibre. If Eref has a durationof τref (usually much smaller than the whole time durationof interest) then it is possible, by reading the spectrogram, todetermine the spectral content of E at time τ over a duration ofτref. Of course, due to the reciprocal relationship betweentime and frequency we cannot get complete information ofthe spectrum at an exact time instance. Instead we have towork with inversely related resolutions in each domain. In thisreview I have given preference to high temporal resolution andreduced frequency resolution. Although this blurs the picturein the spectral domain, it clearly shows the very fast temporaldynamics, while allowing for reasonable spectral association.
References
Agrawal G P 2007 Nonlinear Fiber Optics 4th edn (San Diego, CA:Academic)
Akhmediev N and Karlsson M 1995 Phys. Rev. A 51 2602–7Akimov D A et al 2002 Appl. Phys. B 74 307–11Alfano R R (ed) 2006 The Supercontinuum Laser Source (New York:
Springer)Alfano R R and Shapiro S L 1970 Phys. Rev. Lett. 24 592–4Andersen T, Hilligsøe K, Nielsen C, Thøgersen J, Hansen K,
Keiding S and Larsen J 2004 Opt. Express 12 4113–22Barviau B, Kudlinski A, Quiquempois Y and Mussot A 2010 Conf.
on Lasers and Electro-Optics (San Jose, CA) Optical Society ofAmerica, p CMMM6
Beaud P, Hodel W, Zysset B and Weber H 1987 IEEE J. QuantumElectron. 23 1938–46
Benjamin T and Feir J 1967 J. Fluid Mech. 27 30Biancalana F, Skryabin D V and Yulin A V 2004 Phys. Rev. E
70 016615Birks T A, Wadsworth W J and Russell P S J 2000 Opt. Lett.
25 1415–7Blow K J and Wood D 1989 IEEE J. Quantum Electron. 25 2665–73Brabec T and Krausz F 1997 Phys. Rev. Lett. 78 3282–5Champert P A, Couderc V, Leproux P, Fevrier S, Tombelaine V,
Labonte L, Roy P, Froehly C and Nerin P 2004 Opt. Express12 4366–71
Champert P A, Popov S V, Solodyankin M A and Taylor J R 2002aAppl. Phys. Lett. 81 2157–9
Champert P A, Popov S V and Taylor J R 2002b Opt. Lett. 27 122–4Chen K K et al 2010 Opt. Express 18 5426–32Chernikov S V, Dianov E M, Richardson D J and Payne D N 1993
Opt. Lett. 18 476–8Chernikov S V, Zhu Y, Taylor J R and Gapontsev V P 1997 Opt.
Lett. 22 298–300Coen S, Chau A H L, Leonhardt R, Harvey J D, Knight J C,
Wadsworth W J and Russell P S J 2001 Opt. Lett. 26 1356–8Coen S, Chau A H L, Leonhardt R, Harvey J D, Knight J C,
Wadsworth W J and Russell P S J 2002 J. Opt. Soc. Am. B19 753–64
Cumberland B A, Travers J C, Popov S V and Taylor J R 2008 Opt.Lett. 33 2122–4
Dianov E, Grudinin A, Prokhorov A and Serkin V 1992 OpticalSolitons: Theory and Experiment ed J R Taylor (Cambridge:Cambridge University Press) chapter 7, p 197
17

J. Opt. 12 (2010) 113001 Review Article
Dianov E M, Karasik A Y, Mamyshev P V, Prokhorov A M,Serkin V N, Stelmakh M F and Fomichev A A 1985 JETP Lett.41 294
Dudley J, Genty G and Coen S 2006 Rev. Mod. Phys. 78 1135Dudley J M, Genty G and Eggleton B J 2008 Opt. Express
16 3644–51Dudley J M and Taylor J R (ed) 2010 Supercontinuum Generation in
Optical Fibers 1st edn (Cambridge: Cambridge UniversityPress)
Dumais P, Gonthier F, Lacroix S, Bures J, Villeneuve A,Wigley P G J and Stegeman G I 1993 Opt. Lett. 18 1996–8
Dupriez P, Poletti F, Horak P, Petrovich M N, Jeong Y, Nilsson J,Richardson D J and Payne D N 2007 Opt. Express 15 3729–6
Efimov A, Taylor A J, Omenetto F G, Yulin A V, Joly N Y,Biancalana F, Skryabin D V, Knight J C and Russell P S J 2004Opt. Express 12 6498–507
Erkintalo M, Genty G and Dudley J 2010 Eur. Phys. J. Spec. Top.185 135–44
Ferrando A, Zacares M, Fernandez de Cordoba P, Binosi D andMontero A 2005 Phys. Rev. E 71 16601
Foster M A and Gaeta A L 2004 Opt. Express 12 3137–43Francois P 1991 J. Opt. Sci. Am. B 8 276–93Frosz M H, Bang O and Bjarklev A 2006 Opt. Express 14 9391–407Frosz M H, Moselund P M, Rasmussen P D, Thomsen C L and
Bang O 2008 Opt. Express 16 21076–86Frosz M H, Moselund P M, Rasmussen P D, Thomsen C L and
Bang O 2010 Supercontinuum Generation in Optical Fibersed J M Dudley and J R Taylor (Cambridge: CambridgeUniversity Press) chap 7
Fujii Y, Kawasaki B S, Hill K O and Johnson D C 1980 Opt. Lett.5 48–50
Genty G, Coen S and Dudley J M 2007a J. Opt. Soc. Am. B24 1771–85
Genty G, Kinsler P, Kibler B and Dudley J 2007b Opt. Express15 5382–7
Genty G, Lehtonen M and Ludvigsen H 2004 Opt. Express12 4614–24
Gorbach A and Skryabin D 2007a Nat. Photon. 1 653Gorbach A V and Skryabin D V 2007b Nat. Photon. 1 653–7Gorbach A V and Skryabin D V 2007c Phys. Rev. A 76 053803Gorbach A V, Skryabin D V, Stone J M and Knight J C 2006 Opt.
Express 14 9854–63Gordon J P 1986 Opt. Lett. 11 662–4Gourvia-Neto A S, Wigley P G J and Taylor J R 1989 Opt. Lett.
14 1122–4Gouveia-Neto A, Faldon M and Taylor J R 1989 Opt. Commun.
69 325–8Gouveia-Neto A, Gomes A and Taylor J 1988 IEEE J. Quantum
Electron. 24 332–40Hagen C, Walewski J and Sanders S 2006 IEEE Photon. Technol.
Lett. 18 91–3Hasegawa A and Brinkman W F 1980 IEEE J. Quantum Electron.
16 694–7Hollenbeck D and Cantrell C D 2002 J. Opt. Soc. Am. B 19 2886–92Islam M N, Sucha G, Bar-Joseph I, Wegener M, Gordon J P and
Chemla D S 1989a Opt. Lett. 14 370–2Islam M N, Sucha G, Bar-Joseph I, Wegener M, Gordon J P and
Chemla D S 1989b J. Opt. Soc. Am. B 6 1149–58Itoh H, Davis G M and Sudo S 1989 Opt. Lett. 14 1368–70Johnson S G and Joannopoulos J D 2001 Opt. Express 8 173–90Karasawa N, Nakamura S, Nakagawa N, Shibata M, Morita R,
Shigekawa H and Yamashita M 2001 IEEE J. QuantumElectron. 37 398–404
Karpman V 1967 J. Exp. Theor. Phys. Lett. 6 277–9Karpman V I 1993 Phys. Rev. E 47 2073–82Kinsler P 2008 arXiv:0707.0982v4Knight J 2003 Nature 424 847–51Korneev N, Kuzin E A, Ibarra-Escamilla B and
Flores-Rosas M B J A 2008 Opt. Express 16 2636–45
Kudlinski A, George A K, Knight J C, Travers J C, Rulkov A B,Popov S V and Taylor J R 2006 Opt. Express 14 5715–22
Kudlinski A and Mussot A 2008 Opt. Lett. 33 2407–9Kutz J N, Lynga C and Eggleton B J 2005 Opt. Express 13 3989–98Laegsgaard J 2007 Opt. Express 15 16110–23Leon-saval S G, Birks T A, Wadsworth W J, Russell P S J and
Mason M W 2004 Opt. Express 12 2864–9Lesvigne C, Couderc V, Tonello A, Leproux P, Barthelemy A,
Lacroix S, Druon F, Blandin P, Hanna M and Georges P 2007Opt. Lett. 32 2173–5
Lighthill M 1965 IMA J. Appl. Math. 1 269–306Lin C and Nguyen V T 1978 Electron. Lett. 14 822–3Lin C and Stolen R H 1976 Appl. Phys. Lett. 28 216Lin Q and Agrawal G P 2006 Opt. Lett. 31 3086–8Linden S, Giessen H and Kuhl J 1999 Phys. Status Solidi b 206
119–24Lu F, Deng Y and Knox W H 2005 Opt. Lett. 30 1566–8Mamyshev P and Chernikov S 1990 Opt. Lett. 15 1076–8Milam D 1998 Appl. Opt. 37 546–50Mussot A and Kudlinski A 2009 Electron. Lett. 45 29–30Nishizawa N and Goto T 2002 Opt. Express 10 1151–60Omenetto F et al 2006 Opt. Express 14 4928–34Price J et al 2007 IEEE J. Sel. Top. Quantum Electron. 13 738–49Ranka J K, Windeler R S and Stentz A J 2000 Opt. Lett. 25 25–7Ruban V et al 2010 Eur. Phys. J. 185 5–15Rulkov A B, Vyatkin M Y, Popov S V, Taylor J R and
Gapontsev V P 2005 Opt. Express 13 377–81Russell P 2003 Science 299 358–62Rusu M, Grudinin A and Okhotnikov O 2005 Opt. Express
13 6390–400Schreiber T, Limpert J, Zellmer H, Tunnermann A and Hansen K P
2003 Opt. Commun. 228 71–8Skryabin D V and Yulin A V 2005 Phys. Rev. E 72 016619Skryabin D V and Gorbach A V 2010 Rev. Mod. Phys. 82 1287–99Snyder A W 1970 IEEE Trans. Microw. Theory 18 383–92Solli D R, Ropers C and Jalali B 2008 Phys. Rev. Lett. 101 233902Solli D R, Ropers C, Koonath P and Jalali B 2007 Nature 450 1054Stolen R, Gordon J, Tomlinson W and Haus H 1989a J. Opt. Sci. Am.
B 6 1159–66Stolen R H and Bjorkholm J E 1982 IEEE J. Quantum Electron.
18 1062–72Stolen R H, Gordon J P, Tomlinson W J and Haus H A 1989b J. Opt.
Soc. Am. B 6 1159–66Stone J M and Knight J C 2008 Opt. Express 16 2670–5Tai K, Hasegawa A and Tomita A 1986 Phys. Rev. Lett. 56 135–8Tajima K 1987 Opt. Lett. 12 54–6Tamura K R, Kuhota H and Nakazawa M 2000 IEEE J. Quantum
Electron. 36 773–9Tamura K R and Nakazawa H 1999 IEEE Photon. Technol. Lett.
11 319–21Taylor J R (ed) 1992 Optical Solitons: Theory and Experiment
1st edn (Cambridge: Cambridge University Press)Taylor J R 2010 Supercontinuum Generation in Optical Fibers
ed J M Dudley and J R Taylor (Cambridge: CambridgeUniversity Press) chap 1
Teipel J, Turke D, Giessen H, Killi A, Morgner U, Lederer M,Kopf D and Kolesik M 2005a Opt. Express 13 1477–85
Teipel J, Turke D, Giessen H, Zintl A and Braun B 2005b Opt.Express 13 1734–42
Tombelaine V, Lesvigne C, Leproux P, Grossard L, Couderc V,Auguste J L, Blondy J M, Huss G and Pioger P H 2005 Opt.Express 13 7399–404
Travers J C 2009 Opt. Express 17 1502–7Travers J C 2010 Supercontinuum Generation in Optical Fibers
ed J M Dudley and J R Taylor (Cambridge: CambridgeUniversity Press) chap 8
Travers J C, Popov S V and Taylor J R 2005 Opt. Lett. 30 3132–4Travers J C, Rulkov A B, Cumberland B A, Popov S V and
Taylor J R 2008 Opt. Express 16 14435–47
18

J. Opt. 12 (2010) 113001 Review Article
Travers J C, Rulkov A B, Popov S V, Taylor J R, Kudlinski A,George A K and Knight J C 2006 Conf. on Lasers andElctro-Optics (Long Beach, CA) Optical Society of America,p CPDA11
Travers J C, Rulkov A B, Popov S V, Taylor J R, Kudlinski A,George A K and Knight J C 2007 Conf. on Lasers andElctro-Optics (Baltimore, MD) Optical Society of America,p JTuB2
Travers J C and Taylor J R 2009 Opt. Lett. 34 115–7Tse M L V, Horak P, Price J H V, Poletti F, He F and
Richardson D J 2006 Opt. Lett. 31 3504–6Tzolov V P, Fontaine M, Godbout N and Lacroix S 1995 Opt. Lett.
20 456–8Wadsworth W J, Joly N, Knight J C, Birks T A, Biancalana F and
Russell P S J 2004 Opt. Express 12 299–309
Wadsworth W J, Ortigosa-Blanch A, Knight J C, Birks T A,Man T and Russell P 2002 J. Opt. Soc. Am. B 19 2148–55
Wadsworth W J, Witkowska A, Leon-Saval S and Birks T A 2005Opt. Express 13 6541–9
Wai P K A, Menyuk C R, Lee Y C and Chen H H 1986 Opt. Lett.11 464–6
Washio K, Inoue K and Kishida S 1980 Electron. Lett. 16 658Xia C, Kumar M, Kulkarni O P, Islam M N, Fred L, Terry J,
Freeman M J, Poulain M and Maze G 2006 Opt. Lett.31 2553–5
Xiong C, Witkowska A, Leon-Saval S G, Birks T A andWadsworth W J 2006 Opt. Express 14 6188–93
Zakharov V and Ostrovsky L 2009 Physica D 238 540–8Zakharov V E and Shabat A B 1972 JETP Lett. 34 62–9
19