extending the performance, fuel efficiency and stability ... · the gas engine project at lund...
TRANSCRIPT

Extending the performance, fuel efficiency and stability of stoichiometric spark ignition natural gas engines – Gas engine research at KCFP 2007–2012 (Utökad prestanda, bränsleeffektivitet och stabilitet för stökiometriska naturgasdrivna tändstiftsmotorer – Gasmotorforskning på KCFP 2007–2012)
SGC Rapport 2013:286
Mehrzad Kaiadi, Per Tunestål, Ashish Shah
”Catalyzing energygas development for sustainable solutions”

Postadress och BesöksadressScheelegatan 3212 28 MALMÖ
Telefonväxel040-680 07 60
Telefax0735-279104
Hemsidawww.sgc.se
Extending the performance, fuel efficiency and stability of stoichiometricspark ignition natural gas engines – Gas engine research at KCFP 2007-2012(Utökad prestanda, bränsleeffektivitet och stabilitet för stökiometriskanaturgasdrivna tändstiftsmotorer – Gasmotorforskning på KCFP 2007-2012)
Mehrzad Kaiadi, Per Tunestål, Ashish Shah
Denna studie har finansierats av:EnergimyndighetenE.ON Gas Sverige ABGöteborgs Energi ABLunds Energikoncernen (publ) ABÖresundskraft ABScania CV ABSaab Automobile PowertrainVolvo Car Corporation ABVolvo Powertrain ABAB Volvo PentaCargine Engineering ABCaterpillar Inc.Chevron Energy Technology Company, a division of Chevron U.S.A. Inc.Finnveden Powertrain ABHoerbiger Control Systems ABNational Instruments Sverige ABToyota Motor CorporationWärtsilä Finland Oy
© Svenskt Gastekniskt Center AB

SGC Rapport 2013:286
2 Svenskt Gastekniskt Center AB, Malmö – www.sgc.se

SGC Rapport 2013:286
Svenskt Gastekniskt Center AB, Malmö – www.sgc.se 3
Svenskt Gastekniskt Center AB, SGC
SGC är ett spjutspetsföretag inom hållbar utveckling med ett nationellt uppdrag. Vi arbetarunder devisen ”Catalyzing energygas development for sustainable solutions”. Visamordnar branschgemensam utveckling kring framställning, distribution och användningav energigaser och sprider kunskap om energigaser. Fokus ligger på förnybara gaser frånrötning och förgasning. Tillsammans med företag och med Energimyndigheten och dessSamverkansprogram Energiteknik utvecklar vi nya möjligheter för energigaserna att bidratill ett hållbart samhälle. Tillsammans med våra fokusgrupper inom Rötning, Förgasningoch bränslesyntes, Lagring och transport, Industri och hushåll och Gasformiga drivmedelidentifierar vi frågeställningar av branschgemensamt intresse att genomföra forsknings-,utvecklings och/eller demonstrationsprojekt kring. Som medlem i den europeiskagasforskningsorganisationen GERG fångar SGC också upp internationella perspektiv påutvecklingen inom energigasområdet.
Resultaten från projekt drivna av SGC publiceras i en särskild rapportserie – SGCRapport. Rapporterna kan laddas ned från hemsidan – www.sgc.se. Det är också möjligtatt prenumerera på de tryckta rapporterna. SGC svarar för utgivningen av rapporternamedan rapportförfattarna svarar för rapporternas innehåll.
SGC ger också ut faktabroschyrer kring olika aspekter av energigasers framställning,distribution och användning. Broschyrer kan köpas via SGC:s kansli.
SGC har sedan starten 1990 sitt säte i Malmö. Vi ägs av E.ON Gas Sverige AB,Energigas Sverige, Swedegas AB, Göteborg Energi AB, Lunds Energikoncernen AB(publ) och Öresundskraft AB.
Malmö 2013
Martin RagnarVerkställande direktör
SGC Rapport 2013:286
4 Svenskt Gastekniskt Center AB, Malmö – www.sgc.se
Swedish Gas Technology Centre, SGC
SGC is a leading-edge company within the field of sustainable development having anational Swedish assignment. We work under the vision of “Catalyzing energygasdevelopment for sustainable solutions”. We co-ordinate industry-wide technicaldevelopment on the production, distribution and utilization of energygases anddisseminate knowledge on energygases. Focus is on renewable gases from anaerobicdigestion and gasification. Together with private companies and with the Swedish EnergyAgency and its frame program Co-operational program in Energygas technology wedevelop new solutions where energygases could provide benefits for a sustainablesociety. Together with our focus groups on Anaerobic digestion, Gasification and fuelsynthesis, Storage and transportation, Industry and household and Gaseous fuels weidentify issues of common interest in the industry to conduct joint research, developmentand/or demonstrations projects on. As a member of the European gas researchorganization GERG, SGC provides an international perspective to the development withinthe Swedish energygas sector.
Results from the SGC projects are published in a report series – SGC Rapport. Thereports can be downloaded free of charge from our website – www.sgc.se. It is alsopossible to subscribe to the printed reports. SGC is responsible for the publishing of thereports, whereas the authors of the report are responsible for the content of the reports.
SGC also publishes fact brochures and the results from our research projects in the reportseries SGC Rapport. Brochures can be purchased via the website.
SGC is since the start in 1990 located in Malmö. We are owned by E.ON Gas Sverige AB,Energigas Sverige, Swedegas AB, Göteborg Energi AB, Lunds Energikoncernen AB(publ) and Öresundskraft AB.
Malmö, Sweden 2013
Martin RagnarChief Executive Officer

SGC Rapport 2013:286
Svenskt Gastekniskt Center AB, Malmö – www.sgc.se 5
Authors’ foreword
The gas engine project at Lund University has previously explored extending theperformance, fuel efficiency and stability of SI natural gas engines. The first NGengine activities started in the beginning of the 1990s. In the first and secondphase of the natural gas engine project a lot of time was spent to measureturbulence and to investigate how the combustion chamber design influencedcombustion parameters and emissions. Those experiments were applied on asingle-cylinder Volvo engine TD102.
The third phase of the natural gas engine activities started from 2000 and endedin 2003. A 6-cylinder turbocharged Volvo engine (i.e. TG103) was used in thisphase. Different experiments were performed including investigating differentlocations for fuel injection, investigation of cylinder-to-cylinder and cycle-to-cyclevariations in a Lean Burn natural gas engine and a study to compare Lean Burnnatural gas engine versus stoichiometric operation with EGR. The results from thisphase showed that the stoichiometric operation is a better choice than leanoperation since by using a three-way catalyst the emissions level can be kept atvery low levels and differences in efficiency are not significant.
The fourth phase of the project started in the beginning of 2007. Based on theresults from phase three, the engine operating concept was decided to bestoichiometric and the research activities focused mostly on the problemsassociated with this type of operation. Extending the dilution limit of the engine anddeveloping closed-loop control to operate the engine at its dilution limit has beenthe main method to improve throttle losses. A new method for calculating cyclicvariation was developed that significantly improved the transient capability of theengine control system. The method consequently applied on a closed-loop dilutionlimit control which resulted in improvement in specific fuel consumption withacceptable transient capability. Ion current signals were studied at differentoperation condition. Cyclic variation of ion current integral was found to be arobust combustion stability parameter which can be used as more economicalalternative to cyclic variation derived from pressure sensors. Moreover, the keyfeatures to improve the engine performance are identified as, right amount of EGRat different operating regions, right compression ratio, Variable GeometryTurbocharger (VGT), high turbulent pistons, long route EGR system and model-based control. The started research activities from phase four prolonged and apart of that performed in phase five.
The existing phase started in the beginning of 2010 and it is expected to end in2012. Since the beginning of 2011 the project mainly focuses on exploringalternative ignition techniques as after completion of all previous phases it wasobserved that the capability of conventional spark plug ignition system was thefactor limiting the extent of dilution and hence emission reduction and efficiencyimprovement. Two most feasible alternative ignition systems were identified,namely diesel pilot injection and pre-chamber type ignition system but it was soonrealized that the former has already received considerable attention as there areproducts in the market under different names like The Hardstaff OIGI® (Oil IgnitionGas Injection), Westport’s High-Pressure Direct Injection (HPDI) applicable to awide range of engines. Comparatively, however, the concept of pre-chamberignition has received limited attention and is mainly applied to stationary or large

SGC Rapport 2013:286
6 Svenskt Gastekniskt Center AB, Malmö – www.sgc.se
bore marine engine which do not face as severe speed and load transients asexperienced by a heavy duty engine for mobile application. Reasons behind thisare believed to be limited knowledge about the mechanism of ignition resultingfrom a pre-chamber type ignition device and hence gaining deeper insight into thismechanism is currently the objective of the gas engine project.
This report gives a summary of the results from the first three phases of the gasengine activities at Lund University but the main focus of the report is on phasefour and five.
To the project a reference group has been linked consisting of the followingpersons;Mattias Svensson and Corfitz Nelsson, Swedish Gas Technology CentreIngemar Magnusson, Volvo Global Trucks TechnologyFolke Fritzson, ScaniaKenth Svensson, CaterpillarJari Hyvönen, Wärtsilä

SGC Rapport 2013:286
Svenskt Gastekniskt Center AB, Malmö – www.sgc.se 7
Summary
Most heavy-duty engines are diesel operated. Severe emission regulations, highfuel prices, high technology costs (e.g. catalysts, fuel injection systems) and un-sustainable fuel supplies are enough reasons to convince engine developers toexplore alternative technologies or fuels. Using natural gas/biogas can be a verygood alternative due to the attractive fuel properties regarding emission reductionand engine operation. Heavy-duty diesel engines can be easily converted for natu-ral gas operation which is a very cost effective process for producing gas engines.However, due to the high throttle losses and low expansion ratio the overall engineefficiency is lower than the corresponding diesel engines. Moreover the lower den-sity of natural gas results in lower maximum power level.
In this project (phase 4) key features and strategies which result in improvedefficiency, increased maximum power and improved transient capability of heavy-duty natural gas engines have been identified, validated and suggested. High EGRrates combined with turbocharging has been identified as a promising way to in-crease the maximum load and efficiency of heavy-duty gas engines. With stoichi-ometric conditions a three way catalyst can be used and thus regulated emissionscan be kept at very low levels. Obtaining reliable spark ignition is difficult howeverwith high dilution and there will be a limit to the amount of EGR that can be toler-ated for each operating point. Extending the dilution limit of the engine and devel-oping closed-loop control to operate the engine at its dilution limit has been themain method to reduce throttle losses.
Information about the combustion stability can be derived either from pressure orion-current data measured inside the cylinder. The reliability and robustness of thecombustion stability parameters derived from pressure and ion-current data werevalidated in separate studies. A new method for calculating cyclic variation wasdeveloped that significantly improved the transient capability of the engine controlsystem. The method consequently applied on a closed-loop dilution limit control.Only applying closed-loop control to operate the engine at its dilution limit resultedin 4.5% to 8% improvement in specific fuel consumption at 1200 RPM.
The dilution limit can also be extended by replacing the combustion chamberswith high turbulence pistons which enhances the combustion. New pistons weredesigned to increase the turbulence level to shorten the combustion duration.
The new piston modification resulted in changes in the exhaust gas characteris-tics. These changes, together with the fact that Variable Geometry Turbocharger(VGT) has big potentials to reduce further the throttle losses were the motivation toreplace the turbocharger with a well-matched VGT. It was demonstrated that VGTcan be used instead of throttle in more than 60% of the whole operating range ofthe engine meaning no throttle losses in this area.
Since reliable spark ignition is challenging at high boost and dilution levels pre-chambers have been considered as a solution in phase 5 of the project. Unfueledpre-chamber spark plugs have been evaluated and found to provide marginal im-provement of the dilution limit. Problems with pre-ignition limit their usefulness athigh load however. Ongoing work with fueled pre-chambers should provide betteropportunities.
In summary the key features to improve the performance of a stoichiometricallyoperated natural gas engine are identified as: right amount of EGR at different op-

SGC Rapport 2013:286
8 Svenskt Gastekniskt Center AB, Malmö – www.sgc.se
erating regions, right compression ratio, VGT, high turbulence pistons, powerfulignition, long route EGR system and model-based control. Applying the combina-tion of these strategies resulted in up to 10% improvement in specific fuel con-sumption while preserving combustion stability.

SGC Rapport 2013:286
Svenskt Gastekniskt Center AB, Malmö – www.sgc.se 9
Sammanfattning på svenska
Majoriteten av tunga motorer är idag dieselmotorer. Strikta emissionskrav, högatillverkningskostnader (t.ex. katalysatorer, bränsleinsprutningssystem) och ickehållbar bränsleförsörjning är tillräckliga orsaker för att övertyga motorutvecklare attundersöka alternativa teknologier och bränslen. Naturgas/biogas kan utgöra ettmycket konkurrenskraftigt alternativ pga. gynnsamma bränsleegenskaper för mo-tordrift och minskade emissioner. Det är relativt okomplicerat att konvertera tungadieselmotorer till ottomotorer med naturgasdrift och därigenom är detta ett kost-nadseffektivt sätt att producera gasmotorer. Pga. höga strypningsförluster och lågtexpansionsförhållande blir emellertid energieffektiviteten lägre än för motsvarandedieselmotor. Dessutom ger naturgasmotorn lägre maximal effekt på grund av na-turgasens låga densitet.
Projektet har identifierat och validerat nyckelområden för ökad energieffektivitet,effekt och transientprestanda för tunga gasmotorer. Hög halt av avgasåterföring(EGR) kombinerat med turboladdning kan höja såväl effekt som energieffektivitet.Med stökiometriskt bränsle-/luftförhållande kan dessutom en trevägskatalysatoranvändas och därigenom når man mycket låga emissionsnivåer. Med hög utspäd-ning blir det svårare att åstadkomma tillförlitlig antändning och därför finns det enutspädningsgräns för varje arbetspunkt som inte får överskridas. Höjning av ut-spädningsgränsen och utveckling av återkopplad reglering för att köra motorn påutspädningsgränsen har varit huvudspåret för att minska strypningsförlusterna.
Information om förbränningsstabiliteten kan erhållas antingen från tryckmätningeller från jonströmsmätning i cylindern. Tillförlitlighet och robusthet för stabilitets-parametrar baserade på båda dessa mätmetoder har validerats i separata studier.En ny metod för att beräkna cykel-cykelvariation under transient drift har utveck-lats och ledde till en drastisk förbättring av regleringen. När återkopplad regleringav utspädningen infördes ledde detta till en minskning av bränsleförbrukningenmed 4.5-8 % vid 1200 RPM.
Utspädningsgränsen kan utökas genom förändring av kolvgropen till en utform-ning som ger högre turbulens och därigenom snabbare förbränning. De nya kol-varna sänkte avgastemperaturen och ledde till lägre laddtryck. Detta motiveradeett byte av turboaggregat till en välmatchad VGT (variabel turbingeometri). EnVGT kan dessutom ersätta trotteln för lastreglering i 60 % av arbetsområdet vilketgör att strypningsförlusterna försvinner helt i detta område.
Eftersom tillförlitlig antändning är utmanande vid högt laddtryck och kraftig ut-spädning har förkammartändning studerats i projektet. Förkammartändstift utanseparat bränsletillförsel har provats och visat sig ha viss potential för utökad ut-spädningsgräns. Det som begränsar deras användbarhet är problem med glöd-tändning vid hög last. Pågående studier av förkammare med bränsletillförsel börerbjuda bättre möjligheter.
Sammanfattningsvis har följande nyckelområden identifierats för att förbättraprestanda och energieffektivitet för gasmotorer: rätt EGR-halt för varje arbets-punkt, rätt kompressionsförhållande, VGT, högturbulent förbränningsrum, kraftfullantändning, lågtrycks-EGR och modellbaserad återkoppling för styrningen. Näralla dessa åtgärder kombineras erhålls upp till 10 % minskning av bränsleförbruk-ningen med bibehållen förbränningsstabilitet.

SGC Rapport 2013:286
10 Svenskt Gastekniskt Center AB, Malmö – www.sgc.se
Innehåll
1. Background ................................................................................................... 12
1.1 Executive summary of phase 1, 2 and 3 ................................................. 12
1.1.1 Phase 1 (1994-1997) & phase 2 (1998-2000) .................................. 12
1.1.2 Phase 3 (2001-2003)........................................................................ 12
1.2 Phase 4 & 5 background (2007-2012)..................................................... 14
1.2.1 Objectives of the project ................................................................... 15
1.2.2 Scope of the project.......................................................................... 15
1.3 Outline of the report................................................................................. 15
2. Experimental setup........................................................................................ 16
2.1 The test engine........................................................................................ 16
2.2 The engine control system ...................................................................... 17
2.3 Measurement instruments....................................................................... 18
3. Dilution Limit Control ..................................................................................... 21
3.1 Improving Efficiency at Low/Part load ..................................................... 21
3.2 Combustion Stability................................................................................ 22
3.2.1 Combustion Stability Parameter Based on In-Cylinder Pressure...... 22
3.2.2 New Method for Calculation of Cyclic Variations .............................. 22
3.2.3 Combustion Stability Parameter Based on Ion current Signals ........ 24
3.3 Closed-Loop dilution limit control............................................................. 28
3.3.1 Closed Loop Lambda Control ........................................................... 29
3.3.2 Closed Loop EGR Control ................................................................ 29
3.3.3 Closed Loop Load Control ................................................................ 29
3.3.4 Closed loop Ignition Timing Control .................................................. 29
3.3.5 Experimental Results........................................................................ 30
4. Engine Modification to Improve Efficiency and Extend the Maximum Load limit36
4.1 Combustion chamber .............................................................................. 36
4.1.1 Combustion duration......................................................................... 37
4.1.2 Efficiency .......................................................................................... 38
4.1.3 Maximum load .................................................................................. 38
4.2 Variable Geometry Turbocharger ............................................................ 40
4.2.1 Extending the maximum load............................................................ 40
4.2.2 Reducing throttle losses by means of VGT....................................... 42
4.3 EGR system ............................................................................................ 46

SGC Rapport 2013:286
Svenskt Gastekniskt Center AB, Malmö – www.sgc.se 11
4.3.1 Short route versus Long route EGR System..................................... 46
5. Extending the Dilution Limit and Studying the Effect of Hythane onCombustion .......................................................................................................... 48
5.1 Gas data.................................................................................................. 49
5.2 Experiments ............................................................................................ 50
5.3 Results .................................................................................................... 50
5.3.1 Specific NOX versus Lambda............................................................ 51
5.3.2 Specific HC versus Lambda ............................................................. 52
5.3.3 Specific CO versus Lambda ............................................................. 53
5.3.4 Specific NOX versus EGR rate.......................................................... 53
5.3.5 Efficiencies and knock margins......................................................... 54
6. Alternative ignition systems........................................................................... 56
6.1 Summary of the results ........................................................................... 56
6.1.1 Literature Survey .............................................................................. 60
6.1.2 Future work....................................................................................... 60
7. Conclusions................................................................................................... 62
8. References.................................................................................................... 64

SGC Rapport 2013:286
12 Svenskt Gastekniskt Center AB, Malmö – www.sgc.se
1. BackgroundAs it was described in the “foreword” this report focuses on the gas engine projectactivities from phase 4 and 5 however in order to keep a track on the previous gasengine activities at Lund university, the report is started with a summary of thethree first phases.
1.1 Executive summary of phase 1, 2 and 3
1.1.1 Phase 1 (1994-1997) & phase 2 (1998-2000)The main focus of these phases was to study the influence of different combustionchamber design on combustion parameters as well as emissions.
In-cylinder flow measurements are made on six different combustion chambersin a single-cylinder1 (Volvo TD102) engine, using Laser Doppler Velocimetry(LDV) technique. Cylinder pressure and emissions are also measured and evalu-ated in terms of heat release and indicated specific emissions. The flow measure-ments show a large difference in mean velocity and turbulence between the sixpistons. A high turbulence combustion chamber (Quartette) identified whichshowed fast main combustion, due to the high turbulence peak located close totop dead center. This piston showed to be more tolerant to diluted mixtures interms of engine stability than the original combustion chamber (Turbine), thusmore suitable for lean burn operation. The results from these studies resulted inseveral technical papers and scientific reports. Some of the results from thesephases are reported in [2], [3] and [4].
1.1.2 Phase 3 (2001-2003)The engine used in phase 1 and 2 of the gas engine project is based on a ratherold diesel engine design originating from the 1960’s. The two valve cylinder headwas not the optimum and also the crevice volumes between piston and cylinderliner were large. This means breathing problems and large amounts of unburnedhydrocarbons. It was thus time to replace the engine with a newer design. A newengine was supplied by Volvo (i.e. 6-cylinder turbocharged Volvo engine TG103)for performing some research on a multi-cylinder engine. Some of the results fromthis phase of the gas engine activities can be found in [5], [6] and [7]. Summary ofthe different moments of this phase are presented as follow:
Multi-cylinder tests with various spark gaps and fuel injection locationsTests are performed on a turbocharged multi-cylinder version of the TD102 engine(TG103). Pulsed single-point fuel-injection close to the cylinders (at the throttle)led to large cylinder to-cylinder variations in lambda, resulting in variations in IMEPbetween the cylinders. Cylinders with richer mixtures have higher NOX emissions,and cylinders with leaner mixtures have higher cycle-to-cycle variations. Placingthe fuel injection before the turbo compressor led to much lower cylinder-to-cylinder and cycle-to-cycle variations, the maximum load was however reduced.Late ignition timing, high boost pressures and lean mixtures led to the need for asmall spark gap to avoid misfires. A larger gap improves combustion quality atidle, due to the higher spark energy with a larger gap.
1 6-cylinder engine with one of the cylinders operational and the other 5 motored

SGC Rapport 2013:286
Svenskt Gastekniskt Center AB, Malmö – www.sgc.se 13
Base engine performance and ion-current measurementsThe original ignition system was replaced by a SAAB-TK4 ignition system. Withthis system the ion-current signal can be measured, using the spark plugs as sen-sors. Various air/fuel ratios and ignition timings are tested to see the influence oncombustion and emissions, compared to the standard settings of lambda and igni-tion timing. Cycle-to-cycle variations increase rapidly with standard ignition as themixture becomes leaner. MBT ignition is much more tolerant to highly diluted mix-tures. HC and CO emissions are slightly lower with standard ignition timing be-cause of more post-oxidation, due to higher expansion and exhaust temperatures.The NOX emissions are up to three times higher with MBT ignition since the max-imum cylinder temperature increases. The maximum load is increased with MBTignition, as expected. Also efficiency and main combustion speed increase withMBT ignition timing. The ion-current measurements show a strong correlation be-tween variations in IMEP and variations in the current signal, averaged over 300cycles.
New engine control systemA new engine control system was installed. The open-source code made it possi-ble for us to implement new control features, such as closed-loop lambda control,engine dynamometer control, cylinder-individual fuel-injection duration and timing,cylinder balancing, and much more. A powerful ignition system and ion-currentmeasurement/evaluation in all cylinders are also valuable features of this system.Idle quality and maximum load was improved compared to the original con-trol/ignition system.
Combustion chamber effectsQuartette and Turbine combustion chambers are compared in the multi-cylinderengine, with closed-loop lambda control and fuel injection before the turbo com-pressor. Various air/fuel mixtures and ignition angles are tested at 12 bar BMEP,1200 rpm. Quartette has much faster main combustion and less cycle-to-cycle var-iations than Turbine, the same results as in the single-cylinder tests. The HCemissions are slightly higher with Quartette piston; this was not the case in thesingle-cylinder experiments. One reason may be that those tests were made with-out a turbocharger; the boost was generated by an external compressor. Thismeans that the post-oxidation of HC in the exhaust manifold before the exhaustturbine should be higher with the Turbine combustion chamber, since the tempera-ture is higher with this slow burning combustion geometry. No clear trend in NOXemissions, at MBT ignition, can be seen between the two pistons. The efficiency isthe same, or slightly lower, with Quartette.
Port fuel-injection and cylinder balancingA slight variation in fuel flow between the cylinders can be a problem when operat-ing close to the lean limit, since a small increase in air/fuel ratio will cause poorstability in that cylinder. Variations in airflow between the cylinders may also causethe same problem, even if the fuel flow is the same in all cylinders. One way toovercome this problem is to measure the combustion in all cylinders, using the ion-current signal. The results show that both cylinder to

SGC Rapport 2013:286
14 Svenskt Gastekniskt Center AB, Malmö – www.sgc.se
cylinder and cycle-to-cycle variations are decreased with ion-current cylinder bal-ancing.
Stoichiometric operation with EGR versus lean burn operationPort fuel injection, and Quartette combustion chamber, is used in these tests.Emissions, combustion and ion-current signal are evaluated, comparing lean burnvs. EGR operation. The raw emissions of HC and NOX are lower with EGR opera-tion. CO emissions are higher due to stoichiometric combustion. HC emissionsafter the three-way catalyst are 10 to 30 times higher at lean burn operation thanwith EGR. The NOX emissions are up to 700 times higher after the catalyst withlean burn compared to EGR operation. The CO emissions are 10 times higher withEGR, after the catalyst compared to lean operation.
The early combustion duration (ignition to 5% burnt) is much longer for the EGRcase, since EGR has a stronger influence on the laminar flame speed than excessair. The main combustion duration is however similar for both EGR and lean oper-ation. The high turbulence peak close to TDC (with this combustion chamber) mayexplain the fast main combustion for both EGR and lean operation. The brake effi-ciency is slightly lower with EGR compared to a high-efficiency lean burn strategy,mostly because of the high CO emissions. Higher load can be achieved with EGRcompared to the lean burn cases.
The ion-current signal is very weak at lean operation. A strong signal can befound at stoichiometric operation diluted with EGR though, which can be utilizedfor closed-loop control.
1.2 Phase 4 & 5 background (2007-2012)
Phase four (2007-2009) started based on the results from phase three, the engineoperating concept was decided to be stoichiometric and the research activitiesfocused mostly on the problems associated with this type of operation. The studiesfrom this phase extended partly to the fifth phase of the project (2010-2012).
From phase three it was concluded that the stoichiometric operation of the natu-ral gas engine should be prefered than the lean burn operation since with stoichi-ometric operation the cost effective 3-way catalyst can be used resulting in ultra-low engine-out emissions and the engine efficiency with diluted operation wascomparable to lean burn operation. However due to several reasons the overallefficiency of the stoichiometric operated natural gas engines are significantly lowerthan the corresponding diesel engines.
Normally stoichiometric operated natural gas engines use a throttle to regulatedemanded power. Use of a throttle introduces pumping losses which are particu-larly significant at low loads. Beyond that, the high octane number and high auto-ignition temperature of natural gas makes Compression Ignition (CI) an ill-suitedconcept. Normally for stoichiometric operation of natural gas Spark Ignition (SI)operation concept is used which results in use of lower compression ratio com-pared to diesel engines and thereby the lower efficiency achieves.
Furthermore, since diesel engines operate lean, the exhaust gas temperature islow and the construction materials do not tolerate high exhaust gas temperatures.The converted engines have more stringent limitations in terms of high exhaustgas temperatures than dedicated SI engines.

SGC Rapport 2013:286
Svenskt Gastekniskt Center AB, Malmö – www.sgc.se 15
In summary, throttle losses, lower compression ratio, sensitivity to highexhaust gas temperature and lower fuel density are main parameters whichresults in lower heavy-duty natural gas engine performance compared to dieselengines.
1.2.1 Objectives of the projectThe main objective of the project during 2007-2010 was to develop and apply new
strategies to improve the overall engine efficiency; extend the maximum power
level and improve the transient capability of the engine. Comparing a heavy-duty
natural gas engine to a corresponding diesel engine shows that:
Overall engine efficiency is lower due to throttle losses and lower compres-sion ratio.
Maximum power level of a natural gas engine is lower due to the lower gasdensity and knock phenomena.
Transient capability of the engine is limited due to the diluted operation ofthe engine and the small lambda window.
1.2.2 Scope of the projectThe scope of the project was as follow:
Use stoichiometric operation with three-way catalyst Explore diluted operation with large EGR fraction in order to increase
efficiency and suppress knock Employ in-cylinder sensing and control to limit cyclic, cylinder-to-cylinder
and lambda variations Explore engine modification to improve efficiency and extend the maximum
load level Explore Hythane as an alternative fuel to natural gas
1.3Outline of the report
Chapter one supplies a background to the gas engine project at Lund University.This chapter starts with a summary of the previous work performed at the depart-ment and continues with presenting the objectives and the scopes of the latestphase of the project. In chapter two the experimental engine, measurement sys-tem and control system used during phase 4 and 5 of the project are discussed. Inchapter three a dilution limit control was designed and evaluated and the im-portance of using model-based control strategy is highlighted. In chapter four theneeded engine modification to improve engine performance is discussed. In chap-ter five the effect of Hythane on combustion is discussed. Chapter six covers ex-perimental work with prechamber spark plugs for improved ignition quality.
The main conclusions from phase four and five are discussed in chapter seven.In chapter eight the planned work is listed followed by references.

SGC Rapport 2013:286
16 Svenskt Gastekniskt Center AB, Malmö – www.sgc.se
2. Experimental setup
2.1 The test engine
The project has had an experimental nature. The experimental engine was originallya heavy-duty diesel engine from Volvo Trucks which has been converted for naturalgas operation; see Table 1 for engine specification. The engine is equipped with ashort-route cooled EGR system and a turbocharger with wastegate.
Table 1. Specification of the engineNumber of Cylinder 6
Displacement 9,4 Liter
Bore 120 mm
Stroke 138 mm
Compression ratio 10,5 :1
Fuel Natural gas
Originally the engine is equipped with a single-point injection system, with four in-jectors at the fuel injector assembly. The single-point injection system was re-placed by a multi-port injection system. The main reasons for using a multi-portinjection system are the possibility of adjusting injection for each cylinder individu-ally (i.e. cylinder balancing) and faster response to throttle changes (i.e. bettertransient capability). The original fuel pressure system supplies gas at a pressureof approximately 10 bar. The test-bench engine is supplied with natural gas at apressure of 4 bar, thus the port injection system is equipped with 12 injectors (2per cylinder) to compensate the lower pressure and cover the whole load range,see. This also makes it possible to operate the engine with two different gaseousfuels simultaneously, in case it is desired.
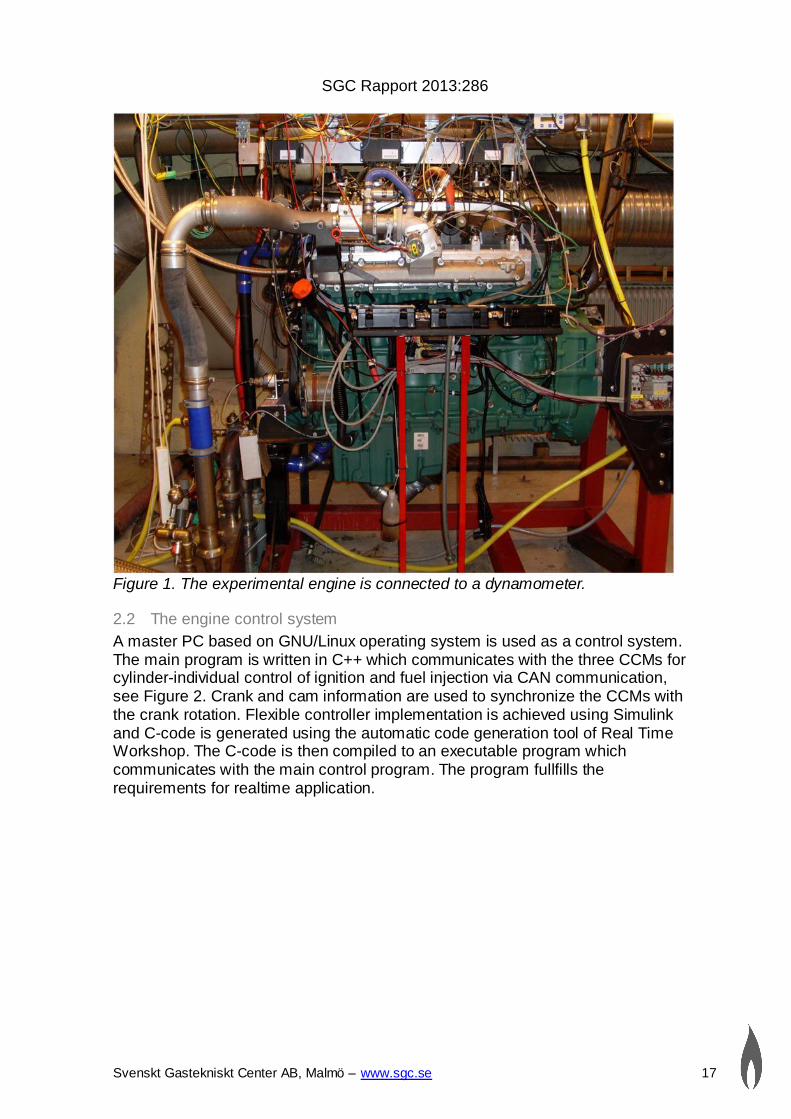
Cylinder-individual control of fuel injection and ignition is possible with a newplatform developed by Hoerbiger Control Systems. Three Cylinder-Control-Modules (CCM) are designed especially for cylinder-individual control of ignitionand fuel injection as well as ion current measurements. The modules use the well-known message-based protocol Control Area Network (CAN) for communication.The engine setup is shown in Figure 1. The three CCMs can be seen below theinlet part and the three boxes on top are ion current modules.
SGC Rapport 2013:286
Svenskt Gastekniskt Center AB, Malmö – www.sgc.se 17
Figure 1. The experimental engine is connected to a dynamometer.
2.2 The engine control system
A master PC based on GNU/Linux operating system is used as a control system.The main program is written in C++ which communicates with the three CCMs forcylinder-individual control of ignition and fuel injection via CAN communication,see Figure 2. Crank and cam information are used to synchronize the CCMs withthe crank rotation. Flexible controller implementation is achieved using Simulinkand C-code is generated using the automatic code generation tool of Real TimeWorkshop. The C-code is then compiled to an executable program whichcommunicates with the main control program. The program fullfills therequirements for realtime application.

SGC Rapport 2013:286
18 Svenskt Gastekniskt Center AB, Malmö – www.sgc.se
Figure 2. Engine setup structure. A master PC based on GNU/Linux operatingsystem is used as a control system
2.3 Measurement instruments
Different parameters were measured from the engine. Some of them such ascrank and cam information and throttle position were needed to operate the controlsystem and the engine. Lots of parameters such as in-cylinder pressure, ion-current, emissions, torque, different flows and temperatures etc. were measured toanalyze and evaluate the performance of the engine. Data was sampled with dif-ferent units, data acquisition cards and with different sample resolution. The mas-ter control PC communicates with two other PCs which sample emissions andsome other parameters (i.e. slow sampled data) via TCP/IP communication proto-col. Figure 3 shows the data flow and communications between PCs and the en-gine units.

SGC Rapport 2013:286
Svenskt Gastekniskt Center AB, Malmö – www.sgc.se 19
Figure 3 Different parameters were measured from the experimental engine.These parameters are such as in-cylinder pressure, cam and crank position, EGRvalve position, throttle position, emission, fuel and air flow etc.
The cylinder head is equipped with piezo electric pressure transducers of typeKistler 7061B to monitor cylinder pressures for heat release calculations. The ion-currents are sampled by CCMs using the spark plugs as sensors. In-cylinder pres-sure and ion current data are sampled by a Microstar 5400A (DAP 5400A) dataacquisition processor which is able to measure 1.25 MS/second (with 8 channels)[8]. To determine the crank shaft position a Leine & Linde encoder is used whichprovides five pulses per crank angle degree giving a resolution of 0.2 CAD. The in-cylinder pressure and ion current data were sampled with a resolution of 0.2 CAD.Three other parameters, lambda, inlet pressure and air flow were also sampledwith DAP 5400A but with lower resolution. Controlling lambda is one of the objec-tives of this work; thus fast lambda measurement and fuel calculation is essential.To measure lambda a broadband sensor from ETAS is used to provide a fasterresponse than the lambda calculated from exhaust analysis. To measure air flow aBronkhorst F-107A is used to provide accurate and fast response data for lambdacontrol.
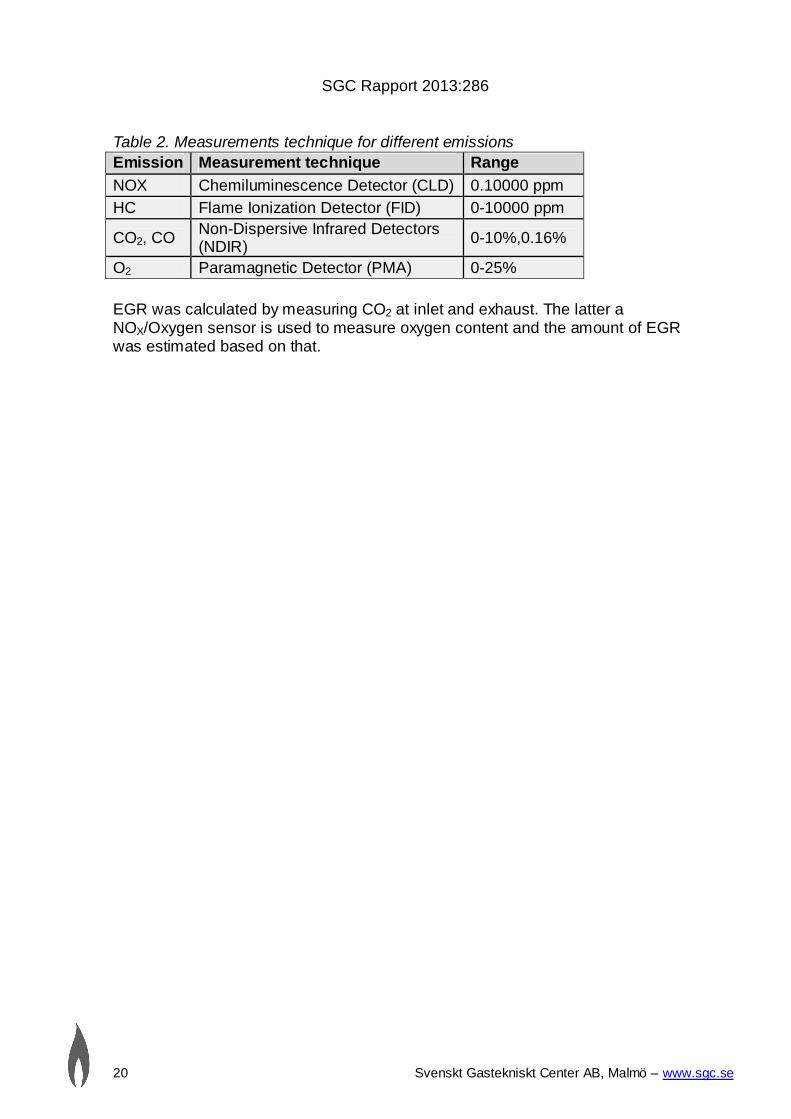
All temperatures were measured by Pentronic Type K thermocouples. Torque ismeasured from a load cell and fuel flow was measured by F type Bronkhorst flow-meter. All these data were sampled by a HP 3852A data acquisition unit whichgives a sample rate of 0.5 Hz. Emissions such as HC, CO, CO2, NO2, NOX and O2
are measured before and after catalyst. Different analyzers were used to measurethe emissions. A summary of the measurement techniques are presented in Table2.
Master PCLinux-based
CCM
IgnitionInjection
EMS2
EGR
CAN Communication 1
CAN Communication 2
Crank 3600CAM,Engine speed
HP EGR position
Throttle
In-cylinder PressureIon-CurrentLambdaAir-flowInlet pressure
Temperaturs (exhaust,Water, Oil, ...)Other PressuresFuel-flowTorque
Emissions (NOX, CO,CO2, HC, ...)
ServoSerial Communication
TCP-IP Communication
TC
P-IP
Com
mun
ication
DAQ (Fast)
DAQ (Slow)
DAQ (Slow)
Engine parameters
SGC Rapport 2013:286
20 Svenskt Gastekniskt Center AB, Malmö – www.sgc.se
Table 2. Measurements technique for different emissions
Emission Measurement technique Range
NOX Chemiluminescence Detector (CLD) 0.10000 ppm
HC Flame Ionization Detector (FID) 0-10000 ppm
CO2, CONon-Dispersive Infrared Detectors(NDIR)
0-10%,0.16%
O2 Paramagnetic Detector (PMA) 0-25%
EGR was calculated by measuring CO2 at inlet and exhaust. The latter aNOX/Oxygen sensor is used to measure oxygen content and the amount of EGRwas estimated based on that.

SGC Rapport 2013:286
Svenskt Gastekniskt Center AB, Malmö – www.sgc.se 21
3. Dilution Limit ControlIn this chapter an introduction about throttle losses and the effects on part/low loadefficiency is presented. Operating an engine at its maximum dilution limit is sug-gested as a practical solution to decrease the throttle losses and improve the effi-ciency. To ensure the combustion stability at these operating conditions robustcontrol is necessary. Details about the control structure, experiments and theevaluation of the control performance at steady-state and transient conditions arereported. Moreover a new method to calculate the combustion stability is devel-oped and discussed in this chapter.
3.1 Improving Efficiency at Low/Part load
By operating natural gas engines stoichiometrically a three way catalyst can beused which results in very low emissions however these types of engines sufferfrom poor gas-exchange efficiency at part or low loads due to high throttling loss-es. EGR is a well-known practice to improve engine fuel economy, decreaseknock tendency and reduce raw NOX emissions in certain operating regimes. Us-ing EGR results in improved fuel economy due to the following facts:
Reduced throttling losses (low/part loads): The addition of inert exhaust gasinto the intake system means that for a given power output, the throttle platemust be opened further, resulting in increased inlet manifold pressure andreduced throttling losses (see Figure 4).
Figure 4. Adding EGR means that for a given power output, the throttle plate mustbe opened further which results in lower throttle losses
Reduced heat rejection: Lowered peak combustion temperatures not onlyreduce NOX formation, it also reduces the loss of thermal energy to com-bustion chamber surfaces, leaving more energy available for conversion tomechanical work during the expansion stroke. Increased EGR rate makesthe combustion colder and the combustion duration longer but it can becompensated somewhat through advanced ignition timing.

SGC Rapport 2013:286
22 Svenskt Gastekniskt Center AB, Malmö – www.sgc.se
Reduced chemical dissociation: The lower peak temperature result in moreof the released energy remaining as sensible energy near Top Dead Center(TDC), rather than being expended (early in the expansion stroke) on thedissociation of combustion products. This effect is relatively minor com-pared to the first two.
The experimental engine is a standard production engine and is equipped with ashort route EGR system which is mainly used to suppress knock and not for im-proving fuel efficiency. When taking into account the advantages of EGR in im-proving efficiency it is desired to operate the engine at its dilution limit at low/partload operation regions. The dilution limit is imposed by increased cyclic variation ofthe combustion intensity that reduces the drivability. Thus, there will be a limit tothe amount of EGR that can be tolerated for each operating point. However,closed loop control of EGR based on combustion stability parameters can be agood means to improve the efficiency and preserve the engines stability at thesame time. On the way to reach this goal different methodologies and combustionstability parameters are used. Pressure/Ion current based dilution limit control isapplied on the EGR separately in order to maximize EGR rate as while preservingcombustion stability. Furthermore, standard closed loop lambda control for control-ling the overall air/fuel ratio is applied in order to keep the catalyst efficiency at itshighest level all the time.
3.2 Combustion Stability
Different combustion stability parameters can be used to measure the roughnessof the engine operation. In the following subsections a new method for calculatingcyclic variation and combustion stability parameters derived from pressure signalsand Ion current signals are discussed.
3.2.1 Combustion Stability Parameter Based on In-Cylinder PressureOne important and well-known measure of cyclic variability and combustion stabil-ity, derived from pressure data, is Coefficient of Variation (COV) of the IndicatedMean Effective Pressure (IMEP) [9], [10]. It is defined as the standard deviation ofIMEP divided by the mean value based on e.g. 100 cycles. The following equa-tions express cyclic variations where N is the number of the cycles.
( ) 100IMEPCOV IMEPIMEP
(1)
2( )
( ) 100( )
netIMEP IMEP
NCOV IMEPIMEP
(2)
3.2.2 New Method for Calculation of Cyclic VariationsUsing the traditional method for calculating COV(IMEP) during transient operationproduces erroneous results. A gradual deterministic change in IMEP results in a

SGC Rapport 2013:286
Svenskt Gastekniskt Center AB, Malmö – www.sgc.se 23
mean value that is not representative for the entire evaluation interval and thechange in operating point will be interpreted as cyclic variation. This means thatCOV calculations based on mean values are not suitable for transient operations.
It is desired to calculate and update the cyclic variations continuously andsmoothly over a fixed number of cycles i.e. 100 cycles. It is also desired to calcu-late COV(IMEP) in a way that transient operation of the engine does not affect thecalculations too much. To achieve this goal a new method is suggested which up-date the dataset continuously and uses a sort of low pass filter instead of meanvalue in order to eliminate the deterministic errors.
It is assumed that the mean value of IMEP is based on a dataset of 100 cycles(3). The dataset is desired to be updated continuously. This means that, the vectorof IMEP updates each cycle by replacing the oldest value by the newest one i.e.IMEP1 is replaced by IMEP101 (4).
1 2 3 100[ ... ]
100
IMEP IMEP IMEP IMEPIMEP
(3)
2 3 100 101[ ... ]
100New
IMEP IMEP IMEP IMEPIMEP
(4)
During step changes and transients there are still risks to get deterministic chang-es. The definition of Low-Pass Filter was helpful to calculate a filter set ofCOV(IMEP). A new variable is defined and named IMEPfilter and is calculated ac-cording to (5) where k is the cycle number and λ is a predefined weight that can be selected between [0 1]. Selecting λ is a trade-off between accuracy and transient performance. λ was chosen equal to 0.3 in this study. The final expression for cal-culating the cyclic variation of IMEP is expressed (6).
( 1) ( ) (1 ) ( )filtered m filtered m netIMEP k IMEP k IMEP k (5)
2( )
( ) 100
net filtered
filtered
IMEP IMEP
NCOV IMEPIMEP
(6)
To evaluate the performance of the new method a simulation is performed in Sim-ulink environment and the filter-based calculation was compared to the meanbased calculation. The comparison is performed in two stages, first under steady-state condition where the IMEP data are not varied and in the second step a tran-sient condition is provided by varying IMEP between 5 and 15 bars. The results forstead-state and transient cases are presented in Figure 5 and Figure 6 respective-ly. Figure 5 shows that under the steady-state conditions the methods work welland COV(IMEP) calculations are smooth and reliable. Figure 6 demonstratescomparison between the two methods under simulated transient conditions. Thefigure shows that the filter-based method can easily catch the transient and re-move the deterministic changes due to the lower weighting on the older IMEP val-ues. The mean based method is, however, unreliable and cannot be used duringtransients.

SGC Rapport 2013:286
24 Svenskt Gastekniskt Center AB, Malmö – www.sgc.se
Figure 5. COV(IMEP) calculations withdifferent methods at steady-stateconditions
Figure 6. COV(IMEP) calculations withdifferent methods under transientconditions
3.2.3 Combustion Stability Parameter Based on Ion current SignalsCOV(IMEP) is a combustion stability parameter derived from pressure signals.Direct measurement of in-cylinder pressure can be implemented with pressuresensors although their use in production vehicles is very expensive, not only intheir capital cost but in their required precision fitting and machining procedures.The ion current technique is a method of measuring in-cylinder combustion infor-mation in a non-intrusive and economical manner. A lot of researchers haveshown interest in ion-sensing in recent years concerning measurement techniquesand its possible applications [11], [12], [13], [15], [16]. The following subsectionstry to explain very briefly the basics of ion current and finally aim to find a compati-ble ion current based combustion stability parameter to COV(IMEP). The parame-ter should be robust enough to be used for diagnostic purposes.
Chemical reactions during the combustion process produce ions and electronsand the motion of these charged particles can be measured by applying a voltage( 100 V DC) over the spark plug which is used as an ion sensing probe. One pro-posal is to divide the ion current into three parts: the ignition phase, the chemical-ionization phase and the thermal-ionization phase [17]. Figure 7 shows a typicalion current trace and a pressure signal of an average of 400 cycles from the testengine. The ignition phase starts with charging the ignition coil and ends with thecoil ringing after the spark. The chemical-ionization phase reflects the early flamedevelopment in the spark gap and thermal-ionization phase appears in the burnedgases behind the flame front. The peak position often appears close to the positionof maximum cylinder pressure.
0 500 1000 1500 2000 2500 30000
5
10
15
Cycle number [-]
CO
V[%
]&
IME
P[B
ar]
Filter-based method Vs. Cycles @ steady-state condition
COV(IMEP)
IMEP
0 500 1000 1500 2000 2500 30000
5
10
15
Cycle number [-]
CO
V[%
]&
IME
P[B
ar]
Mean-based method Vs. Cycles @ steady-state condition
COV(IMEP)
IMEP
0 500 1000 1500 2000 2500 30000
5
10
15
20
Cycle number [-]
CO
V[%
]&
IME
P[B
ar]
Filter-based method Vs. Cycles @ Transient condition
COV(IMEP)
IMEP
0 500 1000 1500 2000 2500 30000
10
20
30
40
Cycle number [-]
CO
V[%
]&
IME
P[B
ar]
Mean-based method Vs. Cycles @ Transient condition
COV(IMEP)
IMEP

SGC Rapport 2013:286
Svenskt Gastekniskt Center AB, Malmö – www.sgc.se 25
Figure 7. Typical Pressure and Ion current signals Vs. Crank Angle Degree (CAD)
In order to find a proper ion current based combustion stability parameter, the be-havior of the ion current signal at different operating conditions was investigated.The engine was operated with different air/fuel ratios and different EGR rates.
Figure 8 shows ion current signals with different air/fuel ratios. According to thefigure the strongest ion current signal is achieved when operating the enginesomewhat lean (i.e. Lambda =1.1) but as the engine operates leaner or richer theion current amplitude decreases. Figure 9 shows the ion current signal behaviorwith different amounts of EGR. By increasing the EGR rate the amplitudes of thefirst and the second peaks decrease. This effect is strongest on the second peakwhich almost disappears at highly diluted operating conditions. The ion currentsignal is highly depended on the combustion temperature i.e. the colder the com-bustion the weaker the ion current signal.
Figure 8. Ion current signal decreaseswhen operating the engine too rich orlean
Figure 9. Ion current signal decreaseswhen increasing the amount of EGR
For combustion diagnostic purposes, reliable signals and parameters are require-ments. It is demonstrated in Figure 8 and Figure 9 that the signals from the firstand the second peak (especially second peak) becomes very weak as the com-
-400 -300 -200 -100 0 100 200 300 4000
2
4
6x 10
6
Pre
ssu
re[P
a]
CAD
Pressure & ION-CURRENT VS. CAD
-400 -300 -200 -100 0 100 200 300 400-2
-1
0
0.15
1x 10
4
ION
-CU
RR
EN
T[m
A]
Ignition phase
Chemi-ionization phase
Thermal-ionization phase
-40 -20 0 20 40 60-2000
-1500
-1000
-500
0
500
1000
1500
2000
2500
3000
CAD [Degree]
Ion-C
urr
entS
ignals
[mV
]
Ion-Current Signals with different Vs. CAD
=0.9 =0.95 = 1 =1.05 =1.1 = 1.15 =1.2 =1.3
-40 -20 0 20 40
-500
0
500
1000
1500
2000
2500
CAD
Ion
-Cu
rre
ntS
ign
als
[mV
]
Ion-Current signals with different EGR Rate Vs. CAD
EGR 0%
EGR 10%
EGR 15%
EGR 20%

SGC Rapport 2013:286
26 Svenskt Gastekniskt Center AB, Malmö – www.sgc.se
bustion becomes colder. For this reason, the information from the peaks may notbe robust enough for diagnostic purposes especially during very lean or dilutedoperation. However, the area created by the first and the second peak containsuseful and reliable information even at low combustion temperature that can beused for combustion diagnostic and control purposes. The area under the first andsecond peak can be expressed as a new parameter as in (7) where ܷ(ߠ) is thevoltage produced by the ion current interface. The ion-integral limits ଵandߠ ଶ�mustߠbe chosen so that the ignition phase is not a part of the integral and also such thatit includes the entire first and the second peaks (see Figure 10).
2
1
( )Integral ion
Ion U d
(7)
Figure 10. Ion-integral includes both the first and the second peak of the ioncurrent signals
An experiment according to Table 3 is performed. The aim of this experiment is tofind out if there is any correlation between COV(ion-integral) and COV(IMEP).
Table 3. Test matrix to capture the correlation between COV(Ion-Integral) andCOV(IMEP)
Speed (RPM) EGR Rate (%)
800 0-4-8-10-12-15
1000 0-4-8-10-12-15-20
1200 0-4-8-10-12-15-20
1400 0-4-8-10-12-15-20
To compute the cyclic variation 100 cycles of the data were used. Figure 11 showsCOV(ion-integral) correlation with COV(IMEP). It can be seen that COV(ion-integral) depends linearly on COV(IMEP) with different slopes at different enginespeeds. Figure 11 also shows that the level of COV(ion-integral) is much higher
-30 -20 -10 0 10 20 30 40
-500
0
500
1000
1500
CAD
ION
-CU
RR
EN
T[m
A]
2
1
Ion-Integral

SGC Rapport 2013:286
Svenskt Gastekniskt Center AB, Malmö – www.sgc.se 27
than the COV(IMEP). The slopes indicate that with increasing EGR the COV in-creases due to the colder and longer combustion. At low engine speed, COV(ion-integral) is much higher than at high engine speed. Figure 12 shows mean valuesof ion current signals for 400 cycles at different engine speeds. It shows that thechemical-ionization phase of the ion current signal becomes stronger with higherengine speed. One possible explanation is the better establishment of the earlyflame with higher engine speed. The thermal-ionization phase remains un-changed as engine speed varies. Better signal establishment at higher enginespeed results in lower COV(ion-integral) level.
Figure 11. COV(Ion-integral) seems tobe a function of speed
Figure 12. Ion current signals becomestronger with higher speed
A new parameter named COV(INDEX) is introduced as a combustion stability pa-rameter which is based on COV(ion-integral) and the product of engine speed andCOV(ion-integral). This parameter is introduced as a compatible parameter toCOV(IMEP). A multiple regression is performed which takes into account both ef-fects from COV(Ion-integral) and the product of engine speed and COV(ion-integral) and calculates the statistics for a line that best fits the data. Expression(8) is derived which describes the correlation line.
COV INDEX 0.000238 Speed COV(Ion-integral)
0.007 COV(Ion-integral) – 5.97
(8)
COV(INDEX) is calculated for the experimental data. Figure 13 shows howCOV(INDEX) correlates with COV(IMEP) of the experimental data. The standarddeviation for the residuals was calculated to 0.42 which assure the accuracy of theestimation equation.

SGC Rapport 2013:286
28 Svenskt Gastekniskt Center AB, Malmö – www.sgc.se
Figure 13. COV(INDEX) is derived based on a multiple regression from ion-integral and engine speed data and correlates well with COV(IMEP)
3.3 Closed-Loop dilution limit control
One of the objectives of this work is to develop a tool for mapping the best posi-tions of the throttle and EGR valve where the engine has the lowest pumping loss-es and the combustion stability index is still less than 5%. The combustion stabilityindicator can be either COV(IMEP) or COV(INDEX), both give the same infor-mation and the only difference between them is that COV(IMEP) is derived frompressure signals and COV(INDEX) is derived from ion current signals. The solu-tion applied here is to develop separate controllers for load (throttle), combustionstability (EGR) and lambda (fuel injection). The control structure is shown in Figure14.
Figure 14. Closed-Loop maximum dilution limit control
0.5 1 1.5 2 2.5 3 3.5 4 4.5 5-1
0
1
Re
sid
ua
ls
0.5 1 1.5 2 2.5 3 3.5 4 4.5 50
1
2
3
4
5
6
COV(IMEP) [%]
CO
V(I
ND
EX
)[%
]
Linear fitting

SGC Rapport 2013:286
Svenskt Gastekniskt Center AB, Malmö – www.sgc.se 29
3.3.1 Closed Loop Lambda ControlTo keep the 3-way catalyst efficiency at its highest possible level a feedback con-troller is needed. Closed loop lambda control evaluates the signal from the broad-band lambda sensor. The sensor measures the oxygen content in the exhaustgas, and thus provides information about the mixture composition. The closed-looplambda control strategy uses the injected fuel quantity as the manipulated variableand compensates for the lambda error. The error signal is based on the differencebetween the measured lambda and a desired set-point lambda and a ProportionalIntegral (PI) controller was used to generate a fuel-offset based on the error.
3.3.2 Closed Loop EGR ControlThe regulator always attempts to operate the engine at the maximum dilution limit.COV of IMEP or “INDEX” is set as the limitation indicator and the level is set to 5percent. The closed loop EGR control evaluates the calculated combustion stabil-ity parameter to control the EGR valve. The error signal is based on the differ-ences between the calculated COV(IMEP) and a set-point COV(IMEP) for 5%.The EGR valve opens more as long as the COV(IMEP) is less than 5%, and ifCOV(IMEP) exceeds 5% the regulator starts to close the EGR valve.
3.3.3 Closed Loop Load ControlThe increase in EGR ratio that follows from activating the combustion stability con-troller decreases the amount of air and thus, with fixed lambda, the load. Thus, aLoad controller is designed to adjust the throttle position to keep the load at a pre-defined level. It was also desired to have an automatic tool to find the best posi-tions of throttle and EGR based on the drivers load demand. The load controllerfulfills this requirement. The engine is connected to an electric dynamometer, andthe torque is measured with a load cell. Brake Mean Effective Pressure (BMEP) iscalculated from the measured torque according to equation 3.11 [18].
Closed loop load control evaluates the signal from the load cell. The error signal
is based on the difference between the measured BMEP and the demanded
BMEP and a throttle offset is generated from that. The throttle is adjusted by the
regulator to keep the measured BMEP at the same level as the desired BMEP. A
PI controller with Bump-less transfer and Anti-Windup algorithms was selected for
the task.
3.3.4 Closed loop Ignition Timing ControlFor each operating condition optimal spark timing can be obtained. The optimalspark timing is called Maximum Brake Torque (MBT) timing that yields to maxi-mum output load, highest efficiency and thereby lowest fuel consumption for eachoperating point. A common rule says that MBT timing results if 50% of the fuel isburned at about 10 CAD ATDC (i.e. CA50=10 ATDC) [1].
CA50 is almost unique for each operating condition, meaning different ignitiontiming is needed to obtain MBT at different loads and engine speeds. The ignitionstiming needed to achieve MBT at different load and engine speeds are presentedin Figure 15. Traditionally MBT timing is implemented as an open-loop controlwhere the ignition timing is found by using a static lookup tables. In this study afeed-forward map together with a PI controller is designed and used to achieveMBT for each cylinder individually. The error signal is based on the differences

SGC Rapport 2013:286
30 Svenskt Gastekniskt Center AB, Malmö – www.sgc.se
between the calculated CA50 and the set-point value. The ignition timing is subse-quently adjusted.
In multi-cylinder engines there are always variations in the performance of differ-ent cylinders which has negative impacts on the overall performance of the en-gine. The ignition timing was controlled individually for each cylinder. Figure 16shows that using a feedback controller improve the combustion phasing balance inall cylinders. The engine was operated at engine speed 1200 RPM and 8 barBMEP in this experiment.
Figure 15. MBT timing for differentloads and speeds
Figure 16. CA50 of all 6 cylinders withand without MBT controller
3.3.5 Experimental ResultsThe engine was tested for a variety of speed/loads at steady-state condition. Sincethe throttling losses are more critical at lower loads, it was decided to operate theengine in this region. Three different loads (i.e. 2.5, 4 and 5.5 bar BMEP) are cho-sen to be operated with different engine speed levels i.e. 800, 1000, and 1200RPM (see Table 4). The start of injection was fixed for all cases. To provide a ba-sis for fair comparison, experiments were conducted in two steps, first without add-ing EGR and no regulator was activated. In the second step by activating the con-trollers the engine was operated at its maximum dilution limit, at the demandedload with MBT timing and λ=1. The results are evaluated in terms of Brake Effi-ciency, pumping losses, fuel consumption and stability. Engine runs at stoichio-metric operating condition with a 3-way catalyst. Since the results for different en-gine speeds were similar, only the results from one of the engine speed (1200RPM) tests at 3 different loads are shown here (results from all engine speeds andloads can be found in [19] and [20]).
Table 4. Test matrix of the operating conditionsEngine Speed(RPM)
BMEP(Bar)
Strategies
800
2,5 NO EGR2,5 With regulator4 NO EGR4 With regulator5,5 NO EGR5,5 With regulator
2 4 6 8 10 12 14 1612
14
16
18
20
22
24
26
28
BMEP [Bar]
Ign
itio
nT
imin
g@
MB
T[C
AD
BT
DC
]
800 RPM
900 RPM
1000 RPM
1300 RPM
1500 RPM
Without Regulator With Regulator0
2
4
6
8
10
12
CA
50
[CA
D]
CA50 of Different Cylinders With and Without Regulator
Cylinder 1
Cylinder 2
Cylinder 3
Cylinder 4
Cylinder 5
Cylinder 6

SGC Rapport 2013:286
Svenskt Gastekniskt Center AB, Malmö – www.sgc.se 31
1000
2,5 NO EGR2,5 With regulator4 NO EGR4 With regulator5,5 NO EGR5,5 With regulator
1200
2,5 NO EGR2,5 With regulator4 NO EGR4 With regulator5,5 NO EGR5,5 With regulator
Figure 17 shows slightly higher gross-indicated efficiency in the cases with acti-vated controller. By increasing EGR rate the combustion is somewhat colder andcombustion duration will be longer but it can be compensated somewhat by ad-vancing the ignition timing. The combustion efficiency can increase somewhathowever since the exhaust gas has a second chance to be combusted in the cyl-inder. The net result shows a slight increase in gross indicated efficiency. The fig-ure shows that the gas-exchange efficiency is higher when the controllers are acti-vated since using EGR lets the throttle open even further to keep the load at thesame level. More open throttle means higher inlet pressure which results in highergas-exchange efficiency. The effect is stronger at higher loads since the turbu-lence is higher and the engine tolerates more EGR than at lower loads. The effecton mechanical efficiency is neglectable which was expected.
Figure 17. Due to the use of the regulators gas-exchange efficiency will beimproved which results in improvement of the total efficiency
The dilution limit and the stable operating region (i.e. region where COV(IMEP)islower than 5%) for different loads at 1200 RPM are plotted in Figure 18. X-axis
2.5 3 3.5 4 4.5 5 5.5
0.3
0.4
0.5
0.6
0.7
0.8
0.9
BMEP [Bar]
Eff
icie
nc
ies
[-]
Efficiencies [-] @ 1200 RPM
Gross Indicated Efficiency
Gas Exchange Efficiency
Mechanical Efficiency
Brake Efficiency
Gross Indicated Efficiency (Regulator)
Gas Exchange Efficiency (Regulator)
Mechanical Efficiency (Regulator)
Brake Efficiency (Regulator)

SGC Rapport 2013:286
32 Svenskt Gastekniskt Center AB, Malmö – www.sgc.se
shows BMEP in bar, Y-axis shows the rate of EGR in percentage and the coloredregion shows the level of COV(IMEP). As load and speed increases, more EGRcan be tolerated in the engine because of lower residual fraction and higher turbu-lence level. The figure also verifies the effect of EGR on cyclic variations.
Figure 18. The maximum dilution limit is specified at 1200 RPM. In this study thestable operating region is defined as the operating region where COV(IMEP) islower than five percent
Pumping losses are calculated and presented in form of PMEP. Figure 19 showsPMEP for the three evaluated loads (2.5, 4, and 5.5 bar BMEP) at 1200 RPM. TheX-axis shows the EGR valve opening position in percentage and the Y-axis showsthe throttle opening position in percentage. The triangle shows the stable regionfor the three loads. A certain throttle opening is needed to achieve a certain load.As the EGR valve opens more the throttle must be opened more to achieve thesame amount of load. As an example in Figure 19, the case at 5.5 bar can be con-sidered. When the EGR valve is closed the throttle is 34% open but as the EGRvalve opens more the throttle opens up to 42% to keep the load at the same level.The throttle opening results in almost 0.15 bar reduction in PMEP which corre-sponds to over 6% reduction of the Specific Fuel Consumption (SFC) (see Fig-ure 20). Figure 20 shows the same type of plot as Figure 19, but it shows SFC asa function of throttle and EGR valve position for the three loads at 1200 RPM.
The same experiment was performed by using COV(INDEX) instead ofCOV(IMEP) as combustion stability indicator in the EGR regulator. The results andthe control performance were as good as with COV(IMEP).
BMEP [Bar]
EG
Rra
te[%
]
COV(IMEP) @ 1200 RPM
3 3.5 4 4.5 5 5.50
5
10
15
20
2
2.5
3
3.5
4
4.5
5
Dilution Limit

SGC Rapport 2013:286
Svenskt Gastekniskt Center AB, Malmö – www.sgc.se 33
Figure 19. PMEP [bar] decreases as the throttle opens more.
Figure 20. SFC reduces as a result of more throttle opening
Figure 21 illustrates a typical performance of the different controllers. At the top ofthe figure CA50 is plotted as a function of cycle number. CA50 is tuned around 10CAD ATDC by adjusting the ignition timing which is plotted below CA50 in the fig-ure. Lambda is adjusted by controlling the injection duration and the cyclic varia-tion is controlled by regulating the amount of EGR.
X: 1.364 Y: 33.79
Index: 0.4368RGB: 0.313, 1, 0.688
Thro
ttle
Posi
tion
[%]
EGR Valve Position [%]
PMEP [Bar] @ 1200 RPM
X: 77.39 Y: 41.57Index: 0.2911
RGB: 0, 0, 0.625
0 10 20 30 40 50 60 70 8026
28
30
32
34
36
38
40
42
BMEP 2.5 bar
BMEP 4 bar
BMEP 5.5 bar
0.3
0.35
0.4
0.45
0.5
0.55
0.6
Not tested area
Unstable region (COVimep > 5%)
X: 0.9 Y: 33.7Index: 249.2
RGB: 0, 0.313, 1
Th
rott
leP
osi
tion
[%]
EGR Valve Position [%]
SFC [g/kWh] @ 1200 RPM
X: 79 Y: 41.9
Index: 230.8RGB: 0, 0, 0.563
0 10 20 30 40 50 60 70 8026
28
30
32
34
36
38
40
42
BMEP 2.5 bar
BMEP 4 bar
BMEP 5.5 bar
240
250
260
270
280
290
300
310
320
Not tested area
Unstable region (COV(IMEP) > 5%)

SGC Rapport 2013:286
34 Svenskt Gastekniskt Center AB, Malmö – www.sgc.se
Figure 21. Controllers performance. As COV(IMEP) increases from the predefinedlimit (i.e. 5%) EGR, Lambda and ignition timing are adjusted
A disturbance resulted in increase in cyclic variation, as it increases over the pre-defined value (i.e. 5%) the EGR valve starts closing and EGR rates decreases. Asresult of this change, injection duration and ignition timing should be adjusted toachieve high catalyst efficiency and MBT. The overall steady-state performancewas very good however the transient performance of the lambda controller waslimited. However it should be mentioned that the developed dilution limit controlshould be applied for steady-state operation or light transients and not sharp tran-sient operations.
200 400 6000
10
20C
A50
[CA
D]
200 400 60010
20
30
Ign
An
gle
[BT
DC
]
200 400 6000.96
0.98
1
1.02
1.04
[-
]
200 400 6002.5
3
3.5
InjD
ura
tion
[ms]
200 400 6000
20
40
CO
V(I
ME
P)
[%]
200 400 60011
12
13
14E
GR
Rate
[%]
200 400 6000
20
40
EG
RP
osi
tion
[%]
Cycles [-]
measured
Ref
measured CA50
Ref CA50
measured COV(IMEP)
Setpoint COV(IMEP)

SGC Rapport 2013:286
Svenskt Gastekniskt Center AB, Malmö – www.sgc.se 35
Only PI feedback controllers were used in this study but a combination of PI con-trollers and feed-forward maps or model-based controllers will further improve theperformance. PID type controllers do not perform well when applied to systemswith time delays. Model-based controller overcomes the problem of delayed feed-back by using predicted future states of the output for control. A model-based con-troller was developed, implemented and evaluated successfully in the project.

SGC Rapport 2013:286
36 Svenskt Gastekniskt Center AB, Malmö – www.sgc.se
4. Engine Modification to Improve Efficiency and Extend the Maximum Loadlimit
As already mentioned in the introduction there are mainly two reasons for naturalgas engines to have lower efficiency than the corresponding diesel engines: firstthe lower compression ratio which is limited due to knock and second, the use of athrottle for load control which causes severe pumping losses. A fuel’s octanenumber is a measure of its knock resistance [22]. Normally natural gas enginesuse the same combustion technology as gasoline engines due to the similarity infuel properties. However natural gas has a higher octane number than gasolineand thus natural gas operated engines can have higher compression ratio withoutexperiencing severe knock problems. The experimental engine has, originally, aconservative compression ratio at 10.5 which is quite low and can be increased tohigher levels (e.g. 12).
Another reason mentioned for the lower efficiency was throttle losses2. It wasestablished in chapter 4 that by operating the engine at its dilution limit, throttlelosses will be reduced drastically. It means that the extension of the dilution limitcan be another strategy to improve the fuel economy. As the engine operatesmore diluted the combustion will be colder and as a result the combustion durationbecomes longer. Increasing the turbulence level is one of the strategies that canenhance the combustion process and shorten the combustion duration. Thus, highturbulence level during the combustion is favorable especially with highly dilutedmixture. One parameter which highly affects the turbulence level in internal com-bustion engines is the shape of the combustion chambers.
The main objective of this chapter is to discuss the details of some engine modi-fications which resulted in improving the overall engine efficiency and extendingthe maximum load limit of the engine. The compression ratio of the engine wasincreased and the piston shape was designed to reduce the combustion duration.The new piston modification resulted in some changes in the exhaust gas charac-teristics. This was the motivation to replace the turbocharger with a well-matchedVGT to adjust the boost pressure level and extend the maximum load. The en-gine’s EGR system is modified in a way to deliver more EGR and also to control itin a faster and more robust way. Each of the performed modifications and the fol-lowing results in terms of engine performance are discussed in detail in the follow-ing subsections.
4.1 Combustion chamber
The first modification to the engine is to redesign the combustion chamber toachieve higher compression ratio and to increase the turbulence level. The com-pression ratio can be increased by reducing the compression volume, however toincrease the turbulence level the bowl shape should be designed in different way.In [21], [23] and [24] the effects of different combustion chambers designs on gasflow, combustion and emissions have been studied. One of the designs, named“Quartette”, that offers the highest turbulence level with good performance hasbeen chosen from [21].
2 Natural-gas engines can be operated stoichiometric or lean. Some of the lean operated natural-gas engines does not use throttle. The statement is only valid for the engines which uses throttle.

SGC Rapport 2013:286
Svenskt Gastekniskt Center AB, Malmö – www.sgc.se 37
Figure 22 illustrates the measured turbulence level, mean velocity and the rateof heat release together with the shape of the original piston and Figure 23 con-tains the same information for the Quartette piston. The turbulence measurementsare not from this study but since the shapes of the pistons and the engine configu-rations are very similar, it can be assumed that the results with the experimentalengine will be also very similar. In the figures the green lines represents the meanvelocity data, the red lines represent the turbulence in the cylinder and the bluelines represent the rate of heat release. Laser Doppler Velocimetry (LDV) wasused to measure the turbulence and mean velocity in two directions and 5 mmbelow the spark plug. Figure 23 shows that the turbulence is much higher withQuartette and peaks close to top dead center which result in much faster combus-tion than the original piston. A set of new pistons were machined according to the“Quartette” design. The compression volume was calculated to achieve a com-pression ratio of 12.
The results with the new pistons are presented in the following subsections.
Figure 22.The original piston shape, tur-bulence measurements, mean velocityand heat release rate [21]
Figure 23.The Quartette piston shape, tur-bulence measurements, mean velocity andheat release rate [21]
4.1.1 Combustion durationCombustion duration is calculated as the crank angle difference between 10% and90% mass fraction burned. Figure 24 shows the combustion duration when theengine was operated at different engine speeds with Wide Open Throttle (WOT).Due to the higher turbulence level generated by the Quartette piston, the combus-tion duration is shortened by almost 40% which is a significant reduction. Figure24 confirm the results reported in [21] about the high turbulence generation withthe Quartette design.
-10
-5
0
5
10
-10
-5
0
5
10U
V
u'
v'
HR
-60 -50 -40 -30 -20 -10 0 10 20 30 40 50 600
0.5
1
1.5
2
2.5
3
CAD
Tu
rbu
len
ce
(m/s
)&
RO
HR
(MW
)
Turbine Combustion ChamberM
ea
nve
locity
(m/s
)
-10
-5
0
5
10
-10
-5
0
5
10UV
u'v'
HR
-60 -50 -40 -30 -20 -10 0 10 20 30 40 50 600
0.5
1
1.5
2
2.5
3
CAD
Tu
rbu
len
ce
(m/s
)&
RO
HR
(MW
)
Quartette Combustion Chamber
Me
an
ve
locity
(m/s
)

SGC Rapport 2013:286
38 Svenskt Gastekniskt Center AB, Malmö – www.sgc.se
Figure 24. Combustion duration (CA10-CA90) at different engine speed (WOT)
4.1.2 EfficiencyThe gross-indicated efficiency data for the same operating points and for the twopistons are compared in Figure 25. The gross-indicated efficiency is improved byat least two percentage points with the Quartette pistons due to faster burn andhigher compression ratio. The new pistons’ shape resulted in increasing the turbu-lence level which consequently enhances the burn rate. The shorter combustionduration minimizes the heat transfer losses to the cylinder walls which improvesthe efficiency. Furthermore, increasing the compression ratio results in a highereffective expansion ratio meaning more thermal energy is used in the cylinder ra-ther than left in the exhaust (i.e. lower exhaust loss). At these operating points(WOT) the changes in gas-exchange efficiency and the mechanical efficiencywere negligible and thereby no data are presented. At lower loads the gas-exchange efficiency can be improved. Since the throttle is not fully open, EGR canbe used to reduce the throttle losses and since, with the Quartette piston, moreEGR can be tolerated the throttle can be more open, for a certain load, and withmore open throttle the pumping losses are lower.
Figure 25. Gross-indicated efficiency at different engine speed (WOT)
4.1.3 Maximum loadApart from efficiency improvement, extending the maximum load limit of the en-gine was another objective of this study. In order to find out the influence of the
800 1000 1200 1400 1600 18000.38
0.4
0.42
0.44
0.46
0.48
Engine Speed [RPM]
Gro
ss-I
nd
ica
ted
Effic
ien
cy
[-]
Gross-Indicated Efficiency Vs. Engine Speed @ (WOT)
Original Piston
Quarttete Piston
800 1000 1200 1400 1600 180010
12
14
16
18
20
22
24
26
28
Engine Speed [RPM]
Co
mb
us
tion
Du
ratio
n[C
AD
]Combustion Duration Vs. Engine Speed @ (WOT)
Original Piston
Quarttete Piston

SGC Rapport 2013:286
Svenskt Gastekniskt Center AB, Malmö – www.sgc.se 39
piston modification on the maximum load of the engine, maximum BMEP at differ-ent engine speeds are plotted in Figure 26. It shows that the maximum BMEPachieved by Quartette is somewhat lower than with the original pistons.
Figure 26. Maximum Load at different engine speed (WOT)
The new piston modification results in some changes in the exhaust gas charac-teristics and since the engine is equipped with a turbocharger with wastegate, thechanges in exhaust gas characteristics may have direct influence on the boostpressure. The pressure after the compressor is plotted in Figure 27 for the sameoperating points as in Figure 26. The absolute boost pressure with Quartette pis-tons is lower which results in lower maximum BMEP. Turbine work is performed bythe flow which turns the turbine and the shaft. From the conservation of energy,the turbine work per mass of airflow, W, is equal to the change in the specific en-thalpy, h, of the flow from the entrance to the exit of the turbine as expressed in(9). Specific enthalpy means enthalpy per mass of airflow. By expressing the defi-nition for enthalpy and taking into account parameters such as efficiency, η, pres-sure ratio, Pr, and specific heat ratio, a new expression for the turbine work is de-rived according to (10) [27].
in outW h h (9)
1
( ) 1p in rW c T P
(10)
From (10) it is clear that the inlet temperature of the turbine will affect the amountof work done by the turbine. Figure 28 shows the exhaust gas temperature whichis the same as the inlet temperature of the turbine. With the Quartette pistons theexhaust gas temperature is lower than with the original pistons. This is due to thehigher compression ratio of the Quartette pistons which results in more expansion.More expansion means that more heat is converted into mechanical work in thecylinder and less energy in the form of exhaust gas enthalpy is available. Lowerexhaust temperature means lower exhaust energy and thereby less charging fromthe turbocharger.
800 1000 1200 1400 1600 18009
10
11
12
13
14
15
16
17
18
Engine Speed [RPM]
BM
EP
[Ba
r]
Maximum Load Vs. Engine Speed @ (WOT)
Original Piston
Quarttete Piston

SGC Rapport 2013:286
40 Svenskt Gastekniskt Center AB, Malmö – www.sgc.se
Figure 27. Pressure after compressor atdifferent engine speed (WOT)
Figure 28. Exhaust gas temperature atdifferent engine speed (WOT)
As noted in the introduction, the exhaust gas temperature from this type of naturalgas engines (i.e. diesel converted engines) must be kept low. According to the
manufacturer the exhaust gas temperature should be lower than 760oC. The lower
exhaust gas temperature obtained with higher compression ratio is beneficial intwo ways. First, there is a higher margin to the highest allowable exhaust gas tem-perature and second, there is potential to extend the maximum load limit by re-placing the turbocharger with a better matched unit.
4.2 Variable Geometry Turbocharger
A Variable Geometry Turbocharger (VGT) has the ability to change the turbinegeometry in order to obtain the desired boost pressure. VGT offers attractiveproperties such as high flexibility, minimal amount of lag and wide operating range.VGT technology is extensively used in diesel engines; however the use of VGT isvery much ignored in gasoline engines due to their relatively high exhaust temper-atures. Ordinary VGT materials and designs cannot withstand temperatures over890°C [26]. The exhaust gas temperature of gasoline engines could, however,reach up to 1000°C, versus 650°C in diesel engines [25]. Normally natural gasengines use the same combustion technology as gasoline engines due to similarfuel properties. In heavy-duty applications, since the engine speed does not ex-ceed 2000 RPM, the exhaust gas temperature is not very high. As an example, themaximum allowable exhaust gas temperature for the experimental engine that op-erates stoichiometrically is 7600C which is tolerable for VGT material. Traditionallyheavy-duty natural gas engines use the same turbocharging technology as gaso-line engines. They are equipped with a turbocharger with wastegate but it is quitesimple and advantageous to replace the by-pass turbocharger with a well-matchedVGT to achieve the required boost pressure.
4.2.1 Extending the maximum loadAfter consulting with the R&D group at Volvo a VGT was designed and mountedon the engine. The engine is operated at the same engine speeds with WOT andby altering the geometry of the turbine housing the boost was increased until eitherknock occurred or the pumping losses started to increase. To suppress knock,
800 1000 1200 1400 1600 1800
1.2
1.4
1.6
1.8
2
Engine Speed [RPM]
Bo
ostp
res
su
re[B
ar]
Boost pressure Vs. Engine Speed @ (WOT)
Original Piston
Quarttete Piston
800 1000 1200 1400 1600 1800580
600
620
640
660
680
700
720
740
Engine Speed [RPM]
Exh
au
st-
Ga
sT
em
pe
ratu
re[C
]
Exhaust-Gas Temperature Vs. Engine Speed @ (WOT)
Original Piston
Quarttete Piston

SGC Rapport 2013:286
Svenskt Gastekniskt Center AB, Malmö – www.sgc.se 41
EGR was added and the ignition timing was adjusted accordingly. Figure 29shows the boost pressure achieved by the VGT in comparison with the by-passturbocharger with original and Quartette pistons. The boost pressure was in-creased up to much higher levels with VGT without sacrificing gas-exchange effi-ciency. The increase in boost pressure resulted in increased maximum load aspresented in Figure 30 compared to previous configurations. The peak load in-creased by 18 percent from 16 to 19 bar BMEP with maintained gas-exchangeefficiency and exhaust gas temperature limitation.
Figure 29. Boost pressure achievedafter replacing the turbocharger with aVGT in compared to the otherconfigurations.
Figure 30. Maximum load achievedafter replacing the turbocharger with aVGT compared to the otherconfigurations
Figure 31. Amount of EGR used to suppress the knock with different configurationviz. Quartette piston and VGT, Quartette/original piston with by-pass turbocharger
By increasing the compression ratio the knock tendency of the engine increases.The knock tendency increases even more when the boost pressure increases.EGR has been used as a remedy to suppress knock. When adding EGR, the igni-tion timing was adjusted to achieve MBT; of course, MBT was not achieved insome operating points. Figure 31 shows the amount of EGR needed with differentengine configurations. The needed EGR rate is obtainable in the entire operatingregion with all configurations.
800 1000 1200 1400 1600 1800
1.2
1.4
1.6
1.8
2
2.2
2.4
Engine Speed [RPM]
Bo
ost
pre
ssu
re[B
ar]
Boost pressure Vs. Engine Speed @ (WOT)
Original Piston
Quarttete Piston
Quarttete Piston & VGT
800 1000 1200 1400 1600 180010
12
14
16
18
20
Engine Speed [RPM]
BM
EP
[Ba
r]
Maximum Load Vs. Engine Speed @ (WOT)
Original Piston
Quarttete Piston
Quarttete Piston & VGT
800 1000 1200 1400 1600 18000
2
4
6
8
10
12
14
16
18
Engine Speed [RPM]
EG
Rra
te[%
]
EGR rate Vs. Engine Speed @ (WOT)
Original Piston
Quarttete Piston
Quarttete Piston & VGT

SGC Rapport 2013:286
42 Svenskt Gastekniskt Center AB, Malmö – www.sgc.se
4.2.2 Reducing throttle losses by means of VGTUsing a throttle always leads to pumping losses. The gas-exchange efficiency forthe whole operating regime of the experimental engine is presented in Figure 32.As BMEP decreases at each engine speed, the gas-exchange efficiency also de-creases due to the more closed throttle which results in more pumping losses.Some strategies have been reported to reduce the throttling losses. In [28],[19]and [20] EGR is used together with closed loop dilution limit control to reduce thethrottling losses. With this strategy the benefits are limited to the dilution limit of theengine; the transient performance of the engine is also limited. In [29] a technologycalled Waste Energy Driven Air Conditioning System (WEDACS) is developed torecover throttling losses. In [30], [31] and [32] the new and efficient strategy viz.Variable Valve Timing (VVT) is introduced which results in higher efficiency in awider operating range. However these strategies are associated with complexity,more components and higher cost.
Figure 32. Gas-exchange efficiency as a function of Load and Engine speed for aHDNG engine
This subsection presents an innovative strategy where a VGT is used to reducethe throttling losses in large operating region. In [33] the feasibility of using VGTfor the heavy-duty natural gas engine is established. Normally a throttle is used tocontrol the desired torque in the engines, but it is also possible to use a VGT in-stead of the throttle in a large operating range to control the desired torque. This ispossible due to the flexibility of the VGT to adjust the inlet pressure by altering thegeometry of the turbine housing. In this operation region the throttle is kept fullyopen and the VGT is used to adjust the inlet pressure and finally control the de-manded torque. This means that the throttle will not be used in a large part of theoperating region and no throttle use means any throttle losses.
The boost threshold for the experimental engine is specified in Figure 33. VGTstart producing boost only with enough amount of exhaust mass flow rate. Figure
Speed [RPM]
BM
EP
[Ba
r]
Gas-Exchange Efficiency [-]
1000 1200 1400 1600 18004
6
8
10
12
14
16
0.9
0.92
0.94
0.96
0.98

SGC Rapport 2013:286
Svenskt Gastekniskt Center AB, Malmö – www.sgc.se 43
33 shows the inlet pressure as a function of engine speed and BMEP after in-stalling a VGT on the engine. The VGT operating region is above the boostthreshold and is specified with the dashed lines. The covered operating region isroughly 60% of the total operating region of the engine.
Figure 33. Inlet pressure as a function of Load and Engine speed for the HDNGengine equipped with VGT. Operating range with VGT is specified with the dashedlines
The feasibility of reducing losses by means of VGT is studied and quantified indetail and is reported in the following three subsections. In the first subsection thepossible gains with VGT in terms of gas-exchange efficiency is discussed. Thetime constants of load transients when using VGT or throttle are calculated andcompared in the second subsection and in the third subsection the achieved re-sults are validated by performing the same experiments at other operation points.
Improvement in Gas-Exchange EfficiencyTo quantify the gain in gas-exchange efficiency, IMEP was altered between 10and 14 bar at 1000 RPM once by using the throttle and once by using the VGT.First the throttle is used to change the load. In this case the VGT position is fixed(i.e. 60% closed) and the throttle was altered between 40 and 100% opening toachieve the desired load. The results are evaluated in terms of gas-exchange effi-ciency (see Figure 34). The Y-axis to the left shows the throttle position and the Y-axis to right illustrate the gas-exchange efficiency. The X-Axis indicates the num-ber of cycles. Once the throttle was fully opened, the gas-exchange efficiency in-creased from roughly 98 percent to almost 100 percent. It confirms that the throt-tling losses results in roughly 2 percent unit losses in gas-exchange efficiency atthis operating point. In the second experiment the throttle was kept fully open andthe VGT is used to alter the desired load at the same engine speed. The VGT po-sition is altered between 0 and 60% to adjust the desired boost and subsequently
Speed [RPM]
BM
EP
[Ba
r]
Inlet Pressure [Bar]
1000 1200 1400 1600 18004
6
8
10
12
14
16
18
20
0.8
1
1.2
1.4
1.6
1.8
2
2.2

SGC Rapport 2013:286
44 Svenskt Gastekniskt Center AB, Malmö – www.sgc.se
to achieve the desired IMEP. The load was altered in the same range as it wasaltered by the throttle. Figure 35 shows the gas-exchange efficiency as the VGT isused to control the load. The Y-axis to the left shows the VGT position and the Y-axis to right illustrates the gas-exchange efficiency. Since no throttling has oc-curred to adjust the desired load, no losses are introduced and the gas-exchangeefficiency is kept at its highest level all the time i.e. almost 100%. During the tran-sient (i.e. step responses) some wave pulses are generated which result in over-shoots in the opposite direction (see Figure 35). For instance when openingthe VGT, exhaust backpressure decreases, but it takes a while beforethe inlet pressure falls, thus lower pumping loss and higher gas-exchange efficien-cy for some cycles can be achieved. In the same way higher pumping loss isachieved for some cycles when closing the VGT. The duration of these overshootscorresponds to the turbochargers lag at this operating point.
Figure 34. Gas-Exchange efficiency asthrottle used to control the desired loadat 1000 RPM
Figure 35. Gas-exchange efficiency asVGT used to control the desired load at1000 RPM
Suggested control strategy for lowest possible throttle losses (Fuel-efficient driv-
ing)
To avoid the throttle losses as much as possible a control strategy is suggested. Itgives two options to the driver to control the desired load. The driver will be able todrive either in the conventional way i.e. with throttle or in a fuel-efficient mode.With the fuel-efficient strategy, the throttle is avoided as much as possible. Withthis mode, to control the load mainly VGT, partly EGR and partly a combination ofthrottle and EGR is used.
The whole operating region of the engine is divided into three main regions. Thebiggest operating region, located above the boost threshold, can be covered bythe VGT. In this region, as already discussed in the previous subsection, the throt-tle is fully open and the load is totally controlled by altering the geometry of theturbine housing. This results in adjusting the boost pressure which consequentlydecides the torque. This region is specified in Figure 36. 60 percent of the totaloperating region can be covered by VGT. The second region is located under theboost threshold. The throttle can still be fully open and by adding EGR the amountof load is decreased. This means that in this region the EGR valve is the main ac-tuator for controlling the desired load. Since the throttle is still fully open in this op-
0 100 200 300 400 500 600 700 80030
45
60
75
90
Th
rott
leP
os
itio
n[%
]
Cycle number [-]
Throttle Position / Gas-Exchange Eff Vs. Cycles
0 100 200 300 400 500 600 700 80097
98
99
100
101
102
Ga
s-E
xch
an
ge
Effic
ien
cy
[%]
Throttle Position
Gas-Exchange Efficiency
0 100 200 300 400 500 600 700 8000
20
40
60
80
VG
TP
ositi
on
[%]
Cycle number [-]
VGT Position / Gas-Exchange Eff Vs. Cycles
0 100 200 300 400 500 600 700 80097
98
99
100
101
102
Ga
s-E
xch
an
ge
Effic
ien
cy
[%]
VGT Position
Gas-Exchange Efficiency

SGC Rapport 2013:286
Svenskt Gastekniskt Center AB, Malmö – www.sgc.se 45
erating region there will not be any throttle losses. There is a limit for the amountof EGR with the fully open throttle. Increasing cyclic variation in IMEP can be agood indication of this limit. The throttle is used combined with the optimal amountof EGR in the third region. Figure 36 demonstrates the three discussed operatingregions and Figure 37 describes the suggested control strategy.
Figure 36. The economical driving requires different strategies in differentoperating regions.
Figure 37. The suggested control strategy for fuel-efficient driving results in thelowest possible throttling losses.
Speed [RPM]
BM
EP
[Bar]
Inlet Pressure [Bar]
1000 1200 1400 1600 18004
6
8
10
12
14
16
18
20
0.8
1
1.2
1.4
1.6
1.8
2
2.2
Fuel-efficient
Over boostthreshold
Use VGT
Under boostthreshold
Use EGR
COV > =5 %
Use throttle
& EGR
Very low load
Use throttle& EGR
VGT
Throttle&EGR
EGR

SGC Rapport 2013:286
46 Svenskt Gastekniskt Center AB, Malmö – www.sgc.se
4.3 EGR system
The engine is equipped originally with a short route EGR system also called HighPressure (HP) EGR system. It was established in chapter 3 that high dilution isvery advantageous at part load. Since the engines’ pistons are replaced with highturbulence pistons the engine will be more tolerant to higher EGR rates. Howeverthe HP EGR configuration can deliver only up to 20% EGR. To increase the en-gine’s ability to deliver more EGR and also to control the EGR rate in a faster andmore robust way a long route EGR system, so called Low Pressure (LP), is addedto the engine (see Figure 38). Moreover a back pressure valve was installed afterthe catalyst to increase the exhaust pressure when needed in order to deliver thedesired EGR rate. This type of double EGR configuration (HP + LP) is previouslypresented in [34].
Figure 38. The engine setup with both short and long-route EGR systems.
4.3.1 Short route versus Long route EGR SystemIn order to compare the dynamics of the two EGR configurations, a step responsewas made to vary the rate of EGR between roughly 1-2% and 15% at 1000 RPM.This experiment was done once with the short route EGR position and once withthe long route EGR position. The results from these experiments are presented inFigure 39 and Figure 40 for the short route and long route EGR system respective-ly. The Y-axis to the left belongs to the EGR valve position and the Y-axis to theright shows the measured EGR rate over 800 combustion cycles. The operatingconditions such as load, engine speed etc. were the same for both experiments.

SGC Rapport 2013:286
Svenskt Gastekniskt Center AB, Malmö – www.sgc.se 47
Surprisingly the dynamics with the long route EGR system are much faster thanwith the short route EGR system which was in contrast to our hypothesis. The dy-namics of the short route EGR system relies on the dynamics of the turbochargerand its lag. The other reason for the faster dynamics with the long route EGR sys-tem rather than the short route is the better pressure difference.
Apart from the faster dynamics, the long route EGR system is advantageous inseveral other ways. First of all, engine operation is more stable due to better distri-bution and mixing of the EGR with air and fuel (i.e. the longer distance the moretime for mixing). Secondly, the EGR goes through an intercooler and the mixturebecomes colder and consequently the engine becomes more knock resistant.Third, due to the higher pressure difference more EGR can be delivered than withthe short route EGR system. The only drawback with the long route EGR systemis that more water will be produced in the intake which should be systematicallydrained.
By taking into account all the discussed facts, it can be easily concluded thatmid-range control of EGR is not needed since by only using the long route EGRsystem, the requirements for robust EGR control can be fulfilled (i.e. the shortroute EGR system is not needed at all).
Figure 39. The dynamics of the shortroute (i.e. HP) EGR system.
Figure 40. The dynamics of the longroute (i.e. LP) EGR system.
0 100 200 300 400 500 600 700 8000
20
40
60
80
HP
EG
RP
ositi
on
[%]
Cycle number [-]
HP EGR Position / EGR rate Vs. Cycles
0 100 200 300 400 500 600 700 8000
5
10
15
20
EG
Rra
te[%
]
HP EGR Position
EGR rate
0 100 200 300 400 500 600 700 8000
2
4
6
8
LP
EG
RP
ositio
n[%
]
Cycle number [-]
LP EGR Position / EGR rate Vs. Cycles
0 100 200 300 400 500 600 700 8000
5
10
15
20
EG
Rra
te[%
]
LP EGR Position
EGR rate

SGC Rapport 2013:286
48 Svenskt Gastekniskt Center AB, Malmö – www.sgc.se
5. Extending the Dilution Limit and Studying the Effect of Hythane on Com-bustion
Extending the dilution limit has been identified as a beneficial strategy to im-prove efficiency and decrease emissions in stoichiometrically operated naturalgas engines. However the dilution limit is limited mainly due to the lower burnrate of natural gas. One way to extend the dilution limit in a natural gas engineis to operate the engine with a natural gas which is enriched with hydrogen.
Hydrogen and methane are complimentary fuels in some ways. Natural gasconsists mainly of methane (~90%) which has a relatively narrow flammabilityrange. This is especially a problem when a natural gas engine is operated closeto its lean or dilution limit. Methane has a slow laminar flame speed, especiallyin lean or diluted operation, while hydrogen has a much faster laminar flamespeed [36] and [37]. Figure 41 shows flame propagation velocity for methaneand hydrogen versus air-fuel ratio. Methane is a fairly stable molecule that canbe difficult to ignite, but hydrogen has an ignition energy requirement much low-er than methane. In [39], [40], [41] and [42] some benefits of using Hythane arereported. In [43] benefits of hydrogen addition to a lean burn natural gas engineare investigated. In the work the hydrogen addition was varied from 5 to 20%(by volume) while the engine was operated lean. Some small improvements inefficiency and unburned hydrocarbon emissions are reported in the work. In [44]a study was performed by the author of this thesis to investigate the effect ofHythane on a stoichiometrically operated multi-cylinder natural gas engine.
The main objective of the work was to investigate the knock sensitivity and pos-sible gain in dilution limit, lean limit, emissions and efficiency of the engine by en-riching the natural gas with 10% hydrogen. No significant differences in terms ofknock margin, efficiency and emissions levels between the blended natural gasand the pure natural gas were observed in the study. From the results it was con-cluded that when the engine is operated stoichiometrically the combustion charac-teristics are already good with short enough combustion duration and the Hythaneshows no improvement compared to natural gas. Since no significant results wereachieved with 10% hydrogen addition, a complementary study was performed with25% hydrogen addition. The main objective of this work was to investigate the ef-fects of the hydrogen addition on knock margin, efficiencies, emissions and dilu-tion limit of a stoichiometrically operated natural gas engine. It was also desired tocompare the possible advantages with Hythane in diluted operation versus thelean operation natural gas engines.
One important parameter which should be addressed and kept in mind duringthe reading of this section is the importance of the recent piston modification.The pistons of the engine were replaced by highly turbulent pistons whichspeed up the combustion rate. This characteristic of the piston has similar ef-fects as Hythane on the combustion process. This means that the effects of theHythane could be more obvious with the original pistons rather than the newpistons. It should also be mentioned that during these experiments VGT wasnot mounted on the engine.

SGC Rapport 2013:286
Svenskt Gastekniskt Center AB, Malmö – www.sgc.se 49
Figure 41. flame propagation velocity over air-fuel ratio [38]
5.1 Gas data
The compositions of the natural gas and the Hythane are presented in Table 5and Table 6 respectively. The main change in the gas properties is the percent-age of Methane which is reduced by 25% and replaced by hydrogen. All thepercentages reported in the tables are volume based. Some important proper-ties of the fuels such as H/C ratio, stoichiometric AFR value, lower heating val-ue and density of the Hythane and natural gas are presented in Table 7.
Table 5. Natural Gas composition Table 6. Hythane composition
Composition % Structure
Methane 89.8 CH4
Ethane 5.87 C2H6
Propane 2.23 C3H8
I-Butane 0.37 C4H10
N-Butane 0.51 C4H10
I-Pentane 0.13 C5H12
N-Pentane 0.08 C5H12
Hexane 0.06 C6H14
Nitrogen 0.3 N2
CO2 0.63 CO2
Compositions % Structure
Methane 67.4 CH4
Ethane 4.3 C2H6
Propane 1.7 C3H8
I-Butane 0.2 C4H10
N-Butane 0.4 C4H10
I-Pentane 0.11 C5H12
N-Pentane 0.09 C5H12
Hexane 0 C6H14
Nitrogen 0.3 N2
CO2 0.5 CO2
Hydrogen 25 H2

SGC Rapport 2013:286
50 Svenskt Gastekniskt Center AB, Malmö – www.sgc.se
Table 7. More properties of the fuels
Property Natural Gas HythaneH/C Ratio 3.7 4.32StoichiometricAFR
16.9 17.56
LHV ( MJ/kg) 48.4 50.76Density (Kg/Nm3) 0.82 0.638
5.2 Experiments
The experiments were performed in three different stages. Since the objective wasto compare the effects of the natural gas and the Hythane respectively on engineoperating parameters; the engine is operated twice at each stage, once with natu-ral gas and once with Hythane. Details about the experiments are as follows:
Lambda response: in this experiment the engine operated at 1000 RPM.The sweep is started at lambda=0.8 and lambda was subsequently in-creased until the lean limit was reached. In this experiment the air flow isconstant and the fuel flow is varied to achieve the desired lambda value.The ignition timing was adjusted to achieve Maximum Brake Torque (MBT)timing.
EGR response: In this experiment the engine was operated stoichiometri-cally at 1000 RPM. The EGR ratio was increased until the dilution limit isreached.
Map: The engine was operated stoichiometrically at different loads and en-gine speeds to study the overall performance of the engine in the entire op-erating region. It was of particular interest to investigate the knock margin ofthe engine. It should be kept in mind that in this experiment EGR was onlyused to suppress knock and not to increase efficiency3.
Since the stoichiometric value is not the same for both fuels, this value was calcu-lated for each fuel and the lambda sensor was calibrated once the fuel waschanged. For each operating point measurements from 300 cycles were collected.
5.3 Results
In the first experiment the lean limit of the engine was investigated. The lean limitof the engine at 1000 RPM was extended from 1.6 to 1.8 by using the Hythane asfuel (see Figure 42). The sudden increase in cyclic variation of IMEP due to misfirein some cycles is used as an indication to identify the lean limit of the engine. Thecombustion duration becomes longer as the engine operates leaner. Extension ofthe lean limit is due to faster burn rate and lower energy requirement for ignition ofHythane. For comparison it can be mentioned that the lean limit with the originalpistons was 1.4 and was extended to 1.6 with the new pistons. Average of com-bustion duration for all 6 cylinders is calculated and plotted over a lambda rangefor both fuels in Figure 43. Combustion duration is defined as the difference be-tween the Crank Angle (CA) where 10% of the total heat is released (CA10) andthe CA where 90% of the total heat is released (CA90). Combustion duration is
3 EGR can also be used to improve the efficiency by reducing the throttling losses

SGC Rapport 2013:286
Svenskt Gastekniskt Center AB, Malmö – www.sgc.se 51
shorter with Hythane due to the faster flame speed. The difference is not much asthe engine operates close to stoichiometric but as the engine operates leaner, thecombustion duration increases and the difference is more obvious. Due to thehigher burn rate of Hythane, the ignition timing is retarded to achieve MBT timing.
Figure 42. COV(IMEP) versus lambda Figure 43. Comb duration versuslambda
CA10 and CA90 for both fuels over the lambda range are plotted in Figure 44 andFigure 45. CA10 is retarded as a consequence of the retarded ignition timing butCA90 is the same for both fuels.
Figure 44. CA10 over lambda range forHythane and natural gas
Figure 45. CA90 over lambda range forHythane and natural gas
Unburned Hydro Carbon (HC) and Nitrogen Oxides (NOX) are measured andcalculated in form of specific emissions.
5.3.1 Specific NOX versus LambdaFigure 46 shows the specific NOX over the lambda range. As the engine operatesclose to stoichiometric and goes up to lambda equal to 1.2, the in-cylindertemperature increases and as the engine operates leaner and leaner the in-cylinder temperature decreases. The fact that points to the proportional relationbetween temperature and NOX generation can explain the trend in NOX generation
0.8 1 1.2 1.4 1.6 1.80
5
10
15
20
25
30
35
40
45
[-]
CO
V(I
ME
P)
[%]
Cyclic variation of IMEP [%]
NG
Hythane
0.8 1 1.2 1.4 1.6 1.810
12
14
16
18
20
22
24
[-]C
om
bu
stio
nD
ura
tion
[CA
D]
Combustion Duration (CA90-CA10) [CAD]
NG
Hythane
0.8 1 1.2 1.4 1.6 1.80
0.5
1
1.5
2
2.5
3
3.5
4
4.5
[-]
CA
10
(BT
DC
)[C
AD
]
CA10 vs. [CAD]
NG
Hythane
0.8 1 1.2 1.4 1.6 1.814
16
18
20
22
24
[-]
CA
90
(BT
DC
)[C
AD
]
CA90 vs. [CAD]
NG
Hythane

SGC Rapport 2013:286
52 Svenskt Gastekniskt Center AB, Malmö – www.sgc.se
in Figure 46 . The peak temperature in this experiment is close to lambda 1.2which is the peak for NOX generation. Due to the higher burn rate of Hythane,there will be higher peak in-cylinder temperature and consequently somewhathigher NOX generation. NOX emission reduces drastically as the engine operatesleaner and as the lean limit extends from 1.6 to 1.8 the NOX will be reduced to verylow levels. The region close to the lean limit of the engine is zoomed in andshowed in the same figure to the right. It shows that by operating the engine on itslean limit the NOX emissions can be reduced by 90% (i.e. to 0.33 g/Kwh) withhythane compared to natural gas which is significant. This factor is especiallyimportant in lean operated natural gas engines where a Selective CatalyticReduction (SCR) system is needed to reduce the NOX emissions to lower levels.By operating the engine on Hythane it seems that it may not be necessary to useSCR. It is still a trade-off between NOX emissions, HC emissions and efficiency,since by extending the lean limit the combustion becomes colder which reducesthe efficiency. A study should be performed to quantify the gains and the losses.
Figure 46. Specific NOX emissions over lambda range for Hythane and NG arecompared. NOX for operating points close to the lean limit is zoomed in, to clarifythe benefits in NOX reduction
5.3.2 Specific HC versus LambdaAs it is stated in Table 7 the H/C ratio of the natural gas is about 16% lower thanfor Hythane. Specific HC emissions for natural gas and Hythane are plotted over alambda range see Figure 47. The figure shows almost 15% reduction in HCemissions which corresponds well to the higher H/C ratio of Hythane.
0.8 1 1.2 1.4 1.6 1.80
5
10
15
20
25
30
35
[-]
NO
X[g
/kw
h]
NOX [g/kwh]
NG
Hythane
1.6 1.7 1.8 1.90
1
2
3
4
5
6
7
X: 1.607Y: 4.214
[-]
NO
X[g
/kw
h]
NOX [g/kwh]
X: 1.798Y: 0.3374
NG
Hythane
90 % NOx reduction
Zoomed in

SGC Rapport 2013:286
Svenskt Gastekniskt Center AB, Malmö – www.sgc.se 53
Figure 47. Specific HC over lambda range for Hythane and natural gas arecompared.
5.3.3 Specific CO versus LambdaSpecific CO over a lambda range is presented in Figure 48 which shows almost aconstant CO reduction with Hythane. The CO reduction is expected since Hythanecontains lower carbon atoms than the natural gas.
Figure 48. Specific CO emissions over lambda range for Hythane and natural gasare compared. New plot is generated to the right which shows the zoomed in area.
In the second stage of the experiment, the dilution limit of the engine isinvestigated. By adding EGR the combustion becomes colder and combustionduration longer. With very high EGR rate, it gets difficult to ignite the mixture whichresults in misfire in some cycles and consequently a sudden increase in cyclicvariation. Due to the lower ignition requirement of Hythane the dilution limit of theengine is extended from 26 to 30 percent compared to natural gas at 1000 RPM.
5.3.4 Specific NOX versus EGR rateBy adding EGR the combustion temperature and oxygen concentration arereduced which results in lower NOX generation. Since the dilution limit is extendedby Hythane, the reduction in NOX emissions at the dilution limit will be higher than
0.8 1 1.2 1.4 1.6 1.8
2
4
6
8
10
[-]
HC
[g/k
wh
]Unburned Hydrocarbon [g/kwh]
NG
Hythane
1 1.2 1.4 1.6 1.80
5
10
15
[-]
CO
[g/k
wh
]
Carbon monoxide [g/kwh] vs.
NG
Hythane
1 1.2 1.4 1.6 1.80.5
1
1.5
2
2.5
3
3.5
[-]
CO
[g/k
wh
]
Carbon monoxide [g/kwh] vs.
NG
HythaneZoomed in

SGC Rapport 2013:286
54 Svenskt Gastekniskt Center AB, Malmö – www.sgc.se
with natural gas. The NOX emissions over the EGR range is plotted in Figure 49.The operating region close to the dilution limit region in Figure 49 is zoomed in andpresented in the same figure to the right. By extending the dilution limit from 26 toalmost 30 percent EGR at this operating point, the NOX emissions can be reducedby 34% which is a remarkable reduction. Normally it is beneficial to dilutestoichiometrically operated engines to improve efficiency and control knock. Theengine uses a three-way catalyst to reduce all the three emissions i.e. NOX, HCand CO simultaneously, so reduced engine-out NOX emissions may result in usinga cheaper 3-way catalyst. The NOX reduction by extending the dilution limit can becompared to the NOX reduction at the lean limit. The NOX reduction by extendingthe lean limit was much greater but it should be kept in mind that stoichiometricoperation allows the use of a 3-way catalyst.
Figure 49. Specific NOX emissions over EGR range for Hythane and natural gasare compared. The operating region close to dilution limit is zoomed in to the right,to clarify the benefits in NOX reduction.
The same trend for HC was observed as reported in the Lambda responsesection. HC emissions were reduced as Hythane was used since the H/C ratio ishigher for Hythane.
5.3.5 Efficiencies and knock marginsIn the third stage of the experiments, the engine was operated from low to highload for a range of engine speeds. During this experiment the lambda was keptconstant and equal to one i.e. stoichiometric operation. The ignition timing wasadjusted to achieve MBT timing and EGR is only used to suppress knock whenneeded.
Small changes are observed in knock margin of the engine due to the lowignition energy of Hythane. The gas-exchange efficiency of the engine isimproved somewhat due to the lower density of Hythane. To achieve the sameload level with Hythane the throttle should be opened more which results in lowerthrottling losses and thereby higher gas-exchange efficiency. The gas-exchangeefficiency will be improved further with Hythane if EGR is used in the operatingpoints with high pumping losses since the dilution limit is extended with Hythane.
0 10 20 300
2
4
6
8
10
12
14
16
EGR rate [%]
NO
X[g
/Kw
h]
NOX [g/Kwh] vs. EGR rate
NG
Hythane
25 26 27 28 29 300.5
1
1.5
2
X: 29.46
Y: 0.9173
EGR rate [%]
NO
X[g
/Kw
h]
NOX [g/Kwh] vs. EGR rate
X: 26.47
Y: 1.397
NG
Hythane
34% NOx reduction
Zoomed in

SGC Rapport 2013:286
Svenskt Gastekniskt Center AB, Malmö – www.sgc.se 55
No remarkable changes in the other efficiencies i.e. combustion and mechanicalefficiency were observed. These results together with some other important resultssuch as combustion duration, exhaust gas temperature, CA50 and boost pressurecan be studied in detail in [45].
In summary, by increasing the percentage of Hydrogen the gains in reduce HCand CO emissions and losses in terms of increased NOX emissions are moreobvious. By extending the lean and dilution limits of the engine the NOX emissionswill be reduced dramatically to very low levels. This is especially veryadvantageous for the lean operated natural gas engines due to the fact that theymay not need to use any SCR.

SGC Rapport 2013:286
56 Svenskt Gastekniskt Center AB, Malmö – www.sgc.se
6. Alternative ignition systemsThe current phase of this project focuses on exploring alternative ignition tech-niques as after completion of all previous phases it was observed that the capabil-ity of conventional spark plug ignition system was the factor limiting the extent ofdilution and hence emission reduction and efficiency improvement.
Two most feasible alternative ignition systems were identified, namely dieselpilot injection [46-48] and pre-chamber type ignition system [49-51] but it was soonrealized that the former has already received considerable attention as there areproducts in the market under different names like The Hardstaff OIGI® (Oil IgnitionGas Injection), Westport’s High-Pressure Direct Injection (HPDI) applicable to awide range of engines. Comparatively, however, the concept of pre-chamber igni-tion has received limited attention and is mainly applied to stationary or large boremarine engine which do not face as severe speed and load transients as experi-enced by a heavy duty engine for mobile application. Reasons behind this are be-lieved to be limited knowledge about the mechanism of ignition resulting from apre-chamber type ignition device and hence gaining deeper insight into this mech-anism is currently the objective of the gas engine project.
6.1 Summary of the results
As a first step, the performance and emission characteristics of a 6 cylinder gasengine were compared for operation with conventional and a pre-chamber sparkplug [52] which was bought from the market [53]. It was observed that the dilutionlimit extended slightly with pre-chamber spark plug as seen in Figure 50. The mainobservation, however, was the notable reduction in flame development angle withpre-chamber spark plug (Figure 51) which fortifies the belief that the jets from pre-chamber offer much higher ignition energy than a single point spark. It was alsoobserved that the pre-chamber spark plug cause charge pre-ignition at load ex-ceeding 10 bar IMEPg mandating the requirement of some form of dilution to re-strict the in cylinder temperature which also restricted the maximum load achieva-ble with pre-chamber spark plugs as shown in Figure 52. Even so, the operationwith pre-chamber spark plug was more stable as can be seen in Figure 53.

SGC Rapport 2013:286
Svenskt Gastekniskt Center AB, Malmö – www.sgc.se 57
Figure 50. Comparison of dilution limit with excess air at 1500 rpm and variousoperating load
Figure 51. Flame development angle at 1500 rpm and under various load anddilution levels
5 12 181
1.1
1.2
1.3
1.4
1.5
1.6
1.7
1.8
Load - IMEPg (bar)
Ex
ces
sA
irR
ati
o(L
am
bd
a)
C.SPPC.SP
1.571.56
1.7
1.6
1.67
1.6
3 6 910
12
14
16
18
20
22
24
Gross IMEP (bar)
Fla
me
De
ve
lop
men
tA
ng
le(d
eg
.C
A) C.SP - Lambda 1.0
C.SP - Lambda 1.2C.SP - Lambda 1.4C.SP - Lambda 1.6PC.SP - Lambda 1.0PC.SP - Lambda 1.2PC.SP - Lambda 1.4PC.SP - Lambda 1.6

SGC Rapport 2013:286
58 Svenskt Gastekniskt Center AB, Malmö – www.sgc.se
Figure 52. Comparison of minimum dilution required and available operatingwindow at 1500 rpm
Figure 53. Coefficient of Cycle to Cycle variations in IMEPg during ESC-like12mode test cycle under maximum excess air dilution
The applicability of ionization current sensing technique when operating with pre-chamber spark plug was also studied [54]. The main observation was the absenceof second peak in ion current which is known to coincide with the time of peak cyl-inder pressure. Also, the strength of first peak was observed to be less affected bydilution and hence contributing to a higher ion current integral value even at dilu-tion limit of operation. Figure 54 and Figure 55 present the ion current signal char-acteristics under various dilutions for convention and pre-chamber spark plug caserespectively.
5 10 15 20 250
5
10
15
20
25
30
Load - IMEPg (bar)
EG
RR
ate
(%)
Exc
es
sA
irR
ati
o(L
am
bd
a)
C.SP - EGRPC.SP - EGRC.SP - Excess AirPC.SP - Excess Air
1
1.8
1.4
Exhaust Temperature > 700 deg. CPre-ignition
Unstable Combustion
19
21
20
22.5
1 2 3 4 5 6 7 8 9 10 11 120
2
4
6
8
10
12
14
Mode
Cyc
leto
Cyc
leC
OV
-IM
EP
g(%
)
C.SPPC.SP
Excess Air Dilution
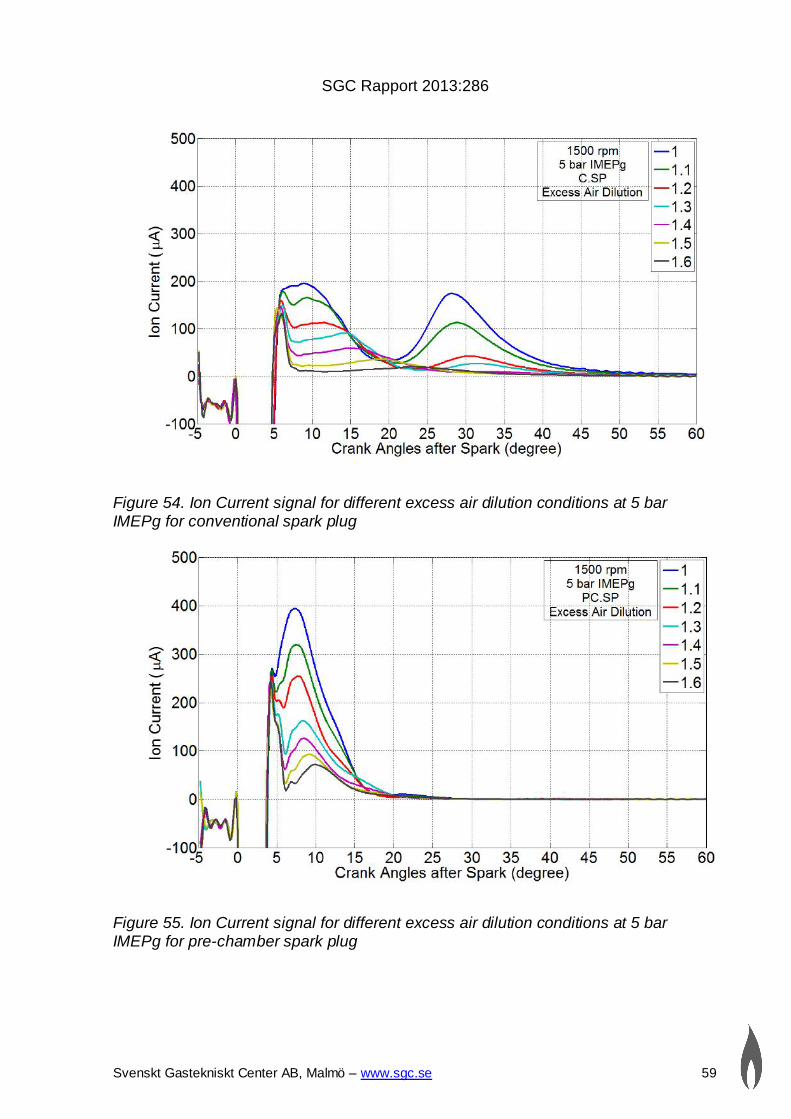
SGC Rapport 2013:286
Svenskt Gastekniskt Center AB, Malmö – www.sgc.se 59
Figure 54. Ion Current signal for different excess air dilution conditions at 5 barIMEPg for conventional spark plug
Figure 55. Ion Current signal for different excess air dilution conditions at 5 barIMEPg for pre-chamber spark plug

SGC Rapport 2013:286
60 Svenskt Gastekniskt Center AB, Malmö – www.sgc.se
Overall, it was observed that the mechanism of ignition resulting from pre-chambertype ignition device was very complex and it was difficult to identify a pattern fromthe results obtained so far. Several factors like the relative volume of two cham-bers, design and orientation of connecting nozzle, relative equivalence ratios oftwo chambers, and location of spark ignition inside the pre-chamber etc. largelyaffect the resulting ignition in main chamber and hence there is a need to under-stand the effect of each of these factors by conducting further detailed and con-trolled experiments.
6.1.1 Literature SurveyThe concept of pre-chamber is not new and has been researched for nearly a cen-tury. Hence, it was decided to conduct a survey of literature available on differentpre-chamber concepts and related research so as to better understan dthe con-cept and also avoid unnecessary repetition. Following the literature survey, pre-chamber system was identified as one of the divided chamber stratified chargeconcepts for SI engines which was proposed first by Sir Harry Ricardo in 1918 (US1,271,942). Since then, several concepts (US 1,568,638 – C. E. Summers, US2,121,920 – Marion Mallory, US 2,065,419 – A. Bagnulo, US 2,615,437 – N. O.Broderson) with either similar or slightly different objective have been patentedand almost all were based on concept of having a readily combustible (stoichio-metric mixture) in vicinity of ignition source in a pre-chamber with a very lean mix-ture in main chamber with the nozzle connecting these chambers so designed asto have a high velocity jet. Thus, the ignition in main chamber mainly relied on thehigh temperature of jet coupled with its turbulent mixing with main chambercharge.
A major deviation from this concept occurred in 1968 when a Russian scientist,L. A. Gussak, proposed a concept called Lavinia Aktyvatsia Gorenia (Avalancheactivated combustion in English), popularly known as LAG-process [55,56] whichwas based on the chain branching theory developed by N. N. Semyonov [57]. Thisconcept proposed the use of very rich mixture in pre-chamber (equivalence ratioaround 2) which when ignited will result in incomplete combustion forming activespecies and ‘chain carriers’ which were then injected into the main chamber rapid-ly advancing the chain branching reaction. Available literature offers a very goodinsight into the mechanism of LAG-process of ignition but also highlights its sensi-tivity to fuel properties and other design factors. Hence it is necessary to study thebehavior of this ignition mechanism with natural gas and at high operating loads asthose reported by Gussak are only upto 8 bar IMEPg.
6.1.2 Future workIn light of the literature survey and the conclusions thereof, it is planned to conductsingle cylinder experiments with specifically designed pre-chambers to study theeffect of relative equivalence ratio between two chambers, effect of operating load(inlet pressure) and the effect of pre-chamber volume and nozzle area on the qual-ity of ignition in main chamber. Gussak’s recommendations of prechamber geome-try are chosen as a starting point which will later be altered following the responseof this technique with natural gas. It is expected that this ignition system will ena-ble operation with high dilution and hence possibility of employing a higher com-pression ratio (diesel like) which will further improve the efficiency. This would alsoenable direct comparison of this combustion concept with advanced conventional

SGC Rapport 2013:286
Svenskt Gastekniskt Center AB, Malmö – www.sgc.se 61
fuel combustion concepts like partially pre-mixed combustion (PPC), reactivitycontrolled compression ignition (RCCI) etc. in terms of operating efficiency andemissions. In future, optical studies with pre-chamber ignition system may also becarried out as a visual aid to further understand the metal engine experimentalresults.

SGC Rapport 2013:286
62 Svenskt Gastekniskt Center AB, Malmö – www.sgc.se
7. ConclusionsA number of studies have been performed mainly to improve the performance of aheavy-duty 6-cylinder natural gas engine that operates stoichiometrically. To re-duce throttling losses at part load operation regions, the concept of closed-loopdilution limit control was developed. A new method to compute cyclic variation wasdeveloped which is well suited for transient operation. The dilution limit controlcoupled with the new method to compute cyclic variation resulted in very simpleand cheap strategy to save fuel. Excellent steady-state performance was achievedas well as limited transient functionality.
A Model-based control strategy was suggested to improve the transient perfor-mance. State of the art System Identification was used to obtain an empiricalmodel which subsequently was used in a Model Predictive Control structure. Mod-el Predictive Control was shown to be a suitable method for controlling lambda aslong as appropriate input variables are chosen for the model.
Since operating the engine at its dilution limit (at part load operation regions)reduces fuel consumption it is advantageous to extend the dilution limit. Increasingturbulence by replacing the combustion chamber resulted in much more turbu-lence and thereby faster combustion.
The compression ratio used in this type of engine is very conservatively chosenand can be substantially increased without risk of knocking. By increasing thecompression ratio from 10.5 to 12, more energy is used in the cylinder rather thanleft in the exhaust which results in higher efficiency. The higher compression ratioresults in lower exhaust gas temperature and more margins for boost pressureand to the highest tolerable temperature by the engine. The heavy-duty naturalgas engines have higher exhaust gas temperature than diesel engines but it is stilllow enough to be tolerable for a VGT. A well-matched VGT will provide desiredboost pressure and extend the maximum achievable output power. Load controlusing the VGT instead of the throttle was also successfully applied in a large oper-ating region (due to its low boost threshold). This resulted in reduced throttle loss-es and thus increased efficiency.
With higher compression ratio and high boost pressure the knock tendency ofthe engine increases and there is need for fast and robust EGR control. A com-parison between short route and long route EGR was performed and long routeshowed much better performance in terms of EGR rate, dynamics, mixing, andknock tolerance of engine.
These results show that by mixing different technologies and applying relatively
small modifications, significant improvement in engine performance can be gained.
In summary the key features to improve the natural gas engine performance areidentified as: Right amount of EGR at different operating regions, Right compres-sion ratio, Variable Geometry Turbocharger, fast burn combustion chambers, Longroute EGR system and model-based control.
Moreover, different experiments were designed and performed to identify andquantify the gains and possible drawbacks with Hythane. From the results it wasconcluded that Hythane is a more appropriate fuel for lean burn operation engines.By extension of the lean limit, NOX emissions will decrease significantly whichcould make the NOX aftertreatment redundant.

SGC Rapport 2013:286
Svenskt Gastekniskt Center AB, Malmö – www.sgc.se 63
As with the alternative ignition technique, it was identified that pre-chamber typeignition system can enable operation with more dilution and hence further improveoperating efficiency and reduce emission. However, the design of pre-chamberspark plug used for initial experimentation did not have any additional fueling tothe pre-chamber and hence the extension in dilution limit was marginal. Moreover,they caused charge pre-ignition above about 10 bar IMEPg and this is believed tobe associated with the spark plug’s design and material. Planned future experi-ments with fueled pre-chamber are believed to extend the dilution limit substantial-ly and also enable operation with higher compression ratio (diesel like) further im-proving the efficiency.

SGC Rapport 2013:286
64 Svenskt Gastekniskt Center AB, Malmö – www.sgc.se
8. References[1] J.B. Heywood, ”Internal Combustion Engine Fundamentals”, International
edition, McGraw-Hill, New York, 1988
[2] B. Johansson, K. Olsson: "Combustion Chambers for Natural Gas SIEngines, Part 1: Fluid Flow and Combustion", SAE paper 950469, 1995
[3] K. Olsson, B. Johansson: "Combustion Chambers for Natural Gas SIEngines, Part 2: Combustion and Emissions", SAE paper 950517, 1995
[4] Patrik Einewall and Bengt Johansson “Combustion chamber forsupercharged Natural Gas Engines “ SAE Paper 970221
[5] Patrik Einewall and Bengt Johansson “Cylinder to Cylinder and Cycle toCycle variations in a Dix Cylinder Lean Burn Natural Gas Engine” SAEPaper 2000-01-1941
[6] Patrik Einewall, Per Tunestål and Bengt Johansson “Lean Burn NaturalGas Operation vs. Stoichiometric Operation with EGR and a Three WayCatalyst” Lund Institute of Technology, SAE Paper 2005-01-0250
[7] Patrik Einewall, Doctoral Thesis “Study and Development of Techniquesto Improve Engine Stability and Reduce Emissions from Natural GasEngines” Sweden, Lund, 2003
[8] Internet source, Microstar Laboratories“http://www.mstarlabs.com/dataacquisition/5400/5400spec.html”20101207
[9] Younis, A. F. and Raine R.R., (2000), “Application of a New Technique forthe Evaluation of Cycle-by-Cycle Variation of Completeness ofCombustion to Changes of Compression Ratio”, SAE Paper 2000-01-1213.
[10] Han, S.B. and Chung, Y.J.,(1999), “The Influence of Air-Fuel Ratio onCombustion Stability of a Gasoline Engine at Idle”, SAE Paper 1999-01-1488.
[11] Jürgen Förster, Achim Gunther, Markus Ketterer, and Klaus-Jurgen Wald,“Ion current sensing for spark ignition engines”, SAE Paper 1999-01-0204.
[12] André Saitzkoff, Raymond Reinmann, and Fabian Mauss, “In cylinderpressure measurements using the spark plug as an ionization sensor”.SAE paper No. 970857, pages 187– 197
[13] M. Hellring, T. Munther, T. Rögnvaldsson, N. Wickström, C. Carlsson, M.Larsson, and J. Nytomt, “Robust AFR estimation using the ion currentand neural networks”, SAE 1999-01-1161
[14] A. Abdel-Rahim, N. Henein, E. Vandyne, “Ion current in a spark ignitionengine using negative polarity on center electrode”, SAE 2007-01-0646

SGC Rapport 2013:286
Svenskt Gastekniskt Center AB, Malmö – www.sgc.se 65
[15] I. Andersson, L. Eriksson, “Ion sensing for combustion stability control ofa spark ignited direct injected engine”, SAE 2000-01-0552
[16] I. Haskara, G. Zhu, Ch. Daniels, J. Winkelman. “Closed loop maximumdilution limit control using in-cylinder ionization signal”, SAE 2005-01-3751
[17] Lars Eriksson, Lars Nielsen, and Jan Nytomt, “Ignition control byionization current interpretation”, SAE SP 1149, (SAE paper No.960045):73–79, 1996.
[18] Johansson, Bengt. “Förbränningsmotorer”, Book, Lund, Sweden 2004
[19] M Kaiadi, P Tunestål, B Johansson: “Closed-Loop Combustion Controlfor a 6-Cylinder Port-Injected Natural gas Engine” SAE Technical Paper2008-01-1722
[20] M Kaiadi, P Tunestål, B Johansson: “Closed-Loop Combustion ControlUsing Ion current Signals in a 6-Cylinder Port-Injected Natural gasEngine” SAE Technical Paper 2008-01-2453
[21] P. Einewall, B. Johansson “Combustion Chambers for SuperchargedNatural Gas Engine” SAE Technical Paper 970221
[22] C. A. Amann “History of the Internal Combustion Engine” page 36, ICE--volume 8, New York, ASME 1989
[23] B. Johansson, K. Olsson “Combustion Chambers for Natural Gas SIEngines Part 1: Fluid Flow and combustion” SAE Technical Paper950469
[24] K. Olsson, B. Johansson “Combustion Chambers for Natural Gas SIEngines Part 2: Combustion and Emissions” SAE Technical Paper950517
[25] R. Bosch GmbH “Automotive Handbook” Book, 6th edition, 2004
[26] K. Miller “Turbo: Real-World High-Performance Turbocharger Systems(S-A Design)”, 2004
[27] HIH. Saravanamuttoo, GFC. Rogers, H. Cohen “Gas Turbine Theory”Book, 5th edition, 2001
[28] I. Haskara, G. Zhu, Ch. Daniels, J. Winkelman. Closed loop maximumdilution limit control using in-cylinder ionization signal, SAE 2005-01-3751
[29] R.H.L. Eichhorn, M.D. Boot, C.C.M. Luijten “Throttle Loss Recoveryusing a Variable Geometry Turbine” SAE 2010-01-1441
[30] Alvon C. Elrod, Michael T. Nelson “Development of a Variable ValveTimed Engine to Eliminate the Pumping Losses Associated with ThrottledOperation” SAE 860537

SGC Rapport 2013:286
66 Svenskt Gastekniskt Center AB, Malmö – www.sgc.se
[31] Allen J., Law D “Production Electro-Hydraulic Variable Valve-Train for anew Generation of I.C. Engines”, SAE Paper Number 2002-01-1109,2002.
[32] D. Nehmer, L. Flueckiger, S. Bohac, C. Cowland, “Development of a FullyFlexible Hydraulic Valve Actuation Engine Part I: Hydraulic ValveActuation System Development”, Global Powertrain Congress, 2002
[33] M. Kaiadi, P. Tunestal, B. Johansson “Improving Efficiency, Extending theMaximum Load Limit and Characterizing the Control-related ProblemsAssociated with Higher Loads in a 6-Cylinder Heavy-duty Natural gasEngine” ASME, ICES2010-35012
[34] M. Kobayashi, Y. Aoyagi, T. Adachi, T. Murayama, A. Noda, Y. Goto, H.Suzuki “ Effect of High Boost and High EGR on the Super Clean DieselEngine” COMODIA 2008, OS-A1
[35] T. Glade, L, Ljung “Control Theory — Multivariable and Nonlinear Meth-ods” Book, English edition, 2000
[36] W. C. Strahle “An Introduction to Combustion”, Combustion Science andTechnology Book Series, Vol. 1, Gordon and Breach Publishers,Amsterdam, 1993
[37] N. Apostolescu and R. Chiriac “Optimum Control of S.I. Engine with aLambda Capability” SAE Paper 960603
[38] U. Kiencke, L. Nielsen “Automotive Control Systems, For Engine,Driveline, and Vehicle” end edition, 2004
[39] K. Collier, R. L. Hoekstra, N. Mulligan, C. Jones and D. Hahn “UntreatedExhaust Emissions of a Hydrogen Enriched CNG Production EngineConversion”, SAE Paper 960858
[40] S. Munshi, C. Nedelcu, J. Harris, T. Edwards, J. R. Williams, F. Lynch,M. R. Frailey, G. Dixon, S. Wayne, and R. Nine “Hydrogen-BlendedNatural Gas Operation of a Heavy-Duty Turbocharged Lean-Burn SparkIgnition Engine”, SAE Paper 2004-01-2956
[41] G. Pede, E. Rossi, M. Chiesa, and F. Ortenzi “Test of Blends of Hydrogenand Natural Gas in a Light-Duty Vehicle”, SAE Paper 2007-01-2045
[42] I. Saanum, M. Bysveen, P. Tunestål, S. Trajkovic “HCCI Combustion ofNatural Gas and Hydrogen Enriched Natural Gas Combustion Control byEarly Direct Injection of Diesel Oil and RME” SAE Paper 2008-01-1657
[43] P. Tunestål, M. Christensen, P. Einewall, T. Andersson, B. Johansson“Hydrogen Addition for Improved Lean Burn Capability of Slow and FastBurning Natural Gas Combustion Chamber” SAE Paper 2002-01-2686
[44] M. Kaiadi, P. Tunestål and B. Johansson “Using Hythane as a Fuel in a6-Cylinder Stoichiometric Natural gas Engine” SAE Paper 2009-01-1950

SGC Rapport 2013:286
Svenskt Gastekniskt Center AB, Malmö – www.sgc.se 67
[45] M. Kaiadi, P. Tunestål and B. Johansson “How Hythane with 25%Hydrogen can affect the Combustion in a 6-Cylinder Natural gas Engine”SAE Paper 2009-01-1950
[46] Yusaf, T., Al-Atabi, M., and Buttsworth, D., "Engine Performance andExhaust Gas Emissions Characteristics of (CNG/Diesel) Dual-FuelEngine," SAE Technical Paper 2001-01-1808, 2001, doi:10.4271/2001-01-1808.
[47] Shen, J., Qin, J., and Yao, M., "Turbocharged diesel/CNG Dual-fuelEngines with Intercooler: Combustion, Emissions and Performance,"SAE Technical Paper 2003-01-3082, 2003, doi:10.4271/2003-01-3082.
[48] Ahmad - I, N., Babu, M., and Ramesh, A., "Experimental Investigations ofDifferent Parameters Affecting the Performance of a CNG - Diesel DualFuel Engine," SAE Technical Paper 2005-01-3767, 2005,doi:10.4271/2005-01-3767.
[49] Attard, W., Kohn, J., and Parsons, P., "Ignition Energy Development for aSpark Initiated Combustion System Capable of High Load, HighEfficiency and Near Zero NOx Emissions,"SAE Int. J. Engines 3(2):481-496, 2010, doi:10.4271/2010-32-0088.
[50] Attard, W. and Blaxill, H., "A Single Fuel Pre-Chamber Jet IgnitionPowertrain Achieving High Load, High Efficiency and Near Zero NOxEmissions," SAE Int. J. Engines 5(3):734-746, 2012, doi:10.4271/2011-01-2023.
[51] Geiger, J., Pischinger, S., Böwing, R., Koß, H. et al., "Ignition Systems forHighly Diluted Mixtures in SI-Engines," SAE Technical Paper 1999-01-0799, 1999, doi:10.4271/1999-01-0799.
[52] Shah, A., Tunestal, P., and Johansson, B., "Investigation of Performanceand Emission Characteristics of a Heavy Duty Natural Gas EngineOperated with Pre-Chamber Spark Plug and Dilution with Excess Air andEGR," SAE Int. J. Engines 5(4):1790-1801, 2012, doi:10.4271/2012-01-1980.
[53] Pre-chamber spark plug from Multitorch GmbH http://www.multitorch.de
[54] Shah, A., Tunestal, P., and Johansson, B., "Applicability of IonizationCurrent Sensing Technique with Plasma Jet Ignition Using Pre-ChamberSpark Plug in a Heavy Duty Natural Gas Engine," SAE Technical Paper2012-01-1632, 2012, doi:10.4271/2012-01-1632.
[55] Gussak, L., Karpov, V., and Tikhonov, Y., "The Application of Lag-Processin Prechamber Engines," SAE Technical Paper 790692, 1979,doi:10.4271/790692.
[56] Gussak, L., Turkish, M., and Siegla, D., "High Chemical Activity ofIncomplete Combustion Products and a Method of Prechamber Torch

SGC Rapport 2013:286
68 Svenskt Gastekniskt Center AB, Malmö – www.sgc.se
Ignition for Avalanche Activation of Combustion in Internal CombustionEngines," SAE Technical Paper 750890, 1975, doi:10.4271/750890.
[57] Semenoff, N., ”Chemical Kinetics and Chain Reactions”, OxfordUniversity Press, 1935