expression of heparanase gene (hpse) in acute leukemia ...egyptianjournal.xyz/55_10.pdfthe egyptian...
TRANSCRIPT
The Egyptian Journal of Hospital Medicine (April 2014) Vol. 55, Page 204–217
204
DOI: 10.12816/0004506
Expression of Heparanase Gene in Egyptian Acute Leukemia Patients Samir Attia Mohamed Zaahkouk.
a, Seham Omar Mohamed Ibrahim
b; Amira Ahmed
Hammam b
; Hesham Fathy Hedifa a
a)- Department of Zoology, Faculty of Science, AL Azhar university, AL Azhar, Egypt b)- Department of Clinical and Chemical Pathology, Faculty of medicine, Beni suef, Egypt
ABSTRACT
Background: Heparanase is an endoglycosidase that degrades heparin sulfate, the main polysaccharide constituent of the extracellular matrix and basement membrane. Expression of
the heparanase gene is associated with the invasive, angiogenic, and metastatic potential of
diverse malignant tumors and cell lines. Aim of the study: to investigate possible relation/correlation between Heparanase gene
expression and quantitation in pediatric Acute leukemia patients and clinicopathologic
variables as well as patients outcome in an attempt to determine it′s prognostic value and the possibility of using it as a new target for treatment.
Patients and methods: Forty pediatric acute leukemia patients (20 acute myeloid leukemia
(AML)&20 acute lymphoblastic leukemia(ALL) as well as 11 normal volunteers were
analyzed for the expression and level of Heparanase gene using real time quantitative reverse transcriptase polymerase chain reaction (RTQ-PCR) to investigate a possible relation,
association, or correlation with the clinical and laboratory features of patients at diagnosis,
and patient outcome after treatment and follow up. Results: Comparing the 3 groups as regards the Heparanase gene level there was high
statistical significant difference (p<0.001) being maximum in AML and minimum in controls,
with mean Relative quantitation (RQ) level 2336.2± 10405.2 in AML ,median 8.0 and range (3.1-46543.0) , while mean RQ in ALL was 1.7±1.0 ,median 1.7 and range (0.1-3.1) and in
controls mean was 0.8±0.3, median 0.8 and range (0.4-1.4).Comparison between each 2
groups as regards heparanase level was of high statistically significant difference, p value
being (p<0.001) when comparing AML/ALL and AML/controls and (p=0.035) when comparing ALL/controls. Cut off value for heparanase gene was calculated using Roc curve
and was found to be 1.413 with 80% sensitivity and 100% specificity. According to this cut
off level, 20/20 (100%) AML cases were heparanase positive, 12/20(60%) (ALL) cases were heparanase positive and 8/20 ALL patients were negative, while all controls (100%) were
negative. This was of high statistical significance (p<0.001). Comparing the overall survival
(OS) of AML/ALL there was no statistically significant difference (p=0.2916), while
comparing the disease free survival (DFS) of AML/ALL was of statistical significant difference (0.0312). Comparing the final status of the disease (complete remission(CR)/
progressive disease(PD) or death) as regards the heparanase gene level RQ , showed a high
statistical significant difference (p<0.005) with the level being higher in patients with PD/death. There was no significant correlation between all group and heparanase gene level
as regards age, TLC, hemoglobin, platelets and peripheral blood blasts
(p=0.353,0.704,0.844,0.54 and 0.097) respectively, while there was significant negative correlation on comparing bone marrow blast% and heparanase gene level (r=-0.408 and
p=0.09).
Conclusion: Heparanse gene is expressed in acute leukemia being higher in AML than ALL
and controls. Patients with higher heparanase gene showed poorer outcome. These findings suggest that heparanase gene may be a novel significant therapeutic target for acute leukemia.
Key words: Heparanase gene, Acute leukemia, RTQ-PCR
INTRODUCTION
Acute leukemia is a heterogenous
disease with numerous genetic abnormalities that define each subtype.
Many of the known chromosomal
translocations and mutations in leukemia
target genes and pathways disrupt
hematopoietic transcription factors and/or confer a proliferative and survival
advantage to leukemia blasts (1)
.
Samir Zaahkouk et al
205
Heparan sulfate proteoglycans
(HSPGs) are ubiquitous macromolecules associated with the cell surface and
extracellular matrix (ECM) of a wide
range of tissues (2)
. The basic HSPG
structure consists of a protein core to which several linear heparin sulfate(HS)
chains are covalently O-linked. HS binds
to and assembles extracellular matrix (ECM) proteins thus playing important
roles in ECM integrity, barrier function,
and cell- ECM interactions. The HS chains ensure that a wide variety of bioactive
molecules bind to the cell surface and
ECM and thereby function in the control
of diverse normal and pathological processes
(3). HSPGs not only provide a
storage depot for heparin-binding
molecules such as growth factors, chemokines and enzymes, but rather can
decisively regulate their accessibility,
function and mode of action(4)
.Recent discoveries indicated that HSPGs localized
within the tumor microenvironment can be
attacked by enzymes that alter
proteoglycan structure resulting in dramatic effects on tumor growth and
metastasis (5, 6)
.
Heparanase , an endoglycosidase, can specially cleave HS side chains from
HSPGs and release a multitude of
bioactive molecules. Then, the generated
HS fragments and released bioactive mediators could facilitate tumor metastasis
cooperatively. In addition , heparanase
also exhibits non enzymatic activities, including cell adhesion and survival,
upregulation of vascular endothelial
growth factor(VEGF) and tissue factor, induction of signal transduction, and
enhancement of certain HSPG from the
tumor cell surface (7,8)
. A large body of
evidence suggest that the expression of heparanase in the tumor closely relates
with the potential for tumor invasion,
angiogenesis and metastasis in most tumors examined
(9,10).
The purpose of this study was to
investigate possible relation/correlation between Heparanase gene expression and
quantitation in pediatric Acute leukemia
patients and clinicopathologic variables as
well as patients outcome in an attempt to determine it′s prognostic value and the
possibility of using it as a new target for
treatment.
MATERIAL AND METHODS
Patients and samples from patients:
Peripheral blood (PB) samples and bone marrow (BM) aspiration samples from 40
Egyptian acute leukemia pediatric patients,
were collected at diagnosis and centrifuged to obtain PB and BM
mononuclear cells (MNCS).
Patients were recruited from 3 places,from the National Cancer Institute,
the Cairo University Hospital and Beni
Suef university hospital over the period
from June 2012 and March 2013 after their agreement .
The diagnosis of Acute leukemia was
made based on the morphologic findings from Giemsa stained smears of bone
marrow (BM) aspirates, cytochemical
stains criteria such as negativity for myeloperoxidase(MPO) and sudan black
B (SBB) in cases of ALL or their
positivity in cases of AML and positivity
of acid phosphatase for (T-ALL) and immunophenotyping criteria as
CD10,CD19,CD20,CD22 for B-
ALL,CD2,CD3,CD5,CD7 for T-ALL, and positivity of CD13 and CD33 for AML
cases.
These patients diagnoses were
distributed as follows: 20 acute myelogenous leukemia (AML) including
the following subtypes of the French-
American-British (FAB) classification ( 4 AML-M1; 10 AML-M2; 3 AML-M3; 1
AML-M5, 2 AML-M7), 20 acute
lymphoblastic leukemia (ALL) from B ,T lineages or common ALL ( 14 B-
lineage, 3 T-lineage and 3 common ALL).
Eleven age & sex matched individuals
were included as controls .
Heparanase gene was analyzed using
real time quantitative reverse transcriptase polymerase chain reaction (RTQ-PCR) to
investigate a possible relation, association,
or correlation with the clinical and laboratory features of patients at
diagnosis, such as: sex, age, lineage (B or
T), hemoglobin (HB), TLC, platelets count
and BM blast cell infiltration; and patient outcome after treatment and follow up.
Expression of Heparanase Gene…
206
RNA isolation and real-time
quantitative RT-PCR Total RNA was extracted from bone
marrow and peripheral blood mononuclear
cells (MNCS) using a QIAamp RNA
blood kit (Qiagen,Germany) according to the manufacture′s instructions. Total
RNA(1µg) was used for a first strand
complementary DNA (cDNA) synthesis using reverse transcription system
(Promega,Madison,WI,USA) as described
by the manufacturer and stored at -20°C till use. SYBR Green (Solis BioDyne,
HOT FIREPOL EvaGreen) real- time
PCRs for amplification of heparanase and
the house keeping gene GAPDH were performed using ABI PRISM 7000
Sequence Detection Software
(AppliedBiosystems). The sequence of primers used for detection of the
Heparanase gene c DNA were
5′-GTTCTAATGCTCAGTTGCTCCT-3′ and
5′-ACTGCGACCCATTGATGAAA-3′
and for GAPDH were
5′-GCACCGTCAAGGCTGAGAAC-3′ and
5′ TGGTGAAGACGCCAGTGGA-3′.
All reactions were perfomed in triplicate using 20µl samples containing 50ng
cDNA. The reaction protocol used
involved heating for 10 minutes at 95ºC,
followed by 40 cycles of amplification (15 seconds at 94ºC and 1 minute at 60ºC).
The expression levels of Heparanase
gene in tested samples were expressed in the form of CT (cycle threshold) level
then Normalized copy number (Relative
quantitation) was calculated using the Δ CT equation . A negative control without
template was included in each experiment.
Expression level of Heparanase gene
was correlated with the clinical features of the studied patients at diagnosis including:
age, sex, TLC, hemoglobin, platelets,
lineage, etc.
Statistical Methods:
Data was analyzed using IBM SPSS advanced statistics version 20 (SPSS Inc.,
Chicago, IL). Numerical data of scores
were expressed as mean and standard
deviation or median and range as appropriate. Qualitative data were
expressed as frequency and percentage.
Chi-square test (Fisher’s exact test) was
used to examine the relation between qualitative variables. For not normally
distributed quantitative data, comparison
between two groups was done using
Mann-Whitney test (non-parametric t-test). Comparison between 3 groups was
done using Kruskal-Wallis test (non-
parametric ANOVA) then post-Hoc "Schefe test" on rank of variables was
used for pair-wise comparison. Spearman-
rho method was used to test correlation between numerical variables. Survival
analysis was done using Kaplan-Meier
method and comparison between two
survival curves was done using log-rank test. Odds ratio (OR) with it 95%
confidence interval (CI) were used for risk
estimation. The Receiver Operating Characteristic (ROC) curve was used for
prediction of cut off values. Kappa test
was used to evaluate agreement between two diagnostic methods. A p-value < 0.05
was considered significant.
RESULTS
The present study was conducted on 40 denovo pediatric acute leukemia patients
(20 AML and 20 ALL), clinical
characteristics of which are presented in table (1). Eleven normal age and sex
matched normal volunteers were studied
as a control group.
They were 23 male patients (10 AML&13 ALL) and 17 female patients (10 AML &7
ALL), while controls were 6 males and 5
females.
Concerning AML Patients:
They were 20 AML patients; 10 males
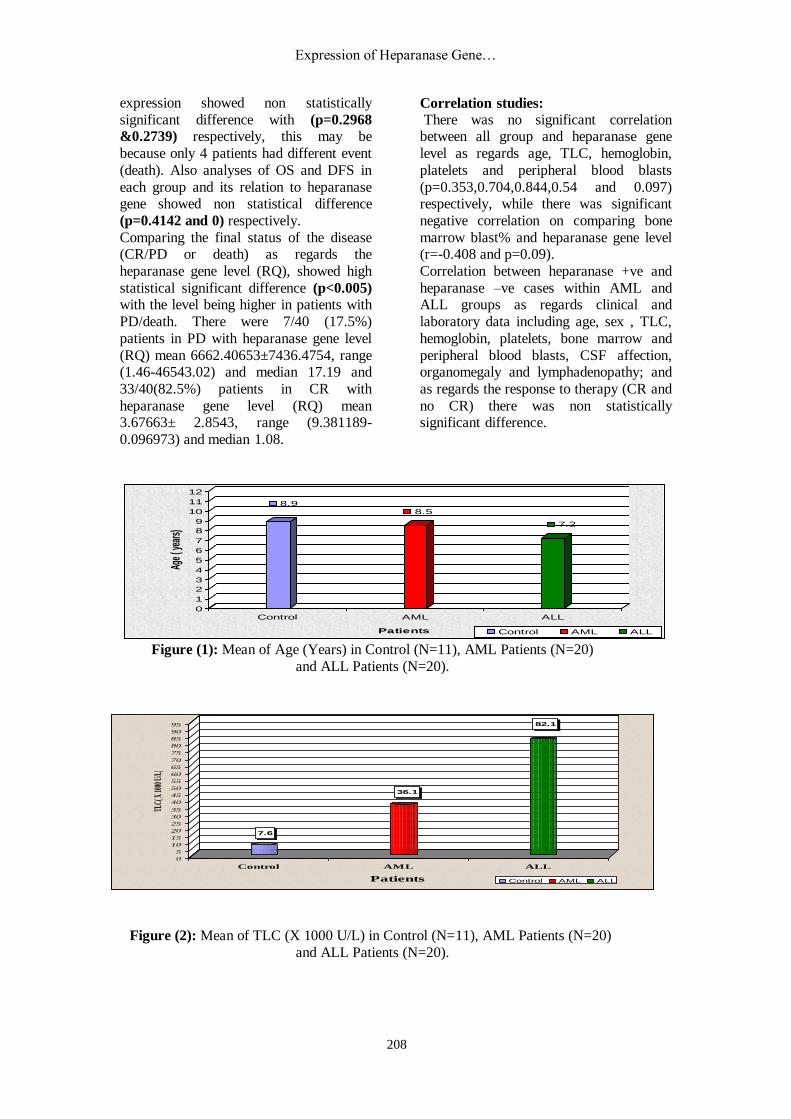
(50%) and 10 females (50%), their ages ranged from (0.8-17 years) with mean 8.5
±5.0 years and median 7.5 years. The
cases were : 4 cases M1(20%), 10 M2
(50%), 3 M3(15%), 1 M5(5%), 2 M7(10%). The mean total leucocytic count
(TLC) at diagnosis was 36.1 ± 34.1x10³
with range (1.2- 140x10³) and median 29x10³, mean hemoglobin was 7.1 gm/dl
with range (3.3-13.4 gm/dl) and median
6.9 gm/dl, mean platelet count was 25.7 x10³ with range (2-70x10³) and median
20x10³, mean peripheral blood blasts was
48.3% with range (10-84%) and median
50.5%, the mean bone marrow blasts was 52.8.8% with range (15-95%) and median
55%. 20/20 ALL patients (100%) had no
Samir Zaahkouk et al
207
CSF involvement. 4/20 (20%) of AML
patients had no organomegaly while 4/20(20%) had splenomegaly, 3/20(15%)
had hepatomegaly, 9/20(45%) had
hepatosplenomegaly and 6/20(30%)
patients had no enlarged lymph nodes while 14/20(70%) had enlarged lymph
nodes. After induction chemotherapy
18/20(90%) of AML patients entered in complete remission (CR) while 2/20(10%)
showed no CR.
Concerning ALL Patients: They were 20 ALL patients; 13 males
(65%) and 7 females (35%), their ages
ranged from (0.7-15 years) with mean 7.2
years and median 7.0 years. The cases were: 13 cases pre B (65%), 1 pro B (5%),
3 C ALL (15%), 3 TALL (15%). The
mean total leucocytic count (TLC) at diagnosis was 82.1 x10³ with range (1.7-
452x10³) and median 31.5x10³, mean
hemoglobin was 8.2 gm/dl with range (4.3-14 gm/dl) and median 7.7 gm/dl,
mean platelet count was 51.1 x10³ with
range (7-152x10³) and median 39x10³,
mean peripheral blood blasts was 36.6% with range (10-97%) and median
24.5%, the mean bone marrow blasts was
74.3±27.7% with range (8-98%) and median 87%. 17/20 ALL patients (85%)
had no CSF involvement while 3/20(15%)
had CSF involvement. 3/20 (15%) of ALL
patients had no organomegaly, while 5/20(25%) had splenomegaly, 1/20(5%)
had hepatomegaly, 10/20(50%) had
hepatosplenomegaly and 1/20(5%) had mesenteric or splenic hilar lymph nodes.
3/20(15%) ALL patients had no enlarged
lymph nodes while 17/20(85%) had enlarged lymph nodes. After induction
chemotherapy 19/20(95%) of ALL
patients entered in complete remission
(CR) while 1/20(5%) showed no CR.
Comparative studies:
Comparing AML and ALL patients as regards their clinical and laboratory data showed no statistical significance for
TLC, hemoglobin and peripheral blood
blasts p value being(0.659,0.114 and 0.46) respectively, but was of statistically
significant difference for platelets
(p=0.046) and bone marrow blasts
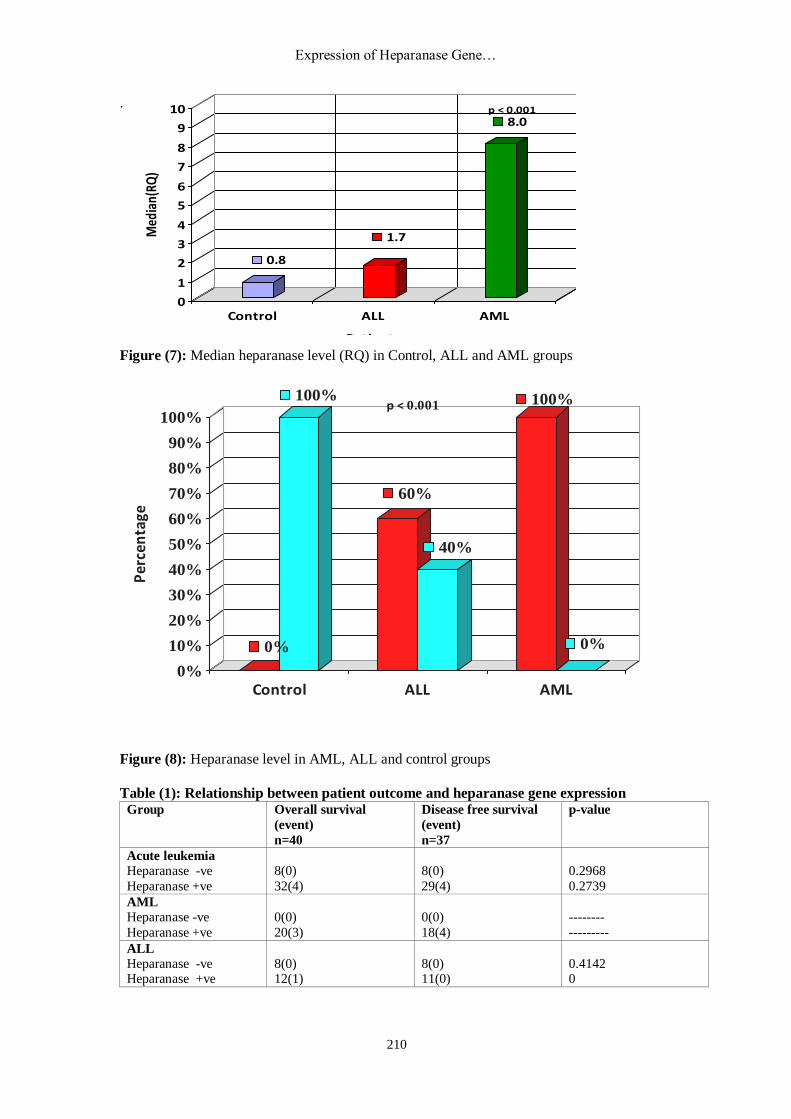
(p=0.006 ) Comparing the 3 groups as regards the
Heparanase gene level there was high
statistical significant difference (p<0.001)
being maximum in AML and minimum in controls, with mean Relative quantitation
(RQ) level 2336.2 in AML ,median 8.0
and range (3.1-46543.0) , while mean RQ
in ALL was 1.7 ,median 1.7 and range (0.1-3.1) and in controls mean was 0.8,
median 0.8 and range (0.4-1.4).
Comparison between each 2 groups as regards heparanase level was of high
statistically significant difference, p value
being (p<0.001) when comparing AML/ALL and AML/controls and
(p=0.035) when comparing ALL/controls.
Cut off value for heparanase gene was
calculated using Roc curve and was found to be 1.413 with 80% sensitivity and 100%
specificity. According to this cut off level,
20/20 (100%) AML cases were heparanase positive, 12/20(60%) ALL cases were
heparanase positive and 8/20 ALL patients
were negative, while all controls (100%) were negative. This was of high statistical
significance (p<0.001).
Follow up of the whole patients group
showed that post induction chemotherapy 37/40(92.5%) entered CR while 3/40
(7.5%) showed no CR, the event of these
37 patients after follow up of showed that 34/37 continued to be in CR while 3/37
relapsed. As for the final state of the
disease (FSD) 33/40 (82.5%) of patients
were in CR and 7/40(17.5%) had either progressive disease (PD) or died and for
the state of the patient (SD); 33/40(82.5%)
were alive free (AF) , 3/40(7.5%) were alive diseased (AD) and 4/40 were dead.
The overall survival time of the whole
group mean was 20.48 month with median 21.12 and range (0-34.9 month),
while the disease free survival (DFS) time
mean was19.28 month, median 19.34
month and range (1.61-34.28) month. Survival analysis of patients till the end of
the study (34.9 month) was 89.73% (no
median survival because more than half of the patients were still alive till the end of
the study).
Comparing the OS of AML/ALL there was non statistically significant difference
(p=0.2916), while comparing the DFS of
AML/ALL it was of statistical significant
difference (0.0312). Comparing the OS and DFS of the whole
group as regards heparanase gene
Expression of Heparanase Gene…
208
7.6
36.1
82.1
0
5
10
15
20
25
30
35
40
45
50
55
60
65
70
75
80
85
90
95
TLC(
X 10
00 U
/L)
Control AML ALL
Patients Control AML ALL
expression showed non statistically
significant difference with (p=0.2968
&0.2739) respectively, this may be
because only 4 patients had different event
(death). Also analyses of OS and DFS in
each group and its relation to heparanase gene showed non statistical difference
(p=0.4142 and 0) respectively.
Comparing the final status of the disease (CR/PD or death) as regards the
heparanase gene level (RQ), showed high
statistical significant difference (p<0.005) with the level being higher in patients with
PD/death. There were 7/40 (17.5%)
patients in PD with heparanase gene level
(RQ) mean 6662.40653±7436.4754, range (1.46-46543.02) and median 17.19 and
33/40(82.5%) patients in CR with
heparanase gene level (RQ) mean 3.67663± 2.8543, range (9.381189-
0.096973) and median 1.08.
Correlation studies:
There was no significant correlation between all group and heparanase gene
level as regards age, TLC, hemoglobin,
platelets and peripheral blood blasts
(p=0.353,0.704,0.844,0.54 and 0.097) respectively, while there was significant
negative correlation on comparing bone
marrow blast% and heparanase gene level (r=-0.408 and p=0.09).
Correlation between heparanase +ve and
heparanase –ve cases within AML and ALL groups as regards clinical and
laboratory data including age, sex , TLC,
hemoglobin, platelets, bone marrow and
peripheral blood blasts, CSF affection, organomegaly and lymphadenopathy; and
as regards the response to therapy (CR and
no CR) there was non statistically significant difference.
Figure (1): Mean of Age (Years) in Control (N=11), AML Patients (N=20)
and ALL Patients (N=20).
Figure (2): Mean of TLC (X 1000 U/L) in Control (N=11), AML Patients (N=20)
and ALL Patients (N=20).
8.98.5
7.2
0
1
2
3
4
5
6
7
8
9
10
11
12
Age
( yea
rs)
Control AML ALL
Patients Control AML ALL
Samir Zaahkouk et al
209
4.3
2.37
2.88
0
0.5
1
1.5
2
2.5
3
3.5
4
4.5
5
5.5
RBC
s (X
10^
6U/L
)
Control AML ALL
Patients Control AML ALL
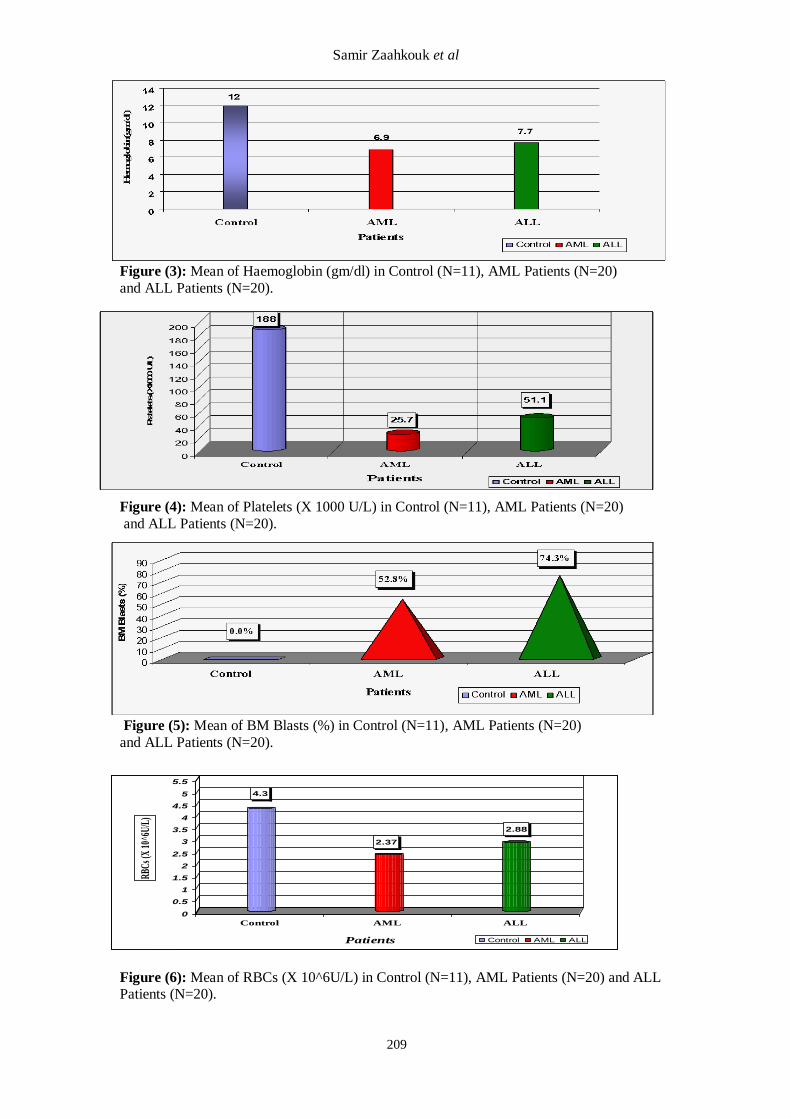
Figure (3): Mean of Haemoglobin (gm/dl) in Control (N=11), AML Patients (N=20)
and ALL Patients (N=20).
Figure (4): Mean of Platelets (X 1000 U/L) in Control (N=11), AML Patients (N=20)
and ALL Patients (N=20).
Figure (5): Mean of BM Blasts (%) in Control (N=11), AML Patients (N=20)
and ALL Patients (N=20).
Figure (6): Mean of RBCs (X 10^6U/L) in Control (N=11), AML Patients (N=20) and ALL Patients (N=20).
Expression of Heparanase Gene…
210
.
Figure (7): Median heparanase level (RQ) in Control, ALL and AML groups
Figure (8): Heparanase level in AML, ALL and control groups
Table (1): Relationship between patient outcome and heparanase gene expression Group Overall survival
(event)
n=40
Disease free survival
(event)
n=37
p-value
Acute leukemia
Heparanase -ve
Heparanase +ve
8(0)
32(4)
8(0)
29(4)
0.2968
0.2739
AML
Heparanase -ve
Heparanase +ve
0(0)
20(3)
0(0)
18(4)
--------
---------
ALL
Heparanase -ve Heparanase +ve
8(0) 12(1)
8(0) 11(0)
0.4142 0
0.8
1.7
8.0
0
1
2
3
4
5
6
7
8
9
10
Med
ian(
RQ)
Control ALL AML
Patients
p < 0.001
0%
100%
60%
40%
100%
0%
0%
10%
20%
30%
40%
50%
60%
70%
80%
90%
100%
Per
cen
tage
Control ALL AML
p < 0.001
Samir Zaahkouk et al
211
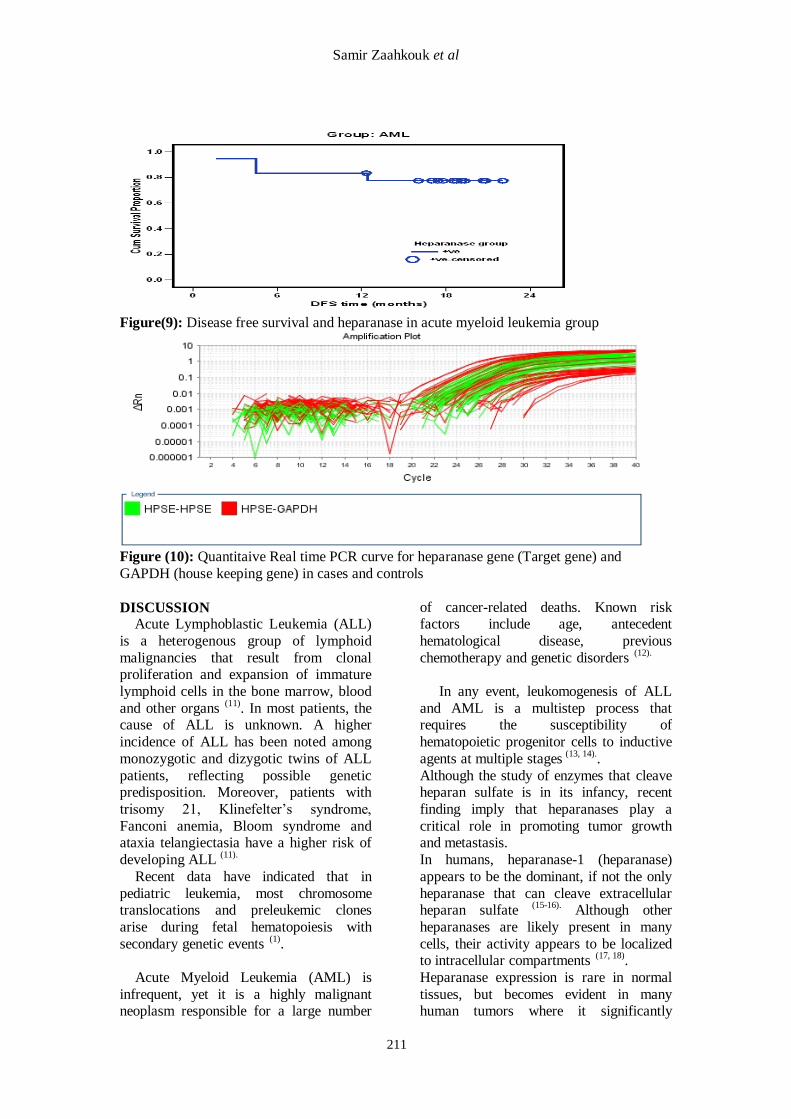
Figure(9): Disease free survival and heparanase in acute myeloid leukemia group
Figure (10): Quantitaive Real time PCR curve for heparanase gene (Target gene) and
GAPDH (house keeping gene) in cases and controls
DISCUSSION Acute Lymphoblastic Leukemia (ALL)
is a heterogenous group of lymphoid
malignancies that result from clonal proliferation and expansion of immature
lymphoid cells in the bone marrow, blood
and other organs (11)
. In most patients, the cause of ALL is unknown. A higher
incidence of ALL has been noted among
monozygotic and dizygotic twins of ALL
patients, reflecting possible genetic predisposition. Moreover, patients with
trisomy 21, Klinefelter’s syndrome,
Fanconi anemia, Bloom syndrome and ataxia telangiectasia have a higher risk of
developing ALL (11).
Recent data have indicated that in
pediatric leukemia, most chromosome translocations and preleukemic clones
arise during fetal hematopoiesis with
secondary genetic events (1)
.
Acute Myeloid Leukemia (AML) is
infrequent, yet it is a highly malignant neoplasm responsible for a large number
of cancer-related deaths. Known risk factors include age, antecedent
hematological disease, previous
chemotherapy and genetic disorders (12).
In any event, leukomogenesis of ALL
and AML is a multistep process that requires the susceptibility of
hematopoietic progenitor cells to inductive
agents at multiple stages (13, 14).
.
Although the study of enzymes that cleave heparan sulfate is in its infancy, recent
finding imply that heparanases play a
critical role in promoting tumor growth and metastasis.
In humans, heparanase-1 (heparanase)
appears to be the dominant, if not the only
heparanase that can cleave extracellular heparan sulfate
(15-16). Although other
heparanases are likely present in many
cells, their activity appears to be localized to intracellular compartments
(17, 18).
Heparanase expression is rare in normal
tissues, but becomes evident in many human tumors where it significantly
Expression of Heparanase Gene…
212
increases both the angiogenic and
metastatic potential of tumor cells (19)
. Elevated heparanase expression in humans
has been correlated with advanced
progression and metastasis of tumors of
the breast (20)
, colon (21)
, ovary (22)
, bladder (23)
, pancreas (24)
and acute myeloid
leukemia (24)
.
The mechanism of heparanase function in tumors is under intense investigations
and it appears that this enzyme may have
multiple effects. For example, degradation of heparan sulfate likely facilitates tumor
cell motility and budding of new blood
vessels, an event that requires remodeling
of the heparan sulfate-rich basement membrane.
Heparan sulfate proteoglycans within
the tumor microenvironment can serve as a reservoir of heparin-binding growth
factors and chemokines, and the activity of
heparanase may act to release these factors for use by the tumor cells. Moreover it is
important to note that active heparanase
does not completely digest the heparan
sulfate chains it attacks; rather it selectively cleaves the glycoside bonds of
heparan sulfate chains at only a few
specific sites, producing fragments that are only 10 to 20 sugar residues long
(25,26).
These fragments generated by heparanase
or by enzymes that cleave heparan sulfate
in a manner similar to that of heparanase have been shown to enhance the ability of
heparan sulfate to potentiate the activity of
bound growth factors (27, 28)
.Thus, degradation of heparan sulfate surrounding
the tumor may remove physical barriers
and enhance signaling events that spark metastasis.
The present study was conducted on 40
denovo pediatric acute leukemia patients (20 AML and 20 ALL) together with
eleven normal age and sex matched
volunteers as a control group. Heparanase gene was analyzed using
real time quantitative reverse transcriptase
polymerase chain reaction (RTQ-PCR) to investigate a possible relation, association,
or correlation with the clinical and
laboratory features of patients at
diagnosis, such as: sex, age, lineage (B or T), hemoglobin (HB), TLC, platelets count
and BM blast cell infiltration; and patient
outcome after treatment and follow up. They were 23 male patients (10 AML&13
ALL) and 17 female patients (10 AML &7
ALL), while controls were 6 males and 5
females. Comparing AML and ALL patients as
regards their clinical and laboratory data
showed no statistical significance for TLC, hemoglobin and peripheral blood blasts p
value being(0.659,0.114 and 0.46)
respectively, but was of statistically significant difference for platelets
(p=0.046) and bone marrow blasts
(p=0.006 ) Comparing the 3 groups as regards the Heparanase gene level there was high
statistical significant difference (p<0.001)
being maximum in AML and minimum in controls, with mean Relative quantitation
(RQ) level 2336.2± 10405.2 in AML
,median 8.0 and range (3.1-46543.0) , while mean RQ in ALL was 1.7±1.0
,median 1.7 and range (0.1-3.1) and in
controls mean was 0.8±0.3, median 0.8
and range (0.4-1.4). Comparison between each 2 groups as
regards heparanase level was of high
statistically significant difference, p value being (p<0.001) when comparing
AML/ALL and AML/controls and
(p=0.035) when comparing ALL/controls.
Cut off value for heparanase gene was calculated using Roc curve and was found
to be 1.413 with 80% sensitivity and 100%
specificity. According to this cut off level, 20/20 (100%) AML cases were heparanase
positive, 12/20(60%) ALL cases were
heparanase positive and 8/20 ALL patients were negative, while all controls (100%)
were negative. This was of high statistical
significance (p<0.001) .
Follow up of the whole patients group showed that post induction chemotherapy
37/40(92.5%) entered CR while 3/40
(7.5%) showed no CR, the event of these 37 patients after follow up of showed that
34/37 continued to be in CR while 3/37
relapsed. As for the final state of the disease (FSD) 33/40 (82.5%) of patients
were in CR and 7/40(17.5%) had either
progressive disease (PD) or died and for
the state of the patient (SD); 33/40(82.5%) were alive free (AF) , 3/40(7.5%) were
alive diseased (AD) and 4/40 were dead.
Samir Zaahkouk et al
213
The overall survival time of the whole
group mean was 20.48±8.37 month with median 21.12 and range (0-34.9 month),
while the disease free survival (DFS) time
mean was19.28±7.22 month, median
19.34 month and range (1.61-34.28) month. Survival analysis of patients till the
end of the study (34.9 month) was 89.73%
(no median survival because more than half of the patients were still alive till the
end of the study).
Comparing the OS of AML/ALL there was no statistically significant difference
(p=0.2916), while comparing the DFS of
AML/ALL was of statistical significant
difference (0.0312). Comparing the OS and DFS of the whole
group as regards heparanase gene
expression showed no statistically significant difference with (p=0.2968
&0.2739) respectively, this may be
because only 4 patients had different event (death). Also analyses of OS and DFS in
each group and its relation to heparanase
gene showed no statistical significance
(p=0.4142 and 0) respectively. Comparing the final status of the disease
(CR/PD or death) as regards the
heparanase gene level (RQ), showed high statistical significant difference (p<0.005)
with the level being higher in patients with
PD/death. There were 7/40 (17.5%)
patients in PD with heparanase gene level (RQ) mean 6662.40653±7436.4754, range
(1.46-46543.02) and median 17.19 and
33/40(82.5%) patients in CR with heparanase gene level (RQ) mean
3.67663± 2.8543, range (9.381189-
0.096973) and median 1.08. There was no significant correlation
between all group and heparanase gene
level as regards age, TLC, hemoglobin,
platelets and peripheral blood blasts
(p=0.353,0.704,0.844,0.54 and 0.097) respectively, while there was significant
negative correlation on comparing bone marrow blast% and heparanase gene level
(r=-0.408 and p=0.09). Correlation between heparanase +ve and heparanase –ve cases within AML and
ALL groups as regards clinical and
laboratory data including age, sex , TLC,
hemoglobin, platelets, bone marrow and peripheral blood blasts, CSF affection,
organomegaly and lymphadenopathy; and
as regards the response to therapy (CR and
no CR) there was no statistically significant difference.
Results repetition
Ostrovsky et al.
(29), investigated
heparanase gene polymorphisms in
patients acute myeloid leukemia (AML), myelodysplastic syndrome(MDS), acute
lymphoblastic leukemia (ALL), chronic
myeloid leukemia (CML), Hodgkin’s disease (HD) and multiple myeloma
(MM).They found Significant correlation
between rs11099592 and rs6535455
heparanase gene (HPSE) single nucleotide polymorphisms (SNPs) and ALL .
Genotype frequency comparisons revealed
a significant association with rs4693602 in MM patients and rs4364254 in AML
patients. They examined heparanase gene
mRNA expression by real-time RT-PCR and indicated a significant low HPSE gene
expression level in ALL patients and a
high expression level in MM and AML
patients, compared to healthy controls. Moreover, statistically significant
correlation was found between heparanase
mRNA expressionlevel and three HPSE gene SNPs (rs4693608, rs11099592 and
rs4364254) among healthy individuals.
They concluded that these data suggest
that certain HPSE gene SNPs may contribute to basal heparanase gene
expression and that alterations in this gene
are an important determinant in the pathogenesis of ALL, AML and MM. This
was in accordance to our work concerning
AML, although we detected low levels of heparanase m RNA in ALL patients as
well as normal control samples
Bitan et al .(30)
evaluated heparanase expression in leukocytes isolated from
peripheral blood of 71 patients with
myeloid and lymphoid leukemias, or non-Hodgkin's lymphoma. Analysis was
performed at two levels: heparanase RNA
was determined by reverse transcriptase polymerase chain reaction, and heparanase
protein was evaluated by
immunocytochemistry and flowcytometry.
They found that in eight peripheral blood samples from normal donors, heparanase
RNA was detected, and protein was found
Expression of Heparanase Gene…
214
within the cytoplasm of granulocytes. In
mononuclear cells derived from various leukemias, heparanase RNA was
expressed in 14 of 15 acute myeloid
leukemia (AML) samples. In contrast,
cells derived from all 33 chronic lymphoblastic leukemia, all 7 non-
Hodgkin's lymphoma, 7 of 8 chronic
myeloid leukemia, and 6 of 8 acute lymphoblastic leukemia patients showed
no detectable expression of the heparanase
RNA. They also revelead that heparanase protein was detected primarily within the
cytoplasm of AML cells, indicating that
the enzyme is produced and stored within
the cytoplasm of myeloid cells, with limited expression on the cell surface. This
was in agreement with our results
concerning AML but we detected low levels of heparanase m RNA in ALL as
well as in normal controls.
Thomas et al.
(31) analyzed the activity,
expression, and function of heparanase in
myeloma patients. They analyzed
heparanase activity in the plasma isolated from bone marrow biopsies of 100 patients
and revealed86 positive for heparanase
activity and 14 negative. They further divided the bone marrow samples into
three categories of heparanase activity,
high activity (42 patients), low activity
(44 patients), and negative (14 patients). In contrast to the bone marrow plasma, levels
of heparanase activity in peripheral blood
plasma of 29 myeloma patients were found to be either negative or low, they
suggested that in multiple myeloma,
heparanase functions in the local microenvironment of the bone marrow and
its activity is not significantly elevated
systemically. Immunohistochemistry was
performed and revealed that patients with high levels of heparanase activity often
have tumor cells with intense staining for
the enzyme. Interestingly, they noted a marked heterogeneity among tumor cells,
with clusters of heavily stained cells
surrounded by cells with weak or negative staining for heparanase. They analyzed
microvessel density and revealed a
strikingly higher concentration of vessels
in patients with high heparanase activity (78.96 vessels/mm2) as compared with
patients negative for heparanase activity
(25.03 vessels/mm2). When they
implanted human myeloma cells transfected with the cDNA for heparanase
in severe combined immunodeficient
(SCID) mice, the resulting tumors
exhibited a significantly higher microvessel density than did tumors
established with control cells. Thus they
concluded that expression of heparanase appears to play a direct role in enhancing
microvessel density in myeloma cells.
Yan et al.
(32) used a severe combined
immunodeficient (SCID) mouse model,
and demonstrated that enhanced
expression of heparanase by myeloma cells dramatically up-regulated their
spontaneous metastasis to bone. They
noted that this occurs from primary tumors growing subcutaneously and also from
primary tumors established in bone.
Interestingly, they observed that tumors formed by subcutaneous injection of cells
metastasize.
Not only to bone, but also to other sites
including spleen, liver, and lung. In contrast, tumors formed by injection of
cells directly into bone exhibit a restricted
pattern of metastasis that includes dissemination of tumor to other bones but
not to extramedullary sites. In addition,
they stated that expression of heparanase
by myeloma cells accelerated the initial growth of the primary tumor, increased
whole-body tumor burden as compared
with controls, and enhanced both the number and size of microvessels within
the primary tumor.
Michael et al.
(33) identified four
putative estrogen response elements in the
heparanase promoter region and found that
transcription of a luciferase reporter gene driven by the heparanase promoter was
significantly increased in estrogen-
receptor positive MCF-7 human breast carcinoma cells after
estrogen treatment. Estrogen-induced
heparanase mRNA transcription in estrogen receptor-positive, but not in
estrogen receptor-negative, breast cancer
cells, confirmed the promoter study data.
The estrogen effects on heparanase mRNA expression levels were abolished in the
presence of the pure antiestrogen ICI
Samir Zaahkouk et al
215
182,780, indicating that the classic
estrogen receptor pathway is involved in transcriptional activation of heparanase. In
vivo, exposure to estrogen augmented
levels of heparanase protein in MCF-7
cells embedded in Matrigel plugs and correlated with increased plug
vascularization. Collectively, our data
suggest a new molecular pathway through which estrogen, independent of its
proliferative effect, may induce
heparanase overexpression and, thus, promote tumor-stromal interactions,
critical for breast carcinoma development
and progression.
Xu et al.
(34) assessed the role of HPA-1
by suppressing its expression using small
interfering RNA (siRNA). They transfected the human heparanase-1
specific siRNA to the human gastric
carcinoma cell line SGC7901 and assessed the effect of gene silencing by Real-Time
PCR and Western Blot. They then
evaluated the invasion potential of the
cells using an in vitro cell invasion model system. They found that HPA-1 specific
siRNA significantly suppressed expression
of heparanase-1 in SGC7901 cells and that Invasion after RNAi treatment through
membranes in a model system was
significantly decreased. They concluded
that HPA-1 facilitates gastric carcinoma invasion by up-regulating endoglycosidase
activity in tumor cells.
Xiaotong et al .
(35) used a strategy of
stable transfection with antisense to derive
ovarian carcinoma cell lines that express different levels of heparanase and used
these to demonstrate that invasion
correlates with heparanase activity. They
found that secreted heparanase activity was increased by reduction, hypoxia, and
growth of cells under reduced oxygen
(1%) augmented heparanase activity and invasion, both of which are inhibited by
treatment with antiheparanase antibodies.
Liduan et al .
(36) designed,
synthesized, and transfected three
heparanase-specific small interfering RNA
(siRNAs) into cultured gastric cancer cell line SGC-7901. They measured
Heparanase expression by RT-PCR, real-
time quantitative PCR and Western blot.
Cell proliferation was detected by MTT colorimetry and colony formation
assay.The in vitro invasion and metastasis
of cancer cells were measured by cell
adhesion assay, scratch assay and matrigel invasion assay. The angiogenesis
capabilities of cancer cells were measured
by tube formation of endothelial cells. They found that transfection of siRNA
against 1496-1514 bp of encoding regions
resulted in reduced expression of heparanase, which started at 24 hrs and
lasted for 120 hrs post-transfection. The
siRNA-mediated silencing of heparanase
suppressed the cellular proliferation of SGC-7901 cells. In addition, the in vitro
invasion and metastasis of cancer cells
were attenuated after knock-down of heparanase. Moreover, transfection of
heparanase-specific siRNA attenuated the
in vitro angiogenesis of cancer cells in a dose-dependent manner.
Evgen et al. (37)
designed plasmid
vectors to express hammerhead ribozymes or small interfering RNAs (siRNAs)
directed against the human or mouse
heparanase mRNAs. Human breast carcinoma (MDA-MB-435) and mouse
lymphoma (Eb) and melanoma (B16-BL6)
tumor cell lines, which have naturally high
levels of endogenous heparanase or have been genetically engineered to over
express heparanase, were transfected with
anti-heparanase ribozyme or siRNA. Semiquantitative reverse transcription–
polymerase chain reaction (RT-PCR) and
measurements of enzymatic activity were used to confirm the efficient silencing of
heparanase gene expression. Cells
transfected with the anti-heparanase
ribozyme and siRNA vectors were tested for invasiveness in vitro and metastatic
dissemination in animal models of
experimental and spontaneous metastasis. They noted that compared with cells
transfected with control constructs, cells
transfected with the anti-heparanase ribozyme or siRNA vectors had
profoundly reduced invasion and adhesion
in vitro, regardless of cell type, and
expressed less heparanase. In vivo, tumors produced by cells transfected with the
antiheparanase ribozyme and siRNA
Expression of Heparanase Gene…
216
vectors were less vascularized and less
metastatic than tumors produced by cells transfected with the control vectors. Mice
injected with cells transfected with the
anti-heparanase ribozyme and siRNA
vectors lived longer than mice injected with control cells.
In conclusion, the current study provides
characterization of heparanase gene expression and quantitation in acute
leukemia and its effect in the patients
outcome after treatment. We recommend the use of heparanase gene as a future
therapeutic target for treatment of acute
leukemias. Further studies are
recommended to strengthen this hypothesis.
REFERENCES 1. Mullighan CG, Flotho C, Downing JR
(2005): Genomic assessment of pediatric
acute leukemia. Cancer j .,11:268-282
2. Bernfield M, Gotte M, Park PW, Reizes
O, Fitzgerald ML, Lincecum Jet al
(1999): Functions of cell surface heparin
sulfate proteoglycans. Annu. Rev.
Biochem., 68:729-77.
3. Sasisekharan R, Shriver Z,
Venkataraman G, Narayanasami U (2002): Roles of heparin-sulphate
glycosaminoglycans in cancer. Nat. Rev.
Cancer, 2:521-8
4. Iazzo RV(1998): Matrix proteoglycans:
from molecular design to cellular function.
Annu. Rev. Biochem., 67: 609-52
5. Fjeldstad k, Kolset SO (2005): Decreasing the metastatic potential in
cancers targeting the heparan sulfate
proteoglycans. Curr. Drug. Targets, 6:665-
682
6. Sanderson RD, Yang Y, Kelly T,
MacLeod V,Dai Y and Theus A (2005):
Enzymatic remodeling of heparin sulfate
proteoglycans within the tumor
microenvironment, growth regulation and
the prospect of new cancer therapies. J.
Cell Biochem.,96:897-905
7. Shuo D and Xiong-Zhi W (2010): Heparanase and hepatocellular carcinoma:
Promoter or inhibitor.World J
Gastroenterol., 16(3):306-3011
8. Levy-Adam F, Feld S, Suss-Toby E, Vlodavsky I, Ilan N (2008): Heparanase
facilitates cell adhesion and spreading by
clustering of cell surface heparin sulfate
proteoglycans. Plos One; 3:e2319
9. Parish CR, Freeman C, Hulett MD
(2001): Heparanase, a key enzyme
involved in cell invasion. Biochem.
Biophys. Acta., 1471:M99-M108
10. Vlodavsky I, Elkin M, Abboud-Jarrous
G,Levi-Adam I,Fuks I,Shafat I, Ilan N
(2008): Heparanase, one molecule with
multiple functions in cancer progression. Connect Tissue Res; 49:207-210
11. Jabbour EJ, Faderl S, Kantarjian HM
(2005): Adult acute lymphoblastic
leukemia. Mayo Clin Proc; 80:1517-1527
12. Deschler B, Lubbert M (2006): Acute
myeloid leukemia: epidemiology and
etiology. Cancer; 107:2099-2107
13. Vlodavsky I, Friedmann Y, Elkin M et
al (1999): Mammalian heparanase gene
cloning, expression and function in tumor
progression and metastasis. Nat Med;
5:793-802
14. Kussie PH, Hulmes JD, Ludwig DL et
al (1999): Cloning and functional
expression of a human heparanase gene.
Biochem Biophys Res Commun;261:183-
187
15. Hulett MD, Freeman C, Hamdorf BJ,
Baker RT, Harris MJ, Parish CR
(1999):Cloning of mammalian
heparanase, an important enzyme in tumor
invasion and metastasis. Nat. Med., 5:803-
809
16. Toyoshima M and Nakajima M (1999): Human heparanase purification,
characterization, cloning, and expression .
J. Biol. Chem., 274: 24153-24160
17. McKenzie E, Tyson K, Stamps A et al
(2000): Cloning and expression profiling
of Hpa2, a novel mammalian heparanase
family member. Biochem. Biophys. Res.
Commun.,276:1170-1177
18. Bame KJ, Venkatesan I, Dehdashti J,
McFarlane J, Burfeind R (2002): Characterization of a novel intracellular heparanase that has a FERM domain.
Biochem. J., 364:265-274
19. Vloddavsky I, Goldshmidt O, Zcharia E
et al (2002): Mammalian heparanase
involvement in cancer metastasis,
angiogenesis and normal development.
Semin. Cancer. Biol., 12:121-129
20. Maxhimer JB, Quiros RM, Stewart R et
al (2002): Heparanase-1 expression is
associated with the metastatic potential of
breast cancer. Surgery;132:326-333
21. Freidmann Y, Vlodavsky I, Aingorn H
et al (2000): Expression of heparanase in
normal dysplastic and neoplastic human
colonic mucosa and stroma: evidence for
its role in colonic tumorigenesis. Am. J.
Path., 157: 1167-1175
22. Ginth S, Menczer J, Friedmann Y et al
(2001): Expression of heparanase .Mdm2
Samir Zaahkouk et al
217
23. and erbB2 in ovarian cancer. Int. J.
Oncol., 18:1133-1144
24. Gohji K, Okamoto M, Kitazawa S et al
(2001): Heparanase protein and gene
expression in bladder cancer.J. Urol.,
166:1286-1290
25. Kolioponas A,Friess H, Kleeff J et al
(2001): Heparanase expression in primary
and metastatic pancreatic cancer. Cancer
Res.,61:4655-4659
26. Bitan M, Polliack A,Zecchina G et al
(2002): Heparanase expression in human
leukemias is restricted to acute myeloid
leukemia. Exp. Hemato.,30;34-41
27. Vlodavsky I and Friedmann Y (2001): Molecular properties and involvement of
heparanase in cancer metastasis and
angiogenesis. J. Clin. Invest.,108: 341-347
28. Kato M,Wang H, Kainulainen V et al
(1998): physiological degradation
converts the soluble syndecan-1
ectodomain from an inhibitor to a potent
activator ofFGF-2. Nat. Med., 4:691-697
29. Liu d,Shriver Z, Venkataraman G, El
Shabrawi Y, Sasisekharan R
(2002):Tumor cell surface heparin sulfate
as cryptic promoters or inhibitors of tumor
growth and metastasis. Proc. Natl. Acad.
Sci. U S A. 99:568-573
30. Ostrovsky O, Korostieshevsky M,
Levite I, Leiba M, Galski H, Vlodavsky
I and Nagler A (2007): Association of
heparanase gene (HPSE) single nucleotide
polymorphisms with hematological
malignancies. Leukemia;21:2296-2303
31. Bitan M, Polliack A, Zecchina G,
Nagler A, Friedmann y et al (2002): Heparanase expression in human
leukemias is restricted to acute myeloid
leukemias. Exp. Hematol., (1): 34-41
32. Thomas K, Hua-Quan M,Yang Y,
Elizabeth N et al (2003): High
heparanase activity in multiple myeloma
is associated with elevated microvessel density. Cancer Reasearch ., 63: 8749-
8756
33. Yang Y, Veronica M, Manali B, Yan H
et al (2005): Heparanase promotes the
spontaneous metastasis of myeloma cells
to bone. Blood;105:1303-1309
34. Michael E, Irit C, Eyal Z, Adam O et al
(2003): Regulation of heparanase gene
expression by estrogen in breast cancer.
Cancer Research; 63:8821-8826
35. Xu Y, Zhang Y, Wang Z, Zhang X et al
(2009): Role of heparanase-1 in gastric carcinoma invasion. Asian Pacific Journal
of Cancer Prevention;10: 151-154
36. Xiaotong H, Paul E.C.B, Gordon C.J,
Lynne H (2004): Hypoxia Increases
heparanase-dependent tumor cell invasion,
which can be inhibited by antiheparanase
antibodies. Cancer Research; 64:3928-
3933
37. Liduan Z, Guosong J, Hong M, Jiarui P
et al (2010): Small RNA interference-
mediated gene silencing of heparanase abolishes the invasion, metastasis and
angiogenesis of gastric cancer cells. BMC
Cancer;10:33
38. Evgeny E, Michael E, Eyal Z, Tamar P,
Israel V (2004): Heparanase gene
silencing, tumor invasiveness,
angiogenesis and metastasis. Journal of
the national cancer institute;96(16):1219-
1230