export competitiveness of tech products: a comparative
TRANSCRIPT

International Journal of Scientific Research and Engineering Development-– Volume X Issue X, Year
Available at www.ijsred.com
ISSN : 2581-7175 ©IJSRED: All Rights are Reserved Page 1
Export Competitiveness of Tech products: A comparative Analysis
of BRICS Countries
Abul Hassan P.S*, Prof. Halima Sadia Rizvi**
*(Department of Economics, Jamia Millia Islamia, New Delhi)
** (Department of Economics, Jamia Millia Islamia, New Delhi)
----------------------------------------************************----------------------------------
Abstract: As a critical factor to speed up the economic growth, value-added technology product are the
adequate commodity variant in BRICS's export basket-like, Highly sophisticated defence equipment in
Russia, pharmaceutical and software in India, GM crops, chemical, electronic, and electrical in Brazil,
China, and South Africa. Looking at the main issues in technological collaboration between BRICS
countries, this paper analyses the export competitiveness of Tech products of BRICS nations based on the
SITC REV.3 UNCTAD product classification from 2000 to 2014. Revealed Comparative Advantage
Index (RCA) is used to measure the comparative advantage in the trade of High-tech products between
average world level and from one country to another and Trade Intensity Index (TII) to evaluate the Trade
potentiality among BRICS countries for Tech products. The technologically oriented trade is being
promoted mainly by China compared to other members, and the Chinese presence is overpowering the
block. Hence, this is not sustainable in the long run. The possibility of Inter-government technological
cooperation can avoid the situations of countries competing for similar Tech products in the same market
with an absence of mutual collaboration.
Keywords — BRICS, Technology products, comparative advantage, and export competitiveness
----------------------------------------************************----------------------------------
I. INTRODUCTION
With South Africa's inclusion in 2010, the
former BRIC alliance became BRICS, another step
in creating a new platform for “Common Big Fives”
to emerge as global economic leaders. Due to the
massive advancement in the technological progress
of the present century, Technological products’
trade has become a crucially significant symbol of a
nation’s growth indicator.
This paper aims at evaluating the trade in tech-
products among the BRICS. The origin of BRICS is
from an analytical memo of Gold man Sachs in
2003 in which they identified similarities in the
economic growth of four Semi- developed countries
Brazil, Russia, India, and China. The acronym
BRIC is further broadened to BRICS with South
Africa's accession during 2010 now, BRICS has
expanded into new horizons since they formed the
New Development Bank (NDB) at the recently held
Fortaleza summit, Brazil. Goldman Sachs came up
with the projection that these countries would
overtake the total output (PPP) of the current
developed western countries by 2040. Their study
reveals a comprehensive total outlook of the BRICS
for the coming four decades, concluding that
BRICS would be larger than G6 (US, UK, Japan,
France, Italy, and Germany) within forty years in
terms of economic size. China would overtake the
US by 2039 in economic size in Dollar terms.
The main reason for BRICS growth mainly
depends on the size of these countries' income and
demographic features. Presently the Per-capita
Income of BRICS countries is like that of the
developed world. A similar decline in the working-
age population across the entire BRICS would
RESEARCH ARTICLE OPEN ACCESS
International Journal of Scientific Research and Engineering Development-– Volume X Issue X, Year
Available at www.ijsred.com
ISSN : 2581-7175 ©IJSRED: All Rights are Reserved Page 2
significantly affect the working force's productivity
and efficiency; hence, this active labour force also
shifts the global demand pattern favourably towards
BRICS domestic markets. The flow of FDI and
Investments upon the high returns of domestic
economies of BRICS would bring further stages of
development in the region. Although the BRICS
economies are not yet over passing the developed
countries even after fifteen years of Goldman Sachs
report, the Intra- trade flows and other Multi-
Bilateral trade flows of BRICS play an essential
role in world economic trade transactions, making
an unavoidable power in taking world decisions.
Innovations and inventions are the backbones of
any development process. The experienced growth
in modern technological skills and entrepreneurship
habits across the BRICS showcase another
promising avenue for knowledge-seeking research.
The potential for BRICS growing like global
economic leaders of the future will only be possible
with a substantial evaluation of technological
advancement and other development attributes. In
lieu of this, this paper investigates the export
competitiveness of tech product's trade transactions
of BRICS comprehensively. The technological
content in product manufacturing and service sector
transactions could perform as a valuable entity in
the Balance sheet of any developing nation. The
case of BRICS is also reflecting the same story. In a
world, witnessing massive changes every day,
technological spillovers are everywhere. The
transformation in tech-spillovers may be possible
through the trade in technology-intensive products
or technology as a purchasing good itself is being
addressed in the present paper. The primary
objectives of this paper are the following:
To Analyse the trade performance and
trade intensity of technology products for
each BRICS members.
To examine the export competitiveness of
Low Tech, Medium Tech and High-Tech
products of BRICS.
The technological features can be identified as
follows: Low Tech products- traditional and low
mechanical techniques used to produce less
capitalised production form. Medium Technology
products- can be classified as using mechanical
kind of technology of semi-complex products other
than complex electrical data processing and
electronic forms. High Tech products include
products with a high intensity of Research &
Development and a new and high complex form.
II. LITERATURE REVIEW
The connection between technological content
and BRICS performance can trace back to the
standard features of BRICS nations. The cheap
availability of human capital and traditional viable
technologies used in village- small scale level is the
striking factor behind this boom. Moreover,
empirically BRICS shows some peculiarities in its
technology trade pattern. Presently, Brazil in the
agricultural sector uses Genetically Modified (GM)
seeds for efficient production and its transactions to
other countries, Russia in steel, Mineral extraction
and High-end defence equipment, India in Software
and pharmaceutical, China in Manufacturing of
Hardware and South Africa in inventions in
Nanotechnology.
The existing studies mainly revolve around the
theoretical framework to define technological
contents in trade transactions. Michel Porter et al.,
(1980) [11] raises a crucial question about the
technology content, that the possibility of
technological inputs can be equated with the wage
market or at the knowledge production level. The
answer to this question lies in the intensity of R&D
activities. And its conversion to a feasible solution
to the existing problems. This can be better revealed
with an excellent example of the aviation industry,
a High-tech industry, unlike other Medium tech
industries. Its level of R&D investment is higher
than other automobile industries; hence, it is both
knowledge producible and highly paid job in the
market.
Ying et al., (2014) [16] analyses the comparative
advantage in the export of High-tech products’

International Journal of Scientific Research and Engineering Development-– Volume X Issue X, Year
Available at www.ijsred.com
ISSN : 2581-7175 ©IJSRED: All Rights are Reserved Page 3
export competitiveness of BRIC in the US market.
Mathematical modelling and methodological tools
are used here, along with Export Specialisation
Index (ESI) and RCA Index with a Varying
Coefficient Model. The study reveals that
technological diffusion in trade is mainly based on
R&D and Patent rights. He finds that high tech
trade is positively related to technical qualities in
R&D activities. Raghuramapatruni (2015), [12]
examines the intensity of BRICS trade and its
commodity trade in fourteen selected products. He
finds that there exist complementarities rather than
competition among BRICS. Pant (2011), [10] reveals
the sustainability of Intra- BRICS trade and its
technological issues. The RCA analysis is used in
the study in measuring trade competitiveness.
Mukhopadhyaya (2012), [8] finds that high tech
products and international competitiveness are
related because export competitiveness reflects a
country’s international competitiveness in
commodity trade.
The competitiveness measurement has attracted
many glimpses in economic literature after the
famous Diamond model coined by the US man
Micheal Porter et al., [11]. He depicted in his study
that in a collusive cluster model, any individual
unit's competitiveness is closely related to its
colleagues' reactions regardless of global or
regional context. Porter’s work gained much
attention, and later many of the competitive
measurement indexes originated based on the
diamond model concept. Armington (1969) [14]
presented an in-depth Interlink Model for a standard
general analytical framework to ease calculating
competitiveness complexities. The OECD branded
this holistic approach by introducing the influence
of price competitions on Imports and exports,
revealing the inter-linkages between them. The
central feature of this typical analytical framework
was the global consistency of its all-competitive
measurement tools. Coviello et al., (1997) [17], in
this study, explains the international
competitiveness based on the theoretical framework
of performance potentiality of the participating
firms in international transactions.
III. METHODOLOGY
This paper calculates the export competitiveness
of technologically oriented products by measuring
the RCA index. However, to measure the trade
intensity between the two countries, we adopt Trade
Intensity Index for the entire Tech products. It
includes all the Low tech, Medium tech, and High-
tech products in a combined form of Total tech
products, and the study revolves over the fifteen
years from 2000 to 2014. The data used in the
analytical part is from several secondary sources of
COMTRADE, Trade Indicator, UNCTAD and
World Bank. Many of the Journals, Research
articles are also referred to gather relevant
information. The Lall classification of SITC.3
technology products was first given by UNCTAD
to categorise the products based on their
technological content. According to UNCTAD,
Low technology manufactures include: Textile,
garments, footwear, and other related fabrics;
Medium tech include: Mechanical parts of
automotive, Industrial equipment use for processing
and other manufacturing engineering products;
High tech products include: Electronic and
Electrical products and other pharmaceutical
spacecraft products. The technological strata of
BRICS handled tradable materials are the same
across the group. The analytical part is done with
the help of two Indexes. Bela Balassa of Hungry
provided the RCA Index or Balassa Index. This is
used to calculate the international export
competitiveness of trade transactions of different
countries. This approach is based on the Ricardian
concept of Comparative advantage in international
trade transactions. Symbolically,
RCAij = (EXij EXit⁄ )/(EXwj EXwt⁄ )
where EXij = Exports of 𝑖𝑡ℎ country in 𝑗𝑡ℎ
product, EXit = Total Exports value of the 𝑖𝑡ℎ
country, EXwj = Total World Exports of 𝑗𝑡ℎ product,
and EXwt= Total World Exports.
RCA shows the comparative advantage of a
particular product for a nation. The value will be of

International Journal of Scientific Research and Engineering Development-– Volume X Issue X, Year
Available at www.ijsred.com
ISSN : 2581-7175 ©IJSRED: All Rights are Reserved Page 4
any real number. If the RCA = 0, indicating
competitive disadvantage and the value = 1,
illustrate a comparative advantage in the export of
an item.
The TII Index is used to measure the
intensity of trade between the two nations. This
method is widely used to exhibit the total trade
performance of a country. Theoretically, this
explains that one country’s export share goes to the
partner country divided by the world share of
export goes to that partner nation. Symbolically,
𝑇𝐼𝐼 = (𝐸𝑋𝑖𝑗 𝐸𝑋𝑖𝑡⁄ )/(𝐸𝑋𝑤𝑗 𝐸𝑋𝑤𝑡⁄ )
Where 𝐸𝑋𝑖𝑗 = 𝑖𝑡ℎ country’s total exports to
𝑗𝑡ℎ country, 𝐸𝑋𝑖𝑡 = 𝑖𝑡ℎ country’s total value of
exports, 𝐸𝑋𝑤𝑗 = world’s total value of exports to
𝑗𝑡ℎ partner and 𝐸𝑋𝑤𝑡 = total world exports
The TII value can be interpreted the same as
RCA if TII = 1; this shows an intense trade relation
between two nations. Here, we use TII to find the
trade potentiality of tech products only.
IV. TRADE PERFORMANCE AND INTENSITY OF
TECH PRODUCTS AMONG BRICS
The major connector of trade and technology are
the transactions of technology-based products
across the world. The product's complex nature
brings enough contradiction in defining
technological alliance's cunningness in a good or
service. Many of the scholars tried to extract the
different variants of technology from end-use
products or semi-products.
While defining technological content in trade
transactions, many diversified clarifications [16] are
available in the literature. The European economist
Joseph R.A observed and examined a definition for
high technological content in product explain, based
on the usage pattern. He identified a set of
variables closely connected with the industry and
the intensity of innovation and R&D activities
inside the industry to objectify the nature of
technical cooperation in product manufacturing. He
called it an "Industry-based" technology definition.
Bullock made another distinction of "Firm based",
the complacent technology arises from firms’ action
rather than industrial influence. Another prevalent
clarification in technological issues was coined by
Serin and Hansen, assessing those product
variations of technology is due to the R&D
intensity of the product he called as product-based.
Lastly, G Balcon provides another version of
technology content in trade transactions: Life cycle-
based. He argued that the trending fashion and
quick adaptations of short-term technological
spillovers by reputable firms are behind
technology's diversified nature in products.
The South African data has been examined
before its accession into the group to evaluate the
influence of a new member's addition into the block.
The statistics show that BRICS' share in the total
world export of Tech products was 7.26% in 2000
and rose to 28.77% in 2014. This analysis
substantiates the fact of improvisation in the export
of tech products among BRICS. This is more
evident if we examine the share percentage of tech
products immediately after South Africa's accession
into the system. After SA joined in 2010 in the
system with technological cooperation in trade
transactions, its total export share rose to 24.5%
during 2011. TABLE 1
THE COMBINED PERFORMANCE OF TECH PRODUCTS AMONG
BRICS (IN % TO TOTAL EXPORT)
Type of
Tech Year Brazil Russia India China SA
Low Tech 2000 0.14 0.09 0.40 0.42 0.15
Low Tech 2014 0.08 0.05 0.25 0.34 0.10
Med Tech 2000 0.25 0.11 0.10 0.19 0.28
Med Tech 2014 0.22 0.08 0.16 0.21 0.31
High Tech 2000 0.14 0.03 0.03 0.24 0.05
High Tech 2014 0.05 0.03 0.06 0.34 0.05
Source: COMTRADE
The percentage share of different category
tech products in the total export value shows a
consistent performance throughout the period, and
it has been depicted in Table 1. The Low-tech
products stand as the more disenchantment for the
study period among BRICS. Each member lost
International Journal of Scientific Research and Engineering Development-– Volume X Issue X, Year
Available at www.ijsred.com
ISSN : 2581-7175 ©IJSRED: All Rights are Reserved Page 5
control over this variable. Brazil, Russia, and India
have shown an almost 50% dip. For Medium tech
products, every member country exhibits
comparative gain over the export items except
Russia, which has lowered the export contribution
to 0.8% from 0.11% at a span of fifteen years. In
the case of High-tech products, only India and
China illustrate advancement during the study
period. Both hikes up their shares by 50% and 40%
respectively as the share to total export. SA and
Russia display a steady and consistent performance
while Brazil decreases 60% for High-tech products.
The total volume of the trade value of BRICS for
High tech items during 2000 was 67269.04, going
up to 785984.5 million US $ in 2014. Medium tech
product also exhibits tremendous progress in its
export from 73786.18 608252.9 million US $ in
2014. Low tech goods have shown a massive hike
in export from 128820.2 to 862169.3 Million US
$ in 2014. From 2000 to 2014, the total BRICS
export of technologically adapted products exposes
a 7.36% growth rate of a previously achieved
269875.5 to 2256407 million US $ (UN
COMTRADE).
Trade intensity refers to the total value of
trade transactions between two countries that would
be smaller or greater than the trade of the world
average. In this section, the study has analysed the
trade intensity of tech products among each BRICS
member and BRICS as a whole block. The
categorised analysis of each tech classification does
not show here because it partially matters while
considering the trade intensity. Trade intensity
index commonly used between two countries for
the total product. Here we have chosen only tech
products for analytical purposes. Earlier literature
works have already evaluated total trade intensity
among BRICS. Hence it is also excluded from our
analysis part. Usually, the developed countries
enjoy most of the transactions in technologically
packed international trade, the economies like Japan,
US, Germany are the most intense trade partners in
technologically driven product’s trade. The Semi
developed groups of BRICS have some exclusive
technological product's business transactions like
Russia in high-end military defence equipment,
India in Software and pharmaceutical exports and
China in Medium tech export in the manufacturing
sector. The total trade volume of the entire BRICS
in tech product trade is 2198.90066 billion US
Dollar during 2014. China was the most
contributing nation with 1963.197 billion US Dollar.
The leading destination for Chinese export of tech
products is the USA, followed by other developed
nations. The tech export shows a steady-state
growth pattern except for the financial crisis years
of 2009 to 2011. The central analysis of this study
includes trade intensity for separate BRICS
members.
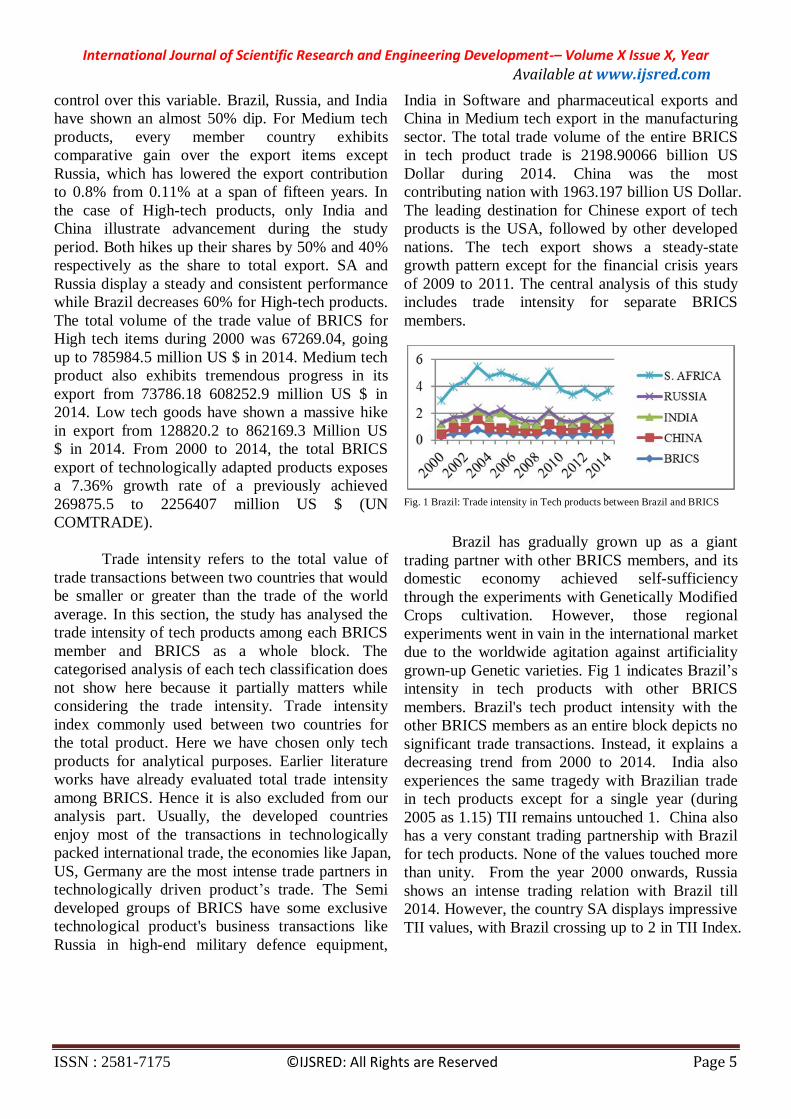
Fig. 1 Brazil: Trade intensity in Tech products between Brazil and BRICS
Brazil has gradually grown up as a giant
trading partner with other BRICS members, and its
domestic economy achieved self-sufficiency
through the experiments with Genetically Modified
Crops cultivation. However, those regional
experiments went in vain in the international market
due to the worldwide agitation against artificiality
grown-up Genetic varieties. Fig 1 indicates Brazil’s
intensity in tech products with other BRICS
members. Brazil's tech product intensity with the
other BRICS members as an entire block depicts no
significant trade transactions. Instead, it explains a
decreasing trend from 2000 to 2014. India also
experiences the same tragedy with Brazilian trade
in tech products except for a single year (during
2005 as 1.15) TII remains untouched 1. China also
has a very constant trading partnership with Brazil
for tech products. None of the values touched more
than unity. From the year 2000 onwards, Russia
shows an intense trading relation with Brazil till
2014. However, the country SA displays impressive
TII values, with Brazil crossing up to 2 in TII Index.

International Journal of Scientific Research and Engineering Development-– Volume X Issue X, Year
Available at www.ijsred.com
ISSN : 2581-7175 ©IJSRED: All Rights are Reserved Page 6
So here, Brazil exhibits an intense trading strategy
with only two nations - SA and Russia.
Fig. 2 Russia: Trade intensity in Tech products between Russia and BRICS
Fig 2 indicates Russia’s intensity in tech
products with other BRICS members.
Geographically, Russia is the biggest country on the
planet, making it an enormous mineral and gas
deposit reservoir. The former Soviet Union has lost
its past glimpse after the dismantling of the USSR.
Even though today, Russia is considered as one of
the centres of the world's Geo-politics. We could
identify this Russian dominance on their TII Index
analysis with the rest of the BRICS. Previously,
Russia enjoyed unquestioned relation with the
BRICS as an entire block, now it has lost the grip
and started fading out its glory to a below one mark
from 2.74 in 2000. Comparing Russia with a single
member still enjoys an effective trading movement
in tech products' transactions. In Brazil's case, it
successfully maintains TII above two points till
2014 and illustrates a constant relation with SA,
concluding no intense trade transaction. The
Chinese story is also the same as Russia. Initial 3.16
dipped to 0.61 in the later period of 2014. The
tremendous loss of Russia is visible when compared
with India's TII values. Former Soviet friends had a
relation of 8 points in the TII index declined to 2.90
in 2014. Thus, Russia's whole story tells that it has
an intense trade transaction in tech products with
only two BRICS members- India and Brazil.
Fig. 3 India: Trade intensity in Tech products between India and BRICS
Fig 3 indicates India’s intensity in tech
products with other BRICS members. India is a
legal trading entity with its precious wealth since
time immemorial. This trading legacy was there
with the nation while the BRICS established. India's
total tech products trade with the entire BRICS
block remains firm with the additional incubating
technologically driven trade transactions. Brazil,
India's traditional trading partner, shows an upward
rising TII curve of tech products, crossing the one-
point thresholds. The Indo- Chinese trade in tech
products also has not flourished yet. The case of
Russia is again another tragic event conceding
below one in TII during 2014 from 3.48 in 2000.
Only S.A performs an intense trading relation with
India crossing, 3pont in TII index.
Fig. 4 China: Trade intensity in Tech products between China and BRICS
Fig 4 indicates China’s intensity in tech
products with other BRICS members. China enjoys
the status of the biggest economy among BRICS
and stands at the top in tech products' trade
transactions. BRICS, as an entire block, shows
nominal values in the TII index crossing below
00.05. Russia also exhibits the same level of

International Journal of Scientific Research and Engineering Development-– Volume X Issue X, Year
Available at www.ijsred.com
ISSN : 2581-7175 ©IJSRED: All Rights are Reserved Page 7
dissatisfied trade transactions for the tech products
up to 0.027 at the end of 2014. The Brazilian
economy has a robust and intense relation with
Chinese tech export crossing 1.15 in 2014. India
and SA also depict almost the same level of
significant positive values above one. Only, the
Chinese economy shows significant export intensity
with the other three members of BRICS.
Fig. 5 S.Africa: Trade intensity, Tech products between S.Africa and BRICS
Fig 5 indicates South Africa’s intensity in tech
products with other BRICS members. South
African economy is the smallest among BRICS and
exposes significant trading partnership with all
other BRICS in the export intensity measurement of
each member. South African significant export
intensity values are that it is the smallest economy;
hence, it depends upon other's exports. This
shortcoming has shrunk the South African economy
from establishing vigorous export intensity with
other group members. It has an in-significant TII
value with the other four partners crossing below
one point in the Index. India and Brazil illustrate
comparatively closer values to one, showing .96
and .80, respectively. Thus, the South African
economy exhibits the weakest intensity among all
BRICS.
V. RCA ANALYSIS
The source of any comparative advantage in
trade is the state or individuals' different level
initiatives to promote trade transactions. These
differences arise from the variations in the source of
technological input of a system. The Georgia High-
Tech indicators [18] suggest that the total
technological output can be equated with the use of
total technological inputs prevailing in society; they
further describe the total inputs identified as the
mix of socio-economic infrastructure, national
orientation, technological infrastructure, and
product capacity level available to that nation. R&D
investment is a crucial factor in determining the
technological level of a country. It expresses a
direct relationship between the growth rate of both
technologies aligned products and the nation's total
growth rate. Suppose higher the R&D higher will
be the growth rate and vice versa. The productive
capacity is directly attributed to the trends and
pattern of a nation's science and technological
innovations. Intellectual property and patent rights
have always supplied the availability of
technological skills and knowledge to society.
Hence the productive capacity illustrates a direct
link with patents achieved in that country.
The BRICS formed as a union to help each other
in achieving a better financial world without
shortcomings. The concept of technical cooperation
with other members in the block will become more
crucial in technological advancement and tech
products trade. More autonomous investment-
related technological cooperation can be a proxy to
survive the interest of each member among BRICS.
All the BRICS partners observe comparative
advantage in the High-tech product's export of
Computer, office machinery, Pharmacy, and
aerospace. The difficulty in defining the exact
technological contents in the wide variety of tech
products limiting us to take the broad disaggregated
level products instead of Low tech, Medium tech,
and High-tech products.
The RCA Index here used to measure the trade
potentiality between two countries at a higher
disaggregated level. RCA analysis aims to evaluate
the performance of the trade potential of tech
products' three-tier classifications provided in the
paper. The total tech product categorised into low
tech, medium-tech, and high tech to explain
disaggregate level trade potentiality among BRICS.
General product's comparative advantage has been
deeply examined by many researchers of earlier
literature. They found that major BRICS countries

International Journal of Scientific Research and Engineering Development-– Volume X Issue X, Year
Available at www.ijsred.com
ISSN : 2581-7175 ©IJSRED: All Rights are Reserved Page 8
have massive trade potentialities in primary and
related products, especially in Minerals and Mining.
The study conducted by Raghuramapatruni R
reveals that Brazil has a comparative advantage in
food, fuels, mining, and steel with others. India can
gain potential trade in food, fuels, steel, and
pharmaceutical products. The Russian case is
slightly different; it has good command over fuels,
mining, iron, steel, and automotive transport
machinery. China enjoys a comparative advantage
in iron, steel, telecommunication, machinery, and
transportation. South Africa can show trade
potentiality in Agricultural products,
pharmaceutical, mining, and telecommunication
with other BRICS members.
TABLE 2
COMPARATIVE ADVANTAGE TECHNOLOGY PRODUCTS
AMONG BRICS
Year India China S. Africa
Low tech High tech Low tech
Medium
tech
2000 2.4065 1.01946 2.56067 0.849841
2002 2.14936 1.33785 2.33594 1.06783
2004 2.2124 1.68688 2.08829 1.0298
2006 1.98312 1.78884 2.14448 1.03781
2008 1.62493 1.98798 2.19192 1.21737
2010 1.60316 1.97623 2.13061 1.11243
2012 1.75926 1.98365 2.29128 1.01192
2014 1.56819 1.82158 2.20858 1.08372
The RCA values observed for BRICS
countries shows that the comparative advantage in
the export of different category tech products’ is the
same for Brazil and Russia; both nations did not
enjoy comparative advantage either in Low tech,
Medium tech, or High-tech goods transactions. The
RCA values are below one here. The significantly
fewer RCA values for Russia and Brazil indicated
an indecent comparative advantage in tech products'
trade. This is because both are much advanced in
primary economic activities, especially in minerals,
fuels, and mining. Wherever they show their
strength in world markets, they face higher
competition from other developed nations. Brazil
has excellent control over the aerospace industry
among BRICS, but its competition is lacking
behind the USA or France on a global platform.
Hence for these two BRICS members, the trades in
tech products need more attention from the
policymakers.
India and China are the biggest nations among
BRICS in terms of population and size of the
economy. Hence these two illustrate comparatively
better performance compared to other members.
China is the only country that could successfully
achieve trade potentiality for two groups (Low tech
and High tech) among BRICS. China exhibits trade
potentiality in electronic data processing, office
machinery and telecommunication and transport
equipment in High tech products and other
machinery for the iron and steel industry in Low
tech products. China displays a consistent
performance in both the tech categories throughout
the study period. Another important nation among
BRICS, India, exhibits comparative advantage in
High-tech products and not in other tech categories.
Indian High tech Export is exposing significant
RCA values from 2000 to 2014 only. The major
products of Indian comparative advantage are the
telecommunication and computer processing tools.
South Africa is another nation in BRICS that shows
comparative export advantage in Medium tech
products only. The RCA value of more than 1 in
Medium tech exhibits South Africa's strong position
in automotive products.
VI. CONCLUSION
Globalisation stands at the centre of spreading
technological spillovers across the world, but the
distribution of technological richness mismatches
with the allocation of the low-cost labour force.
These differences in technological products'
manufacturing pave the stones for International
trade transactions. World witnesses an abundant
presence of technological products in the baskets of
Developed countries. On the other hand, the
manufactures of tech products look at the emerging
markets in search of low-cost production techniques.
BRICS countries are in the middle of these two

International Journal of Scientific Research and Engineering Development-– Volume X Issue X, Year
Available at www.ijsred.com
ISSN : 2581-7175 ©IJSRED: All Rights are Reserved Page 9
classifications. Simultaneously it operates as a
technologically prosperous nation with quick
adaption from the western world and its supply of
adequate human capital at a meagre cost. Hence it
is difficult to assess which BRICS comes under
which category? This paper brings an answer to this
question. The RCA analysis and Trade Intensity
analysis of BRICS tech products suggests that
BRICS stands unique among technologically rich
nations and emerging markets. China and India
have a comparative advantage in top technological
classifications. China has an advantage in both
High tech and Low tech, India has the upper hand
in Low-tech transactions, and South Africa has in
Medium tech products. Brazil and Russia have no
comparative advantage in the tech trade, but it
exhibits an intense trade potentiality with others in
tech trade transactions. These value-added trade
transactions among BRICS can be concluded as an
engine of future growth. The one useful method for
every member state's technological benefit is to go
for the industrial specialisation where partnership
advantage is equally high to each member.
REFERENCES [1] Burange L.G and NN. Karnik, (2014) “An Analysis of the Export
Competitiveness of BRIC”: Is fire Working Paper Series, Working
Paper – 4.
[2] Castro T.D. (2012), “Trade Cooperation Indicators: Development of
BRIC Bilateral Trade Flows”: International Review of Business
Research Papers Vol. 8. No. 1, Pp. 211 – 223.
[3] Depperu D. and D. Cerrato, (2005) “Analysing International
Competitiveness at the Firm Level: Concepts and Measures”:
Researchgate. (https://www.researchgate.net/publication/228681715).
[4] Evenett S.J. (2015), "The BRICS Trade Strategy: Time for a Rethink":
The 17th GTA Report, CEPR Press, London.
[5] Porter. H, M.P. Ribeiro, W. Urban and J. Ghosh, (2009), “Models of
BRIC’s Economic Development and Challenges for EU
Competitiveness”: The Vienna Institute for International Economic
Studies, Research Reports- 359, Vienna.
[6] Hongyi, L.Xiaoming and G. Mingwei, “Analysis of BRICS Countries’
Economic Situation and Competitiveness”: Shandong University of
Finance and Economics, Jinan China.
[7] Jayati G. (2013), “The Global Economic Chessboard and the Role of
the BRICS: Brazil, Russia, India, China, South Africa”: Global
Research.
[8] Mukhopadhyaya and J. Nath, (2012), “Determinants of Market Share,
Profitability and Market Power at the Firm Level in the Cement
Industry of India”: Vilakshan: The XIMB Journal of Management; Vol.
9 Issue 1, pp. 95-114.
[9] Nayyar, D. (June 2008) “China, India, Brazil and South Africa in the
World Economy Engines of Growth?”: Institute for Economic
Research, Discussion Paper No. 2008/05, World (UNU-WIDER).
[10] Pant M. (2011), “India and the BRICS Countries: Issues of Trade and
Technology”: Indian Institute of Foreign Trade (IIFT), New Delhi.
[11] Porter M.E (1980), “COMPETITIVE STRATEGY Techniques for
Analyzing Industries and Competitors”: Free Press, New York (USA).
[12] Raghuramapatruni R. (2015), “Revealed Comparative Advantage and
Competitiveness: A Study on BRICS”: Arabian Journal of Business
and Management Review 5:5.
[13] Rizvi S.A.M and H.S, Rizvi. (2010), “GRAIN in BRICS”: Khanna
Book Publishing Co. (P) Ltd, New Delhi.
[14] Saito M. (2004), “Armington Elasticities in Intermediate Inputs Trade:
A Problem in Using Multilateral Trade Data”: IMF Working Paper.
[15] Verhulst H., “International Trade in Technology – Licensing of Know-
How and Trade Secrets 1”: Centre for Promotion of Imports from
Developing Countries (CBI), Netherlands,
(http://www.wipo.int/portal/en/index.html).
[16] Ying S, Miao L. and C. Yibo, (2014), “High-Tech Products Export
Competitiveness, BRIC Countries in U.S Market: A Comparative
Analysis”: The Journal of developing Areas, Volume 48, No.3.
[17] Coviello, N., & Munro, H. (1997). Network relationships and the
internationalisation process of small software firms. International
business review, 6(4), 361-386.
[18] https://tpac.gatech.edu/tpac2016/sites/default/files/projectfiles/exsum0
1.pdf