exploring the sequence space of a dna aptamer using ... the... · exploring the sequence space of a...
TRANSCRIPT

7626–7635 Nucleic Acids Research, 2007, Vol. 35, No. 22 Published online 2 November 2007doi:10.1093/nar/gkm922
Exploring the sequence space of a DNA aptamerusing microarraysEvaldas Katilius*, Carole Flores and Neal W. Woodbury
Center for BioOptical Nanotechnology, The Biodesign Institute and the Department of Chemistry andBiochemistry, Arizona State University, Tempe, AZ 85287-5201, USA
Received June 18, 2007; Revised September 18, 2007; Accepted October 10, 2007
ABSTRACT
The relationship between sequence and bindingproperties of an aptamer for immunoglobulin E (IgE)was investigated using custom DNA microarrays.Single, double and some triple mutations of theaptamer sequence were created to evaluate theimportance of specific base composition on apta-mer binding. The majority of the positions in theaptamer sequence were found to be immutable, withchanges at these positions resulting in more than a100-fold decrease in binding affinity. Improvementsin binding were observed by altering the stem regionof the aptamer, suggesting that it plays a significantrole in binding. Results obtained for the variousmutations were used to estimate the informationcontent and the probability of finding a functionalaptamer sequence by selection from a randomlibrary. For the IgE-binding aptamer, this probabilityis on the order of 10210 to 1029. Results obtained forthe double and triple mutations also show that thereare no compensatory mutations within the spacedefined by those mutations. Apparently, at least forthis particular aptamer, the functional sequencespace can be represented as a rugged landscapewith sharp peaks defined by highly constrainedbase compositions. This makes the rational optimi-zation of aptamer sequences using step-wisemutagenesis approaches very challenging.
INTRODUCTION
Aptamers are short, single-stranded nucleic acids whichcan be selected in vitro to bind nearly any target, fromsmall molecules to proteins (1–3). The relative ease ofselection, and the fact that the specificity and affinity ofaptamers rival that of monoclonal antibodies has led to anincreasing number of analytical applications for aptamers(4–6). One such application is the creation of aptamermicroarrays that have been used for protein detection with
the ultimate goal of proteomic profiling of biologicalsamples for diagnostic purposes (7).
Several approaches for creating low-density arrays(both in terms of number of probes per array and interms of different aptamers) have been previouslydescribed. In one of the earliest reports, an array biosensorutilizing fluorescently labeled DNA- and RNA-basedaptamers was used to demonstrate binding of targetproteins in complex mixtures by using fluorescenceanisotropy changes upon protein target binding toa surface-immobilized aptamer (8). Later reports havedescribed approaches where fluorescently labeled proteinswere used to detect binding to the aptamers arranged ona surface in microarray format. For example, DNA-basedphotoaptamer microarrays were created by immobilizingaptamers on slides using chemical linkage through anamino group present on the 50 end of the aptamer. Thesearrays were used to detect and quantify concentrationsof up to 17 different target proteins (7). Similarly, DNAaptamers which bind to human immunoglobulin E (IgE)and thrombin were used to create spotted microarraysusing 30-amino-modified sequences (9). Subsequently,more extensive studies including both DNA and RNAaptamers were performed using biotin-modified aptamerswhich were spotted onto the surface of streptavidin orneutravidin modified slides (10–12). In all of these cases,DNA or RNA aptamers selected employing solution-based SELEX methods were used in a microarray formatto demonstrate binding of fluorescently labeled targetproteins. Recently, applications of aptamer arrays usingdifferent label-free detection modalities have also beendemonstrated. For example, surface plasmon resonance(SPR) imaging was used to detect protein binding to RNAaptamer microarrays (13,14). Electrochemical detection ofprotein target binding to arrays of aptamer-modified goldelectrodes have been also demonstrated (15).
The studies described above used aptamer sequenceswhich were chemically synthesized and then depositedon the surface of an array. However, this approachis limited in terms of the number of aptamers permicroarray, both because of the requirement that theaptamers be presynthesized and by limitations of robotic
*To whom correspondence should be addressed. Tel: +1 480 727 8790; Fax: +1 480 727 0396; Email: [email protected]
� 2007 The Author(s)
This is an Open Access article distributed under the terms of the Creative Commons Attribution Non-Commercial License (http://creativecommons.org/licenses/
by-nc/2.0/uk/) which permits unrestricted non-commercial use, distribution, and reproduction in any medium, provided the original work is properly cited.
Downloaded from https://academic.oup.com/nar/article-abstract/35/22/7626/2402600/Exploring-the-sequence-space-of-a-DNA-aptamerby Arizona State University West useron 07 September 2017

printing approaches. In situ DNA synthesis technologies,either light-directed synthesis (Affymetrix, NimbleGen)or non-contact printing of nanoliter volumes (Agilent),allow much higher density arrays to be created. It is nowpossible to obtain large custom microarrays withhundreds of thousands of probes (Agilent, Nimblegen).In the present report, custom DNA microarrays havebeen designed and used as a means of synthesizing andanalyzing variants of an IgE binding aptamer, which haspreviously been selected using SELEX methodology (16)(Figure 1). This has made it possible to explore the effectsof aptamer sequence modification on binding propertiesand to see if enhancement in binding of surface-boundaptamers can be observed. The IgE-binding aptamer thatserved as the basis for this study was selected previouslyusing standard, solution-phase SELEX methodology (16),and one question addressed in this work is whether furtheroptimization for use as a surface bound molecularrecognition element in a microarray format is possible.Because current technology allows in situ synthesis ofthousands of distinct sequences in the same microarray,it is straightforward to study the effects of single, double,triple, etc. mutations of a specific aptamer. We havedesigned a 44 000 feature custom microarray (Agilent)that contains three copies of all possible single- anddouble-mutations as well as about one-third of all triplemutations of the IgE aptamer. This allows the directexploration of the topology of aptamer sequence space.
Direct exploration of sequence space utilizing micro-arrays offers a unique perspective for studying protein–DNA interactions. This has been elegantly demonstratedby protein-binding microarray technology, which provides
comprehensive characterization of the in vitro DNA-binding specificities of DNA-binding proteins (transcrip-tion factors etc.) binding to double-stranded DNAmicroarrays (17–20). Analysis of DNA-binding specificitiesusing microarrays provides information about the loweraffinity sequences, which is largely inaccessible using othermethods for sequence space exploration, like selectionsfrom doped libraries (21,22). Here we demonstrate thatmicroarray technology can be effectively used for directexploration of protein-binding aptamer sequence space byproviding a complete picture of high-, moderate- and low-binding sequence variants of the IgE-binding aptamer.
MATERIALS AND METHODS
Human IgE was purchased from Athens Research(Athens, GA, USA). For binding experiments, IgE waslabeled with Alexa Fluor 647 dye according to themanufacturer’s protocol (Invitrogen). Typical labelingresulted in �6–7 dye molecules per protein molecule.Custom 44K DNA microarrays were designed and
ordered through the custom microarray program fromAgilent. The array design was based on the publishedIgE aptamer sequence (sequence 17.4, see Figure 1).Microarrays were designed to include triplicates of eachprobe. Before binding of the fluorescently labeled IgEprotein to the array, the microarray surface was blockedusing a solution consisting of 0.2% I-Block (AppliedBiosystems) and 0.1% Tween-20 in 1� PBS also contain-ing 1mM MgCl2. Blocking was done for 1 h at roomtemperature and then the arrays were dried by centri-fuging. Protein binding was performed using GeneFramehybridization chambers. Fluorescently labeled protein wasdiluted to concentrations ranging from 1nM to 500 nM in1% BSA solution in 1� PBSMT (1� PBS (10mM sodiumphosphate buffer pH 7.4, 138mM NaCl, 2.7mMKCl)+0.1% Tween-20+1mM MgCl2). Binding assayswere done at 378C overnight. After incubation, micro-arrays were washed three times with 1� PBSMT and threetimes with 1� PBSM (1� PBS+1mM MgCl2). Then, themicroarrays were dipped in nanopure H2O to remove anyremaining salt and dried by centrifuging (1500 rpmfor 5min using a swinging bucket rotor). Microarrayswere imaged using Agilent’s microarray scanner at 10 mmresolution. Data were extracted from images usingGenePix Pro 6.0 software and results were analyzedusing programs written in Matlab or Excel. Results fromtriplicates of each probe were used to calculate the meanfluorescence signal and standard deviation for each probe.In the majority of cases, the SD was <10% of the meanvalue. To evaluate reproducibility, incubations at 100 nMprotein concentration have been performed three times(on three different arrays), and the array-to-array varia-bility was also within 10% of the mean signals.
RESULTS
DNA sequences on custom DNA arrays from Agilent canbe synthesized up to 60 nt in length. Since the IgE-bindingaptamer is only 37 nt long (Figure 1), the initial investiga-tion of this aptamer immobilized on the surface of the
Figure 1. Predicted secondary structure of the IgE-binding aptamerused in this study. Non-Watson-Crick base pairing between T and G isdenoted with a dot. The secondary structure shown was determinedusing the program ‘mfold’ (30).
Nucleic Acids Research, 2007, Vol. 35, No. 22 7627
Downloaded from https://academic.oup.com/nar/article-abstract/35/22/7626/2402600/Exploring-the-sequence-space-of-a-DNA-aptamerby Arizona State University West useron 07 September 2017
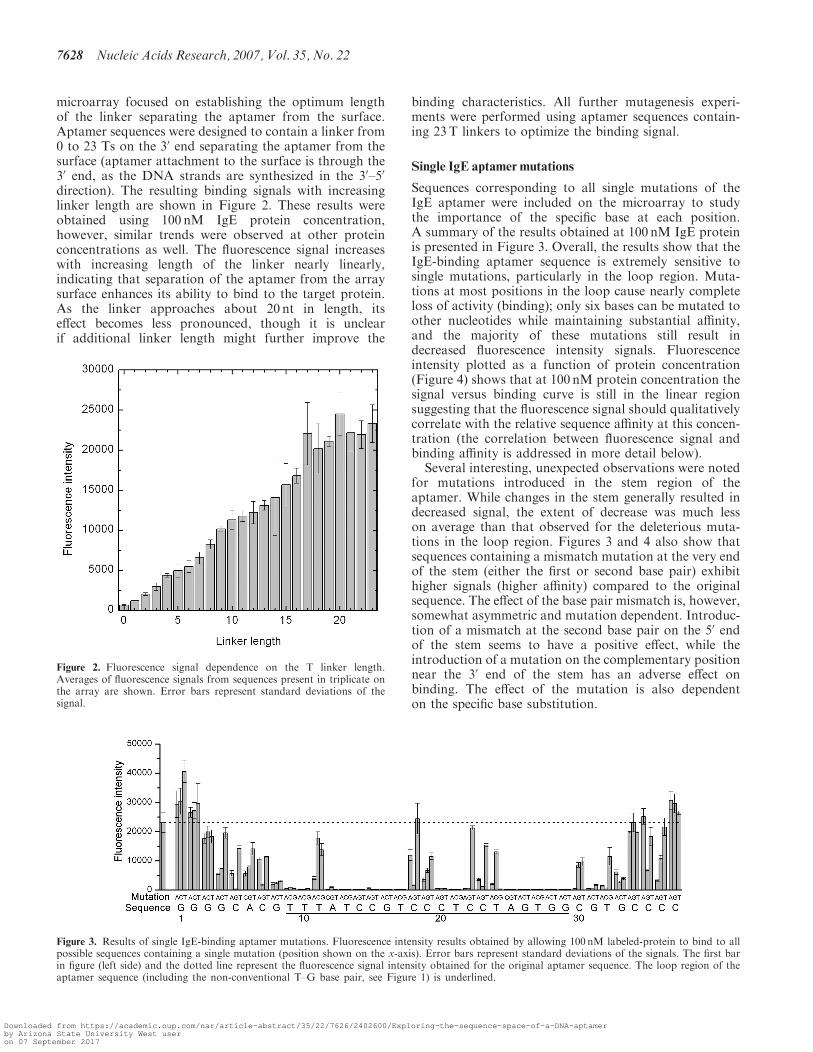
microarray focused on establishing the optimum lengthof the linker separating the aptamer from the surface.Aptamer sequences were designed to contain a linker from0 to 23 Ts on the 30 end separating the aptamer from thesurface (aptamer attachment to the surface is through the30 end, as the DNA strands are synthesized in the 30–50
direction). The resulting binding signals with increasinglinker length are shown in Figure 2. These results wereobtained using 100 nM IgE protein concentration,however, similar trends were observed at other proteinconcentrations as well. The fluorescence signal increaseswith increasing length of the linker nearly linearly,indicating that separation of the aptamer from the arraysurface enhances its ability to bind to the target protein.As the linker approaches about 20 nt in length, itseffect becomes less pronounced, though it is unclearif additional linker length might further improve the
binding characteristics. All further mutagenesis experi-ments were performed using aptamer sequences contain-ing 23T linkers to optimize the binding signal.
Single IgE aptamer mutations
Sequences corresponding to all single mutations of theIgE aptamer were included on the microarray to studythe importance of the specific base at each position.A summary of the results obtained at 100 nM IgE proteinis presented in Figure 3. Overall, the results show that theIgE-binding aptamer sequence is extremely sensitive tosingle mutations, particularly in the loop region. Muta-tions at most positions in the loop cause nearly completeloss of activity (binding); only six bases can be mutated toother nucleotides while maintaining substantial affinity,and the majority of these mutations still result indecreased fluorescence intensity signals. Fluorescenceintensity plotted as a function of protein concentration(Figure 4) shows that at 100 nM protein concentration thesignal versus binding curve is still in the linear regionsuggesting that the fluorescence signal should qualitativelycorrelate with the relative sequence affinity at this concen-tration (the correlation between fluorescence signal andbinding affinity is addressed in more detail below).
Several interesting, unexpected observations were notedfor mutations introduced in the stem region of theaptamer. While changes in the stem generally resulted indecreased signal, the extent of decrease was much lesson average than that observed for the deleterious muta-tions in the loop region. Figures 3 and 4 also show thatsequences containing a mismatch mutation at the very endof the stem (either the first or second base pair) exhibithigher signals (higher affinity) compared to the originalsequence. The effect of the base pair mismatch is, however,somewhat asymmetric and mutation dependent. Introduc-tion of a mismatch at the second base pair on the 50 endof the stem seems to have a positive effect, while theintroduction of a mutation on the complementary positionnear the 30 end of the stem has an adverse effect onbinding. The effect of the mutation is also dependenton the specific base substitution.
Figure 3. Results of single IgE-binding aptamer mutations. Fluorescence intensity results obtained by allowing 100 nM labeled-protein to bind to allpossible sequences containing a single mutation (position shown on the x-axis). Error bars represent standard deviations of the signals. The first barin figure (left side) and the dotted line represent the fluorescence signal intensity obtained for the original aptamer sequence. The loop region of theaptamer sequence (including the non-conventional T–G base pair, see Figure 1) is underlined.
Figure 2. Fluorescence signal dependence on the T linker length.Averages of fluorescence signals from sequences present in triplicate onthe array are shown. Error bars represent standard deviations of thesignal.
7628 Nucleic Acids Research, 2007, Vol. 35, No. 22
Downloaded from https://academic.oup.com/nar/article-abstract/35/22/7626/2402600/Exploring-the-sequence-space-of-a-DNA-aptamerby Arizona State University West useron 07 September 2017

Double mutations
Given that the IgE aptamer is predicted to have a stem-loop secondary structure (Figure 1), we have created twodistinct sets of double mutations. First, all possible doublestem mutations that conserve the base pairing wereinvestigated to analyze the stem’s importance in binding.Another set of all possible double mutations in the loopregion (spanning bases 9–29) were created and testedto investigate the effects of these mutations on bindingaffinity.
The results for the stem mutations are summarized inFigure 5. Overall, these findings suggest that only a smallregion of the stem is critical for binding. The majorityof the base pair-conserving mutations do not have asignificant effect on the binding signal. As seen for thesingle mutations, a higher intensity fluorescence signal isobserved for the features containing sequences in whichthe first base pair in the stem (G–C) is changed to athermodynamically less stable base pair (A–T or T–A).Interestingly, mutation of the fifth, sixth or seventh basepair in the middle of the stem to GC results in a decreaseof the observed signal, suggesting that the particularcomposition of these base pairs is important for bindingto IgE. On the other hand, mutation of the eighth basepair from GC to AT results in a significant increase in theobserved fluorescence signal. The specific arrangement ofbases also seems to be important as the symmetric reversalof AT to TA in this position results in a decreased signal.Another surprising result is that the aptamer containingthe mirror image of the stem (i.e. the sequence on the leftswitched places with the sequence on the right) shows
an increase in the observed fluorescence signal (corre-sponding to a higher binding affinity) compared to theoriginal sequence. The results of Figure 5 also show thatthe particular composition of the stem is important,as aptamers with completely mutated stems (all G–C or allC–G or all A–T base pairs) show significant decreases inbinding affinity. The results for all T–A base pair stems aremost likely biased because of the 23T linker separatingthe aptamer from the surface and the run of A’s in closeproximity at the 30 end of the stem. In this case, secondarystructure calculations predict a configuration that is morestable when the linker sequence folds to form a smallall-T loop with the A–T stem. The existence of this stablesecondary structure likely interferes with the properaptamer structure required for binding to IgE.As the single mutation results described above suggest,
little variation is possible in the specific aptamer sequenceof the loop region if function is to be maintained.However, in principle, a mutation at one position mightbe compensated by a mutation at another position. To testthis, sequences containing all possible double mutationsin the loop region (starting with the non-conventionalTG base pair) were included on the microarray to investi-gate the interplay between mutations within the loop.The results complement the results of the single mutations,showing that most of the positions in the aptamersequence are critical for binding (Figure 6). Only fewpositions can be mutated in concert while still maintaininga significant binding affinity. In particular, double muta-tions including mutations in the positions 11, 18, 19, 22, 23and 24 retain aptamer activity, although with decreasedaffinity (Figure 6). These mutations are at the same
Figure 4. Protein concentration dependence of the fluorescent intensityfor the original aptamer sequence (squares) and for three mutations—Gmutation to T at position 1 (circles), C mutation to T at position 19(triangles) and T mutation to A at position 17 (diamonds). Lines in thegraph are B-spline interpolations of the data shown only as a guide tothe eye. Error bars represent the standard deviations of the signals.Results obtained for the T to A mutation at position 17 arerepresentative of non-specific protein binding to the control randomDNA sequences.
Figure 5. Results of aptamer stem composition analysis. Fluorescenceresults were obtained for aptamer sequences containing an altered basepair in the stem region or a different composition of the stem altogether(see text and Figure 1 for explanation). ‘Reverse’ represents the resultwhere the aptamer sequence fragments corresponding to the stemregion were switched (50 versus 30). The first bar (bottom) in the graphand the dotted line represent the fluorescence signal observed for theoriginal aptamer sequence.
Nucleic Acids Research, 2007, Vol. 35, No. 22 7629
Downloaded from https://academic.oup.com/nar/article-abstract/35/22/7626/2402600/Exploring-the-sequence-space-of-a-DNA-aptamerby Arizona State University West useron 07 September 2017
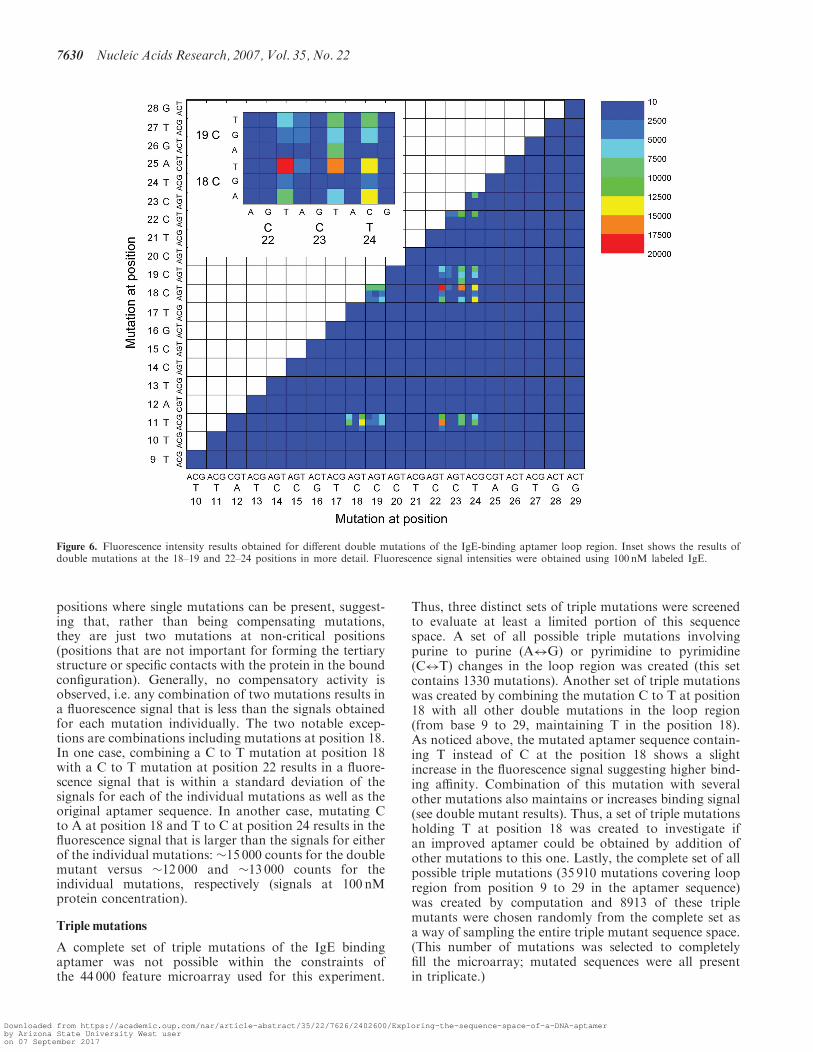
positions where single mutations can be present, suggest-ing that, rather than being compensating mutations,they are just two mutations at non-critical positions(positions that are not important for forming the tertiarystructure or specific contacts with the protein in the boundconfiguration). Generally, no compensatory activity isobserved, i.e. any combination of two mutations results ina fluorescence signal that is less than the signals obtainedfor each mutation individually. The two notable excep-tions are combinations including mutations at position 18.In one case, combining a C to T mutation at position 18with a C to T mutation at position 22 results in a fluore-scence signal that is within a standard deviation of thesignals for each of the individual mutations as well as theoriginal aptamer sequence. In another case, mutating Cto A at position 18 and T to C at position 24 results in thefluorescence signal that is larger than the signals for eitherof the individual mutations: �15 000 counts for the doublemutant versus �12 000 and �13 000 counts for theindividual mutations, respectively (signals at 100 nMprotein concentration).
Triple mutations
A complete set of triple mutations of the IgE bindingaptamer was not possible within the constraints ofthe 44 000 feature microarray used for this experiment.
Thus, three distinct sets of triple mutations were screenedto evaluate at least a limited portion of this sequencespace. A set of all possible triple mutations involvingpurine to purine (A$G) or pyrimidine to pyrimidine(C$T) changes in the loop region was created (this setcontains 1330 mutations). Another set of triple mutationswas created by combining the mutation C to T at position18 with all other double mutations in the loop region(from base 9 to 29, maintaining T in the position 18).As noticed above, the mutated aptamer sequence contain-ing T instead of C at the position 18 shows a slightincrease in the fluorescence signal suggesting higher bind-ing affinity. Combination of this mutation with severalother mutations also maintains or increases binding signal(see double mutant results). Thus, a set of triple mutationsholding T at position 18 was created to investigate ifan improved aptamer could be obtained by addition ofother mutations to this one. Lastly, the complete set of allpossible triple mutations (35 910 mutations covering loopregion from position 9 to 29 in the aptamer sequence)was created by computation and 8913 of these triplemutants were chosen randomly from the complete set asa way of sampling the entire triple mutant sequence space.(This number of mutations was selected to completelyfill the microarray; mutated sequences were all presentin triplicate.)
Figure 6. Fluorescence intensity results obtained for different double mutations of the IgE-binding aptamer loop region. Inset shows the results ofdouble mutations at the 18–19 and 22–24 positions in more detail. Fluorescence signal intensities were obtained using 100 nM labeled IgE.
7630 Nucleic Acids Research, 2007, Vol. 35, No. 22
Downloaded from https://academic.oup.com/nar/article-abstract/35/22/7626/2402600/Exploring-the-sequence-space-of-a-DNA-aptamerby Arizona State University West useron 07 September 2017

Triple purine–purine or pyrimidine–pyrimidinemutations. The results for these mutations essentiallymatch the results of the double mutations. Only combina-tions of the mutations in positions 11, 18, 19, 22, 23 and24 are possible while still maintaining significant bindingsignal (only 20 out of 1330 of mutations). Combinationsof mutations at any other positions, even when containingtwo of the mutations in the above mentioned positions,results in a decrease in fluorescence signal to near back-ground levels, indicating that these sequences do notexhibit significant affinity for the target protein.
Triple mutations containing 18T. Analysis of results forthe set of triple mutations containing 18T instead of C alsocoincide with the results obtained for double and othertriple mutations—only mutations in the positions 11, 19,22, 23 or 24 in addition to a mutation of C to T at position18 are possible while maintaining reasonable affinity.Only one of the combinations of mutations containing18T, substitution of A for C at position 19 and T for Cat position 23, shows a signal close to that of theoriginal aptamer sequence (�20 000 versus about 23 000as obtained using 100 nM of labeled target protein).All other combinations of mutations resulted in at leasttwo-fold reduction in signal compared to the originalaptamer sequence.
Random triple mutations. Results obtained for nearly9000 triple mutations which were randomly selected fromthe set of all possible triple mutations in the loop regionconfirm the results obtained for the double and othertriple mutations. Once again, results show that onlycombinations of the mutations in positions 11, 18, 19, 22,23 and 24 still exhibit significant binding signal. Any othercombinations containing mutations in other positionsresult in a decrease of the fluorescence signals to a levelclose to the background.
Comparison of array data to independentlydeterminedKd values
The original IgE-binding aptamer and three of thevariants with either stronger (G to T mutation atposition 1), similar (C to T mutation at position 19) ormuch weaker (T to A mutation at position 17) apparentaffinities were synthesized and their Kd values were deter-mined using SPR and/or fluorescence anisotropy methods(results are summarized in Table 1, see also Supplemen-tary Data). SPR experiments were performed usinga Biacore instrument, where IgE was immobilized on thesurface of a gold chip and different aptamers were flowed
over it. The fluorescence anisotropy experiments utilizedTexas Red labeled aptamers binding to IgE in solution,similarly to previously published work (23). The fluore-scence values observed on the array for this set of aptamervariants using 100 nM labeled IgE corresponds qualita-tively to the binding constants determined, suggesting thatthe level of fluorescence on the array is a reasonablequalitative measure of affinity.
DISCUSSION
Nucleic acid aptamers have been rapidly gaining popu-larity in various bioanalytical techniques where theyhave been effectively used to replace antibodies. One ofthe main reasons for this is the fact that aptamers canbe easily synthesized and modified using well-establishednucleic acid chemistries. The specific nucleic acid sequencedetermines how the aptamer is folded, which in turndetermines the binding affinity. Thus, investigation of therelationship between sequence, structure and bindingaffinity is important for a more complete understandingof the biophysical aspects of aptamer–ligand binding.A number of studies of aptamer sequence space havebeen performed previously utilizing a variety of techniquesdirected to either chemically modify the aptamersequences (24–26) or to select the best variants from thedoped aptamer libraries (21,22,27). Chemical modificationstudies, like footprinting using various cleavage agentshave been instrumental in shedding some light onto thestructural aspects of aptamer binding to proteins, whereX-ray or NMR structural data is not available. Chemicalcleavage or modification of an aptamer’s sequenceprovides some limited information about the parts ofthe sequence that are in close proximity (or makecontact with) the target and are therefore protected frommodification. In combination with the secondary structurepredictions, these studies provide some information aboutthe possible structural motifs critical in effective bindingof an aptamer to its target (24,25).Selections of aptamers from doped libraries, where the
specific positions or regions in the sequence have beenmodified to contain an unequal distribution of nucleo-tides, have been very informative in determining the bestconsensus sequences for a variety of aptamers as well asdetermining base distribution, i.e. information contentof the sequence (27). However, selection of aptamers fromdoped libraries has limitations. This process of selectionis inherently targeted toward the selection of the highestaffinity sequences. Information about these sequences isobtained after cloning and sequencing a limited number
Table 1. Comparison of fluorescence signals to independently measured dissociation constants for different aptamer variants
Aptamer Fluorescence signalat 100 nM protein
KD fromanisotropy, nM
KD fromSPR, nM
Ka, M�1s�1 Kd, s
�1
Original sequence 23 000 15� 4 4.7 4.3� 105 0.002Mutation G to T at position 1 32 000 7� 2 4.1 5.6� 105 0.0023Mutation C to T at position 19 9200 19� 2 7 3� 105 0.0021Mutation T to A at position 17 140 450� 30 ND ND ND
Ka and Kd are association and dissociation rate constants, respectively, fitted from the SPR data using a 1:1 binding model; ND – not determined.
Nucleic Acids Research, 2007, Vol. 35, No. 22 7631
Downloaded from https://academic.oup.com/nar/article-abstract/35/22/7626/2402600/Exploring-the-sequence-space-of-a-DNA-aptamerby Arizona State University West useron 07 September 2017
of clones after several rounds of selection (or sometimes inbetween the rounds). However, no information is usuallyobtained for the sequences, which do not survive theselection process. Thus, the effects of specific mutationson the affinity of the aptamer can be only indirectlyinferred from the consensus sequence distributions.Thus, in general, library selection methods provide onlylimited information about the degree of affinity over thetopology of local sequence space.We have approached the study of aptamer sequence
space using a different method. Instead of performinga mutagenesis and selection study as described previously(27), we have evaluated the properties of a well-characterized IgE-binding DNA aptamer by utilizingcustom DNA microarray technology. As mentionedabove, several companies currently offer synthesis ofcustom microarrays containing 60-mer (Agilent) or even80-mer (Nimblegen) DNA sequences in a microarrayformat. This length is sufficient for studying most ofthe known DNA aptamers. Current DNA microarrayproduction technology allows in situ synthesis of up tohundreds of thousands of sequences on the microarraysurface (a number which is projected to expand to severalmillion in the near future), resulting in a considerablecapability to study sequence variations. By specificallydefining the sequence at each feature of the microarray itis possible to systematically study the topology of localaptamer sequence space with respect to binding of thetarget protein. This approach provides more detailedinformation about the relative affinity of sequences thatdo not bind the target or bind it at with intermediateaffinity. This information is normally largely inaccessiblefrom the results of clone sequencing and consensussequence analysis, as only the best binding sequences areanalyzed after selection.
The relationship between array fluorescence valuesand affinities
For microarray data to be useful in the analysis of bindingas a function of sequence space, fluorescence signalsobtained from microarray experiments must correlate tothe relative affinity of sequences. It is clear from Figure 4that measurements in the 100 nM range of the targetprotein are still within the linear range of the bindingcurve and thus should be representative of relative bindingaffinity under the conditions of the measurement.However, the solution phase dissociation constant forthe interaction between IgE and this aptamer is �10 nM asdetermined by a filter binding assay (16). In contrast, inFigure 4, the apparent KD for the aptamer on the surfaceis on the order of several hundred nanomolar (it isdifficult to estimate accurately as saturation has not beenreached even at 500 nM protein concentration). Previouslypublished results using aptamer microarrays preparedusing synthesized aptamers have generally shown bindingat protein concentrations more consistent with solutionphase dissociation constants (9,11,12). The large apparentKd for IgE binding to its aptamer on the surface couldarise from one of several factors. First, the surface itselfcan affect aptamer function. It is quite possible that there
are interactions between the aptamer and the surface ofthe slide in the case of the arrays being used here thateffectively compete with the IgE interaction (the stronginfluence of linker length on aptamer affinity in Figure 2suggests this). Second, the binding protocol was optimizedfor the best signal to background ratios on these particulararrays. This involved both specific incubation times,temperatures and buffer conditions as well as the presenceof blocking agents to decrease non-specific binding. Theseconditions may favor specificity of binding, but changethe binding kinetics or dissociation constant significantly.Past studies of aptamer binding to IgE (9,12) have beenperformed by incubating the arrays with the target proteinat room temperature instead of at 37C as has been donehere. Solution affinities determined for the IgE-bindingaptamer using fluorescence anisotropy resulted in KD
values that increased significantly with temperature (23).This effect could also be exaggerated when binding occursat the surface, depending on the nature of the surfaceinteractions. Finally, the dye labeling of the IgE, parti-cularly with multiple labels per protein at random amines,could change the binding characteristics of the proteinas well as increase non-specific binding, as has beendemonstrated previously (10).
In order to empirically determine if the fluorescencesignals from the microarray measurements correspondedto relative affinities, more traditional methods of evaluat-ing affinity were applied to the original aptamer sequenceand several of the variants identified on the microarrays(Table 1). Even though the apparent dissociation constantfor the original IgE-binding aptamer on the surface isconsiderably larger than that previously seen in solution,the relative changes in fluorescence intensities obtained fordifferent sequences correlate very well with the dissocia-tion constants obtained for several different aptamervariants (Table 1 and Supplementary Data) using eitheranisotropy measurements or SPR analysis. Thus, as aqualitative measure of binding affinity, the fluorescencevalues determined in the array are apparently valid.
Overall structural requirements
The IgE-binding aptamer has been previously selectedfrom a DNA library containing a sequence of 40 randomnucleotides using standard SELEX methods (16). After15 rounds of selection and the sequencing of 87 clones,it was shown that a highly conserved 21 nt long sequencewas responsible for high-affinity binding. It was proposedthat this conserved sequence could be folded into a stem-loop secondary structure having an unstable 4 bp stem anda 12 base loop. Extension of the unstable stem by flankingcomplementary sequences was then shown to stabilizethe aptamer structure and improve binding affinity. At thesame time, variations in the sequences obtained from theclone sequencing analysis suggested that the sequence ofthe stem was not critical for binding. Consensus sequenceanalysis also indicated that only a few positions in theaptamer sequence can be varied (in most cases either C orT were present in the clone sequences at the positions 11,18, 19, 23 and 24 using the sequence numbering of theD17.4 aptamer) (16).
7632 Nucleic Acids Research, 2007, Vol. 35, No. 22
Downloaded from https://academic.oup.com/nar/article-abstract/35/22/7626/2402600/Exploring-the-sequence-space-of-a-DNA-aptamerby Arizona State University West useron 07 September 2017

Overall, the results presented here complement theresults from the original selection paper. Analysis ofthe single-site mutants shows that the specific sequenceof the aptamer is critical in determining the aptamer’sability to bind to IgE. Mutations in the positionsmentioned above: 11, 18, 19, 23 and 24, are possiblewhile maintaining significant affinity to the target protein.In addition to that, position 22 can also be mutatedfrom C to T without detrimental effects. No other singlemutations are possible without significant decreases inaffinity. Through systematic analysis of the effects ofparticular mutations on binding, additional conclusionscan be drawn that would not be possible to obtain fromlibrary selections without sequencing and analyzing alarge number of potential aptamers. For example, consen-sus sequence analysis in previous work showed that it ispossible for either C or T to be present in position 11 andretain binding capability. The results of the current studyshow that G can also be substituted in this position withnearly the same resulting affinity. Thus, one useful aspectof array analysis is that it can provide a complete pictureof all possible equivalent aptamers in local sequence space.
The stem region
Previous studies have suggested that the stem region is notcritical for binding (16). Our microarray analysis of theIgE aptamer stem region indicates that some modifica-tions may actually enhance binding (a conclusion that issupported by more traditional affinity measurements forposition 1, Table 1). Single-mutation analysis shows thathaving a mutation in the first two base pairs of the 50 endof the stem results in an increase in the detectedfluorescence signal, implying better binding. This resultsuggests that having a less energetically stable stem isbeneficial for the aptamer function. A similar conclusion isalso implied by the results of stem mutagenesis when basepairing in the stem region is conserved. Results presentedin Figure 5 show that having a less stable A–T or T–Abase pair at the beginning of the stem results in theimprovement of detected signal. Based on the consensussequence obtained from the selection results, it wassuggested that the base pair composition in the stemregion is important only as a stabilizing structural factor(16). However, the results presented here show that theparticular base pair composition of the stem region isimportant for obtaining the best binding signal. Forexample, having a stem with all GC or all CG base pairsresults in a several-fold decrease in the detected signal, i.e.apparent aptamer affinity. As shown in Figure 5, changesin the base pairs 5 through 8 (which would correspondto the initial stem region just below the loop in theconsensus sequence and proposed secondary structure)have quite significant effects on the observed bindingsignal. Both decreased and increased signals wereobtained, implying that optimization of the aptamersequence in the stem region is possible. Finally, even thesymmetry appears to be important; an aptamer sequencecontaining the reversed stem, wherein the sequences thatcomprise the 50 and 30 stem regions have been exchanged,appear to give rise to a somewhat higher signal than the
original sequence. All these results emphasize that thedetailed structure of the stem region plays an importantrole in binding of the target protein.
Information content of aptamer sequence
Previously, the information content of nucleic acidprotein-binding sites has been quantified utilizing theShannon uncertainty measure, which is calculated bydetermining the probability of finding a specific nucleotideat a particular position (28,29): H ¼ �
PPi log2 Pi, where
H is the uncertainty of the particular position, Pi is theprobability of finding a specific nucleotide at that positionand i represents the four nucleotides (i=A,T,C,G). Theprobability Pi can be estimated from the frequency ofoccurrence of the particular nucleotide (i) at a positionupon analysis of a number of sequences. Using thisapproach, the information content of RNA aptamersequences selected to bind GTP has been calculated (27).In that work, an extensive mutagenesis and selection studywas performed to evaluate the effects of mutations in eachsequence position as well as to quantify the informationcontent of different aptamers with distinct sequences (alsosecondary structures) and different affinities for the targetmolecule. It was concluded that a 10-fold increase inaptamer affinity requires the addition of �10 additionalbits of information, which corresponds to specifyingthe identity of five additional nucleotide positions. Thischange in information content also results in abouta thousand-fold decrease in abundance of functionalsequences within a random set of sequences (27).The results presented here do not directly provide an
estimate of the frequency of a specific nucleotide at aparticular position in the aptamer sequence. However,the microarray results for the aptamer sequence variantscan be used to estimate the probability of finding a specificnucleotide in the aptamer sequence. For example, Figure 3shows that aptamer sequences with either C or T at theposition 22 show about the same fluorescence intensitysignals representing about the same affinity, thus, one canconclude that the probabilities of finding these twonucleotides at that position are about 50% in a functionalaptamer, while the probabilities of finding either A or Gat this position are essentially zero (the actual probabilitiesfor each nucleotide can be more accurately estimatedbased on the observed binding signals). From this followsthat the information content at this position is about 1 bit.Using this approach, the information content for eachposition in the loop region of the aptamer sequence wascalculated (Figure 7). The information content in the stemregion could not be unequivocally evaluated because allpossible stem mutations were not tested, making it difficultto assess the importance (and complete informationcontent) of the stem region.Total information content of the aptamer sequence can
be used to evaluate the probability of finding a functionalaptamer sequence in random space. The total informationcontent in the loop region of the IgE-binding aptameris �29 bits. Thus, the probability of finding a functionalaptamer sequence is 2�29
� 2� 10�9. Taking into accountthe fact that stem region of the aptamer sequence
Nucleic Acids Research, 2007, Vol. 35, No. 22 7633
Downloaded from https://academic.oup.com/nar/article-abstract/35/22/7626/2402600/Exploring-the-sequence-space-of-a-DNA-aptamerby Arizona State University West useron 07 September 2017

probably adds several bits to the total, it is expected thatthe actual probability is on the order of 10�10.
Topology of functional sequence space
The microarray results presented here also provide auseful picture of the local topology of functional sequencespace for the IgE-binding aptamer. One of the strikingaspects of Figures 3 and 6 is that very few positions in thesequence can be mutated while maintaining bindingaffinity similar to the original sequence. Most changes,even of single bases, result in a drop in fluorescence signalessentially to baseline level. The absence of high-affinitycompensatory variants in the double and triple mutantstudies suggests that the functional sequence space ofthis aptamer is very constrained. In other words, the localsequence space encompassing the functional aptamersequences looks more like a rugged landscape containingsharp peaks (Figure 6) rather then a gradually changingsurface. This implies that rational optimization of theaptamer functionality through step-wise mutagenesisis essentially impossible. Further studies of otheraptamer sequences are required to see how general thisobservation is.This study of DNA aptamer sequence space shows
yet another application for DNA microarrays. We havedemonstrated that microarrays can be effectively used tostudy a wider range of DNA-protein binding interactions,not limited to proteins which bind to double-strandedDNA as previously demonstrated by protein binding todouble-stranded DNA microarrays. It can be anticipatedthat this methodology will become a useful tool for futureinvestigations of the structure/function properties ofaptamers. It can also be expected that in the future micro-array technologies can be extended to novel chemistries(expansion in the choice of modified or non-natural
nucleotides, different coupling chemistries, etc.) whichmight provide new information about the protein–DNAinteractions and which should prove useful for post-selection modifications and optimizations of aptamersto improve their stability or selectivity under specificconditions.
SUPPLEMENTARY DATA
Supplementary Data are available at NAR Online.
ACKNOWLEDGEMENTS
This work was funded by Arizona University SystemTechnology and Research Initiative Fund and theBiodesign Institute at Arizona State University. Wewould like to thank Dr Scott Bingham and Dr JefferyHock for their help with the Agilent microarray scanner.Funding to pay the Open Access publication charges forthis article was provided by Arizona University SystemTechnology and Research Initiative fund.
Conflict of interest statement. None declared.
REFERENCES
1. Tuerk,C. and Gold,L. (1990) Systematic evolution of ligands byexponential enrichment: RNA ligands to bacteriophage T4 DNApolymerase. Science, 249, 505–510.
2. Ellington,A.D. and Szostak,J.W. (1990) In vitro selection of RNAmolecules that bind specific ligands. Nature, 346, 818–822.
3. Gold,L., Polisky,B., Uhlenbeck,O. and Yarus,M. (1995) Diversityof oligonucleotide functions. Annu. Rev. Biochem., 64, 763–797.
4. Hamula,C.L.A., Guthrie,J.W., Zhang,H., Li,X. and Le,X.C. (2006)Selection and analytical applications of aptamers. Trends Anal.Chem., 25, 681–691.
5. Bunka,D.H. and Stockley,P.G. (2006) Aptamers come of age – atlast. Nat. Rev. Microbiol., 4, 588–596.
6. Tombelli,S., Minunni,M. and Mascini,M. (2005) Analytical appli-cations of aptamers. Biosens. Bioelectron., 20, 2424–2434.
7. Bock,C., Coleman,M., Collins,B., Davis,J., Foulds,G., Gold,L.,Greef,C., Heil,J., Heilig,J.S. et al. (2004) Photoaptamer arraysapplied to multiplexed proteomic analysis. Proteomics, 4, 609–618.
8. McCauley,T.G., Hamaguchi,N. and Stanton,M. (2003) Aptamer-based biosensor arrays for detection and quantification of biologicalmacromolecules. Anal. Biochem., 319, 244–250.
9. Stadtherr,K., Wolf,H. and Lindner,P. (2005) An aptamer-basedprotein biochip. Anal. Chem., 77, 3437–3443.
10. Collett,J.R., Cho,E.J., Lee,J.F., Levy,M., Hood,A.J., Wan,C. andEllington,A.D. (2005) Functional RNA microarrays forhigh-throughput screening of antiprotein aptamers. Anal. Biochem.,338, 113–123.
11. Collett,J.R., Cho,E.J. and Ellington,A.D. (2005) Production andprocessing of aptamer microarrays. Methods, 37, 4–15.
12. Cho,E.J., Collett,J.R., Szafranska,A.E. and Ellington,A.D. (2006)Optimization of aptamer microarray technology for multipleprotein targets. Analytica. Chimica. Acta, 564, 82–90.
13. Li,Y., Lee,H.J. and Corn,R.M. (2006) Fabrication andcharacterization of RNA aptamer microarrays for the study ofprotein–aptamer interactions with SPR imaging. Nucleic Acids Res.,34, 6416–6424.
14. Li,Y., Lee,H.J. and Corn,R.M. (2007) Detection of proteinbiomarkers using RNA aptamer microarrays and enzymaticallyamplified surface plasmon resonance imaging. Anal. Chem., 79,1082–1088.
15. Xu,D., Xu,D., Yu,X., Liu,Z., He,W. and Ma,Z. (2005) Label-freeelectrochemical detection for aptamer-based array electrodes.Anal. Chem., 77, 5107–5113.
Figure 7. Information content of loop positions in the IgE-bindingaptamer. The amount of information is represented as bits per base,positions are color-coded based on the simplified color scheme shownin the figure legend.
7634 Nucleic Acids Research, 2007, Vol. 35, No. 22
Downloaded from https://academic.oup.com/nar/article-abstract/35/22/7626/2402600/Exploring-the-sequence-space-of-a-DNA-aptamerby Arizona State University West useron 07 September 2017

16. Wiegand,T.W., Williams,P.B., Dreskin,S.C., Jouvin,M.H.,Kinet,J.P. and Tasset,D. (1996) High-affinity oligonucleotide ligandsto human IgE inhibit binding to Fc epsilon receptor I. J. Immunol.,157, 221–230.
17. Bulyk,M.L., Huang,X., Choo,Y. and Church,G.M. (2001)Exploring the DNA-binding specificities of zinc fingers with DNAmicroarrays. Proc. Natl Acad. Sci. USA, 98, 7158–7163.
18. Berger,M.F., Philippakis,A.A., Qureshi,A.M., He,F.S.,Estep,P.W., III and Bulyk,M.L. (2006) Compact, universal DNAmicroarrays to comprehensively determine transcription-factorbinding site specificities. Nat. Biotechnol., 24, 1429–1435.
19. Berger,M.F. and Bulyk,M.L. (2006) Protein binding microarrays(PBMs) for rapid, high-throughput characterization of the sequencespecificities of DNA binding proteins. Methods Mol. Biol., 338,245–260.
20. Bulyk,M.L. (2006) DNA microarray technologies for measuringprotein–DNA interactions. Curr. Opin. Biotechnol., 17, 422–430.
21. Bartel,D.P., Zapp,M.L., Green,M.R. and Szostak,J.W. (1991)HIV-1 Rev regulation involves recognition of non-Watson-Crickbase pairs in viral RNA. Cell, 67, 529–536.
22. Conrad,R.C., Baskerville,S. and Ellington,A.D. (1995) In vitroselection methodologies to probe RNA function and structure.Mol. Divers, 1, 69–78.
23. Gokulrangan,G., Unruh,J.R., Holub,D.F., Ingram,B.,Johnson,C.K. and Wilson,G.S. (2005) DNA aptamer-based
bioanalysis of IgE by fluorescence anisotropy. Anal. Chem., 77,1963–1970.
24. Jensen,K.B., Green,L., MacDougal-Waugh,S. and Tuerk,C. (1994)Characterization of an in vitro-selected RNA ligand to the HIV-1Rev protein. J. Mol. Biol., 235, 237–247.
25. Green,L., Waugh,S., Binkley,J.P., Hostomska,Z., Hostomsky,Z.and Tuerk,C. (1995) Comprehensive chemical modificationinterference and nucleotide substitution analysis of an RNApseudoknot inhibitor to HIV-1 reverse transcriptase. J. Mol. Biol.,247, 60–68.
26. Burgstaller,P., Kochoyan,M. and Famulok,M. (1995) Structuralprobing and damage selection of citrulline- and arginine-specificRNA aptamers identify base positions required for binding.Nucleic Acids Res., 23, 4769–4776.
27. Carothers,J.M., Oestreich,S.C., Davis,J.H. and Szostak,J.W. (2004)Informational complexity and functional activity of RNA struc-tures. J. Am. Chem. Soc., 126, 5130–5137.
28. Schneider,T.D., Stormo,G.D., Gold,L. and Ehrenfeucht,A. (1986)Information content of binding sites on nucleotide sequences.J. Mol. Biol., 188, 415–431.
29. Stormo,G.D. (1988) Computer methods for analyzing sequencerecognition of nucleic acids. Annu. Rev. Biophys. Biophys. Chem.,17, 241–263.
30. Zuker,M. (2003) Mfold web server for nucleic acid folding andhybridization prediction. Nucleic Acids Res., 31, 3406–3415.
Nucleic Acids Research, 2007, Vol. 35, No. 22 7635
Downloaded from https://academic.oup.com/nar/article-abstract/35/22/7626/2402600/Exploring-the-sequence-space-of-a-DNA-aptamerby Arizona State University West useron 07 September 2017