mapping the binding position of an aptamer on z05 dna ... the binding position of an aptamer ......
TRANSCRIPT
Mapping the binding position of an aptamer on Z05 DNA
Polymerase to better understand the complexʼs stability and compatibility with Hot Start PCR
A Major Qualifying Project Report
Submitted to the Faculty of the
WORCESTER POLYTECHNIC INSTITUTE
In partial fulfillment of the requirements for the
Degree of Bachelor of Science
in
Biology/Biotechnology
by
_________________________________
Danielle Wisheart
October 14,2013
_________________________________
Dr. Destin Heilman, Advisor
Department of Chemistry and Biochemistry, WPI
2
Abstract
An aptamer is an oligonucleotide that specifically and reversibly binds an enzyme,
influencing its activity. DNA polymerase enzyme synthesizes DNA. The benefits of
adding aptamer to DNA polymerase include: Hot Start PCR compatibility, polymerase
stability when in complex with aptamer, and protection against harmful environmental
conditions. However, the underlying mechanisms that account for these properties are not
well understood. Through the development of a proteinase K challenge experiment, this
project determined the location of aptamer binding on DNA polymerase and its
functional implications.

3
Acknowledgements I value the fact that my project allowed for a unique opportunity to take part in a
dual internship/MQP experience. It was an enriching experience that allowed for both the
opportunity to conduct long-‐term, independent research as well as a chance to be exposed
to work in an FDA regulated environment.
First and foremost, I would like to thank my MQP advisor from WPI, Destin Heilman,
for his guidance throughout the whole Major Qualifying Project process. His insight,
recommendations, and feedback were instrumental to the success of this project.
I would also like to express gratitude to my Roche Molecular Systems sponsor and
liason, Ganapathy Muthukumer. His guidance during my internship and continued
investment in the project once I was back at WPI was crucial to the project’s success.
I would also like to recognize the staff within the BioProcessing division at Roche
Molecular Systems including Dorthe Hoeg, Weiya Dan, Steven Johnson, Dalia Ibrahim, Farid
Eid, Michael Masullo and the rest of the BioProcessing team for their support on my
project. I truly felt as though I was part of the team and their training, document reviews,
and support with data collection was greatly appreciated.
I would also like to express my utmost appreciation to Department Heads Arne
Gericke and Joseph Duffy for working behind the scenes to establish this partnership
between Roche Molecular Systems and Worcester Polytechnic Institute. I am very grateful
for their endorsement as a strong candidate to take part in this unique opportunity.
Finally I would like to thank all of the MQP students and volunteers in Professor
Heilman’s project lab. Their feedback and suggestions motivated me to improve my project
to reach a high-‐quality end result.
4
Table of Contents
Abstract .................................................................................................................................................... 2 Acknowledgements .............................................................................................................................. 3 Introduction ............................................................................................................................................ 5 Materials and Methods ..................................................................................................................... 13 Accelerated Enzyme Stability Study ...................................................................................................... 13 Optimizing Conditions for Proteinase K Challenge Experiment .................................................. 13 Mass-‐Spectrometry and Mapping the Aptamer to Taq Polymerase Crystal Structure ......... 17 Determining the mg/mL Concentration of Z05 Polymerase ......................................................... 17 Determining mg/mL Concentration of Aptamer Sample ................................................................ 18
Results ................................................................................................................................................... 19 Discussion ............................................................................................................................................. 24 Figures ................................................................................................................................................... 30 References ............................................................................................................................................ 35
5
Introduction
The Polymerase Chain Reaction (PCR), which was invented by Kary B. Mullis in
1985, is a powerful technology where in a single copy of DNA can be amplified into millions
of identical copies. This amplification process is cyclical and with every new cycle, the
concentration of DNA doubles. The PCR technique works though the repetition of a three-‐
stage cycle4. First the reaction mix which includes a thermostable polymerase, DNA
template, a pair of primers, and a complete set of deoxynucleotide triphosphates, is heated
up to 90°C-‐98°C in order to separate the two strands of the DNA template. In the second
stage the temperature is dropped to 40°C-‐60°C in order to anneal the two complementary
primers to the ends of the separated strands of target DNA. In the final stage of the cycle,
the temperature is raised to approximately 72°C to allow the thermostable polymerase to
use the target strand and primers to synthesize new strand complements to the previously
separated template strands.
In early PCR experiments DNA fragments were amplified with the Klenow fragment
of DNA polymerase I8. Unfortunately the Klenow enzyme was not stable at high
temperatures and as a result became inactive during the first step of the PCR cycle, where
temperature is raised to separate template strand of the target fragment. This meant that
scientist had to introduce more Klenow into the reaction after every cycle’s denaturation
step in order to provide freshly active DNA polymerase required for DNA extension.
Another consequence of the non-‐thermostable Klenow DNA polymerase was that the
extension step of the PCR process had to be performed at much lower temperatures, which
increased the chance of amplification of nonspecific targets because primers could easily
bind to non-‐target regions of the DNA and amplify at low temperatures9. These early PCR
6
experiments were also extremely expensive and susceptible to outside contamination
because the reaction tube had to be opened repeatedly to add more enzymes. In addition,
early PCR experiments were performed manually so the scientist had to be present at every
step of the three-‐stage PCR cycle. This meant that the scientist could only handle a few
samples at a time because thermocyclers had not been invented yet to automate the whole
PCR process.
The flexibility and accuracy of PCR improved with Perkin-‐Elmer’s development of a
revolutionary thermo block cycler that automatically and repeatedly raised and lowered
the temperature of the samples during the PCR cycles9. Also when scientists discovered a
thermostable DNA polymerase, Taq DNA polymerase, which could remain both active and
stable at the elevated temperature required for the PCR extension step, the potential of the
PCR technique increased exponentially9. Now scientist no longer needed to interrupt the
PCR process to add more enzymes and run the risk of contaminating their PCR samples.
The true advantage of these thermostable polymerases, like Taq polymerase, are
not just that the enzymes can withstand high temperatures, but rather when added to PCR
reactions the extension step can occur at much higher temperatures resulting in higher
primer annealing specificity. There are many types of thermostable polymerases. The first
was discovered in 1960’s by a biologist, Dr. Thomas Brock, when he was investigating
bacteria in Yellowstone National Park’s hot springs where he discovered a type of bacteria
that was thriving in water at extremely high temperatures. This newly discovered archaea
bacterium was named Thermus aquaticus. This extremophile produced an enzyme known
as Taq polymerase, which could survive the elevated temperatures required for PCR. Taq
polymerase is homologous to Eschericia coli polymerase I where in it has a domain at its
7
amino acid terminus that has 5’ nuclease activity and a domain at its carboxyl end that
catalyzes the polymerase reaction13. The structure of the polymerase domain of Taq
polymerase and the Klenow fragment of polymerase I are practically identical. However,
unlike polymerase I, Taq polymerase has lost its editing 3’—5’ exonuclease activity because
of the absence of catalytically critical carboxylate residues that bind two metal ions in the
3’—5’ exonuclease domain13. Another type of thermostable polymerase is known as Z05
DNA polymerase and is derived from the bacterium Thermus species Z05. Similar to Taq
polymerase, Z05 DNA polymerase has lost its 3’—5’ exonuclease activity. Z05 polymerase
has DNA polymerase activity, reverse trancriptase activity and optional 5’—3’ exonuclease
activity1.
Despite there being many types of thermostable polymerases, many have
similarities in both overall structure and catalytic mechanisms at the polymerase active
site. There are at least five different families of DNA polymerases all of which share a
general structure that can be compared to that of the right hand, which consists of
“thumb”, “palm”, and “finger” domains12. Figure 1 displays the three-‐dimensional structure
of Taq polymerase with these three distinct domains labeled. The palm domain plays a role
in the catalysis of the phosphoryl transfer reaction required to build the DNA backbone
while the finger domains play and important role in the incorporation of new base pairs to
the template strand12. In contrast, the thumb plays a role in the position of the double
stranded DNA within the polymerase binding active site, the rate at which new nucleotides
are added to the template strand, and the translocation of the DNA from the active site12.
In addition to similarities in overall structure, many DNA polymerases have
conserved active site biochemistries. Within the active site of many DNA polymerases there
8
are at least two conserved aspartic acid catalytic residues. Replication of new DNA occurs
through the attachment of nucleotides to the new strand that match the template strand.
Polymerases attach incoming dioxynucleotide triphosphates to the growing strand with the
help of metal ions. The active site features two metal ions, usually Mg 2+, that plays a crucial
role in the mechanism that catalyzes DNA synthesis. One Mg 2+ ion prepares the end of the
new DNA strand to bind with the phosphate of the incoming deoxynucleotide
triphosphates. The second Mg2+ stabilizes the negative charge that builds up as the DNTP
enters the active site to add a nucleotide to the new strand10. Figure 2 shows a schematic
diagram of the two metal ion stabilization as an incoming dNTP is added to the growing
DNA strand.
Although several advancements have been made with PCR technology, including
incorporation of thermostable polymerases and advancements in thermocycler devices,
one of the biggest challenges with PCR is the potential for polymerases to amplify
nonspecific products. The complexity of template especially when there may only be trace
amounts of the target sequence available for PCR makes it even more challenging to obtain
high levels of specificity, sensitivity, and reproducibility5. At higher temperatures primers
are much more sensitive and have a higher propensity of annealing with the specific target
sequence14. Hot Start PCR is a technique that reduces non-‐specific amplification and offers
the convenience of reaction set up at room temperature. The polymerases used in Hot Start
PCR are unreactive at ambient temperatures. These polymerases only become active at
elevated temperatures, which allow primers the time to properly match up with the target
sequences and further minimizes non-‐target primer annealing and extension.
9
In Hot Start PCR polymerase activity can be inhibited at ambient temperatures
through different mechanisms including chemical modification and aptamer technology.
For chemical modification techniques, the DNA polymerase is permanently and chemically
modified to only be active at higher temperatures. Unlike chemical modifications, the use
of aptamer in Hot Start PCR is a reversible process and does not change the chemical make
up of the polymerase. These properties make aptamer technology an attractive alternative
to previous Hot Start methods. At low temperatures, the aptamer binds DNA polymerase,
blocking its polymerase activity. However, when temperatures are raised during the
beginning of the PCR cycle, the aptamer dissociates from the polymerase allowing it to
amplify target sequences in the reaction. This process repeats with each new cycle of the
PCR reaction.
As previously mentioned aptamers can be used as reversible physical inhibitors of
DNA polymerase in Hot Start PCR technology. However, there are many other applications
for aptamers that the scientific community has uncovered. An aptamer is a small
oligonucleotide such as RNA or single stranded DNA that can bind to specific targets with
high affinity2. Aptamers are an emerging class of molecules that are beginning to rival
antibodies in both therapeutic and diagnostic applications because they tend to bind
targets molecules with higher affinity and are more robust7. Aptamers have been utilized in
many diagnostic assay formats. In two-‐site binding assays, where an analyte is sandwiched
between a capturing ligand and a detection ligand, multiple studies have shown that
specific aptamers can serve as the capturing ligand or the detecting ligand7. Aptamer can
also be used in other diagnostic assays like affinity chromatography and capillary gel
10
electrophoresis in order to separate specific target components from a biochemical
mixture.
In addition to the utilization of aptamers in various diagnostic assays, attempts have
been made to search for aptamers that specifically target biomarkers for various diseases
like cancer or viral infections. In 2004, the FDA approved a drug developed by Pfizer and
EyeTech called Macugen. This drug is a VEGF-‐specific aptamer that treats age-‐related
macular degeneration, which causes vision loss in the center of the visual field due to retina
damage2. Aptamers can also be used as a drug delivery system. In 2011, a group of
scientists published a paper that described a dual-‐aptamer delivery vehicle where one half
of the complex shuttled the anti-‐cancer drug, doxorubicin to prostate cancer cells as the
second aptamer component of the complex recognized cell surface receptors unique to
prostate cancer3.
Roche Molecular Systems has also been exploring new applications for aptamers. In
a recent study conducted this summer, an accelerated enzyme stability study was
performed to see how the NTQ21-‐46A aptamer affected the stability of Z05 DNA
polymerase stored at various temperatures outside the recommended storage of 2°C-‐8°C.
The trendlines generated from this experiment revealed that for all storage temperatures
tested, the activity of enzymes formulated with aptamer decreased at a slower rate
compared to the formulation that contained only DNA polymerase. Also the DNA
polymerase activity rate of decay correlated to how far the storage temperature deviated
from the recommended storage of 2°C-‐8°C; the farther outside of the recommended
storage temperature for the enzyme the faster the decay of enzyme activity.

11
As a direct consequence of using aptamer in many of the company’s DNA
polymerase formulations, including the Z05 polymerase formulation, Roche Molecular
Systems has noticed that the aptamer provides compatibility with Hot Start PCR, stability
when in complex with DNA polymerase, and better protection for the DNA polymerase
from various harmful environmental conditions. However, the underlying mechanisms that
lead to these observed properties were not well understood. As a result, Roche Molecular
Systems is interested in learning more about the underlying mechanisms for this
protection. Specifically the company would like to know where the aptamer binds on the
DNA polymerase as well as the structure-‐function implications associated with this
binding.
The overall goal of this MQP project was to map the location of the NTQ21-‐46A
aptamer to a particular area on the Z05 polymerase as well as better understand the
implications for this binding. In preliminary experiments done by Roche Molecular
Systems, it was noticed that by adding aptamer to their enzyme formulations, the aptamer
provided protection from proteinase degradation. However, the mechanism by which this
aptamer protected the polymerase was not well understood. This MQP project will attempt
to replicate Roche’s preliminary experiments through the design of a proteinase K
challenge experiment to first demonstrate that Z05 polymerase formulated with aptamer
provides protection against proteinase K degradation. Then these same challenge
experiments will be used to dive deeper to map the location of the aptamer on the DNA
polymerase. By carrying out these experiments, a better understanding of the structural
and functional relationship of the binding of the aptamer to a particular site on the DNA
polymerase will be achieved. A better understanding of how aptamer interacts with the
12
DNA polymerase may pave the way for furture research into how these interactions can be
manipulated for specific purposes in order to improve current technology. This
information may also benefit in the future to help engineer better aptamers from the
ground up based on our better understanding of how molecules interact with one another.
The experiments described here attempt to uncover through protein mapping
where the NTQ21-‐46A aptamer binds and interacts with the DNA polymerase. For these
experiments a solution of Z05 polymerase and aptamer as well as a separate solution of
only the polymerase were digested with proteinase K. The resulting digests were run on
SDS-‐PAGE gels followed by Coomassie R-‐250 staining in order to compare protein fraction
patterns between the DNA polymerase-‐aptamer complex and the DNA polymerase alone.
The fragments that appeared in the polymerase only conditions but disappeared in the
DNA polymeraseplus aptamer conditions were then extracted and sequenced by mass-‐
spectrometry. The enrichment of peptide fragments to the same area on the known
structure of a DNA polymerase similar to Z05 polymerase signified the likely region in
which aptamer bound. The region identified was within the active site of the polymerase-‐
binding domain of the polymerase.
13
Materials and Methods
Accelerated Enzyme Stability Study In order to demonstrate that the NTQ21-‐46A aptamer can stabilize DNA polymerase
activity, an accelerated enzyme stability experiment was performed. Aliquots of Z05
polymerase formulated with and without aptamer were placed in four different storage
temperatures: 5°C, 25°C, 37°C, and 45°C. Samples within these storage environments were
tested each week for a total of eight weeks to track the changes in polymerase activity. A
polymerase activity assay developed by Roche Molecular Systems was used to measure the
ZO5 polymerase activity. This assay measured the rate of incorporation of radioactively
labeled dNTPs into DNA strands synthesized by the polymerase. A scintillation counter was
used to measure the radioactivity in the samples and quantify polymerase activity.
Optimizing Conditions for Proteinase K Challenge Experiment An important part of running a limited proteinase K challenge experiment was to
optimize conditions to get reproducible band fragment patterns on the SDS-‐PAGE gels. In
order to achieve reproducibility, several conditions were optimized. One of which was the
amount of DNA polymerase loaded on the gels with each trial. In order to determine the
appropriate amount, a 2-‐fold dilution series for the DNA polymerase was carried out, SDS
loading buffer was then added to each dilution in a 1:1 ratio, and the samples were run on
the gel at 50 milliamps for 1 hour and 20 minutes. Coomassie staining revealed that the
bands were too light for all the DNA polymerase dilutions. A rerun of the gel with a
preparation of 15 µL of the stock DNA polymerase and 15 µL of SDS loading buffer was
added to a well at a final loading volume of 25 µL. This preparation revealed an intense
14
band when stained and was used for all trials moving forward. It was later determined
through a Bradford assay that the concentration of stock Z05 polymerase was 0.2250
mg/ml or 2.25x10-‐4 µg/µL, thus 15 µL of stock polymerase would equal 3.38x10-‐3 µg of
polymerase.
The next step in the optimization for these limited proteinase K challenge
experiments was to determine the appropriate concentration of proteinase K and time
course to expose the DNA polymerase to this proteinase K in order to get limited
degradation. To determine the appropriate time course and concentration two SDS-‐PAGE
gels were run in parallel. One in which the time course of proteinase K exposure stayed the
same (5 minutes) while the concentrations in each successive well varied by 3-‐fold starting
from a stock proteinase K concentration of 2.0x10-‐3 µg/µL. Stock proteinase K was diluted
in a 3-‐fold series with a developed proteinase K buffer which included 50mM tris-‐HCL at
pH 8 and 1mM CaCl2. On the second gel, the time course of proteinase K activation and
exposure varied (30 seconds, 1 minute, 3 minutes, 5 minutes, 10 minutes, 20 minutes, and
30 minutes) while the concentration of proteinase K added remained the same in each well
(5x10-‐3 µg/µl). In each case DNA polymerase and the appropriate concentration of
proteinase K were mixed together in a 1:1 ratio (15 µL of polymerase: 15 µL of proteinase
K dilution) and then activated by putting the mixtures into a 50°C water bath. When
proteinase K needed to be inactivated, samples were moved from the 50°C water bath to a
heat block set at approximately 90-‐95°C where all samples received 30 µL of SDS loading
buffer and boiled for 5 minutes. Afterwards the time course dependent reaction samples
and concentration dependent reaction samples were removed from the heat block and 25
15
µL of sample was loaded on the two gels. The gels were run at 35 milliamps for 1 hour and
35 minutes.
After the gels were run they were transferred to separate plastic containers for
coomassie staining, which involved a 20 minute incubation in a coomassie blue solution
followed by a one-‐hour incubation in a destaining solution. Coomassie staining revealed no
bands on the time course dependent gel and on the concentration dependent gel some
degradation for the middle dilutions of proteinase K (ie 1/81 and 1/243). This signified
that adjustments needed to be made to the testing conditions. Moving forward a 2-‐fold
expansion was performed starting from the 1/243 proteinase K dilution from the
previously tested concentration dependent gel. 15 µL of the appropriate proteinase K
dilutions (1/243, 1/486, 1/972, 1/1944, 1/3888, 1/7776, 1/15,552, 1/31104, and
1/62208) were added to 15 µL of DNA polymerase. The activation of proteinase K within
these samples was again carried out in a 50°C water bath but the time spent in the water
bath was cut down from 5 minuutes to 3 minutes. Inactivation of proteinase K in these
samples occurred again when moved from the 50°C water bath to a heat block set at
approximately 90-‐95°C where all samples received 30 µL of SDS loading buffer and boiled
for 5 minutes. After 5 minutes of boiling 25 µL of each sample was transferred to the wells
of the 10% SDS-‐Page gel. The gel was run as 35 milliamps for an hour and 35 minutes.
Coomassie staining after this gel was run revealed an optimal proteinase K
concentration range that created a gradient where band amounts reduce with each
successive proteinase K dilution until there were little to no bands in the most dilute
proteinase K wells. These conditions were retested for reproducibility and a similar pattern
was observed.
16
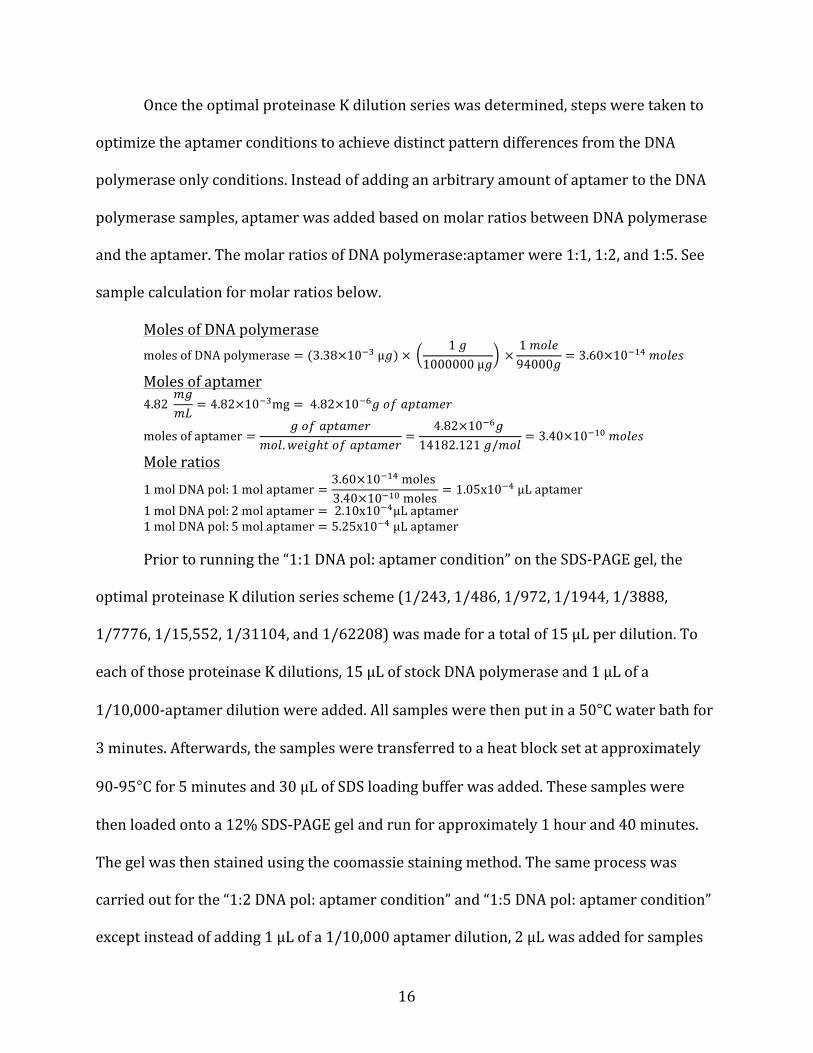
Once the optimal proteinase K dilution series was determined, steps were taken to
optimize the aptamer conditions to achieve distinct pattern differences from the DNA
polymerase only conditions. Instead of adding an arbitrary amount of aptamer to the DNA
polymerase samples, aptamer was added based on molar ratios between DNA polymerase
and the aptamer. The molar ratios of DNA polymerase:aptamer were 1:1, 1:2, and 1:5. See
sample calculation for molar ratios below.
Moles of DNA polymerase moles of DNA polymerase = (3.38×10!! µμ!) ×
1 !1000000 µμ!
×1 !"#$94000!
= 3.60×10!!" !"#$%
Moles of aptamer 4.82
!"!"
= 4.82×10!!mg = 4.82×10!!! !" !"#!$%&
moles of aptamer =! !" !"#!$%&
!"#.!"#$ℎ! !" !"#!$%&=
4.82×10!!! 14182.121 !/!"#
= 3.40×10!!" !"#$%
Mole ratios 1 mol DNA pol: 1 mol aptamer =
3.60×10!!" moles 3.40×10!!" moles
= 1.05x10!! µμL aptamer 1 mol DNA pol: 2 mol aptamer = 2.10x10!!µμL aptamer 1 mol DNA pol: 5 mol aptamer = 5.25x10!! µμL aptamer
Prior to running the “1:1 DNA pol: aptamer condition” on the SDS-‐PAGE gel, the
optimal proteinase K dilution series scheme (1/243, 1/486, 1/972, 1/1944, 1/3888,
1/7776, 1/15,552, 1/31104, and 1/62208) was made for a total of 15 µL per dilution. To
each of those proteinase K dilutions, 15 µL of stock DNA polymerase and 1 µL of a
1/10,000-‐aptamer dilution were added. All samples were then put in a 50°C water bath for
3 minutes. Afterwards, the samples were transferred to a heat block set at approximately
90-‐95°C for 5 minutes and 30 µL of SDS loading buffer was added. These samples were
then loaded onto a 12% SDS-‐PAGE gel and run for approximately 1 hour and 40 minutes.
The gel was then stained using the coomassie staining method. The same process was
carried out for the “1:2 DNA pol: aptamer condition” and “1:5 DNA pol: aptamer condition”
except instead of adding 1 µL of a 1/10,000 aptamer dilution, 2 µL was added for samples
17
run on the “1:2 DNA pol: aptamer”gel and 5 µL were added to samples run a separate “ 1:5
DNA pol: aptamer” gel.
To better visualize pattern changes between the no aptamer conditions and aptamer
conditions as molar concentration of aptamer increased, the conditions established in lanes
3 and 4 of the no aptamer gel, 1:1 gel, 1:2 gel, and 1:5 molar ratio of DNA polymerase to
aptamer gel were run simultaneously on one 16% gel followed by coomassie staining.
Bands that appeared in the no aptamer lanes or 1:1 DNA polymerase:aptamer lanes but
disappeared as the concentration of aptamer got higher were excised from the gel, placed
in an eppendorf tube, and stored at 4°C until they could be analyzed by mass-‐spectrometry.
Mass-‐Spectrometry and Mapping the Aptamer to Taq Polymerase Crystal Structure
The bands excised from the SDS-‐PAGE gel were analyzed by mass spectrometry
using University of Massachusetts Medical School services. The proteome software,
Scaffold 4, was used to analyze the peptide fragments that were detected and matched to
the known sequence of thermus thermophilus DNA Polymerase. Using 3-‐D protein coloring
software, Swiss Deepview, the enriched polymerase peptide sequences within the band
samples were highlighted on the known 3-‐D structure of Taq polymerase’s polymerase
binding domain.
Determining the mg/mL Concentration of Z05 Polymerase A Bradford assay was performed post facto to determine the concentration of the
Z05 DNA polymerase sample provided by Roche Molecular Systems. Using a multi-‐well
plate reader spectrophotometer, the standard curve for BSA was created. In order to create
the BSA standard curve a 2-‐fold dilution series of BSA was made directly in the well plate.
18
There were 8 dilutions in this 2-‐fold dilution series, each with a total volume of 10 µL.
Then 200uL of Bradford reagent was added to the dilutions and mix by pipetting up and
down. In addition to loading the BSA dilutions on to the 96-‐well plate, the unknown DNA
polymerase was added to the plate at varying volumes of 10 µL, 5 µL, 2.5 µL, and 1µL with
the appropriate amount of Bradford reagent that would bring the final volume up to 210 µL
in each individual well. The BSA dilution series and the DNA polymerase at varying
volumes were all prepare in triplicate before run on the spectrophotometer at a
wavelength of 450nm. The average absorbance for each BSA dilution was calculate along
with standard deviation then plotted on a graph. The three-‐absorbancy values for each of
the DNA polymerase samples at different volumes were average separately. Using the
equation generated from the plotted BSA absorbencies at known concentrations, the
average DNA polymerase absorbencies were substituted in for the y-‐value to solve for the
X-‐value, or concentration. The resulting values were compared against the BSA standard
curve to determine which value best fit within the linear range of the Standard BSA curve
(refer to Figure 3).
Determining mg/mL Concentration of Aptamer Sample
In order to determine the concentration of the aptamer provided by Roche
Molecular Systems, 3 µL of the NTQ21-‐46A aptamer and 297 µL of nuclease free water
were added to a cuvette. The spectrophotometer was properly blanked and then the
cuvette with the aptamer was placed in the spectrophotometer to get abosorbance and
concentration readings at 260nm and 280nm. The resulting concentration based on the
spectrophotometer read out was 4.82 mg/mL or 4.82x10-‐3 µg/µL.
19
Results Aptamer and Hot Start PCR is an area of special interest for Roche Molecular
Systems, Inc. The BioProcessing division at the Branchburg, NJ site makes many enzyme
formulations for kits that are ideal for Hot Start PCR including formulations with aptamer.
Roche Molecular Systems has identified many benefits to the addition of aptamer to their
enzyme formulations including compatibility with Hot Start PCR, stability properties for
the polymerase when in complex with aptamer as well as protection against some harmful
environmental conditions. However, the company is not sure how these molecules interact
and the underlying mechanism for these properties seen. As a result, these questions
provided the motivation for the research presented in this manuscript where the main
goals were to explore DNA polymerase-‐aptamer stability and to map the location of
interaction between the aptamer and polymerase at various polymerase domain(s).
In order to explore the extent of DNA polymerase-‐aptamer stability, an eight week
accelerated enzyme stability study was performed to track changes in polymerase activity
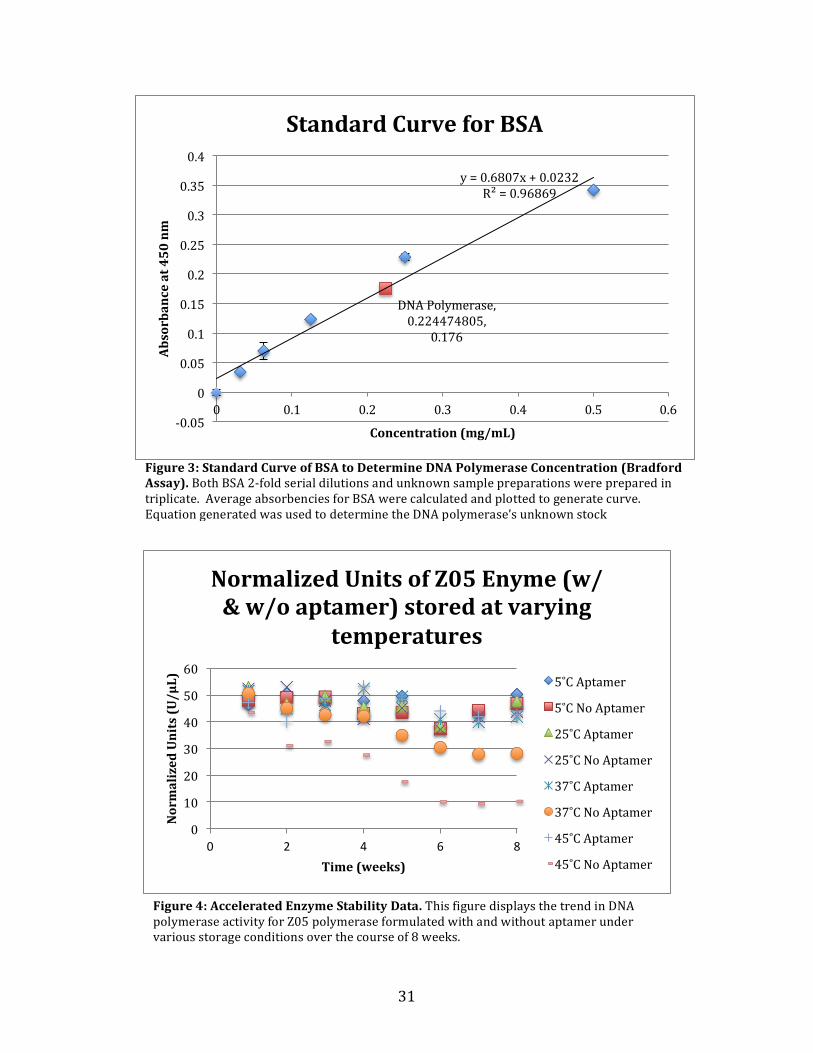
under different storage conditions. Figure 4 shows the stability data for the Z05
polymerase formulated with and without aptamer stored in the four different
temperatures over an eight-‐week time course. Notice in Figure 4 that the farther the
storage temperatures deviated from the recommended storage of 5°C, the faster the rate of
decay in enzyme activity. In addition, when DNA polymerase with and without aptamer
was compared to one another at each storage condition there was a faster decline in
activity for the polymerase without aptamer as oppose to with aptamer. This trend was
most noticeable under the 45°C storage condition. DNA polymerase with aptamer stored at
45°C sustained a polymerase activity close to the recommended 5°C control. However, the
20
DNA polymerase stored at 45°C without aptamer quickly declined to about a fifth of it
initial activity level by the end of eight weeks.
In order to map the location of aptamer binding on DNA polymerase, a proteinase K
challenge experiment was designed and executed. This challenge experiment involved
DNA polymerase formulated both with and without aptamer exposure to a series of
proteinase K concentrations to generate limited proteolysis products. The proteolysis
products that resulted from this proteinase K exposure were run on SDS-‐PAGE gels. The
gels were then stained to reveal band patterns between the no aptamer and aptamer
conditions. The ultimate goal was to isolate bands present in the no aptamer conditions
that subsequently disappeared in samples with increasing molar concentrations of
aptamer. Isolating these particular bands would theoretically signify the sequence on the
polymerase where the aptamer was interacting. The disappearance of the same band at
higher aptamer concentrations would suggest that the bound aptamer physically blocked
proteinase K from cleaving at those particular sites.
In order for the limited proteinase challenge experiment to be successful several
conditions had to be optimized. First the amount of DNA polymerase used in the challenge
experiments had to be optimized. It was important that the amount of DNA polymerase
used in these experiments was enough to get visible bands on the gel. It was determined
that 3.38x10-‐3 µg of DNA polymerase was a sufficient amount to add to each sample. Note
that this amount was kept constant through the remainder of all subsequent experiments.
Next the concentration of proteinase K added to each DNA polymerase sample had
to be optimized in order to generate limited banding patterns on the gel. The optimal
concentration range for this experiment was as follows: 8.2x10-‐5 µg/µL, 4.1 x10-‐5 µg/µL,
21
2.1x10-‐5 µg/µL, 1.0x10-‐5 µg/µL, 5.0x10-‐6 µg/µL, 3.0x10-‐6 µg/µL, 1.0x10-‐6 µg/µL, and 6.0 x10-‐7
µg/µL. Figure 5 shows the band pattern on the gel after being coomassie stained that
resulted from the optimal range of proteinase K concentrations. Note the distinct gradient
pattern in bands as proteinase K concentration decreases from left to right.
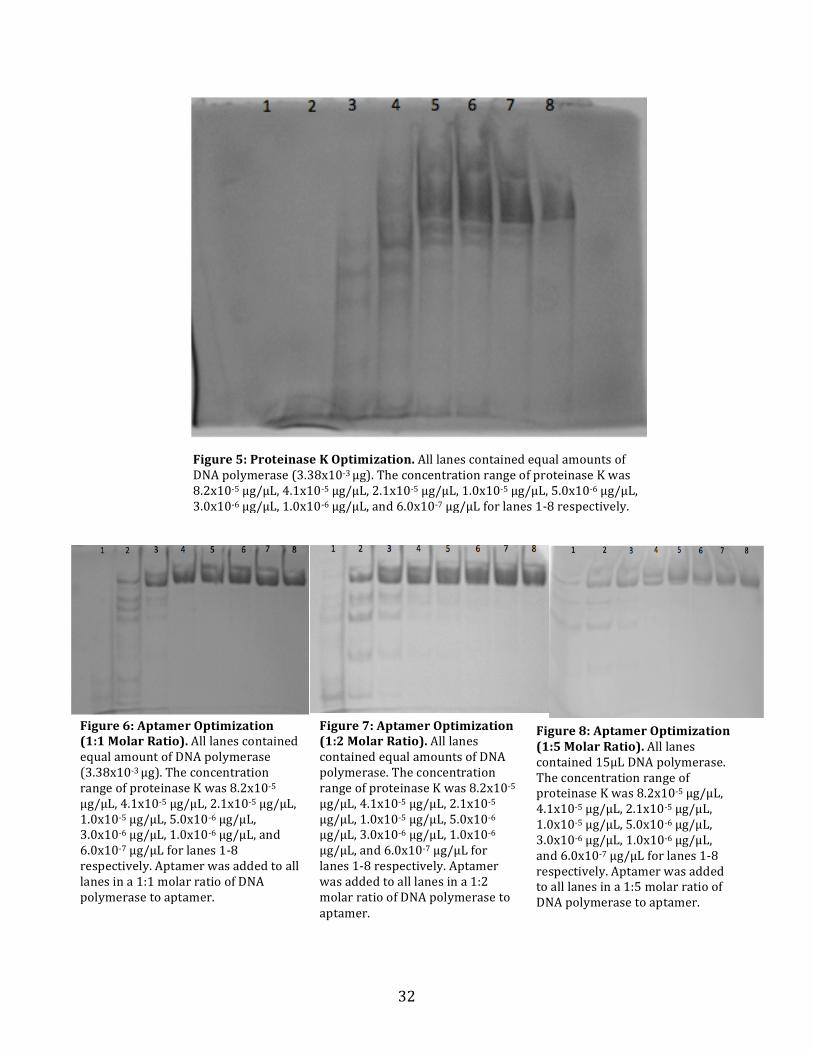
Once the optimal proteinase K concentration range was established, the amount of
aptamer necessary to achieve distinct pattern differences from the DNA polymerase only
gels (Figure 5) had to be optimized. Aptamer had to be added in amounts that would allow
for easy interaction with the DNA Polymerase. As a result of this instead of adding arbitrary
amounts of aptamer to the DNA polymerase samples, aptamer was added based on molar
ratios between DNA polymerase and the aptamer. Figure 6-‐8 displays the band patterns on
three gels that had DNA polymerase:Aptamer molar ratios of 1:1, 1:2, and 1:5 respectively
after being coomassie stained. Notice in comparing these three gels, that there is a
significant disappearance in proteolysis products as the amount of aptamer is increased
between each gel. Note that the DNA polymerase amount and proteinase K concentration
range for Figures 6-‐8 is the same as the conditions in Figure 5.
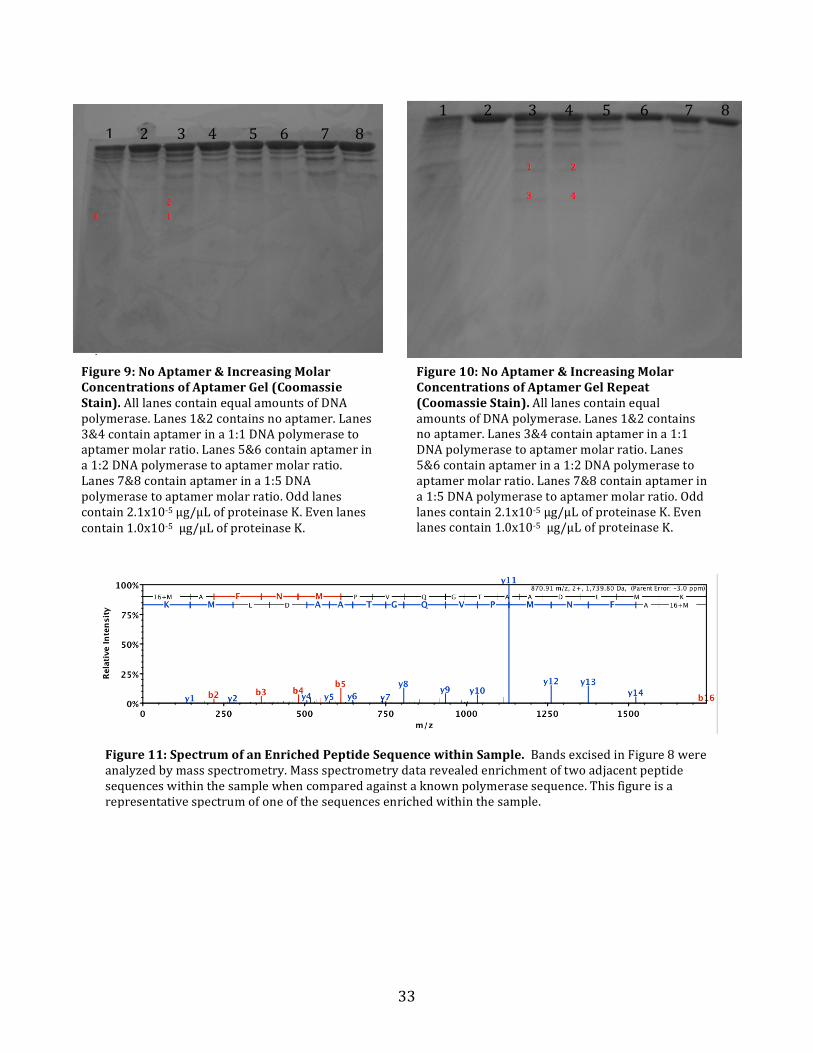
To better visualize pattern changes between the no aptamer conditions and aptamer
conditions as molar concentration of aptamer increased, the conditions established in lanes
3 and 4 of Figures 5-‐8 were run on the same gel followed by coomassie staining. Figure 9 &
10 reveal the gel pattern results under these conditions (Figure 10 is a repeat of the
experiment performed in Figure 9). Note some bands that are visible in the no aptamer
lanes (lanes 1&2) and lane lanes with aptamer in a 1:1 molar ratio (lanes 3&4) begin to
disappear in subsequent lanes as aptamer concentrations increased. Bands annotate with
22
numbers in both Figure 9 & 10 were excised from the gel and stored at 4˚C until they could
be analyzed by mass-‐spectrometry.
Bands labeled 1 and 2 in Figure 10 as well as bands labeled 3 and 4 were pooled
together and analyzed by mass spectrometry. The peptide fragments recovered from both
samples during the mass spectrometry procedure revealed the same two adjacent
sequences that were enriched within both samples as compared to all other peptides
identified. Figure 11 displays the spectrum of a representative peptide fragment that was
enriched within one of the bands submitted. Notice the spike in intensity for this particular
peptide fragment compared to all the other amino acids identified and represented as
smaller peaks.
Once the enriched sequences within the samples were identified they were mapped
on the known crystal structure of the Taq polymerase polymerase-‐binding domain to
reveal the likely residues that the aptamer interacts with on the polymerase and thus
protected during proteinase K digestion. Figure 12 displays two views of the known crystal
structure of the polymerase-‐binding domain, one of which is in space-‐fill form (Figure
12B). The polymerase-‐binding domain of the taq polymerase is highlighted in pink. The
areas highlighted in blue represent the residues that the aptamer likely interacts with on
the DNA polymerase and thus protect from proteinase K cleavage. Residues highlighted in
white represent the three conserved catalytic residues (Asp 610, Asp 785, and Glu 786)
within the active site of taq polymerase. Based on the results from Figure 12A and 12B, the
aptamer appears to be closely associated with the DNA polymerase-‐binding active site. The
peptide fragments that were enriched within the samples analyzed by mass spectrometry
matched to polymerase residues on the known three-‐dimensional structure that
23
surrounded the conserved catalytic residues within the polymerase-‐binding domain. The
space filling view of the polymerase in Figure 12B also shows that these residues reside
close to the surface of the polymerase molecule. Since these residues are close to the
surface of the molecule, these particular residues may provide easy access for the aptamer
to associate with and consequently proteinase K to degrade if unprotected.

24
Discussion Aptamer technology and its applications in PCR, medicine, and diagnostics have
gained considerable attention in recent years. A huge focus of Roche Molecular Systems’
work revolves around the development of diagnostic kits that in many cases employ PCR
technology. As a company, Roche Molecular Systems is always striving to make
advancements that improve their products and in turn benefit their customers. One area in
which advancements could be made is in the wide use of aptamer in the company’s line of
products as more information on aptamer biochemistry and the molecules benefits become
readily available. In small scale testing Roche Molecular Systems has identified several
interesting properties when some of their enzymes, used in diagnostic kits, are formulated
with aptamer. These properties include compatibility with Hot Start PCR, increased
stability, and protection from harmful environmental factors all of which are attractive for
commercial purposes. The underlying mechanism for these properties is not well
understood and as a result served as a motivation for the research outlined in this
manuscript, sponsored by Roche Molecular Systems.
There were three major goals for this project. The first was to demonstrate that an
aptamer could provide stability for the DNA polymerase enzyme. The second goal was to
demonstrate that aptamer in complex with DNA polymerase can provide protection against
harmful environmental conditions. Finally the third goal was to design and conduct
experimental studies that would result in the better understanding of the molecular
interactions between an aptamer and a Z05 polymerase.
The accelerated enzyme studies conducted at Roche Molecular Systems revealed
that the farther polymerase storage conditions deviated from the recommended 5°C
25
storage, the faster the rate of decline in activity. This observation was to be as expected
because enzymes, including polymerases, function normally under very specific
environmental conditions. Drastic changes in these conditions such as temperature or
exposure to proteases can lead to denaturation events and thus loss of protein function.
Interestingly when this same polymerase is formulated with aptamer the stability in
enzyme activity was maintained in many of the storage conditions outside the
recommended range (refer to Figure 4). These findings may have a huge beneficial impact
on Roche Molecular Systems’ production in the future. This preliminary study, could pave
the way for the development of a master mix that includes aptamer, which would allow the
enzymes produced by the company to be stored at room temperature. This could save the
company on the cost of refrigeration during production and shipment process of many of
their products.
The design and execution of a proteinase K challenge experiment had a dual role in
demonstrating protection capabilities of the aptamer as well as aid in the mapping of the
aptamer to a particular area on the DNA polymerase. Optimization of the proteinase K
challenge experiment was a major part of this study and several key findings were made as
a result of this trial and error process. While optimizing a specific range of proteinase K
concentrations that would result in a gradient of bands as proteinase K concentration
decreased, it was noticed that the gradient pattern slightly varied from trial to trial.
Proteinase K exhibits broad range substrate specificity. It often, but not always, cleaves
peptide bonds adjacent to the carboxyl group of aliphatic and aromatic amino acids with
blocked alpha amino groups11. This broad specificity may have contributed to the slight
deviations in patterns on the gel from trial to trial. In addition, optimization of the
26
proteinase K revealed that achieving a distinct gradient in band pattern occurred within a
very narrow proteinase K concentration range. Figure 5 reveals that over the span of four
2-‐fold dilutions of proteinase K, the gradient quickly goes from complete degradation (no
bands appear), to several proteolysis products generated, followed by limited proteolysis
(few bands).
When comparing the aptamer optimization gels it was noticed that it took 5:1 molar
excess aptamer in some cases to get disappearing of bands (Figure 9 &10). This suggests
that binding of the nucleic acid aptamer to the DNA polymerase might be a weaker
interaction than initially expected. This is because if the binding constant for the complex
were strong, it would have taken much less aptamer to achieve the disappearing band
effect. The huge excess of aptamer may have helped to drive the reaction to the right
toward more DNA polymerase-‐aptamer complex as a result of a small K constant of
formation, Kf. It is possible that with increased aptamer amounts, greater stability of the
DNA Polymerase may be achieved. It is suggested in the future that Roche Molecular
Systems continues their stability studies but with increased aptamer amounts to see if
better stability results can be achieved.
Optimization of the proteinase K challenge experiment also resulted in the
demonstration that the aptamer can provide some protection for the polymerase from
harmful environmental conditions, in the context of this study, proteinase K. Comparison of
the figures of gels with aptamer (Figure 6-‐10) reveals reduction in bands numbers at
higher aptamer concentrations. This suggests that the aptamer may be physically blocking
the proteinase K’s ability to cleave a certain recognition sites on the polymerase.
27
The mass spectrometry results revealed that the aptamer likely interacts with
residues toward the C-‐terminal end of the DNA polymerase within the polymerase binding
active site. Enrichment of two peptide sequences within the samples submitted for mass
spectrometry were mapped and highlighted on the known three-‐dimensional structure of
Taq polymerase, a polymerase similar to Z05 polymerase. Figure 12 reveals the location of
those mapped residues on the known polymerase structure. These residues were located
within the active site of the polymerase-‐binding domain. These results suggested that the
aptamer likely interacts within the pocket of the DNA polymerase active site but more
specifically the figure suggests that the aptamer is closely associated with the three
conserved catalytic residues required for DNA polymerization. This is because the enriched
sequences matched sequences in close proximity to the catalytic residues within the known
three-‐dimensional structure. This interaction would account for why aptamer is so
effective for Hot Start PCR because the aptamer is temporarily blocking access to the
catalytic residues required for DNA polymerization until it can dissociate at higher
temperatures. In addition, Figure 12B shows the space-‐fill form of the polymerase-‐aptamer
interaction. This figure reveals that the interaction may be occurring near the protein
surface. This is important because had the interaction been buried in the core of the
protein the proteinase K challenge may not have worked because the proteinase K could
have had trouble accessing the region of interaction.
It is also important to note that without the exact sequence of the Z05 polymerase,
the mapped region of aptamer binding is only an approximation. The Z05 polymerase likely
has homology to the taq polymerase structure and is in large part why taq polymerase was
28
used as an alternative to map the aptamer interaction in the absence of the known Z05
polymerase sequence.
Another way in which aptamer binding within the polymerase binding active site
can be validated is through the development of a Mg2+ titration experiment using
eriochrome black T indicator. This titration experiment takes advantage of the fact that
magnesium ions are associated with the DNA polymerase active site. The hypothesis for
this experiment is that if the aptamer binds the DNA polymerase active site, then the Mg2+
will be physically blocked from being stripped away from the active site and into solution
when a metal chelating agent, like EDTA, is added. For this particular experiment,
polymerase with and without aptamer would be subjected to EDTA to see if there is a
statistical difference in the amount of Mg2+ ions free in solution. Statistical differences in
the Mg2+ ion amount in the solution for polymerase with and without aptamer would
suggest that the aptamer does bind the polymerase active site thus affecting the amount of
magnesium ions that can be stripped into solution. No statistical differences in ion amount
would suggest that the aptamer does not bind the DNA polymerase active site and
therefore the aptamer would not obstruct the EDTA from chelating magnesium within the
polymerase active site. Due to the time constraints this alternative method could not be
carried out to completion. It is recommended that this processes be developed and
executed in the future to access the feasibility of this method and further validate that the
aptamer binds within the active site of the Z05 DNA polymerase.
This research resulted in the better understanding of how the NTQ21-‐46A aptamer
may interact with Z05 DNA polymerase. This information could pave the way for future
research into how these interactions can be manipulated for specific purposes in order to

29
improve current technology. For example, aptamer design studies where residues on the
aptamer are swapped out for different residues may lead to alteration in binding affinities.
This information may benefit in the future to help engineer better aptamers from the
ground up for more global use. With a better understanding of aptamer interactions with a
wide variety of proteins, these aptamers may serve as a cheap and more efficient
alternative to antibodies for future research, diagnostic, and therapeutic studies.

30
Figures
Figure 1: 3-‐D Structure of Taq Polymerase. This figure displays the crystal structure of Taq polymerase, with all its major domains, bound to DNA.
Figure 2: Mechanism of Two Metal Stabilization of DNA Polymerase Active Site. Two metal ions labeled A & B stabilize the transition state as a dNTP enters the active site. Metal ion A prepares the primer’s 3’ hydroxyl for attack on the α-‐phosphate on the dNTP. Metal ion B neutralizes the negative charge that builds up on the leaving oxygen and chelates the β and γ phosphates12.
31
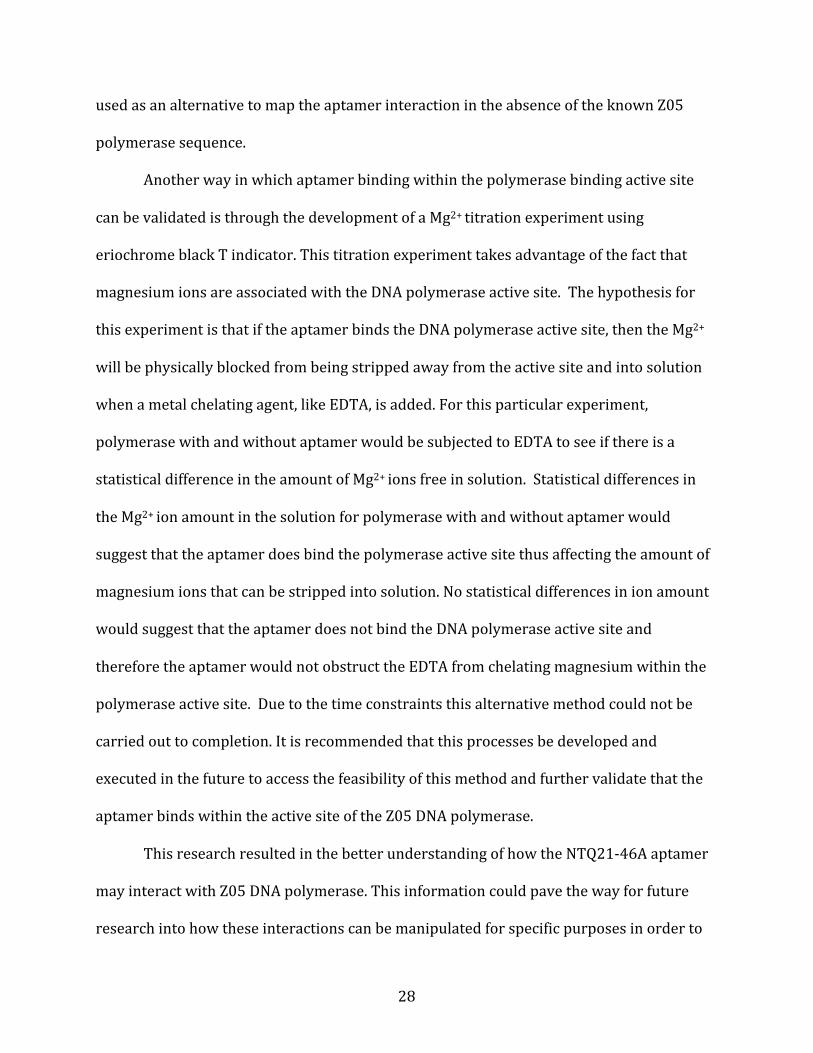
Figure 3: Standard Curve of BSA to Determine DNA Polymerase Concentration (Bradford Assay). Both BSA 2-‐fold serial dilutions and unknown sample preparations were prepared in triplicate. Average absorbencies for BSA were calculated and plotted to generate curve. Equation generated was used to determine the DNA polymerase’s unknown stock concentration.
DNA Polymerase, 0.224474805,
0.176
y = 0.6807x + 0.0232 R² = 0.96869
-‐0.05
0
0.05
0.1
0.15
0.2
0.25
0.3
0.35
0.4
0 0.1 0.2 0.3 0.4 0.5 0.6
Absorbance at 450 nm
Concentration (mg/mL)
Standard Curve for BSA
Figure 4: Accelerated Enzyme Stability Data. This figure displays the trend in DNA polymerase activity for Z05 polymerase formulated with and without aptamer under various storage conditions over the course of 8 weeks.
0
10
20
30
40
50
60
0 2 4 6 8
Normalized Units (U/μL)
Time (weeks)
Normalized Units of Z05 Enyme (w/ & w/o aptamer) stored at varying
temperatures
5˚C Aptamer
5˚C No Aptamer
25˚C Aptamer
25˚C No Aptamer
37˚C Aptamer
37˚C No Aptamer
45˚C Aptamer
45˚C No Aptamer
32
Figure 5: Proteinase K Optimization. All lanes contained equal amounts of DNA polymerase (3.38x10-‐3 µg). The concentration range of proteinase K was 8.2x10-‐5 µg/µL, 4.1x10-‐5 µg/µL, 2.1x10-‐5 µg/µL, 1.0x10-‐5 µg/µL, 5.0x10-‐6 µg/µL, 3.0x10-‐6 µg/µL, 1.0x10-‐6 µg/µL, and 6.0x10-‐7 µg/µL for lanes 1-‐8 respectively.
Figure 6: Aptamer Optimization (1:1 Molar Ratio). All lanes contained equal amount of DNA polymerase (3.38x10-‐3 µg). The concentration range of proteinase K was 8.2x10-‐5 µg/µL, 4.1x10-‐5 µg/µL, 2.1x10-‐5 µg/µL, 1.0x10-‐5 µg/µL, 5.0x10-‐6 µg/µL, 3.0x10-‐6 µg/µL, 1.0x10-‐6 µg/µL, and 6.0x10-‐7 µg/µL for lanes 1-‐8 respectively. Aptamer was added to all lanes in a 1:1 molar ratio of DNA polymerase to aptamer.
Figure 7: Aptamer Optimization (1:2 Molar Ratio). All lanes contained equal amounts of DNA polymerase. The concentration range of proteinase K was 8.2x10-‐5 µg/µL, 4.1x10-‐5 µg/µL, 2.1x10-‐5 µg/µL, 1.0x10-‐5 µg/µL, 5.0x10-‐6 µg/µL, 3.0x10-‐6 µg/µL, 1.0x10-‐6 µg/µL, and 6.0x10-‐7 µg/µL for lanes 1-‐8 respectively. Aptamer was added to all lanes in a 1:2 molar ratio of DNA polymerase to aptamer.
Figure 8: Aptamer Optimization (1:5 Molar Ratio). All lanes contained 15µL DNA polymerase. The concentration range of proteinase K was 8.2x10-‐5 µg/µL, 4.1x10-‐5 µg/µL, 2.1x10-‐5 µg/µL, 1.0x10-‐5 µg/µL, 5.0x10-‐6 µg/µL, 3.0x10-‐6 µg/µL, 1.0x10-‐6 µg/µL, and 6.0x10-‐7 µg/µL for lanes 1-‐8 respectively. Aptamer was added to all lanes in a 1:5 molar ratio of DNA polymerase to aptamer.
33
Figure 9: No Aptamer & Increasing Molar Concentrations of Aptamer Gel (Coomassie Stain). All lanes contain equal amounts of DNA polymerase. Lanes 1&2 contains no aptamer. Lanes 3&4 contain aptamer in a 1:1 DNA polymerase to aptamer molar ratio. Lanes 5&6 contain aptamer in a 1:2 DNA polymerase to aptamer molar ratio. Lanes 7&8 contain aptamer in a 1:5 DNA polymerase to aptamer molar ratio. Odd lanes contain 2.1x10-‐5 µg/µL of proteinase K. Even lanes contain 1.0x10-‐5 µg/µL of proteinase K.
1 2 3 4 5 6 7 8 1 2 3 4 5 6 7 8
Figure 10: No Aptamer & Increasing Molar Concentrations of Aptamer Gel Repeat (Coomassie Stain). All lanes contain equal amounts of DNA polymerase. Lanes 1&2 contains no aptamer. Lanes 3&4 contain aptamer in a 1:1 DNA polymerase to aptamer molar ratio. Lanes 5&6 contain aptamer in a 1:2 DNA polymerase to aptamer molar ratio. Lanes 7&8 contain aptamer in a 1:5 DNA polymerase to aptamer molar ratio. Odd lanes contain 2.1x10-‐5 µg/µL of proteinase K. Even lanes contain 1.0x10-‐5 µg/µL of proteinase K.
Figure 11: Spectrum of an Enriched Peptide Sequence within Sample. Bands excised in Figure 8 were analyzed by mass spectrometry. Mass spectrometry data revealed enrichment of two adjacent peptide sequences within the sample when compared against a known polymerase sequence. This figure is a representative spectrum of one of the sequences enriched within the sample.

34
Figure 12A & 12B: Crystal Structures of Taq Polymerase Binding Domain. These figures display two views of the crystal structure of Taq polymerase’s polymerase binding domain with the peptide sequence that aptamer protects highlighted in blue and the three catalytic residues (Asp 610, Asp 785, Glu 786) in white.
A B
35
References
1. Abramson, R., Gelfand, D., & Greenfield, L. U.S. Department of Commerce, United States Patent and Trademark Office. (1995). Mutated thermostable nucleic acid polymerase enzyme from thermus species z05 (US5455170 A). Retrieved March 30, 2014 from website: http://www.google.com/patents/US5455170
2. Ban, C., Song, K.M, Lee, S. (2012). Aptamer and their biological applications. Sensors, 12: 612-‐631.
3. Ban, C., Min, K., Jo, H., Song, K., Cho, M., Chun, Y.S., Jon, S., Kim, W.J. (2011). Dual-‐
aptamer-‐based delivery vehicle of doxorubicin to both PSMA (+) and PSMA (-‐) prostrate cancers. Biomaterials, 32: 2124-‐2132.
4. Ellis, M.J. (1998). Making a lot out of a little: the polymerase chain reaction. Retrieved October 6, 2013, from http://www.bio.davidson.edu/courses/molbio/molstudents/01maellis/pcr.html
5. Gelfand, D.H., Holland, P.M., Abramson, R.D., Watson, R., (1991). Detection of specific
polymerase chain reaction product by utilizing the 5’à3’ exonuclease activity of thermus aquaticus DNA polymerase. Proc. Natl. Acad. Sci. USA, 88: 7276-‐7280.
6. Geif, M., Sobek, H., Ankenbauer, W., & Laue, F. U.S. Department of Commerce, United States Patent and Trademark Office. (1999). Thermostable enzyme promoting the fidelity of thermostable dna polymerases—for improvement of nucleic acid synthesis and amplification in vitro (US07410782B2). Retrieved October 6, 2013 from website: http://www.lens.org/lens/patent/US_7410782_B2/fulltext
7. Jayasena, S.D. (1999). Aptamers: An emerging class of molecules that rival antibodies in diagnostics. Clinical Chemistry, 45: 1628-‐1650.
8. Lapidot, A and Iakobashvili, R. (1998). Low cycled PCR protocol for Klenow
fragment of DNA Polymerase I in the presence of proline. Nucleic Acids Research, 27: 1566-‐1568.
9. Roche Diagnostics. (2013). The evolution of PCR. Retrieved October 7, 2013, from
http://www.roche-‐applied-‐science.com/campaigns/DeveloperTips/pcr/The-‐Evolution-‐of-‐PCR.html
10. Saiki, RK; et al. (1988). Primer-‐directed enzymatic amplification of DNA with
thermostable DNA polymerase. Science, 239: 487–91.
11. Sigma Aldrich. (2014). Proteinase K. Retrieved March 31, 2014 from http://www.sigmaaldrich.com/life-‐science/metabolomics/enzyme-‐explorer/analytical-‐enzymes/proteinase-‐k.html

36
12. Steitz, T.A. (1999). DNA polymerases: structural diversity and common mechanisms.
J. Biol. Chem, 274: 17395-‐17398.
13. Steitz, T.A., Kim, Y., Eom, S.H., Wang, J., Lee, D.S, Suh, S.W. (1995). Crystal structure of Thermus aquaticus DNA Polymerase. Nature, 376: 612-‐616.
14. Wallace, B., Wu, D.Y., Ugozzoli, L., Pal, B.K, Qian, J. (1991). The effect of temperature
and primer length on the specificity and efficiency of amplification by the polymerase chain reaction. DNA and Cell Biology, 10: 233-‐238.