exploring the relationship between hearing quality and ... quality... · hearing quality and case...
TRANSCRIPT
Exploring the Relationship Between Hearing Quality and Case Outcomes in New York
CHILD WELFARE COURT IMPROVEMENT PROJECTNEW YORK STATE UNIFIED COURT SYSTEM
ALICIA SUMMERS, PHDData Savvy Consulting
November 2017


Contents
Introduction 1
Prior Research on Hearing Quality and Case Outcomes 2Hearing Quality Variables of Interest 2Outcome Variables of Interest 3
Methods of Examining the Relationship Between Hearing Quality and Case Outcomes 4
Correlations and Statistical Significance 4Limitations to this method 6
Findings 7
Correlations (Method 1) 7• Reunification 7• Time to Permanency 7• Time to Adoption 8• Still in Care 9• Aging Out/Reaching the Age of Majority 10
Predictive Analyses (Method 2) 10• Time to Permanency 10• Reunification 11
Summary of Findings Across Methods 12
Conclusion 12
Exploring the Relationship Between Hearing Quality and Case Outcomes in New York


EXPLORING THE RELATIONSHIP BETWEEN HEARING QUALITY AND CASE OUTCOMES IN NEW YORK 1
Introduction
The New York Child Welfare Court Improvement Program (CIP) began examining hearing quality in 2012, after findings from an earlier CFSR revealed concerns
regarding timely permanency. The CIP started exploring reasons for the delay. Data from 2012 revealed that permanency hearings were being held timely, within the Family Court Act Article 10-A guidelines in the vast majority of cases (e.g., 83% of initial permanency and 93% of subsequent permanency hearings were held within the timeframe). Yet, time to permanency averaged 2.5 years (median = 547 days) for children who entered out-of-home care in 2012. It was clear that despite holding timely permanency hearings, there could be improvements in the achievement of timely permanency. New York CIP began a more robust exploration of hearing practice in order to examine how the quality of court hearings may be related to case outcomes.
New York CIP collected data through structured court observations as well as structured case file reviews of recently closed cases. Data were collected in 12 jurisdictions across the state of New York, including the 5 boroughs of New York City, with a goal of observing 20 permanency hearings and reviewing case files of 20 closed cases in each jurisdiction. The final sample included 238 court hearings observed and 232 cases reviewed, with data collected on 732 permanency hearings from the case files. Data were collected to inform multiple purposes. First, data from each site were summarized and reported back to system stakeholders to inform action planning efforts. A secondary purpose of the data was to identify trends across the state on key quality hearing performance measures. Finally, the data were compiled for the purpose of exploring the complex relationship between hearing quality indicators and child abuse and neglect case outcomes. The third point is the focus of this report, discussing the methods of collecting and analyzing the data in order to identify relationships in variables, and when available, predict case outcomes in a meaningful way.
Monroe
Erie
Broome
Oneida
Albany
Westchester
New York
Kings
Queens
Richmond
Bronx
Dutchess
CHILD WELFARE COURT IMPROVEMENT PROJECT2
Prior Research on Hearing Quality and Case Outcomes
1. Summers, A., & Shdaimah, C. (2013). Improving Juvenile Dependency Case Timeliness through Use of the One Family, One Judge Model. Juvenile and Family Court Journal, 64, 23-34. Summers, A., & Shdaimah, C. (2013). One family, one judge, no continuances. Juvenile and Family Court Journal, 64, 35-44.
2. Wood, S., & Russell, J. (2011). Effects of parental and attorney involvement on reunification in Juvenile dependency cases. Children and Youth Services Review, 33, 1730-1741.
3. Macgill, S., & Summers, A. (2014). Assessing the relationship between the quality of juvenile dependency hearings and foster care placements. Family Court Review, 52, 678-685.
4. Ellett, A. J., & Steib, S. D. (2005). Child welfare and the courts; A statewide study with implications for professional development, practice, and change. Research on Social Work Practice, 15(5), 339-352.
5. Summers, A., & Darnell, A. (2015). What does court observation tell us about judicial practice and the courts in child welfare? Journal of Public Child Welfare, 9, 341-361.
6. Summers, A., Gatowski, S. I. & Gueller, M. (under review). Examining Hearing Quality in Child Abuse and Neglect Cases: The Relationship Between Breadth of Discussion and Case Outcomes
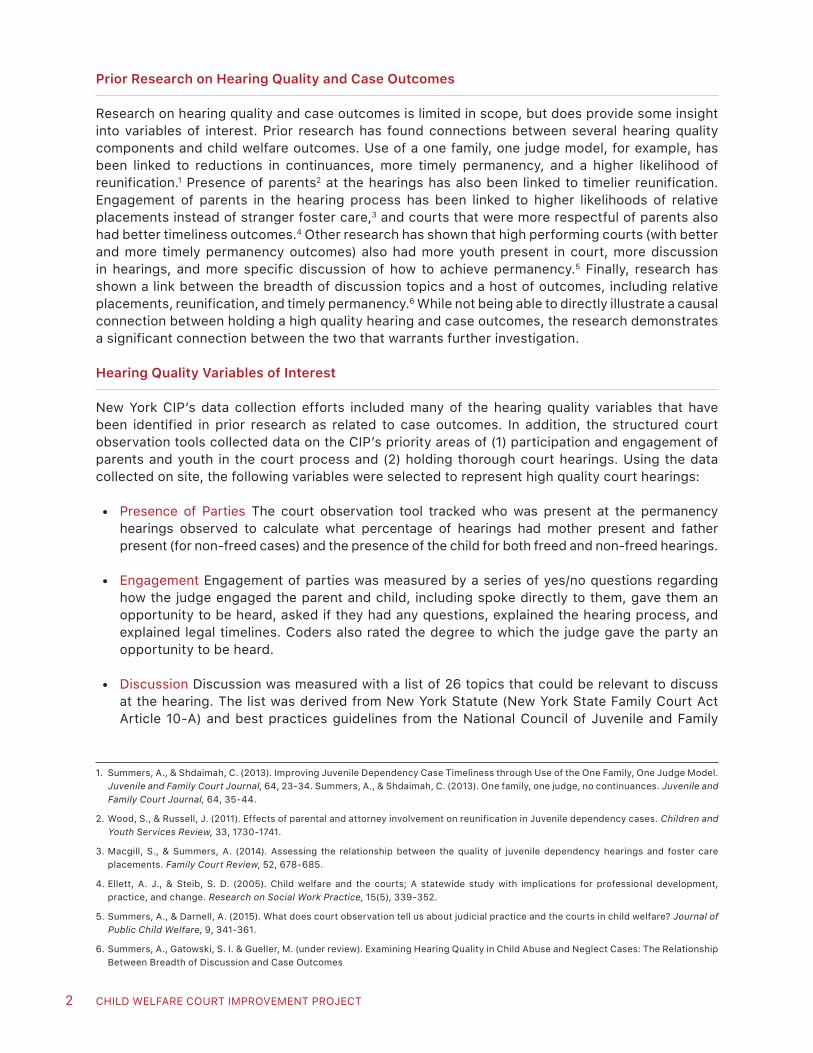
Research on hearing quality and case outcomes is limited in scope, but does provide some insight into variables of interest. Prior research has found connections between several hearing quality components and child welfare outcomes. Use of a one family, one judge model, for example, has been linked to reductions in continuances, more timely permanency, and a higher likelihood of reunification.1 Presence of parents2 at the hearings has also been linked to timelier reunification. Engagement of parents in the hearing process has been linked to higher likelihoods of relative placements instead of stranger foster care,3 and courts that were more respectful of parents also had better timeliness outcomes.4 Other research has shown that high performing courts (with better and more timely permanency outcomes) also had more youth present in court, more discussion in hearings, and more specific discussion of how to achieve permanency.5 Finally, research has shown a link between the breadth of discussion topics and a host of outcomes, including relative placements, reunification, and timely permanency.6 While not being able to directly illustrate a causal connection between holding a high quality hearing and case outcomes, the research demonstrates a significant connection between the two that warrants further investigation.
Hearing Quality Variables of Interest
New York CIP’s data collection efforts included many of the hearing quality variables that have been identified in prior research as related to case outcomes. In addition, the structured court observation tools collected data on the CIP’s priority areas of (1) participation and engagement of parents and youth in the court process and (2) holding thorough court hearings. Using the data collected on site, the following variables were selected to represent high quality court hearings:
• Presence of Parties The court observation tool tracked who was present at the permanency hearings observed to calculate what percentage of hearings had mother present and father present (for non-freed cases) and the presence of the child for both freed and non-freed hearings.
• Engagement Engagement of parties was measured by a series of yes/no questions regarding how the judge engaged the parent and child, including spoke directly to them, gave them an opportunity to be heard, asked if they had any questions, explained the hearing process, and explained legal timelines. Coders also rated the degree to which the judge gave the party an opportunity to be heard.
• Discussion Discussion was measured with a list of 26 topics that could be relevant to discuss at the hearing. The list was derived from New York Statute (New York State Family Court Act Article 10-A) and best practices guidelines from the National Council of Juvenile and Family
EXPLORING THE RELATIONSHIP BETWEEN HEARING QUALITY AND CASE OUTCOMES IN NEW YORK 3
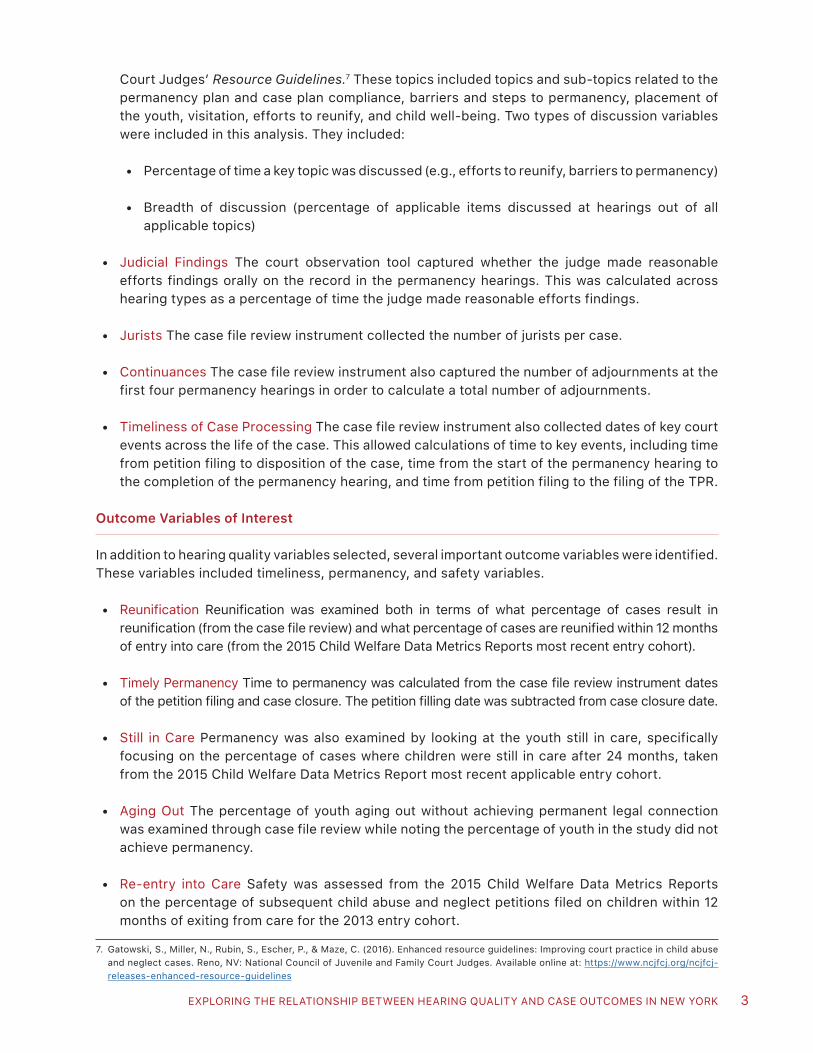
Court Judges’ Resource Guidelines.7 These topics included topics and sub-topics related to the permanency plan and case plan compliance, barriers and steps to permanency, placement of the youth, visitation, efforts to reunify, and child well-being. Two types of discussion variables were included in this analysis. They included:
• Percentage of time a key topic was discussed (e.g., efforts to reunify, barriers to permanency)
• Breadth of discussion (percentage of applicable items discussed at hearings out of all applicable topics)
• Judicial Findings The court observation tool captured whether the judge made reasonable efforts findings orally on the record in the permanency hearings. This was calculated across hearing types as a percentage of time the judge made reasonable efforts findings.
• Jurists The case file review instrument collected the number of jurists per case.
• Continuances The case file review instrument also captured the number of adjournments at the first four permanency hearings in order to calculate a total number of adjournments.
• Timeliness of Case Processing The case file review instrument also collected dates of key court events across the life of the case. This allowed calculations of time to key events, including time from petition filing to disposition of the case, time from the start of the permanency hearing to the completion of the permanency hearing, and time from petition filing to the filing of the TPR.
7. Gatowski, S., Miller, N., Rubin, S., Escher, P., & Maze, C. (2016). Enhanced resource guidelines: Improving court practice in child abuse and neglect cases. Reno, NV: National Council of Juvenile and Family Court Judges. Available online at: https://www.ncjfcj.org/ncjfcj-releases-enhanced-resource-guidelines
Outcome Variables of Interest
In addition to hearing quality variables selected, several important outcome variables were identified. These variables included timeliness, permanency, and safety variables.
• Reunification Reunification was examined both in terms of what percentage of cases result in reunification (from the case file review) and what percentage of cases are reunified within 12 months of entry into care (from the 2015 Child Welfare Data Metrics Reports most recent entry cohort).
• Timely Permanency Time to permanency was calculated from the case file review instrument dates of the petition filing and case closure. The petition filling date was subtracted from case closure date.
• Still in Care Permanency was also examined by looking at the youth still in care, specifically focusing on the percentage of cases where children were still in care after 24 months, taken from the 2015 Child Welfare Data Metrics Report most recent applicable entry cohort.
• Aging Out The percentage of youth aging out without achieving permanent legal connection was examined through case file review while noting the percentage of youth in the study did not achieve permanency.
• Re-entry into Care Safety was assessed from the 2015 Child Welfare Data Metrics Reports on the percentage of subsequent child abuse and neglect petitions filed on children within 12 months of exiting from care for the 2013 entry cohort.

CHILD WELFARE COURT IMPROVEMENT PROJECT4
Methods of Examining the Relationship Between Hearing Quality and Case Outcomes
Data were compiled and analyzed using two distinct methods to explore the link between hearing quality and case outcomes. The first method explored correlations (relationships)
between typical practice in a given jurisdiction and typical outcomes in a given jurisdiction for the 12 sites. The second method used predictive analysis to explore relationships found with variables and outcomes in the case file review dataset. Both methods are described in more depth below.
Method 1 - Correlations. To examine relationships between hearing quality and case outcomes, we explored correlations, a common statistic that provides a single number that describes the degree of relationship between two variables. For this method, we took the averages from the 12 sites on a series of hearing quality measures (identified above and below) and compared this to average jurisdiction level data from the Child Welfare Data Metrics Report for that specific site. For example, for the 20 hearings observed in site A, we calculated the percentage of time the mother was present. This variable was entered into a database as a number (e.g., 67% = .67). We also took outcome data from the Child Welfare Data Metrics Report, such as percentage of cases reaching reunification within 12 months and added that number to the dataset. This resulted in 12 cases (each jurisdiction is 1 case) and nearly 100 variables per case to correlate. The hearing quality variables and case outcome variables (see list starting on page 5) were all added into a correlation matrix and examined for statistically significant relationships.
Correlations and Statistical Significance
Correlation Values Correlation values range from 0 to +/-1, with those closer to 1 being stronger relationships. A value of .2 to .39 is considered weak, .4 to .59 is considered moderate and .6 to .79 is considered strong and .8 to 1.0 is considered a very strong association between two variables.
Correlation Direction Correlations also include a direction. A positive correlation means that variables both increase or decrease in the same direction. That is, as one increases so does the other. For example, a positive correlation (.80) between height and shoe size indicates that as people get taller their shoe size increases. A negative correlation (any value -.1 to -1.0) indicates that the variables are related in opposite directions. For example, smoking and life expectancy are negatively correlated, as the amount of smoking you do per day increases, your life expectancy decreases. The direction is not related to the strength. A -.8 correlation shows a stronger relationship than a +.5).
Statistical Significance The correlations are tested for statistical significance; essentially, this is testing whether we believe that the relationship is more than can be explained by chance alone. Statistical significance can be explained as evidence on a scale of 0 to 1, with smaller values indicating more evidence that the values derived were not chance, and that there is actually something there. Traditionally, researchers use a value of .05 as a cutoff (also called p value). In applied research with smaller sample sizes, we chose to use a value of .1, indicating 90% certainty that our results are not just chance.
EXPLORING THE RELATIONSHIP BETWEEN HEARING QUALITY AND CASE OUTCOMES IN NEW YORK 5
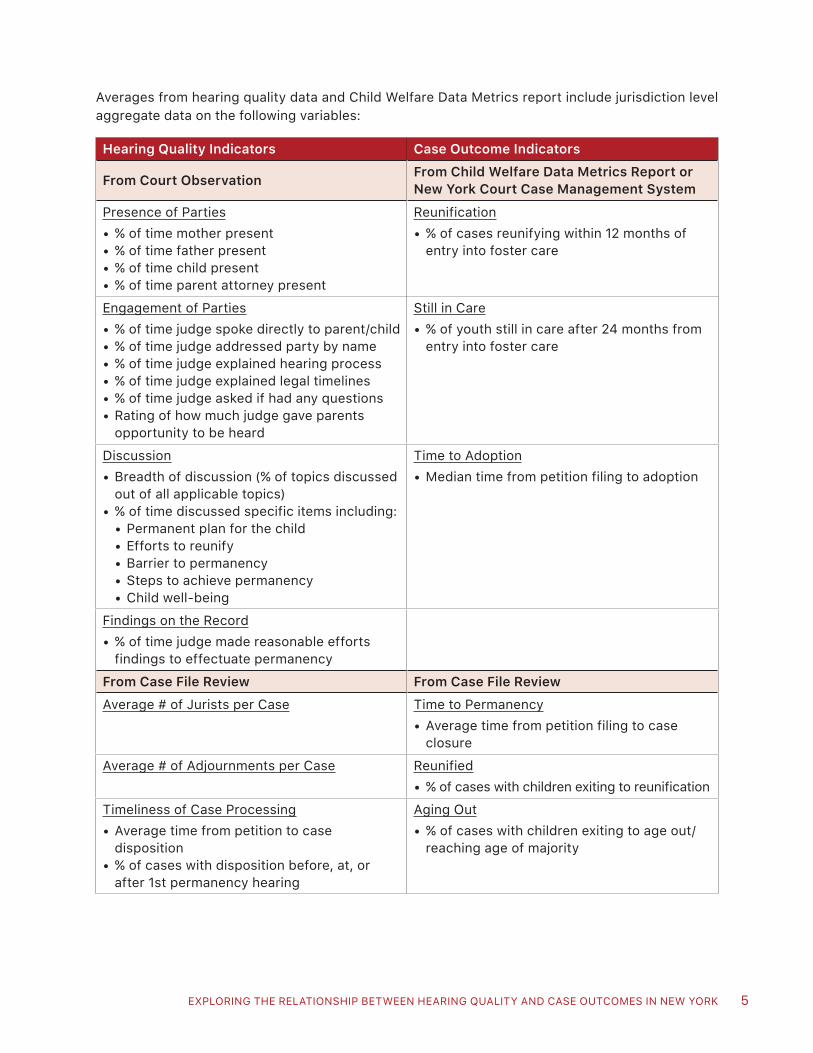
Averages from hearing quality data and Child Welfare Data Metrics report include jurisdiction level aggregate data on the following variables:
Hearing Quality Indicators Case Outcome Indicators
From Court Observation From Child Welfare Data Metrics Report or New York Court Case Management System
Presence of Parties• % of time mother present• % of time father present• % of time child present• % of time parent attorney present
Reunification• % of cases reunifying within 12 months of
entry into foster care
Engagement of Parties• % of time judge spoke directly to parent/child• % of time judge addressed party by name• % of time judge explained hearing process• % of time judge explained legal timelines• % of time judge asked if had any questions• Rating of how much judge gave parents
opportunity to be heard
Still in Care• % of youth still in care after 24 months from
entry into foster care
Discussion• Breadth of discussion (% of topics discussed
out of all applicable topics)• % of time discussed specific items including:
• Permanent plan for the child• Efforts to reunify• Barrier to permanency• Steps to achieve permanency• Child well-being
Time to Adoption• Median time from petition filing to adoption
Findings on the Record• % of time judge made reasonable efforts
findings to effectuate permanencyFrom Case File Review From Case File ReviewAverage # of Jurists per Case Time to Permanency
• Average time from petition filing to case closure
Average # of Adjournments per Case Reunified• % of cases with children exiting to reunification
Timeliness of Case Processing• Average time from petition to case
disposition• % of cases with disposition before, at, or
after 1st permanency hearing
Aging Out• % of cases with children exiting to age out/
reaching age of majority
CHILD WELFARE COURT IMPROVEMENT PROJECT6
Limitations to this method
While this method has been common in the research literature (see Summers & Darnell or Ellet & Steib), it is not without limitations. The biggest limitation is the sample size. While there are many variables of interest, there are only 12 cases (1 per jurisdiction). The sample is fairly small, but somewhat diverse as it includes both urban and more rural jurisdictions in the state of New York. It is also limited in that it only examines “typical” or average practice and compares to average outcomes. A more robust analysis would examine case level practice and link that to the outcomes on those specific cases. It also cannot show any causal connections between practice and outcomes. This analysis only shows relationships and relationship direction.
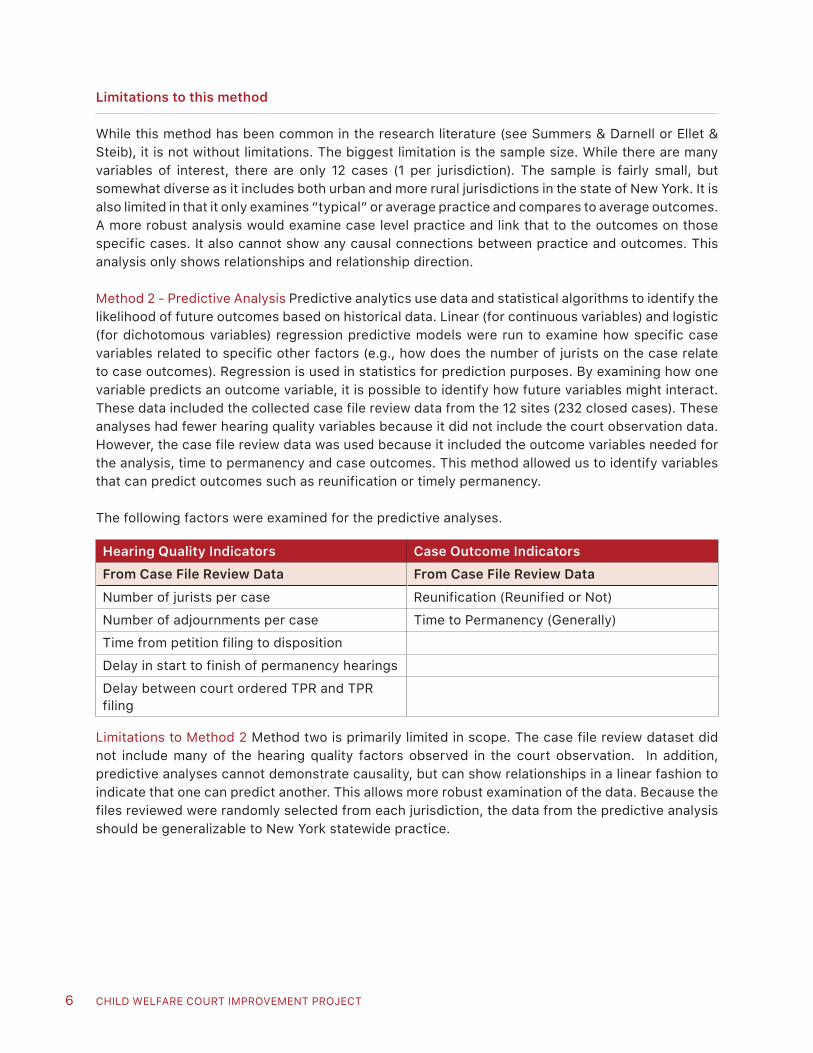
Method 2 - Predictive Analysis Predictive analytics use data and statistical algorithms to identify the likelihood of future outcomes based on historical data. Linear (for continuous variables) and logistic (for dichotomous variables) regression predictive models were run to examine how specific case variables related to specific other factors (e.g., how does the number of jurists on the case relate to case outcomes). Regression is used in statistics for prediction purposes. By examining how one variable predicts an outcome variable, it is possible to identify how future variables might interact. These data included the collected case file review data from the 12 sites (232 closed cases). These analyses had fewer hearing quality variables because it did not include the court observation data. However, the case file review data was used because it included the outcome variables needed for the analysis, time to permanency and case outcomes. This method allowed us to identify variables that can predict outcomes such as reunification or timely permanency.
The following factors were examined for the predictive analyses.
Hearing Quality Indicators Case Outcome IndicatorsFrom Case File Review Data From Case File Review DataNumber of jurists per case Reunification (Reunified or Not)Number of adjournments per case Time to Permanency (Generally)Time from petition filing to dispositionDelay in start to finish of permanency hearingsDelay between court ordered TPR and TPR filing
Limitations to Method 2 Method two is primarily limited in scope. The case file review dataset did not include many of the hearing quality factors observed in the court observation. In addition, predictive analyses cannot demonstrate causality, but can show relationships in a linear fashion to indicate that one can predict another. This allows more robust examination of the data. Because the files reviewed were randomly selected from each jurisdiction, the data from the predictive analysis should be generalizable to New York statewide practice.

EXPLORING THE RELATIONSHIP BETWEEN HEARING QUALITY AND CASE OUTCOMES IN NEW YORK 7
Findings
Correlations (Method 1)
All the hearing quality and case outcome variables were entered into a correlation analysis. The statistically significant items (p ≤ .1) are reported along with their correlation variable. The correlation variable tells you the direction (positive or negative) of the correlation as well as the strength. These are reported by outcomes of interest.
ReunificationThe outcome of reunification was examined in two ways. The first was the percentage of cases that resulted in reunification (from the case file review dataset). The second was a percentage of children reunified within 12 months of entering care (from the most recent entry cohort reported in the 2015 Child Welfare Court Data Metrics Report). This report was selected as it coincided with the court observation data collection conducted during this study, and so should be reflective of court practices underway when these outcomes were achieved. As noted in the table below, several hearing quality variables were strongly related to reunification. These were all positive correlations, so increases in the hearing quality variables were related to increases in the outcome. For example, sites that had a higher percentage of judges making reasonable efforts to effectuate permanency findings on the record also had higher rates of reunification. On the other hand, sites that had more hearings when no parent attorney was present also had lower rates of reunification within 12 months.
Outcome Variable Hearing Quality Variable Correlation P valueReunified (% Reunified) % judge made reasonable efforts
to effectuate permanency goal.507 .093
Average length of hearing .528 .078
% of cases where disposition was held after the first permanency hearing
.596 .041
Time from removal to disposition .553 .062% Reunified within 12 months Percentage of mother present
at hearings.581 .048
Percent judge gave child opportunity to be heard
.553 .062
(Negative Correlation – as one decreases, the other increases)
Percentage of hearings with no parent attorney present
-.528 .078
Time to PermanencyThere is a strong push to ensure that youth reach permanency in a timely fashion and not languish in foster care. Time to permanency (across permanency types) was calculated from the case file review data from petition filing date to case closure date and the average was entered into the data set. As noted in the table below, hearing quality variables were both positively and negatively correlated with time to permanency. Sites with higher average time to disposition also had higher average time to permanency. One of the strongest correlations was percent of time mother was present at the hearing (-.772). This means that jurisdictions where the mother was present less often had longer times to permanency.

CHILD WELFARE COURT IMPROVEMENT PROJECT8
Outcome Variable Hearing Quality Variable Correlation P valueTime to Permanency (Positive correlations – as one variable increases, so does the other)
Time from removal to disposition hearing
.524 .08
# of jurists per case .585 .045% disposition held after 1st permanency hearing
.656 .020
(Negative Correlations – as one decreases, the other increases)
Percent of hearings with disposition hearing held before 1st permanency hearing
-.575 . 051
Percent mother present -.772 .003% of hearings where judge discussed permanency plan for child
-.548 .065
% of hearings where judge addressed parents by name
-.508, .092
% of hearings where judge addressed child by name
-.521 .082
% of hearings where judge spoke directly to child
-.531 .076
% of hearings where the judge asked the child if they had any questions
-.669 .017
Judge treated parents with respect
-.609 .036
Time to AdoptionIn addition to time to permanency generally, we explored time to adoption (a specific permanency outcome). The CIP provided median time to adoption by site for the 12 sites from their court case management system. We correlated this with our hearing quality variables of interest. All significant correlations were negative, indicating that as the variable of interest increases, the median time to adoption decreases. Sites that had a higher percentage of time that the mother was present at hearings also had lower median time to adoption. Other strong correlations included judicial engagement of parents and children at the hearings. When engagement was higher, median time to adoption was lower.
Outcome Variable Hearing Quality Variable Correlation P valueTime to Adoption (Negative Correlations – as one decreases, the other increases)
Percentage of time the mother was present at hearings
-.772 .003
Percentage of time discussed child wellbeing at hearings
-.565 .06

EXPLORING THE RELATIONSHIP BETWEEN HEARING QUALITY AND CASE OUTCOMES IN NEW YORK 9
Outcome Variable Hearing Quality Variable Correlation P valuePercentage of time judge spoke directly to parents
-.628 .03
Percentage of time judge addressed parents by name
-.706 .01
Percent judge spoke directly to the child
-.494 .10
Percentage of time judge asked child if they had any questions
-.705 .01
Percentage of all topics covered at hearing (breadth of discussion)
-.524 .08
Still in CareWe also explored non-permanent outcomes, looking at the percentage of youth who were still in care at 24 months. These data were the most recent cohort that could still be in care at 24 months from the 2015 Child Welfare Court Data Metrics Report. All of the hearing quality correlations reported were moderate to strong correlations. The strongest were the negative correlations. For example, sites with higher percentages of holding the disposition hearing prior to the first permanency hearing also had lower percentages of youth still in care at 24 months. In addition, sites with a higher percentage of youth present at court had lower percentages of youth still in care at 24 months. Time from removal to disposition hearing was also related to percentage of youth still in care at 24 months, with sites with longer time to disposition also having more youth still in care at 24 months.
Outcome Variable Hearing Quality Variable Correlation P value% still in care at 24 months Time from removal to disposition
hearing.620 .031
Percentage of non-freed hearings with no parent attorney present
.437 .009
% of cases with disposition hearing before 1st permanency hearing
-.813 .001
% of hearings where the mother was present
-.739 .006
% of hearings where judge discussed efforts to reunify
-.636 026
% of hearings where the child was present
-.756 .004
% of hearings where the judge asked child if they had questions
-.633 .027
Average rating of whether the judge gave the child opportunity to be heard
-.571 .052

CHILD WELFARE COURT IMPROVEMENT PROJECT10
Aging Out/Reaching the Age of MajorityOutcome data were collected from the case file review to identify the percentage of youth that aged out of care. There were both positive and negative correlations. All the relationships reported below are moderate to strong correlations. There was a positive relationship between sites that held disposition on the same day as the first permanency hearings and the percentage of youth aging out of care. There were also several strong negative correlations. For example, sites with higher percentages of judges making oral reasonable efforts findings on the record had lower percentages of youth aging out.
Outcome Variable Hearing Quality Variable Correlation P value% aging out Percent disposition held same
date as the first permanency hearing
.730 .007
% Judge made oral reasonable efforts to effectuate permanency finding
-.637 .026
% Judge made oral reasonable efforts to effectuate permanency (in not freed cases only)
-.798 .002
Breadth of discussion -.661 .019Average length of hearing -.565 .056# of jurists per case -.554, .062
Predictive Analyses (Method 2)
For the predictive analyses, we conducted linear and logistic regression – statistical processes to model relationships between variables – to look at time to permanency and reunification using the case file review data. For example, we looked at whether the number of jurists on a case (independent variable) predicted the time to permanency on cases (dependent or outcome variable). If there is a statistically significant relationship, we can say that number of jurists predicts time to permanency.
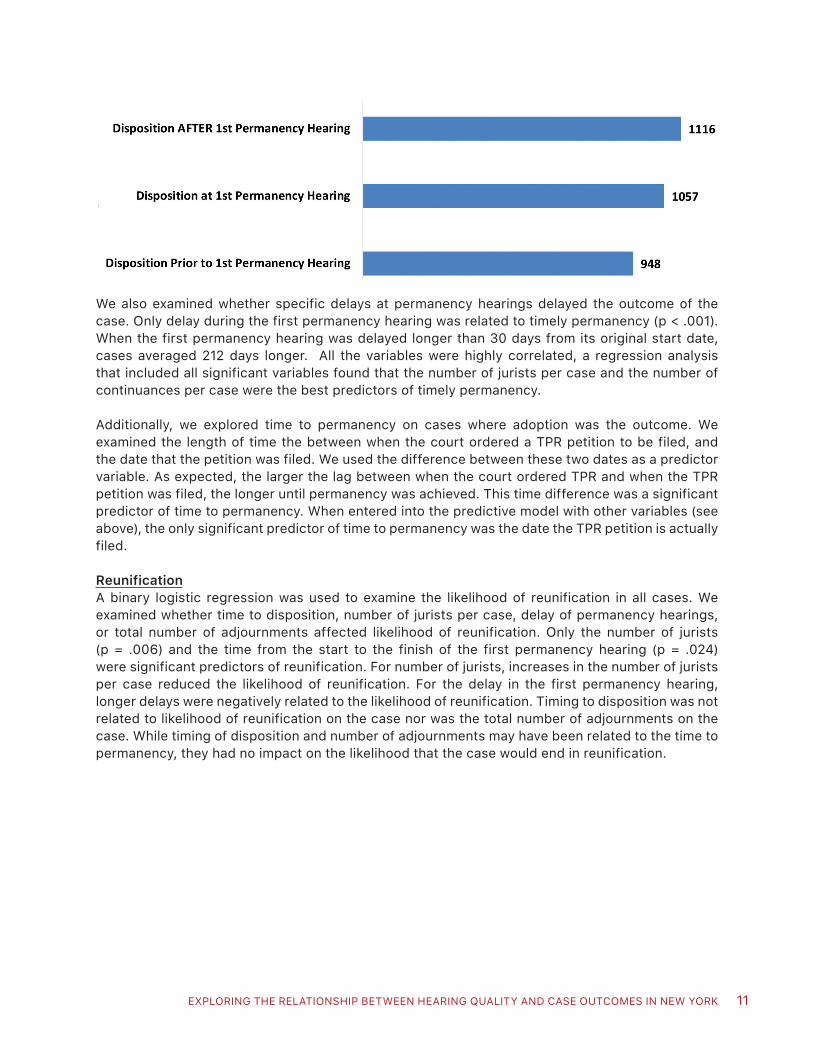
Time to PermanencySeveral factors significantly predicted time to permanency. The total number of adjournments across the life of the case predicted time to permanency (p < .001). Every adjournment on the case increases time to permanency by 120 days. The number of jurists on the case is also a significant predictor of time to permanency (p < .001). Every jurist on the case increases time to permanency by 162 days. In addition, as the time from petition filing to disposition reached increases so does the time to permanency. As illustrated below, the cases that held the disposition before the first permanency hearing achieved permanency 168 days faster (on average).
EXPLORING THE RELATIONSHIP BETWEEN HEARING QUALITY AND CASE OUTCOMES IN NEW YORK 11
We also examined whether specific delays at permanency hearings delayed the outcome of the case. Only delay during the first permanency hearing was related to timely permanency (p < .001). When the first permanency hearing was delayed longer than 30 days from its original start date, cases averaged 212 days longer. All the variables were highly correlated, a regression analysis that included all significant variables found that the number of jurists per case and the number of continuances per case were the best predictors of timely permanency.
Additionally, we explored time to permanency on cases where adoption was the outcome. We examined the length of time the between when the court ordered a TPR petition to be filed, and the date that the petition was filed. We used the difference between these two dates as a predictor variable. As expected, the larger the lag between when the court ordered TPR and when the TPR petition was filed, the longer until permanency was achieved. This time difference was a significant predictor of time to permanency. When entered into the predictive model with other variables (see above), the only significant predictor of time to permanency was the date the TPR petition is actually filed.
ReunificationA binary logistic regression was used to examine the likelihood of reunification in all cases. We examined whether time to disposition, number of jurists per case, delay of permanency hearings, or total number of adjournments affected likelihood of reunification. Only the number of jurists (p = .006) and the time from the start to the finish of the first permanency hearing (p = .024) were significant predictors of reunification. For number of jurists, increases in the number of jurists per case reduced the likelihood of reunification. For the delay in the first permanency hearing, longer delays were negatively related to the likelihood of reunification. Timing to disposition was not related to likelihood of reunification on the case nor was the total number of adjournments on the case. While timing of disposition and number of adjournments may have been related to the time to permanency, they had no impact on the likelihood that the case would end in reunification.
CHILD WELFARE COURT IMPROVEMENT PROJECT12
Summary of Findings Across Methods
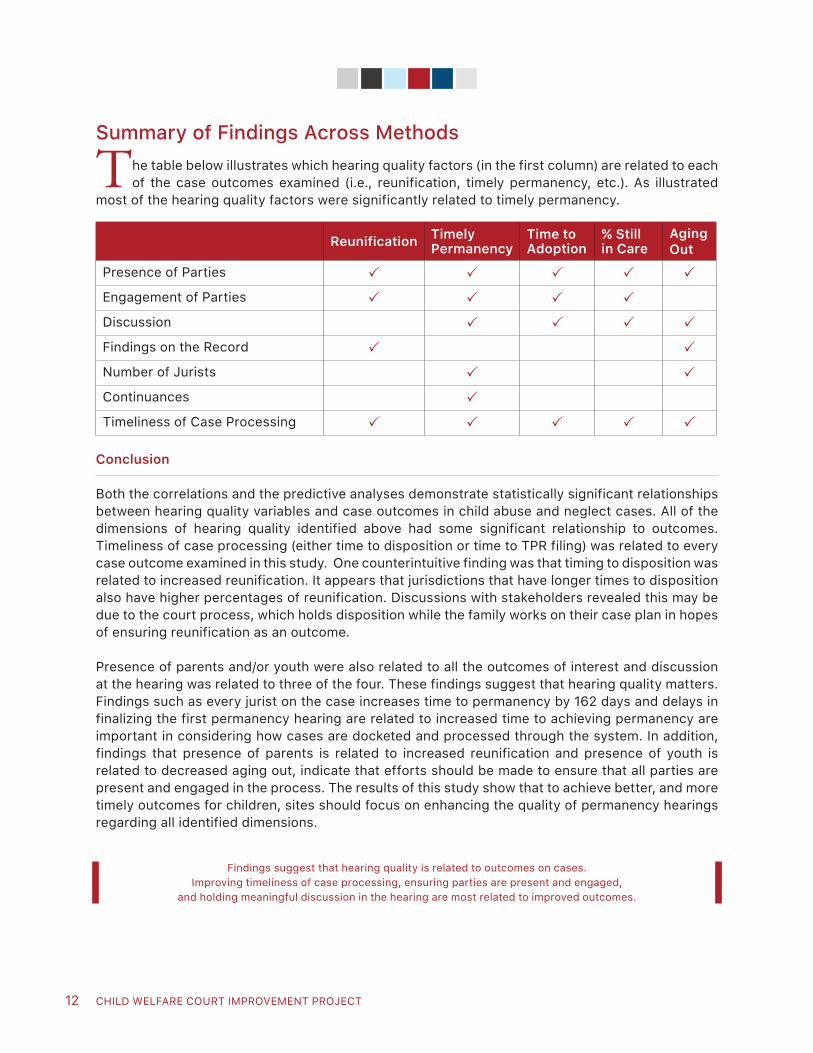
The table below illustrates which hearing quality factors (in the first column) are related to each of the case outcomes examined (i.e., reunification, timely permanency, etc.). As illustrated
most of the hearing quality factors were significantly related to timely permanency.
Reunification Timely Permanency
Time to Adoption
% Still in Care
Aging Out
Presence of Parties
Engagement of Parties
Discussion
Findings on the Record
Number of Jurists
Continuances
Timeliness of Case Processing
Conclusion
Both the correlations and the predictive analyses demonstrate statistically significant relationships between hearing quality variables and case outcomes in child abuse and neglect cases. All of the dimensions of hearing quality identified above had some significant relationship to outcomes. Timeliness of case processing (either time to disposition or time to TPR filing) was related to every case outcome examined in this study. One counterintuitive finding was that timing to disposition was related to increased reunification. It appears that jurisdictions that have longer times to disposition also have higher percentages of reunification. Discussions with stakeholders revealed this may be due to the court process, which holds disposition while the family works on their case plan in hopes of ensuring reunification as an outcome.
Presence of parents and/or youth were also related to all the outcomes of interest and discussion at the hearing was related to three of the four. These findings suggest that hearing quality matters. Findings such as every jurist on the case increases time to permanency by 162 days and delays in finalizing the first permanency hearing are related to increased time to achieving permanency are important in considering how cases are docketed and processed through the system. In addition, findings that presence of parents is related to increased reunification and presence of youth is related to decreased aging out, indicate that efforts should be made to ensure that all parties are present and engaged in the process. The results of this study show that to achieve better, and more timely outcomes for children, sites should focus on enhancing the quality of permanency hearings regarding all identified dimensions.
Findings suggest that hearing quality is related to outcomes on cases. Improving timeliness of case processing, ensuring parties are present and engaged,
and holding meaningful discussion in the hearing are most related to improved outcomes.


Data Savvy Consulting


Child Welfare Court Improvement Project 200 Elizabeth Street Utica, New York 13501