exploring the impact of trolls on activity dynamics in ...papers. · exploring the impact of trolls...
TRANSCRIPT

Exploring the Impact of Trolls on Activity Dynamics inReal-World Collaboration Networks
Philipp KoncarGraz University of Technology
Simon WalkStanford University
[email protected] Helic
Graz University of [email protected]
Markus StrohmaierGESIS & University of [email protected]
ABSTRACTWhen new users join social networking websites, they often formcollaboration ties with existing users, which in turn may result insome level of activity on the site. However, for various reasons,new users often fail to create such ties and their contributions tothe system’s overall activity remain insignificant. For example,on Question and Answering portals, such as the StackExchangenetwork, users collaborate to find the best answers for a given set ofquestions. However, the intentions of new users are highly diverse.While the contributions of most users positively impact the evolutionof a community, other participants might just try to steer discussionsoff-topic or purposely generate discord. To better understand suchmalicious behavior, it is important to model and quantify the impactof such users on the overall activity in collaboration networks. In thispaper we simulate and investigate the influence of trolls—users whointentionally contribute detrimental content—on the total activity ofseveral different StackExchange instances, Semantic MediaWikisand Subreddits. The contributions of this paper are three-fold. First,we simulate activity dynamics in the context of trolls in onlinecollaboration networks. Second, we analyze and quantify the impactof trolls on the levels of activity in these networks. Third, we discussour results and put them into a real-world context.
KeywordsActivity Dynamics, dynamical systems, collaboration networks
1. INTRODUCTIONThe success of online platforms and communities is often deter-
mined by the number of unique active users over an arbitrary timespan. Further, on many successful websites users rarely act on theirown—instead they form connections with other users and develop asense of belonging to a specific community. However, activity (andhence, the number of active users) on such websites is influenced bya plethora of highly diverse extrinsic and intrinsic factors. For exam-ple, whenever new users join, the overall activity of a collaborationnetwork might change depending on those new users’ intentions. In
c©2017 International World Wide Web Conference Committee(IW3C2), published under Creative Commons CC BY 4.0 License.WWW’17 Companion, April 3–7, 2017, Perth, Australia.ACM 978-1-4503-4914-7/17/04.http://dx.doi.org/10.1145/3041021.3051116
.
particular, newly joined trolls—users that consciously contributedetrimental content—could lead to a decline of productive contri-butions in networks. Modeling and quantifying the influence oftrolls and their implications on the overall levels of activity wouldallow website operators (i) to uncover and measure the resilience oftheir collaboration networks against trolls, (ii) estimate the impactof a systematic attack of trolls and (iii) help them to make informeddecisions to sustain a positive evolution of their websites.
In this paper, we make use of dynamical systems on networks—in the form of the Activity Dynamics framework1 [19]—in a novelapplication and context to model and simulate the emergence oftrolls in collaboration networks. This framework is based on theformalism of dynamical systems on networks, consisting of a setof coupled (differential) equations that determine the change inuser participation over time. We conduct a total of two differentexperiments, each of them following a different strategy to uncoverdifferent aspects of trolls in real-world collaboration networks. Tothat end, we define trolls as users that intentionally contribute detri-mental content—represented as negative activity—that needs to becompensated by existing users to prevent declines in productiveactivity. For each experiment we perform a (i) random and (ii) in-formed selection of users that newly joined trolls will connect to andinvestigate the resulting differences in activity and affected users.We apply these experiments on a set of two real-world Questionand Answering datasets from the StackExchange Web portal, twoSemantic MediaWikis, as well as two Subreddits to demonstrate thegeneral applicability of the Activity Dynamics framework.
The contributions of this paper are three-fold. First, we presenta novel application for the Activity Dynamics model to simulate theimpact of trolls on activity dynamics as well as the levels of overallactivity in empirical collaboration networks. Second, we analyzeand quantify the impact of each experiment on the overall activityof the corresponding collaboration network. Third, we discuss theinfluence of trolls on existing users and put our results in a real-worldcontext.
2. RELATED WORKIn general, a dynamical system represents any system that changes
in time with some predefined behavior (i.e., by a set of rules or aset of equations). In particular, dynamical systems (on networks)are often used to define the microscopic behavior of the nodes (i.e.,users) of a network and investigate the macroscopic impact andinfluences. Especially in a non-network context, dynamical systemshave received a lot of interest from scientists and engineers in the
1The code for the presented model is available onhttp://www.github.com/simonwalk/ActivityDynamicsSI
1573
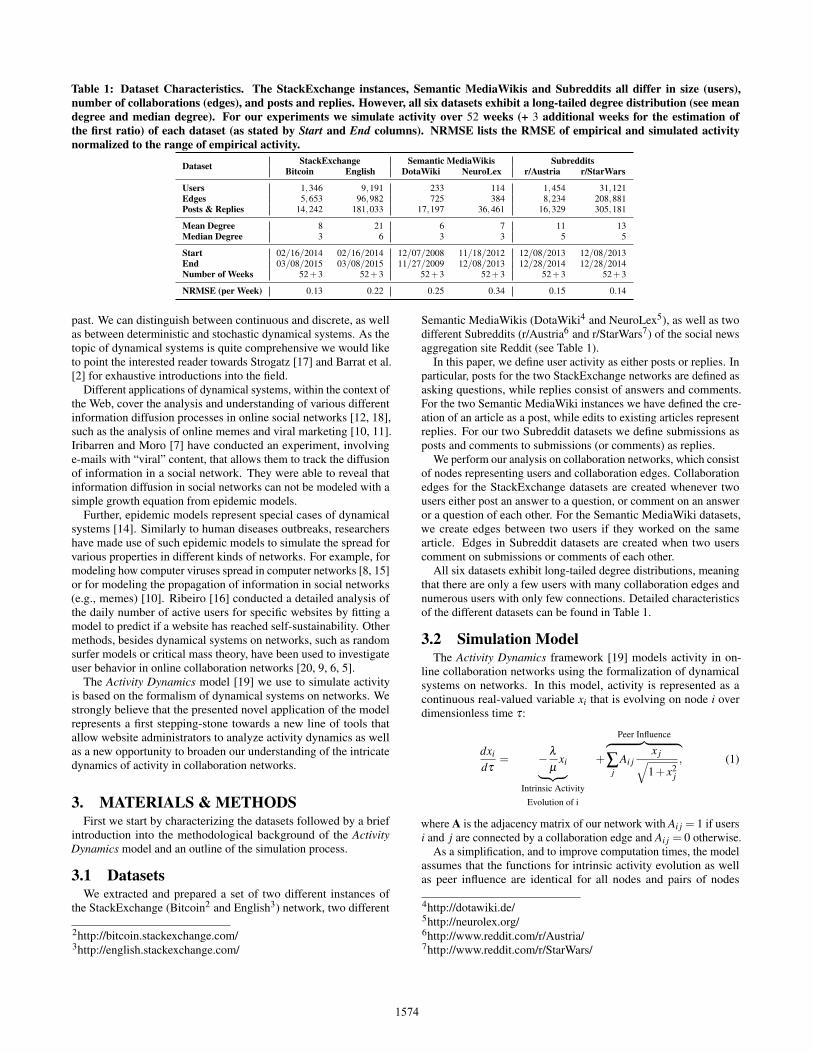
Table 1: Dataset Characteristics. The StackExchange instances, Semantic MediaWikis and Subreddits all differ in size (users),number of collaborations (edges), and posts and replies. However, all six datasets exhibit a long-tailed degree distribution (see meandegree and median degree). For our experiments we simulate activity over 52 weeks (+ 3 additional weeks for the estimation ofthe first ratio) of each dataset (as stated by Start and End columns). NRMSE lists the RMSE of empirical and simulated activitynormalized to the range of empirical activity.
Dataset StackExchange Semantic MediaWikis SubredditsBitcoin English DotaWiki NeuroLex r/Austria r/StarWars
Users 1,346 9,191 233 114 1,454 31,121Edges 5,653 96,982 725 384 8,234 208,881Posts & Replies 14,242 181,033 17,197 36,461 16,329 305,181
Mean Degree 8 21 6 7 11 13Median Degree 3 6 3 3 5 5
Start 02/16/2014 02/16/2014 12/07/2008 11/18/2012 12/08/2013 12/08/2013End 03/08/2015 03/08/2015 11/27/2009 12/08/2013 12/28/2014 12/28/2014Number of Weeks 52+3 52+3 52+3 52+3 52+3 52+3
NRMSE (per Week) 0.13 0.22 0.25 0.34 0.15 0.14
past. We can distinguish between continuous and discrete, as wellas between deterministic and stochastic dynamical systems. As thetopic of dynamical systems is quite comprehensive we would liketo point the interested reader towards Strogatz [17] and Barrat et al.[2] for exhaustive introductions into the field.
Different applications of dynamical systems, within the context ofthe Web, cover the analysis and understanding of various differentinformation diffusion processes in online social networks [12, 18],such as the analysis of online memes and viral marketing [10, 11].Iribarren and Moro [7] have conducted an experiment, involvinge-mails with “viral” content, that allows them to track the diffusionof information in a social network. They were able to reveal thatinformation diffusion in social networks can not be modeled with asimple growth equation from epidemic models.
Further, epidemic models represent special cases of dynamicalsystems [14]. Similarly to human diseases outbreaks, researchershave made use of such epidemic models to simulate the spread forvarious properties in different kinds of networks. For example, formodeling how computer viruses spread in computer networks [8, 15]or for modeling the propagation of information in social networks(e.g., memes) [10]. Ribeiro [16] conducted a detailed analysis ofthe daily number of active users for specific websites by fitting amodel to predict if a website has reached self-sustainability. Othermethods, besides dynamical systems on networks, such as randomsurfer models or critical mass theory, have been used to investigateuser behavior in online collaboration networks [20, 9, 6, 5].
The Activity Dynamics model [19] we use to simulate activityis based on the formalism of dynamical systems on networks. Westrongly believe that the presented novel application of the modelrepresents a first stepping-stone towards a new line of tools thatallow website administrators to analyze activity dynamics as wellas a new opportunity to broaden our understanding of the intricatedynamics of activity in collaboration networks.
3. MATERIALS & METHODSFirst we start by characterizing the datasets followed by a brief
introduction into the methodological background of the ActivityDynamics model and an outline of the simulation process.
3.1 DatasetsWe extracted and prepared a set of two different instances of
the StackExchange (Bitcoin2 and English3) network, two different
2http://bitcoin.stackexchange.com/3http://english.stackexchange.com/
Semantic MediaWikis (DotaWiki4 and NeuroLex5), as well as twodifferent Subreddits (r/Austria6 and r/StarWars7) of the social newsaggregation site Reddit (see Table 1).
In this paper, we define user activity as either posts or replies. Inparticular, posts for the two StackExchange networks are defined asasking questions, while replies consist of answers and comments.For the two Semantic MediaWiki instances we have defined the cre-ation of an article as a post, while edits to existing articles representreplies. For our two Subreddit datasets we define submissions asposts and comments to submissions (or comments) as replies.
We perform our analysis on collaboration networks, which consistof nodes representing users and collaboration edges. Collaborationedges for the StackExchange datasets are created whenever twousers either post an answer to a question, or comment on an answeror a question of each other. For the Semantic MediaWiki datasets,we create edges between two users if they worked on the samearticle. Edges in Subreddit datasets are created when two userscomment on submissions or comments of each other.
All six datasets exhibit long-tailed degree distributions, meaningthat there are only a few users with many collaboration edges andnumerous users with only few connections. Detailed characteristicsof the different datasets can be found in Table 1.
3.2 Simulation ModelThe Activity Dynamics framework [19] models activity in on-
line collaboration networks using the formalization of dynamicalsystems on networks. In this model, activity is represented as acontinuous real-valued variable xi that is evolving on node i overdimensionless time τ:
dxi
dτ= −λ
µxi︸ ︷︷ ︸
Intrinsic ActivityEvolution of i
+
Peer Influence︷ ︸︸ ︷∑
jAi j
x j√1+ x2
j
, (1)
where A is the adjacency matrix of our network with Ai j = 1 if usersi and j are connected by a collaboration edge and Ai j = 0 otherwise.
As a simplification, and to improve computation times, the modelassumes that the functions for intrinsic activity evolution as wellas peer influence are identical for all nodes and pairs of nodes
4http://dotawiki.de/5http://neurolex.org/6http://www.reddit.com/r/Austria/7http://www.reddit.com/r/StarWars/
1574
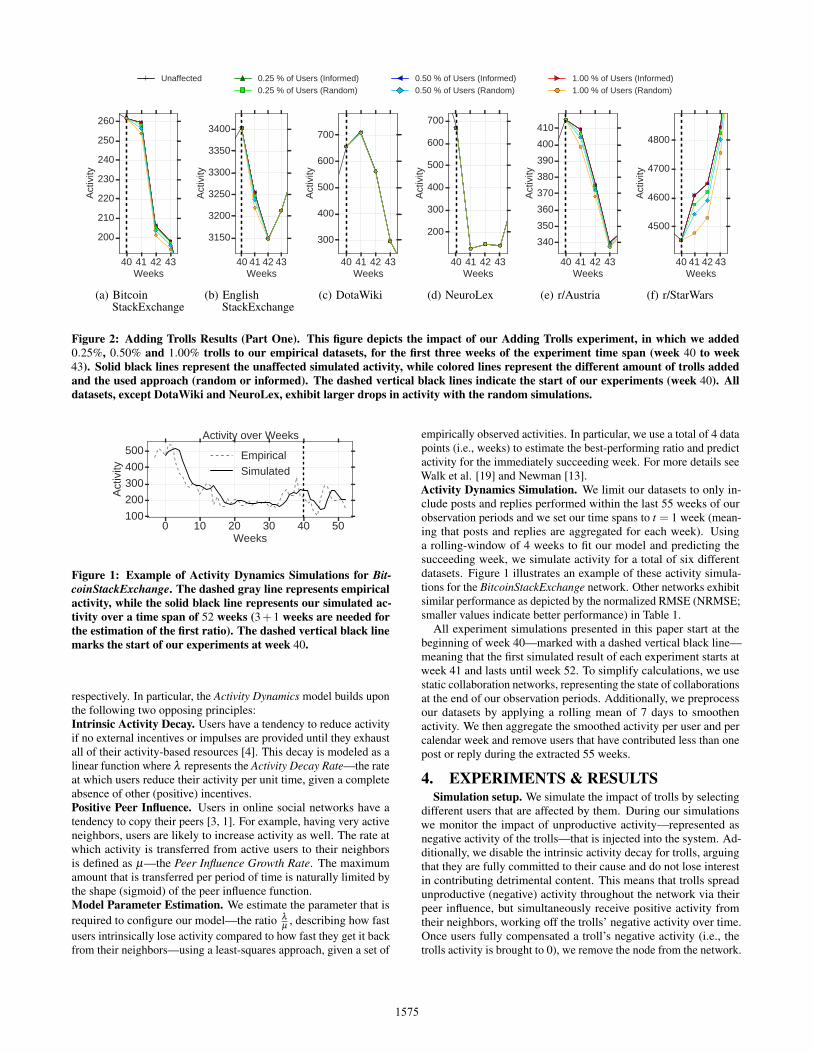
Unaffected 0.25 % of Users (Informed)0.25 % of Users (Random)
0.50 % of Users (Informed)0.50 % of Users (Random)
1.00 % of Users (Informed)1.00 % of Users (Random)
40 41 42 43Weeks
200
210
220
230
240
250
260
Act
ivity
(a) BitcoinStackExchange
40 41 42 43Weeks
3150
3200
3250
3300
3350
3400
Act
ivity
(b) EnglishStackExchange
40 41 42 43Weeks
300
400
500
600
700
Act
ivity
(c) DotaWiki
40 41 42 43Weeks
200
300
400
500
600
700
Act
ivity
(d) NeuroLex
40 41 42 43Weeks
340
350
360
370
380
390
400
410
Act
ivity
(e) r/Austria
40 41 42 43Weeks
4500
4600
4700
4800
Act
ivity
(f) r/StarWars
Figure 2: Adding Trolls Results (Part One). This figure depicts the impact of our Adding Trolls experiment, in which we added0.25%, 0.50% and 1.00% trolls to our empirical datasets, for the first three weeks of the experiment time span (week 40 to week43). Solid black lines represent the unaffected simulated activity, while colored lines represent the different amount of trolls addedand the used approach (random or informed). The dashed vertical black lines indicate the start of our experiments (week 40). Alldatasets, except DotaWiki and NeuroLex, exhibit larger drops in activity with the random simulations.
0 10 20 30 40 50Weeks
100
200
300
400
500
Act
ivity
Activity over Weeks
EmpiricalSimulated
Figure 1: Example of Activity Dynamics Simulations for Bit-coinStackExchange. The dashed gray line represents empiricalactivity, while the solid black line represents our simulated ac-tivity over a time span of 52 weeks (3+1 weeks are needed forthe estimation of the first ratio). The dashed vertical black linemarks the start of our experiments at week 40.
respectively. In particular, the Activity Dynamics model builds uponthe following two opposing principles:Intrinsic Activity Decay. Users have a tendency to reduce activityif no external incentives or impulses are provided until they exhaustall of their activity-based resources [4]. This decay is modeled as alinear function where λ represents the Activity Decay Rate—the rateat which users reduce their activity per unit time, given a completeabsence of other (positive) incentives.Positive Peer Influence. Users in online social networks have atendency to copy their peers [3, 1]. For example, having very activeneighbors, users are likely to increase activity as well. The rate atwhich activity is transferred from active users to their neighborsis defined as µ—the Peer Influence Growth Rate. The maximumamount that is transferred per period of time is naturally limited bythe shape (sigmoid) of the peer influence function.Model Parameter Estimation. We estimate the parameter that isrequired to configure our model—the ratio λ
µ, describing how fast
users intrinsically lose activity compared to how fast they get it backfrom their neighbors—using a least-squares approach, given a set of
empirically observed activities. In particular, we use a total of 4 datapoints (i.e., weeks) to estimate the best-performing ratio and predictactivity for the immediately succeeding week. For more details seeWalk et al. [19] and Newman [13].Activity Dynamics Simulation. We limit our datasets to only in-clude posts and replies performed within the last 55 weeks of ourobservation periods and we set our time spans to t = 1 week (mean-ing that posts and replies are aggregated for each week). Usinga rolling-window of 4 weeks to fit our model and predicting thesucceeding week, we simulate activity for a total of six differentdatasets. Figure 1 illustrates an example of these activity simula-tions for the BitcoinStackExchange network. Other networks exhibitsimilar performance as depicted by the normalized RMSE (NRMSE;smaller values indicate better performance) in Table 1.
All experiment simulations presented in this paper start at thebeginning of week 40—marked with a dashed vertical black line—meaning that the first simulated result of each experiment starts atweek 41 and lasts until week 52. To simplify calculations, we usestatic collaboration networks, representing the state of collaborationsat the end of our observation periods. Additionally, we preprocessour datasets by applying a rolling mean of 7 days to smoothenactivity. We then aggregate the smoothed activity per user and percalendar week and remove users that have contributed less than onepost or reply during the extracted 55 weeks.
4. EXPERIMENTS & RESULTSSimulation setup. We simulate the impact of trolls by selecting
different users that are affected by them. During our simulationswe monitor the impact of unproductive activity—represented asnegative activity of the trolls—that is injected into the system. Ad-ditionally, we disable the intrinsic activity decay for trolls, arguingthat they are fully committed to their cause and do not lose interestin contributing detrimental content. This means that trolls spreadunproductive (negative) activity throughout the network via theirpeer influence, but simultaneously receive positive activity fromtheir neighbors, working off the trolls’ negative activity over time.Once users fully compensated a troll’s negative activity (i.e., thetrolls activity is brought to 0), we remove the node from the network.
1575

Users Affected by Trolls (Informed)Users Affected by Trolls (Random)
Users Infected by Trolls (Informed)Users Infected by Trolls (Random)
Activity at Week 52 (Informed)Activity at Week 52 (Random)
1.0 2.0 3.0 4.0 5.0Added Trolls (%)
0
20
40
60
80
100
Per
cent
age
of U
sers
-300
-200
-100
0
100
200
300
Act
ivity
at W
eek
52
(a) BitcoinStackExchange
1.0 2.0 3.0 4.0 5.0Added Trolls (%)
0
20
40
60
80
100
Per
cent
age
of U
sers
0
100
200
300
400
500
600
Act
ivity
at W
eek
52
(b) DotaWiki
1.0 2.0 3.0 4.0 5.0Added Trolls (%)
0
20
40
60
80
100
Per
cent
age
of U
sers
-400-300-200-1000100200300400500
Act
ivity
at W
eek
52
(c) r/Austria
1.0 2.0 3.0 4.0 5.0Added Trolls (%)
0
20
40
60
80
100
Per
cent
age
of U
sers
05001000150020002500300035004000
Act
ivity
at W
eek
52
(d) EnglishStackExchange
1.0 2.0 3.0 4.0 5.0Added Trolls (%)
0
20
40
60
80
100
Per
cent
age
of U
sers
0
50
100
150
200
250
300
Act
ivity
at W
eek
52
(e) NeuroLex
1.0 2.0 3.0 4.0 5.0Added Trolls (%)
0
20
40
60
80
100
Per
cent
age
of U
sers
12000
13000
14000
15000
16000
17000
18000
Act
ivity
at W
eek
52
(f) r/StarWars
Figure 3: Adding Trolls Results (Part Two). This figure illustrates the number of users affected by trolls (blue lines), the numberof users infected by trolls (red lines), and the overall activity level (green lines) for our Adding Trolls experiment, respectively forthe informed (solid lines) and random (dashed lines) approach. Randomly attaching trolls to users in our empirical networks onlyhas a minor impact on overall levels of activity. After a certain tipping-point, the informed approach managed to collapse the coreof some datasets, dampening or ceasing productive activity. The amount of users affected or infected by trolls is steadily increasingwith higher numbers of trolls in the random approach, whereas these numbers abruptly increase in the informed approach.
We select users that trolls connect to in two different ways: First,we perform a random selection of a given number of users. When-ever we randomly select users, we repeat the experiment 10 timesand report average values as results. Second, we preferentially selecthigh-degree (most collaboration edges) users. No repetitions areperformed for this kind of experiment as the sequence of selectedusers does not change. We call this informed selection of users. Notethat due to our long-tailed degree distributions across all networks,randomly selected users are more likely to have a small number ofcollaboration edges.
We conduct a total of two different experiments where we evaluatethe impact of trolls by investigating the number of users that havebeen affected by trolls (i.e., received unproductive activity as peerinfluence), the number of users that have been infected by trolls (i.e.,stopped contributing productively and started spreading negativeactivity themselves), and the overall activity in the network. Wecollect these values at the end of our simulations at week 52.
4.1 Adding TrollsFor our first experiment, we simulate and measure how different
numbers of trolls affect activity and users in online collaborationnetworks. To that end, we split this experiment into two parts. First,we add a small amount of a total of 0.25%, 0.50%, and 1.00% newusers, which are initialized as trolls, and investigate their impact onthe overall activity levels at the beginning (week 40) and end (week52) of our simulations (see Figure 2). Second, we increase the num-ber of trolls in increments of 0.10% until we reach a maximum of5.00% of existing users. For each iteration, we simulate the relativeimpact of trolls from week 40 to week 52 (see Figure 3). Further,we set each troll’s initial activity to −5 (this can be interpreted as,for example, five detrimental posts) and randomly/informed connectthem to the existing users. The number of trolls’ connections equalsthe mean degree of a given network. That way, we achieve similar
exposure of our trolls across all datasets. Further, we stop our simu-lations if each user in the network has an activity < 1, meaning thatall users spend all of their time coping with the trolls.Results. For four of our six datasets and smaller numbers of trolls(0.25%, 0.50% and 1.00%), activity within the first three weeksis negatively affected when randomly adding trolls (41 to 43; seeFigure 2). On the other hand, when targeting well-connected usersin the informed selection, activity levels are not influenced. Atthe end of our simulations for all datasets and a small number oftrolls (informed and random at week 52; not depicted in Figure 2),all networks are able to recover and exhibit little deviation fromunaffected activity levels.
When incrementally increasing the number of trolls added toa community, we can observe that the informed approach affectsactivity faster than the random approach (cf. Figure 3). For example,the BitcoinStackExchange (Figure 3(a)) network only needed 4.00%of added trolls (informed) to reduce the activity of each user to< 1. However, the number of affected and infected users, at first,increases faster when randomly connecting trolls while activity atthe end of our simulations is only minimally influenced. The otherdatasets follow analogously, except for r/StarWars (Figure 3(f)),where activity steadily decreases.Discussion. Whenever a small number of trolls randomly attachesto users of our networks, we can observe larger drops in activitythan when they target high-degree users (see Figure 2). As well-connected users receive and exercise more peer influence and aretypically more active, they can better compensate the negative influ-ence of the added trolls, rendering their influence negligible. Further,the influence of randomly added trolls only occurs in the immediatevicinity of the start of our experiments and vanishes over time, asusers start to work off, through positive peer influence, the impactof trolls.
1576

Users Affected by Trolls (Informed)Users Affected by Trolls (Random)
Users Infected by Trolls (Informed)Users Infected by Trolls (Random)
Activity at Week 52 (Informed)Activity at Week 52 (Random)
10 100 200 300 400 500Connections per Troll
0
20
40
60
80
100
Per
cent
age
of U
sers
A
-500-400-300-200-1000100200300
Act
ivity
at W
eek
52
(a) BitcoinStackExchange
10 100 200 300 400 500Connections per Troll
0
20
40
60
80
100
Per
cent
age
of U
sers
B
0
100
200
300
400
500
600
Act
ivity
at W
eek
52
(b) DotaWiki
10 100 200 300 400 500Connections per Troll
0
20
40
60
80
100
Per
cent
age
of U
sers
A
-100
0
100
200
300
400
500
Act
ivity
at W
eek
52
(c) r/Austria
10 100 200 300 400 500Connections per Troll
0
20
40
60
80
100
Per
cent
age
of U
sers
A
05001000150020002500300035004000
Act
ivity
at W
eek
52
(d) EnglishStackExchange
10 100 200 300 400 500Connections per Troll
0
20
40
60
80
100
Per
cent
age
of U
sers
B
0
50
100
150
200
250
300
Act
ivity
at W
eek
52
(e) NeuroLex
10 100 200 300 400 500Connections per Troll
0
20
40
60
80
100
Per
cent
age
of U
sers
C
-10000
-5000
0
5000
10000
15000
20000
Act
ivity
at W
eek
52
(f) r/StarWars
Figure 4: Increase Trolls’ Exposure Results. This figure illustrates the number of users affected by trolls (blue lines), the amount ofusers infected by trolls (red lines), and the overall activity level (green lines) for the Increase Trolls’ Exposure experiment, respectivelyfor the informed (solid lines) and random (dashed lines) approach. All networks encounter a more effective impact with the randomapproach, except for BitcoinStackExchange and r/StarWars where informed trolls have a higher impact on activity.
However, there appears to be a tipping point (a phase transition)where high-degree users (e.g., around 4.00% of added trolls forBitcoin StackExchange; see Figure 3(a)) become infected, can’tcompensate for the negative influence of the trolls and start to spreadunproductive activity throughout the whole network. Once thattipping point is reached, the whole network engages in unproductiveactivity. In turn, when trolls connect to random users they arelikely to attach to ones in the network’s periphery, as the degreedistributions of all networks exhibit a long tail, meaning that thereare proportionally large amounts of sparsely connected users. Theseusers typically do not exhibit high activity levels and therefore takelonger to compensate for the negative influence of trolls.
In a real-world context, we interpret this experiment as trollsspamming discussion boards or comments on a weblog. With theintention to inject large amounts of unproductive activity, trolls seekto end all user participation. This way, we can learn how many trollsit would need to affect each user and spread their content throughthe whole network.
4.2 Increasing Trolls’ ExposureIn this experiment we introduce a total of 1.00% of existing users
as trolls and change the amount of users that our trolls connect to.This will allow us to examine to which extent users can resist thedetrimental content of trolls. To that end, we start our experimentswith a total of 10 connections per troll and increase this amount byincrements of 10 until trolls are either connected to a maximum of500 users or to all existing users of the collaboration network. Due tothe size of some of our datasets, we decided to use absolute numbersfor this experiment (e.g., 1.00% of added edges for r/StarWars wouldequal a total of > 2,000 edges). As previously, we set the initialactivity of the trolls to −5 and we stop the simulations as soon aseach user in the network reaches an activity < 1.Results. The results for this experiment are depicted in Figure 4. ForBitcoinStackExchange (Figure 4(a)) the random experiment stoppedat 270 connections per introduced troll, as activity for each user in
the network was smaller than 1. In contrast, trolls in the informedapproach only needed 250 connections to reach this point. Whilethe amount of affected and infected users increased continuouslyfor the random approach, numbers decreased at 70 connections andbegan to increase again after 80 connections (marked with A in Fig-ure 4(a)) during the informed simulations. In contrast, r/Austria (seeFigure 4(c)) only ceased all productive activity with trolls randomlyconnecting to 410 users. For both of our Semantic MediaWikidatasets (Figures 4(b) and 4(e)) we had to abort simulations earlydue to the small number of users to connect trolls to. Here, over-all activity was not affected at the end of simulations even though100% (DotaWiki) and 96.49% (NeuroLex) of users have been af-fected by the trolls. The number of introduced trolls did not manageto increase the number of infected users when increasing connec-tions for both approaches (area marked with B in Figures 4(b) and4(e)). Similarly, the EnglishStackExchange (Figure 4(d)) did notencounter changes in overall activity, but exhibited the same tem-porary decrease of affected users as BitcoinStackexchange around380 connections. In contrast, r/StarWars (Figure 4(f)) was moreeffectively influenced by the informed approach, where only 40connections per troll were needed to end productive activity andinfect almost all existing users within the network (area marked withC in Figure 4(f)). However, in the random approach, users managedto resist the trolls for up to 350 connections after which the usersin the network slowly succumbed and started to reduce productiveactivity. Note that at 500 connections per troll, more than 80% ofall users have been infected but still create productive activity.Discussion. The results of this experiment suggest that users aremore effectively influenced by trolls that are randomly connectingto existing users. Similar to the Adding Trolls experiment, highlyconnected and more active users can better compensate for the im-pact of trolls. However, we again observed a tipping point, at whichthe right number of informed selected users collapses a network.For example, r/StarWars, where the number of added trolls at 1.00%(311) is high enough to infect and collapse the core of the network,
1577

instantly diffusing unproductive activity throughout the whole net-work. Furthermore, high-degree users in BitcoinStackExchange,EnglishStackExchange and r/Austria temporarily managed to reducethe influence of trolls as the number of negatively affected usersdecreases at certain amounts of connections (see areas marked withA in Figure 4). However, once the trolls connect to larger amountsof high-degree users, the number of affected users increases again.It appears as if the number of informed selected users and theiractivity is crucial for the trolls’ ability to affect existing users innetworks. For example, 10 users with high levels of activity at thetime the trolls connect to them can better compensate for the trolls’detrimental content than 10 users with low activity.
To put this in a real-world context, we argue that a small amountof trolls either sends private messages to users in the periphery ofcollaboration networks or posts a new topic that addresses to highlyactive users. This experiment allows us to learn to which extentthe users in networks can be exposed to trolls before they start tocollapse.
5. CONCLUSIONS & FUTURE WORKIn this paper we simulated and investigated the impact of trolls
in online collaboration networks. Our results showed that smallamounts of trolls have a higher impact when connecting to usersin the networks’ periphery, as those users receive and exercise lesspeer influence and cannot compensate for the negative influence oftrolls as well as highly connected and highly active users can. How-ever, larger amounts of trolls influence activity levels more whenperforming informed selection of high-degree users. While theseusers—building the core of the networks—are able to compensatefor the trolls’ influence longer, overall activity is drastically reducedonce high-degree users are infected and start spreading unproductiveactivity themselves. Additionally, there appears to be optimal upperthresholds of users that can be targeted by a single troll to maximizeimpact in the form of affected and infected users. If the number ofthe trolls (or the negative activity) is not large enough and activityis more equally distributed across users, increasing the number oftargeted (i.e., connected to) users might even dampen the impact oftrolls.
For future work we plan on further extending this analysis bycrawling and adapting our model towards simulating empiricallyobserved events of online vandalism (e.g., Wikipedia) and spam(e.g., deleted posts on StackOverflow or Reddit).
We strongly believe that the presented analyses of two differentexperiments regarding trolls represents a very important first step-ping stone towards a new line of tools, methodologies and modelsto simulate the impact of internal and external factors on activitydynamics of collaboration networks.
6. ACKNOWLEDGEMENTSParts of this work were funded by the KONDE project of the
Austrian Federal Ministry of Education.
7. REFERENCES[1] S. Aral and D. Walker. Identifying influential and susceptible
members of social networks. Science, 337(6092):337–341,2012.
[2] A. Barrat, M. Barthelemy, and A. Vespignani. Dynamicalprocesses on complex networks, volume 1. 2008.
[3] N. A. Christakis and J. H. Fowler. The collective dynamics ofsmoking in a large social network. New England journal ofmedicine, 358(21):2249–2258, 2008.
[4] C. Danescu-Niculescu-Mizil, R. West, D. Jurafsky,J. Leskovec, and C. Potts. No country for old members: User
lifecycle and linguistic change in online communities. InProceedings of the 22nd International Conference on WorldWide Web, WWW ’13, pages 307–318, 2013.
[5] F. Geigl, D. Lamprecht, R. Hofmann-Wellenhof, S. Walk,M. Strohmaier, and D. Helic. Random surfers on a webencyclopedia. In Proceedings of the 15th InternationalConference on Knowledge Technologies and Data-drivenBusiness, page 5. ACM, 2015.
[6] F. Geigl, K. Lerman, S. Walk, M. Strohmaier, and D. Helic.Assessing the navigational effects of click biases and linkinsertion on the web. In Proceedings of the 27th ACMConference on Hypertext and Social Media, HT ’16, pages37–47, New York, NY, USA, 2016. ACM.
[7] J. L. Iribarren and E. Moro. Impact of human activity patternson the dynamics of information diffusion. Physical reviewletters, 103(3):038702, 2009.
[8] J. O. Kephart, S. R. White, and D. M. Chess. Computers andepidemiology. Spectrum, IEEE, 30(5):20–26, 1993.
[9] D. Lamprecht, F. Geigl, T. Karas, S. Walk, D. Helic, andM. Strohmaier. Improving recommender system navigabilitythrough diversification: A case study of imdb. In Proceedingsof the 15th International Conference on KnowledgeTechnologies and Data-driven Business, page 21. ACM, 2015.
[10] J. Leskovec, L. A. Adamic, and B. A. Huberman. Thedynamics of viral marketing. ACM Transactions on the Web(TWEB), 1(1):5, 2007.
[11] J. Leskovec, L. Backstrom, and J. Kleinberg. Meme-trackingand the dynamics of the news cycle. In Proceedings of the15th ACM SIGKDD international conference on Knowledgediscovery and data mining, pages 497–506. ACM, 2009.
[12] S. A. Myers, C. Zhu, and J. Leskovec. Information diffusionand external influence in networks. In Proceedings of the 18thACM SIGKDD international conference on Knowledgediscovery and data mining, pages 33–41. ACM, 2012.
[13] M. Newman. Networks: an introduction. Oxford UniversityPress, 2010.
[14] R. Pastor-Satorras, C. Castellano, P. Van Mieghem, andA. Vespignani. Epidemic processes in complex networks.arXiv preprint arXiv:1408.2701, 2014.
[15] R. Pastor-Satorras and A. Vespignani. Evolution and structureof the Internet: A statistical physics approach. CambridgeUniversity Press, 2007.
[16] B. Ribeiro. Modeling and predicting the growth and death ofmembership-based websites. In Proceedings of the 23rdInternational Conference on World Wide Web, WWW ’14,pages 653–664, 2014.
[17] S. H. Strogatz. Nonlinear Dynamics And Chaos: WithApplications To Physics, Biology, Chemistry, And Engineering(Studies in Nonlinearity). Studies in nonlinearity. PerseusBooks Group, 1994.
[18] A. Vespignani. Modelling dynamical processes in complexsocio-technical systems. Nature Physics, 8(1):32–39, 2012.
[19] S. Walk, D. Helic, F. Geigl, and M. Strohmaier. Activitydynamics in collaboration networks. ACM Transactions on theWeb (TWEB), 10(2):11, 2016.
[20] S. Walk and M. Strohmaier. Characterizing and predictingactivity in semantic mediawiki communities. In Proceedingsof the Third International Conference on Semantic WebCollaborative Spaces-Volume 1275, pages 53–67.CEUR-WS.org, 2014.
1578