exploring eye tracking data on source code via dual space
TRANSCRIPT
Exploring Eye Tracking Data on Source Code viaDual Space Analysis
Li Zhang, Jianxin Sun, Cole Peterson, Bonita Sharif, Hongfeng YuDepartment of Computer Science and Engineering
University of Nebraska-Lincoln, Lincoln, Nebraska USA 68588{liz, jianxins, cpeterso, bsharif, yu}@cse.unl.edu
Abstract—Eye tracking is a frequently used technique to collectdata capturing users’ strategies and behaviors in processinginformation. Understanding how programmers navigate througha large number of classes and methods to find bugs is importantto educators and practitioners in software engineering. However,the eye tracking data collected on realistic codebases is massivecompared to traditional eye tracking data on one static page. Thesame content may appear in different areas on the screen withusers scrolling in an Integrated Development Environment (IDE).Hierarchically structured content and fluid method positioncompose the two major challenges for visualization. We presenta dual-space analysis approach to explore eye tracking databy leveraging existing software visualizations and a new graphembedding visualization. We use the graph embedding techniqueto quantify the distance between two arbitrary methods, whichoffers a more accurate visualization of distance with respect to theinherent relations, compared with the direct software structureand the call graph. The visualization offers both naturalness andreadability showing time-varying eye movement data in boththe content space and the embedded space, and provides newdiscoveries in developers’ eye tracking behaviors.
Index Terms—visualization, eye tracking, developer classifica-tion, content space, embedded space
I. INTRODUCTION
The cognitive process (e.g., code reading and debugging)of a software developer is often related to multiple factorsin software engineering (SE) such as programmer efficiency,hierarchically organized software structures, relations amongsource code, and integrated development environments (IDEs).The knowledge of such processes can lead to many implica-tions and benefits. For example, knowledge of efficient codereading processes can be explicitly exposed to students in theirSE learning [1]–[3]. Knowing programmers’ code viewingefficiency can also help project managers assign workload [3]and intervene when they see patterns of stress or evaluate taskdifficulties [4].
To understand such a cognitive process, SE researchers useeye tracking devices to keep track of the psycho-physiologicalstates while performing debugging tasks using measurementssuch as pupil dilation, fixation duration, and saccade fre-quency [3]–[6]. By examining the time-varying data of par-ticipants’ visual attention to particular content or IDE paneson a screen, researchers seek to identify patterns from thehigh-dimensional data across time, content, or screen.
Compared with the conventional analytics of eye trackingdata [7], [8], the increasing complexity of software introduces
unique challenges in exploring eye tracking data to identifyand compare individual user patterns. A software systemis typically organized in a hierarchical tree structure (e.g.,the organization of classes and methods and the dependencyrelations between these elements). In addition, the systemis associated with a call graph where each node representsa method and each link represents a caller/callee relation.Given a content space containing a software tree structure andan associated call graph, different users may have differentstrategies to explore this space for code reading or debuggingtasks. Also, note that using iTrace [5], [9] to collect eyetracking data during bug fixes increases the complexity ofthe visualization since we are no longer limited to short codesnippets. A common strategy is to directly visualize the soft-ware tree structure [10], [11], and/or the call graph [12], andsuperimpose eye trajectories which can intuitively display thesequence of user focus in the content space and qualitativelycompare trajectories. However, these existing visualizationtechniques cannot qualitatively reveal the distance amongtrajectories as the inherent semantic information of a softwaresystem may not be appropriately displayed in the visualization.
In this paper, we present a new dual-space approach toenhancing the analysis of eye tracking data generated duringusers’ viewing or debugging a software system. First, wedirectly visualize the content space by simultaneously depict-ing the hierarchical structure, the call graph, and user eyetrajectories for a software system. We leverage a radial layoutand an edge bundling algorithm to effectively depress visualclutter. The visualization in the content space allows users tointuitively examine the interplay between user trajectories, thesoftware hierarchy, and the call relations. Second, we createan embedded space by transforming the call graph and/orthe tree structure via graph embedding. The visualizationof user trajectories in the embedded space allows us toquantitatively measure distances among trajectories. We linkthe visualizations in these two spaces and use our approachwith an eye tracking dataset of debugging processes [13].Our approach facilitates the study of different user behaviorsthrough different views and reveals some discoveries that havenot been identified in existing work.
II. RELATED WORK
Though many studies consider software reviewing or de-bugging using eye tracking data, they do not directly consider

the graph structure in contents [3], [4], [14]–[16]. As seen inthe work of Suliman et al. [17], a graph is used to modelthe communication relationships between software developersreading each other’s files and is what researchers try to learnfrom eye tracking data. Our work focuses on understandingand evaluating reading and navigation patterns through pro-gram files and how such patterns reflect, interact with, anddeviate from the underlying graphical software pattern definedby its tree structure and call relations. As our work spans twodomains, i.e, eye tracking and software domain, we review thecorresponding studies.
A. Eye Tracking Analytics
Fixations and saccades are two fundamental metrics fordescribing behaviors of eye movement. A complete sequenceof fixations and saccades is a scanpath [6]. There are twomajor visualization tracks, direct visualization, and statisticalanalysis. The major difference is whether it represents andvisualizes individual features (e.g., location, duration, andgaze) directly or use summary statistics such as saccadefrequency to abstract individual features for statistical analysis.Area of interest (AOI) is an important feature to capturereaders’ comprehension patterns. Formally, an AOI can be anyuser-defined area that is quantified by fixation and saccadedata. How researchers define their AOI may not be explicitand can be very different [3], [15].
1) Direct visualization: Direct visualizations put fixationcircles, color, and/or saccade lines directly over the contentand give a user-friendly overview of gaze patterns. It is widelyused in various areas not limited to software [6], such asapplication stores [18], info-graphics design [19]. The content-focus overlay plot [1], [3], [14], [20] exploits the uniformitybetween contents and screen, i.e, that contents are static andfixed to a specific location on the paper, screen or objects. Itis straightforward that the distance in contents can be directlyrepresented by their position on a page or screen. In this plot,we cannot infer about user viewing pattern along time. Wecannot distinguish from a user gazing less frequently for alonger duration from another gazing more frequently but fora shorter time.
A timeline flow visualization can remedy this deficiency.Sharif et al. use a line and time coordinate to plot the fixationpoints in time [1]. This visualization gives the false impressionthat there is no meaningful reading time because it showsonly fixation points rather than duration specific to each line.To overcome this shortness, Clark and Sharif introduced theskyline visualization, which shows a user’s duration of fixationand saccade in time [14]. This visualization gives a clearcorrespondence between the focus in content with the lengthof horizontal line signifying duration corresponding to thatcontent. This work follows the direction pointed by Clarkand Sharif and studies scan patterns in reference to controlstructures and programs with greater length and size.
2) Statistical analysis: The statistical analysis directionconsiders patterns in the features of interest to explain thevariance between groups who succeed and groups who failed
the tasks. Typical research questions focus on whether codefixation time, focus on the specific type of code (e.g. logical,declaration, and loops) [15], behaviors such as switching win-dows, or using particular IDE panes (e.g. variable, console, orcode) [3] or regression rate [21] makes a significant predictorof debugging success. While these studies yield importantinsights as to what features characterize efficient code readers,it is insufficient to treat coding as natural text. If we comparemethod declarations and syntax to vocabularies of sourcecode, the structure is the grammar of source code and isalso essential for code comprehension. Since it is difficultto quantify structure statistically, we adopt a visualizationmethod to examine how different participants interact with thestructure of source code.
B. Software Visualization
Researchers propose many metaphors to visualize hierar-chical or tree software structures. For example, Andrian etal. [10] present a 3D representation for software structures.Wettel et al. [11] visualize large-scale software systems asa city. Holten presents an aesthetic visualization to overcomethe current issues associated with clustering in the rendering oflarge complex graphs [12]. A software program with classes,dependencies, and call relations can be represented as a graphwith inclusion relations and adjacency relations. In relatedwork [22], Mabakane designed a visualization of the callgraph to help identify performance bottlenecks in the executionof a parallel program. A limitation of these visualizationapproaches is that the distance between nodes, which areusually perceived as the length of the curve connecting thenodes, are mostly suggestive of connectivity. In other words,one longer curve does not mean that the distance betweena pair of nodes is longer than another pair of nodes with ashorter curve. The requirement of distance measure in oursoftware visualization drives for a more meaningful graphrepresentation, where the distance between the nodes actuallycaptures their semantic distance in the software systems.
III. APPROACH
A. Design Requirements
The requirements from the domain experts on analyzing eyetracking data on source code mostly include:
R1. Identify user behavior according to their scanpath.Visualizations can help qualitatively understand how usersread and navigate through the content space of both hierar-chical and adjacent relations to locate bugs. More specifically,what patterns in visualization can reveal the success or failureof bug locating, and any general differences between thosewho located the bugs and those who did not.
R2. Interpret distance in both intuitive and meaningfulways. The semantic distance between one method and anothermethod is not as straightforward as the Euclidean distancebetween two points in a 2D plane. However, the visualizationshould represent and layout methods in a meaningful way thatpreserves the distances.
R3. Support deeper analysis by visualizing the timedimension of scanning. Ideally, the visualization should inte-grate multiple dimensions in addition to the content dimension:the time dimension indicating sequences of fixations or sac-cades, the duration of fixations, and/or the repetitive patternof back and forth reading. A reasonable assumption here isthat if a method ma calls another method mb which furthercalls mc, then a sequential saccade pattern of ma, mb, andmc may be more effective than a pattern of mb, ma, and mc.The synthetic visualization with local visiting relation detailscan be extended to study the transition of pattern in time withsimilarly structured relations.
B. Design Challenges
We identify four major challenges in the existing visual-ization approaches that lead to our current research efforts:the absence of content structure, limited content space, lackof meaningful distance representation in visualization, andseparation or omission of time data.
Existing literature highlighted the general trend for thestimulus material or object using heatmap. The mapping ofcolor directly onto the focused content is straightforward andworks effectively when the material is a static web page or aninformatics design on a poster. However, if the content spacebecomes much larger where there are tens or hundreds of textfiles and thousands of lines per file, this direct mapping willfall apart as the information becomes increasingly cluttered.
Another challenge with reading code is that the content hasits own structures. Typically, they follow a tree structure inorganizing the file systems and a graphical structure betweenthe method calls. The visualization of human’s reading focuson larger and structured contents is not fully explored yet.
For traditional visualization of contents, given that the AOIsare static or fixed to its screen or physical location, a distancemeasure between AOIs corresponds directly to their physicaldistances. However, for a software system rendered in an IDE,the distance measure between a method ma in a file fb andanother method mc in a file fd is not intuitive. Additionally,suppose we have ma and mb both in a class cc and supposethey are k lines apart from each other; however, ma callsmethod mb at some point, we can no longer simply use kas the sole measure of the distance between ma and mb. Weneed a better distance measure capturing the cost of readingin hierarchically structured content space.
Finally, the heatmap based visualization failed to suggestthe sequence of focus which can be important in readingcode. Readers who located an intermediate method to the bugshould be expected to locate the bug more easily than thosewho did not. We can say safely that if a participant foundthe intermediate bug location (on the bug path) but failed tolocate the bug, he/she may not be as experienced. However,if a participant did not find any relevant methods, we are notso sure about his/her chances of locating the bug. Sequenceslike these suggest the reading efficiency, logical reasoning,understanding of the structure and code, and familiarity withthe IDE.
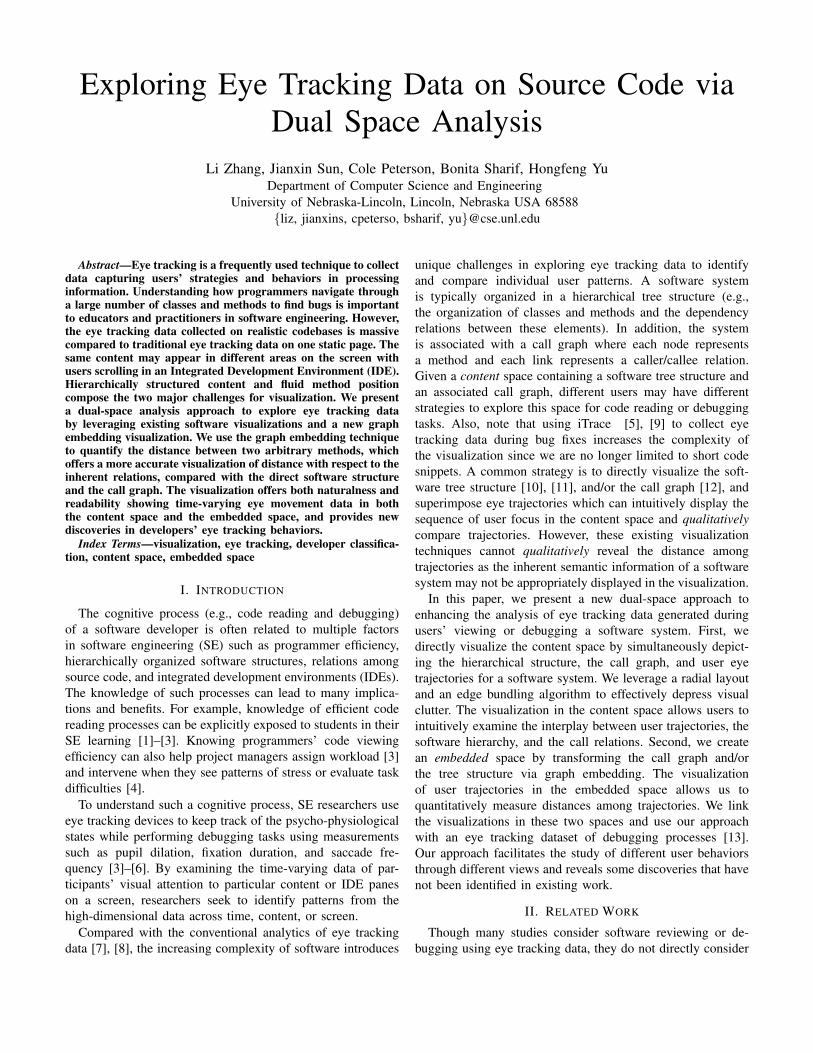
Fig. 1. Overview of our approach
C. Our Design
Figure 1 shows an overview of our approach. In this work,we study eye tracking data for understanding user behaviorsduring their code reading and debugging. We take the eyetracking data and the software program as the inputs to derivethe trajectory data, the hierarchical tree structure, and the callgraph. The dataset is visualized using two linked views ina content space and an embedded space to reveal differentpatterns of user behaviors.
1) Data collection and processing: We used the Tobii X60eye tracker to record 22 participants debugging 3 differenttasks, rated as either easy or difficult. Among the participants,12 are labeled professional (i.e., the participants 1-12), and10 are labeled novice (i.e., the participants 22-31). For eachparticipant, the eye tracking data records time, duration, line,method, the file name of focus, pupil dilation, and coordinatesin the screen for each task. Notice that the time interval be-tween recordings is not equal and the number of observationsdiffers across participants based on their reading. In this paper,we extract the user trajectories from the eye tracking data. Onetrajectory of a user consists of the sequence of methods thatthe user read, and the time and the duration that the user spenton a method.
We extract the hierarchical tree structure and the callgraph of the software system using java-callgraph, an opensource static analysis tool [23]. The tree structure is impliedin the name of methods. For example, the method nameroot.net.sf.jabref.EntryTable.addSelectionListener() suggeststhat the class EntryTable is in the package root.net.sf.jabrefand the method is addSelectionListener(). The call graphindicates the caller/callee relations among the methods. Withthe hierarchical tree and call graph combined, we are thenready to visualize users’ trajectories on the software structure.
2) Content space analysis: We leverage different schemesto visualize the tree structure, the call graph, and the usertrajectories and reveal participants’ efficiency of reading inthe content space. We choose the D3 library [24] in ourimplementation.
First, we use a common tree visualization method, theradial layout [12], to visualize the hierarchical structure wheremethods are visualized as leaves (rectangles along the inner
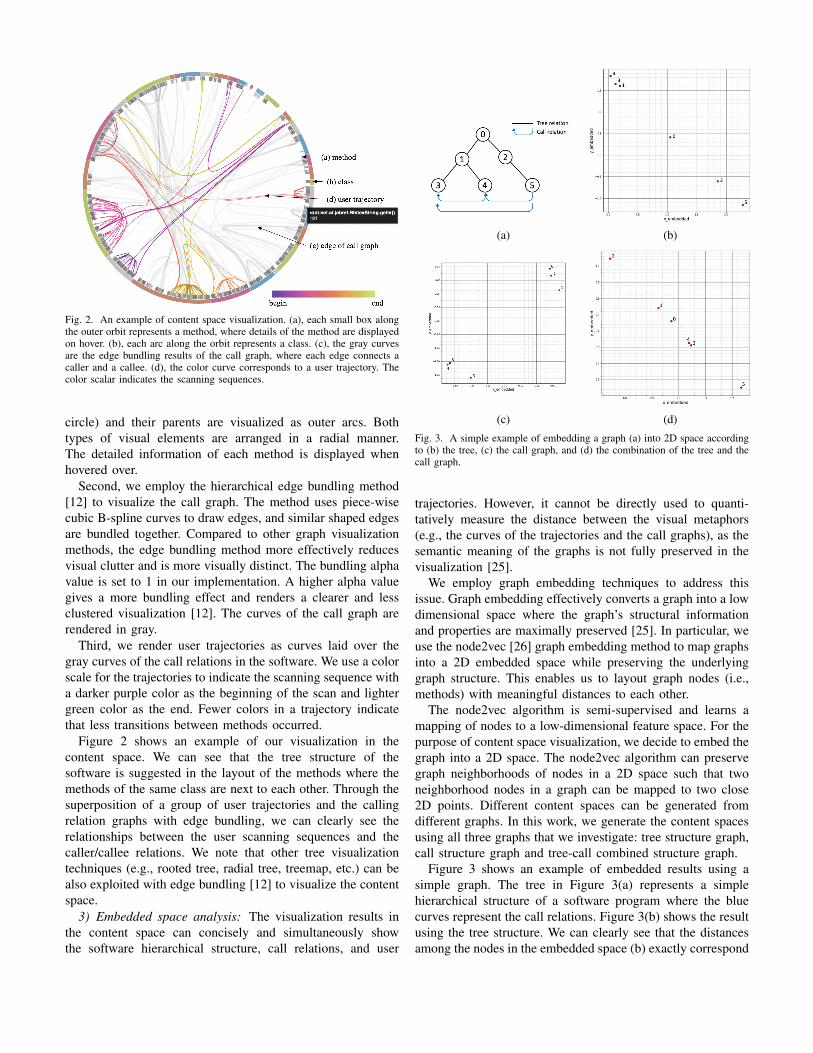
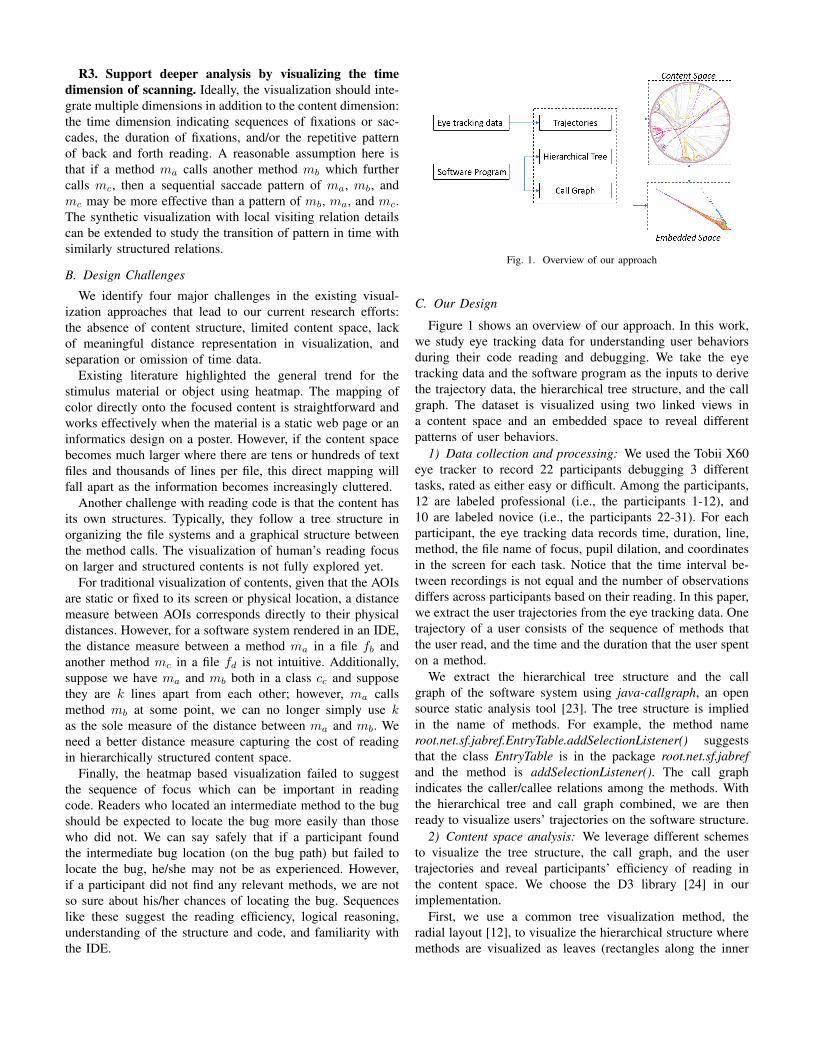
Fig. 2. An example of content space visualization. (a), each small box alongthe outer orbit represents a method, where details of the method are displayedon hover. (b), each arc along the orbit represents a class. (c), the gray curvesare the edge bundling results of the call graph, where each edge connects acaller and a callee. (d), the color curve corresponds to a user trajectory. Thecolor scalar indicates the scanning sequences.
circle) and their parents are visualized as outer arcs. Bothtypes of visual elements are arranged in a radial manner.The detailed information of each method is displayed whenhovered over.
Second, we employ the hierarchical edge bundling method[12] to visualize the call graph. The method uses piece-wisecubic B-spline curves to draw edges, and similar shaped edgesare bundled together. Compared to other graph visualizationmethods, the edge bundling method more effectively reducesvisual clutter and is more visually distinct. The bundling alphavalue is set to 1 in our implementation. A higher alpha valuegives a more bundling effect and renders a clearer and lessclustered visualization [12]. The curves of the call graph arerendered in gray.
Third, we render user trajectories as curves laid over thegray curves of the call relations in the software. We use a colorscale for the trajectories to indicate the scanning sequence witha darker purple color as the beginning of the scan and lightergreen color as the end. Fewer colors in a trajectory indicatethat less transitions between methods occurred.
Figure 2 shows an example of our visualization in thecontent space. We can see that the tree structure of thesoftware is suggested in the layout of the methods where themethods of the same class are next to each other. Through thesuperposition of a group of user trajectories and the callingrelation graphs with edge bundling, we can clearly see therelationships between the user scanning sequences and thecaller/callee relations. We note that other tree visualizationtechniques (e.g., rooted tree, radial tree, treemap, etc.) can bealso exploited with edge bundling [12] to visualize the contentspace.
3) Embedded space analysis: The visualization results inthe content space can concisely and simultaneously showthe software hierarchical structure, call relations, and user
(a) (b)
(c) (d)
Fig. 3. A simple example of embedding a graph (a) into 2D space accordingto (b) the tree, (c) the call graph, and (d) the combination of the tree and thecall graph.
trajectories. However, it cannot be directly used to quanti-tatively measure the distance between the visual metaphors(e.g., the curves of the trajectories and the call graphs), as thesemantic meaning of the graphs is not fully preserved in thevisualization [25].
We employ graph embedding techniques to address thisissue. Graph embedding effectively converts a graph into a lowdimensional space where the graph’s structural informationand properties are maximally preserved [25]. In particular, weuse the node2vec [26] graph embedding method to map graphsinto a 2D embedded space while preserving the underlyinggraph structure. This enables us to layout graph nodes (i.e.,methods) with meaningful distances to each other.
The node2vec algorithm is semi-supervised and learns amapping of nodes to a low-dimensional feature space. For thepurpose of content space visualization, we decide to embed thegraph into a 2D space. The node2vec algorithm can preservegraph neighborhoods of nodes in a 2D space such that twoneighborhood nodes in a graph can be mapped to two close2D points. Different content spaces can be generated fromdifferent graphs. In this work, we generate the content spacesusing all three graphs that we investigate: tree structure graph,call structure graph and tree-call combined structure graph.
Figure 3 shows an example of embedded results using asimple graph. The tree in Figure 3(a) represents a simplehierarchical structure of a software program where the bluecurves represent the call relations. Figure 3(b) shows the resultusing the tree structure. We can clearly see that the distancesamong the nodes in the embedded space (b) exactly correspond

(a) (b)
Fig. 4. The visualization results of the software structure, the call graph,and the trajectory for the participants 3 (a) and 6 (b) in the content space.Participant 3 scans the methods in a local tree structure, as the ones in the bluecircles, while participant 6 read the code frequently along the call relations,as the ones in the green circles. The red circles highlight a possible AOIthat is shared by 3 and 6 and is also across most participants (5 out of 7)who successfully fixed the bug. The name of the intermediate bug location issetValues () in the class GroupsPrefTab.
to the tree structure (a). For example, the nodes 3 and 4 arethe children of the node 1, and they are embedded closely in(b). Similarly, the nodes 2 and 5 are close to each other in(b), while the node 0 is roughly at the center of the space.Figure 3(c) shows the result using the call graph, where wecan clearly see the nodes are distributed according to theircall relations (e.g., the group formed by the nodes 3, 4, and5). In Figure 3(d), the placement of the nodes is generatedusing the combined graph of the tree relations and the callrelations. For example, the nodes 3 and 4 are close to eachother as they have the same parent as well as the call relation.The node 5 becomes farther away from 2 compared to theresults in Figure 3(b). This is because the node 5 has morecall relations to 3 and 4 even though 5 is the child of 2.
After we generate an embedded graph, we overlay user tra-jectories on the embedded graph and also use juxtaposition forcomparison between different users. The user trajectories arecolored using the same scale in the content space visualization.In this way, we can examine if a user would scan the codeaccording to the software structure and/or the call relations.
IV. RESULTS
We documented participants solutions for the bugs theylocated and asked about their confidence levels, comments,and evaluations of task difficulty. We also further evaluatedeach solution to be either acceptable or not. For example, inTask 2, we have valid data from 20 participants, 5 out of11 professional participants successfully fixed the bug and 3out of 9 novice participants also fixed the bug. We use thisevaluation as supplemental information as well as ground truthfor our analysis.
A. Content Space Results
The radial visualization presents an intuitive analysis ofthe participants’ scanning pattern and whether they followthe tree structure and/or call relations. For example, Figure 4shows the visualization results for participants 3 and 6. We can
see that participant 3 mostly follows the tree structure whenreading methods in the same class, as represented by the moreaggregated local curves (e.g., the ones in the blue circles inFigure 4 (a)). Alternatively, the participant 6 navigates throughthe code seemingly following the call relations, as shown inthe curves in the green circles in Figure 4 (b), which appearto overlap with the underlying software relations in grey lines.Such uncertainty can be further examined with the embeddedcall space (see Section IV-B1).
We can further identify a possible AOI, corresponding tothe method 228 GroupsPrefTab.setValues (), in the red circlesin both Figure 4 (a) and (b). Figure 5 gives the trajectoriesfor all 20 participants for task 2 [13]. Examining across theparticipants in Figure 5, we can find that participants 3, 4, 5,6, 11, 25, 29, and 30 all show this pattern in their trajectoriesof which 80% of these participants who are professionalssuccessfully fixed bugs (the participant 11 did not fix the bug).It is also interesting to observe that the participants 29 and30 did not fix the bug even when they are in this AOI. Analternative interpretation is that getting to an intermediate buglocation will give professionals more of a guarantee to findingthe final bug location than novice participants. The participants29 and 11 shared almost identical scanning patterns and mayhave failed the task because too much focus was put onthe local files and did not relate to the bug problem well.In addition, it is difficult to distinguish the participants 5and 30 because they share almost the same pattern in thisvisualization.
B. Embedded Space Results
1) Interpretation of embedded spaces: We embed the soft-ware tree structure, the call graph, and the combined graph ofthe tree and call relations to understand how the embeddingalgorithm interprets the distance of the software methods.
To understand the effect of different graphs (i.e., the tree,the call graph, and the combined graph) in graph embedding,we first highlight the points of two methods getText () andsetText () in red in Figure 6. Similar to the get and set methodsin most programs, these two methods are also defined in thesame class and do not have direct call relations between them.Intuitively, the distance between them should not be far as theyare semantically related even though there is no call relation.The distance shown in the embedded space of the tree graph isindeed close, as shown in Figure 6 (a). However, the distancebetween the two becomes very far in the embedded space ofthe call graph, as shown in Figure 6 (b). Figure 6 (c) showsa medium distance in the embedded space of the combinedgraph of tree and call relations.
Figure 7 offers a more complex example with a method call-ing another both directly and indirectly where more relationsimply a closer distance and a shorter curve. For example, themethod 175 calls 163 directly and also indirectly through 171.The method 171 calls 163 only directly. Therefore, the method175 appears closer to 163 than 171. For the method 159, sinceit calls 163 only indirectly, it shows as the most distant from163 among the three methods. The embedded call graph gives

Fig. 5. The visualization results of the software structure, the call graph, and the trajectory for all participants in the content space. The bottom color scaleis used for all participants, indicating starting time in deep purple and ending time in light green in the sequence of scanning. Our survey-based evaluationsuggests that the participants 3, 4, 5, 6, 9, 25, 27, and 31 have successfully located and fixed the bug.

(a) tree (b) call (c) combined
Fig. 6. The two methods getText () and setText () are in the same FieldEditorclass, and are colored in red. They are plotted in the tree graph (a), the callgraph (b), and the combined graph (c).
Fig. 7. An example illustrating more complex call relations. The rank ofdistance to the method 163 from smallest to largest is 175, 171, and 159.This is because the method 175 features both direct and indirect calls to 163,and the methods 171 and 159 feature a direct call and a indirect call to 163,respectively.
a distance according to two principles implied here: 1) morepaths of calling means a closer distance; and 2) direct callingis closer in distance than indirect calling.
To demonstrate how different graph visualization resultscorrespond to each other, we first circle eight groups ofmethods, where each group is in the same subtree, as shown inFigure 8 (a). The subtrees may be at different levels of depth.Methods in the same subtree stay closely together as shownin Figure 8 (b). Figure 9 shows an example of embedding thecalling graph. Two subgraphs 9 (a) and 9 (b) are plotted into9 (c). The methods with close calling relations stays together(within a or b) and those with distant calling relations (betweena and b) are further away from each other.
Figure 10 illustrates further with the participant 6’s trajecto-ries. For the listed methods in the figure, the user’s trajectoriesdo not seem to be more effective in the call graph than those inthe tree graph. However, if we examine the distance betweenthe methods 67 and 72 and between the methods 239 and 253,the distance given by the tree graph becomes much shorter.Therefore, the participant 6 mainly follows the tree structurewhile visiting these methods. The result provides a more clearindication, compared with Figure 4(b).
2) General patterns: This section presents the results basedon the general trends observed visually among all participants.The first question we ask is whether or not any trajectoriesfollow the call graph more dominantly. Figure 11 shows thecomparison results of the participants 1 and 11 using thedifferent embedded graphs. We can see the busy and longlines in both Figure 11 (a) and Figure 11 (c), implying thatneither the call nor tree relations govern the participant 1’sreading. By comparing Figure 11 (b) and (d), we can see thatparticipant 11 paid more attention to the call relations than
(a) radial (b) tree
Fig. 8. The visualization of embedded tree graph in correspondence with theradial layout. Eight sample areas from (a) are selected. The methods withina circle represent the leaf nodes in the same subtree. The methods in a circlein (a) belong in the cluster circled in the same color in (b). These methodsare also nearest in (b). Note that the two blue clusters of methods in (a)share the same depth and are one level deeper than the methods in the redand yellow circles, which causes the blue circled methods are distinct in (b).Similarly, the red and yellow circled methods share the same depth, but theyellow circled methods are more than twice the size of the other circled ones.The embedding algorithm can also capture the structure of the subtree by itssize and structure, and distinguish the yellow and red circled methods in (b).
the tree relations. In addition, the participants 1 and 11’s calldistances are average when compared across all participantsas shown in Figure 13. We identify 7 participants featuringthis pattern. Considering both the tree and call relations asshown in Figure 11 (e) and (f), we can observe seemingly moredistant lines in the participant 1. We no longer include analysisof the combined graph in this subsection as the plottingresembles a straight line and causes serious overlapping ofnodes and trajectories.
Figure 12 and Figure 13 show the trajectories from all20 participants in the embedded tree graph and call graph,respectively. Based on the visual comparison across all thetrajectories, we summarized a few general patterns as shownin Figure 14. As shown in Figure 12, the tree graph inthe embedded space generally depicts a line-shaped plot ofblue points. We can identify a pattern c that approximatelyrepresents the middle cluster along the line-shaped plot. Theseare the methods at the same depth level and with similarcommunity features. Using this pattern c as the cutting point,we can further identify the patterns lt and rt that characterizethe left and right position of methods along the line-shapedplot, respectively. For the call graph as shown in Figure 13,the patterns show up are l1, which represents a group ofsimilar paths to the AOI (i.e, the method 228) and its closeneighborhood methods (e.g., 229 and 230 in Figure 8(a)). Theother ends of the paths are close the method 197.
Using the flag patterns in Figure 14, we characterize eachparticipant by whether they follow the patterns in Table I.Note that rt is not included in Table I, as we found that rtis not noticeably helpful to differentiate the participants. InTable I the distance column, long, medium, and short representthe participant’s trajectories in the tree graph in Figure 12.Considering L as the longest distance in the distances betweenany pair of methods, we categorize a trajectory accordingto the longest distance x among methods traversed. The

TABLE IIDENTIFYING GROUPS WITH FLAG PATTERNS. THE PARTICIPANTS MARKED WITH * HAVE SUCCESSFULLY LOCATED AND FIXED THE BUG.
Distance long medium shortParticipant 1 2 7 25∗ 3∗ 4∗ 5∗ 6∗ 10 23 24 26 30 8 9∗ 11 27∗ 28 29 31∗
l1 X X X X X X X X X Xlt X X X X X X X Xc X X X
(a) radial
(b) radial
(c) call
Fig. 9. The visualization of embed call graph in correspondence with theradial layout. Upon clicking a method node in the radial visualization, themethods with direct relations get highlighted as shown in (a) and (b). Forboth (a) and (b), the methods with direct calling relations show as close toeach other in (c). But the distance of the methods between that in (a) and thatin (b) are much more distant.
categories are long (x > L2 ), medium (L4 ≤ x ≤ L
2 ), andshort(x ≤ L
4 ). We observed that out of 7 participants with shorttrajectories, 3 were bug solvers. Note that the tiny trajectories,such as ones of the participant 31, do not necessarily meanpoor code coverage as methods of different classes may beclustered together as shown in Figure 8. However, if we alsoconsider the call graph which features fewer colors and nodesvisited, it is safe to conclude that a participant reads with lesscode coverage. The participants in the group of short distancesin tree graph are most likely tree structure followers.
In general, we can see a few patterns characterizing alltrajectories in call graphs. For example, the trajectories of the
Fig. 10. An example translating the participant 6’s trajectories in the radiallayout (a, b) into the embedded spaces of the tree (c) and the call graph (d).(c) reflects the tree relation between methods. Note that the distance between175 and 69 are similar to that between 239 and 253 in (d), even through theformer looks much more distant than the later in radial layout.
(a) tree (b) tree
(c) call (d) call
(e) combined (f) combined
Fig. 11. Comparison of the participants 1 (left) and 11 (right) in their readingpatterns across different embed graphs (i.e, the tree, the call graph, and thecombined graph). We can see clearly that the participant 11’s reading patternmostly follows the tree graph. However, the participant 1 does not show anobvious pattern following either tree or call graph.
participants 2, 3, 4, 5, 7, 11, 25, 26, 29 and 30 are similar inthat they follow the flag pattern l1 as shown in Figure 14 (b).Table I shows detailed results of grouping with different flagpatterns. Examining whether participants traverse l1 or focuson the central location c as shown in Figure 14 (a) gives apool of 13 participants, among whom 6 are the bug solvers.

Fig. 12. The visualization results of the tree graph. Some similar patterns in radial layout become more distinct. For example, we can quickly identifyparticipants 8, 9, 11, 27, 28, 29, and 31 read most likely following the tree structure.
Only the bug solvers 6 and 9 do not have either pattern.
C. Deeper into the patterns
With help of AOIs we can examine patterns in greater detail.The above visual analysis yields a pool of 13 participants with6 of them correctly fixing bugs, we still have 7 participants (2,7, 11, 26, 28, 29, and 30) who are false positives. The method228 can be visited from its close neighbor method 230 whosecaller method is 156. Alternatively, it can be visited from itscallee method 163 which is called by the methods 239 and249. Looking at individual trajectory data and tracing howeach come to visit the intermediate AOI, we can further divideparticipants into three groups: a) reasonable landers (3, 4, 5,6, 11, 25, 29), b) backward travelers (30) who visited firstfrom callee to caller in the sequence of visits, and c) missedtravelers (2, 7, 26, 27, 28) who did not visit the AOI.
As we have expected, sequences in scanning can reflect thedevelopers’ reasoning. If we examine the participants 11, 25,and 29 in Figure 5, though they have very similar patternsrelated to the AOI around the method 228, the participant 25who successfully fixed the bug started his reading in the areadistinct from the method 228 and searched his way into theAOI at the end, whereas the other two were jumping right intothe AOI and then reading away from it and missed the bug.
In addition, the color changes of a trajectory offers moreinsight. For example, the trajectories with more colors meanthat the participants (e.g., 1, 2, 4, 6, 7, 25) went through moremethods and potentially had better code coverage. For theprofessional participants, their trajectories showed more colors(i.e., from purple to red to green) implying that the scanpathis less repetitive. In tree graphs, we verify that bug solverstypically start with longer purple curves and ended with shortergreen curves, which indicates that they are working to narrowdown the space of searching.
D. Discussion
The embedded space results provide a more accurate de-piction of distance, where neighborhood methods, accordingto different relations, can be mapped to nearby 2D points.Thus, we can compare user trajectories’ distances in a moremeaningful way. However, as we use a 2D embedded space,certain trajectory segments can overlap. For example, althoughseveral participants show similar patterns in Figures 12 and 13,it is less direct to tell whether or not the methods are visited ina similar sequence, thereby making it difficult to perceive moredetailed differences among trajectories. To address this issue,we plan to investigate data in a 3D space [27] by introducinga time axis additional to the 2D embedded space to generatemore comprehensive analytics results.

Fig. 13. The visualization results of the call graph, and the trajectories for all participants for in the embedded space using the same color scale as Fig. 5.Some similar patterns in radial layout become more distinct. For example, if we compare the participant 30 with 5, we can see that the participant 30 1) isless active in exploring the codes (less color in trajectory) and 2) shows a stroke (the tiny line in the bottom cluster) that are not found in other participants.
(a) (b)
Fig. 14. Flag patterns from the tree graph (a) and the call graph (b). In (a),we identify three patterns, lt for left, c for center, and rt for right. In (b), weidentify a line l1 that appears frequently among the trajectories.
V. CONCLUSIONS AND FUTURE WORK
In this paper, we leverage multiple visualization schemes forthe analysis of participants’ patterns in reading and debuggingsoftware programs. We visualize the software program withthe software’s tree and call graphs in the content and embeddedspaces and overlay participants’ trajectories on the graphsusing edge bundling techniques and color scales to indicatethe sequence of focus. Our visualization and clustering resultsprovide an intuitive and effective way of understanding readingpatterns, such as whether participants follow the tree or callgraph structure and how participants generally navigate to thebug location and in what sequence. Our visualization usesthe eye trace of the software system as its use case, but it
has the potential of applications in other domains as well.For example, in social science, we can visualize the patternof a person getting himself into a social network, suggestinghis social skills or personality. Similarly, we can investigatethe pattern of how information or news gets spread. In thispaper, we are primarily concerned with eye tracking data fordebugging patterns and efficiency.
In our future work, we would like to visualize multipleperspectives, such as psycho-physiological features and screenusage, in an integrated way. The possible extra measurements(e.g., electrogastrographic data, body movement data, facialexpression, galvanic skin response, pupil dilation, etc.) maybe integrated into data analysis with user eye trajectories. Inthis way, we can not only identify more holistic user patternsbut also gain a deeper understanding of the interplay betweensoftware structures and user exploration and comprehension.Finally, we plan on performing a user study to gain feedbackon the usefulness of this visualization to developers andresearchers.
ACKNOWLEDGMENT
This research has been sponsored in part by the NationalScience Foundation through grants IIS-1652846 and CCF-1855756.

REFERENCES
[1] B. Sharif, M. Falcone, and J. I. Maletic, “An eye-tracking study on therole of scan time in finding source code defects,” in Proceedings of theSymposium on Eye Tracking Research and Applications. ACM, 2012,pp. 381–384.
[2] M. Ciolkowski, O. Laitenberger, D. Rombach, F. Shull, and D. Perry,“Software inspections, reviews and walkthroughs,” in Proceedings ofthe 24th International Conference on Software Engineering. ICSE 2002.IEEE, 2002, pp. 641–642.
[3] K. Chandrika, J. Amudha, and S. D. Sudarsan, “Recognizing eyetracking traits for source code review,” in 2017 22nd IEEE InternationalConference on Emerging Technologies and Factory Automation (ETFA).IEEE, 2017, pp. 1–8.
[4] T. Fritz, A. Begel, S. C. Muller, S. Yigit-Elliott, and M. Zuger, “Usingpsycho-physiological measures to assess task difficulty in softwaredevelopment,” in Proceedings of the 36th international conference onsoftware engineering. ACM, 2014, pp. 402–413.
[5] B. Sharif, T. Shaffer, J. Wise, and J. I. Maletic, “Tracking developers’eyes in the IDE,” IEEE Software, vol. 33, no. 3, pp. 105–108, 2016.
[6] T. Blascheck, K. Kurzhals, M. Raschke, M. Burch, D. Weiskopf, andT. Ertl, “State-of-the-art of visualization for eye tracking data,” inProceedings of EuroVis, vol. 2014, 2014.
[7] K. Kurzhals, B. Fisher, M. Burch, and D. Weiskopf, “Evaluating visualanalytics with eye tracking,” in Proceedings of the Fifth Workshop onBeyond Time and Errors: Novel Evaluation Methods for Visualization.ACM, 2014, pp. 61–69.
[8] T. Blascheck, M. Burch, M. Raschke, and D. Weiskopf, “Challengesand perspectives in big eye-movement data visual analytics,” in 2015Big Data Visual Analytics (BDVA). IEEE, 2015, pp. 1–8.
[9] D. T. Guarnera, C. A. Bryant, A. Mishra, J. I. Maletic, andB. Sharif, “itrace: eye tracking infrastructure for developmentenvironments,” in Proceedings of the 2018 ACM Symposium on EyeTracking Research & Applications, ETRA 2018, Warsaw, Poland,June 14-17, 2018, 2018, pp. 105:1–105:3. [Online]. Available:https://doi.org/10.1145/3204493.3208343
[10] A. Marcus, L. Feng, and J. I. Maletic, “3D representations for softwarevisualization,” in Proceedings of the 2003 ACM symposium on Softwarevisualization. ACM, 2003, pp. 27–ff.
[11] R. Wettel and M. Lanza, “CodeCity: 3D visualization of large-scale soft-ware,” in Companion of the 30th international conference on Softwareengineering. ACM, 2008, pp. 921–922.
[12] D. Holten, “Hierarchical edge bundles: Visualization of adjacency re-lations in hierarchical data,” IEEE Transactions on visualization andcomputer graphics, vol. 12, no. 5, pp. 741–748, 2006.
[13] K. Kevic, B. Walters, T. Shaffer, B. Sharif, D. C. Shepherd, and T. Fritz,“Eye gaze and interaction contexts for change tasks - observations and
potential,” Journal of Systems and Software, vol. 128, pp. 252–266,2017. [Online]. Available: https://doi.org/10.1016/j.jss.2016.03.030
[14] B. Clark and B. Sharif, “iTraceVis: Visualizing eye movement datawithin Eclipse,” in 2017 IEEE Working Conference on Software Visual-ization (VISSOFT). IEEE, 2017, pp. 22–32.
[15] F. Peng, C. Li, X. Song, W. Hu, and G. Feng, “An eye tracking researchon debugging strategies towards different types of bugs,” in 2016IEEE 40th Annual Computer Software and Applications Conference(COMPSAC), vol. 2. IEEE, 2016, pp. 130–134.
[16] H. Uwano, A. Monden, and K.-i. Matsumoto, “DRESREM 2: Ananalysis system for multi-document software review using reviewers’ eyemovements,” in 2008 The Third International Conference on SoftwareEngineering Advances. IEEE, 2008, pp. 177–183.
[17] M. Suliman, H. Bani-Salameh, and A. Saif, “Visualizing communica-tions between software developers during development,” InternationalJournal of Software Engineering and Its Applications, vol. 10, no. 3,pp. 131–140, 2016.
[18] J. Fu, “Usability evaluation of software store based on eye-tracking tech-nology,” in 2016 IEEE Information Technology, Networking, Electronicand Automation Control Conference. IEEE, 2016, pp. 1116–1119.
[19] A. Majooni, M. Masood, and A. Akhavan, “An eye-tracking study on theeffect of infographic structures on viewer’s comprehension and cognitiveload,” Information Visualization, vol. 17, no. 3, pp. 257–266, 2018.
[20] G. Andrienko, N. Andrienko, W. Chen, R. Maciejewski, and Y. Zhao,“Visual analytics of mobility and transportation: State of the art andfurther research directions,” IEEE Transactions on Intelligent Trans-portation Systems, vol. 18, no. 8, pp. 2232–2249, 2017.
[21] Z. Sharafi, T. Shaffer, B. Sharif, and Y.-G. Gueheneuc, “Eye-trackingmetrics in software engineering,” in 2015 Asia-Pacific Software Engi-neering Conference (APSEC). IEEE, 2015, pp. 96–103.
[22] M. S. Mabakane, “Effective visualisation of callgraphs for optimisationof parallel programs: a design study,” Ph.D. dissertation, Faculty ofScience, 2019.
[23] G. Gousios, “Programs for producing static and dynamic (runtime) callgraphs for java programs,” https://github.com/gousiosg/java-callgraph,2018.
[24] N. Q. Zhu, Data visualization with D3. js cookbook. Packt PublishingLtd, 2013.
[25] H. Cai, V. W. Zheng, and K. C.-C. Chang, “A comprehensive surveyof graph embedding: Problems, techniques, and applications,” IEEETransactions on Knowledge and Data Engineering, vol. 30, no. 9, pp.1616–1637, 2018.
[26] A. Grover and J. Leskovec, “node2vec: Scalable feature learningfor networks,” CoRR, vol. abs/1607.00653, 2016. [Online]. Available:http://arxiv.org/abs/1607.00653
[27] J. Wei, H. Yu, R. W. Grout, J. H. Chen, and K.-L. Ma, “Dual spaceanalysis of turbulent combustion particle data,” in 2011 IEEE PacificVisualization Symposium. IEEE, 2011, pp. 91–98.