exploration discovery production - europa oil · exploration and production company. they have...
TRANSCRIPT

EUR
OPA
OIL &
GA
S (HO
LDIN
GS) PLC
Annual Rep
ort and A
ccounts for the year ended
31 July 2013
EUROPA OIL & GAS (HOLDINGS) PLCAnnual Report and Accounts for the year ended 31 July 2013
ExplorationDiscoveryProduction

Europa Oil & Gas (Holdings) plc Annual Report and Accounts for the year ended 31 July 2013
Europa Oil & Gas (Holdings) plc is an AIM listed exploration and production company focused on Europe. It offers an attractive mix of very high impact exploration offshore Ireland and onshore France, supported by exploration and production onshore UK.
The Cover: The Polarcus Amani has been shooting 3D seismic over Europa’s licence interests in the Irish Atlantic Margin
Highlights 1Chairman’s statement 2Operational review 4 Directors’ report 10Statement of directors’ responsibilities 12Report of the independent auditor 13Consolidated statement of comprehensive income 14Consolidated statement of financial position 15Consolidated statement of changes in equity 16Company statement of financial position 17Company statement of changes in equity 18Consolidated statement of cash flows 19Company statement of cash flows 20Notes to the financial statements 21Directors and advisers 40

Please visit our website for more information. www.europaoil.com
Operational highlights
• Renewed Béarn des Gaves permit until 23 March 2017 • Received £0.3 million from Kosmos in respect of costs on the two Irish licence options • 3D seismic acquisition in Ireland ongoing, FEL 3/13 is completed • Two new subsidiary companies established for Irish licence interests • Leith Hill Action Group announced its intention to appeal against Europa’s successful High Court challenge regarding the Holmwood prospect • Underground Coal Gasification licences allowed to lapse
Post reporting date events
Financial performance
• Farm-in secured with Kosmos Energy Ireland (“Kosmos”) for two blocks offshore Ireland • Converted two Irish Licence Options to Frontier Exploration Licences (“FEL”) • Commenced 3D seismic acquisition programme offshore Ireland • Identified large shallow gas prospects on Béarn des Gaves permit onshore France • Wrote down the Tarbes val d’Adour intangible asset onshore France • Acquired 77 km of 2D seismic and identified four new conventional hydrocarbon leads in North East Lincolnshire (PEDL181) • Favourable judgment at High Court for UK Holmwood planning appeal • 182 boepd recovered from three UK onshore fields – ahead of forecast
Revenue
£4.5m(2012: £5.1m)
Pre-tax profit
£0.4m(2012: loss £12.1m)
Pre-tax profit excluding exploration write-off and impairment
£0.6m(2012: £1.2m)
Cash generated from operations
£1.6m(2012: £2.1m)
Net cash balances as at 31 July 2013
£0.7m(2012: £0.2m)
Revenue (£’m)
3.1
10 10
3.8
11 11
5.1
12 12
4.5
13 13
Adjusted pretax profit (£’m)1
0.3 0.7 1.2 0.6
1 Pretax profit for continuing operations, excluding exploration write-off and impairments
www.europaoil.com 1O
UR B
USIN
ESSG
OV
ERNA
NC
EFIN
AN
CIA
L STATEMEN
TSA
DV
ISERS

Chairman’s statement
Dear shareholders,At our Annual General Meeting in December 2012 we stated our objective to become an upper quartile exploration and production company on AIM by 2017. I am pleased to report that we have taken a very significant step towards achieving that objective with our farm-out in Ireland.
Our Irish licences contain prospects that may hold very large volumes of oil. Exploration success at these prospects would be utterly transformational for Europa. In April 2013 we were delighted to announce a farm-in agreement with Kosmos a leading independent oil and gas exploration and production company. They have immediately moved us into an accelerated exploration programme. Kosmos pioneered the Cretaceous stratigraphic play that has resulted in significant exploration success in the Atlantic margin basins. With such a pedigree, we view Kosmos’ participation in our Irish blocks as a vote of confidence in the technical work we carried out. Today, Europa has a 15% free carry on potentially two high impact wells operated by a leading frontier explorer in an emerging hydrocarbon hotspot. We have now moved from talk to action. Should the state of the art 3D seismic we acquired this summer confirm the prospectivity then by the summer of 2014 we could be committing to drill a playmaker exploration well in 2015. This is fast track deepwater frontier exploration and we are already a year ahead of the competition.
New technical work in the Béarn des Gaves permit in the Aquitaine Basin, onshore France has substantially upgraded the gas resources at the Berenx shallow prospect to more than 400 bcf. Exploration success would be a company maker. Having only just received notification of the renewal of the permit we have initiated drilling planning and will immediately look to restart the farm-out process with a view to drilling a shallow well within the next 18 months.
Europa will continue to pursue new ground floor exploration ventures with minimal entry costs. The technical insights that we are acquiring in Ireland provide us with a competitive edge that we will seek to exploit through participation in the next Irish Atlantic margin licensing round. We are also investigating other ground floor exploration opportunities in the North Atlantic and Mediterranean as well as further afield.
We continue to work up our onshore UK portfolio. The Wressle well in PEDL180 will be spudded towards the end of the year. We acquired new seismic in PEDL181 and are working up new prospects that may become candidates for drilling next year. We continue to seek planning approval for the Holmwood well in PEDL143.
In parallel with this exploration activity we are seeking opportunities to acquire production either from actively producing fields or more brownfield activity. We are also reviewing consolidation opportunities. The Europa team is actively in the deal flow and announcements will be made as and when significant events occur.
Europa is not just an oil and gas explorer but also a producer. For the second consecutive year, our production from three UK onshore fields has hit our forecast. This year we produced 182 boepd which generated revenues of £4.5 million over the period, a lower figure than the previous
“Europa is not just an oil and gas explorer but also a producer. For the second consecutive year, our production from three UK onshore fields has hit our forecast. This year we produced 182 boepd which generated revenues of £4.5 million over the period. “
Europa Oil & Gas (Holdings) plc Annual Report and Accounts for the year ended 31 July 2013
2

Mullen
Kiernan
year’s average of 200 boepd due to the anticipated natural decline in production. We have completed an integrated reservoir and production engineering study that will provide the technical basis for the future management of the West Firsby field. After taking into account the cost of two work-overs on the West Firsby well in H1 2013 and costs associated with reservoir studies undertaken in H2 2013, profit before tax (before exploration write-offs) for the year was £0.6 million (2012: £1.2 million). Costs were higher over the period, predominantly as a result of additional spend on the work-overs, and exaggerated by administrative costs in the prior period having benefitted from a credit from the disposal of the Ukraine business.
Cash as at 31 July 2013 stood at £0.7 million (2012: £0.2 million). With an additional £0.3 million received from Kosmos in August 2013 in respect of Irish back costs, we can fully fund our share of drilling the Wressle prospect on PEDL180 later this year. Outlook Largely as a result of the progress made during the 12 months under review, the year ahead promises to be a highly active period for Europa including drilling Wressle, completing 3D seismic acquisition offshore Ireland with subsequent processing, interpretation and prospect generation and generating drillable prospects in PEDL181. In addition, following the recent renewal of the Béarn des Gaves permit, we intend to commence the permitting process required to drill a well in the 416 bcf Berenx shallow prospect, in conjunction with reopening a data room for potential partners. Following the favourable High Court judgment in July 2013 regarding our application to drill a temporary exploration well on the Holmwood prospect in the Weald Basin, we are hopeful that we will eventually be in a position to drill what we believe to be one of the best undrilled prospects onshore UK.
Outside our existing portfolio, having proved our low cost exploration model generates value, we are actively looking to acquire new licences around the world which match our criteria and where we can replicate the success we achieved offshore Ireland. We are working hard to close the gap which has opened up between our current share price and the value of our risked and diluted net resources and production. With a team in place that has already achieved much success, as evidenced by Kosmos’ decision to farm-in to our Irish licences, I believe we are well placed to become an upper quartile oil and gas company on AIM and in the process generate significant value for shareholders.
Finally, I would like to thank the management team, directors and advisers for their hard work during the year and also to our shareholders for their continued support over the period.
WH AdamsonChairman
The Irish farm-out partners Europa with Kosmos – a self-funded explorer with financial strength and flexibility, the architect of the overlooked Late Cretaceous play, and the ideal partner to accelerate the exploration programme.
• Founded in 2003• In June 2007 discovered the massive Jubilee Field in
the deep waters offshore Ghana• Delivered first oil from Jubilee in November 2010• Listed on the New York Stock Exchange in 2011• Developing additional discoveries offshore Ghana• Focused on exploration of the Atlantic Transform Margin
– Ghana, Ireland, Mauritania, Morocco and Suriname • Approximately 250 employees
About Kosmos
www.europaoil.com 3O
UR B
USIN
ESSG
OV
ERNA
NC
EFIN
AN
CIA
L STATEMEN
TSA
DV
ISERS

10
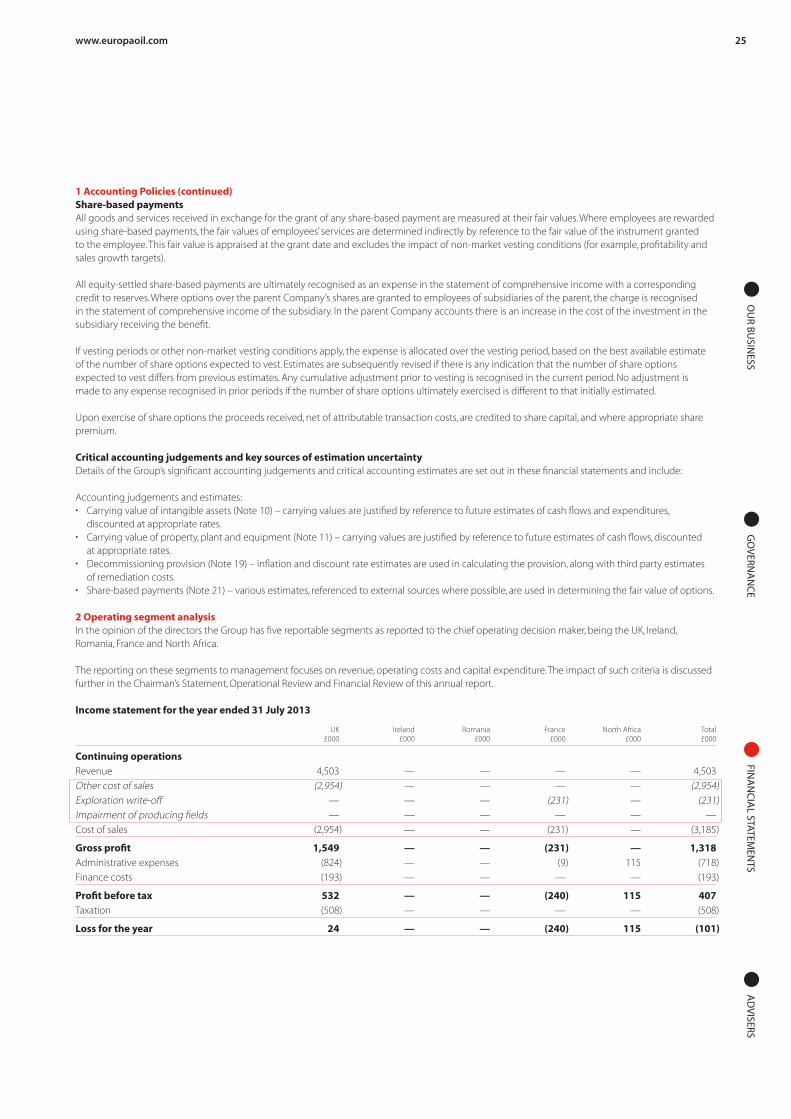
Field/Country Area Licence Prospect Operator Equity Status
UK East Midlands DL 003 West Firsby Europa 100% Production DL 001 Crosby Warren Europa 100% Production PL 199/215 Whisby-4 BPEL 65% Production PEDL150 West Whisby Europa 75% Exploration PEDL180 Wressle Egdon 33% Exploration PEDL181 Caistor Europa 50% Exploration PEDL182 Broughton Egdon 33% Exploration
Weald PEDL143 Holmwood Europa 40% Exploration
Ireland Porcupine FEL 2/13 Mullen Kosmos 15% Exploration FEL 3/13 Kiernan Kosmos 15% Exploration
France Aquitaine Béarn des Gaves Berenx (deep and shallow) Europa 100% Exploration
Romania Carpathians EIII-4 Bacau Raffles 19% Planning to exit EPI-3 Brates Barchiz Europa 100% Planning to exit
Europa operates exploration, production and appraisal assets across three core EU countries.
Our Portfolio
“Thanks to the success of the in-house technical work undertaken over the course of the year we have two potential company makers in our portfolio: offshore Ireland and onshore France.”Hugh MackayCEO
Operational reviewOperations and development
Europa Oil & Gas (Holdings) plc Annual Report and Accounts for the year ended 31 July 2013
4

km500
Ireland - Porcupine
FEL 3/13 (15%)
FEL 2/13 (15%)
Cork
Galway
Mullen
Kiernan
Dunquin
Corrib
Burren
Connemara
Spanish Point
Ireland
ExplorationPorcupine Basin Frontier Exploration Licences (“FEL”) 2/13 and 3/13- Europa (15%); Kosmos (85% and operator)
In November 2011 Europa was awarded two Licence Options (“LO”) in the South Porcupine Basin offshore southwest Ireland; LO 11/7 and LO 11/8. The South Porcupine Basin is underexplored and had been overlooked by the mainstream oil and gas industry. The exploration model for the licences involves a new play, the Cretaceous stratigraphic play: comprising Early Cretaceous turbidite sandstone reservoirs charged by mature Late Jurassic and Early Cretaceous source rocks and contained in stratigraphic traps with elements of structural closure. The Cretaceous play in Ireland is considered to be analogous to the Cretaceous play in the equatorial Atlantic Margin province that has delivered the Jubilee and Mahogany oil fields. Previous drilling offshore West Ireland during the 1970s and 1980s focused on a North Sea style Jurassic play and failed to find commercial hydrocarbons. We believe that the new Cretaceous play, enabled by modern 3D seismic and deepwater drilling technology, has the potential to deliver commercial hydrocarbon discoveries.
Europa’s interpretation of pre-existing 2D seismic identified two previously unknown prospects in the Lower Cretaceous stratigraphic play: Mullen in LO 11/7 and Kiernan in LO 11/8. The Company estimates these to have gross mean un-risked indicative resources of 482 million barrels of oil and 1.612 billion barrels of oil equivalent respectively. Information about the Mullen and Kiernan prospects were provided to the markets in press releases dated 6 November 2012 and 16 January 2013.
Europa launched its farm-out of both Licence Options in November 2012 and opened a data room to prospective farminees in January 2013. There was significant interest from large and mid-cap oil companies and on 18 April 2013 Europa announced it had successfully farmed out both LO 11/7 and LO 11/8 to Kosmos.
Kosmos agreed to farm-in to each Licence Option, earning an 85% interest in, and operatorship of, each licence. The transfer of interest and operatorship was approved by the Irish Government on 8 May 2013 and Kosmos, as operator, undertook to accelerate the conversion of LOs 11/07 and 11/08 into Frontier Exploration Licences. FELs were granted by the Irish Government commencing on 5 July 2013. Following the mandatory 25% relinquishment LO 11/7 became FEL 2/13 and LO 11/8 became FEL 3/13. Each FEL lasts for a period of 15 years and is broken down into a maximum of four phases. The first phase of three years includes a commitment to acquire 740 km2 of 3D seismic on each licence. The second phase lasts four years and has a commitment to drill an exploration well on each licence.
Under the terms of the farm-in Kosmos will fully fund the costs of a 3D seismic programme in the first phase of each FEL. Contingent upon an election of the companies to enter into the second phase of the FEL, which carries a drilling commitment, Kosmos will incur 100% of the costs of the first exploration well on each FEL. The first exploration wells on FEL 2/13 and FEL 3/13 have investment caps of US$90 million and US$110 million respectively. Costs in excess of the investment cap would be shared between Kosmos (85%) and Europa (15%).
In parallel with the FEL application process Kosmos secured a seismic vessel and obtained the appropriate permits from the relevant departments of the Irish Government to enable 3D seismic acquisition during the summer 2013 season. The MV Polarcus Amani started acquisition on 5 July 2013. The early conversion to an FEL in July 2013 means that seismic has been obtained a year earlier than would have been had we followed the conventional timetable and converted in November. FEL 3/13 has been completed and the first phase work commitment on this licence is already fulfilled. Seismic acquisition is ongoing over FEL 2/13.
The 3D seismic being acquired over the licences is a very significant first step towards realising the hydrocarbon potential of the basin. Based on the historic 2D seismic Europa estimates geological risk to be around 1 in 10 for both the Kiernan and Mullen prospects. 3D has the potential to substantially de-risk these prospects. Particularly if features like conformance, flat events and AVO anomalies are observed on the 3D seismic data. It is anticipated that the indicative resources previously provided to the market will change according to the vastly improved prospect mapping arising from the state of the art 3D data currently being acquired. The prospect sizes will likely remain large and the quantum of resources is likely to be hundreds of millions of barrels.
www.europaoil.com 5O
UR B
USIN
ESSG
OV
ERNA
NC
EFIN
AN
CIA
L STATEMEN
TSA
DV
ISERS

Operational reviewOperations and development
Béarn des Gaves 100%Europa holds a 100% interest in the onshore Béarn des Gaves permit in the Aquitaine basin, the heartland of the French oil industry. The permit contains two prospects: Berenx Deep and Berenx Shallow.
Berenx Deep is an appraisal project having previously been explored and drilled by EssoRep with two wells, Berenx-1 (1969) and Berenx-2 (1972), both encountering strong gas shows over a 500m thick gas bearing zone. In 1975 Berenx-2 was re-entered, drill stem tested and flowed gas to surface from the same carbonate reservoir that delivered 9 tcf and 2 tcf from nearby fields at Lacq and Meillon.
Europa possesses all data connected to both wells. Good quality 2D seismic data exists for the licence as well as a reprocessed 3D seismic dataset covering the area between Berenx and Lacq. Europa’s in-house technical work indicates that the Berenx deep appraisal prospect could hold in excess of 500 bcf of recoverable gas resources. In a CPR dated 31 May 2012, ERC Equipoise estimated gross mean un-risked resources of 277 bcf for the Berenx deep gas play. The difference between Europa’s and ERC’s assessment of resources reflects the confidence of each party in mapping in a geologically complex terrain. Europa was able to map a larger area of closure and as a consequence larger resources.
Thorough re-evaluation and interpretation of existing seismic and well data on the permit has resulted in the better definition of a shallow gas prospect, Berenx Shallow. Previous exploration on the concession had focused only on the deep lying gas prospectivity. A comprehensive review of historic well results, re-interpretation of structure and better understanding of proven hydrocarbon bearing reservoir distribution in the shallow Cretaceous and Late Jurassic carbonate sediments by Europa has upgraded the Berenx Shallow gas prospectivity and suggests potential gross mean un-risked resources of 416 bcf.
France
Highlights
km100
Percorade
Vic Bilh
LagravePau
Dax
Lacq
Tarbes
France - Aquitaine
Béarn des Gaves (100%)
Tarbes val d’Adour (100%)
MeillonCassourat
Ger Jacque & Osmets
Castera Lou
Berenx
• Berenx Shallow gas prospectivity and suggests potential gross mean un-risked resources of 416 bcf
In July 2013 ExxonMobil completed drilling the Dunquin exploration well in licence FEL 3/04 which lies in the South Porcupine basin between FEL 2/13 and 3/13. The well targeted a very different hydrocarbon play comprising carbonate reef reservoir on a volcanic ridge in the middle of the basin and proved to be water bearing with no commercially recoverable hydrocarbons. This result is irrelevant to the Cretaceous turbidite sandstone stratigraphic play being pursued in FEL 2/13 and 3/13 since we are pursuing a completely different reservoir and trap on the flanks of the basin. Of more relevance is the report that oil shows were present in sidewall cores over the upper 44m section of the Dunquin reservoir, suggesting the presence of a possible residual oil column. If correct this indicates that an oil prone source rock is present in the basin and may de-risk the source rock component of the Cretaceous stratigraphic play.
The pioneering work in the Porcupine basin by the participants in the 2011 Atlantic Margin Licensing Round has been endorsed by the entry of mid-cap and large oil companies during the first half of 2013. At the same time as farming into Europa’s licences Kosmos also farmed into Antrim’s licence FEL 1/13. On 7 May 2013 Cairn Energy announced a farm-in to Chrysaor operated FELs 2/04 and 4/08 and LO 11/2. On 28 June 2013 Woodside Petroleum announced a farm-in to Petrel’s LO 11/4 and 11/6 and Bluestack’s LO 11/3.
The earliest feasible drill date in our licences is 2015. The operator Kosmos has a new build, 6th generation, ultra-deepwater drillship, Atwood Achiever scheduled for delivery in mid 2014 for a three year contract. With a maximum water depth capability of 3,650m the drillship can work in the 1,000-2,000m water depths in our licences. Further announcements will be made in due course and following prospect mapping with the new seismic in H1 2014.
We are excited by the potential of a new play in an underexplored and overlooked basin. We are at the forefront of exploration of this play. The technical insights that Europa has, and will gain, from its work in the South Porcupine Basin provides a competitive edge that we will seek to exploit through participation in future licensing rounds in Ireland.
Europa Oil & Gas (Holdings) plc Annual Report and Accounts for the year ended 31 July 2013
6

The Company’s strategy for Béarn des Gaves is to first target the shallow gas play, drill a well to deliver a commercial flow rate and, on the back of success, to further appraise shallow prospectivity and undertake work to de-risk the Berenx Deep appraisal project. The anticipated total depth of the Berenx Shallow well is approximately 2,500m.
Europa submitted its application for the renewal of Béarn des Gaves in November 2011 and the renewal process formally started on 22 March 2012. Post-period end on 3 October 2013, the Company was informed by the French authorities that the permit has been successfully renewed. This next phase covers a period of five years from 22 March 2012 and carries an expenditure commitment of approximately €2.5 million. The Directors intend to immediately commence a farm-out process for the permit in tandem with well planning and permitting for a well location on Berenx Shallow ahead of drilling in the next 18 months.
The permit benefits from being located only 20 km from the Lacq Field, which potentially provides a straightforward export route, allowing gas to be processed in an existing facility with spare capacity.
Tarbes Val d’Adour 100%As announced in July, the Tarbes Val d’Adour permit has not yet been renewed by the French authorities. Under the terms of the agreement, if notification of renewal has not been received by the expiry date then the permits are deemed to have lapsed.
Europa has submitted an appeal to the relevant French authorities. Further updates with respect to the appeal process will be provided by the Company as and when it is appropriate to do so. Total aggregate exploration costs of £0.2 million previously incurred on the permit by Europa has been written off in the current financial period.
Gross un-risked resources bcf
Reservoir P90 P50 P10 MeanNeocomian 126 240 402 254Kimmeridgian 66 156 261 162 Total 416
United Kingdom
Highlights
United Kingdom - ExplorationNE Lincolnshire
• Four prospects on PEDL181 were the focus of a 78 line km 2D seismic acquisition programme completed in April 2013
PEDL180 33.3% (Wressle)PEDL180 covers an area of 100 km2 of the East Midlands Petroleum Province south of the Crosby Warren field. Europa has a 33.3% working interest in the block with its partners Egdon Resources (operator 25%)Celtique Energie Petroleum Ltd (33.3%) and Union Jack Oil (8.3%). 49 km2 of 3D seismic acquisition covering PEDL180 and PEDL182 was acquired in Q1 2012 and has been processed and interpreted. The operator estimates the Wressle prospect to hold mean gross un-risked recoverable resources of 2.1 mmbo. Drilling at Wressle is planned to take place towards the end of 2013.
PEDL182 33.3% (Broughton)To the north, PEDL182 is an area of 40 km2 with the same equity structure as that of PEDL180. The Broughton prospect was previously drilled by BP and flowed oil. The May 2012 Competent Person’s Report (“CPR”) estimated the Broughton prospect to hold mean gross un-risked recoverable resources of 1.85 mmbo.
PEDL181PEDL181 (50%)
0 10km
Wressle
Broughton
WestCuxwold
EastCentral
Caistor leads
UK - East Midlands
ImminghamOil Refinery
Grimsby
EasingtonGas Terminal
Scunthorpe
PEDL181 (50%)PEDL180 (33%)
PEDL182 (33%)Crosby Warren(100%)
www.europaoil.com 7O
UR B
USIN
ESSG
OV
ERNA
NC
EFIN
AN
CIA
L STATEMEN
TSA
DV
ISERS

Operational reviewOperations and development
Dorking area
PEDL143 (40%)
Holmwood-1(Proposed)
Brockham
Albury
km100
Guildford Dorking
M25
Crawley
M23
UK - Weald
PEDL143 40% (Holmwood)The PEDL143 licence covers an area of 92 km2 of the Weald Basin, Surrey. Europa is the operator and has a 40% working interest in the licence with partners Egdon Resources (38.4%), Altwood Petroleum (1.6%), and Warwick Energy (20%). The Holmwood prospect is a Jurassic sandstone project with a low geological risk. The May 2012 CPR estimated Holmwood to hold gross mean recoverable resources of 5.64 mmbo. Europa considers Holmwood to be one of the best undrilled exploration prospects in the UK onshore.
The prospect lies south of Dorking within the Surrey Hills Area of Outstanding Natural Beauty and an application to construct a temporary exploration well on the site was originally made in 2008. This application was refused in 2011 by Surrey County Council contrary to their planning officer’s recommendation to approve. An appeal to overturn the decision was heard at a public inquiry in July 2012. The appeal was dismissed on 26 September 2012.
As announced on 1 November 2012, Europa, along with its partners, applied for an order to quash the decision of the Secretary of State for Communities and Local Government’s appointed Inspector to dismiss the appeal. On 25 July 2013 in the Royal Courts of Justice the judge, Mr Justice Ouseley, gave judgment in favour of quashing the Inspector’s decision. The judge also granted the Leith Hill Action Group (“LHAG”) leave to appeal to the Court of Appeal against his judgment. On 19 September 2013, LHAG submitted an appeal to the Court of Appeal. The hearing is expected to be of one day duration and to take place between February and May 2014. If the Court rules in favour of Europa, the appeal will be remitted to the Planning Inspectorate for redetermination, which may involve a further planning inquiry, for the exploratory drill site at Holmwood.
PEDL181 50% Europa has a 50% interest in and is the operator of the PEDL181 licence, with Egdon Resources UK Limited and Celtique Energie Petroleum Ltd each holding a 25% interest. PEDL181 is located in the Carboniferous petroleum play and covers an area of over 540 km2 in the Humber Basin. The licence has good potential for conventional oil and gas and unusually for this play has never been previously drilled. The licence is located in a working hydrocarbon system where a number of discoveries have been made along the Brigg-Broughton anticline, an analogous trend to the west of Caistor anticline. Europa’s existing oil production at the Crosby Warren field lies at the westernmost end of the anticline.
Technical evaluation has confirmed several conventional prospects/leads on PEDL181. Four of these in the southern part of the licence, all with reservoirs of Carboniferous age, were the focus of a 78 km 2D seismic acquisition programme that was completed in April 2013. Reprocessing of 150 km2 of existing 3D seismic data has been performed together with processing of the new data. Interpretation of the integrated dataset is being performed with the objective of maturing the four leads, and defining drillable prospects. This work is due to be completed later this year, at which point the results will be released along with a forward plan for the licence.
In addition to the conventional prospectivity the licence may also contain shale gas potential in the South Humber basin. Interpretation of the new seismic data suggests that this basin may contain a much thicker sequence of Namurian age sediments than was previously thought. To date this sedimentary package has not been drilled in the South Humber basin. The Namurian section in the Gainsborough Trough basin, located some 25 km to the west of PEDL181 has been drilled and is known to host the Bowland Shale which has well documented potential for shale gas. It is possible that the Namurian section in the South Humber basin may contain a Bowland Shale equivalent with similar potential for shale gas.
Europa Oil & Gas (Holdings) plc Annual Report and Accounts for the year ended 31 July 2013
8

Production
The three UK fields produced 182 boepd in line with management expectations. During the period, workovers were successfully completed on the West Firsby wells which are now back on production. Detailed production and reservoir engineering studies have been conducted and the results implemented with the aim of maximising recovery rates at the producing fields.
Proven and probable (“2P”) producing reserves of the three producing fields was estimated at 0.65 mmbo by the CPR (as at 31 December 2011).
Unconventional resources
Underground Coal Gasification (UCG) 90%Europa (90%) and Oxford Energy Consulting Limited (10%) acquired two UCG licences on the 22 September 2010 from the Coal Authority, using powers conferred on it by the Coal Industry Act 1994: one being the Holderness Offshore Area (CA11/UCG/0015/S) and the other the South Humber Offshore Area (CA11/UCG/0016/S).
Following a technical evaluation, Europa concluded there is at present no commercial means of exploiting the coal using UCG at the depth at which the coal occurs and taking into account thickness of the individual coal seams. As a result, these licences were allowed to lapse on the 22 September 2013.
Shale GasAs previously noted PEDL181 has some potential for shale gas.
Romania
Planning to exit
• West Firsby (WF) 100%• Crosby Warren (CW) 100%• Whisby-4 well 65%
The Company continues to hold interests in two exploration licences in Romania: Brates (100%) and Bacau (19%). Both licences are in the process of being relinquished. The assets were fully written down in the year ended 31 July 2012.
ConclusionThanks to the success of the in-house technical work undertaken over the course of the year we have two potential company makers in our portfolio offshore Ireland and onshore France. Ireland is funded and we have begun an exploration programme that could lead to realisation of this potential by drilling in 2015.
Plenty of work remains to be done on our existing projects and new ventures in the year ahead. We are delighted with the pace that Kosmos has set in advancing the Irish licences since taking over operatorship. By acquiring 3D seismic in summer 2013, the partnership has gained a year and we can focus on processing and interpreting the seismic during the winter months to further define the prospectivity and identify possible drilling targets. Having secured the renewal of Béarn des Gaves we will target securing a farm-in partner with a view to drilling a well at Berenx Shallow in the next 18 months. In the UK, we are close to identifying drillable prospects on PEDL181, while on PEDL180 we expect to drill Wressle towards the end of 2013. I am excited about the year ahead and look forward to making further significant progress on all our projects and particularly our two company makers.
Hugh MackayCEO
West Firsby #9 well producing on beam pump
www.europaoil.com 9O
UR B
USIN
ESSG
OV
ERNA
NC
EFIN
AN
CIA
L STATEMEN
TSA
DV
ISERS

Europa Oil & Gas (Holdings) plc Annual Report and Accounts for the year ended 31 July 2013
10
The directors present their report and the audited financial statements for the year ended 31 July 2013.
Principal activitiesThe principal activity of the Group is investment in oil and gas exploration, development and production. The Group’s assets and activities are located in the United Kingdom, Ireland and France. The Board has considered and will continue to consider investments in Europe, Mediterranean and Atlantic Margin.
Business reviewA detailed review of the Group’s business and prospects is set out in the Chairman’s statement (page 2) and Operational review (page 4).
Key performance indicatorsAt its regular meetings, the Board closely monitors production rates, costs and progress with all the licences in which the Group has interests.
Primary risks and uncertaintiesEuropa’s activities are subject to a range of financial risks including commodity prices, liquidity within the business and of counterparties, exchange rates and loss of operational equipment or wells. These risks are managed with the oversight of the Board and the Audit Committee through ongoing review taking into account the operational, business and economic circumstances at that time. The primary risk facing the business is that of liquidity.
LiquidityDetailed cash forecasts are prepared frequently and reviewed by management and the Board. The Group’s production provides a monthly inflow of cash and is the main source of working capital and project finance. Additional cash is available through a £700,000 overdraft facility and the placing of Europa shares in the market.
Overdraft facilityThe Royal Bank of Scotland (RBS) multi-currency facility signed on 8 February 2013 provides an overdraft of up to £700,000 (2012: £700,000). Interest is charged at 3% over base rate (2012: 3% over base rate). The facility is due to be renewed before 31 January 2014. The principal interest rate risk for the Group is the interest charge arising from utilisation of the multi-currency facility.
Placing of sharesDuring the year, no shares were issued (2012: a total of 7,777,776 shares issued at 9p raising £665,000 net of broker commission).
The SEDA facilityOn 15 July 2011 Europa entered into a 3 year agreement with YA Global Master SPV (Yorkville) under which Yorkville provided a £5 million Standby Equity Distribution Agreement (SEDA). Yorkville is an investment fund managed by Yorkville Advisors UK LLP. To date there have been no draw downs against the SEDA. Due to uncertainty over future use of the facility, Europa wrote-off the SEDA arrangement fee in 2012.
Commodity price, credit and currencyThe Board has considered the use of financial instruments to hedge oil price and US Dollar exchange rate movements. To date, the Board has not hedged against price or exchange rate movements, but intends to regularly review this policy.
Sales revenue is generated primarily in US Dollars and these funds are matched where possible against expenditures within the business. As most capital and operating expenditures are Sterling denominated, US Dollars are periodically sold to purchase Sterling.
Crude oil is sold to one multinational oil company. Credit risk is considered to be minimal.
Exploration, drilling and operational riskThe business of exploration and production of oil and gas involves a high degree of risk. Few prospects that are explored are ultimately developed into producing oil and gas fields.
Significant expenditure is required to establish the extent of oil and gas reserves through seismic surveys and drilling and there can be no certainty that oil and gas reserves will be found. The exploration and development of oil and gas assets may be curtailed, delayed or cancelled by unusual or unexpected geological formation pressures, hazardous weather conditions or other factors.
There are numerous risks inherent in drilling and operating wells, many of which are beyond the Company’s control. The Group’s operations may be curtailed, delayed or cancelled as a result of environmental hazards, industrial accidents, occupational and health hazards, technical failures, shortage or delays in the delivery of rigs and/or other equipment, labour disputes and compliance with governmental requirements.
Drilling may involve unprofitable efforts, not only with respect to dry wells, but also to wells which, though yielding some oil or gas, are not sufficiently productive to justify commercial development. Completion of a well does not assure a profit on the investment or recovery of drilling, completion and operating costs.
Licences may be revoked by the relevant issuing authority if commitments under those licences are not met. Further details of current licence commitments are given in Notes 10 and 23.
Directors’ report

11O
UR B
USIN
ESSG
OV
ERNA
NC
EFIN
AN
CIA
L STATEMEN
TSA
DV
ISERSwww.europaoil.com
Exploration, drilling and operational risk (continued)Appropriate insurance cover is obtained annually for all of Europa’s exploration, development and production activities.
Future drilling plans are disclosed in the Operations review.
Accounting policiesThe Group has not made any material changes to its accounting policies in the year to 31 July 2013.
Results for the year and dividendsThe Group loss for the year after taxation was £101,000 (2012 loss: £11,316,000). The directors do not recommend the payment of a dividend (2012: £nil).
Directors and their interestsThe directors’ interests in the share capital of the Company at 31 July were: Number of Number of ordinary ordinary shares share options
2013 2012 2013 2012
WH Adamson 575,000 475,000 500,000 500,000CW Ahlefeldt-Laurvig1 25,502,442 25,502,442 — —RJHM Corrie2 87,500 87,500 500,000 500,000P Greenhalgh 250,000 250,000 3,075,000 1,875,000HGD Mackay 860,823 786,863 6,600,000 5,000,000
1. CW Ahlefeldt-Laurvig holds his shares through HSBC Global Custody Nominee (UK) Limited.2. RJHM Corrie holds his shares via a 50% interest in RT Property Investments Limited which holds 50,000 shares, and Corrie Limited, of which Mr Corrie is a director, owns 62,500 shares.
In addition to their interest in the ordinary shares of the Company, WH Adamson and RJHM Corrie hold stock options. These options were awarded in connection with their appointment to the Board and full details of the options are included in Note 21. The Board has listened to comments raised by certain investors and discussed the subject with advisers. Whilst recognising that the granting of options to non-executive directors is contrary to the principles of the UK corporate governance code the Board considers that the quantum of options granted is not so significant as to raise any issue concerning the independence of these directors. In addition, the Board wishes to retain the ability to grant stock options to non-executive directors in future.
Details of the vesting conditions of the directors’ stock options are included in Note 21.
Directors’ interests in transactionsNo director had, during the year or at the end of the year, other than disclosed below, a material interest in any contract in relation to the Group’s activities except in respect of service agreements.
Subject to the conditions set out in the Companies Act 2006, the Company has arranged appropriate Directors’ and Officers’ insurance to indemnify the directors against liability in respect of proceedings brought by third parties. Such provisions remain in force at the date of this report.
Policy and practice on payment of suppliersThe Group’s policy on payment of suppliers is to settle amounts due on a timely basis taking into account the credit period given. At 31 July 2013, the Group had 48 days of purchases outstanding (2012: 47 days) and the Company had 20 days of purchases outstanding (2012: 25 days).
Financial instrumentsSee Note 1 and Note 22 to the financial statements.
Related party transactionsSee Note 25 to the financial statements.
Post reporting date eventsSee Note 26 to the financial statements.
Capital structure and going concernFurther details on the Group’s capital structure are included in Note 20. Comments on going concern are included in Note 1.
Accounting policiesA full list of accounting policies is set out in Note 1 to the financial statements.

Europa Oil & Gas (Holdings) plc Annual Report and Accounts for the year ended 31 July 2013
12
Disclosure of information to the auditorsIn the case of each person who was a director at the time this report was approved:• So far as that director was aware there was no relevant available information of which the Company’s auditors were unaware.• That director had taken all necessary steps to make themselves aware of any relevant audit information, and to establish that the Company’s
auditors were aware of that information.
AuditorsA resolution to re-appoint the auditors, BDO LLP will be proposed at the next Annual General Meeting.
On behalf of the Board 10 October 2013
P GreenhalghFinance Director
Statement of directors’ responsibilities
Directors’ responsibilitiesThe directors are responsible for preparing the annual report and the financial statements in accordance with applicable law and regulations.
Company law requires the directors to prepare financial statements for each financial year. Under that law the directors have elected to prepare the Group and Company financial statements in accordance with International Financial Reporting Standards (IFRSs) as adopted by the European Union. Under Company law the directors must not approve the financial statements unless they are satisfied that they give a true and fair view of the state of affairs of the Group and Company and of the profit or loss of the Group for that year. The directors are also required to prepare financial statements in accordance with the rules of the London Stock Exchange for companies trading securities on the Alternative Investment Market.
In preparing these financial statements, the directors are required to:• select suitable accounting policies and then apply them consistently;• make judgements and accounting estimates that are reasonable and prudent;• state whether they have been prepared in accordance with IFRSs as adopted by the European Union, subject to any material departures disclosed
and explained in the financial statements;• prepare the financial statements on the going concern basis unless it is inappropriate to presume that the Company will continue in business.
The directors are responsible for keeping adequate accounting records that are sufficient to show and explain the Company’s transactions and disclose with reasonable accuracy at any time the financial position of the Company and enable them to ensure that the financial statements comply with the requirements of the Companies Act 2006. They are also responsible for safeguarding the assets of the Company and hence for taking reasonable steps for the prevention and detection of fraud and other irregularities.
Website publicationThe directors are responsible for ensuring the annual report and the financial statements are made available on a website. Financial statements are published on the Company’s website in accordance with legislation in the United Kingdom governing the preparation and dissemination of financial statements, which may vary from legislation in other jurisdictions. The maintenance and integrity of the Company’s website is the responsibility of the directors. The directors’ responsibility also extends to the ongoing integrity of the financial statements contained therein.
Directors’ report (continued)

13O
UR B
USIN
ESSG
OV
ERNA
NC
EFIN
AN
CIA
L STATEMEN
TSA
DV
ISERSwww.europaoil.com
Report of the independent auditor
Independent auditor’s report to the members of Europa Oil & Gas (Holdings) plcWe have audited the financial statements of Europa Oil and Gas (Holdings) plc for the year ended 31 July 2013 which comprise the consolidated statement of comprehensive income, the consolidated and Company statement of financial position, the consolidated and Company statement of changes in equity, the consolidated and Company statement of cashflows and the related Notes. The financial reporting framework that has been applied in their preparation is applicable law and International Financial Reporting Standards (IFRSs) as adopted by the European Union and, as regards the parent Company financial statements, as applied in accordance with the provisions of the Companies Act 2006.
This report is made solely to the Company’s members, as a body, in accordance with Chapter 3 of Part 16 of the Companies Act 2006. Our audit work has been undertaken so that we might state to the Company’s members those matters we are required to state to them in an auditor’s report and for no other purpose. To the fullest extent permitted by law, we do not accept or assume responsibility to anyone other than the Company and the Company’s members as a body, for our audit work, for this report, or for the opinions we have formed.
Respective responsibilities of directors and auditorsAs explained more fully in the statement of directors’ responsibilities, the directors are responsible for the preparation of the financial statements and for being satisfied that they give a true and fair view. Our responsibility is to audit and express an opinion on the financial statements in accordance with applicable law and International Standards on Auditing (UK and Ireland). Those standards require us to comply with the Auditing Practices Board’s Ethical Standards for Auditors.
Scope of the audit of the financial statementsA description of the scope of an audit of financial statements is provided on the Financial Reporting Council’s website at www.frc.org.uk/auditscopeukprivate
Opinion on financial statementsIn our opinion: • the financial statements give a true and fair view of the state of the Group’s and the parent Company’s affairs as at 31 July 2013 and of the Group’s
loss for the year then ended;• the group financial statements have been properly prepared in accordance with IFRSs as adopted by the European Union;• the parent Company financial statements have been properly prepared in accordance with IFRSs as adopted by the European Union and as applied
in accordance with the provisions of the Companies Act 2006; and• the financial statements have been prepared in accordance with the requirements of the Companies Act 2006.
Opinion on other matters prescribed by the Companies Act 2006In our opinion the information given in the directors’ report for the financial year for which the financial statements are prepared is consistent with the financial statements.
Matters on which we are required to report by exceptionWe have nothing to report in respect of the following matters where the Companies Act 2006 requires us to report to you if, in our opinion:• adequate accounting records have not been kept by the parent company, or returns adequate for our audit have not been received from branches
not visited by us; or• the parent Company financial statements are not in agreement with the accounting records and returns; or• certain disclosures of directors’ remuneration specified by law are not made; or• we have not received all the information and explanations we require for our audit.
Anne Sayers (senior statutory auditor)For and on behalf of BDO LLP, statutory auditorLondon, United Kingdom
BDO LLP is a limited liability partnership registered in England and Wales (with registered number OC305127).
Europa Oil & Gas (Holdings) plc Annual Report and Accounts for the year ended 31 July 2013
14
2013 2012 Note £000 £000
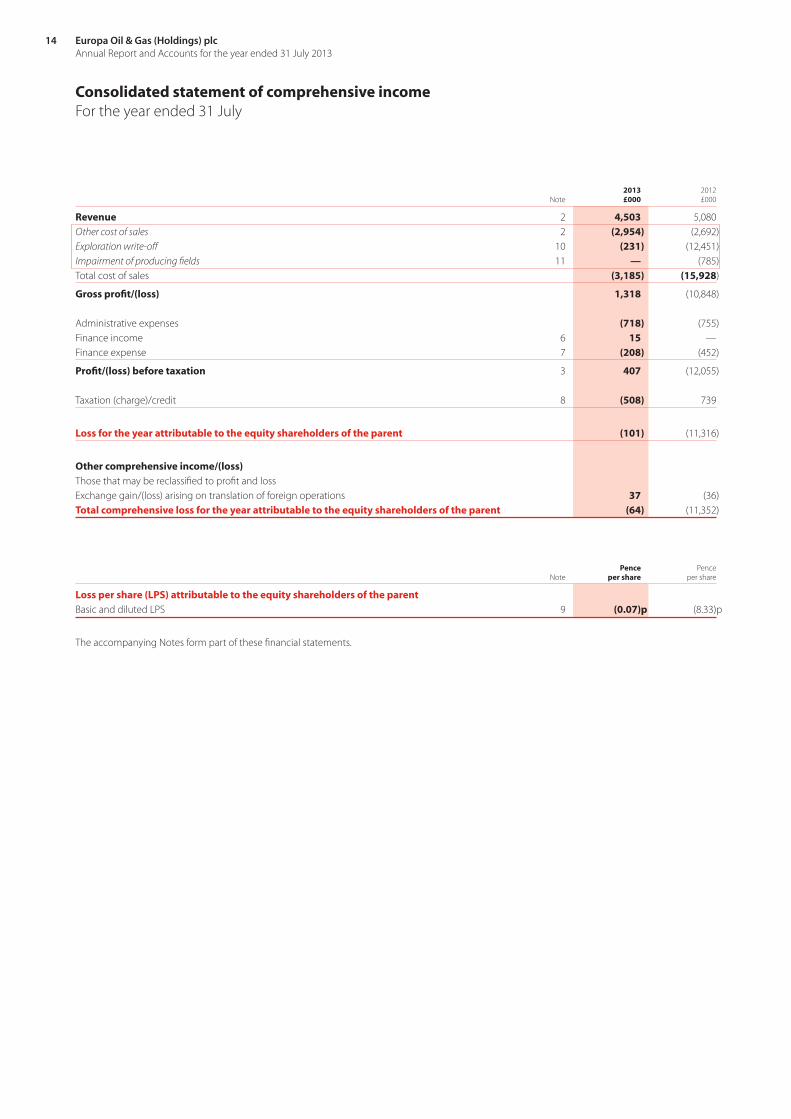
Revenue 2 4,503 5,080
Other cost of sales 2 (2,954) (2,692)
Exploration write-off 10 (231) (12,451)
Impairment of producing fields 11 — (785)
Total cost of sales (3,185) (15,928)
Gross profit/(loss) 1,318 (10,848)
Administrative expenses (718) (755)
Finance income 6 15 —
Finance expense 7 (208) (452)
Profit/(loss) before taxation 3 407 (12,055)
Taxation (charge)/credit 8 (508) 739
Loss for the year attributable to the equity shareholders of the parent (101) (11,316)
Other comprehensive income/(loss)Those that may be reclassified to profit and loss
Exchange gain/(loss) arising on translation of foreign operations 37 (36)
Total comprehensive loss for the year attributable to the equity shareholders of the parent (64) (11,352)
Pence Pence Note per share per share
Loss per share (LPS) attributable to the equity shareholders of the parentBasic and diluted LPS 9 (0.07)p (8.33)p
The accompanying Notes form part of these financial statements.
Consolidated statement of comprehensive incomeFor the year ended 31 July

OU
R BU
SINESS
GO
VERN
AN
CE
FINA
NC
IAL STATEM
ENTS
AD
VISERS
15www.europaoil.com
2013 2012 Note £000 £000
AssetsNon-current assetsIntangible assets 10 2,446 2,127
Property, plant and equipment 11 4,383 4,959
Deferred tax asset 18 — 14
Total non-current assets 6,829 7,100
Current assetsInventories 13 33 56
Trade and other receivables 14 928 1,250
Cash and cash equivalents 672 230
1,633 1,536
Other current assets Assets classified as held for sale 15 338 338
Total assets 8,800 8,974
LiabilitiesCurrent liabilitiesTrade and other payables 16 (1,227) (1,880)
Current tax liabilities (541) (87)
Derivative 16 (48) (64)
Short-term borrowings 17 (208) (230)
Short-term provisions 19 (290) —
Total current liabilities (2,314) (2,261)
Non-current liabilitiesDeferred tax liabilities 18 (2,902) (2,948)
Long-term provisions 19 (1,681) (1,950)
Total non-current liabilities (4,583) (4,898)
Total liabilities (6,897) (7,159)
Net assets 1,903 1,815
Capital and reserves attributable to equity holders of the parent Share capital 20 1,379 1,379
Share premium 13,160 13,160
Merger reserve 2,868 2,868
Foreign exchange reserve 417 380
Retained deficit (15,921) (15,972)
Total equity 1,903 1,815
These financial statements were approved by the Board of directors and authorised for issue on 10 October 2013 and signed on its behalf by:
P Greenhalgh Finance Director
Company registration number 5217946
The accompanying Notes form part of these financial statements.
Consolidated statement of financial positionAs at 31 July

Europa Oil & Gas (Holdings) plc Annual Report and Accounts for the year ended 31 July 2013
16
Attributable to the equity holders of the parent
Foreign Share Share Merger exchange Retained Total capital premium reserve reserve deficit equity £000 £000 £000 £000 £000 £000
Balance at 1 August 2011 1,301 12,573 2,868 416 (4,719) 12,439Total comprehensive loss for the year — — — (36) (11,316) (11,352)
Share based payment — — — — 63 63
Issue of share capital (net of issue costs) 78 587 — — — 665
Balance at 31 July 2012 1,379 13,160 2,868 380 (15,972) 1,815
Balance at 1 August 2012 1,379 13,160 2,868 380 (15,972) 1,815
Total comprehensive loss for the year — — — 37 (101) (64)
Share based payment — — — — 152 152
Balance at 31 July 2013 1,379 13,160 2,868 417 (15,921) 1,903
The accompanying Notes form part of these financial statements.
Consolidated statement of changes in equity

OU
R BU
SINESS
GO
VERN
AN
CE
FINA
NC
IAL STATEM
ENTS
AD
VISERS
17www.europaoil.com
2013 2012 Note £000 £000
AssetsNon-current assetsIntangible assets 10 1,028 —
Property, plant and equipment 11 14 22
Investments 12 3,320 3,316
Total non-current assets 4,362 3,338
Current assetsOther receivables 14 354 61
Cash and cash equivalents 54 27
408 88
Other current assets Assets classified as held for sale 15 338 338
Total assets 5,108 3,764
LiabilitiesCurrent liabilitiesTrade and other payables 16 (186) (162)
Derivative 16 (48) (64)
Short-term borrowing 17 (208) (230)
Total current liabilities (442) (456)
Total liabilities (442) (456)
Net assets 4,666 3,308
Capital and reserves attributable to equity holders of the parentShare capital 20 1,379 1,379
Share premium 13,160 13,160
Merger reserve 2,868 2,868
Retained deficit (12,741) (14,099)
Total equity 4,666 3,308
These financial statements were approved by the Board of directors and authorised for issue on 10 October 2013 and signed on their behalf by:
P Greenhalgh Finance Director
Company registration number 5217946
The accompanying Notes form part of these financial statements.
Company statement of financial positionAs at 31 July

Europa Oil & Gas (Holdings) plc Annual Report and Accounts for the year ended 31 July 2013
18
Share Share Merger Retained Total capital premium reserve deficit equity £000 £000 £000 £000 £000
Balance at 1 August 2011 1,301 12,573 2,868 (306) 16,436
Total comprehensive income for the year — — — (13,856) (13,856)
Share based payment — — — 63 63
Issue of share capital (net of issue costs) 78 587 — — 665
Balance at 31 July 2012 1,379 13,160 2,868 (14,099) 3,308
Balance at 1 August 2012 1,379 13,160 2,868 (14,099) 3,308
Total comprehensive income for the year — — — 1,206 1,206
Share based payment — — — 152 152
Balance at 31 July 2013 1,379 13,160 2,868 (12,741) 4,666
The accompanying Notes form part of these financial statements.
Company statement of changes in equity

OU
R BU
SINESS
GO
VERN
AN
CE
FINA
NC
IAL STATEM
ENTS
AD
VISERS
19www.europaoil.com
2013 2012 Note £000 £000
Cash flows from operating activitiesLoss after tax (101) (11,316)
Adjustments for:
Share based payments 21 152 63
Depreciation 11 578 673
Exploration write-off 10 231 12,451
Impairment of property, plant & equipment 11 — 785
Finance income 6 (15) —
Finance expense 7 208 452
Taxation expense/(credit) 8 508 (739)
Decrease/(increase) in trade and other receivables 621 (647)
Decrease/(increase) in inventories 23 (13)
(Decrease)/increase in trade and other payables (535) 350
Cash generated from operations 1,670 2,059
Income tax payment (84) —
Net cash from operating activities 1,586 2,059
Cash flows from investing activitiesPurchase of property, plant and equipment (5) (78)
Purchase of intangible assets (1020) (2,955)
Expenditure on well decommissioning (51) —
Net cash used in investing activities (1,076) (3,033)
Cash flows from financing activitiesProceeds from issue of share capital (net of issue costs) — 665
Decrease in payables related to the issue of share capital — (115)
Repayment of borrowings (22) (1,025)
Finance costs (34) (289)
Net cash used in financing activities (56) (764)
Net increase/(decrease) in cash and cash equivalents 454 (1,738)
Exchange (loss)/gain on cash and cash equivalents (12) 92
Cash and cash equivalents at beginning of year 230 1,876
Cash and cash equivalents at end of year 672 230
The accompanying Notes form part of these financial statements.
Consolidated statement of cash flowsFor the year ended 31 July

Europa Oil & Gas (Holdings) plc Annual Report and Accounts for the year ended 31 July 2013
20
2013 2012 Note £000 £000
Cash flows from operating activities
Profit/(loss) after tax 1,206 (13,856)
Adjustments for:
Share based payments 148 63
Depreciation 11 10 22
Transfer costs to intangibles 11 —
Movement in intercompany loan (1,591) 13,096
Finance income (321) (377)
Finance expense 214 844
Decrease in trade and other receivables 7 185
Increase in trade and other payables 23 36
Net cash (used in)/from operating activities (293) 13
Cash flows from investing activitiesPurchase of property, plant and equipment (2) (16)
Purchase of intangible assets (2) —
Movement on loan to Group companies 376 (834)
Net cash from /(used in) investing activities 372 (850)
Cash flows from financing activitiesProceeds from issue of share capital (net of issue costs) — 665
Decrease in payables related to the issue of share capital — (115)
Repayment of borrowings (22) (1,025)
Finance costs (29) (275)
Net cash used in financing activities (51) (750)
Net increase/(decrease) in cash and cash equivalents 28 (1,587)
Exchange (loss)/gain on cash and cash equivalents (1) 36
Cash and cash equivalents at beginning of year 27 1,578
Cash and cash equivalents at end of year 54 27
The accompanying Notes form part of these financial statements.
Company statement of cash flowsFor the year ended 31 July

OU
R BU
SINESS
GO
VERN
AN
CE
FINA
NC
IAL STATEM
ENTS
AD
VISERS
21www.europaoil.com
Notes to the financial statements
1 Accounting PoliciesGeneral informationEuropa Oil & Gas (Holdings) plc is a Company incorporated and domiciled in England and Wales with registered number 5217946. The address of the registered office is 6 Porter Street, London, W1U 6DD. The Company’s administrative office is at the same address.
The functional and presentational currency of the Company is Sterling (UK£).
Basis of accountingThe consolidated financial statements have been prepared in accordance with applicable International Financial Reporting Standards (IFRS) as adopted by the EU. The policies have not changed from the previous year.
The accounting policies that have been applied in the opening statement of financial position have also been applied throughout all periods presented in these financial statements. These accounting policies comply with each IFRS that is mandatory for accounting periods ending on 31 July 2013.
Going concernIn their assessment of going concern the directors note that the Group is dependent on the existing bank facility in place. The current bank facility is due to expire in January 2014. Based on correspondence with the Group’s bankers the directors have no reason to believe that the facility will not be renewed on the same or similar acceptable terms in an appropriate timescale. Therefore given this expectation and the continuing cash inflow from the Group’s producing assets the directors have concluded, at the time of approving the financial statements, that there is a reasonable expectation, based on the Group’s cash flow forecasts, that the Group can continue in operational existence for the foreseeable future, which is deemed to be at least 12 months from the date of signing these financial statements. Accordingly they continue to adopt the going concern basis in preparing the financial statements.
Future changes in accounting standardsThe IFRS financial statements have been drawn up on the basis of accounting standards, interpretations and amendments effective at the beginning of the accounting period. The IASB and IFRIC have issued the following standards and interpretations:
Effective date
IAS 12 Deferred Tax Recovery of Underlying Assets 1 Jan 2012
IAS 1 Amendment – Presentation of Items of Other Comprehensive Income 1 Jul 2012
The following are amendments to existing standards and new standards which may apply to the Group in future accounting periods. Except for the disclosure requirements of IAS 24 and the impact of IFRS 9 and IFRS 11, which the directors are continuing to assess, none of the following are considered to affect the Company.
Effective date (periods beginning on or after)
IFRS 9 * Financial instruments 1 Jan 2015IFRS 10 Consolidated Financial Statements 1 Jan 2014IFRS 11 Joint Arrangements 1 Jan 2014IFRS 12 Disclosure of Involvement with Other Entities 1 Jan 2014IFRS 13 Fair Value Measurement 1 Jan 2013IAS 19 Employee Benefits 1 Jan 2013 IAS 27 Separate Financial Statements 1 Jan 2014IAS 28 Investments in Associates and Joint Ventures 1 Jan 2014
Items marked * had not yet been endorsed by the European Union at the date that these financial statements were approved and authorised for issue by the Board.
Basis of consolidationThe Group financial statements consolidate those of the Company and all of its material subsidiary undertakings drawn up to 31 July 2013. Subsidiaries are entities over which the Group has the power to control the financial and operating policies so as to obtain benefits from its activities. The Group obtains and exercises control through voting rights.
Intra Group balances are eliminated on consolidation. Unrealised gains on transactions between the Group and its subsidiaries are eliminated. Unrealised losses are also eliminated unless the transaction provides evidence of an impairment of the asset transferred. Amounts reported in the financial statements of subsidiaries have been adjusted where necessary to ensure consistency with the accounting policies adopted by the Group.
The Group is engaged in oil and gas exploration, development and production through unincorporated joint ventures. The accounting for the Group’s share of the results and net assets of these joint arrangements is described below.
Europa Oil & Gas (Holdings) plc Annual Report and Accounts for the year ended 31 July 2013
22
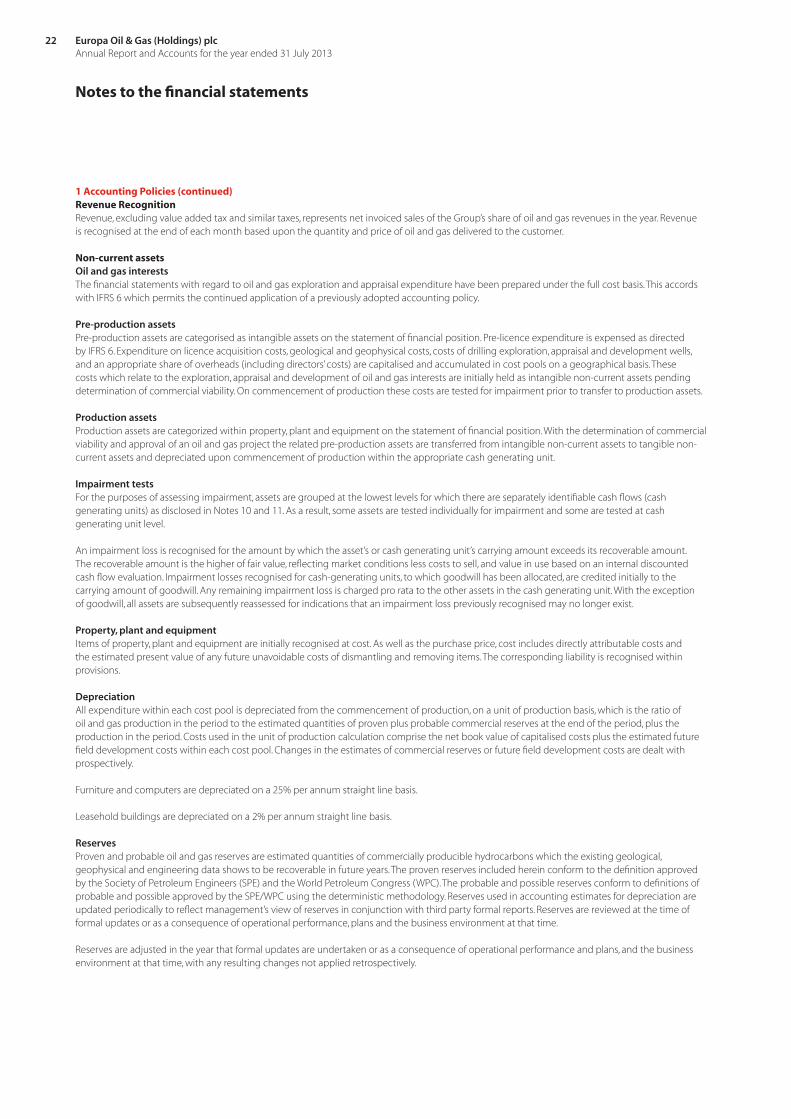
1 Accounting Policies (continued)Revenue RecognitionRevenue, excluding value added tax and similar taxes, represents net invoiced sales of the Group’s share of oil and gas revenues in the year. Revenue is recognised at the end of each month based upon the quantity and price of oil and gas delivered to the customer.
Non-current assetsOil and gas interestsThe financial statements with regard to oil and gas exploration and appraisal expenditure have been prepared under the full cost basis. This accords with IFRS 6 which permits the continued application of a previously adopted accounting policy.
Pre-production assetsPre-production assets are categorised as intangible assets on the statement of financial position. Pre-licence expenditure is expensed as directed by IFRS 6. Expenditure on licence acquisition costs, geological and geophysical costs, costs of drilling exploration, appraisal and development wells, and an appropriate share of overheads (including directors’ costs) are capitalised and accumulated in cost pools on a geographical basis. These costs which relate to the exploration, appraisal and development of oil and gas interests are initially held as intangible non-current assets pending determination of commercial viability. On commencement of production these costs are tested for impairment prior to transfer to production assets.
Production assetsProduction assets are categorized within property, plant and equipment on the statement of financial position. With the determination of commercial viability and approval of an oil and gas project the related pre-production assets are transferred from intangible non-current assets to tangible non-current assets and depreciated upon commencement of production within the appropriate cash generating unit.
Impairment testsFor the purposes of assessing impairment, assets are grouped at the lowest levels for which there are separately identifiable cash flows (cash generating units) as disclosed in Notes 10 and 11. As a result, some assets are tested individually for impairment and some are tested at cash generating unit level.
An impairment loss is recognised for the amount by which the asset’s or cash generating unit’s carrying amount exceeds its recoverable amount. The recoverable amount is the higher of fair value, reflecting market conditions less costs to sell, and value in use based on an internal discounted cash flow evaluation. Impairment losses recognised for cash-generating units, to which goodwill has been allocated, are credited initially to the carrying amount of goodwill. Any remaining impairment loss is charged pro rata to the other assets in the cash generating unit. With the exception of goodwill, all assets are subsequently reassessed for indications that an impairment loss previously recognised may no longer exist.
Property, plant and equipmentItems of property, plant and equipment are initially recognised at cost. As well as the purchase price, cost includes directly attributable costs and the estimated present value of any future unavoidable costs of dismantling and removing items. The corresponding liability is recognised within provisions.
DepreciationAll expenditure within each cost pool is depreciated from the commencement of production, on a unit of production basis, which is the ratio of oil and gas production in the period to the estimated quantities of proven plus probable commercial reserves at the end of the period, plus the production in the period. Costs used in the unit of production calculation comprise the net book value of capitalised costs plus the estimated future field development costs within each cost pool. Changes in the estimates of commercial reserves or future field development costs are dealt with prospectively.
Furniture and computers are depreciated on a 25% per annum straight line basis.
Leasehold buildings are depreciated on a 2% per annum straight line basis.
ReservesProven and probable oil and gas reserves are estimated quantities of commercially producible hydrocarbons which the existing geological, geophysical and engineering data shows to be recoverable in future years. The proven reserves included herein conform to the definition approved by the Society of Petroleum Engineers (SPE) and the World Petroleum Congress (WPC). The probable and possible reserves conform to definitions of probable and possible approved by the SPE/WPC using the deterministic methodology. Reserves used in accounting estimates for depreciation are updated periodically to reflect management’s view of reserves in conjunction with third party formal reports. Reserves are reviewed at the time of formal updates or as a consequence of operational performance, plans and the business environment at that time.
Reserves are adjusted in the year that formal updates are undertaken or as a consequence of operational performance and plans, and the business environment at that time, with any resulting changes not applied retrospectively.
Notes to the financial statements

OU
R BU
SINESS
GO
VERN
AN
CE
FINA
NC
IAL STATEM
ENTS
AD
VISERS
23www.europaoil.com
1 Accounting Policies (continued)Future decommissioning costsA provision for decommissioning is recognised in full at the point that the Group has an obligation to decommission an appraisal, development or producing well. A corresponding non-current asset (included within producing fields in Note 11) of an amount equivalent to the provision is also created. The amount recognised is the estimated cost of decommissioning, discounted to its net present value and is reassessed each year in accordance with local conditions and requirements. For producing wells, the asset is subsequently depreciated as part of the capital costs of production facilities within tangible non current assets, on a unit of production basis. Any decommissioning obligation in respect of a pre-production asset is carried forward as part of its cost and tested annually for impairment in accordance with the above policy.
Changes in the estimates of commercial reserves or decommissioning cost estimates are dealt with prospectively by recording an adjustment to the provision, and a corresponding adjustment to the decommissioning asset. The unwinding of the discount on the decommissioning provision is included within finance expense.
TaxationCurrent tax is the tax payable based on taxable profit/(loss) for the year.
Deferred income taxes are calculated using the balance sheet liability method on temporary differences. Deferred tax is generally provided on the difference between the carrying amounts of assets and liabilities and their tax bases. However, deferred tax is not provided on the initial recognition of goodwill, nor on the initial recognition of an asset or liability unless the related transaction is a business combination or affects tax or accounting profit. Deferred tax on temporary differences associated with shares in subsidiaries and joint ventures is not provided if reversal of these temporary differences can be controlled by the Group and it is probable that reversal will not occur in the foreseeable future. Tax losses available to be carried forward as well as other income tax credits to the Group are assessed for recognition as deferred tax assets.
Deferred tax liabilities are provided in full, with no discounting. Deferred tax assets are recognised to the extent that it is probable that the underlying deductible temporary difference will be able to be offset against future taxable income. Current and deferred tax assets and liabilities are calculated at tax rates that are expected to apply to their respective period of realisation, provided they are enacted or substantively enacted at the reporting date.
Changes in deferred tax assets or liabilities are recognised as a component of tax expense in the statement of comprehensive income, except where they relate to items that are charged or credited directly to equity in which case the related deferred tax is also charged or credited directly to equity.
Foreign currencyThe Group and Company prepare their financial statements in Sterling.
Transactions denominated in foreign currencies are translated at the rates of exchange ruling at the date of the transaction. Monetary assets and liabilities in foreign currencies are translated at the rates of exchange ruling at the reporting date. Non-monetary items that are measured at historical cost in a foreign currency are translated at the exchange rate at the date of transaction. Non-monetary items that are measured at fair value in a foreign currency are translated using the exchange rates at the date the fair value was determined.
Any exchange differences arising on the settlement of items or on translating items at rates different from those at which they were initially recorded are recognised in the Statement of comprehensive income in the period in which they arise. Exchange differences on non-monetary items are recognised in the Statement of Changes in Equity to the extent that they relate to a gain or loss on that non-monetary item taken to the Statement of Changes in Equity, otherwise such gains and losses are recognised in the Statement of comprehensive income.
The monetary assets and liabilities in the financial statements of foreign subsidiaries are translated at the rate of exchange ruling at the reporting date. Income and expenses are translated at monthly average rates providing there is no significant change in the month. The exchange differences arising from the retranslation of the opening net investment in subsidiaries are taken directly to the foreign exchange reserve in equity. On disposal of a foreign operation the cumulative translation differences are transferred to the statement of comprehensive income as part of the gain or loss on disposal.
Europa Oil and Gas (Holdings) plc is domiciled in the UK, which is its primary economic environment and the Company’s functional currency is Sterling. The Group’s current operations are based in the UK, Ireland, Romania and France, and the functional currencies of the Group’s entities are the prevailing local currencies in each jurisdiction. Given that the functional currency of the Company is Sterling, management has elected to continue to present the consolidated financial statements of the Group and Company in Sterling.
InvestmentsInvestments, which are only investments in subsidiaries, are carried at cost less any impairment. Additions include the net value of share options issued to employees of subsidiary companies less any lapsed, unvested options.

Europa Oil & Gas (Holdings) plc Annual Report and Accounts for the year ended 31 July 2013
24
1 Accounting Policies (continued)Financial instrumentsFinancial assets and liabilities are recognised on the statement of financial position when the Group becomes a party to the contractual provisions of the instrument. The Group and Company classifies its financial assets into loans and receivables, which comprise trade and other receivables and cash and cash equivalents. The Group has not classified any of its financial assets as held to maturity or available for sale or fair value through profit or loss.
Trade and other receivables are measured initially at fair value plus directly attributable transaction costs, and subsequently at amortised cost using the effective interest rate method, less provision for impairment. A provision is established when there is objective evidence that the Group will not be able to collect all amounts due. The amount of any provision is recognised in the Statement of comprehensive income.
Cash and cash equivalents comprise cash held by the Group, short-term bank deposits with an original maturity of three months or less and bank overdrafts. Within the consolidated statement of cash flows, cash and cash equivalents includes the overdraft drawn against the multi-currency facility described in Note 17.
The Group and Company classify financial liabilities into one of two categories, depending on the purpose for which the asset was acquired. The accounting policy for each category is as follows:
Fair value through profit or lossThis category comprises only out-of-the-money derivatives. They are carried in the statement of financial position at fair value with changes in fair value recognised in the consolidated Statement of comprehensive income. Other than these derivative financial instruments, the Group does not have any liabilities held for trading nor has it designated any financial liabilities as being at fair value through profit or loss.
Other financial liabilitiesInclude the following items:
Bank and other borrowings are initially recognised at fair value net of any transaction costs directly attributable to the issue of the instrument. Such interest bearing liabilities are subsequently measured at amortised cost using the effective interest rate method, which ensures that any interest expense over the period to repayment is at a constant rate on the balance of the liability carried in the statement of financial position. Interest expense in this context includes initial transaction costs and any interest or coupon payable while the liability is outstanding.
Trade payables and other short-term monetary liabilities, which are initially recognised at fair value and subsequently carried at amortised cost using the effective interest method.
Financial liabilities and equity instruments issued by the Group are classified in accordance with the substance of the contractual arrangements entered into and the definitions of a financial liability and an equity instrument. An equity instrument is any contract that evidences a residual interest in the assets of the Group after deducting all of its liabilities. Equity instruments issued by the Company are recorded at the proceeds received, net of direct issue costs.
Leased assetsDuring the current and prior year the Group and Company did not have any finance leases. All leases are regarded as operating leases and the payments made under them are charged to the statement of comprehensive income on a straight line basis over the lease term. Lease incentives are spread over the term of the lease.
Assets held for saleAssets classified as held for sale are those assets which are being actively marketed for sale and the Board has an expectation that the sale will be completed in the following year.
Treatment of finance costsAll finance costs are expensed through the income statement.
Defined contribution pension schemesThe pension costs charged against profits are the contributions payable to the scheme in respect of the accounting period.
InventoriesInventories comprise oil in tanks stated at the lower of cost and net realisable value. Cost is determined by reference to the actual cost of production in the period.
Joint venturesJoint ventures are those ventures in which the Group holds an interest on a long term basis which are jointly controlled by the Group and one or more venturers under a contractual arrangement. When these arrangements do not constitute entities in their own right, the consolidated financial statements reflect the relevant proportion of costs, revenues, assets and liabilities applicable to the Group’s interests in accordance with IAS 31. The Group’s exploration, development and production activities are generally conducted jointly with other companies in this way.
Notes to the financial statements
OU
R BU
SINESS
GO
VERN
AN
CE
FINA
NC
IAL STATEM
ENTS
AD
VISERS
25www.europaoil.com
1 Accounting Policies (continued)Share-based paymentsAll goods and services received in exchange for the grant of any share-based payment are measured at their fair values. Where employees are rewarded using share-based payments, the fair values of employees’ services are determined indirectly by reference to the fair value of the instrument granted to the employee. This fair value is appraised at the grant date and excludes the impact of non-market vesting conditions (for example, profitability and sales growth targets).
All equity-settled share-based payments are ultimately recognised as an expense in the statement of comprehensive income with a corresponding credit to reserves. Where options over the parent Company’s shares are granted to employees of subsidiaries of the parent, the charge is recognised in the statement of comprehensive income of the subsidiary. In the parent Company accounts there is an increase in the cost of the investment in the subsidiary receiving the benefit.
If vesting periods or other non-market vesting conditions apply, the expense is allocated over the vesting period, based on the best available estimate of the number of share options expected to vest. Estimates are subsequently revised if there is any indication that the number of share options expected to vest differs from previous estimates. Any cumulative adjustment prior to vesting is recognised in the current period. No adjustment is made to any expense recognised in prior periods if the number of share options ultimately exercised is different to that initially estimated.
Upon exercise of share options the proceeds received, net of attributable transaction costs, are credited to share capital, and where appropriate share premium.
Critical accounting judgements and key sources of estimation uncertaintyDetails of the Group’s significant accounting judgements and critical accounting estimates are set out in these financial statements and include:
Accounting judgements and estimates:• Carrying value of intangible assets (Note 10) – carrying values are justified by reference to future estimates of cash flows and expenditures,
discounted at appropriate rates.• Carrying value of property, plant and equipment (Note 11) – carrying values are justified by reference to future estimates of cash flows, discounted
at appropriate rates.• Decommissioning provision (Note 19) – inflation and discount rate estimates are used in calculating the provision, along with third party estimates
of remediation costs.• Share-based payments (Note 21) – various estimates, referenced to external sources where possible, are used in determining the fair value of options.
2 Operating segment analysis In the opinion of the directors the Group has five reportable segments as reported to the chief operating decision maker, being the UK, Ireland, Romania, France and North Africa.
The reporting on these segments to management focuses on revenue, operating costs and capital expenditure. The impact of such criteria is discussed further in the Chairman’s Statement, Operational Review and Financial Review of this annual report.
Income statement for the year ended 31 July 2013
UK Ireland Romania France North Africa Total £000 £000 £000 £000 £000 £000
Continuing operationsRevenue 4,503 — — — — 4,503
Other cost of sales (2,954) — — — — (2,954)
Exploration write-off — — — (231) — (231)
Impairment of producing fields — — — — — —
Cost of sales (2,954) — — (231) — (3,185)
Gross profit 1,549 — — (231) — 1,318Administrative expenses (824) — — (9) 115 (718)
Finance costs (193) — — — — (193)
Profit before tax 532 — — (240) 115 407Taxation (508) — — — — (508)
Loss for the year 24 — — (240) 115 (101)

Europa Oil & Gas (Holdings) plc Annual Report and Accounts for the year ended 31 July 2013
26
2 Operating segment analysis (continued)Segmental assets and liabilities as at 31 July 2013
UK Ireland Romania France North Africa Total £000 £000 £000 £000 £000 £000
Non-current assets 5,788 85 — 956 — 6,829
Current assets 1,595 — 38 — — 1,633
Held for sale assets 338 — — — — 338
Total assets 7,721 85 38 956 — 8,800
Non-current liabilities (4,583) — — — — (4,583)
Current liabilities (1,546) — (768) — — (2,314)
Total liabilities (6,129) — (768) — — (6,897)
Other segment items
Capital expenditure 551 309 — 165 — 1,025
Depreciation 578 — — — — 578
Share based payments 152 — — — — 152
Income statement for the year ended 31 July 2012
UK Ireland Romania France North Africa Total £000 £000 £000 £000 £000 £000
Continuing operationsRevenue 5,080 — — — — 5,080
Other cost of sales (2692) — — — — (2,692)
Exploration write-off (2,056) — (10,395) — — (12,451)
Impairment of producing fields (785) — — — — (785)
Cost of sales (5,533) — (10,395) — — (15,928)
Gross loss (453) — (10,395) — — (10,848)Administrative expenses (675) — (39) — (41) (755)
Finance costs (358) — (94) — — (452)
Loss before tax (1,486) — (10,528) — (41) (12,055)Taxation 739 — — — — 739
Loss for the year (747) — (10,528) — (41) (11,316)
Segmental assets and liabilities as at 31 July 2012
UK Ireland Romania France North Africa Total £000 £000 £000 £000 £000 £000
Non-current assets 5,995 66 — 1,039 — 7,100
Current assets 1,530 — 6 — — 1,536
Held for sale assets 338 — — — — 338
Total assets 7,863 66 6 1,039 — 8,974
Non-current liabilities (4,648) — (250) — — (4,898)
Current liabilities (1,573) — (688) — — (2,261)
Total liabilities (6,221) — (938) — — (7,159)
Other segment itemsCapital expenditure 583 66 1,863 521 — 3,033
Depreciation 674 — — — — 674
Share based payments 63 — — — — 63
100% of the total revenue (2012: 100%) relates to UK based customers. Of this figure, one single customer (2012: one) commands more than 99% of the total.
Notes to the financial statements

OU
R BU
SINESS
GO
VERN
AN
CE
FINA
NC
IAL STATEM
ENTS
AD
VISERS
27www.europaoil.com
3 Profit/(loss) before taxationProfit/(loss) from continuing operations is stated after charging:
2013 2012 Note £000 £000
Depreciation on property, plant & equipment 11 578 673
Staff costs including directors 5 1,181 1,022
Exploration write-off 10 231 12,451
Impairment of property, plant and equipment 11 — 785
Fees payable to the auditor for the audit 41 42
Fees payable to the auditor for non-audit services 8 7
Operating leases – land and buildings 38 37
Amount of inventory recognised as an expense / (income) 23 (14)
Foreign exchange 21 24
The Company has taken advantage of the exemption provided under Section 408 of the Companies Act 2006 not to publish its individual statement of comprehensive income and related notes. The profit dealt with in the financial statements of the parent Company is £1,206,000 (2012: loss £13,856,000).
4 Directors’ emolumentsDirectors’ salaries and fees
2013 2012 £000 £000
WH Adamson 40 40
CW Ahlefeldt-Laurvig 25 21
PA Barrett (to 22 April 2012) — 96
RJHM Corrie 25 21
P Greenhalgh 177 129
HGD Mackay (from 10 October 2011) 234 149
Total 501 456
Directors’ pensions
2013 2012 £000 £000
PA Barrett — 16
P Greenhalgh 18 17
ES Syba — 6
Total 18 39
The above charge represents premiums paid to money purchase pension plans during the year. Under the terms of a compromise agreement dated 12 August 2010, the Company continued to pay pension contributions in respect of ES Syba until February 2012. PA Barrett resigned as a director on 21 October 2011 and remained an employee until 22 April 2012.
Social security costs in relation to directors’ remuneration were £64,000 (£2012: £57,000).
Directors’ share based payments
2013 2012 £000 £000
WH Adamson 8 11
RJHM Corrie — 1
P Greenhalgh 36 11
HGD Mackay 96 39
Total 140 62
The above represents the accounting charge in respect of stock options with vesting periods during the year. No share options were exercised during the period (2012: none).
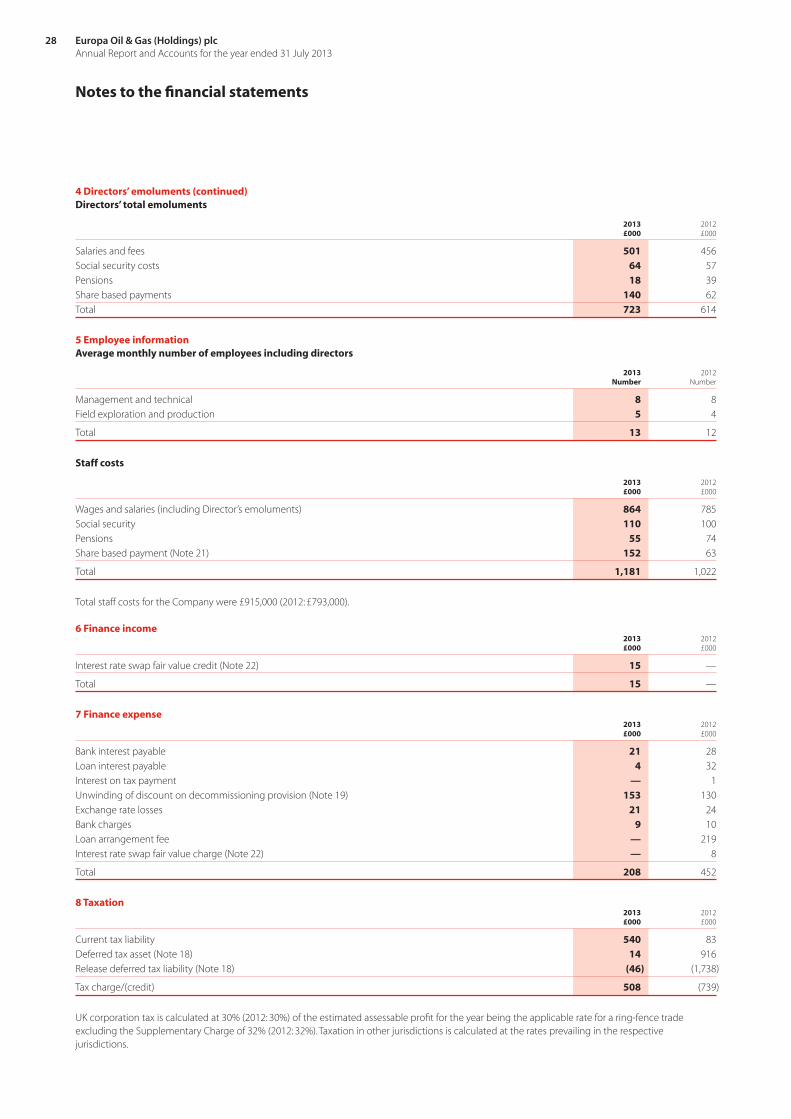
Europa Oil & Gas (Holdings) plc Annual Report and Accounts for the year ended 31 July 2013
28
4 Directors’ emoluments (continued)Directors’ total emoluments
2013 2012 £000 £000
Salaries and fees 501 456
Social security costs 64 57
Pensions 18 39
Share based payments 140 62
Total 723 614
5 Employee informationAverage monthly number of employees including directors
2013 2012 Number Number
Management and technical 8 8
Field exploration and production 5 4
Total 13 12
Staff costs
2013 2012 £000 £000
Wages and salaries (including Director’s emoluments) 864 785
Social security 110 100
Pensions 55 74
Share based payment (Note 21) 152 63
Total 1,181 1,022
Total staff costs for the Company were £915,000 (2012: £793,000).
6 Finance income 2013 2012 £000 £000
Interest rate swap fair value credit (Note 22) 15 —
Total 15 —
7 Finance expense 2013 2012 £000 £000
Bank interest payable 21 28
Loan interest payable 4 32
Interest on tax payment — 1
Unwinding of discount on decommissioning provision (Note 19) 153 130
Exchange rate losses 21 24
Bank charges 9 10
Loan arrangement fee — 219
Interest rate swap fair value charge (Note 22) — 8
Total 208 452
8 Taxation 2013 2012 £000 £000
Current tax liability 540 83
Deferred tax asset (Note 18) 14 916
Release deferred tax liability (Note 18) (46) (1,738)
Tax charge/(credit) 508 (739)
UK corporation tax is calculated at 30% (2012: 30%) of the estimated assessable profit for the year being the applicable rate for a ring-fence trade excluding the Supplementary Charge of 32% (2012: 32%). Taxation in other jurisdictions is calculated at the rates prevailing in the respective jurisdictions.
Notes to the financial statements

OU
R BU
SINESS
GO
VERN
AN
CE
FINA
NC
IAL STATEM
ENTS
AD
VISERS
29www.europaoil.com
8 Taxation (continued) 2013 2012 £000 £000
Profit/(loss) on ordinary activities per the accounts 407 (12,055)
Tax reconciliationProfit/(loss) on ordinary activities multiplied by the standard rate of corporation tax in the UK of 30% (2012: 30%) 122 (3,617)
Expenses not deductible for tax purposes 115 3,990
Other reconciling items including Supplementary Charge in the UK 271 (1,112)
Total tax charge/(credit) 508 (739)
9 Loss per share Basic loss per share (LPS) has been calculated on the loss or profit after taxation divided by the weighted average number of shares in issue during the period. Diluted LPS uses an average number of shares adjusted to allow for the issue of shares, on the assumed conversion of all in-the-money options.
The Company’s average share price for the year to 31 July 2013 was 9.32p (2012: 8.97p), which was below the exercise price of all of the 11,685,000 (2012: 8,275,000) outstanding share options. As there was a loss in the period for both years the options are not considered dilutive.
The calculation of the basic and diluted (loss) per share is based on the following:
2013 2012 £000 £000
LossesLoss after tax (101) (11,316)
Weighted average number of sharesfor the purposes of basic and diluted LPS 137,855,504 135,921,685
10 Intangible assets Intangible assets - Group 2013 2012 £000 £000
At 1 August 2,127 11,348
Additions 550 3,230
Exploration write-off (231) (12,451)
At 31 July 2,446 2,127
Intangible assets comprise the Group’s pre-production expenditure on licence interests as follows: 2013 2012 £000 £000
France (Béarn des Gaves permit) 950 1,039
Ireland 78 66
UK PEDL143 (Holmwood) 463 437
UK PEDL180 (Wressle) 315 279
UK PEDL181 (Caistor) 429 113
UK PEDL182 (Broughton) 211 193
Total 2,446 2,127
2013 2012 £000 £000
Exploration write-offFrance (Tarbes val d’Adour permit) 231 —
UK PEDL150 (Hykeham) — 2,057
Romania — 10,394
Total 231 12,451
The Tarbes Val d’Adour permit was not renewed by the French authorities within the set timeframe of the renewal process. Under the terms of the agreement, if notification of renewal has not been received by the expiry date then the permit is deemed to have lapsed. While Europa has appealed against this outcome, with this uncertainty, the intangible asset has been written off in the period.

Europa Oil & Gas (Holdings) plc Annual Report and Accounts for the year ended 31 July 2013
30
10 Intangible assets (continued) Intangible assets - Group (continued)Certain of the UK exploration licences carry well commitments in 2014. If the Group elects to continue with these licences, it will need to fund the drilling of wells by raising finance or by farming down. If the Group is not able to raise funding, or elects not to continue in the licences, then the impact on the financial statements will be the impairment of some or all of the intangible assets disclosed above. Further details of the commitments are included in Note 23.
Intangible assets - Company 2013 2012 £000 £000
At 1 August — —
Additions – Transferred from group company 1,023 —
Additions 5 —
At 31 July 1,028 —
Licence interests relating to France and Ireland were transferred to the Company from a subsidiary in the period, as the legal party to the licences is the Company.
Intangible assets comprise the Company’s pre-production expenditure on licence interests as follows:
2013 2012 £000 £000
France (Béarn des Gaves permit) 950 —
Ireland 78 —
Total 1,028 —
11 Property, plant and equipment Property, plant & equipment – Group
Furniture & Leasehold Producing computers building fields Total £000 £000 £000 £000
CostAt 1 August 2011 66 437 10,785 11,288
Additions 16 — — 16
Transfer to assets for sale — (437) — (437)
Disposals (39) — — (39
At 31 July 2012 43 — 10,785 10,828
Additions 2 — — 2
At 31 July 2013 45 — 10,785 10,830
Depreciation, depletion and impairmentAt 1 August 2011 42 92 4,412 4,546
Charge for year 14 8 651 673
Transfer to assets for sale — (100) — (100)
Disposal (35) — — (35)
Impairment — — 785 785
At 31 July 2012 21 — 5,848 5,869
Charge for year 10 — 568 578
At 31 July 2013 31 — 6,416 6,447
Net Book ValueAt 31 July 2011 24 345 6,373 6,742
At 31 July 2012 22 — 4,937 4,959
At 31 July 2013 14 — 4,369 4,383
The producing fields referred to in the table above are the production assets of the Group, namely the oilfields at Crosby Warren and West Firsby, and the Group’s interest in the Whisby-4 well, representing three of the Group’s cash generating units.
Notes to the financial statements

OU
R BU
SINESS
GO
VERN
AN
CE
FINA
NC
IAL STATEM
ENTS
AD
VISERS
31www.europaoil.com
11 Property, plant and equipment (continued)The carrying value of each producing field was tested for impairment by comparing the carrying value with the value in use. The value in use was calculated using a Brent crude price of $110 per barrel, an assumption of no future tax losses being available and a discount rate of 10%. There was no impairment at any of the sites in 2013 (2012: Crosby Warren £785,000, West Firsby and Whisby-4 well £nil).
Property, plant and equipment – Company Furniture & Leasehold computers building Total £000 £000 £000
CostAt 1 August 2011 66 437 503
Additions 16 — 16
Transfer to assets held for sale — (437) (437)
Disposals (39) — (39)
At 31 July 2012 43 — 43
Additions 2 — 2
At 31 July 2013 45 — 45
DepreciationAt 1 August 2011 42 92 134
Charge for the year 14 8 22
Transfer to assets held for sale — (100) (100)
On disposals (35) — (35)
At 31 July 2012 21 — 21
Charge for year 10 — 10
At 31 July 2013 31 — 31
Net Book ValueAt 31 July 2011 24 345 369
At 31 July 2012 22 — 22
At 31 July 2013 14 — 14
The Abingdon property has been vacated and has been put up for sale. The net book value has been transferred to current assets (see Note 14). The property loan of £208,000 (2012: £230,000) described in Note 17 is secured against this building.
12 Investments – CompanyInvestment in subsidiaries 2013 2012 £000 £000
At 1 August 3,316 3,315
Current year additions 4 1
31 July 3,320 3,316
The Company’s investments at the reporting date in the share capital of unlisted companies include 100% of Europa Oil & Gas Limited (this company undertakes oil and gas exploration, development and production) and 100% of Europa Oil & Gas (West Firsby) Limited (this company is non-trading). These two companies are registered in England and Wales.
The results of the two companies have been included in the consolidated accounts. Europa Oil & Gas Limited owns 100% of the ordinary share capital of each of: Europa Oil & Gas Resources Limited (this UK company undertakes exploration in the area of underground coal gasification); Europa Oil & Gas SRL registered in Romania; and Malopolska Oil & Gas Company Sp.z.o.o., registered in Poland. The result of the Polish company has not been consolidated on the grounds that it is not material to the Group.
Additions to the cost of investments represent the net value of options over the shares of the Company issued to employees of subsidiary companies less any lapsed, unvested options.

Europa Oil & Gas (Holdings) plc Annual Report and Accounts for the year ended 31 July 2013
32
Notes to the financial statements
13 Inventories – Group 2013 2012 £000 £000
Oil in tanks 33 56
14 Trade and other receivables Group Company
2013 2012 2013 2012 £000 £000 £000 £000
Current trade and other receivablesTrade receivables 760 1,057 299 —
Other receivables 90 109 8 17
Prepayments 78 84 47 44
Total 928 1,250 354 61
Loans to subsidiaries have been fully written down in the Company accounts.
15 Assets classified as held for saleIn January 2012 the Group relocated its head office from Abingdon to London. The vacated leasehold property in Abingdon has been classified as an asset held for sale. The property loan of £208,000 (2012: £230,000) described in Note 17 is secured against this building and will be repaid out of the sale proceeds.
Group Company
2013 2012 2013 2012 £000 £000 £000 £000
Property, plant & equipment
Cost at 1 August 437 — 437 —
Transfer from non-current assets — 437 — 437
Cost at 31 July 437 437 437 437 Depreciation at 1 August 99 — 99 —
Transfer from non-current assets — 99 — 99
Depreciation at 31 July 99 99 99 99
Net book value at 31 July 338 338 338 338
16 Trade and other payables Group Company
2013 2012 2013 2012 £000 £000 £000 £000
Trade payables 417 1,032 67 105
Other payables 16 14 — —
Accruals 794 834 119 57
1,227 1,880 186 162
Derivative liabilityInterest rate swap 48 64 48 64
Group other payables includes advances received from partners on projects in UK. More information on the interest rate swap is included in Note 22.
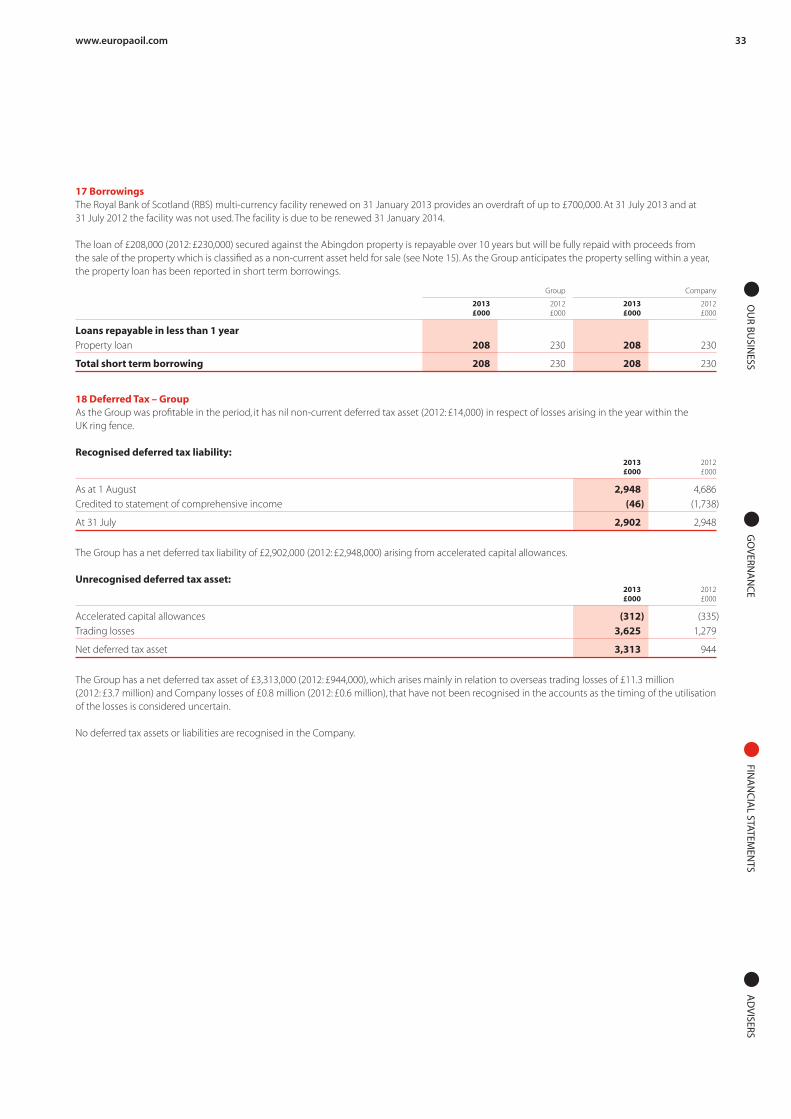
OU
R BU
SINESS
GO
VERN
AN
CE
FINA
NC
IAL STATEM
ENTS
AD
VISERS
33www.europaoil.com
17 Borrowings The Royal Bank of Scotland (RBS) multi-currency facility renewed on 31 January 2013 provides an overdraft of up to £700,000. At 31 July 2013 and at 31 July 2012 the facility was not used. The facility is due to be renewed 31 January 2014.
The loan of £208,000 (2012: £230,000) secured against the Abingdon property is repayable over 10 years but will be fully repaid with proceeds from the sale of the property which is classified as a non-current asset held for sale (see Note 15). As the Group anticipates the property selling within a year, the property loan has been reported in short term borrowings.
Group Company
2013 2012 2013 2012 £000 £000 £000 £000
Loans repayable in less than 1 yearProperty loan 208 230 208 230
Total short term borrowing 208 230 208 230
18 Deferred Tax – GroupAs the Group was profitable in the period, it has nil non-current deferred tax asset (2012: £14,000) in respect of losses arising in the year within the UK ring fence.
Recognised deferred tax liability: 2013 2012 £000 £000
As at 1 August 2,948 4,686
Credited to statement of comprehensive income (46) (1,738)
At 31 July 2,902 2,948
The Group has a net deferred tax liability of £2,902,000 (2012: £2,948,000) arising from accelerated capital allowances.
Unrecognised deferred tax asset: 2013 2012 £000 £000
Accelerated capital allowances (312) (335)
Trading losses 3,625 1,279
Net deferred tax asset 3,313 944
The Group has a net deferred tax asset of £3,313,000 (2012: £944,000), which arises mainly in relation to overseas trading losses of £11.3 million (2012: £3.7 million) and Company losses of £0.8 million (2012: £0.6 million), that have not been recognised in the accounts as the timing of the utilisation of the losses is considered uncertain.
No deferred tax assets or liabilities are recognised in the Company.

Europa Oil & Gas (Holdings) plc Annual Report and Accounts for the year ended 31 July 2013
34
19 Provisions – GroupDecommissioning provisions are based on third party estimates of work which will be required and the judgement of directors. By its nature, the detailed scope of work required and timing is uncertain.
Provisions for decommissioning the Barchiz and Hykeham wells were classified as short-term in the reporting period. Work on Barchiz started in the year and costs were written against the provision. Work on Hykeham started post the reporting date.
Short-term provisions 2013 2012 £000 £000
As at 1 August — —
Transferred from long-term provisions 422 —
Utilised in year - Barchiz (132) —
At 31 July 290 —
Long-term provisions 2013 2012 £000 £000
As at 1 August 1,950 1,570
Charged to statement of comprehensive income 153 130
Added to exploration write-off — 250
Transferred to short-term provisions (422) —
At 31 July 1,681 1,950
20 Called up share capital 2013 2012 £000 £000
Allotted, called up and fully paid137,855,504 ordinary shares of 1p each (2012: 137,855,504) 1,379 1,379
All the allotted shares are of the same class and rank pari passu.
In 2005, the Company issued 39,999,998 ordinary shares of 1p at a nil premium in exchange for the entire shareholding of Europa Oil & Gas Limited. This gave rise to the merger reserve at 31 July 2013 of £2,868,000 (2012: £2,868,000).
The following describes the purpose of each reserve within owners’ equity:
Reserve Description and purpose
Share premium Amount subscribed for share capital in excess of nominal valueMerger reserve Reserve created on issue of shares on acquisition of subsidiaries in prior yearsForeign exchange reserve Reserve arising on translation of foreign subsidiariesRetained deficit Cumulative net gains and losses recognised in the consolidated statement of comprehensive income
Notes to the financial statements

OU
R BU
SINESS
GO
VERN
AN
CE
FINA
NC
IAL STATEM
ENTS
AD
VISERS
35www.europaoil.com
21 Share based payments There are 11,685,000 ordinary 1p share options outstanding (2012: 8,275,000). These are held by certain members of the Board: WH Adamson 500,000; RJHM Corrie 500,000; P Greenhalgh 3,075,000; HGD Mackay 6,600,000, and employees of the Group 1,010,000.
Of the outstanding options, 3,885,000 are exercisable: one third 18 months after grant; a further third 30 months after grant and the balance 42 months after grant, with no further vesting conditions.
5,000,000 options held by HGD Mackay are exercisable after 24 months, subject to the Company’s share price trading above a target level for at least 30 consecutive business days. The options are exercisable as follows:
Number of options Target price
1,000,000 25p
1,000,000 35p
1,000,000 45p
1,000,000 50p
1,000,000 60p
The remaining 2,800,000 options are exercisable after 12 months, subject to the Company’s share price trading above 13p for at least 30 consecutive business days.
The latest date at which all options can be exercised is the 10th anniversary from the grant date.
The fair values of all options were determined using a Black Scholes Merton model. Volatility is based on the Company’s share price volatility since flotation.
The inputs used to determine the values of the 3,410,000 options granted in 2013 are detailed in the table below:
24 Oct 24 OctGrant date 2012 2012
Number of options 610,000 2,800,000
Share price at grant 7.6p 7.6p
Exercise price 10p 10p
Target price na 13p
Volatility 90% 90%
Dividend yield nil nil
Risk free investment rate 0.88% 0.73%
Option life (years) 6 5
Fair value per share 5.01p 3.70p
The inputs used to determine the values of the 5,250,000 options granted in 2012 are detailed in the table below:
10 Oct 10 Oct 10 Oct 10 Oct 10 Oct 24 OctGrant date 2011 2011 2011 2011 2011 2011
Number of options 1,000,000 1,000,000 1,000,000 1,000,000 1,000,000 250,000
Share price at grant 10.25p 10.25p 10.25p 10.25p 10.25p 9.5p
Exercise price 13p 13p 13p 13p 13p 10p
Target price 25p 35p 45p 50p 60p na
Volatility 90% 90% 90% 90% 90% 90%
Dividend yield nil nil nil nil nil nil
Risk free investment rate 1.73% 1.73% 1.73% 1.73% 1.73% 1.58%
Option life (years) 5 6 7 8 9 5
Fair value per share 3.18p 2.74p 2.18p 1.52p 0.79p 6.15p
Based on the above fair values above, the charge arising from employee share options was £152,000 (2012: £63,000).
In the year 3,410,000 options were granted and no options expired or were forfeited or exercised (2012: 5,250,000 options were granted, 357,142 expired, and none were forfeited or exercised).

Europa Oil & Gas (Holdings) plc Annual Report and Accounts for the year ended 31 July 2013
36
21 Share based payments (continued) 2013 2013 2012 2012 Number Average Number Average of options exercise price of options exercise price
Outstanding at the start of the year 8,275,000 15.05p 3,382,142 18.35p
Granted 3,410,000 10p 5,250,000 12.86p
Expired — — (357,142) 14p
Outstanding at the end of the year 11,685,000 13.58p 8,275,000 15.05p
Exercisable at the end of the year 3,024,999 18.75p 2,953,805 18.80p
The weighted average remaining contractual life of share options outstanding at the end of the period was 7.7 years (2012: 8.1 years).
22 Financial instruments The Group’s and Company’s financial instruments comprise cash and cash equivalents, bank borrowings, loans, interest rate derivatives, and items such as trade and other receivables and trade and other payables which arise directly from its operations. Europa’s activities are subject to a range of financial risks the main ones being: credit; liquidity; interest rates; commodity prices; foreign exchange and capital. These risks are managed through ongoing review taking into account the operational, business and economic circumstances at that time.
Credit riskThe Group is exposed to credit risk as all crude oil production is sold to one multinational oil company. The customer is invoiced monthly for the oil delivered to the refinery in the previous month and invoices are settled in full on the 15th of the following month. At 31 July 2013 trade receivables were £761,000 representing one month of oil revenue of £460,000 and other receivables due from the Irish licence joint venture partner of £300,000 (2012: £1,057,000 representing one month of oil revenue of £417,000 and other receivables in respect of oil deliveries made on behalf of other parties and joint venture partners of £640,000). The fair value of trade receivables and payables approximates to their carrying value because of their short maturity. Any surplus cash is held on short term deposit with Royal Bank of Scotland. The maximum credit exposure in the year was £459,000 (2012: £513,000).
The Company exposure to credit risk is negligible.
Liquidity riskThough the Group has the benefit of a regular revenue stream, there is still a need for bank financing. The Company has in place a £0.7 million flexible multi-currency facility with its bankers which can be utilised in either Sterling or foreign currency via an overdraft. At the year end there was no overdraft (2012: no overdraft).
The Group and Company monitor their levels of working capital to ensure they can meet liabilities as they fall due. The following table shows the contractual maturities of the Group’s financial assets and liabilities.
Trade Trade and other and other Derivative Short-term receivables payables at fair value borrowings £000 £000 £000 £000
At 31 July 20136 months or less 850 (1,227) (5) —6-12 months — — (5) (208)1-2 years — — (9) —2-5 years — — (20) —Over 5 years — — (9) —
Total 850 (1,227) (48) (208)
At 31 July 20126 months or less 1,160 (1,763) (6) —
6-12 months 6 (117) (6) (230)
1-2 years — — (11) —
2-5 years — — (25) —
Over 5 years — — (16) —
Total 1,166 (1,880) (64) (230)
Notes to the financial statements
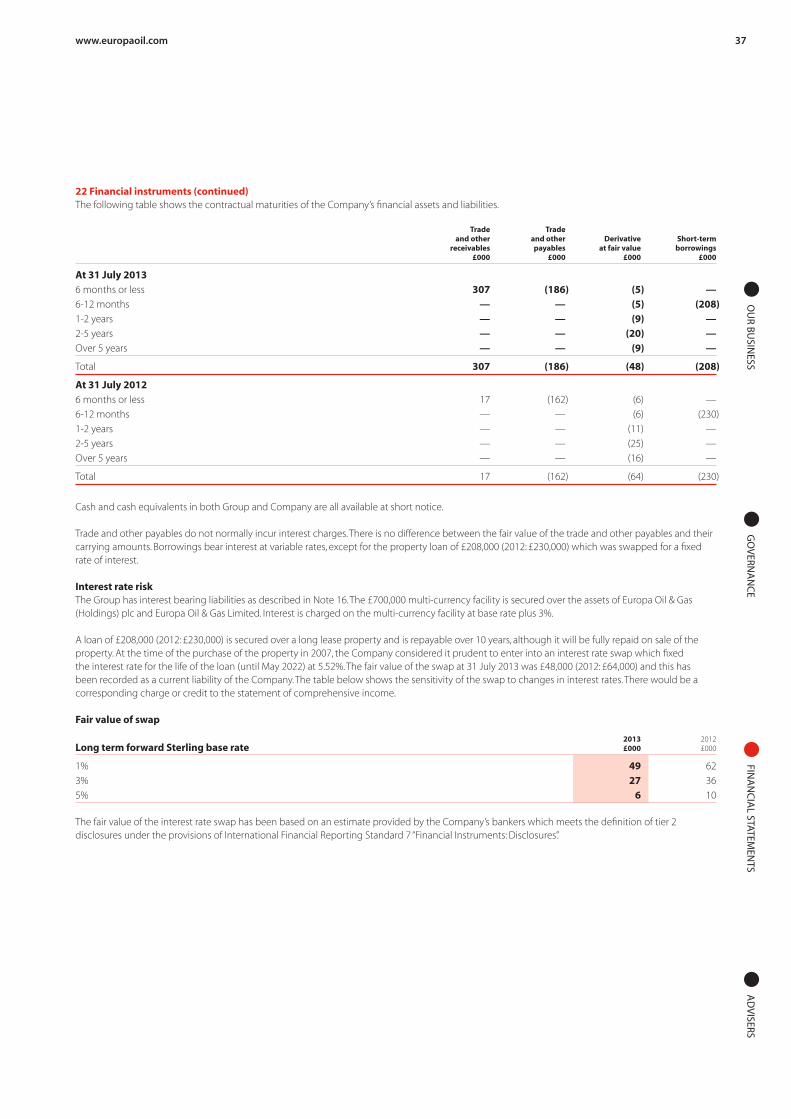
OU
R BU
SINESS
GO
VERN
AN
CE
FINA
NC
IAL STATEM
ENTS
AD
VISERS
37www.europaoil.com
22 Financial instruments (continued)The following table shows the contractual maturities of the Company’s financial assets and liabilities.
Trade Trade and other and other Derivative Short-term receivables payables at fair value borrowings £000 £000 £000 £000
At 31 July 20136 months or less 307 (186) (5) —6-12 months — — (5) (208)1-2 years — — (9) —2-5 years — — (20) —Over 5 years — — (9) —
Total 307 (186) (48) (208)
At 31 July 20126 months or less 17 (162) (6) —
6-12 months — — (6) (230)
1-2 years — — (11) —
2-5 years — — (25) —
Over 5 years — — (16) —
Total 17 (162) (64) (230)
Cash and cash equivalents in both Group and Company are all available at short notice.
Trade and other payables do not normally incur interest charges. There is no difference between the fair value of the trade and other payables and their carrying amounts. Borrowings bear interest at variable rates, except for the property loan of £208,000 (2012: £230,000) which was swapped for a fixed rate of interest.
Interest rate riskThe Group has interest bearing liabilities as described in Note 16. The £700,000 multi-currency facility is secured over the assets of Europa Oil & Gas (Holdings) plc and Europa Oil & Gas Limited. Interest is charged on the multi-currency facility at base rate plus 3%.
A loan of £208,000 (2012: £230,000) is secured over a long lease property and is repayable over 10 years, although it will be fully repaid on sale of the property. At the time of the purchase of the property in 2007, the Company considered it prudent to enter into an interest rate swap which fixed the interest rate for the life of the loan (until May 2022) at 5.52%. The fair value of the swap at 31 July 2013 was £48,000 (2012: £64,000) and this has been recorded as a current liability of the Company. The table below shows the sensitivity of the swap to changes in interest rates. There would be a corresponding charge or credit to the statement of comprehensive income.
Fair value of swap
2013 2012Long term forward Sterling base rate £000 £000
1% 49 62
3% 27 36
5% 6 10
The fair value of the interest rate swap has been based on an estimate provided by the Company’s bankers which meets the definition of tier 2 disclosures under the provisions of International Financial Reporting Standard 7 “Financial Instruments: Disclosures”.

Europa Oil & Gas (Holdings) plc Annual Report and Accounts for the year ended 31 July 2013
38
22 Financial instruments (continued)Commodity price riskThe selling price of the Group’s production of crude oil is set at a small discount to Brent prices. The table below shows the range of prices achieved in the year and the sensitivity of the Group’s Profit/(Loss) Before Taxation (PBT) to such movements in oil price. There would be a corresponding increase or decrease to net assets. There is no commodity price risk in the Company.
Price PBT Price PBT 2013 2013 2012 2012Oil price Month $/bbl £000 $/bbl £000
Highest Feb 13 114.7 699 123.8 (11,442)
Average 107.6 407 110.0 (12,055)
Lowest Apr 13 100.4 111 93.3 (12,833)
Foreign exchange riskThe Group’s production of crude oil is invoiced in US Dollars. Revenue is translated into Sterling using a monthly exchange rate set by reference to the market rate. The table below shows the range of average monthly US Dollar exchange rates used in the year and the sensitivity of the Group’s PBT to similar movements in US Dollar exchange. There would be a corresponding increase or decrease to net assets.
2013 2013 2012 2012 Rate PBT Rate PBTUS Dollar Month $/£ £000 $/£ £000
Highest Dec 12 1.617 260 1.628 (12,190)
Average 1.563 407 1.585 (12,055)
Lowest May 13 1.516 544 1.528 (11,870)
The table below shows the Group’s currency exposures. Exposures comprise the net financial assets and liabilities of the Group that are not denominated in the functional currency.
Group Company
2013 2012 2013 2012Currency Item £000 £000 £000 £000
Euro Cash and cash equivalents 6 (1) 6 (1)
Trade and other payables (61) (15) (3) (8)
US Dollar Cash and cash equivalents 8 159 — (4)
Trade and other receivables 636 879 — —
Trade and other payables (2) (562) (2) —
Total 587 460 1 (13)
Capital risk managementThe Group’s objectives when managing capital are to safeguard the Group’s ability to continue as a going concern in order to provide returns for shareholders and maintain an optimal capital structure to reduce the cost of capital. The Group defines capital as being the consolidated shareholder equity (Note 20) and bank borrowings (Note 17). The Board monitors the level of capital as compared to the Group’s long term debt commitments and adjusts the ratio of debt to capital as is determined to be necessary, by issuing new shares, reducing or increasing debt, paying dividends and returning capital to shareholders. The Group is not subject to any externally imposed capital requirements.
23 Capital commitments and guaranteesAs at the reporting date, Europa had contractual commitments to drill up to four wells onshore UK. In PEDL180 Wressle is expected to be drilled in 2013 and Europa is able to fund this from existing resources. Wells at PEDL143 Holmwood (subject to planning approval), PEDL182 Broughton and PEDL181 Caistor (both additionally subject to detailed prospect mapping) are not currently funded (see Note 10). Europa’s share of total costs on the four wells is expected to be £3.8 million.
24 Operating lease commitmentsEuropa Oil & Gas Limited pays an annual site rental for the land upon which the West Firsby and Crosby Warren oil field facilities are located. The West Firsby lease runs until September 2022 and can be terminated upon giving 2 months notice. The annual cost is currently £18,000 (2012: £18,000) and increases annually in line with the retail price index. The Crosby Warren lease runs until December 2022 and can be terminated on 3 months notice. The annual cost is currently £20,000 (2012: £20,000).
Notes to the financial statements
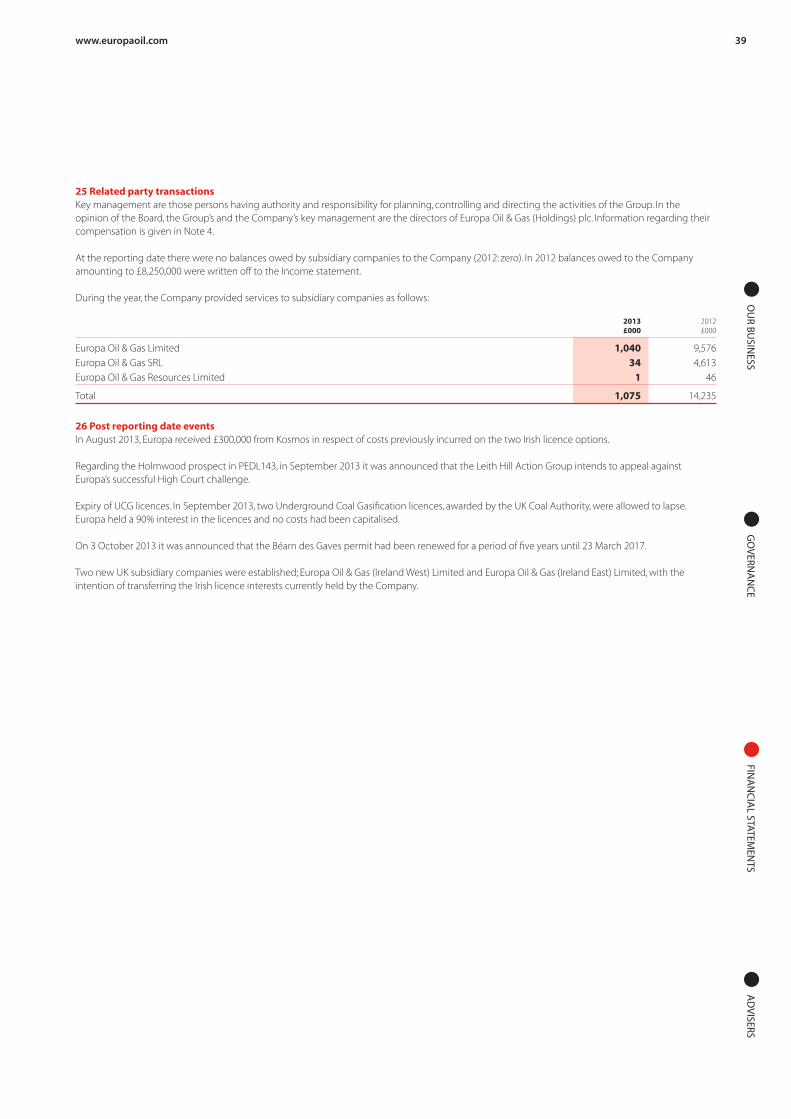
OU
R BU
SINESS
GO
VERN
AN
CE
FINA
NC
IAL STATEM
ENTS
AD
VISERS
39www.europaoil.com
25 Related party transactionsKey management are those persons having authority and responsibility for planning, controlling and directing the activities of the Group. In the opinion of the Board, the Group’s and the Company’s key management are the directors of Europa Oil & Gas (Holdings) plc. Information regarding their compensation is given in Note 4.
At the reporting date there were no balances owed by subsidiary companies to the Company (2012: zero). In 2012 balances owed to the Company amounting to £8,250,000 were written off to the Income statement.
During the year, the Company provided services to subsidiary companies as follows:
2013 2012 £000 £000
Europa Oil & Gas Limited 1,040 9,576
Europa Oil & Gas SRL 34 4,613
Europa Oil & Gas Resources Limited 1 46
Total 1,075 14,235
26 Post reporting date eventsIn August 2013, Europa received £300,000 from Kosmos in respect of costs previously incurred on the two Irish licence options.
Regarding the Holmwood prospect in PEDL143, in September 2013 it was announced that the Leith Hill Action Group intends to appeal against Europa’s successful High Court challenge.
Expiry of UCG licences. In September 2013, two Underground Coal Gasification licences, awarded by the UK Coal Authority, were allowed to lapse. Europa held a 90% interest in the licences and no costs had been capitalised.
On 3 October 2013 it was announced that the Béarn des Gaves permit had been renewed for a period of five years until 23 March 2017.
Two new UK subsidiary companies were established; Europa Oil & Gas (Ireland West) Limited and Europa Oil & Gas (Ireland East) Limited, with the intention of transferring the Irish licence interests currently held by the Company.
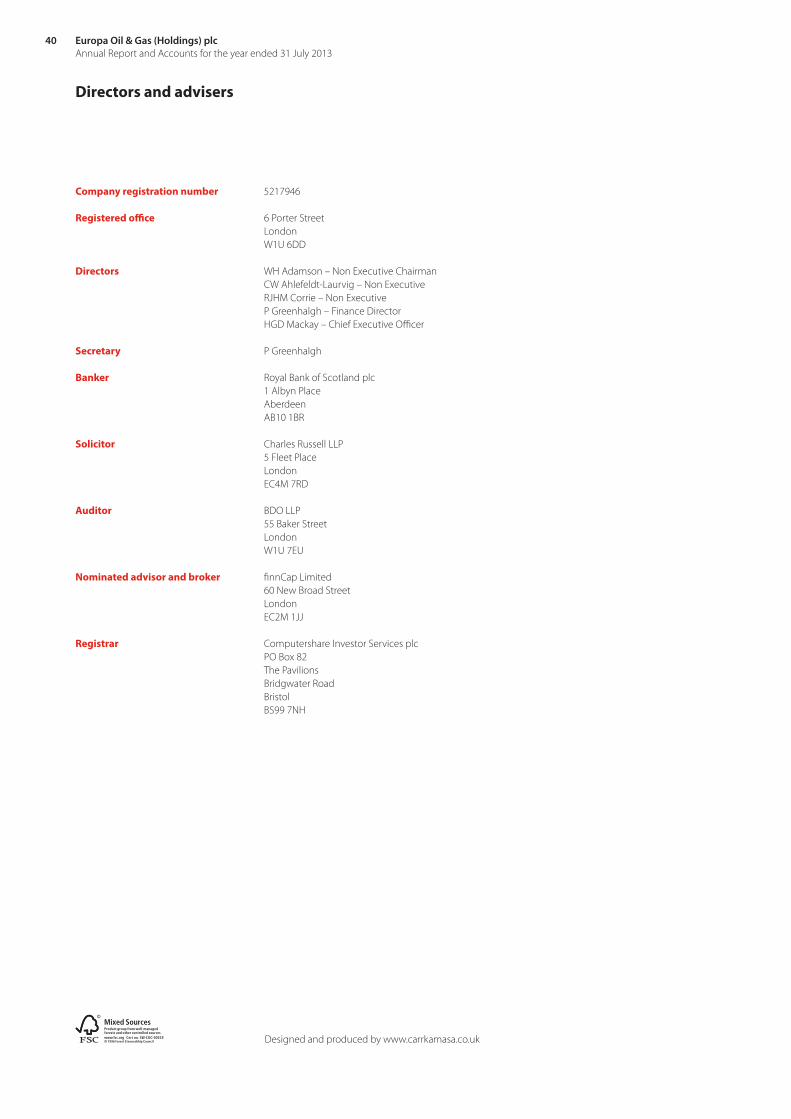
Europa Oil & Gas (Holdings) plc Annual Report and Accounts for the year ended 31 July 2013
40
Directors and advisers
Company registration number 5217946
Registered office 6 Porter Street London W1U 6DD
Directors WH Adamson – Non Executive Chairman CW Ahlefeldt-Laurvig – Non Executive RJHM Corrie – Non Executive P Greenhalgh – Finance Director HGD Mackay – Chief Executive Officer Secretary P Greenhalgh
Banker Royal Bank of Scotland plc 1 Albyn Place Aberdeen AB10 1BR
Solicitor Charles Russell LLP 5 Fleet Place London EC4M 7RD
Auditor BDO LLP 55 Baker Street London W1U 7EU
Nominated advisor and broker finnCap Limited 60 New Broad Street London EC2M 1JJ
Registrar Computershare Investor Services plc PO Box 82 The Pavilions Bridgwater Road Bristol BS99 7NH
Designed and produced by www.carrkamasa.co.uk

OU
R BU
SINESS
GO
VERN
AN
CE
FINA
NC
IAL STATEM
ENTS
AD
VISERS
www.europaoil.com
EUROPA OIL & GAS (HOLDINGS) PLC6 Porter StreetLondon, W1U 6DDTel: +44 (0)20 7224 3770
www.europaoil.com
EUR
OPA
OIL &
GA
S (HO
LDIN
GS) PLC
Annual Rep
ort and A
ccounts for the year ended
31 July 2013