experiments - digital library/67531/metadc624596/m2/1/high... · experiments post conference...
TRANSCRIPT

. . e$@Jt)$ifLz.q&y~
15ti InternationalConference on StructuralMechanics in Reactor Technology
Experiments
Post Conference Seminar on Containment of Nuclear Reactors ‘-HOAM Convention Cente~ Seoul, Korea, August 23-24,1999
on Corium Dispersion after Lower Head Failure at @ +
Moderate Pressure
L. Meyer,G. Jacobs,D. Wilhelm,M. GargalloForschungszentnunKadsruheInstitut * Kern- und EnergietechnikPostfach3640D-76021KarlsruheGERMANYmeyer@iket.fzk.de
o c“ --
6$T. K. Blanchat
(& s
SandiaNationalLaboratories%%
A’.Reactor SafetyExperiments,Department6423 # ,
P.O. Box 5800,MS 1139Albuquerque,NM 87185-1139USAtkblanc(tjkandia.gov
.
ABS’i’RACT
Concerning the mitigation of high pressure core melt scenarios, the design objective for future
PWRS is to transfer high pressure core melt to low pressure core melt sequences, by means of ‘
pressure relief valves at the primary circuit, with such a discharge capacity to limit the pressure in
the reactor coolant system to less than 20 bar. Studies have shown that in late in-vessel reflooding
scenarios there may be a time window where the pressure is indeed in this range, at the moment of
the reactor vessel rupture. It has to be verified that large quantities of corium released from the
vessel after failure at pressures <20 bar cannot be carried out of the reactor pit, because the melt
collecting and cooling concept of fiture PWRS would be rendered useless.
Existing experiments investigated the melt dispersal phenomena in the context of the DCH reso-
lution for existing power plants in the USA, most of them having cavities ~th large ins~ent
tunnels leading into subcompartrnents. For such designs, breaches with small cross sections at
high vessel failure pressures had been studied. However, some present and t%tureEuropean PWRS
have an annular cavity design without a large pathway out of the cavity other than through the nar-
row annular gap between the RPV and the cavity wall. Therefore, an experimental program was
launched, focusing on the a!nnuhtrcavity design and low pressure vessel failure.
The first part of the program comprises two experiments which were performed with thermite
melt steam and a prototypic atmosphere in the containment in a scale 1:10. The initial pressure in
the RPV-model was 11 and 15 bars, and the breach was a hole at the center of the lower head with
a scaled diameter of 100 cm and 40 cm, respectively. ‘Themain results were: 78°/0of melt mass
were ejected out of the cavity with the large hole and 2 1°/0with the small hole; the maximum pres-
sures in the model containment were 6 bar and 4 bar, respectively.
In the second part of the experimental program a detailed investigation of geometry effects is be-
ing carried out. The test facili~ DISCO-C has been built for performing dispersion experiments
with cold simulant materials in a 1/18 scale. fie” fluids are water or bismuth alloy instead of melt,
and nitrogen or helium instead of steam.
The experiments serve as a test bed for the AFDM code, that ~willbe ~pplied to reactor conditions.,T, ,
~ p:) ~
‘J‘N:+LLF I i ~Lw
— .. .. ..... . ... . .... . . ,,..-.!. ,, >-- .- ..,.-

. . . .
. . 1. INTRODUCTION. .
. ..+., ..
; .. $,
{;.- ‘‘~ ,. . .. ... .
. . :.
-. ”-....’ . ..-.
. . .. . .
. .
-.. ——— ——— —.——–.
t .
Concerning the mitigation of high pressure core melt scenarios, the design objective forfiture European PWRS is to transfer high pressure core melt to low pressure core melt sequences,by means of pressure relief valves at the primary circuit with such a discharge capacity to limitthe pressure in the reactor coolant system (RCS) to lower than 20 bar, at the moment of the reactorpressure vessel rupture. A ftilure in the bottom head of the reactor pressure vessel (I@/),followed by melt expulsion and blowdown of the RCS, might disperse molten core debris out ofthe reactor pit with higher pressures at vessel ftilure leading to larger fractions of dispersedmaterial. The mechanisms of efficient. debris-to-gas heat transfer, exothermic metal/oxygenreactions, and hydrogen combustion may cause a rapid increase in pressure and temperature in thereactor containment and are collectively referred to as direct containment heating (DCH). Apartfrom the loads on the containment building due to DCH, the ejection of the a considerable amountof melt debris out of the reactor cavity by itself is a problem, because the melt collecting andcooling concept of future PWRS would be rendered useless.
A large amount of work has been done to ,jnvestigate the melt dispersal/DCH-phenomenafor Westinghouse cavity designs with large instrument tunnels leading into subcompartments [1].Only a few experiments have been done with an annular cavity design typical of the Calvert Cliffs(CC) plant built by Combustion Engineering (CE) [2,3]. Some European PWRS and the plannedEuropean Pressurized Reactor (EPR) have an annular cavity design without a large pathway out ofthe cavity other than through the narrow annular gap between the RPV and the cavity wall (Fig.1).The past experiments focused on relatively small holes at the center of the lower head and highfailure pressures. Our investigations have been extended to low failure pressures and larger breachsizes with a cavity design similar to the planned EPR cavity. Also, lateral breaches will beinvestigated.
The experimental program has three parts. The first part has been completed in 1998. Thiscomprised two experiments performed at the Sandla National Laboratories (SNL) in cooperationwith Forschungszentrum Karlsruhe (FZK), Institut de Protection et de Surete Nucleaire (IPSN)and the U.S. Nuclear Regulatory Commission (NRC). These tests were performed with thermitemel~ steam and a prototypic atmosphere in the containment in a scale 1:10. For the first time, atest with a large break at low pressure was conducted. In the second part of the experimental pro-gram a detailed investigation of geometry effects is being performed. The test facility DISCO-Chas been built at FZK for performing dispersion experiments with cold sirnulant materials in anEPR-typical geometry in a scale 1:18. In the thiid part of the progrti, selected experiments in aDISCO-H facility in the 1:18 scale will be pefiormed with thermite melt, steam and a prototypicatmosphere in the containment. The ultimate objective of the experiments is to find an upperbound of RCS pressures resulting in a minimum of melt dispersed out of the cavity in an opti-mized cavity geometry.
The experimental program is accompanied by analytical work with the objective to trans-form the experimental results to the prototypical case [11]. Two fimdamentally different methodsare employed. One method is to correlate all experimental results regarding the dispersed fractionof melt with a single fimction of similarity numbers. This fi-mctioncan then be applied to proto-typical conditions. The other method makes use of codes to calculate the pressure and the meltdispersal. The models used in the codes are validated by comparison with experimental results.With both methods an extrapolation out of the range of experimental parameters is necessary and acarefil assessment of the similarity numbers is essential.
DISCLAIMER
This report was prepared as an account of work sponsoredby an agency of the United States Government. Neither theUnited States Government nor any agency thereof, nor anyof their employees, make any warranty, express or implied,or assumes any legal liability or responsibility for theaccuracy, completeness, or usefulness of any information,apparatus, product, or process disclosed, or represents thatits use would not infringe privately owned rights. Referenceherein to any specific commercial product, process, orservice by trade name, trademark, manufacturer, orotherwise does not necessarily constitute or imply itsendorsement, recommendation, or favoring by the UnitedStates Government or any agency thereof. The views andopinions of authors expressed herein do not necessarilystate or reflect those of the United States Government orany agency thereof.
-. -..—..—. .—

DISCLAIMER
Portions of this document may be illegiblein electronic image products. Images areproduced from the best available originaldocument.

. ,
Melt Discharge Channel Zirconia layer Melt Plug
Fig. 1. The Reactor pressure vessel and cavity planned for the EPR
2.
llloth
THE EXPERIMENTS WITH THERMITE AT SNL
The SNL tests are documented in detail in Ref. 4. The experiments utilized the existingscale model of the Calvert Cliffs (CC) nuclear power plant. It was necessary to increase th~
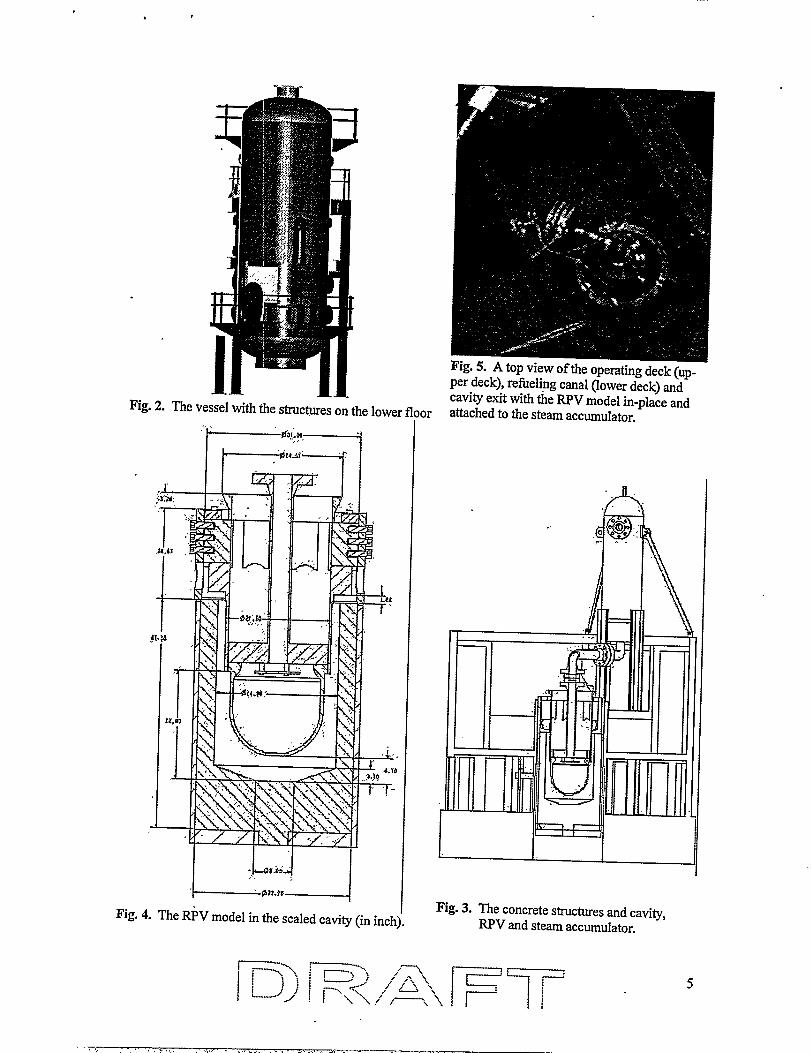
lWV model crucible (melt generator) volume to handle larger melt masses. Also, the cavityconllguration was changed slightly to fit the geometry closer to the foreseen EPR design. Figure 2shows a cutout of the pressure vessel with the 1/1Ohscale CE-like structures resting on the lowerfloor. Figure 3 shows a cross section of the concrete structures, cavity and RPV, and steamaccumulator which represents the total volume of the RCS. Figure 4 shows a cross-section of thecavity and RPV. The melt generator (or crucible) is attached to the lower part of the RPV. Thebottom of the melt generator holds a graphite disk machined with a 10-cm I.D. or 4-cm I.D. hole,respectively, a brass melt plug fits within the graphhe and provides a pressure barrier during thethermite reaction interval. In case of the 10-cm hole, the 4-inch pipe connecting the accumulator tothe crucible limits the blow down due to a 9.3 cm I.D. Figure 5 shows a top view of the operatingdec~ refueling canal, and cavity exit with the RPV model in-place and attached to the steamaccumulator. Table 1 compares the principal geometrical data of the experiment with the currentdata of the EPR. Significant differences are accentuated. The 62 kg of thermite has a combinedthermal and chemical energy of 178 MJ. Scaled according to the energy content arid the potentialfor DCH loads, this corresponds to 120 t of corium. A volume scaling of 0.016 m3 thermite or 16m’ of corium gives 130 t of corium. If the ratio of V~~lt/VRcsis to be kept constan~ than itcorresponds to 22 m3 corium or 180 ~ because of the underscaling of the accumulator volume by afactor of 0.675.
r~~. ~ ~> ‘>I)!~_,, ,
i“ <~..,,,~~- - 3
“~ /#/! r\\/
.—.-.—.——.—..—-—-..-.——— --.- _—.—., .,. ,. —.. . ...—— --,

.——--—
ne most important difference is the fact that in the latest EPR design no path into therefueling canal exists. At the time of the experiment one design option of the EPR provided forsuch a path with an area of 3 mz. In the SNL.-experiments the melt debris can take the straightvertical path through the cavity exit into the dome, while in the EPR cavity, now the main path isalong the loop piping. Here, first the flow has to overcome an area restriction at the support girderand than it must make a 90 de~ee turn. The flow area around the main coolant pipes is 10 mz inthe EPR design (scaled 0.10 mz)versus 0.033 m’ in the experiment.
Table 1. Geometric comparisons for the SNL experiments with present EPR data.
Geometric Parameters EPR EPR SNLScale Plant I/loti lllom
RCS + RPV Volume (m~ 440 0.440 0.307Coriurnor ThermiteMass (kg) 120x 103 62.0Coriumor ThermiteVolume(m3) 15 0.016RPV ShellMid-VesselOD (m) .-. 5.385 0.5385 0.5461Length fromMelt Plug to CaviVFloor (m) 1.12 0.112 0.12
fromMelt Plug to NozzleCenterline(m) 8.72 0.872 0.9357L!2E.aEffectiveAnnularGapbelowNozzles(m) I 0.383 I 0.0383 I 0.0443Annular Flow Area belowNozzles(m2) 7.0” 0.07 0.0825~inimum How Area at &mnort Girder hn’} I 6.n I n.06 I n.ntmFlow Area at Cavity Exit (m~ o 0Flow Area along Loop Piping (Cutout - Leg) (m*)
“.4”,,10.0 0.100 0.033
Flow area of venting channel openings (m~ 1.5 0.15 0CavityDiameterbelowNozzles (m) 6.145 0.6145 0.6349CavityFloor Area (m2) 30.0 0.30 0.3167CavityHeight (m) I 11.84 I 1.18 I 1.3350VesselEmptyVolume (ms) 78000.0 78.0 99.0
Table 2. Idial conditions for the two Experiments at SNL
Test 1 Test 2Thermitecomposition(kg) ‘
iron oxide 44.41 44.41aluminum 13.81 13.81
I alumina I 3.79 I 3.79Mass of the thermitecharge(kg) 62.00 62.00Accumulator Dressure MPaJ I 1.106 I 1-5.3
I Accumulatorgas or steamtemperature(K) I 467 483)Moles of accumulatorsteam(moles) 74 80
Ed hole diameter (m) 0.10 0.04Vesselpressure (MPa) (containment) 0.213 0.2184Vessel temperature(K) 372 379Vesselgas moles (moles) 6308Gas composition I Steam 47.9
635145.2
in the ve&el (mole ‘A) Nz 38.3 40.102 10.3 10.7Hz 3.2 3.3
Other 0.3 0.7
4
.
Fig. 2. The vessel with the structies on the
‘F---+,_,_,
lowe
IFig. 4. The I@Vmodel in the scaled cavity (in inch).
Ior
Eig. 5. A top view of the operating deck (up-per deck), refueligg canal (lower deck) andcavity exit with the RPV model in-place andattached to the steam accumulator.
A.. .
L14-Fig. 3. The concrete structures and caviiy,
RPV and steam accumulator.
5
,. .,. .... . . ... . ———

-—.— ---
.Table 3. Material properties of the melt.
Property Corium Thermitewith aluminaFull Scale ‘ l/lOti scale
~ (J/k#K) 525.7 1198.4K (W/m/K) . 5.0 19.7
P @dm3) 8045 387811(Pas) 0.0151 0.0073
0.91 1.0L
.. (s (N/m)- T~P,OXide(K) 2450 I 2200
Trndt(.Q . 2800 2500. .
*
- Test Summary
: tie vesselmately 0.21 MPa.
was heated by filling with steam until the vessel pressure reached approxi-The average gas temperature inside the test vessel was 372 K (379 K in test 2)
at the end of the heat up. Water condensed on the vessel walls and the structures during the 16-hour heat up and the condensate was drained from the cavity and vessel floors during the steamingprocess. The initial conditions for both tests are summ~zed in Table 2, the material properties ofthe melt are given in Table 3.
After taking pretest gas grab samples and veri~lng camera and data acquisition systems operating,a thermite initiator ignited the thermite powder. About 12s (9”s in test 2) after ignitiou an explo-sive charge was used to ftil the burst diaphragm separating the accumulator and the crucible, pres-surizing the crucible with steam. About 1 s (4s in test 2) later, the brass melt plug failed, initiat-ing the melt ejection (defined as t = Os).
Video Interpretation
Four video cameras were used to view the inside of the Surtsey vessel. Two cameras (oneheavily filtered) looked down from the window port in the vessel upper head and two cameras(one heavily filtered) looked across the operating deck directly at the cavity exit through a level 3window port. At t = Os, glowing orange molten particles exited the cavity.
Test 1: The melt first impacted the dome at about t = 0.5 s. The”molten particle stream out of thecavity lasted about 0.3 s. A glowing-orange cloud indicating a hydrogen deflagration reached thetop of the vessel almost immediately and pulsed and glowed orange for an addhional seven toeight seconds. Glowing particles rained down on the operating deck for about 3 s after the start ofthe ejection.
Test 2: The melt stream out of tie cavity did not appear to be as vigorous as in the previous test.The stream had more of a liquid sparging or jetting structure as compared to a fine spray dropletstructure. The video showed most of the melt rising, peaking at about 0.6s, and then falling backwithout striking the vessel dome. The molten particle stream out of the cavity lasted about 1-2 s.Glowing particles rained down on the operating deck for about 3 s after the start of the ejection. Aglowing-orange cloud indicating a hydrogen deflagration reached the top of the vessel in about 1-2s. Combustion in the dome region ended at about 5s.
6

.
0.0 1.0 2.0 3.0 4.0 5.0 ‘---
.
0.0 1.0 2.0 3.0 4.0 5.0
2500
g2000
1500
1000
Time (s) Time (s)“Fig. 6. Pressuresand pyrometertemperatureat Fig. 7. Pressuresand pyrometertemperatureat
cavityexit in test 1 (O.1m hole diameter) cavity exit in test 2 (0.04m hole diam.)
Measured Data
Figures 6 and 7 give the pressure history of the crucible (RPV), cavity and vessel, andpyrometer temperature (with the pyrometer focused on the cavity exit).
Zero time was set at the initiation of the melt ejectioq verified by the melt plug breakwires and the start of the accumulator depressurization. Accumulator and crucible pressure (RPVpressure) dropped immediately in test 1 while it stayed at the initial value for almost 1 s beforefalling in test 2. This implies that in test 1, with the large hole, a blow through with a two-phaseflow occurs almost instantaneously (< 0.18 s), while with @e small hole in test 2 there is a single-
‘ phase liquid flow fust and a two phase flow later. The lWV pressures reached a minimum of 0.4MPa in both testi, then equilibrated and tracked the increasing vessel pressure. Vessel pressurespeaked to 0.606 MPa in test 1 and to 0.42 MPa in test 2.
In test 1, the ,debris entrainment interval probably occurred from t = 0.1 s to t = 0.4 s,based on the failure of the cavity exit break wire, the very quick rise and fall in the pyrometer sig-nal, the small over pressures registered by the cavi~ gages near t = 0.1 s, and the camera videointerpretation. In test 2, the debris entrai~ent interval probably occurred ilom t = 0.1 s to about t= 2.0 s, based on the very quick rise and slow fall in the pyrometer signal and the camera videointerpretation.
Figure 8 shows the vessel gas temperatures averaged from three thermocouple arrays. Theaverage basement gas temperatures were measured in the subcompartments. Specific thermocou-ples indicated temperatures up to 400 K higher.
12001100 - ~ #1 dome avemge
~ #1 basement avs.1000 - ~ #2 dome avenge
g 900 - ~ %?bassment ave.
&l= 800 -f?0 700 -’2$ 600 -
500 -
400
3000 5 10 15 20
Time (s)
Fig. 8. Averagegas temperaturesin the vessel
.
7
—. -,——.. —— ..— —

.—— .-—
Debris Recovery
The crucible recovery showed that the melt plug was completely gone and that the graphitediskshowed noablation orerosion. The finalexit holewas round withalO-cm, respectively, a4-cm diameter. A small part of the lower section of the steel crucible inner liner was melted by”thethermite.
Table 4. Debris recovery results
I Test 1 I Test 2 IInitial therrnite charge, Md”(a) 0%)Crucible (b)Cavily (c)1 (MInside structures’ (d) (d= f-e - c) (kg)Outside structures (e) (WTotal Recovered (f) 2
62.00 62.00-2.05 -0.2215.18 58.0035.93 0.56
47.50 14.6168.61 73.17
Recovery fiction, fwo,m = fla 1.11 1.18Dispersed from cavity, &,= (f-c)/f 0.779 0.207Transported to dome, f-= elf 0.693 0.199Therrnite transported to dome, Md = MdO* f- (kg) 42.94 12.34Particle size SMMD (mm) 3.40 1.54
‘ Cavitymassin Test-2includesthe 1.44kg debris found in~de the loop piping.
2The molten mass available for dispersal into the vessel is greater than the initial thennite charge due to melting ofthe inner wall of the crucible (if used), vaporizationof the fhsiblebrass plug (1.675kg fortest 1),ablationofcon-cretein thecavity,contaminants(breakwires,thermocouples,etc.),andoxidationofmetallicdebrisbysteam.
Table 4 shows the debris recovery and the mass balance and transport fractions. The cavi~dispersal fraction in the test-1 experiment was 0.78 with driving pressure at 1 MPa and using a 0.1m dkuneter hole. The test-1 cavity dispersal fraction wiis identical to the average cavity dispersalfraction in the CE experiments, most of which were perilorrnedwith driving pressure at 8 MPa andusing a 0.04 m dkuneter hole. The cavity dispersal fraction in the test-2 experiment was 0.21 withdriving pressure at 1.5 MPa and using a 0.04 m diameter hole.
The debris recovered from the upper deck was sieved. This debris covered the deck uni-formly and consisted of small particles of iron and alumina. The appearance of the debris in thetwo tests in the lower deck (so-called refheling canal) was different. In test 2 the debris appearedto have been laid down rather than sprayed down (as if due to a low pressure ‘Ix.@’ of materialout of the cavity). The thickness of the larger pieces was 2-5 mm. The outer RPV wall and the in-ner cavity wall was coated with a layer of alumina. The thickness of the layer was 1-4 mm (tlickernear the cavity floor). This layer was chipped off yielding a total weight of 37.76 kg in test 2. Inaddition, an iron slug weighing 18.80 kg was recovered from the bottom of the cavity. .
The sieve analysis (in test-2 only that debris recovered from the upper deck)yielded a particle sieve mass medkm diameter (SMMD) of 1.54 mm in test-2, compared to theSMMD of 3.40 found in the test 1. This was large but consistent with the CE tests in that the par-ticle size increased with lower driving pressure. However, close inspection of the particles thatpassed through the median sieve revealed that these particles were not single drops, but rather acrumbly amalgamation of particles ranging in size from about 0.1 mm to 1 mm, sintered together.So much material was ejected onto and covered the operating deck that there was little free spacefor the particles to remain as individual drops during the cooling period.
8
1
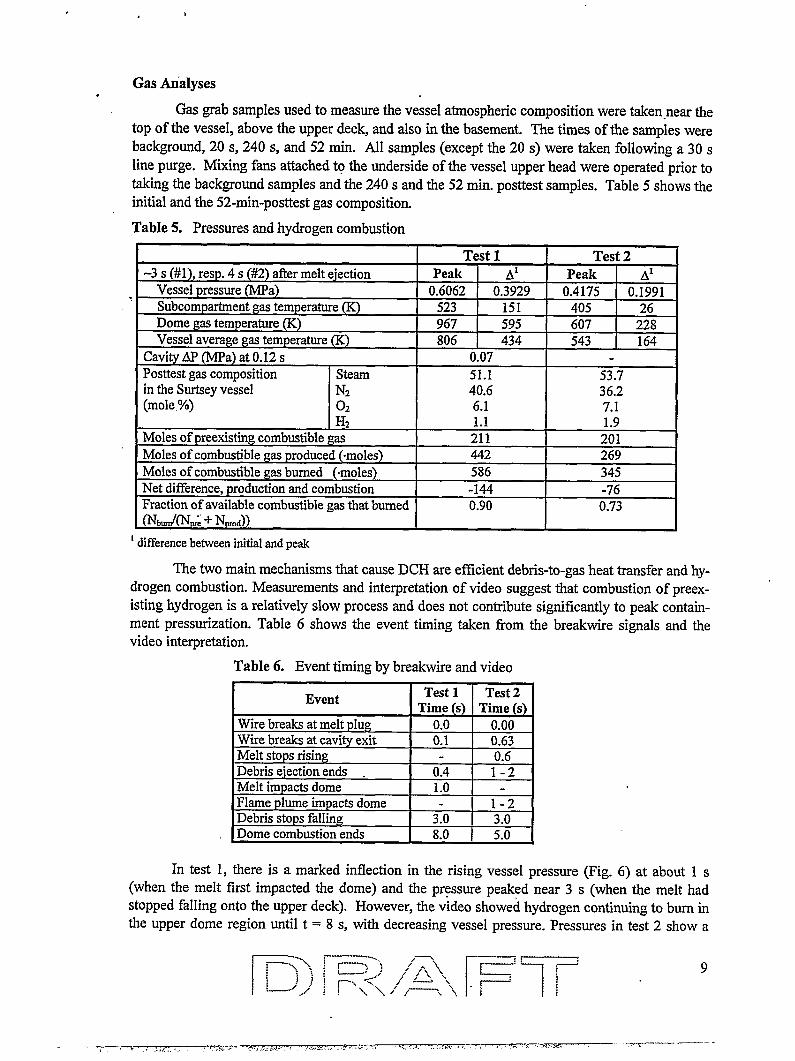
Gas Arialyses,
Gas grab samples used to measure the vessel atmospheric composition were taken-near thetop of the vessel, above the upper deck and also in the basement. The times of the samples werebackground, 20 s, 240 s, and 52 min. All samples (except the 20 s) were taken following a 30sline purge. Mixing fans attached to the underside of the vessel upper head were operated prior totaking the background samples and the 240s and the 52 min. posttest samples. Table 5 shows theinitial and the 52-min-posttest gas composition.
Table 5. Pressures and hydrogen combustion
Test 1 Test 2-3s (#l), resp. 4s (#2) afler melt ejection Peak Al Peak Al
Vesselpressure(MPa) 0.6062 0.3929. 0.4175 0.1991Subcompartment gas temperature (K) 523 151 405 26Dome gas temperature (K) 967 595 607 228Vessel average gas temperature (K) 806 434 543 164
Cavity AP (NIPa) at 0.12s 0.07Posttest gas composition Steam 51.1 53.7in the Surtsey vessel Nz 40.6 36.2(mole,%) 02 6.1 7.1
Moles of preexisting combustible gas 211Moles of combustible gas produced (-moles) 442Moles of combustible gas burned (moles) 586Net difference, production and combustion -144
+
201269345-76 I
Fraction of available combustible gas that burned 0.90 0.73~bd~p: + &d))
* differencebetween initial and peak
The two main mechanisms that cause DCH are el%cient debris-to-gas heat transfer and hy-drogen combustion. Measurements and interpretation of video suggest that combustion of preex-isting hydrogen is a relatively slow process and does not contribute significantly to peak contain-ment pressurization. Table 6 shows the event timing taken fi-om the breakwire signals and thevideo interpretation.
Table 6. Event timing by breakwire and video
Event Test 1 Test 2Time (s) Time (s)
Wire breaksat melt plug 0.0 0.00Wire breaks at cavity exit 0.1 0.63Melt ston~ +img n~
Debris G.ICGLLUIL Guus . I U.* I l-z
Melt im~acts dome 1.0 I - I
.-~” . . . . . . I I “.”
. ...,.,.4:-- --J- /-),4 16 I
Flame plume impacts dome [ - I 1-2Debris stops falling 3.0 3.0 I
IDome combustion ends I 8.0 I 5.0 i
In test 1, there is a marked inflection in the rising vessel pressure (Fig. 6) at about 1 s
(when the melt first impacted the dome) and the pressure peaked near 3 s (when the melt hadstopped falling onto the upper deck). However, the video showed hydrogen continuing to burn in
the upper dome region until t = 8 s, with decreasing vessel pressure. Pressures in test 2 show a
—,7 ,. .—
. ., -. ..= - . .,.-.-.~- .,-,-- .:.., -,--~’~-- -~ . ...... . .. . .-:i $,., ., ..,- ,- .-xY-si7--- .—- -T?-T-

—. . —-
similar behavior (Fig. 7); vessel pressurization is nearly complete at 3-4 s, with the cavity meltejection complete and all of the debris fallen back onto the structure surfaces, while the videoshowed hydrogen continuing to burn until t = 5s.
Conclusions from the SNL experiments
Two experiments were performed at the Sandia National Laboratories to investigate DCHphenomem using a modified I/IO* scale model of the Calvert Cliffs nuclear power plant. TheCalvert Clifll plant is typical of Combustion Engineering (CE) plants with a Bechtel annular cavity, adesign that represents 5 out of the 15 CE plants in the United States. This type of cavity, with d~ect
. access to the dome, is fiso typical of some pressiu-ized water reactors (PWRs) in Europe. Theplanned European Pressurized Reactor (EPR) has also an annular cavity, but in its latest desi~ it isclosed at the top with the main flowpath out of the cavity via flow areas around the main coolantpipes leading into pump and heat exchanger compartments. The main findings of the twoexperiments are:
1. Intentional depressurization of the RCS can mitigate DCH loads given an open cavity exitflow path with direct line-of-sight to the containment dome and a 0.4 m (scaled) RPV lowerhead ftilure hole size. This is evident by comparing data from earlier SNL experiments [2]
(CE-3, 8 MPa and 4-cm hole) to Test-2 (1.5 MPa and 4-cm hole). The peak pressure increaseApwas 0.390 MJ?ain CE-3 and 0.199 MPa in Test-2. This can be attributed to the significantlydifferent cavity dispersal fictions, with 0.64 in CE-3 and 0.21 in Test-2.
2. The mitigating effects of the 1 MPa low driving pressure were countered by the larger 10-cmdiameter hole. The cavity dispersal and vessel pressure load in Test-1 closely matched theprevious CE-3 experiment. The peak pressure increase was 0.390 in CE-3 and 0.393 in Test-1. Cavity dispersal flactions were also simk, with 0.64 in CE-3 and 0.78 in Test-1.
3. The two main mechanisms that cause DCH are efficient debris-to-gas heat transfer and hydro-gen combustion. Measurements and interpretation of video suggest that combustion of preex-isting hydrogen is a relatively slow process and does not contribute significantly to peak con-tainment pressurization.
4. Debris transport to the dome was 69% in Test-1 and 20% in Test-2. The seven previous Cal-vert Cliffs experiments (4-8 MPa and 4-cm hole) indicated that 42°/0to 69°/0of the total debrisrecovered posttest was transported to the upper dome”[2]. In the Zion and Surry tests with thelarge instrumentation tunnel modeled, only 7% to 10’%oof the total debris recovered was foundin the upper dome [12,13].
The experiments showed high melt dkpersion from the annular cavity without an instrumentationchannel at low ftilure pressures below 15 bars. The latest design modifications of the EPR cavity,regarding the absence of a direct path into the dome, and other differences to the tested geometryrequire more experiments and analysis to investigate the possible implications for the EPR. To thatend experiments in the DISCO facilty were and are being performed.
10

,
The DI~CO Experiment
The test facility DISCO-C has been built at FZK for performing dispersion experimentswith cold simukmt materials in an EPR-geometry in a 1/18 scale (Fig. 9). The fluids are water orWood?smetal (Bi-Pb-Sn-In-alloy, MCP-58@, p = 9230 kgm-3) instead of melt and nitrogen or he-lium instead of steam. There are three potential flow paths out of the test cavily. The path straightup into the refheling canal through 8 openings with a total cross section of 3 mz is expected notexist in the final EPR design. The main flow path would be the flee flow area around the 8 ,maincoolant lines into the pump and steam generator rooms with a total flow area of about’ 10 m2.However, there is a flow constriction below the nozzles at the RPV support structure with anminimum flow area of only 6 mz. The third way out of the reactor pit will be through the fourventilation openings in the lower part of the cavity (total flow area 1.5 mz) leading to the spreadingcompartment via an annular channel around the pi~ and a connecting channel.
. .
Gas Une
RPV+RCSVolume—
PumpRoom
I
Steam Genemtor
Room
=
kCore Support Plate
_ Melt Simulant
Rupture Disk
—— Cavity
TOP VIEW
Fig. 9. Scheme of the DISCO-C test facility
Test summary
The first series of experiments in the DISCO-C facility have been performed with both thefirst and t.hkd flow path closed (Fig. 10), the only path being the annular space around the RPVleading to the flow areas along the main coolant lines and into the pump and steam generatorrooms. These compartments are open to the dome in the prototype and open to the abnosphere inthe experiment, only covered by filters for the extraction of fog or droplets. The compartments arevolumetrically scaled and contain some baffles (pump room O.131 m3, steam generator room 0.3m3). The dimensions of the cavity and the RPV are shown in Fig. 10. They are scaled according tothe dimensions given for the EPR in table 1. The total volume of the pressure vessel is 0.08538 m’(scaled 498 m’), simulating the volume of both the RPV and part of the RCS. A disk holding 8pipes (44 mm I.D., 250 mm length) separates the two partial volumes in a ratio 60:40 (RCS:RPV).
‘ ‘FT’ - 11-===::~) ,) ,/”,., ‘.\:L..—”—‘viI-’\<\ /“.=.”..
—. —-.——-—— .—— — —

..—
Fig. 10. The configuration of the pressure vessel with a rupture disk at the lower head.
Table 7. Parameters and dispersed liquid fictions in DISCO-C experiments
Test
D-IID-10D-15D-07D-04
D-13
D-06D-05
D-14
D-OSD-09D-12H-02H-01H-03R-O1D-17
M-01M-02
TGas Liquidwaterlmetal
2=~~-3 ~3
Nz 3.4 wN2 3.4 wNz 3.4 w
&N2 3.4 wNz 3.4 wNz 3.4 wNz 3.4 wNz 3.4 wNz 3.4 w
4=N2 3.4 wN2 3.4 wNz 3.4 wHe 3.4 wHe I 3.4 w
zHe 3.4 wN2 1.8wNz 1.8wN2 3.4 mNz 3.0 m”
~..—-,. .
HoleDiam.
-@?#
15252525505050
10010010018252525
25#252525
—..,.-- \\
])-J ,,J
Burst Compart-Pressure ments
abs.
Ta G
0.643 0.16061.141 0.38220.348 0.19310.620 0.5177
*
-+-l-%!+
1.137 0.74070.270 0.00000.388 0.12310.641 0.3495
=1=1.156 0.61630.611 0.02900.612 0.40731.045 0.35750.595 I 0.0602
,——-..-—-, /-.....,,------
: L..: ~ ,,~ //’., ‘~-,,r—-, \ -~-....>
\ \ /“,r—-
Llquid fraction found inCavi& RPv Cavily RPvbottom support total
f.0.5829 0.2565 0.8394 00.3865 0.2313 0.6178 00.5372 0.2697 0.8069 00.2240 0.2583 0.4823 00.0563 0.2453 0.3016 00.2119 0.2374 0.4493 00.0607 0.2703 0.3310 00.0124 0.2286 0.2410 00.1358 ‘ 0.2839’ 0.4197 o’0.0524 0.2305 0.2829 00.0207 0.2386 0.2593 00.9499 0.0501 1.0000 00.6211 0.2558 0.8769 00.3989 0.2516 0.6505 00.1229 0.2608 0.3837 00.4229 0.1847 0.6076 0.3633
-0.1228 0.4699 0.5927 00.4275 0.2150 0.6425 00.8624 0.0767” 0.9398 0
-.—- -———..
‘\12

,
The RPV lower head can hold 3.410-3 m3 of liquid (liquid height in the hemisphere is 96 mm)lThis corresponds to 20 m3 or 160 t of corium. The holes in all tests, except for test R-01, were at ‘the center of the hemisphere. They were closed by a rupture disk that had an opening diameterlarger than the hole diameter. The pressure vessel was filled with gas to a pressure slightly lowerthan the failure pressure of the rupture disk A small auxiliary pressure vessel, filled to a somew-hat higher pressure was connected to the main pressure vessel. By opening a valve electro-pneumatically the pressure in the main vessel increased up to the failing pressure of the rupturedisk and the blow down started. A break wire at the hole gave the signal for closing the valveagain and for the time mark t = O.
Dispersal rates
The initial conditions of the experiments are given in table 7 together with the liquid frac-tions found in the compartments and the cavity after the tests. If liquid reaches the RPV”supportgirder, app. 0.810-3 m3 are deposited there; 0.610-3 m3 are kept behind a conical ring (s. Fig.10),that prevents the liquid to flow back into the lower pit. The rest stays on the horizontal surfaces inthis area. Fig.11 shows the data as function of the inhial pressure. For compariso% data are shownfrom experiments performed at Brookhaven National Laboratory (BNL) for a Westinghouse cavitydesign (Surry) with a large instrument tunnel [5] (Fig.11 and 12). These data seem to change moresharply at a threshold from low to high dispersal rates than in our case. However, for larger holes(>50 mm, s0.90 m scaled) there must be a sharp drop at very low pressure differences (0.1 -0.2MPa). The effect of a different driving gas (He versus Nz) is similar as found before, e.g. at BNL.The higher sound velocity of helium leads to a fmter blow do~ but the lower density (app. 1/7ofNz) c?uses less entrainmen~ with
g111111
{ 0.8 ––l--t- ~–l-<–t—
:,~:
II6
0,6 –1 – L –1 .L;z
II Iz Ill II———% 0.4
/
——— —
II rlll5.= Illg ~22 –1 - 1- l– -t-t
ii 1111
n-o 0.2 “ 0.4 0.0 0.8 1 1.2 1.4
PRESSURE (MPa)
the net result of a lower dispersal.
1P 4 I I I Il*. IA’ I I I I
I
II
—-1
Id 0,2E
F
–l–*–k-l-*–xt
Ill Ill 1,~
o 02 04 0.6 0.8 1 1.2 1.4
PRESSURE (MPa)
Fig. 11.Liquid mass fractions as function of the failure pressure of the rupture disk
Ho/e SIZE
~ mhnm fi,som)~ 500sn (0,90 m)
—4—— 25ekn [W m)
-———&—— 25 mm He
i ltlnsn ~0.32 ml
——’+——— Wmm (w27m)
$ hork. rip (2.5 equlx BNL9.5 (0.40 m)
Fig.
1 I
o.a + oJ’$ ● *
o.a ++ %. o ●
+ 5 : m&++0.4
0 ‘
3 0++ nxx ● *
* Bo ‘
0.2●
+ + x o
+:‘3$ ❑ ‘x
< ,
0
0 1 2 3 4
INITIAL VESSEL PRESSURE (h4Pa)
12. BNL data for the Surry cavity with an instrument t&nel in 1/42 scale
---- --’. - —. ..— -- . .. —.. ——— — .-..

———
One special test was run with a horizontal rip at the side of the lower head (R-OI). The rip.was app. 40 mm x 12.5 mm, having a 25-mm hole equivalent flow area. The lower and the upperedge of the rip were 55 mm and 64 mm above the bottom of the lower hea& respectively. The liq-uid volume used was only 1.810-3 m3, and the liquid surface was at 67 mm above the bottom. Inthis test very little liquid was dispersed into the compartments. The small mass that was dispersedwas found in the compfients on the opposite side of the break. A considerable amount of liquidremained in the lower head of the RPV. The liquid level of this rest water was at 39 mm above thebottom, or 16 mm below the lower edge of the rip opening. A comparison test (D-17) with thesame amount of liquid but a center hole of 25 mm diameter gave similar results as the test with thelarge liquid mass (D-07). The somewhat smaller mass fraction in the compartments (0.4073 versus0.5 177) is due to the much larger (relative) m~s fiction at the ,RPV support in D-17, but with al-
.-most identical absolute masses at the support in both tests.
Blow down histories
The duration of the blow down process is inversely proportional to the flow area of the hole(Fig.13). According to scaling-laws it is also proportional to the length scale, so the blow downtimes for the reactor would be between 3 s and 38 s with hole sizes between 0.45 m and 1.8 m di-ameter. However, with steam and thermal effects these times would be different. Scaling laws pre-dict a blow down time dependency on the initial pressure as t - In (po/p) [11, 14]. The experimentsshow that the pressure effect is smaller than that. The reason is the presence of the liquid. A puregas blow down has an entirely different trend (Fig. 14).
Fig. 15.a shows the pressure in the RPV together with the pressure (P6) measured on thecavity floor directly below the hole. The rupture dkk opens at *O s, but the pressure still increases
because the valve between the auxiliruy pressure vessel and the main vessel closes not before t=O.07
s. Up to app. @O.4 s the pressure falls only slightly. The pressure signal from P6 is identical to the
RPV pressure signal up to tb=0.362s. This indicates that there is a single-phase liquid flow with the
velocity of uL = (2 Ap/pL)ln . At k=O.362s a blow-through occurs and there is a two-phase flow upto app. &O.78 s. From that point on there is a single-phase gas flow, probably with very small
droplets, and again the pressure signal P6 gives the total pressure with pd~=pG/2 UG2.Similar sig-
nals could be observed in all tests, but in most cases the dynamic pressure in the initial liquid flow
phase did not reach quite the RPV pressure (Fig. 15.b); probably because of the fragmentation of thejet (13g.16).
7
6
1
00 0.5 1 1.5 2 2.5
TIME (S)
Fig. 13.Pressure histories for different hole sizes
12
10g~
8wK36m(/Ywa4a
2
I I
~ D5: 50 mm
~ D6 50 mm
\~ D13: 50 mm
— — B2 gas
I I
0 I I I I I
o 0.2 0.4 0.6 0.8
TIME (S)
Fig. 14.Pressure histories for different initial pressures
p-:.:.c;\ --;;;.:::;;” ,/-””‘“x,\\\ ~T-.-- ~ _..-- . . . . . . . . . .
. . . . . . . . . . . . . . . . . . . . . .
};: —.,
,) ,, ,,-.
I 1’14--..—...=;! ~...., -..;’ ,/ \\...........;j .—-----‘,/J ! ~ \ \ ,/ ,,--...-.-., ., Ir !

IL!tx23(ncoIlllxL
1
-JDl& 25mm -
— RPV
cavity
6 / \
DZ 25 mm
51 . — RPV
l\ cavitv
11, ., ,1, ,, ,1, ,, .1..,, 1,.,,
0 0.5 1 1.5 2 0 0.5 1 1.5 2 2.5TIME (S) TIME (S)
(a) “ 0)Fig. 15.RPV static pressure andtotalpressure on the cavity floor below the hole
(a) @)Fig. 16. Waterje; (a)titiout fi@entition, hole w=closed"titi atilnfoil mdpresswe wmincremed
with a shock, (b) with tlagrnentation, hole closedby a rupture disk.
The blow through times tb, determined Ilom the pressure signal P6 are listed in Table 8, to-gether with the time & it would take to blow out all liquid in a single-phase flow. A contractionfactor E = 0.6 was applied for the determination of the time t, = VJ(E & UL).Thisk typical forsharp edged openings at high Reynolds numbers. & is the cross section of the hole and VL is theliquid volume. The water height & at which the blow through starts can be calculated with theabove data. There are correlations in the literature giving the blow through heights h as fiction ofthe Froude number Fr = ud(gd)ln and the diameterratio d/D, with the hole diameter d and the vesseldiameter D [6].
Fig. 17 shows the water height ~ in thelower head at blow through reduced by the holediameter d as function of the Froude number. Forthe legend of the symbols see Fig. 11. The blowthrough times have been experimentally deter-mined and the heights were determined assumingstationary flow and constant contraction factors.There is no difference between nitrogen and’he-Iiurn,driven liquid flows. The general trend and theabsolute values compare well with the data statedin Ref. 6. However, no clear effect of the d/D-ratiocan be seen.
4
3 ● n
2
❑
1
A
o I I I1 1 1
0 40 80 120Fr
Fig. 17. Relative blow throughheight versusFroude number (line is a least square fit)
.—...— —--- — -—--—– -—-

——.- .:
Ta~le 8. Blow downtimes
FNo.
Dll
D1O
D15
D07
D04
D13
D06
D05
D14D08
LH02
HOI
H03
D17
d
(m)
0.0150.015
0.0250.0250.0250.0500.0500.050
0.1000.1000.0250.0250.025
0.025
Ap uLiquid h & titb Fr i hb
(MPa) (In/s) (s) (s) . , (mm)
0.540 32.9 0.688 0.976 1.41 85.7 491.040 45.6 0.419 0.703 1.67 118.9 580.250 22.4 0.359 0.516 1.43 45.2 500.520 32.2 0.106 0.358 3.31 65.1 781.060 46.0 0.047 0.251 5.22 93.0 85, r I
0.260I 22.8I 0.032I0.127I 3.62I 32.6I S10.520 32.2 0.024 0.089 3.50 46.0 801.060 46.0 0.018 0.063 3.30 65.7 79
0.250 22.4 0.012 0.032 2.15 22.6 730.510 31.9 0.013 0.023 1.51 32.2 59
0.288 24.0 0.335 0.481 1.42 48.5 500.641I 35.8I 0.104I0.322I 3.04I 72.3I 771.056 46.0 0.065 0.251 3.77 92.8 81
0.505 31.8 0.033 0.192 5.83 64.2 61
3.273.87
2.003.123.40
1.621.601.580.730.592.003.083.242.44
D/d
18.4018.40
11.0411.0411.045.525.525.522.762.76
11.0411.0411.0411.04
During the blow down the gas temperature drops due to the expansion and the volume dis-placement work. This is a non-reversible thermodynamic process where the temperature can bedetermined approximately by
P2: 1~ _ p, K-1——~1: l.”<
K-1
W@ the index 1 and 2 denoting the state before and after the blow do~ respectively. Nhrogen
(=1,4) at room temperature cools down by 61 to 78 ~ depending on the pressure, and helium(=1,667) by 86 to 109 K. This causes the formation of a ~ck fog that obscures, the view into thecavity and some ice formation at the walls. In order to avoid a temperature drop below freezingthe gas was heated to at least 80”C before the test.
With the information of the pressure and the temperature in the RPV and the cavity, andthe flow cross section of the annular space around the ,2RPV, a mean gas velocity in the annulus can be deter- ~ M 25mm
~ D5: 50 mm
mined. Fig. 18 shows the RPV pressure and the static 10- ~ D9:IO0mm
pressure in the cavity. Because of the choked flow at the ~ ~reduced flow area below the nozzles we see a pressure ~.peak in the cavity in experiments with large holes. This ~ ~-sets an upper limit to the velocities in the annulus. ?Fig. 19 shows some typical velocity histories which were ~ d -determined assuming that the whole annular cross see-, ~tion is available for the gas flow. Of course, this is not ithe case, because the liquid fills up part of the cross see- o , 1 1 ition. AUsothe velocity distribution will not be uniform. o 0.2 0.4 0.6 0.8
Thus, these velocities represent a lower bound. Local Time (s)
velocity measurements are going to be done, in order to Fig. 18. Pressure in the RPV and cavity
determine the upper irnit of the velocities in the anmdus.
-. —-—...\; -—~=;”’ , /’;~\
-...-........—.-.1 -----l~; -.. ,/; ,/’ i,
~, {;:::--..-’:::’:
/! ,,j : ~-.,, ..<\ \ ,.’ ,T:.rz:..,‘\\ 1:i&-.....- ~ ,! . 16

.
100
80
60
40
20
0
0 0.4 0.8 1.2~:~E (S)
+80 , I 1 I
II I A I I I I
60
40
20
0
0 0.4 0.8 1.2 1.6 ;
TIME (S)
(b)Fig. 19. Gas velocitiesin the annularspace in the cavity (a) at the same initialpr&sure with different
hole sizes, (b) with an identicalhole size of25 mm, with differentpressuresand gases.
1I I ‘1 i
I 1 I0.8 — y ––,_–;_+_
I~I=IAIA;
I t ,—, -, I0.6r—L—_l,1–I—-u_l_4’ I I 1
I0.4 -
I I I—+~ –o–d–. I——_ __
II I I I
0.2 -** -i – –,__j_-fi __
O’1@
I I
o I I Io 20 40 60 60 100
tvWXVELOCITY (171/S)
Fig. 20. Dispersedfractionversus the maximumgas velocity in the annularspace in the cavity.
Hole size100 mm (1.80m)50 mm (0.90 m)25 mm (0.45m)18 mm (0.32 m)15 mm (0.27 m)
25 mm, He25 mm metal
1 10 100 1000Ku
Fig. 21. Dispersedfractionversus the Kutateladze-number
In Fig. 20 we see a coarse correlation between the dispersed fraction and the maximum gasvelocity in the annulus, relatively independent of the hole size. Considering the above mentioneduncertainties in the determination of the velocity, it is surprising to find such a simple relation.The tests with helium and the test with Wood?smetal lie outside this band. There is no single co r-relation between the liquid exit velocity and the dispersed fraction. The nitrogen and helium testscollapse on one curve, if they are correlated by rG UG2,and also the liquid metal test can be joinedinto hat curve if the dkpersed mass fractions are correlated by the Kutatela&e nwber, Ku = rGUG2/(rLg~)*n (Fig.21). (Surface tension of the metal is app. 0.35 N/m, that of water is 0.072
r~x ;ii
!:‘j } ~ Q;)
“~. ~~ ~ ‘7. . ..-”#/d./ j f-<\/ f-----n ‘~.

N/m.) If the threshold for droplet levitation up the annulus was applied according to the Ku- .
tateladze criterion Ku s 14, the velocity limit for N2/water would be 18 IU/s, and for both,He/water and N2/Wood3 metal systems it would be 47 mh. The results, however, show no sharpthreshold and”dispersal occurs also at lower velocities. The above correlation should not be over-rated. It is a preliminary result and does not reflect the complexity of the blow ,down and disper-sion processes. Taking the maximum gas velocity as a correlation parameter does not seem to takeaccount of the several stages of the blow out the single-liquid stage, the two-phase stage and thesingle gas phase. The maximum velocity occurs either near the end of the two-phase blow out (seeFig.15 ~ at t = 0.8s) or at a first stage of the two-phase blow out (see Fig. 15 b, at t = 0.6 s).
If the gas velocity in the annulus is really the governing parameter for melt dispersal, a re-duction of this velocity could-reduce the dispersion. This can be achieved by reducing the flow
‘ cross section at the RPV support or increasing the flow cross section of the annular space aroundthe RPV. Before a conclusion can be drawn for the optimum cavity design, more and special ex-periments are necessary, especially with lateral rips in the lower head.
Preliminary conclusions for the DISCO experiments
A first series of 19 experiments has been pefiorrned in the DISCO-C facility with a 1/18-scale model of an EPR-typical reactor pit with simukmt materials. Hole dkuneters between 15 mmand 100 mm (0.27 m and 1.80 m scaled) and initial pressures between 0.35 and 1.16 MPa wereemployed. The main results are:
1.
2.
3.
4.
3.
With large holes and 1 MTa initial pressure, practically all liquid (water) was ejected out ofthe lower pit however, approximately 25 YOwas caught in the space at the RPV support.
The results of all experiments with central holes in the lower head, with material combinationsnitrogen/water, helium/water and nitrogen/Woodk metal, can be correlated regarding the dis-persed fictions as a function of the Kutateladze number, Ku= ?GuG2/(?Lg@ln, with uG,themaximum gas velocity in the annular space around the RPV.
The threshold pressure for dispersion is less pronounced in the annular cavity geometry than incavities with a chute.
One experiment with a lateral rip in the lower head showed much smaller dispersal rates thanwith central holes. More experiments with such a geometry will be performed.
TRANSIENT CODE MODELS FOR LOW PRESSURE CORIUM DISPERSION
The experimental data are abundant enough to start testing theoretical models which are
needed to asses condhions on prototypic scale. Besides the generally used lumped parameter mod-
els, see [7], the present method takes advantages of the proven technology of a multiphase code
and adds specific dispersion models to it. The two theoretical approaches are used in parallel and
offer to mutually influence each other. While the lumped parameter approach is justified by the
lack of rigorously mechanistic models, the multiphase code has the advantage to resolve the ge-
ometry in greater detail. Specific models, such as that for entrainmen~ may be common to both
approaches.
The multiphase code chosen is AFDM (Advanced Fluid Dynamics Model [8]) which has
two dimensions and three velocity fields. This allows to track water, molten corium, and a gas-
...........~--=:;\ --;:::: , f . ‘\
...—-—------------- ......,.~-........... . . ... ,......”...s 18~: ]~. -.; ,,; /’ ,<., \\ L“.-—.,
./j : ~-., ‘~: ‘ ........... 1:j ~-_-../ ‘\\\ \ ,“ ./--–-”--’. . 1- ;1:
. ,
vapor mixture. Explicit models can easily be added to the code. For low pressure coriurn disper-
sion, models have been written for the formation of liquid films+at the cavity walls, for the en-
trainment of droplets out of the liquid film, for the oxidation of metallic melt in the cavity, and for”
the combustion of hydrogen in the compartments downstream of the cavity..,
The models need a control volume for the physical process which consists of a cluster of
computational cells. Each process may have a different control volume. This allows to use the
lumped parameter models for which substantial work has already been expended. While oxidation
and combustion are important to asses system pressures and long term behavior for the SNL Test-
1 and Test-2 experiments [4], dispersion rates for corium simukmt fluids were found to be hardly
affected in the present geome~. This permits to concentrate on one subject each.
The objective of the present wo~k is to use a coarse computational grid of AFDM and test
the applicability of entrapment and entrainment models. Higher geometrical resolutions may de-
mand adjustments of model parameters and will largely increase computational expenditure. In the
present model, a liquid film is defined at the cavity walls. The film is supposed to have a negligi-
ble velocity. All three veloci~ fields of the code are already occupie~ and a moving film would
need a flow-regime dependent subdivision of given computational cells which are limited to use
only cell-averaged values. For the entrapment of droplets on the walls, a simple model of mass
transfer rate is used which is proportional to the liquid droplet flow perpendicular to the wall and
indirectly proportional to the Reynolds number of the gas flow parallel to the wall. The entrain-
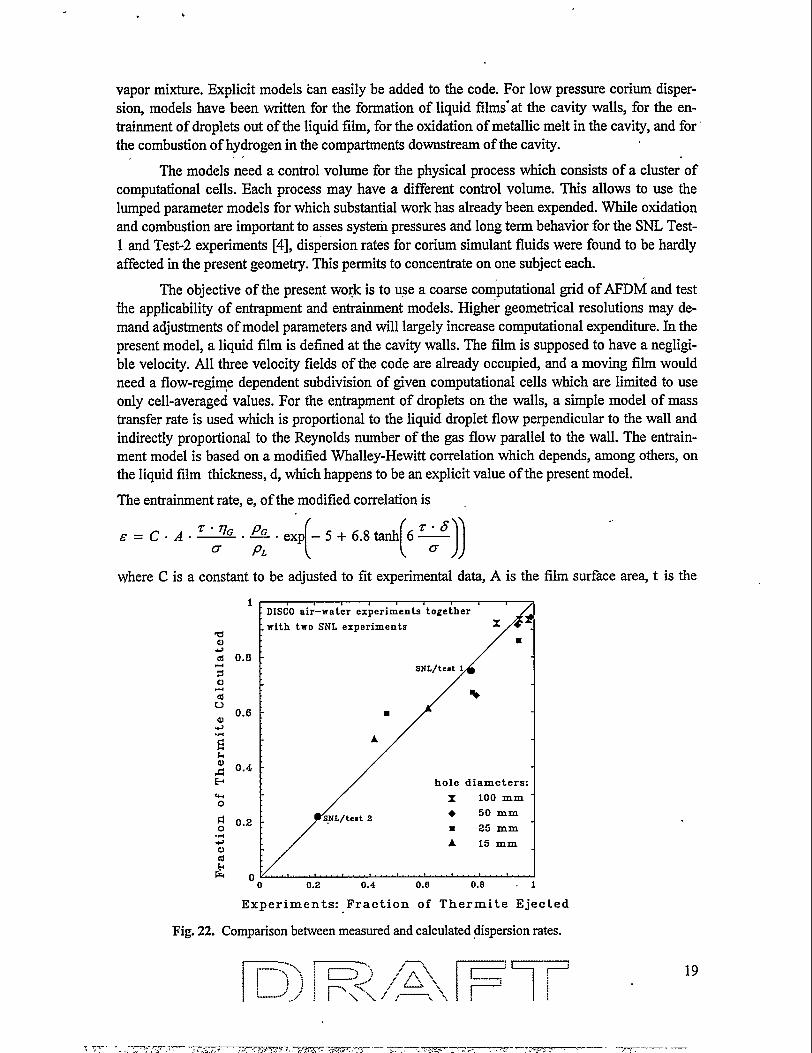
ment model is based on a modified Whalley-Hewitt correlation which depends, among others, on
the liquid film thickness, d, which happens to be an explicit value of the present model.
The entrainment rate, e, of the modified correlation is
& =C.A.=.~o- ~L “exf’+’”’+%l
where C is a constant to be adjusted to fit experimental daa
..
A is the film surface are% t is the
1: DISCOair-water experiments together
: with two SNL experiments
/
x>@al ■
■
A
hole diameters:%o t x 100 mm
: 0.2m 25 mm
.+
.@c1
A 15 mm
a
kn
“o 0.2 0.4 0.6 0.8 . 1
Experiments: Fraction of Thermite Ejected
Fig. 22. Comparisonbetweenmeasuredand calculateddispersionrates.
~\ ~ _,”.\ /-,~’,/-.,‘\ m,c5-~~))~~<~<,z~’:,’’~,>~ !L—.”” 19
-i T- , y .--’---- ‘T- -,-- -7T-PYr--- .- WT?Y 7 .7zc-?Tr--=-> .. ..,m-.y - -— -- . .. . . . . . .. . ._=. .._ ..— ..- —— - .—.-.’. r , ,.

..-— — . -
,
shear stress on the ga.i side of the film surface, ? is the dynamic viscosity, ands is the surface ten-sion. To the original correlation has been added the ratio of the densities of gas and liquid, rG/rL,an addition which was found to be necessary to match water and thermite data at the same time.The exponential fimction is a tentative fit to a cluster of experimental points published in [9]. Itshould be noted that the database is for annular flow in pipes with predominantly thin films. Thismay be quite different to tie present problem, especially on reactor scale.
As already criticized by [1O] , it is questionable whether the entrainment rate is propor-tional to the liquid viscosity as in the original formulation. Better results have been obtained byusing a constant reference viscosity, or by the vapor viscosity & in the formula above.-For lowpressure corium dispersions, the shear stress may not be well represented by a formula with a two-
. phase friction multiplier established for annular $low”inpipes. A smooth film surface shear stresshas given better results.
“ The flow is highly transient and the dmensions of the cavity are such that flow profilescannot develop because of the abrupt changes of flow d~ections. Therefore, the steady state en-trainment formula may not be filly valid. This shows also the need for adjusting the constant C inthe entrainment equation above. Local and transient measurement of flow and film parameters isdifficult which limits the assessment of possible alternatives to standard entrainment models. Atpresen~ models and parameters are assessed on integral results only.
Fig.22. shows the comparison of measured and calculated dispersion rates.,The rate is de-fined by the ratio of the liquid mass collected downstream of the cavity exit to the total initialmass. The cavity exit is at the upper end of the vertical annulus. Any liquid beyond the Ill-W pipesupport structures is supposed to be dispersed. Geometrical details of the support structures aredifficult to model without exact knowledge of steady state pressure losses.
The figure collects data of the DISCO water experiments and the two SNL thermite tests.The present models seem to be applicable to both material combinations, however, a scatter of upto 300/0still remains.
‘da)
4va)
.-
w
3 -
2 -
1
r
DISCO 100 mm hole
/
~ experiment
■ code
o0 1 2 3 4 5 6
Initial RPV Pressure (bar)
Fig. 23. DISCOejectedmass and codecalculationfor very low RPV pressures.
3 !—----.~\ i ~, -’) ‘ “\ I:!......”.-.1: j]! ,~’,.*./~_\‘N,~=:............r:~i ~,#:--...,---’,/;::\‘\~“,/””-”-”””-’.‘I/~ h
20
.

Another problem is the high dispersion with large holes for which the dispersion rate dropsonly at very low RPV pressures. Fig.23 shows the variation of the ejected water mass with the ini-tial RPV pressure. Only very late does the calculated dispersion rate fall with decre@ng pressureswhile the two experiments show a dispersion rate decrease already at higher pressures. The steepdownward ramp is responsible for large uncertainties, for the experiment as well as for the calcu-lation.
Recalculations of SNL and DISCO experiments with a two-dimensional multiphase code to which
specific DCH models were added have shown that correlations for entrainment and entrapment “
can be formed which give reasonable integral results for dispersion rates. The correlations need to
be tested on Mure experiments of the DISCO program before recommendations for extrapolations
to fill scale can be made.
Sandia is a multiprograrnhbonto~.operatedby Sandia Corporation,aLockheed Martin Company,for theUnited States Departmentof Energy
References undercontractllE-~C04-94~S5000.
1.
2.
3.
4.
5.
6.
7.
8.
9.
10.
11.
12.
13.
14.
Nucl. Eng. Des., 164,1996 (TopicalIssue on DCH)
Blancha6 T.K., M. Pilch, and M.D. Allen, Experimentsto Investigate Direct ContainmentHeating Phenomenawith Scaled Models of the Calvert Cliffs Nuclear Power Plant NUREG/CR-6469,SAND96-2289,Sandia Na-tional Laboratories,Albuquerque,N.M., Feb. 1997.
Bertodano,M. L. de, A. Becker, A. Sharon, R. Schnider,DCH Dispersaland entrainmentexperiment in a scaledannularcavity,Nucl. Eng. Des.,164,271-285, 1996
Blanchat, T.K., M.M. Pilch, RY. Lee, L. Meyer, and M. Petit Direct Containment Heating Experiments atLower Reactor Coolant SystemPressure in the SurtseyTest Facility, NUREG/CR-5746,SAND99-1634, SandiaNational Laboratories,Albuquerque,N.M., 1999.
Tutu, N.K., Ginsberg, C., A letter report on the results of meIt dispersal experimentswith the Suny and Zioncavity models, Brookhaven National Laboratory, Upton, New York, transmitted to the USNRC, Oct. 1990.
Pilch, M.M. RO.Griffith, Gas Blowthrough and flow qualily correlations for use in the analysis of high pressuremelt ejection (HPME) events, SANDIA Repo~ SAND91-2322, UC-523, Sandia National Laboratones, June1992.
Pilch, M.M,, A Two-Cell Equilibrium Model for Predicting DCH, Appendix E of M.M.Pilch, H.Yan,T.G.Theofanous, The Probability of Containment Failure in ZION, Sandia National Laboratory reportNUREG/CR-6075, SAND93-1535, July 1994
Bohl, W.R, D.Wilhelm, The Advanced Fluid Dynamics Model Program: Scope and Accomplishment, NuclearTechnology, VOI.99, pp.309-3 17, 1992
Hewi~ G.F., Liquid mass transfer in annular two phase flow, in F. Durst et.al. editors, Two-phase momentum,heat, and mass transfer in chemical, process, and engineering systems, Vol.1, Washington 1979, p.273
WNiams, D.C., RO. Griftlth, Assessment of Cavity Dk.persal Correlations for Possible Implementation in theCONTAIN Code, Sandia National Laboratory report SAND94-0015, February 1996
Jacobs, G., L. Meyer, Planned melt dispersal experiments in a scaled cavity, SMiRT 14 Post-Conference Semi-nar on Containment of Nuclear Reactors, CEA Sacley, France, August 25-26, 1997.
Allen, M.D., M. Pilch, T.K. Blancha~ RO. Griftlth, and RT. Nichols, May 1994, Experiments to Investigate Di-rect Containment Heating Phenomena with Scaled Models of the Zion Nuclear Power Plant in<the Surtsey TestFacility, NUREG/CR-6044, SAND93-1049, Sandia National Laboratories, Albuquerque, NM.
Blanchat, T.K., M.D. Allen, M. Pilch, and R.T. Nichols, June 1994, Experiments to Investigate Direct Contain-ment Heating Phenomena with Scaled Models of the Surry Nuclear Power PhnL NUREG/CR-6152, SAND93-2519, Sandia National Laboratories, Albuquerque, NM.
Tutu, N.K., Ghsberg, et.al., Debris Disuersal from Reactor Cavities durhw Hirzh-Pressure Melt Eiection AccidentScenarios, BNL, ~-tiG/CR-5146, 1988
. . –.
21
: ~ -T-———- . .-=.. — -—.- --
—. ... . . ----- ,., -., ., ... .,. ...F-..,~,. :,,,., ,,..