experimental study on effects of segregated cooling
TRANSCRIPT
EXPERIMENTAL STUDY ON EFFECTS OF SEGREGATED COOLING PROVISIONING
ON THERMAL PERFORMANCE OF INFORMATION TECHNOLOGY SERVERS IN
AIR COOLED DATA CENTERS
by
ASHWIN VENUGOPAL SIDDARTH
Presented to the Faculty of the Graduate School of
The University of Texas at Arlington in Partial Fulfillment
of the Requirements
for the Degree of
MASTER OF SCIENCE IN MECHANICAL ENGINEERING
THE UNIVERSITY OF TEXAS AT ARLINGTON
December 2015

ii
Copyright © by Ashwin Venugopal Siddarth 2015
All Rights Reserved

iii
Acknowledgements
I would like to thank Dr. Dereje Agonafer for his sustained encouragement and
support over the last few years of my thesis work in University of Texas Arlington. I would
also like to thank him for providing opportunities to work on industry-funded projects and
advancing various networking possibilities through attending conferences.
I would like to thank Dr. Jain and Dr. Haji-Sheikh for serving on my thesis
committee. I would also like to thank Dr. Veerendra Mulay of Facebook Inc. for providing
the necessary servers and equipment to carry out my experiments. I am thankful to Ms.
Sally Thompson for all her care and assistance with educational administrative matters
and otherwise.
I owe a great deal of gratitude to Rick Eiland for being my mentor with regards to
my thesis and various other projects. He was a constant source of knowledge and an
inspiration to solve research problems. I thank Marianna Vallejo for her guidance and
genuine interest to help. I am also thankful to John Fernandes and other EMNSPC team
members for their support.
Most of all, I would like to thank my family for their emotional and financial
support at all times. My mother (G. B. Pushpalatha), my brother (Chinmaya Rajath), my
aunt and uncle (Chaya and Bharath) and my cousins (Rithwik and Pallavi) have always
been there in my journey, providing enormous strength with their affection and love.
November 24, 2015

iv
Abstract
EXPERIMENTAL STUDY ON EFFECTS OF SEGREGATED COOLING PROVISIONING
ON THERMAL PERFORMANCE OF INFORMATION TECHNOLOGY SERVERS IN
AIR COOLED DATA CENTERS
Ashwin Venugopal Siddarth, M.S.
The University of Texas at Arlington, 2015
`
Supervising Professor: Dereje Agonafer
Modern Information Technology (IT) equipment are typically assumed to operate
in quiescent airflow conditions in an uncontained data center facility. In this study, the
multi-scaled thermal management strategies are reconsidered at the IT chassis and rack
level for a containment system. For an ideal containment configuration of airflow
provisioning the entirety of conditioned air provided by the Computer Room Air
Conditioning (CRAC) unit would flow through the IT equipment and return back to the
CRAC. But in actuality a lack of interfaced airflow distribution exists between the amount
of conditioned air provisioned to the rack and the volume capacity ingested by the IT
equipment thereby decreasing the efficiency of the overall cooling system.
This work evaluates the thermal performance of IT servers when operating in a
representative cold aisle containment system. In this study, the impact of positive and
negative static pressure differentials between the inlet and exhaust of a representative
rack is experimentally studied. The effect of fan proximity in the chassis layout to
variations in pressure differentials is assessed. This information can be helpful in
optimizing the desired static pressure set points within the room and define coupled
internal fan control strategies to achieve the most energy efficient use of cooling
resources.

v
Table of Contents
Acknowledgements .............................................................................................................iii
Abstract .............................................................................................................................. iv
List of Illustrations ..............................................................................................................vii
Chapter 1 Introduction......................................................................................................... 1
1.1 Data Center: An Overview ........................................................................................ 1
1.2 Segregated Cooling Provisioning ............................................................................. 2
1.2.1 Multi-Scale Thermal Management of Data Centers .......................................... 2
1.2.2 Optimization of Cooling Provisioning................................................................. 4
1.3 Scope of the Work .................................................................................................... 5
1.3.1 Motivation and Literature Review ...................................................................... 5
1.3.2 Objective of Study ............................................................................................. 7
Chapter 2 Experimental Setup and Testing Procedures of IT Servers ............................... 8
2.1. Server under Study .................................................................................................. 8
2.2 Experimental Test Setup .......................................................................................... 9
2.2.1 Idealized Containment Configuration ................................................................ 9
2.2.2 Test Setup and Data Acquisition ..................................................................... 10
2.3 Testing Procedures ................................................................................................ 12
Chapter 3 Impact of Static Pressure Differential between Supply Air and
Return Exhaust on Server Level Performance ................................................................. 14
3.1 Static Pressure Testing Procedure ......................................................................... 14
3.2 Results .................................................................................................................... 15
3.2.1 Externally Powered, Externally Controlled Server Fans ................................. 15
3.2.2 Internally Controlled, Externally Powered Server Fans................................... 21
Chapter 4 Impact of Fan Proximity in System Layout on Cooling Performance ............... 24

vi
4.1 Fan System Effects ................................................................................................ 24
4.2 Fan Proximity Testing ............................................................................................. 24
4.2.1 Objectives and Testing Procedure .................................................................. 24
4.3 Results .................................................................................................................... 26
Chapter 5 Influence of IT Workload Variation on Cooling Provisioning ............................ 30
5.1 Disparity in Compute, Memory and File System Workloads of Servers ................. 30
5.2 Results .................................................................................................................... 31
Chapter 6 Conclusion ........................................................................................................ 37
References ........................................................................................................................ 39
Biographical Information ................................................................................................... 43

vii
List of Illustrations
Figure 1-1 Raised-Floor Supply and Dropped-Ceiling Return Data Center Architecture ... 3
Figure 2-1 First generation Open Compute web server with partitioned airflow paths ....... 8
Figure 2-2 Deadband control limits utilized in the server under study ................................ 9
Figure 2-3 Schematic of experimental setup used to control inlet static pressure to
servers............................................................................................................................... 10
Figure 2-4 Simplified depiction of testing setup and data acquisition ............................... 11
Figure 2-5 Airflow Test Bench ........................................................................................... 13
Figure 3-1 Simulated rack of servers attached to the Airflow Bench ................................ 14
Figure 3-2 Impact of inlet static pressure on server CPU temperature at fixed fan duty
cycles of (a) 0%PWM, (b) 5%PWM, (c) 10%PWM, and (d) 25%PWM ............................ 16
Figure 3-3 Convergence of cooling performance of 0%, 5%, 10%, and 25%PWM fan duty
cycles across range of inlet static pressure ...................................................................... 17
Figure 3-4 Development of server flow curve from experimental system resistance and
fan curves .......................................................................................................................... 18
Figure 3-5 Comparison of theoretical flow curves at 0% and 25%PWM duty cycle for the
motherboard potion of a single server .............................................................................. 19
Figure 3-6 CPU temperatures maintained at or below control limit threshold across
differential static pressures range ..................................................................................... 21
Figure 3-7 Variation in fan speeds as a function of inlet static pressure .......................... 22
Figure 3-8 Total rack fan power as the inlet static pressure is varied .............................. 22
Figure 4-1 Simplified depiction of moving fans farther in the server under study ............. 25
Figure 4-2 Characteristic system resistance curve, fan curve and the experimental flow
curve for the Baseline case ............................................................................................... 26
Figure 4-3 System Resistance curves for the Baseline, 1D and 2D cases ...................... 27

viii
Figure 4-4 Experimental Flow curves for Baseline, 1D and 2D cases ............................. 28
Figure 5-1 Variation of CPU temperatures at 30% workload over a range of cooling
provisioning ....................................................................................................................... 31
Figure 5-2 Variation of CPU temperatures at Idle workloads over a range of cooling
provisioning ....................................................................................................................... 31
Figure 5-3 Variation of CPU temperatures at peak CPU workload over a range of cooling
provisioning ....................................................................................................................... 32
Figure 5-4 CPU Die Temperatures for 30% CPU Utilization for 0% to 25% server fan duty
cycles ................................................................................................................................ 33
Figure 5-5 Variation in CPU Die Temperature upon stressing the server to peak CPU
utilization ........................................................................................................................... 34
Figure 5-6 Increase in negative differential static pressure across the simulated rack
setup.................................................................................................................................. 35
Figure 5-7 Variation in fan speed based on fan control scheme at peak CPU utilization for
Server 10 at the bottom of the stack ................................................................................. 35

1
Chapter 1
Introduction
1.1 Data Center: An Overview
Data center is a purpose built computing infrastructure facility housing large
amounts of information technology (IT) equipment used to process, store and transmit
digital information and thereby centralizes all the IT operations of an organization. A data
center is a strategic asset facilitating business continuity and based upon the scale of
operations and growth predictions the facility is provisioned with hardware and support
infrastructure.
A data center facility comprises of the IT infrastructure which brings the strategic
value through utilization of computing nodes, data storage and transmission. IT
equipment operating require an uninterruptible power supply provided by the power
infrastructure consisting of power conversion and backup equipment delivering high
quality reliable power at all times. The power supplied to the IT devices upon useful
computations dissipate heat. Additional power is supplied to the cooling infrastructure to
remove the heat dissipated in the facility and keep the IT equipment in safe operating
conditions. As such, Data centers are power hungry by design and risk-averse in
operation rendering the data center industry highly inefficient and under-utilized due to
gross over-provisioning of resources [1].
Data center energy use doubled from 2000 to 2005, accounting for about 1.3% of
global energy usage and about 2 percent of energy use in the United States in the 2007
report [2]. The rate of growth slowed between 2005 and 2010, wherein the energy used
by data centers worldwide increased by about 56% and increased by 36% in the US
instead of doubling. By 2010, the total electricity use by data centers amounted to about

2
1.3 percent of all electricity use for the world and 2 percent of all electricity use for the US
[3].
With the prominent drive from Internet of Things (IoT) and Big Data and
continued prevalence of internet in global commerce, entertainment and social
interactions the energy demands of data centers shall continue to grow. In 2013, the full
90% of all the data in the world had been generated over the previous two years and the
steep increase continues [4]. The number of data centers around the globe are expected
to increase to store the enormous amount of data and be able to deliver data at the edge.
Power Usage Effectiveness (PUE) is a metric that measures the relationship with
the total facility energy consumed and the IT equipment energy consumed within a
particular data center infrastructure. The energy consumption for the cooling
infrastructure in a typical data center can be more than the IT infrastructure and
sometimes amounts to more than half of the energy consumed by the data center facility.
While the cloud giants continue to push their PUEs closer to 1.0, the general PUE trends
observed amongst the enterprise data centers reveal two-thirds of enterprises reported
PUEs more than 2.0 and 10 percent were over 3.0 or didn’t know [5]. Hence, highly
efficient cooling systems are important to reduce the overall cost of operation and carbon
footprint of data centers.
1.2 Segregated Cooling Provisioning
1.2.1 Multi-Scale Thermal Management of Data Centers
Data center thermal management is multi-scaled in nature with the primary
heat generation occurring at the chip level gets dissipated into the data center airspace
which is then finally rejected to the outside ambient. At the chip level, the thermal
management solution involves improved heat sink design, use of thermal interface

3
materials and application of heat spreaders to remove heat from the chip. At the server
level, the chassis fan array and the ducted air delivery paths are primed to deliver airflow
to the heat sinks.
At the rack level, the airflow within the cabinets are optimized and additional
configurations such as optimal placement of servers, rear-door heat exchangers and
liquid cooling are considered. Room level cooling is part of the facility cooling design
which focuses on installing computer room air-conditioning (CRAC) units to deliver
conditioned air to the racks. Air cooling is the widely prevalent data center cooling
technology where the key function involves providing the raw cooling capacity in kilowatts
to exhaust the total power load (kW) of the IT infrastructure. The air conditioning systems
are closely integrated at the room, row or rack level. The airflow delivery is controlled
through various air distribution configurations to minimize air mixing and distribute air to
the loads [6].
Figure 1-1 Raised-Floor Supply and Dropped-Ceiling Return Data Center Architecture
In Figure 1-1, one such commonly found data center architecture is shown. A
raised-floor cold air supply and hot air dropped-ceiling return with the CRAC blowers
pressurizing the raised-floor plenum allowing perforated tiles to deliver conditioned air to

4
the above floor where positioned. The physical airspace is divided into cold and hot aisle
facilitating the cold air to enter the rack inlet, picks up heat at the rack, and is then
removed from the hot aisle and back to the CRAC, through the return dropped-ceiling
plenum. An effective cooling system shall comprise of an interfaced and coupled thermal
solution amongst all levels of thermal management in a data center.
1.2.2 Optimization of Cooling Provisioning
In IT equipment thermal design, any cooling system must ensure that each and
every microelectronic component meets its thermal specification. For microelectronics
components the silicon devices reach their functional limits generally in the 85°C to
105°C range while any further 15°C to 25°C increase can damage and shutdown the
component. In an air cooled system, the component temperature is driven by the inlet air
temperature to the system, the increase in air temperature due to upstream heat sources
and thermal shadowing and the inherent heat dissipation of the component due to
component packaging, power dissipation and thermal solution. While component
placement is heavily driven by electrical circuitry considerations, placement for thermal
considerations matters and are often not designed for optimal thermal solution. The
opportunities in optimizing the airflow paths within the server board layout focuses on
intelligent ducting to improve airflow delivery to critical components.
Air movers are selected to match the IT equipment system resistance and finely
tuned to provision necessary volumetric flow rates for optimal cooling performance,
power consumption, acoustic noise, fan reliability and redundancies [7]. Component
thermal sensors provide better knowledge of cooling requirements and can be generally
used to dictate the fan array resulting in reduced fan speeds. As the rack inlet

5
temperature increases the fan array responds by operating at higher speeds, resulting in
dramatic fan power increase, to maintain safe component temperatures.
The air conditioning units are configured to provision conditioned air at
temperature and relative humidity set points to comply to IT equipment manufacturer
specifications and the American Society of Heating, Refrigerating, and Air-Conditioning
Engineers (ASHRAE) class limits [8] for which the equipment are designed. Despite the
expected variation of temperatures and relative humidity observed in the data center, the
facility air distribution needs to be designed to comply with the stated thermal guidelines
and maintain stability of the environment. To minimize such variations and conserve
cooling energy, aisle containment solutions can be installed. For further such savings, the
room level air handlers could be integrated more closely to respond to varying IT
workloads.
1.3 Scope of the Work
1.3.1 Motivation and Literature Review
In pursuit of extending the air cooling technology in data centers, the industry is
constantly looking for innovations that augment the efficiencies and cooling capacities per
rack. Various studies have contributed in optimizing airflow provisioning at the rack
focusing on facility room architecture and data center air distribution [9], [10]. The advent
of aisle containment has presented an easy solution to implement and its advantages of
airflow separation, improved efficiency and thermal ride-through times are well
documented [11]–[13]. High density facility design for rack densities up to 30 kW cabinets
in [14] proposed the idea of targeted air supply with a velocity less than 400 feet per
minute. By maintaining a static pressure differential in a cold aisle and hot aisle
configuration the server fans speeds were minimized to improve overall efficiency in an
Open Compute data center [15].

6
Modern IT servers are typically designed assuming to operate in quiescent
conditions with a zero differential pressure between inlet and exhaust. In an operating
data center, especially with aisle containment, any variation in IT equipment’s fan speed
control results in varying volume of air through the IT equipment. Without dynamic
response from the data center air conditioning system to this variation, the positive or
negative differential pressure between the supply and return exhaust of any IT equipment
in the rack can influence the ability of its fan array in ingesting conditioned air. Even
though, most new or upgraded data centers use the CRAC supply air temperature as the
control set point together with variable speed fans to control under-floor plenum pressure
they need to respond to the dynamic variations of IT workloads and airflow demands [7],
[16].
Previous studies have worked to understand the interactions of under-floor
pressure distributions on airflow rates through perforated floor tiles and its effect on air
distribution and temperatures at the rack inlet. Common goals for underfloor pressure
management are to reduce the velocity of air flow and hence increase the static pressure
of the underfloor. This in turn increases the volume of air passing through perforated floor
tiles. In an idealized scenario, the entirety of conditioned air provided by a CRAC unit
would travel through a server. In actuality, bypass and leakage of cold air around the
server and into the hot aisle decreases the efficiency of the room level cooling system
[17], [18]. Additionally, recirculation of hot exhaust air back to the cold aisle raises the
inlet temperature to servers, also diminishing cooling efficiency [19].
Most of the previous studies related to data hall pressurization stop at the rack
level focusing on inlet temperatures, rack airflow rates and aisle level leakage flow rates
[11], [13], [20]–[22]. This work seeks to understand the impact of pressurization on the
thermal performance and energy consumption within a server. This information can be

7
helpful in optimizing the desired static pressure set points within the room to achieve the
most energy efficient use of cooling resources.
1.3.2 Objective of Study
The overall objectives of this study are as follows:
What is the effect of varying differential static pressures between supply air and
return exhaust at server level?
Upon variation, what is the impact on server cooling efficiencies and overall
thermal performance?
How does the chassis fan proximity in the server system layout, chassis fan
speed control scheme and IT equipment varying workload affect the IT
equipment sensitivity to differential static pressures?
What are the important parameters to enable optimization of airflow provisioning
at the rack and define coupled fan control strategies?

8
Chapter 2
Experimental Setup and Testing Procedures of IT Servers
2.1. Server under Study
Figure 2-1 First generation Open Compute web server with partitioned airflow paths
Figure 2-1 shows a first generation Open Compute server based on Intel
motherboard used in this study. The key design features of these servers include larger
chassis height of 1.5U rack mount unit and customized heat sinks for wider spaced
primary heat generating components (CPUs). The airflow path is compartmentalized with
a partitioning for power supply and hard drive as shown in Figure 2-1. The critical
temperature below which the CPUs need to be operated is 81.3°C. In this work, the
compartmentalization allowed for discrete analysis of airflow over primary components
and fan power consumption of the servers. Further details of this particular web server
design can be found in references [23], [24].

9
Four 60mm x 25mm DC fans are located at the exhaust of the servers which pull
conditioned air through the server and are driven based on a 25 kHz pulse width
modulation (PWM) signal that is prescribed by CPU die temperatures.
Figure 2-2 Deadband control limits utilized in the server under study
The two processors represent the principal heat load within the system with a
thermal design power of 95W and their temperatures drive the fan speed control
algorithm based on a deadband control scheme as shown in Figure 2-2 to ensure
adequate cooling. The power supply unit has an integrated 60mm fan that modulates the
airflow based on inlet temperatures [25].
2.2 Experimental Test Setup
2.2.1 Idealized Containment Configuration
In an operating data center the airflow provisioning configuration modulates the
temperature and pressure variations across the face of the front-to-back server rack.
Much work has shown that actual data center racks have non-uniform pressure gradients

10
across the face of a rack and the velocity streamlines exiting perforated floor tiles are not
straight into the servers [26].
A stack consisting of four Open Compute servers was used to simulate a rack.
The servers are named 10 through 40 starting from the bottom of the stack. An Air Flow
Bench test chamber was used to act as a pseudo cold aisle containment system shown
schematically in Figure 2-3. The inlet of the rack was mounted on the airflow bench with
the outlet exhausting into the room ambient. This is an idealized scenario because it
assumes uniform pressure across the face of the servers and flow straighteners within
the chamber orient streamlines parallel to the servers.
2.2.2 Test Setup and Data Acquisition
All the 60mm DC fans are powered with an external 12VDC power supply that
enables measurement of fan power for the rack, allowing the fan cooling power to be
monitored separately. Each fan is connected onto a solderless breadboard using four pin
Figure 2-3 Schematic of experimental setup used to control inlet static pressure to servers
Nozzle Plate
Blast Gate
Air Flow
P
Pseudo Cold Aisle
at Variable Pressure
Pseudo Hot Aisle
at Gauge Pressure
Blower represents CRAC fans

11
connectors where the four pins replicate the functions of ground, power, tachometer
sensing and PWM control as found on the motherboard. Figure 2-4 depicts the
experimental test setup, control and data acquisition setup.
Figure 2-4 Simplified depiction of testing setup and data acquisition
The fan speeds are sensed using a data acquisition unit sensing off of the
tachometer signals from each fan and the fan array is controlled through an external
PWM signal generator or through the internal motherboard native control algorithm based
on deadband control scheme. When the fan array is controlled externally, the fan speeds
are varied in increments of fan duty cycles [27]. To utilize the native control algorithm, the
control signal from a particular server motherboard was fed to its respective fans. Since
the fans were still externally powered and sensed, the native control algorithm required to
sense the presence of fans operating at all times for redundancy purposes. Tachometer
signals from four extra fans, acting as dummies with idling fan speeds, provided the

12
necessary presence to prevent the fan speed control algorithm from going into the failure
mode wherein all the server fans would be ramped to the maximum speeds. The ground
signal from each server and fan was shared between all the monitoring and control
equipment.
A Yokogawa CW121 power meter is used to measure the current drawn by the
stack of servers operating at 277VAC, as well as the power of three individual servers 10,
20 and 40. Omega OM-EL-USB-1-LCD temperature loggers are used to measure the
room ambient temperature and a rack inlet temperature of 25°C ± 1.0°C is observed
during testing. To communicate with the four servers operating on LINUX operating
interface, a desktop workstation is utilized to execute bash command scripts and transfer
the data logged on the servers with synchronized time stamps.
2.3 Testing Procedures
The Airflow Bench (AFB) is a test bench and for a given system/device under
study it allows for the measurement volumetric flow rates for varying pressure drops
across the given system. The test bench consists of a blower which can be operated
either in the push or pull configuration. The test bench has two chambers with a nozzle
plate in the middle allowing the static pressure taps installed across them to record
differential pressures.
Figure 2-5 shows the test bench used for this study. There are flow straighteners
within the outlet chamber to facilitate supply of uniform and steady airflow. The inlet static
pressure within this chamber was monitored utilizing the static pressure tap provided.
The measurement can also be considered as the pressure drop across the simulated
rack setup as the pressure transducer at the other end was open to the ambient gauge
pressure. By varying the blower speed, increments of inlet static pressure can be

13
achieved and the flow rates and pressure drops across the simulated rack are constantly
monitored through a data acquisition unit. Any system or air mover is characterized on
the test bench complying to the standard referenced in [28].
The servers are stressed using a synthetic load generator tool called lookbusy
[29] to create various workloads. A bash script automates this process as mentioned
earlier. Native Linux commands mpstat [30] and free [31] are executed to measure CPU
utilization and memory usage over the duration of stressing. The ability to fixate fan
speeds and vary the stressing levels allows parametric observations to be made
eliminating the cooling influence of the chassis fans. CPU Die temperature, a primary
data of interest was monitored utilizing an internal diagnostic tool provided by the
manufacturer [32].
In the following chapters, testing procedures and data measured for each
experimental test conducted shall be elaborately explained.
Figure 2-5 Airflow Test Bench

14
Chapter 3
Impact of Static Pressure Differential between Supply Air and Return Exhaust on Server
Level Performance
3.1 Static Pressure Testing Procedure
To understand the impact of inlet static pressurization on the thermal
performance of the servers, the server fans were first fixed at a constant duty cycle. For
the initial testing, a synthetic computational load is applied to all four servers using a free
software package, lookbusy [29].
For the externally controlled and externally powered fan configuration, the effect
of pressure on CPU temperatures could be isolated from other fan interactions. While
operating at fixed fan speeds, the blower to the Air Flow Bench was adjusted to achieve a
desired inlet static pressure.
At each server fan speed and blower setting, the server was provided a synthetic
computational workload of idle, 30%, and 98% CPU utilization with the lookbusy software
Figure 3-1 Simulated rack of servers attached to the Airflow Bench

15
tool. Each workload was run for 30 minutes and repeated three times in total for
repeatability. The results gathered here are taken from the average values over the last
10 minutes of each computational workload as this is when steady state CPU
temperatures were achieved.
Following the externally powered, externally controlled test, the server fans were
then controlled internally by the motherboards native fan speed control algorithm while
still being powered externally. Again, the Air Flow Bench was set to fixed blower speeds,
but now, the inlet static pressure became a function of the server fan speeds as they
modulated to maintain the control set point temperature of the deadband operation
described in Figure 2-2. Tests were conducted with the servers operating at 98% CPU
utilization only because this was the only workload that generated CPU temperature high
enough to trigger the fan speed control. The workload was operated for 60 minutes in this
case to allow the fluctuations in fan speed and static pressure to reach steady state
conditions. Average values over the last ten minutes of steady state conditions are
reported here.
3.2 Results
3.2.1 Externally Powered, Externally Controlled Server Fans
Figure 3-2 shows the results for the externally powered, externally controlled
tests across the ranges of inlet static pressures studied when the servers were operated
at maximum computational load. Note in the figure that the y-axis crosses at a negative
static pressure value. A best curve fit taken from all CPU temperatures across each of
the four servers shows the average trend in the data. Note in the figure that the y-axis
crosses at a negative static pressure value.

16
A best curve fit taken from all CPU temperatures across each of the four servers
shows the average trend in the data. At the lower fan speeds of 0% and 5%PWM duty
cycle, CPU temperatures begin to reach their upper functional limits when the static
pressure becomes negative. From Figure 3-3 it can be seen that these lines of constant
fan duty cycles eventually converge. This convergence takes place at higher static
pressures for higher fan speeds.
Figure 3-2 Impact of inlet static pressure on server CPU temperature at fixed fan duty
cycles of (a) 0%PWM, (b) 5%PWM, (c) 10%PWM, and (d) 25%PWM

17
As an approximation from the curve fits shown in Figure 3-3, the die
temperatures at 0% and 5%PWM signals are equal at 0.07 inH2O inlet static pressure.
CPU temperatures for 0%, 5%, and 10%PWM all converge at 0.11 inH2O inlet static
pressure. All of these curves converge with 25%PWM fan speed at 0.15 inH2O inlet
static pressure. This may be expected because, beyond a certain static pressure, the
airflow provided by the blower begins to overtake the airflow provided by the internal
server fans.
Figure 3-3 Convergence of cooling performance of 0%, 5%, 10%, and
25%PWM fan duty cycles across range of inlet static pressure
18
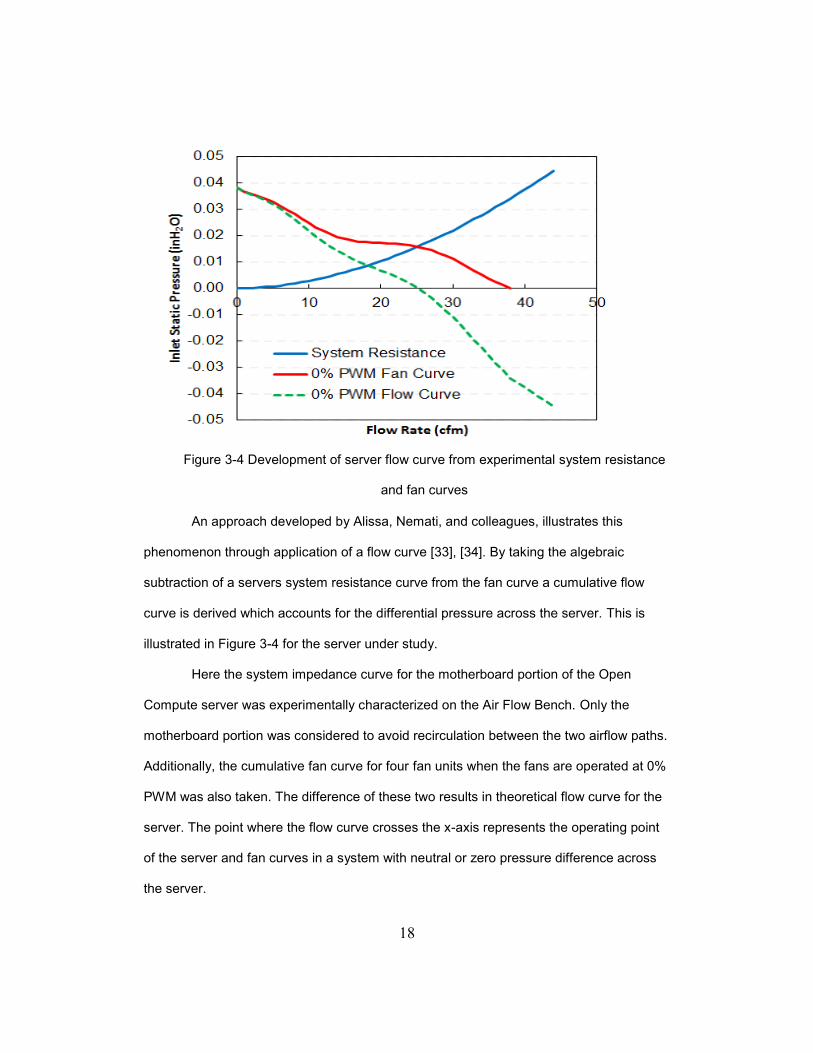
An approach developed by Alissa, Nemati, and colleagues, illustrates this
phenomenon through application of a flow curve [33], [34]. By taking the algebraic
subtraction of a servers system resistance curve from the fan curve a cumulative flow
curve is derived which accounts for the differential pressure across the server. This is
illustrated in Figure 3-4 for the server under study.
Here the system impedance curve for the motherboard portion of the Open
Compute server was experimentally characterized on the Air Flow Bench. Only the
motherboard portion was considered to avoid recirculation between the two airflow paths.
Additionally, the cumulative fan curve for four fan units when the fans are operated at 0%
PWM was also taken. The difference of these two results in theoretical flow curve for the
server. The point where the flow curve crosses the x-axis represents the operating point
of the server and fan curves in a system with neutral or zero pressure difference across
the server.
Figure 3-4 Development of server flow curve from experimental system resistance
and fan curves

19
All points above the x-axis can be considered when the inlet static pressure to
the server is a negative value during the above experiments. All points below the x-axis
are indicative of the positive pressure conditions of the above experimental testing. As
seen from the experimental data positive inlet static pressure results in more airflow
through the system and lower component temperatures. The resultant flow curve shown
in Figure 3-4 is unique to the operation of the server when the fans are running at
0%PWM duty cycle. A new flow curve must be created when the fans are operated at
different speeds since the fan curve will change.
A comparison of the flow curve for the Open Compute server when the fans
operate at 0% and 25%PWM duty cycle is shown in Figure 3-5. As can be seen, these
curves converge and are equal beyond 0.10 inH2O of positive inlet static pressure.
Figure 3-5 Comparison of theoretical flow curves at 0% and 25%PWM duty cycle for the
motherboard potion of a single server

20
This can be explained by the fact that beyond 38cfm the 0%PWM flow curve is
simply an inverse of the server’s system resistance. It is assumed that at pressures
beyond free flow condition the fan will not be generating any additional airflow. The fan’s
contribution to flow and pressure is limited to its fan curve.
An additional point to note is that the convergence of the theoretical flow curves
in Figure 3-5 is at approximately 0.10 inH2O, well below the 0.14 inH2O point seen in the
experimental data of Figure 3-3. This can be explained by the fact that these flow curves
are limited to the theoretical operation of just the motherboard portion of the Open
Compute servers. In actual testing, additional airflow passes through the power supply
(PSU) portion of the server. The PSU airflow can be considered leakage airflow past the
motherboard region of the server and hence a high inlet static pressure would need to be
maintained to obtain the desired airflow across the motherboard.
The PSU portion of the server represents a system with lower system impedance
and therefore consisting of weaker fans. But the motherboard portion represents a
system with higher system impedance and therefore have stronger array of fans installed.
Any system with lower system impedance to airflow shall be more susceptible to changes
in inlet and exhaust static pressures [35].

21
3.2.2 Internally Controlled, Externally Powered Server Fans
When the server fans are controlled internally, it is expected that the CPU
temperatures will not exceed their target values specified in the deadband control. This is
seen in Figure 3-6 across the range of inlet static pressures studied.
At lower inlet static pressure values (particularly in the negative region) CPU
temperatures are seen to fluctuate around the control range of 68°C to 74°C. The internal
server fans are capable of operating at higher fan speeds and manage to keep the CPU
temperatures under the critical temperature limit. At higher inlet static pressures, the air
flow provided by the blower over powers the internal server fans and more consistent
temperatures are observed.
Figure 3-6 CPU temperatures maintained at or below control limit
threshold across differential static pressures range

22
Figure 3-8 Total rack fan power as the inlet static pressure is varied
Figure 3-7 Variation in fan speeds as a function of inlet static pressure
1500
2000
2500
3000
3500
4000
4500
5000
5500
-0.10-0.08-0.06-0.04-0.02 0.00 0.02 0.04 0.06 0.08 0.10
Fa
n S
pe
ed
(rp
m)
Inlet Static Pressure (inH2O)
Server 10
Server 20
Server 30
Server 40
5
10
15
20
25
30
-0.10 -0.08 -0.06 -0.04 -0.02 0.00 0.02 0.04 0.06 0.08 0.10
Ra
ck
Fa
n P
ow
er
(W)
Inlet Static Pressure (inH2O)
Server 10
Server 20
Server 30
Server 40
23
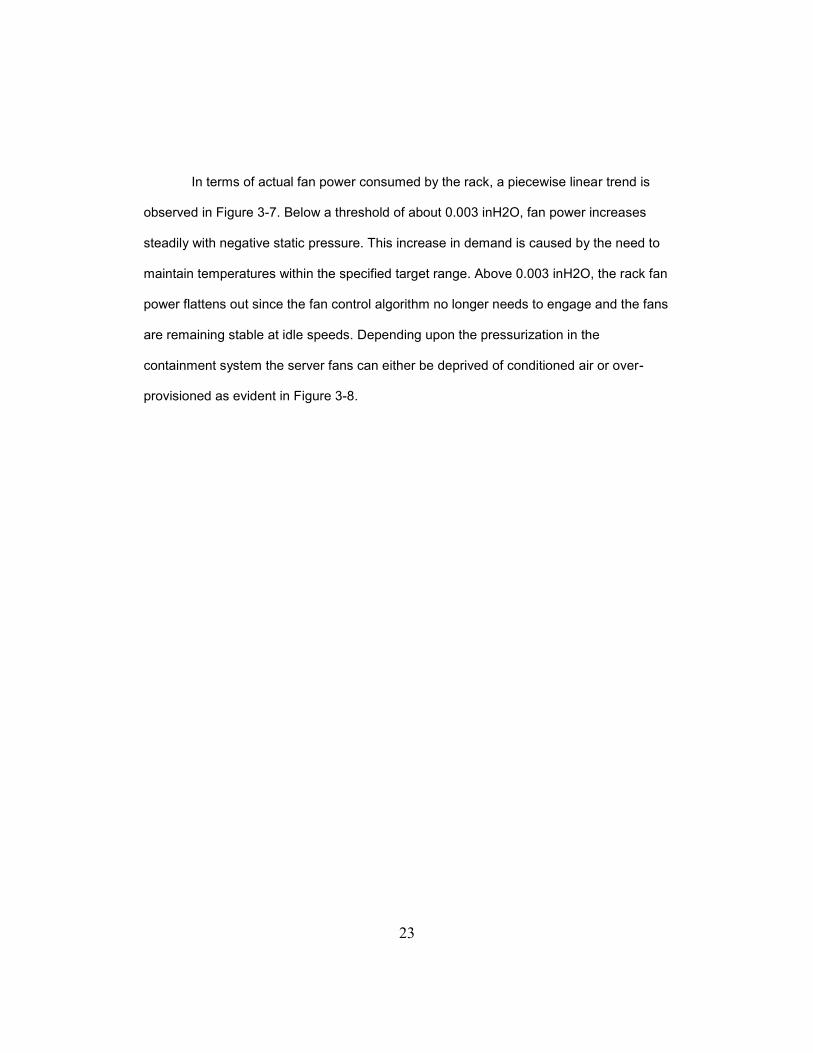
In terms of actual fan power consumed by the rack, a piecewise linear trend is
observed in Figure 3-7. Below a threshold of about 0.003 inH2O, fan power increases
steadily with negative static pressure. This increase in demand is caused by the need to
maintain temperatures within the specified target range. Above 0.003 inH2O, the rack fan
power flattens out since the fan control algorithm no longer needs to engage and the fans
are remaining stable at idle speeds. Depending upon the pressurization in the
containment system the server fans can either be deprived of conditioned air or over-
provisioned as evident in Figure 3-8.

24
Chapter 4
Impact of Fan Proximity in System Layout on Cooling Performance
4.1 Fan System Effects
For any Original Equipment Manufacturer (OEM) server or custom built server,
fans are usually selected from a range of models and sizes, rather than designed
specifically for the particular server. Usually, depending on the server size and form
factor the server fans are subjected severe system effects. System effect is the change in
system performance resulting from the interaction of fan and server components. Fan
selection is based on calculating the airflow and pressure drop requirements of a system.
But if the fans are under-sized and the system configuration is poor, fan performance can
be degraded leading to insufficient airflow delivery. A conservative design alternative to
over-size the fan/motor assembly can lead to significant increment in energy costs [36].
The server form factor is dictated by the standardized rack or cabinet sizes to facilitate
servers to be hot swappable. And with the trend of increasing server densities, the racks
shall get more power dense requiring more airflow for cooling purposes.
In this study, the feasibility of improving fan system performance by varying the
fan inlet conditions is experimentally investigated. Poor airflow conditions at the inlet of
the fan can decrease its overall effectiveness and efficiency with which it imparts energy
to an airstream.
4.2 Fan Proximity Testing
4.2.1 Objectives and Testing Procedure
The inlet conditions of the fan array in the motherboard portion web server from
the previous study is considered. The impact of fan-system effects on cooling efficiencies

25
is experimentally characterized by moving the four 60mm diameter fans farther in fan unit
diameter increments. See Figure 4-1 for a simplified depiction of the fan proximity study.
Figure 4-1 Simplified depiction of moving fans farther in the server under study
The 60mm diameter axial fan is characterized on the Airflow test bench to obtain
the experimental fan curve [28]. Using fan affinity laws, the cumulative fan curve for the
four fans is formulated and plotted [37]. To capture the fan performance when operating
in the server, the server is mounted on the Airflow bench with the fans fixated to operate
at maximum duty cycle. The ability of the fan array to deliver airflow in the server is tested
over increments of pressure drops ranging from the no flow or stall condition (maximum
pressure drop), free flow condition (zero pressure drop) and positive pressures above the
free flow condition. The characterized curve depicting the ability of the fan to deliver

26
airflow within the server system is called an experimental flow curve [33]. The test is
repeated for the cases when the fans are moved first by 60mm (1D), equal to one fan
diameter. Subsequently, moved farther again by 120mm (2D), equal to two fan diameters
as shown in Figure 4-1. Any increase in the system resistance is characterized by plotting
the system resistance curve for each case described in Figure 4-1.
4.3 Results
For the baseline case, the system resistance curve, the cumulative fan curve
and the experimental flow curve described earlier is plotted in Figure 4-2. The difference
in the fan performance curve when characterized in the ideal laboratory conditions when
compared to the experimental flow curve is evident from Figure 4-2.
Figure 4-2 Characteristic system resistance curve, fan curve and the experimental flow
curve for the Baseline case

27
The degradation in fan performance is attributed to poor inlet conditions of
placing the server fans within the server. Although the primary purpose of internal server
fans is to ingest enough air to keep all the server components below critical temperatures
any improvements in fan performance can have a cascading positive effect at the facility
level.
For the baseline case, it is evident in Figure 4-2 the fan curve depicts the
volumetric flow rate through the server at the operating point is 98.7 CFM while it is only
64.1 CFM according to the experimental flow curve. Flow curves can be considered to
provide a better depiction of volumetric flow rates through the server as they account for
the operational performance of server fans.
Figure 4-3 System Resistance curves for the Baseline, 1D and 2D cases
28
In Figure 4-3, the system resistance curves for the baseline case and for the
cases when the fans are moved 1D and 2D farther are shown. The system resistance for
the 1D and the 2D case is incrementally more than the baseline case. The chassis
extension required to provide the clearance at the inlet of the fans and also
accommodate the fan array is responsible for the slight increase in system resistance.
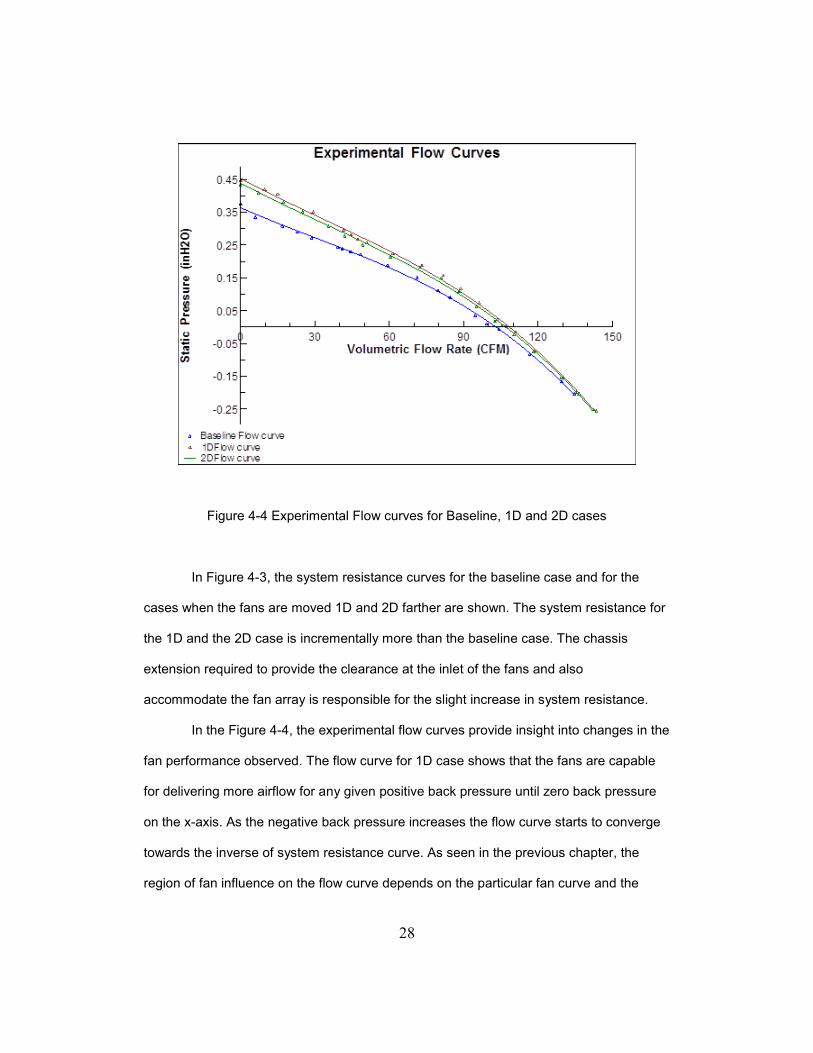
In the Figure 4-4, the experimental flow curves provide insight into changes in the
fan performance observed. The flow curve for 1D case shows that the fans are capable
for delivering more airflow for any given positive back pressure until zero back pressure
on the x-axis. As the negative back pressure increases the flow curve starts to converge
towards the inverse of system resistance curve. As seen in the previous chapter, the
region of fan influence on the flow curve depends on the particular fan curve and the
Figure 4-4 Experimental Flow curves for Baseline, 1D and 2D cases

29
system resistance curve. From the flow curve for 2D case, the improvement in fan
performance is slightly lesser than the 1D case due to the negating effect of increase in
2D system resistance. For the 1D and 2D case, the fans manage to overcome the 1D
and 2D system resistances and deliver 80.1 CFM and 72.6 CFM respectively.
The range of influence in airflow delivery for the fans increases for the 1D and 2D
cases but they are rendered more susceptible to any variations in the differential static
pressures at the inlet and return exhaust.

30
Chapter 5
Influence of IT Workload Variation on Cooling Provisioning
5.1 Disparity in Compute, Memory and File System Workloads of Servers
Generally, servers in a data centers are rarely completely idle and seldom
operate near their maximum utilization levels [38]. The real-world data center workloads
can be very seasonal and varying spatially and in time within the data center. A recent
performance study [39] on real-world data centers focusing on server CPU utilization,
memory usage, disk plus file system usage reveals the disparity in their average
workloads for over a period of two years. CPU utilization is the percentage of time the
CPU is active over an observation timeframe. Utilization values for memory, disk and file
system are defined by the volume of space used divided by the total available space. The
study reports 7-25% CPU, 72-84% memory, 64-81% disk and 39-55% file system
utilization workloads [39].
When building a data center, capacity planning and resource provisioning
focuses on supporting the peak workloads based on strategic workload predictions and
future growth. When operating a data center, significant energy savings can be made by
focusing on dynamic resource consolidation and dynamic cooling provisioning. Source of
electricity and designed IT peak load are reported to have a significant impact in a data
center lifecycle assessment study. Secondary parameters identified were server idle
power and IT utilization workload management [40].
Dynamic cooling provisioning focuses on matching the cooling capacity with the
varying IT workloads. In this study, the server under consideration is a web server. For
the experimental setup described in Chapter 2, the impact of under-provisioning and
over-provisioning the simulated rack operating at various IT workloads is reported here.

31
5.2 Results
23
26
29
32
35
38
41
-0.02 0.00 0.02 0.04 0.06 0.08 0.10 0.12 0.14 0.16
CP
U T
em
pe
ratu
re ( C
)
Inlet Static Pressure (inH2O)
UCPU = Idle, 0%PWM
Server 10
Server 20
Server 30
Server 40
Average
40
45
50
55
60
65
70
-0.02 0.00 0.02 0.04 0.06 0.08 0.10 0.12 0.14 0.16
CP
U T
em
pe
ratu
re ( C
)
Inlet Static Pressure (inH2O)
UCPU = 30%, 0%PWM
Server 10
Server 20
Server 30
Server 40
Average
Figure 5-1 Variation of CPU temperatures at Idle workloads over a range
of cooling provisioning
Figure 5-2 Variation of CPU temperatures at 30% workload over a range
of cooling provisioning

32
In Figure 5-1, 5-2 and 5-3, the CPU utilization workloads of 0%, 30% and 98% is
considered and the variation in CPU die temperatures over a range of cooling
provisioning is shown. The fans are fixed at idle speeds to quantify the effect of cooling
provisioning on the CPU die temperatures. At zero differential static pressure, the cooling
provisioning can be considered to be properly provisioned where the amount of
conditioned air provisioned matches the volume capacity ingested by the internal server
fans. For peak CPU utilization of 98% and with the fans idling the CPU die temperatures
are observed to be close to critical CPU temperature of 81.3°C. Maintaining a positive
differential static pressure by pressurizing the cold aisle at 0.01 inH2O can reduce the
CPU die temperatures close to the target die temperatures. But such aisle pressurization
would end up over-cooling the servers during idle and 30% CPU utilization workloads,
expending extra conditioned air and thereby affecting energy consumption at the CRAC.
Figure 5-3 Variation of CPU temperatures at peak CPU workload over
a range of cooling provisioning

33
Allowing the differential static pressure to get to negative values can affect the
CPU die temperatures significantly for CPU utilization workloads above 30%. Although, it
should be noted the internal server fans were fixed at idle speeds which counteracted its
ability to influence the increasing CPU die temperatures. In Figure 5-4, the increasing fan
speeds demonstrate the CPU temperatures can be cooled to be within the desired CPU
temperature margins.
To quantify the effects of under-provisioning a server rack, the simulated rack
setup from Chapter 2 is considered. The stack of four servers, initially at idle CPU
workloads, are stressed to peak CPU utilizations. The variation in internal fan speeds and
the thermal mass plot of the CPU is observed until the CPU die temperatures reach the
target temperatures defined in the fan speed control algorithm.
Figure 5-4 CPU Die Temperatures for 30% CPU Utilization for 0% to 25%
server fan duty cycles

34
When the internal server fans are idling at idle CPU utilization workload, a zero
differential static pressure is maintained across the simulated rack.
Any increase in fan speeds shall create negative differential static pressures due
to the lack of dynamic variation in cooling provisioning to the rack. Fans are forced to
work against the negative differential static pressures and fight with neighboring server
fans to deliver necessary airflow dictated any increase in CPU die temperatures. It took
about 15 minutes to reach the target CPU die temperatures.
Ucpu=98%
Duration(Seconds)0 500 1000 1500
Die
Te
mp
era
ture
(C)
34
40
46
52
58
64
70
76
Figure 5-5 Variation in CPU Die Temperature upon stressing the
server to peak CPU utilization

35
Static Pressure Variation
Duration(Seconds)0 500 1000 1500
Diffe
ren
tia
lS
tatic
Pre
ssu
re
0
-0.01
-0.02
-0.03
-0.04
-0.05
-0.06
-0.07
-0.08
-0.09
Figure 5-7 Increase in negative differential static pressure across
the simulated rack setup
Ucpu=98%
Server 10 Fan Speed VariationDuration
0 450 900 1350 1800
Fa
nS
pe
ed
2000
2400
2800
3200
3600
4000
4400
4800
5200
5600
Figure 5-6 Variation in fan speed based on fan control scheme at
peak CPU utilization for Server 10 at the bottom of the stack

36
A previous study utilizing CPU dominated air-cooled servers by colleagues
Fernandes and Eiland established the internal fan power consumption exerts greater
influence on the total server power consumption than the static power due to leakage
current at the CPU module [41]. Aisle pressurization provides an opportunity to reduce
server level power consumption by allowing the fans to operate at lower speeds and
target lower die temperatures. Important considerations to realize such energy savings
depend on the quality of aisle containment [13], possible use of air-side economization
and free cooling and the degree of disparity in IT equipment size and utilization
workloads.

37
Chapter 6
Conclusion
In this study the effects of a positive and negative static pressure differential
between the supply inlet and return exhaust of an Open Compute server operating in a
simulated rack setup in an idealized laboratory scenario is studied. A truly optimized
system will require dynamic balancing between the fan power within a server and the fan
power from blowers within the data center’s CRAC units. From the results presented
here, it is clear that room level pressure variations may significantly impact the
performance of individual servers, especially if allowed to fall below a certain pressure
threshold or to negative pressure values. Fan proximity placement within the server
chassis layout is studied. Server chassis system layout can be further optimized through
intelligent placement of internal fans to reduce fan-system effects and improve airflow
delivery performance.
The overall goal should be to minimize total system fan power. This will likely
require various pressure measurements throughout the data hall, either as static
pressure at the front of racks in the cold aisle, or ideally, as a differential pressure
measurement across a rack. The work of [42] proposed a control system utilizing
dampers within either the cold or hot aisle to physically restrict airflow and maintain static
pressure at specified levels. It is possible in some cases that a large enough static
pressure could be built up across a server rack allowing for complete removal of server
fans. All airflow through a server may be provided solely though room level airflow from
CRAC units.
Other alternatives may include additional, larger fans placed either within the cold
aisle or hot aisle. As demonstrated in [43], larger fans will typically operate more
efficiently than their smaller counterparts. Existing products are available on the market

38
that have active floor tiles which include fans coupled the perforated floor tiles of the
raised floor. Alternatively, an exhaust fan placed within the return air plenum of the hot
aisle may serve similar function.

39
References
[1] J. Glanz, “Power, Pollution and the Internet,” New York Times, 2012. [Online]. Available: http://nyti.ms/SkoL83.
[2] T. Dreibholz, M. Becke, and H. Adhari, “Report to Congress on Server and Data Center Energy Efficiency,” Public Law 109-431, vol. 109, p. 431, 2007.
[3] J. Koomey, “Growth in Data Center Electricity use 2005 to 2010,” Oakland, CA Anal. Press. August, pp. 1–24, 2011.
[4] Sintef, “Big Data, for better or worse: 90% of world’s data generated over last two years,” ScienceDaily, 2013.
[5] S. Petersen, “Enterprises Still Failing to Cut Data Center Power , Cooling Costs,” 2015. [Online]. Available: http://www.eweek.com/it-management/enterprises-still-failing-to-cut-data-center-power-cooling-costs.html. [Accessed: 20-Nov-2015].
[6] K. Dunlap and N. Rasmussen, “Choosing Between Room , Row , and Rack-based Cooling for Data Centers,” p. 18, 2012.
[7] ASHRAE Technical Committe 9.9, “IT Equipment Thermal Management and Controls,” Am. Soc. Heating, Refrig. Air-Conditioning Eng. Inc, ASHRAE TC 9.9 Whitepaper, 2012.
[8] ASHRAE Technical Committee 9.9, “Thermal Guidelines for Data Processing Environments,” Am. Soc. Heating, Refrig. Air-Conditioning Eng. Inc, pp. 1–45, 2011.
[9] R. Sharma, C. Bash, and C. Patel, “Dimensionless Parameters for Evaluation of Thermal Design and Performance of Large-scale Data Centers,” 8th AIAA/ASME Jt. Thermophys. Heat Transf. Conf., no. June, pp. 1–11, 2002.
[10] P. Kumar and Y. Joshi, “Fundamentals of Data Center Airflow Management.,” Springer, pp. 199–236, 2012.
[11] M. Bharath, S. K. Shrivastava, M. Ibrahim, S. A. Alkharabsheh, and B. G. Sammakia, “Impact of Cold Aisle Containment on Thermal Performance of Data Center,” InterPACK, pp. 1–5, 2013.
[12] S. K. Shrivastava and M. Ibrahim, “Benefit of Cold Aisle Containment during Cooling Failure,” InterPACK, pp. 1–7, 2013.
[13] S. A. Alkharabsheh, S. K. Shrivastava, and B. G. Sammakia, “Effect of Cold Aisle Containment Leakage on Flow Rates and Temperatures in a Data Center,” InterPACK, pp. 1–9, 2013.

40
[14] J. Musilli and B. Ellison, “Facilities Design for High Density Data Centers,” Intel IT White Pap., no. January, 2012.
[15] E. Frachtenberg, D. Lee, M. Magarelli, V. Mulay, and J. Park, “Thermal design in the open compute datacenter,” Intersoc. Conf. Therm. Thermomechanical Phenom. Electron. Syst. ITHERM, vol. 94025, pp. 530–538, 2012.
[16] C. Patel, C. E. Bash, R. Sharma, M. Beitelmal, and R. Friedrich, “Smart Cooling of Data Centers,” in InterPACK, 2003, no. IPACK2003–35059, pp. 1–9.
[17] T. J. Breen, E. J. Walsh, J. Punch, A. J. Shah, C. E. Bash, B. Rubenstein, S. Heath, and N. Kumari, “From Chip to Cooling Tower Data Center Modeling: Influence of Air-Stream Containment on Operating Efficiency,” J. Electron. Packag., vol. 134, p. 041006, 2012.
[18] J. W. Vangilder and S. K. Shrivastava, “Real-Time Prediction of Rack-Cooling Performance,” ASHRAE Trans., vol. 112, 2006.
[19] H. E. Khalifa, “Optimization of Enclosed Aisle Data Centers Using Bypass Recirculation,” J. Electron. Packag., vol. 134, no. June 2012, p. 020904, 2012.
[20] V. K. Arghode and Y. Joshi, “Measurement of Air Flow Rate Sensitivity to the Differential Pressure Across a Server Rack in a Data Center,” J. Electron. Packag., vol. 137, no. December, p. 041002, 2015.
[21] B. Fakhim, N. Srinarayana, M. Behnia, and S. W. Armfield, “Thermal Performance of Data Centers-Rack Level Analysis,” Components, Packag. Manuf. Technol. IEEE Trans., vol. 3, no. 5, pp. 792–799, 2013.
[22] S. W. A. and N. S. B. Fakhim, M. Behnia, “Cooling Solutions in an Operational Data Centre: A Case Study.” Applied Thermal Engineering, vol. 31, no. 14, pp. 2279-2291, 2011.
[23] E. Frachtenberg, A. Heydari, H. Li, A. Michael, J. Na, A. Nisbet, and P. Sarti, “High-efficiency server design,” 2011 Int. Conf. High Perform. Comput. Networking, Storage Anal., pp. 1–11, 2011.
[24] H. Li, E. Author, and A. Michael, “Intel Motherboard Hardware v2.0,” opencompute.org, 2011. [Online]. Available: http://www.opencompute.org/rojects/intel-motherboard/. [Accessed: 20-Nov-2015].
[25] P. Sarti and F. Frankovsky, “700W-SH/450W-SH Power Supply Hardware v1.0, http://www.opencompute.org/assets/download/Open_Compute_Project_700W_450W_Power_Supply_v1.0.pdf.,” [Online], 2012.

41
[26] P. Kumar, Y. Joshi, M. K. Patterson, R. Steinbrecher, and M. Mena, “Cold Aisle Air Distribution in a Raised Floor Data Center with Heterogenous Opposing Orientation Racks,” InterPACK, pp. 1–8, 2011.
[27] Intel, “4-Wire Pulse Width Modulation (PWM) Controlled Fans,” 2005. [Online]. Available: http://www.formfactors.org/developer%5Cspecs%5C4_Wire_PWM_Spec.pdf. [Accessed: 20-Nov-2015].
[28] AMCA 210-99 and A. 51-99, “Laboratory Methods of Testing Fans for Aerodynamic Performance Rating,” Air Mov. Control Assoc. Int. …, vol. 552, 1999.
[29] D. Carraway, “‘lookbusy - a synthetic load generator,’ [Online].” p. https://devin.com/lookbusy/, 2013.
[30] “"mpstat(1): Report processors related statistics - Linux man page.” [Online]. Available: http://linux.die.net/man/1/mpstat. [Accessed: 20-Nov-2015].
[31] “free(1): amount of free/used memory in system - Linux man page.” [Online]. Available: http://linux.die.net/man/1/free. [Accessed: 20-Nov-2015].
[32] J. Fernandes, “Minimizing Power Consumption at Module, Server And Rack-Levels Within A Data Center Through Design And Energy-Efficient Operation Of Dynamic Cooling Solutions,” University of Texas at Arlington.
[33] H. A. Alissa, K. Nemati, B. G. Sammakia, M. Seymour, K. Schneebli, and R. Schmidt, “Experimental and Numerical Characterization of a Raised Floor Data Center using Rapid operational Flow Curves Model,” InterPACK, 2015.
[34] K. Nemati, H. A. Alissa, B. T. Murray, B. G. Sammakia, and M. Seymour, “Experimentally Validated Numerical Model of a Fully-Enclosed Hybrid Cooled Server Cabinet,” InterPACK, 2015.
[35] A. Radmehr, K. C. Karki, and S. V. Patankar, “Analysis of Airflow Distribution Across a Front-to-Rear Server Rack,” in ASME InterPACK, 2007.
[36] Lawrence Berkeley National Laboratory and Resource Dynamics Corporation, Fan System: a sourcebook for industry. U.S. DOE, AMCA, 1989, p. 92.
[37] R. Jorgensen, Fan Engineering - An Engineer’s Handbook on Fans and their Applications, Ninth Edit. Howden Buffalo, INC., 1999.
[38] X. Fan, W.-D. Weber, and L. A. Barroso, “Power Provisioning for a Warehouse-sized Computer,” 34th ACM International Symposium on Computer Architecture, 2007. [Online]. Available:

42
http://research.google.com/archive/power_provisioning.pdf. [Accessed: 21-Nov-2015].
[39] R. Birke, L. Y. Chen, and E. Smirni, “Data centers in the Wild: A large scale performance study,” Proc. - 2012 IEEE 5th Int. Conf. Cloud Comput. CLOUD 2012, vol. 3820, pp. 336–343, 2012.
[40] A. J. Shah, Y. Chen, and C. E. Bash, “Sources of variability in data center lifecycle assessment,” Sustain. Syst. Technol. (ISSST), 2012 IEEE Int. Symp., pp. 1–6, 2012.
[41] J. E. Fernandes, R. Eiland, A. Siddarth, D. Agonafer, and V. Mulay, “Minimizing Server Power Consumption: Tradeoff between Cooling Power and Leakage Current,” Arlington TX, 2015.

43
Biographical Information
Ashwin Siddarth received his Bachelor’s degree in Mechanical Engineering from
Visvesvaraya Technological University, India in June 2013. He received his Master’s
degree in Mechanical Engineering from University of Texas at Arlington in December
2015. His research focused on energy efficient operation of cooling systems in data
centers. Ashwin served as a research assistant in Electronics, MEMS and
Nanoelectronics Packaging Center and worked on various industry-funded projects as a
graduate student researcher in NSF funded Industry University Cooperative Research
Center called Center of Energy-Smart Electronic Systems (ES2).
.