experimental study of renewable energy implementation in
TRANSCRIPT

Experimental Study of Renewable Energy Implementation in Cement Kilns through
Industrial-Scale Downdraft Gasification of Poultry Litter
by
Bryant Thomas Hains
A thesis submitted to the Graduate Faculty of
Auburn University
in partial fulfillment of the
requirements for the Degree of
Master of Science
Auburn, Alabama
December 12, 2011
Keywords: gasification, waste fuels, poultry litter, cement kiln
Copyright 2011 by Bryant Thomas Hains
Approved by
Sushil Bhavnani, Co-Chair, Professor of Mechanical Engineering
Thomas Burch, Co-Chair, Visiting Assistant Professor of Mechanical Engineering
Sushil Adhikari, Assistant Professor of Biosystems Engineering

ii
Abstract
Waste biomass, most notably poultry litter, is a potential source of energy that is
widely available and cheap, especially in the southeast. Using poultry litter as an energy
source provides a year-round outlet for this waste product. One major energy user that
currently utilizes alternative solid fuels is the cement industry. Poultry litter in its raw
state, however, is limited in use because of its high chlorine content and relatively large
concentration of other unwanted constituents. Downdraft biomass gasification of
pelletized poultry litter is a proposed solution to this problem as a means to produce a
clean, consistent product gas for injection into the kiln. In this study, this process has
been analyzed through experimentation on a pilot-scale 65 Nm³/hr (Normal m³/hr at 0˚C,
101.3 kPa) syngas production downdraft gasifier to determine its effectiveness and
consistency. The low ash fusion temperature and high alkali content of poultry litter
prove to be difficult obstacles to overcome as ash clinker formation is an issue.
Experiments with temperature depression via flue gas recirculation as well as
experiments employing an additive (limestone) to prevent fusion and aid in chlorine
retention in the ash have been carried out. Flue gas recirculation allowed the reduction of
the gasifier secondary air oxygen concentration by 40-45%, yielding an approximately
100˚C depression in average temperature. Results have shown that the clinkering is
temperature independent, at least within the controllable temperature range. Limestone
also has only a slight effect on the fusion when used to coat the pellets. However,
iii
limestone addition did display some promise in regards to chlorine capture, as ash
analyses showed chlorine concentrations of more than four times greater in the limestone
infused ash as compared to raw poultry litter. Experiments were also conducted to
explore the effectiveness of mixing limestone with raw poultry litter, the object being to
coat more surface area and have a more even mixture. These resulted in the most
consistent experiments with no ash clinkering.
Once consistent gasification of raw poultry litter was achieved through a combination
of woodchip dilution (60% woodchips:40% poultry litter) and addition of limestone at
5% of the wet poultry litter mass, experiments were performed to determine the capture
rates of the contaminants pertinent to cement kilns. Limestone percentage was varied to
explore its effect on chlorine retention at three different set points. It was found that
limestone percentage, at least within the tested range, had little effect on neither the
retention of contaminants nor distribution of contaminants through the gasifier system.
On average, 89% of the chlorine was retained in the gasifier char, as was 94% of both the
potassium and sodium, and 100% of the phosphorus. A contaminant concentration
profile, developed from analyses of char samples from different sections of the gasifier
system, showed that 69.1% of the chlorine retained was captured past the gasifier grate
and 52.6% was captured in the significantly cooler filter box and heat exchanger sections
of the gasifier system. Additionally, peaks in concentration of sulfur and potassium were
observed in these same sections. From these results, it was concluded that cooling and
filtering the syngas in the range of 60-110˚C obtains the maximum removal of
contaminants from the syngas stream.

iv
Acknowledgments
I would like to thank my advisory committee of Dr. Burch, Dr. Bhavnani, and Dr.
Adhikari for all their help and guidance. I would especially like to thank Dr. Burch and
Dr. Bhavnani whom I have worked closely with the last two years and have provided
much needed support and direction. I also would like to thank Christian Brodbeck and
Jonathan Griffith who were extremely helpful and instrumental in setting up and
performing the experiments in this study. Finally, I would like to thank my family whose
love and support have been irreplaceable during this time.

v
Table of Contents
Abstract ............................................................................................................................... ii
Acknowledgments.............................................................................................................. iv
List of Tables ................................................................................................................... viii
List of Figures .................................................................................................................... xi
List of Abbreviations .........................................................................................................xv
1 Introduction .......................................................................................................................1
1.1 Poultry Litter ......................................................................................................1
1.2 Cement Kiln .......................................................................................................2
1.3 Gasification ........................................................................................................3
2 Background .......................................................................................................................6
2.1 Poultry Litter Composition ................................................................................6
2.2 Undesirable Elements in Cement Kilns ...........................................................10
2.3 Chlorine and Alkali Release from Biomass under Gasification and
Combustion Conditions ...................................................................................14
2.4 Gasification of Poultry Litter ...........................................................................15
2.5 Reasons for Clinker Formation and Possible Solutions ...................................16
2.6 Limiting the Release of Chlorine and Alkalis..................................................17
3 Experimental Setup and Procedure .................................................................................19
3.1 Experimental Setup ..........................................................................................19

vi
3.1.1 Gasifier ..............................................................................................19
3.1.2 Gas Analysis .....................................................................................27
3.1.3 Feedstock/Ash Analysis ....................................................................29
3.2 Procedure .........................................................................................................30
3.2.1 Exploration of Poultry Litter Gasification Procedure .......................30
3.2.2 Quantification of Contaminant Retention Procedure ........................33
3.2.3 Data Analysis ....................................................................................37
4 Results and Discussion ...................................................................................................41
4.1 Exploration of Poultry Litter Gasification .......................................................41
4.1.1 Initial Tests and Woodchip Dilution .................................................42
4.1.2 Flue Gas Recirculation ......................................................................46
4.1.3 Limestone Additive ...........................................................................50
4.1.4 Raw Poultry Litter and Limestone Addition .....................................53
4.1.5 Summary of Results ..........................................................................55
4.2 Quantification of Contaminant Retention Study..............................................56
4.2.1 Contaminant Mass Balances .............................................................63
4.2.2 Contaminant Distribution..................................................................72
4.2.3 Conclusions, Recommendations, and Sources of Error ....................77
5 Conclusions .....................................................................................................................81
References ..........................................................................................................................83
Appendices .........................................................................................................................87
A Contaminant Mass Balance Spreadsheets ......................................................................88
B Sample Calculations .......................................................................................................95

vii
C Uncertainty Analysis ......................................................................................................97
D Additional Figures........................................................................................................103

viii
List of Tables
Table 2.1: Proximate analyses (% mass, dry basis) of five litter samples from the
literature ......................................................................................................... 6
Table 2.2: Ultimate analyses (% mass, dry basis), chlorine content, and heating value of
six litter samples from the literature .............................................................. 7
Table 2.3: Ash analyses (% mass, ignited basis) of five litter samples from the literature 7
Table 2.4: Origins of poultry litter components relevant to cement kiln implementation.
Element % are elemental, not oxide .............................................................. 9
Table 2.5: List of elements relevant to cement manufacturing that are present in poultry
litter and their effects, adapted from Bhatty, 2004 ...................................... 11
Table 2.6: Comparison of poultry litter composition (% mass, dry) to coal and coke
samples used at the Lafarge Roberta plant .................................................. 12
Table 2.7: Comparison of poultry litter composition (g/MJ, dry) to coal and coke samples
used at the Lafarge Roberta plant ................................................................ 13
Table 4.1: Poultry litter pellet proximate analysis ............................................................ 41
Table 4.2: Poultry litter pellet ultimate analysis ............................................................... 42
Table 4.3: Poultry litter pellet ash analysis ....................................................................... 42
Table 4.4: Powdered limestone analysis ........................................................................... 51
Table 4.5: Dense, gray, easily crumbled, amorphous ash analysis ................................... 52

ix
Table 4.6: Summary of primary experiments and results, avg. syngas HHV 5.4 MJ/m³
...................................................................................................................... 55
Table 4.7: Proximate analysis of charcoal, woodchips, and poultry litter (% dry basis) .. 56
Table 4.8: Ultimate analysis of charcoal, woodchips, and poultry litter (% dry basis) .... 57
Table 4.9: Ash analysis of charcoal, woodchips, and poultry litter (% ignited basis) ...... 57
Table 4.10: Retention percentage of notable elements, not accounting for conveyor losses
...................................................................................................................... 64
Table 4.11: Average retention percentage of notable elements at the three limestone set
points, not accounting for conveyor losses .................................................. 65
Table 4.12: % of total input ash content accounted for by conveyer losses and absolute %
difference between total input ash and output ash with and without conveyor
losses factored in. ......................................................................................... 65
Table 4.13: Retention percentage of notable elements, conveyor losses factored in ....... 66
Table 4.14: Average retention percentage of notable elements, conveyor losses factored
in .................................................................................................................. 66
Table 4.15: Retention percentage of notable elements, normalized to Ca ........................ 69
Table 4.16: Average retention percentage of notable elements, normalized to Ca .......... 70
Table A.1: Ash contents of the input feedstocks .............................................................. 88
Table A.2: Analyses of feedstocks used in mass balances and oxide to element % mass
conversion factor. Limestone total 100% b/c CaO and MgO are calculated
from carbonate percentages (seen in Table 4.4) .......................................... 88
Table A.3: Spreadsheet for 4.24% limestone/dry litter from 5/24/2010 ............................89
Table A.4: Spreadsheet for 6.43% limestone/dry litter from 5/17/2010 ............................90

x
Table A.5: Spreadsheet for 8.95% limestone/dry litter from 5/19/2010 ............................91
Table A.6: Spreadsheet for 4.31% limestone/dry litter from 6/3/2010 ..............................92
Table A.7: Spreadsheet for 6.69% limestone/dry litter from 5/26/2010 ............................93
Table A.8: Spreadsheet for 8.92% limestone/dry litter from 6/1/2010 ..............................94
Table C.1: Uncertainty of instruments used ......................................................................97
Table C.2: Uncertainty of biomass and char analyses, units are % mass. Oxide and Cl are
on an Ash basis ...............................................................................................98

xi
List of Figures
Figure 1.1: A typical cement production facility, rotating cylindrical kiln circled ............ 2
Figure 2.1: % Cl released by switchgrass and coal at varying pyrolysis temperatures .... 14
Figure 2.2: Alkali concentration in fluidized bed product gas before and after the gas
cooler for various fuels .................................................................................. 18
Figure 3.1: CPC mobile gasifier unit parked outside of the Alabama Capitol Building .. 20
Figure 3.2: Labview schematic of Biomax 25 Gasifier .................................................... 20
Figure 3.3: Gasifier with secondary air injection levels and grate level labeled .............. 21
Figure 3.4: Average temperature profile inside the gasifier during a standard woodchip
run .................................................................................................................. 22
Figure 3.5: Average temperature of the syngas at different locations in the system starting
at gasifier exit, proceeding through the heat exchanger (HEX), and finally
after the filter ................................................................................................. 23
Figure 3.6: Gasifier opened at seam 10cm above the grate .............................................. 24
Figure 3.7: Chamber below grate, slanted entrance to tube leading to heat exchanger at
right. Larger, heavier ash particles settle here ............................................... 25
Figure 3.8: Access port at heat exchanger entrance, Shop-Vac in use ............................. 25
Figure 3.9: Heat exchanger exit, tubes visible inside at left. Pipe bend and flexible hose
leading to filter box at right. .......................................................................... 26

xii
Figure 3.10: Filter box with doors open. Bags are inverted inside barrels by syngas flow
....................................................................................................................... 27
Figure 3.11: Gas analysis flow diagram ........................................................................... 27
Figure 3.12: Gas analyzer train used during experiments. HiTech K1550 top right,
California Analytical ZRE bottom, California Analytical Pump Pack II
middle ............................................................................................................ 28
Figure 3.13: DewPro MMR101 used in contaminant quantification experiments,
measures % volume moisture ........................................................................ 29
Figure 3.14: a) Poultry litter pellet detail b) Raw poultry litter .................................... 31
Figure 3.15: Propane water heater used for flue gas generation ....................................... 32
Figure 4.1: Poultry litter clinker from initial trial, ~18 cm wide ...................................... 43
Figure 4.2: Poultry litter pellet clinkers from 40% pellet run ........................................... 45
Figure 4.3: View from top of gasifier of poultry litter pellet clinkers hung up between
levels 3 and 4 after loose biomass char had been removed. Level 5 is
obscured by clinkers ...................................................................................... 46
Figure 4.4: Average gasifier temperature profile during a typical run with pine chips .... 47
Figure 4.5: Impression of nozzle in poultry pellet clinker ................................................ 48
Figure 4.6: Average gasifier temperature profile during flue gas recirculation poultry
litter ............................................................................................................... 49
Figure 4.7: Easily crumbled, grey amorphous ash from raw poultry litter with limestone
....................................................................................................................... 55
Figure 4.8: „Woodchip Char‟ sample, collected from the top of the gasifier ................... 59

xiii
Figure 4.9: Ash mound as seen when gasifier is opened at crack above grate. Poultry litter
ash is the light gray section in the middle of the mound ............................... 60
Figure 4.10: Crumbled poultry litter ash as sent for analysis in one experiment for each
limestone set point (3.71, 5.71, and 7.71 % Lime/Wet PL), labeled „PL Ash‟
....................................................................................................................... 60
Figure 4.11: „Rest of Gasifier‟ sample, comprised mostly of charcoal and wood char .... 61
Figure 4.12: Char collected from chamber below gasifier grate, labeled „Below Grate‟ . 61
Figure 4.13: Char from inside and just after the heat exchanger, labeled „HEX‟ ............. 62
Figure 4.14: Char collected from filter box, labeled „Filter‟ ........................................... 62
Figure 4.15: Chlorine Retention vs. Limestone Percentage ............................................. 67
Figure 4.16: Alkali Retention vs. Limestone Percentage ................................................. 67
Figure 4.17: Phosphorus and Calcium Retention vs. Limestone Percentage ................... 68
Figure 4.18: Chlorine Retention vs. Limestone Percentage, Normalized to Calcium ...... 70
Figure 4.19: Potassium, Sodium, and Phosphorus Retention vs. Limestone Percentage . 71
Figure 4.20: Mass percent of oxides in char ash throughout the gasifier, at 3.71%
limestone/wet litter ........................................................................................ 73
Figure 4.21: Mass percent of oxides in char ash throughout the gasifier, at 5.71%
limestone/wet litter ........................................................................................ 73
Figure 4.22: Mass percent of oxides in char ash throughout the gasifier, at 7.71%
limestone/wet litter ........................................................................................ 74
Figure 4.23: Percentage of total mass collected of each element at different locations in
the gasifier, at 3.71% limestone/wet litter ..................................................... 75

xiv
Figure 4.24: Percentage of total mass collected of each element at different locations in
the gasifier, at 5.71% limestone/wet litter ..................................................... 75
Figure 4.25: Percentage of total mass collected of each element at different locations in
the gasifier, at 7.71% limestone/wet litter ..................................................... 76
Figure 4.26: Ash mound found when gasifier is opened at seam above the grate, white
deposits circled .............................................................................................. 79
Figure D.1: Dry syngas composition vs. Time for a standard woodchip run, fluctuations
in composition are typical, with an average HHV ~5400 kJ/m³ ................. 103
Figure D.2: Dry syngas composition vs. time during flue gas recirculation experiment
(Section 4.1.2) ............................................................................................. 104
Figure D.3: Dry syngas composition vs. time during raw litter, 5% limestone, and 60:40
(woodchip:litter) experiment (Section 4.1.4) .............................................. 105
Figure D.4: Dry syngas composition vs. time during 8.95% Limestone/Dry Litter
experiment. Very typical of all experiments in contaminant retention study
(Section 4.2) ................................................................................................ 106

xv
List of Abbreviations
Acronyms
CPC Community Power Corporation
HEX Heat Exchanger
HHV Higher Heating Value
LHV Lower Heating Value
LOI Loss on Ignition, % mass
MW Molecular Weight, g/mole
PL Poultry Litter
WAL Wyoming Analytical Labs
Symbols
Atomic Weight, g/mole
Uncertainty of i, same units as i
ΔH Change in Enthalpy, kJ/mole
n Number of moles
Nm³/hr Normal cubic meters per hour, at 0˚C and 101.3 kPa (1 atm)
P Pressure, Pa
Universal Gas Constant,
T Temperature, K
V Volume, m³

1
Chapter 1
Introduction
1.1 Poultry Litter
Poultry litter is a waste product of the poultry industry that comes from floor-
raised birds (primarily broilers) and consists of their manure, bedding material (usually
wood shavings), waste feed, and feathers. According to the USDA, over 8 billion broilers
(47.7 billion pounds) were produced in the US in 2009, and approximately half of all
broiler production was from Alabama, Georgia, Arkansas, and Mississippi alone (1).
Using an estimate of .52 lb litter/lb bird recommended by Alabama Cooperative
Extension System, that translates to 12.4 million tons of litter produced annually (2). The
most common use for this litter is as a soil amendment in farming (3). However, due to
high transportation costs most of the litter is applied only to neighboring farmlands
leading to nutrient buildup and runoff, most notably of phosphorus, causing excess algae
growth, disruption of local ecosystems, and drinking water pollution (3-5). Because of
these harmful effects garnered over time, there is much interest in finding other outlets
for this waste product.

2
1.2 Cement Kiln
One proposed alternative use for poultry litter is as a fuel. It has an average higher
heating value (HHV) of ~14 MJ/dry kg which is comparable to ~20 MJ/dry kg for wood
and about half that of coal (3). A current major waste and alternative solid fuel consumer
and potential venue for poultry litter utilization is the cement production industry.
Portland cement is manufactured by heating limestone, primarily calcium carbonate
(CaCO₃), to temperatures up to 1450˚C to form calcium oxide (CaO) as well as calcium
silicates and aluminates in a process called calcination (6). These temperatures are
achieved by burning large amounts of primarily non-renewable fossil fuels such coal,
petroleum coke, gas, or oil in a massive rotating kiln (Figure 1.1).
Figure 1.1: A typical cement production facility, rotating cylindrical kiln circled (7)
It is in the cement producer‟s interest both economically and environmentally to
supplement some energy needs with alternative, renewable fuels. Types of alternative
fuels vary depending on availability relative to plant location, but some examples
include: waste oils, landfill gas, bark, paper, tires, and plastics (8). A good alternative fuel

3
will have sustained availability and be economically beneficial to the cement producer,
and in areas such as the southeast and where plants are in close proximity to poultry
farms, poultry litter fulfills those requirements well. While these fuel selection
requirements are not very discriminating, some further process-specific limitations do
exist. The alternative fuel introduced must not adversely affect the kiln functionality or
the quality of the cement product, and while the robust nature of the process makes this a
generally undemanding requirement, negative effects can be garnered from excess heavy
metal, alkali, sulfur, or chlorine content. Chlorides, sulfides, and alkalis become
circulating elements in the kiln, volatilizing in hotter portions while condensing in cooler
portions, leading to the formation of kiln ring build-ups and subsequent, costly shut-
downs (8) (7). Every cement manufacturing facility has its own unique standards to
determine the quantity of these deleterious components that is permissible, but the high
level of alkalis and chlorine found in poultry litter either prevents or severely limits its
substitution rate almost universally. Therefore, in order to gain the distinct economic and
environmental advantages presented by poultry litter use, an intermediate step of biomass
gasification is presented as a means to extract the chemical energy for use in the cement
kiln while limiting the throughput of undesirable elements.
1.3 Gasification
Thermochemical gasification via partial oxidation is a relatively old technology; it
has been in existence for over 150 years (9). The overall goal is to convert the solid
biomass energy into a gaseous form with minimal loss, usually 10-30%, in order to gain
the many advantages which gas possesses over solid fuel (10). A possible secondary goal

4
is to remove unwanted components from the fuel source, such as sulfur, as in coal
gasification (9). This is the feature of interest relevant to the implementation of poultry
litter energy in the cement kiln. There are many types of gasifiers, each typified by the
oxidizer employed; the orientation and flow of products relative to inputs; or the use of
fluidized beds versus static, packed fuel beds (9). A commercially available, relatively
simple, low-tar production option is a downdraft gasifier. This vertically-oriented setup
draws both the oxidizer (air in this case) and the feedstock in through the open top. The
consumption of the biomass then occurs along the throat of the gasifier, proceeding to the
grate at the bottom where the hot synthesis gas (syngas) exits, ready for use. The
gasification process can be broken down into several stages as it progresses from the
entry to the exit of the gasifier: thermal decomposition, or pyrolysis, in which the
volatiles are driven off producing pyrolysis vapors and tars; char oxidation, in which char
remnants from the pyrolysis zone react with remaining oxygen and other gases and are
gasified in both endothermic and exothermic reactions; and char reduction, in which
remaining carbon content is consumed through primarily endothermic reactions (11) (12).
While the exact chemistry of this process is highly complex, there are several principal
reactions vital to the formation of the syngas products that are well agreed upon and used
commonly when mathematically modeling biomass gasification (11) (13-15):

5
Heterogeneous Reactions (Solid and gas reactants)
C + ½O₂ CO ΔH = -110.6 kJ/mol
C + O₂ CO₂ ΔH = -393.8 kJ/mol
C + CO₂ 2CO ΔH = +172.6 kJ/mol
C + H₂O CO + H₂ ΔH = +131.4 kJ/mol
C + 2H₂ CH₄ ΔH = -74.9 kJ/mol
Homogeneous Reactions (Gas reactants)
CO + H₂O CO₂ + H₂ ΔH = -41.2 kJ/mol
CH₄ + H₂O CO + 3H₂ ΔH = +201.9 kJ/mol
The gas produced with the downdraft, air-oxidation gasifier is „low joule‟ or „low
energy‟ gas, relative to other methods of gasification or pure pyrolysis, and is best
employed in a „closely coupled‟ arrangement for immediate use to preserve efficiency (9)
(10). This arrangement would be ideally suited in preparing potentially harmful fuels,
specifically poultry litter, for use in a cement kiln and, therefore, is the focus of the
current study.

6
Chapter 2
Background
2.1 Poultry Litter Composition
Poultry litter is a non-homogeneous mixture of bedding, feathers, excrement, and
feed. Because of this, no two samples are exactly alike and, thus, a model or standard
definition doesn‟t exist. Proximate and ultimate analyses, on a dry basis, from different
farms are usually relatively similar, but can have as much as a 20-30 average percent
difference between parameters (16-18). A comparison of several proximate analyses and
ultimate analyses of different litter samples from the literature is presented in Tables 2.1
and 2.2.
Table 2.1: Proximate analyses (% mass, dry basis) of five litter samples from the
literature
Li et
al.
(17)
Schaffer
(19)
Reardon et al.
(raw litter
sample) (16)
Reardon et al.
(pelletized
sample) (16)
Primenergy
(18) Average
Ash 27.96 32.65 21.9 26.5 20.61 25.9 Volatile
Matter 65.16 53.96 62.7 59.8 45.64 57.5
Fixed
Carbon 6.88 13.39 15.4 13.7 33.75 16.6
Total 100.0
0 100.00 100.0 100.0 100.00
100.0

7
Table 2.2: Ultimate analyses (% mass, dry basis), chlorine content, and heating value of
six litter samples from the literature
Li et al.
(17) Schaffer
(19)
Reardon et
al.
(raw litter
sample)
(16)
Reardon et
al.
(pelletized
sample)
(16)
Primenergy
(18) Bock
(5) Average
Carbon 28.2 35.03 36.6 33.7 40.89 37.8 35.4
Hydrogen 5.0 4.50 4.9 4.5 4.86 5.1 4.8
Oxygen 35.0 21.51 32.0 29.3 28.66 31.1 29.6
Nitrogen 3.4 4.06 3.9 5.0 4.30 3.8 4.1
Sulfur 0.9 1.14 0.78 0.95 0.68 0.4 0.8
Ash 27.7 32.65 21.9 26.5 20.61 21.8 25.2
Total 100.2 98.89 100.08 99.95 100 100 99.9
Chlorine 1.16 1.11 Not
reported Not reported 0.051 1.0 0.8
MJ/kg 13.31
(LHV)
Not
reported
14.82
(LHV)
13.62
(LHV)
15.99
(HHV)
14.87
(HHV) 15.43
(HHV)
It can be seen from the tables that while the samples do compare relatively well to
the calculated average, the differences between individual samples may be significant.
Differences become even more apparent when comparing the ash analyses of poultry
litter samples. There can exist as much as a 40-50 average percent difference between the
oxide concentrations of two separate samples. Table 2.3 shows the comparison between
five ash component analyses found in the literature and the average of these values.
Table 2.3: Ash analyses (% mass, ignited basis) of five litter samples from the literature
Oxide Li et al.
(17) Schaffer
(19) Primenergy
(18) Bock (5)
Codling
(20) Average
Al₂O₃ 4.9 3.45 0.84 1.9 1.73 2.6 CaO 13.5 15.00 23.60 17.3 17.63 17.4
Fe₂O₃ 2.1 1.14 0.85 1.2 1.03 1.3 K₂O 12.2 8.68 20.51 16.3 6.06 12.7 MgO 4.6 3.62 7.76 5.0 3.96 5.0 Na₂O 5.8 4.58 7.04 9.2 N/A 6.7 P₂O₅ 15.3 10.90 24.62 24.4 17.39 18.5 SO₃ 5.8 7.11 6.60 6.7 N/A 6.6 SiO₂ 35.6 38.40 7.46 8.1 N/A 22.4 TiO₂ 0.2 N/A 0.07 0.2 N/A 0.2 Total 100.0 92.88 99.35 90.3 47.79 93.4

8
While the exact concentration of each element (presented here as their oxide) can
be very different for each sample, the species with the highest concentrations tend to be
CaO, K₂O, P₂O₅, and SiO₂. The relatively high concentrations of K and P, along with
nitrogen, are what make poultry litter an attractive soil amendment. However, the high
ratio of P to N and the high water-solubility of the phosphorus-containing compounds is
what causes the phosphorus concentrations to build up in the soil over time and run off
into watersheds and water supplies (5) (20).
The high variance in poultry litter composition, specifically of the ash
components, is due to many variables involved in how the birds are raised and the
individual farm‟s practices. Commercial poultry houses have dirt floors, so some
components of litter come from varying amounts of dirt mixed in by humans when
cleaning the pens or by the birds themselves (21). This inconsistency between farms most
likely accounts for the high variability in silica (SiO₂) content found in the literature.
Wood shavings are typically used as bedding in the pens and make up a substantial
portion of the litter, and therefore the type of wood used has an effect on the poultry litter
composition. The diet of the birds, in the form of unconsumed feed or through their
excrement, contributes to the composition as well. A listing of ash components, other
elements of interest, and their origins is displayed in Table 2.4. The table was compiled
after consulting Carla Price, a nutritionist for Sanderson Farms, but can also apply to
other production facilities as well. The broilers‟ primary diet consists of corn, soy and
water and is supplemented with meat meal (ground up chicken parts).

9
Table 2.4: Origins of poultry litter components relevant to cement kiln implementation.
Element % are elemental, not oxide (21) (22)
Element Possible Origin
Al
In soil
In alum (Aluminum Sulfate), used to
keep ammonia levels of litter down
Generally ~0.1-0.7% of wood ash
Ca
In feed for bone strength
40g per bird over lifetime, large
amount retained
Generally the largest ash component in
wood (~20-35%)
K
High concentration (2-3%) in soy fed
to birds
Generally second largest ash
component in wood (~5-15%)
Mg
Fed as a trace mineral
Also in meat meal
Generally the third largest ash
component in wood (~3-9%)
Na
In feed
10g per bird over lifetime, some
retained
Trace element in wood
P In feed for bone strength
Generally ~1% of wood ash
S Not in the diet
Generally ~1% of wood ash
Si In dirt, sand and water
In wood ash
Cl Fed as trace mineral
In water, extra added to poultry farm
supply if experiencing health issues

10
2.2 Undesirable Elements in Cement Kilns
The exact alternative fuel standards and composition limits for a given kiln vary
depending on the cement plant and are usually trade secrets. However, a few examples
have been published and general guidelines are known about which elements in excess
are harmful to cement product or the kiln itself. For example, the alternative solid fuels
used by the Lafarge Cement Polska group in Poland must meet the following
requirements (7):
Heating value > 14.0 MJ/kg (weekly average)
Chlorine content < 0.2%
Sulfur content < 2.5%
Using these values as a general guideline, it can be seen that poultry litter barely satisfies
the energy requirement, easily satisfies the sulfur requirement, and fails the requirement
for chlorine with an average from the literature of about 1%. Although not included in
this list, much attention is also paid to the alkalis in the fuel which become circulating
elements in the kiln, alongside sulfur and chlorine. A list of elements found in poultry
litter and their effects on the cement manufacturing process can be seen in Table 2.5. It is
evident that the elements whose throughput it is most important to reduce are Cl, K, Na,
and S.
11
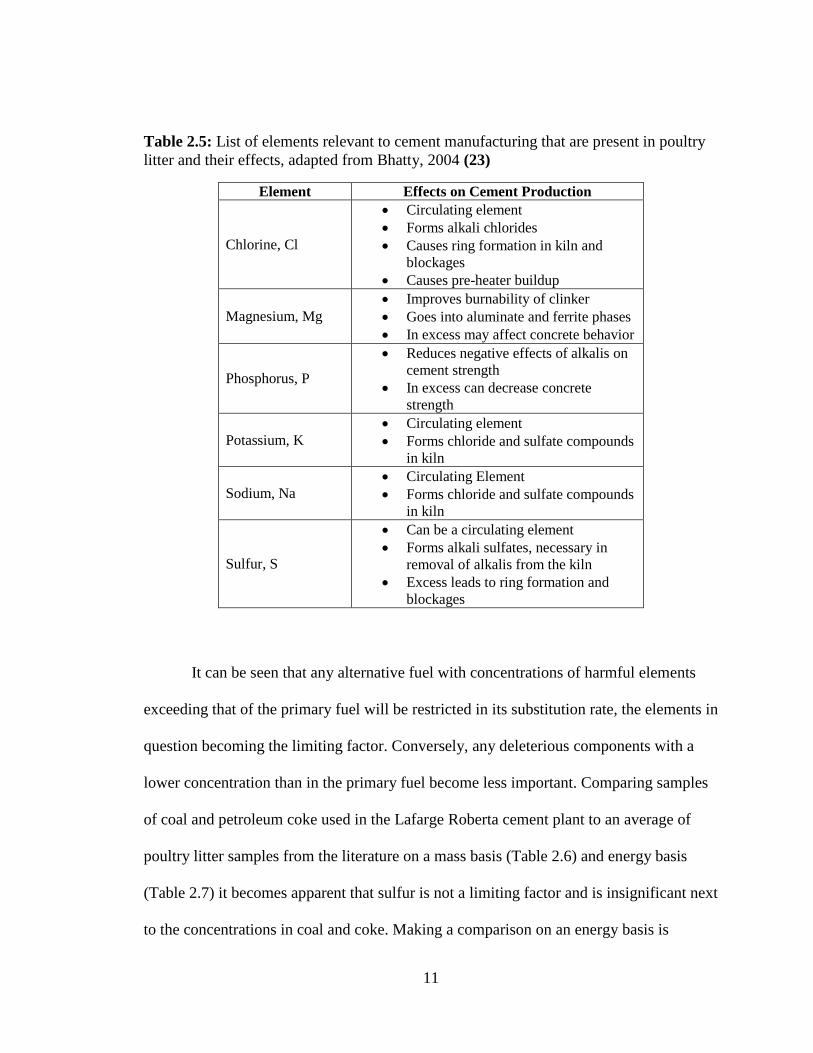
Table 2.5: List of elements relevant to cement manufacturing that are present in poultry
litter and their effects, adapted from Bhatty, 2004 (23)
Element Effects on Cement Production
Chlorine, Cl
Circulating element
Forms alkali chlorides
Causes ring formation in kiln and
blockages
Causes pre-heater buildup
Magnesium, Mg
Improves burnability of clinker
Goes into aluminate and ferrite phases
In excess may affect concrete behavior
Phosphorus, P
Reduces negative effects of alkalis on
cement strength
In excess can decrease concrete
strength
Potassium, K
Circulating element
Forms chloride and sulfate compounds
in kiln
Sodium, Na
Circulating Element
Forms chloride and sulfate compounds
in kiln
Sulfur, S
Can be a circulating element
Forms alkali sulfates, necessary in
removal of alkalis from the kiln
Excess leads to ring formation and
blockages
It can be seen that any alternative fuel with concentrations of harmful elements
exceeding that of the primary fuel will be restricted in its substitution rate, the elements in
question becoming the limiting factor. Conversely, any deleterious components with a
lower concentration than in the primary fuel become less important. Comparing samples
of coal and petroleum coke used in the Lafarge Roberta cement plant to an average of
poultry litter samples from the literature on a mass basis (Table 2.6) and energy basis
(Table 2.7) it becomes apparent that sulfur is not a limiting factor and is insignificant next
to the concentrations in coal and coke. Making a comparison on an energy basis is

12
pertinent because substitution rates are based on energy content, not mass (7). It was
reported by Folta (7) that over a series of five burns, the energy supplied by coal was
between 35-60% of the total, coke was 20-37%, and a combination of tires, plastics and
alternative fuel was 18-30% of the total kiln energy consumption.
Table 2.6: Comparison of poultry litter composition (% mass, dry) to coal and coke
samples used at the Lafarge Roberta plant (7)
Average Litter
Composition
from Tables
1,2 & 3
Coal Coke
Proximate Analysis, % mass, dry
Ash 25.9 24.9 8.81
volatile matter 57.5 25.4 12.9
Fixed Carbon 16.6 49.7 78.3
Total 100.0 100.0 100.0
Ultimate and Elemental Analysis, % mass, dry
Carbon 35.4 64.50 78.7
Hydrogen 4.8 3.24 2.7
Oxygen 29.6 2.84 1.81
Nitrogen 4.1 1.02 1.23
Sulfur 0.8 3.47 6.74
Chlorine 0.8 0.059 0.013
Al 0.36 2.98 0.53
Ca 3.22 1.98 1.67
Fe 0.24 1.74 0.42
K 2.73 0.60 0.13
Mg 0.78 0.18 0.07
Na 1.29 0.05 0.02
P 2.09 0.02 0.00
(SO₃ in ash) S 0.68 0.03 0.74
Si 2.71 5.89 1.13
Ti 0.03 0.16 0.03
MJ/kg 15.43 (HHV) 26.45 (HHV) 32.25 (HHV)

13
Table 2.7: Comparison of poultry litter composition (g/MJ, dry) to coal and coke
samples used at the Lafarge Roberta plant (7)
Average Litter
Composition
from Tables
1,2 & 3
Coal Coke
Proximate Analysis, g/MJ dry
Ash 16.79 9.41 2.73
volatile matter 37.27 9.60 4.00
Fixed Carbon 10.76 18.79 24.28
Total 64.81 37.81 31.01
Ultimate and Elemental Analysis, g/MJ dry
Carbon 22.94 24.39 24.40
Hydrogen 3.11 1.22 0.84
Oxygen 19.18 1.07 0.56
Nitrogen 2.66 0.39 0.38
Sulfur 0.52 1.31 2.09
Chlorine 0.52 0.022 0.004
Al 0.23 1.13 0.16
Ca 2.09 0.75 0.52
Fe 0.15 0.66 0.13
K 1.77 0.23 0.04
Mg 0.51 0.07 0.02
Na 0.83 0.02 0.01
P 1.36 0.01 0.00
(SO₃ in ash) S 0.44 0.01 0.23
Si 1.76 2.23 0.35
Ti 0.02 0.06 0.01
Having compared the composition of poultry litter to the standard fuels, observed an
example of limits, and examined the effects of certain elements on cement kilns, it
becomes evident that the most important components to limit introduction into the kiln
are Chlorine, Sodium, and Potassium. This study will focus on these elements, but
attention will be paid to other components previously mentioned as potentially harmful.
14
2.3 Chlorine and Alkali Release from Biomass under Gasification and
Combustion Conditions
There is little documentation as to the study and quantification of the capture rates
of the unwanted constituents of interest to the cement manufacturing process by means of
downdraft gasification, especially with regards to poultry litter. However, some work has
been done in examining chlorine and alkali release from other types of biomass under
similar pyrolytic and gasification conditions. It has been found that in gasification of
biomass HCl and KCl are the dominating chlorine-containing species released in the gas
and are formed during the pyrolysis and char oxidation phases. Chlorine exists in several
forms in biomass but it is believed that a significant portion is present as the salt KCl
which is assumed to begin volatilization above its melting point of approximately 750˚C
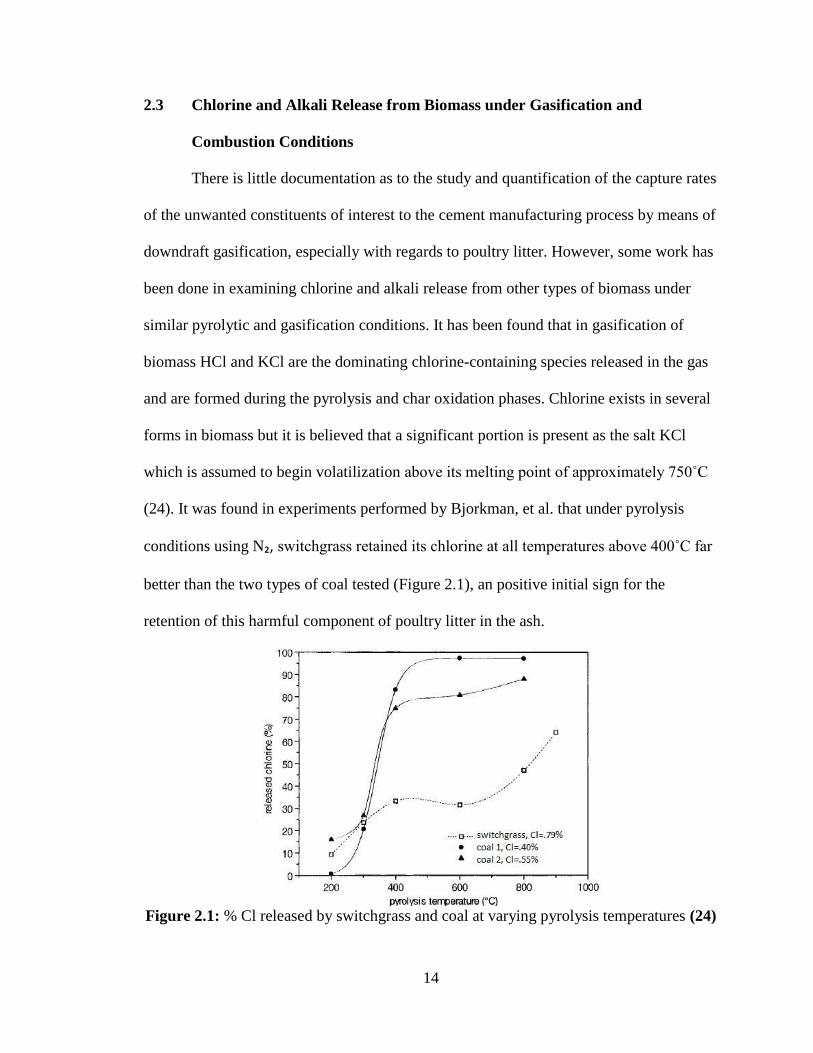
(24). It was found in experiments performed by Bjorkman, et al. that under pyrolysis
conditions using N₂, switchgrass retained its chlorine at all temperatures above 400˚C far
better than the two types of coal tested (Figure 2.1), an positive initial sign for the
retention of this harmful component of poultry litter in the ash.
Figure 2.1: % Cl released by switchgrass and coal at varying pyrolysis temperatures (24)

15
It was also found that using CO₂ in place of N₂, the same experiments yielded higher
chlorine release at temperatures above 800˚C (24). Additionally, chlorine presence in
biomass is known to facilitate the volatility and mobility of many inorganic elements,
specifically alkali metals. Chlorine, in fact, has as much effect on the amount of alkali
vaporized during combustion as does the alkali concentration (25). It has been found that
in combustion of switchgrass, the dominant alkali containing gas species is KCl, followed
by either KOH or NaCl at 1100˚C or 800˚C, respectively (26).
In experiments employing an ashing furnace, it was found by Misra, et al. (22)
that varying temperatures from 600-1300˚C when combusting wood sees a loss of K and
S with increase in temperature but a retention of Na, Mg, P, Mn, Al, Fe, and Ca. K
concentration drops off significantly above 800-900˚C, while S decreases, although less
severely, above 1000-1100˚C. All results were normalized with respect to Ca which was
assumed to be constant. A similar experiment was performed by Adams (4) with poultry
litter, the temperature varying from 450-1000˚C. Sulfur was not analyzed and different
results were found. K, Na, Mg, Al, Fe, and Mn all decreased with increasing temperature,
K the most severe. However, P and Ca were still retained.
2.4 Gasification of Poultry Litter
In the literature, gasification trials using poultry litter have been run in both
bench-scale and pilot-scale arrangements with varying degrees of success. In all cases
slagging or clinkering (fusion) of the poultry litter during gasification was an issue that
had to be addressed (16) (19) (13). It was found by Community Power Corporation
(CPC) that using pelletized litter with reduced moisture and limiting the superficial

16
velocity (volume flow rate of gas produced/gasifier cross-sectional area, measured in
m/s) of the gasifier provided the best results in a bench-scale downdraft gasifier. This is
said to control the temperature at the pyrolysis front, and without these measures, clinker
formation was an issue. A pilot scale trial using 12.5% moisture pellets was run for 5
hours, producing 45 Nm³/hr (Normal m³/hr at 0˚C, 101.3 kPa) of syngas with a lower
heating value of 4.79 MJ/Nm³. However, no mention was made of the state of the gasifier
char remaining upon completion of the run, as to whether fusion occurred or not (16). In
another study, using a fixed-bed, counter-current updraft gasifier, in which the fuel entry
and syngas exit is at the top and oxidizer entry is at the bottom, it was found that
gasifying pure poultry litter resulted in a large agglomeration forming inside the gasifier.
However, mixing the poultry litter with a fuel less prone to slagging, cow manure, in a
50:50 weight ratio char fusion was negligible (13).
2.5 Reasons for Clinker Formation and Possible Solutions
The clinkering problems encountered when gasifying poultry litter are attributed
the interaction between the alkali metals, chlorine, and silica present in the fuel (24) (25).
The root of the problem is thought to be caused by either one or both of two reactions.
The first is the formation of alkali silicates from a reaction of alkali metals and silica.
Alkali silicates can soften or melt at temperatures as low as 700˚C depending on the
composition, and most poultry litter is high in both alkalis (K and Na) and silica (SiO₂).
The second is the formation of alkali sulfates from alkali and sulfur (25). As mentioned
previously, chlorine aids immensely in the volatilization and transport of alkalis,
particularly potassium, conveying them to surfaces where ash deposition occurs (25).

17
Potential solutions to this problem are co-gasification with other fuels, temperature
reduction, and, as suggested by several sources, addition of up to 5% limestone or
dolomite (5) (16) (27).
2.6 Limiting the Release of Chlorine and Alkalis
The addition of limestone in a combustion or gasifier environment can promote
the capture and sequestration of volatilized chlorine. This aids in both the minimization
of ash clinkering as well as potentially limiting the throughput of chlorine in the product
gas with consideration to cement kiln usage. It has been proposed that gaseous chlorine is
removed through the following path during combustion:
CaO(s) + 2HCl(g) CaCl₂(s) + H₂O(g)
It has been suggested through thermodynamic modeling that this equation is favored
more at lower temperatures (550-700˚C) and when high HCl and low H₂O are present in
the flue gas (27). The use of limestone also would be convenient if needed at a cement
production facility, as this is one of the primary raw materials employed in cement
manufacture.
In the endeavor to mitigate alkali release, it has been shown that simply cooling
and filtering the product gas at 400-500˚C (cooler than the melting point of the alkali-
containing salts) can have a dramatic effect on the gas alkali concentration (28). This
effect can be seen in Figure 2.2 where the alkali concentration (Na + K) in the product
gas from a fluidized bed gasifier is plotted relative to temperature for many different solid
fuels. The points on the right side of the graph are samples taken before the gas cooler
and those on the left from after the gas cooler.

18
Figure 2.2: Alkali concentration in fluidized bed product gas before and after the gas
cooler for various fuels (28)
In this study, various experiments were performed initially utilizing methods
drawn from the literature as well as methods devised based on known fuel characteristics
in an attempt to inhibit the fusion of the poultry litter during gasification in order to
consistently gasify it (Sections 3.2.1 and 4.1). Specifically, trials were run experimenting
with dilution of the fuel using non-sintering material, attempting to lower the average
gasifier temperature using flue gas recirculation, and utilizing limestone as an anti-fusion
and potential chlorine-capturing additive. This was done with the end goal of quantifying
the alkali, chlorine and other potentially interesting elements released in the gasification
of poultry litter, and as such, attention was paid to these properties along the way.
The next set of experiments in this study were performed to actually quantify the
contaminant retention and sequestration garnered by the use of a gasifier while extracting
the chemical energy from poultry litter.

19
Chapter 3
Experimental Setup and Procedure
3.1 Experimental Setup
3.1.1 Gasifier
This study was conducted using a Community Power Corporation (CPC) Biomax 25
downdraft, co-current gasifier (Figure 3.1). This unit is fully automated utilizing a
Labview interface and designed to gasify 22kg/hr (~50lbs/hr) of dry biomass and produce
65 Nm³/hr (~2300 std ft³/hr) of syngas with a nominal energy content of 4.8 MJ/Nm³
(~130 Btu/Std ft³). The produced gas is pulled through a shell and tube, air-cooled heat
exchanger and dry bag filter and can either be flared or used to run an internal
combustion engine to generate up to 25kW of electricity. The heat removed from the
syngas by the heat exchanger is used either to dry the feedstock in the storage bins or to
heat the control room. A screenshot of the Labview gasifier schematic can be seen in
Figure 3.2.

20
Figure 3.1: CPC mobile gasifier unit parked outside of the Alabama Capitol Building
Figure 3.2: Labview schematic of Biomax 25 Gasifier
The gasifier is an open top design, which is where both the primary air and biomass
enter. The inside dimensions of the gasifier throat are 130 cm height and 35 cm diameter.
The biomass level inside the gasifier is constantly maintained using distance sensors
which activate the onboard feed system. Secondary air is injected through five levels of

21
nozzles spaced equally along the height of the gasifier and controlled by proportional
valves in order to control the gasifier temperature and syngas composition. The gasifier
temperature is monitored using k-type thermocouples (±2.2˚C) at each of the 5 levels, at
the grate, and at two locations above the nozzles (Figure 3.3).
Figure 3.3: Gasifier with secondary air injection levels and grate level labeled
Pressure drop is also measured across the gasifier and across the grate using onboard
digital manometers and the oscillation of the grate is varied according to the degree of
pressure drop. Syngas flow rate is measured via the onboard venturimeter and corrected
to 0˚C, 101.3 kPa (1 atm). All pressures, temperatures, and gas flow rates are recorded by
the onboard computer every 10 seconds.
Because the gasifier is fully automated, operating parameters such as temperature
are controlled to stay within a desired range. Variations in secondary air amount, grate
shaker speed/interval, heat exchanger blower speed, and other controls are made by the
onboard computer to keep the gasifier as close to steady-state as possible during

22
operation. An average temperature profile in the gasifier from a standard woodchip-fed
run can be seen in Figure 3.4. The temperature profile through the rest of the gasifier
during the same run can be seen in Figure 3.5.
Figure 3.4: Average temperature profile inside the gasifier during a standard woodchip
run

23
Figure 3.5: Average temperature of the syngas at different locations in the system
starting at gasifier exit, proceeding through the heat exchanger (HEX), and finally after
the filter
Additionally, syngas composition, and consequently the syngas higher heating value
(HHV), are intended to stay within a desired range during steady-state operation. A
typical run employing pine chips sees an average dry syngas composition (by volume)
and volumetric HHV of approximately:
O₂ [%]
CO
[%] CO₂ [%]
CH₄ [%]
H₂ [%]
HHV
[MJ/m³]
0.5 20 12 1.5 18 5.4
*Syngas over duration of a typical run can be seen in Appendix D, Figure D.1
The O₂ concentration in the syngas is a result of tiny air leaks in the system and is higher
if the gasifier differential pressure is elevated. The moisture percentage in the syngas
varies with the feedstock moisture and is typically in the range of 5-10% (by volume).
~790˚C
~610˚C
~110˚C~60˚C
0.0
100.0
200.0
300.0
400.0
500.0
600.0
700.0
800.0
900.0
Gasifier Grate HEX In HEX Out Filter Out
Tem
per
atu
re (
˚C)
Thermocouple Location

24
Ash sampled at the end of experiments was collected at several locations in an
attempt to capture all of it. Before all experiments, ash was purged from every location
using the same methods. Charred woodchips were removed from the top of the gasifier
using a Shop-Vac down to around level 4 (see Figure 3.3). Ash remaining in the gasifier
was collected by removing bolts and opening the gasifier at a sealed seam 10 cm (4
inches) above the grate (Figure 3.6).
Figure 3.6: Gasifier opened at seam 10cm above the grate
Below the gasifier grate is a round chamber (Figure 3.7) where the heavier ash tends to
settle as opposed to becoming entrained and continuing through the pipe (slanted inlet,
right side of Figure 3.7) towards the heat exchanger.

25
Figure 3.7: Chamber below grate, slanted entrance to tube leading to heat exchanger at
right. Larger, heavier ash particles settle here
Some ash settles in the bend just before the heat exchanger. This is accessed through a
port at the heat exchanger entrance (Figure 3.8).
Figure 3.8: Access port at heat exchanger entrance, Shop-Vac in use
More ash settles in the heat exchanger itself and in the pipe leading from heat exchanger
to filter box. This is accessed by removing the pipe bend from the end of the heat
26
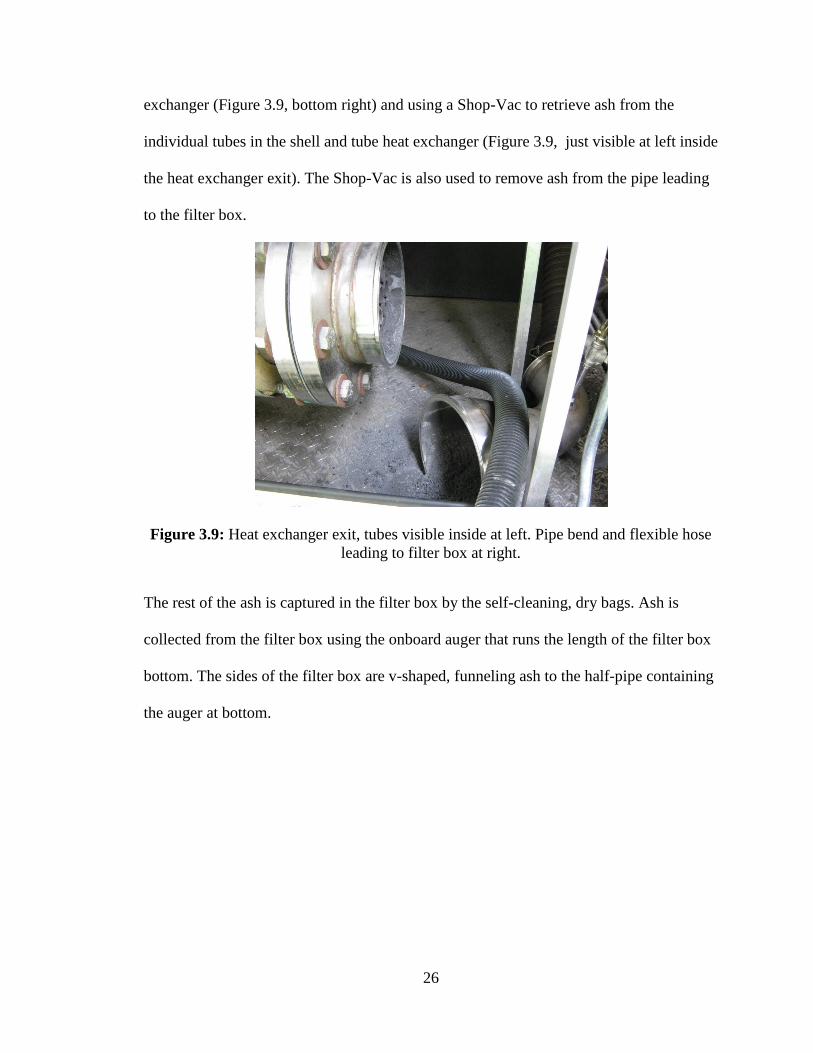
exchanger (Figure 3.9, bottom right) and using a Shop-Vac to retrieve ash from the
individual tubes in the shell and tube heat exchanger (Figure 3.9, just visible at left inside
the heat exchanger exit). The Shop-Vac is also used to remove ash from the pipe leading
to the filter box.
Figure 3.9: Heat exchanger exit, tubes visible inside at left. Pipe bend and flexible hose
leading to filter box at right.
The rest of the ash is captured in the filter box by the self-cleaning, dry bags. Ash is
collected from the filter box using the onboard auger that runs the length of the filter box
bottom. The sides of the filter box are v-shaped, funneling ash to the half-pipe containing
the auger at bottom.

27
Figure 3.10: Filter box with doors open. Bags are inverted inside barrels by syngas flow
3.1.2 Gas Analysis
During all experiments the syngas was continuously side-stream sampled and
analyzed through a valve located after the heat exchanger and filter box, so the gas was
cooled to approximately 60˚C and relatively clean. The sample flow is as shown in
Figure 3.11.
Figure 3.11: Gas analysis flow diagram
The two gas analyzers used were a California Analytical Instruments model ZRE and
a HiTech Instruments K1550. The ZRE measured CO (±0.6%), CO₂ (±0.6%), and CH₄
(±0.3%) using Non-Dispersive Infrared (NDIR) method and O₂ (±0.5%) by means of a
Desiccant Filter
Particulate Filter
CAI Pump Pak II
CAI ZRE Analyzer
(O₂, CO, CO₂, CH₄)
HiTech K1550 Analyzer (H₂)

28
fuel cell (Figure 3.12, bottom). The K1550 measured H₂ (±2%) using thermal
conductivity (Figure 3.12, top right). Gas composition data was recorded every 15
seconds using an Omega OMB-DAQ-56 connected to the analog 4-20mA outputs of the
instruments.
Figure 3.12: Gas analyzer train used during experiments. HiTech K1550 top right,
California Analytical ZRE bottom, California Analytical Pump Pack II middle
A dew point meter was used in the quantification of contaminant retention
experiments (Sections 3.2.2 and 4.2). The meter was a GE DewPro MMR101 (Figure
3.12) that measured percent volume H₂O and was linked to the Omega-DAQ-56 through
a 4-20mA loop. The probe was mounted directly in the syngas stream, just before the gas
analyzer sampling port.

29
Figure 3.13: DewPro MMR101 used in contaminant quantification experiments,
measures % volume moisture
The ZRE and K1550 analyzers were calibrated less than 1 week before each experiment
using both zero and span gases. The DewPro analyzer was received factory-calibrated
and requires re-calibration every two years, and thus was not re-calibrated during the
study.
3.1.2 Feedstock/Ash Analysis
All biomass and ash analyses were performed by Wyoming Analytical
Laboratories (WAL) in accordance with the corresponding ASTM standard except
moisture analyses and woodchip char ash analyses performed during the quantification of
contaminant retention experiments (Sections 3.2.2 and 4.2). For the analyses that were
performed in-house during these experiments, moisture was analyzed according to
ASTM Method E 871. Ash was analyzed according to ASTM Method D 1102, with the
maximum temperature being 750˚C, as used and suggested by WAL.
30
3.2 Procedure
3.2.1 Exploration of Poultry Litter Gasification Procedure
The first set of experiments was performed with the goal of consistently gasifying
poultry litter. The literature showed this to be either difficult or was ambiguous as to
whether poultry litter gasification could actually be sustained. In this study, various
experiments were performed utilizing methods drawn from the literature as well as
methods devised based on known fuel characteristics in an attempt to inhibit the fusion of
the poultry litter during gasification. Specifically, trials were run experimenting with
dilution of the fuel using non-sintering material, attempting to lower the average gasifier
temperature using flue gas recirculation, and utilizing limestone as an anti-fusion and
potential chlorine-capturing additive.
Poultry litter pellets were used for all tests initially (Figure 3.14a). The size and
shape of the pellets, coupled with their ease of handling and relative homogeneity, made
them a better candidate than raw poultry litter for the type of gasifier and feed system
being used. Pellets used were manufactured by Organic Growing Systems, Monticello,
MS.

31
Figure 3.14: a) Poultry litter pellet detail b) Raw poultry litter
Later experiments employed the use of raw poultry litter, acquired from the
Auburn University Poultry Science Department Research Farm (Figure 3.14b). In cases
where poultry litter was diluted with pine woodchips or mixed with limestone, relatively
consistent homogeneity in the mixed feedstock was achieved by employing the use of a
portable, clean cement mixer.
For all experiments, the gasifier was started using a combination of natural
charcoal and pine chips and allowed to come to steady-state operation, taking
approximately one half hour, before the feedstock of interest was fed. All feedstocks
tested were run for at least three hours so the effects of the fuel being tested would be
amplified relative to the woodchips and charcoal used for startup.
In an attempt to lower and control the average gasifier temperature, trials were run
using flue gas as a diluent, supplementing the secondary air. Early gasification trials with
poultry litter pellets displayed a tendency to hang up on, and adhere to, the secondary air
injection nozzles (can be seen in Figure 4.3). In the oxygen deficient environment of the
gasifier, the highest reaction rates, and thus the highest temperatures, would be where

32
oxygen is most available. Limiting the local “hot-spots” generated at the secondary air
injection sites was seen as a potential solution. The experimental setup consisted of
generating and cooling flue gas using an Eccotemp L10 propane water heater and feeding
it into the secondary air blower inlet (Figure 3.15). The amount of flue gas generated was
controllable by the propane valve and the O₂ and CO₂ content of the secondary air
mixture could be measured with a second gas analyzer sampling after the blower. This
analyzer was manufactured by NOVA Analytical Systems.
Figure 3.15: Propane water heater used for flue gas generation
33
3.2.2 Quantification of Contaminant Retention Procedure
These later experiments were executed after consistent gasification of poultry
litter was achieved. They were performed with the goal of quantifying the retention of the
deleterious components pertinent to the cement kiln in the ash. It was found in the first
set of experiments (Section 3.2.1 and 4.1), that in order to gasify the litter consistently,
raw poultry litter had to be mixed with approximately 5% powdered limestone (by mass,
relative to wet poultry litter, or ~6.5% relative to dry litter) and diluted with pine chips to
about 40%. In the Quantification of Contaminant Retention experiments, the limestone
ratio functioned as the independent variable and two runs each were performed using
3.71, 5.71, and 7.71 percent lime relative to wet poultry litter mass. These slightly higher
percentages were selected to account for the lower moisture content of the poultry litter
used in these runs versus that used in the Exploration of Poultry Litter Gasification
experiments (sections 3.2.1 and 4.1.4), as well as to allow for rounded-off, easy to work
with weights of feedstocks (can be seen in Tables A.3-8). Also, to account for the lower
moisture content, all runs were performed with the raw litter diluted by pine chips to a
35:65 ratio (litter:woodchips) instead of the 40:60 ratio used previously. As in section
4.1.4, 200 lbs (90.72 kg) of woodchips were fed into the gasifier following the poultry
litter/limestone/woodchip mixture to ensure complete gasification of the fuel of interest.
Despite this excess biomass, poultry litter would still be dominant source of the chlorine
and alkali components in the resulting gasifier char due to the low ash content of the
woodchips. All char produced was collected, sampled, and sent for analysis after every
experiment. These analyses were then compared in a mass balance to the composition of
the incoming feedstocks to determine the retention rate of contaminants pertinent to

34
cement kilns. Additionally, char from three of the experiments was sampled and analyzed
by location from the heat exchanger, filter box, and below the gasifier grate in order to
examine the effects of temperature variation on char composition.
Preliminary preparation consisted of acquiring a large amount of raw poultry litter
from the Auburn Poultry Science Research Farm from the same pile and mixing well for
batch homogeneity. This batch would be used for all runs. A consistent, homogeneous
batch of pine woodchips was also delivered and used for all runs. Powdered limestone
and natural charcoal were purchased by the bag and are assumed to be consistent in
composition from bag to bag. Poultry litter, woodchip, and charcoal samples were taken
and sent to Wyoming Analytical to have proximate, ultimate, chlorine, Btu, and ash
analyses performed. A sample of limestone was sent to WAL to have an ash analysis
performed.
The following setup was consistent between experiments, the only variable being
limestone percentage:
Prior to each experiment, the gasifier system was purged using a Shop-Vac and
the onboard auger, as shown in Section 3.1.1.
The feedstock mixture was prepared using a cement mixer, weights measured
with an electronic scale. First all the litter and lime were mixed separately, then
added to the woodchips in the following amounts:
o 130 lbs (58.97 kg) pine woodchips
o 70 lbs (31.75 kg) raw poultry litter
o 2.6/4/5.4 lbs (1.17/1.81/2.45 kg) powdered limestone

35
200 lbs (90.72 kg) of woodchips were weighed, to be fed after the poultry litter
mixture in order for the litter to fully gasify
The gasifier was filled to level 1 with charcoal from a bag, the weight taken
before and after, and the difference recorded as the charcoal weight
The gasifier was filled the rest of the way with woodchips, the weight recorded
o Woodchips were kept at ready to be fed as the gasifier warmed up until the
poultry litter mixture was fed
Representative samples were collected and analyzed for moisture content,
according to ASTM E 871:
o Charcoal
o Warm-up Woodchips
o Poultry Litter
o Woodchips mixed with poultry litter/Woodchips fed after poultry litter
mix (same batch used for both)
The following procedure was consistent between experiments:
The gasifier was started, buckets of woodchips weighed, recorded, and added to
maintain proper level in the gasifier until temperatures reached steady state
When the gasifier operation reached steady state (about one half hour after
starting), the poultry litter/limestone/woodchip mixture was started feeding
(automatically, by the feed system)
o The time was recorded when the first bit of the mixture dropped into the
gasifier

36
o The time was recorded when the last bit of the mixture dropped into the
gasifier
After the last of the mixture was fed, the 200 lbs of woodchips were started
feeding using the automatic feed system
o The woodchips and poultry litter chunks that (together with associated
limestone percentage) that were sorted by the sorting screen were
separated and weighed to be subtracted from the input amount
After the last of the 200 lbs of woodchips were fed, the flame front was allowed
to advance to the top, charring all the raw chips and consuming any remaining
moisture. As soon as this occurred, the gasifier was turned off, sealed and allowed
to cool overnight.
o Woodchips that were sorted by the sorting screen were weighed and
recorded to be subtracted from the 200 lb total
The following data collection methods were consistent between experiments:
Syngas was side stream sampled, dried, analyzed, and recorded continuously from
the first steady-state before litter/limestone/woodchip addition until end of run
for: O₂, CO, CO₂, CH₄, and H₂
Moisture of syngas was probe monitored and recorded continuously
Gasifier performance data was recorded by the onboard computer continuously
At least 24 hours after every experiment (to allow cool-down), ash was collected
from the various collection points (Section 3.1.1), weighed, and sampled.
o The char from the 200 lbs of woodchips was collected from the top of the
gasifier, down to level 5, and labeled „Woodchip Char‟

37
o The rest of the gasifier char was collected (Figure 3.6), sample labeled
„Rest of Gasifier‟. The gray, amorphous poultry litter/limestone ash was
separated by hand for the first three runs, sample labeled „PL Ash‟
o The char below the gasifier grate was collected (Figure 3.7) and combined
with the char collected from just before the heat exchanger entrance
(Figure 3.8), sample labeled „Below Grate‟
o The char was collected from inside and at the exit of the heat exchanger
using a Shop-Vac (Figure 3.9), labeled „HEX‟
o The char was collected from the filter box using the onboard auger,
labeled „Filter‟
Two experiments were run for each limestone percentage (3.71, 5.71, and 7.71 %
limestone). In one experiment for each set point, representative ash and char samples
were taken from each of the above locations for comparison of variation in ash
composition through the gasifier. In the other three experiments, „Rest of Gasifier‟ and
„PL Ash‟ were combined and analyzed as one sample labeled „Gasifier‟. Also, „Filter‟,
„HEX‟ and „Below Grate‟ were combined and analyzed as one sample labeled „After
Grate‟. For all experiments, a sample from the „Woodchip Char‟ was analyzed for Loss
on Ignition (LOI), as dictated in Section 3.1.2.
3.2.3 Data Analysis
The data collected for each experiment was analyzed using various methods in
order to understand and interpret the results. Syngas volume percentage was used to

38
calculate syngas HHV and biomass and ash analyses were used to perform mass
balances. In performing these analyses, several assumptions were made:
Only species present in syngas are O₂, CO, CO₂, CH₄, H₂, N₂, and H₂O
All gases behave as ideal
All biomass and limestone is homogeneous in composition, on a dry basis
CO₂ in limestone is fully consumed during gasification
Limestone and poultry litter, after being mixed, travel together in the same
wet weight ratio as they were combined for each experiment (This
assumption is used to factor in sorted litter and residual litter in the storage
bins)
The ash content of the „Woodchip Char‟ has the same composition as the
ash content of the raw woodchips
When calculating composite syngas HHV, the HHV per unit mass (kJ/kg) of each of the
combustible components (CO, CH₄, and H₂) were referenced from Turns, 2000 and
Glassman, 2008 (29) (30). To get the volumetric heating value of each gas, the HHV‟s of
each gas were converted to a molar basis and then multiplied by the molar density of an
ideal gas at 0˚C, 1 atm (the standard to which the gasifier flow is corrected to).
P = 101,325 Pa
= 8.3145
T = 273.15 K

39
The composite HHV at 0˚C, 1 atm is then just the molar fraction (or volume fraction as
dictated by the gas analyzers) of each gas multiplied by its corresponding volumetric
HHV and summed up.
₄ ₄
₂ ₂
To find the element mass percentage (% E) from the corresponding oxide mass
percentage (% ), the oxide mass percent was multiplied by the ratio of element‟s
weight in one molecule of the oxide to the molecular weight of the oxide.
=Atomic Weight of Element
=Atomic Weight of Oxygen (15.999)

40
In the Exploration of Poultry Litter Gasification Section (Section 4.1),
experiments were performed examining methods to achieve consistent gasification of
poultry litter. Replications of experiments were performed only if results from initial
experiments were deemed promising. With this in mind, early experiments only were
performed once or twice, but later experiments saw more iterations as results were
approaching the performance and consistency desired. In the Quantification of
Contaminant Retention Study (Section 4.2) 6 total experiments were performed, two at
each limestone set point. This allowed averages to be calculated and trends observed both
overall and at each variable each set point.

41
Chapter 4
Results and Discussion
4.1 Exploration of Poultry Litter Gasification
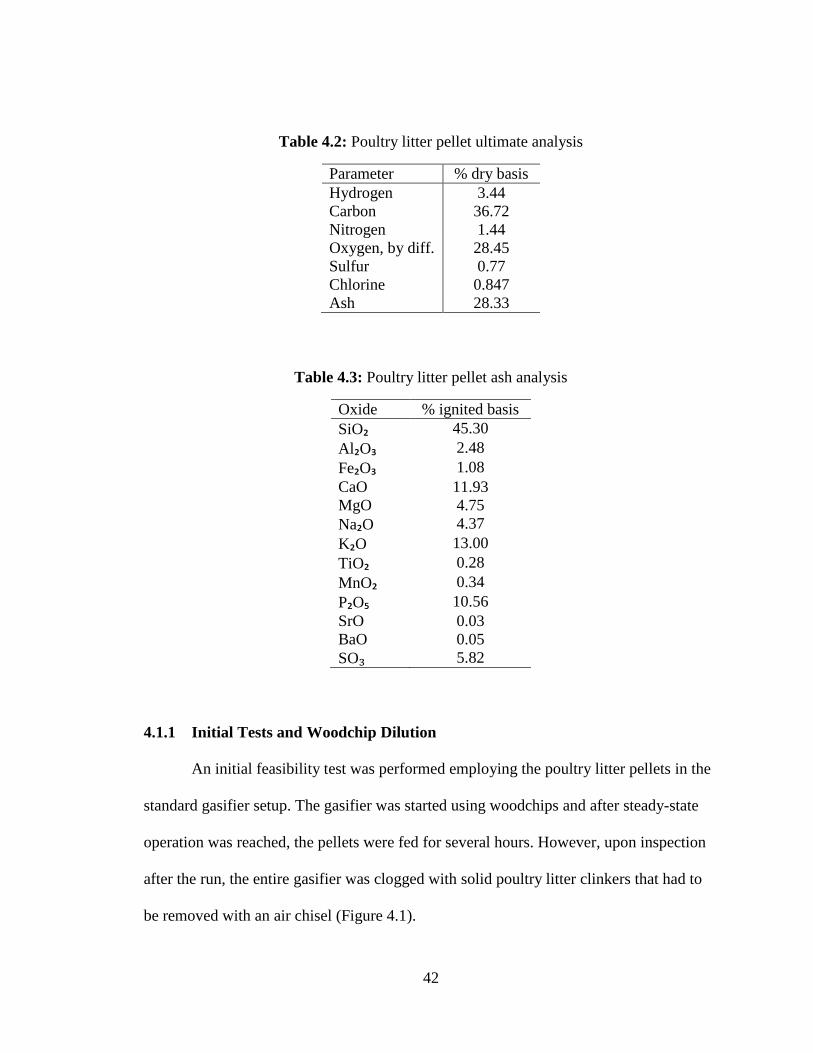
The proximate, ultimate, and ash analyses of the poultry litter pellets used in the
experiments are shown in Tables 4.1-4.3. This composition is typical for poultry litter.
The silica percentage in the ash is relatively high, but this varies from farm to farm
depending on the amount of dirt that gets mixed with the litter in the pens. Na₂O is
slightly lower than the average expected quantity as well, usually in 5-9% range.
Additionally, ash fusion analyses showed initial deformation occurring at 1120˚C in a
reducing atmosphere and 1149˚C in an oxidizing environment.
Table 4.1: Poultry litter pellet proximate analysis
Parameter % as
received
% dry
basis
Moisture 11.32 -
Ash 25.12 28.33
Volatile matter 52.54 59.25
Fixed carbon, by
dif. 11.02 12.42
HHV [MJ/kg] 12.40 13.98
42
Table 4.2: Poultry litter pellet ultimate analysis
Parameter % dry basis
Hydrogen 3.44
Carbon 36.72
Nitrogen 1.44
Oxygen, by diff. 28.45
Sulfur 0.77
Chlorine 0.847
Ash 28.33
Table 4.3: Poultry litter pellet ash analysis
Oxide % ignited basis
SiO₂ 45.30
Al₂O₃ 2.48
Fe₂O₃ 1.08
CaO 11.93
MgO 4.75
Na₂O 4.37
K₂O 13.00
TiO₂ 0.28
MnO₂ 0.34
P₂O₅ 10.56
SrO 0.03
BaO 0.05
SO₃ 5.82
4.1.1 Initial Tests and Woodchip Dilution
An initial feasibility test was performed employing the poultry litter pellets in the
standard gasifier setup. The gasifier was started using woodchips and after steady-state
operation was reached, the pellets were fed for several hours. However, upon inspection
after the run, the entire gasifier was clogged with solid poultry litter clinkers that had to
be removed with an air chisel (Figure 4.1).

43
Figure 4.1: Poultry litter clinker from initial trial, ~18 cm wide
This result was in agreement with most of the literature and showed the need for
additional measures to be taken when attempting to gasify poultry litter consistently.
Accordingly, the next runs were performed using a mixture of poultry litter pellets diluted
with woodchips (the typical feedstock used in this gasifier), and with an eye to reducing
the temperature of the gasifier through limited superficial velocity and reduced secondary
air flow.
The first of these runs was a test to explore exactly what level of control over the
gasifier temperature existed. The fusion of the pellets was most likely due to their low ash
fusion temperature, a contribution of the alkali metals, chlorine, and silica present in
poultry litter. Lowering the temperatures in the gasifier, especially the peak temperatures,
was thought to alleviate at least some of the clinkering. Several trials were conducted
running only woodchips and attempting to stabilize reduced temperatures.
The initial attempt consisted of simply reducing the set point temperatures in each
stage of air injection for the gasifier. Although the peak temperature was reduced with
this technique, the operation was not stable and the flame front rose to the top of the
downdraft gasifier. This occurred because as air injection is reduced at each level (to
reduce the temperature in that level), additional air was added at the uncontrolled gasifier

44
inlet (top) to provide the total flow rate of air required for the syngas production rate
specified (65m3/hr).
In subsequent trials, to reduce the gasifier superficial velocity, the lower set point
temperatures were used in conjunction with lower syngas flow rates until the syngas flow
rate was reduced to 40m3/hr (the minimum allowed by the gasifier). The net reduction in
average reaction temperature was less than 50˚C using this technique.
The next runs were conducted to determine if the clinkering tendency of poultry
litter could be mitigated by diluting the poultry litter pellets with wood chips. Trials with
20 percent and 40 percent poultry litter (by weight) in wood chips were conducted.
Initially the trial with 20 percent poultry litter appeared to be successful and produced no
external operating anomalies such as increased pressure drop across the gasifier.
Consequently, without purging the existing material, a trial using 40 percent poultry litter
was conducted. During each of these trials a suitable quality syngas was produced for the
duration. However, as the 40% trial progressed, the operating temperature profile and the
gasifier pressure drop became unstable and the trial was aborted. The gasifier was then
cleaned and the ash was found to contain significant quantities of clinkered poultry litter
pellets (Figure 4.2).

45
Figure 4.2: Poultry litter pellet clinkers from 40% pellet run
Subsequent trials and analyses showed that clinkering was actually occurring with the 20
percent trial but the low concentration of poultry litter pellets and the long residence time
in the gasifier caused the problem to not be evident during the roughly 4 hour initial trial.
Additional tests were performed attempting to limit the gasifier temperature while
feeding poultry litter by adjusting set-points, depressing overall gas flow rate, using wet
woodchips to depress the flame front, and combinations of each. None of these options
yielded either stable operation or a reduction of the pellet clinkering.
However, a pattern was observed in the clinker formation and location throughout
the runs. Clinkers tend to be on the order of 6-8 cm in diameter, or roughly the size of a
baseball. The pellet agglomerations tended to be found hung-up between levels 3-4 or 4-5
(Figure 4.3). This trend appeared to be independent of trial length or dilution percentage.

46
Figure 4.3: View from top of gasifier of poultry litter pellet clinkers hung up between
levels 3 and 4 after loose biomass char had been removed. Level 5 is obscured by
clinkers
4.1.2 Flue Gas Recirculation
According to the ash fusion analysis conducted by Wyoming Analytical
Laboratories, initial deformation was found to be occurring at1120˚C in a reducing
environment and 1149˚C in an oxidizing environment. Both of these temperatures,
however, are greater than any observed in the gasifier under normal operating conditions.
A plot of the average temperature profile inside the gasifier over a typical 4 hour run can
be seen in Figure 4.4. Levels 1-5 correspond to thermocouples located at the 5 levels of
secondary air injection.

47
Figure 4.4: Average gasifier temperature profile during a typical run with pine chips
While this represents the average over time, it should be noted that peak temperatures
observed during standard operation seldom eclipse 950˚C and never exceed 1100˚C
unless the flame front escapes the gasifier top and is recorded by the top-most
thermocouple.
Given these observations, it was perplexing as to why pellet adhesion was
occurring with such severity at these low temperatures despite the efforts put forth to
abate them. However, when examining the clinkers formed during some of the
experiments, it was discovered that several had distinct impressions corresponding to the
shape of the secondary air injection nozzles (Figure 4.5).

48
Figure 4.5: Impression of nozzle in poultry pellet clinker
This gave rise to the theory that local „hot spots‟ exceeding the ash fusion temperature
were to blame for the clinker formation. In the reducing environment of the gasifier, the
highest temperatures would be where oxygen is most available and actual combustion
could occur locally. Limiting this oxygen supply through the use of a diluent, the most
practical option being flue gas, was a prospective solution. In addition to diluting the
throughput of oxygen to the gasifier char, the primary species present in flue gas (CO₂
and H₂O) could potentially participate in two of the dominant endothermic reactions to
actually lower the temperature locally (11) (13):
C + CO₂ 2CO + 14.42 MJ/ kg of carbon gasified
C + H₂O CO + H₂ +10.92 MJ /kg of carbon gasified
To easily produce, control, and cool a flue gas stream, a propane water heater was
used, as detailed in the Experimental Setup section. The lowest average gasifier operating
temperature profile obtained is shown in Figure 4.6, for comparison to the standard
profile from Figure 4.4.

49
Figure 4.6: Average gasifier temperature profile during flue gas recirculation poultry
litter
The overall average temperature of the gasifier achieved using this method was 662˚C,
102˚ cooler than the 764˚C average of the typical run. This was obtained by reducing the
syngas production rate to 55Nm³/hr (from the standard 65) to limit the superficial
velocity through the gasifier and by diluting the secondary air by an average of 42.5%.
That is, the average O₂ reading of the secondary air was 12%, 42.5% less than the 20.9%
concentration of the measured ambient air. This test was conducted using a 40% mixture
of poultry litter pellets to pine chips by weight for a duration of 3 hours and 20 minutes.
A negative effect manifested in the use of flue gas injection was a reduction in
syngas quality. During a standard run with the gasifier using pine chips, the average dry
syngas composition (by volume) that can be expected and corresponding higher heating
value is approximately:
O₂ [%]
CO
[%] CO₂ [%]
CH₄ [%]
H₂ [%]
HHV
[MJ/m³]
0.5 20 12 1.5 18 5.4
*Syngas over duration of a typical run can be seen in Appendix D, Figure D.1

50
A composition along these lines was observed when gasifying the 40% poultry litter
pellet mixture under normal operation in a previous experiment that resulted in clinker
formation. However, use of the flue gas recirculation technique resulted in an inferior
average syngas composition and consequently an approximately 25% reduction in higher
heating value:
O₂ [%]
CO
[%] CO₂ [%]
CH₄ [%]
H₂ [%]
HHV
[MJ/m³]
1.3 13.1 14.3 1.1 15.2 4.0
*Syngas performance over duration of run can be seen in Appendix D, Figure D.2
Despite the successful overall reduction in temperature, examination after the experiment
showed that clinkering of the poultry litter pellets was neither eliminated nor significantly
reduced. Clinkers were still recovered that had impressions of the nozzles, similar to
Figure 4.5.
From the experiments run and observations made, it can be seen that the fusion
experienced by the poultry litter pellets in the gasifier is temperature independent, at least
within the controllable range.
4.1.3 Limestone Additive
The next option, as described in the literature, was the use of limestone additive to
prevent fusion of gasified litter (5) (16) (27). A further benefit of the addition of
limestone to the gasifier environment was the potential for the capture and retention in
the ash of volatilized chlorine.
Powdered limestone was used for the experiments and the analysis is shown in
Table 4.4.

51
Table 4.4: Powdered limestone analysis
Oxide % dry basis
SiO₂ 1.60
Al₂O₃ 0.51
Fe₂O₃ 0.59
CaCO₃ 81.86
MgCO₃ 15.01
Na₂O 0.01
K₂O 0.17
TiO₂ 0.05
MnO₂ 0.06
P₂O₅ 0.05
SrO 0.07
BaO 0.01
SO₃ 0.16
The analysis shows that the limestone used was of good quality, being high in calcium
carbonate and low in silica and other constituents. As recommended in the literature, 5%
by weight (limestone/litter) powdered limestone was used to evenly coat the poultry litter
pellets in a cement mixer. This mixture was then diluted to 40% by weight with pine
chips to prevent extreme blockage if the experiment was unsuccessful. Ninety kg of this
mixture was fed for four hours with very little departure in gasifier performance or
syngas composition from a standard woodchip feedstock run. Upon examination of the
char, it was discovered that although clinkers had been formed, most were smaller in size
than usual (4-5 cm diameter) and two larger ones (12-14 cm) had proceeded beyond the
lowest level of nozzles, where few usually advance.
A second, identical experiment was run and after 90 kg of the mixture was
gasified, pine chips were fed for an additional four hours in an attempt to flush the

52
poultry litter mixture through the gasifier. A significant amount of poultry litter pellets
did feed past the last air injection nozzles, but they were found in the form of a large
agglomeration containing both woodchip and pellet remains. However, the furthest
advancing, pellet-containing part of this agglomeration appeared to blend seamlessly into
a layer of easily crumbled, dense, gray, amorphous ash approximately 4 cm above the
grate. This suggested that the pellets, having been fully depleted of their carbon content,
no longer possessed the extreme traits of fusion displayed when found higher in the
gasifier. A sample of this ash was analyzed and was found to contain oxides associated
with both the limestone and poultry litter ash as well as a chlorine concentration of 3.57%
(Table 4.5).
Table 4.5: Dense, gray, easily crumbled, amorphous ash analysis
Oxide % dry basis
SiO₂ 24.50
Al₂O₃ 1.30
Fe₂O₃ 1.25
CaO 37.78
MgO 2.49
Na₂O 0.89
K₂O 15.18
TiO₂ 0.16
MnO₂ 1.34
P₂O₅ 1.99
SrO 0.17
BaO 0.30
SO₃ 4.09
Loss on
ignition 8.55
Chlorine 3.57
The chlorine concentration found (3.57%) is more than four times that of the raw
poultry litter pellets (0.847 %) and indicates the successful capture of a measurably

53
significant portion. This was a promising result with regards to the end goal of limiting
chlorine volatilization and entrainment in the product gas. The clinkering issue, however,
demanded further attention if poultry litter was to be gasified consistently, leading to the
set of experiments described next.
4.1.4 Raw Poultry Litter and Limestone Addition
A trial of raw, un-pelletized, woodchip-diluted poultry litter was seen as an
alternative to the dense, seemingly non-porous litter pellets. This mixture would offer a
more even distribution of the litter as well as allow easier carbon conversion. Results
from previous runs using poultry litter pellets indicated that long residence times were
necessary if total carbon conversion was to be achieved. This is due most likely to the
low porosity of the highly compacted pellets limiting the gas diffusion and isolating
reactions to the surface of the pellets. Additionally, trials could be run using the limestone
additive mixed more evenly with the problem feedstock, as opposed to only coating the
surface of pellets. Dilution of the raw litter with woodchips would be necessary for
implementation in the downdraft gasifier and feed system due to the high percentage of
fines.
Ninety kg of the 20% raw litter mixture fed for three hours for a total mass flow
rate of 30 kg/hr. Over 90 kg of woodchips were fed for four hours following the poultry
litter mixture to assure advancement of the mixture to the grate and allow for accurate
assessment of performance following the trial.
The trial performed well and a syngas similar to pure woodchips was produced
for the duration of the run. Only two small clinkers resulted from this experiment, and

54
both were found past the last level of nozzles inside the gasifier, indicating clean passage
through the area where pelletized litter had been hung up.
A second experiment of 40% litter was run to determine the upper limit of raw
poultry litter substitution. This was found to be too much for the gasifier, producing a
large agglomeration between levels four and five.
To test the effect of limestone addition, 5% lime (to raw litter weight) was evenly
mixed with the raw litter before being diluted to 40% with woodchips. Since 40% un-
amended litter appeared to exceed the upper limit, this concentration would be a good
benchmark for comparison. The mixture was found to gasify much better than either the
litter without lime or the pelletized litter mixed with lime. No clinker formation was
found to occur, only the existence of an amorphous, grey, crumbly ash (Figure 4.7). This
ash was easily broken up by hand and was likely to continue through the gasifier without
much issue.
During the experiment a large pressure drop across the gasifier built up, but was
alleviated by the continuing oscillation of the grate shaker. Even if this pressure drop
proves to be persistent, operation was reliable and steady enough to conduct further tests
in quantifying deleterious species capture rates.
An identical experiment was performed to test how consistent this method was
and very similar results were found. The syngas composition and resulting HHV were
slightly compromised by air leaks resulting from the elevated gasifier differential
pressure (seen in Appendix D, Figure D.3), but gasifier performance was satisfactory for
beginning the Quantification of Contaminant Retention Study.

55
Figure 4.7: Easily crumbled, grey amorphous ash from raw poultry litter with limestone
4.1.5 Summary of Results
A summary of the primary techniques explored in the study is presented in Table 6.
Table 4.6: Summary of primary experiments and results, avg. syngas HHV 5.4 MJ/m³
Technique used Gasifier char state Syngas
Quality Notes
20% pellets,
80%woodchips
6-8cm clinkers,
nozzle impressions Average
40% pellets,
60%woodchips
6-8cm clinkers,
nozzle impressions Average
Flue gas recirculation,
40% pellets
6-8cm clinkers,
nozzle impressions
Below
average,
4.0 MJ/m³
~100˚C
reduction in
avg. temp.
Limestone addition,
40% pellets
4-5cm clinkers,
agglomeration past
nozzles
Average
20% raw litter, 80%
woodchips
Minimal clinker
formation and only
past the nozzles
Average
40% raw litter, 60%
woodchips Large agglomeration Average
Limestone addition,
40% raw litter
No clinkers:
amorphous, grey,
crumbly ash
Below
average,
~4.0 MJ/m³
Reduction in
syngas quality
due to increased
gasifier pressure
and resulting air
leak

56
4.2 Quantification of Contaminant Retention Study
The goal in these experiments was to quantify the percentage of contaminants
retained in the ash when gasifying poultry litter. The proximate, ultimate, and ash
analyses of the charcoal, woodchips, and raw poultry litter used in these tests are
presented in Tables 4.7-4.9. The limestone used was the same as that in Sections 4.1.3-
4.1.4 and can be seen in Table 4.4. The raw poultry litter has a lower ash content and a
higher HHV than the pelletized litter used previously, making it a better fuel candidate
from the beginning. When compared to the average from the literature (Section 2.1), the
ash is still low, but HHV is average. The sulfur and chlorine content are lower than
average as well. The silica content is lower than the poultry litter pellets, potentially
aiding in its resistance to clinkering (as discussed in Section 2.5).
Table 4.7: Proximate analysis of charcoal, woodchips, and poultry litter (% dry basis)
Parameter Charcoal Woodchips Poultry Litter
Ash 5.64 0.28 19.63
Volatile matter 16.81 81.71 63.99
Fixed carbon, by dif. 77.55 18.01 16.38
HHV [MJ/kg] 30.17 19.40 15.48

57
Table 4.8: Ultimate analysis of charcoal, woodchips, and poultry litter (% dry basis)
Parameter Charcoal Woodchips Poultry Litter
Hydrogen 1.88 5.03 3.87
Carbon 80.44 49.33 36.69
Nitrogen 0.52 0.53 0.77
Oxygen, by dif. 11.49 44.70 38.44
Sulfur 0.01 0.13 0.10
Chlorine 0.0221 0.0030 0.502
Ash 5.64 0.28 19.63
Table 4.9: Ash analysis of charcoal, woodchips, and poultry litter (% Ignited Basis)
Oxide Charcoal Woodchips Poultry Litter
SiO₂ 6.51 13.99 25.96
Al₂O₃ 0.43 2.99 2.87
Fe₂O₃ 0.97 6.55 1.47
CaO 78.06 35.50 28.29
MgO 2.15 11.95 4.65
Na₂O 0.90 1.78 3.33
K₂O 5.16 12.50 11.31
TiO₂ 0.00 0.00 0.07
MnO₂ 2.04 3.73 0.23
P₂O₅ 1.07 5.81 15.83
SrO 0.29 0.16 0.03
BaO 0.43 0.47 0.00
SO₃ 1.91 4.39 3.52
Chlorine 0.07 0.22 3.13
Total 99.98 99.99 100.00
The low Ash and Chlorine content of the charcoal and woodchips relative to the
litter, paired with the low alkali and phosphorus content of the charcoal ensured that the
poultry litter was by far the dominant source of Na, K, P, and Cl in the experiments. For
all experiments, poultry litter accounted for 90.6±0.6% Na, 83.6±0.9% K, 95.5±0.2% P,
and 93.6±0.4% Cl fed into the gasifier (Appendix A, Tables A.3-8).

58
Results between experiments were very similar from a gasifier performance,
qualitative analysis, and syngas production standpoint. During all runs, gasifier
differential pressure started climbing after the poultry litter mixture had been feeding for
about one hour, due to the large amount of fines present in poultry litter. By one and a
half hours it had reached 25” H₂O (6.2 kPa), the maximum in the measured range for the
onboard manometer, where it remained for the duration of the test. Consequently, air was
drawn into the system anywhere there were small leaks and syngas quality suffered. It
was discovered after sampling syngas from different parts of the system that the primary
source of the leak was somewhere in the filter box. The dry average syngas composition
and HHV during the feeding of the litter/limestone/woodchip mixture for one of the
experiments (8.95% limestone/dry litter) is as follows:
O₂ [%]
CO
[%] CO₂ [%]
CH₄ [%]
H₂ [%]
HHV
[MJ/m³]
5.6 14.9 8.5 0.8 12.1 3.8
*Syngas variation during this typical run can be seen in Appendix D, Figure D.4
This result was very typical for all experiments. Since it was found that all O₂ was
entering through leaks in the filter box, and assuming that 3.76 moles of N₂ entered for
every mole of O₂ in air, a corrected syngas composition and corresponding HHV could
be calculated:
O₂ [%]
CO
[%] CO₂ [%]
CH₄ [%]
H₂ [%]
HHV
[MJ/m³]
0.0 20.4 11.6 1.1 16.6 5.1
This corrected composition and HHV is what would be achieved if leaks were eliminated
from the system and is very comparable to the standard woodchip syngas composition as
described in Section 3.1.1. However, the root of the problem is the high pressure across

59
the gasifier which is an issue that needs to be addressed if gasifying poultry litter is to be
further pursued.
Ash recovered from each section of the gasifier was visibly identical between
experiments, the only minor difference being „PL Ash‟ crumbling slightly less easily at
the 3.71% limestone set point, perhaps indicating an approach towards the threshold of
clinkering for a minimum amount of limestone. A sample of the „Woodchip Char‟
collected from the top of the gasifier using a Shop-Vac can be seen in Figure 4.8. A dime
is pictured as a size reference.
Figure 4.8: ‘Woodchip Char‟ sample, collected from the top of the gasifier
When the gasifier was opened at the seam above the grate, the distinction between what
appears to be the poultry litter and limestone ash and the charred wood and charcoal was
evident. The poultry litter ash, as previously described in Section 4.1.4, is gray, crumbly
and amorphous in nature, and can be seen as the light gray sections of ash in Figure 4.9.

60
Figure 4.9: Ash mound as seen when gasifier is opened at crack above grate. Poultry
litter ash is the light gray section in the middle of the mound
After being separated from the charcoal and wood char by hand and crumbled, the
poultry litter and limestone ash can be seen in Figure 4.10. This was separated, weighed,
and sent for analysis as „PL Ash‟ in the first experiment for each of the three limestone
set points (3.71, 5.71, and 7.71 % Limestone/Wet Litter), but mixed with the rest of the
gasifier char for the second. The charcoal and wood char not included in the „PL Ash‟
sample was labeled „Rest of Gasifier‟ and can be seen in Figure 4.11.
Figure 4.10: Crumbled poultry litter ash as sent for analysis in one experiment for each
limestone set point (3.71, 5.71, and 7.71 % Lime/Wet PL), labeled „PL Ash‟

61
Figure 4.11: „Rest of Gasifier‟ sample, comprised mostly of charcoal and wood char
The char that settled in the chamber below the gasifier grate and just before the heat
exchanger, a section where syngas is between 600-750˚C, was labeled „Below Grate‟ and
can be seen in Figure 4.12.
Figure 4.12: Char collected from chamber below gasifier grate, labeled „Below Grate‟
The char that settled inside and just after the exit of the heat exchanger was labeled
„HEX‟ and can be seen in Figure 4.13. It is much finer than that below the grate. Syngas
in this section is cooled from 600-630˚C down to 100-110˚C.

62
Figure 4.13: Char from inside and just after the heat exchanger, labeled „HEX‟
The final place char is found is the filter box, samples labeled „Filter‟. This char is very
similar to the „HEX‟ sample, only slightly darker and more powdery (Figure 4.14).
Syngas in this section is filtered through bags and cools from 100-110˚C to 50-60˚C.
Figure 4.14: Char collected from filter box, labeled „Filter‟
In the second experiment for each of the three limestone percentages (3.71, 5.71, and
7.71 %), the char comprising the „Below Grate‟, „HEX‟, and „Filter‟ samples was
combined, mixed, and then sampled as „Past Grate‟. In these same three experiments, all
char labeled „PL Ash‟ and „Rest of Gasifier‟ was combined, mixed, and sampled as
„Gasifier‟.

63
4.2.1 Contaminant Mass Balances
The procedure followed was that dictated in Section 3.2.2, however after the first
four experiments it was discovered that a small amount of the biomass fines were falling
below the conveyer in the onboard feed system and never making it into the gasifier.
Therefore, during the final two experiments, the small portion of poultry litter mixture
that fell through was collected and weighed as was the small portion of the 200 lbs (90.72
kg) of woodchips fed after the poultry litter mixture using the onboard conveyer. The two
runs yielded similar results with 4.64 lbs of woodchips and 10.05 lbs of poultry litter mix
being collected for one and 5.10 lbs of woodchips and 12.75 lbs of poultry litter mix
collected for the other. The average of these two (4.86 lbs woodchips and 11.40 lbs of PL
mix) was then assumed as the loss for each of the previous four experiments. To find the
composition of the PL mix that was recovered, it was assumed that the same ratio of
woodchips fell through from both the 200 lbs woodchip batch and from the woodchips in
the poultry litter mixture (130 lbs). This amount (i.e., for the average:
) was then
subtracted from the PL mix recovered and what remained was assumed to be poultry
litter and lime present in the same ratio as they were mixed for each experiment (i.e. 3.71,
5.71, or 7.71% Limestone/Wet PL).
The analyses for each of the raw feedstocks (charcoal, woodchips, poultry litter,
and limestone), coupled with the experimentally found moisture content, predetermined
weight, and experimental losses were used to determine the total amount of each
contaminant of interest (K, Na, P, Cl) and a tracer element (Ca) fed into the gasifier. In
the same manner, using the mass of ash collected, lab analyses, and experimentally

64
determined LOI‟s the amount of each contaminant and tracer mineral recovered in the
ash was determined. Ratios of mass recovered in char to mass fed into the gasifier were
then calculated for each element in every experiment, giving a retention percentage of the
elements when gasified. Additionally, total ash content fed into the gasifier was
calculated from the feedstock weight and ash analysis, as was total ash content recovered
from the char. These values were then compared and used to calculate a percent
difference of total ash content collected to total ash content expected. These mass
balances and analyses can be seen in Appendix A.
Not factoring in the assumed and measured losses from the onboard conveyor, the
retention percentage of each element for every experiment can be seen in Table 4.10,
arranged in order of increasing Limestone/Dry poultry litter percentage. The average
retention percentage at each Limestone/Wet Poultry Litter set point can be seen in Table
4.11.
Table 4.10: Retention percentage of notable elements, not accounting for conveyor
losses
% Limestone/Wet
PL
% Limestone/Dry
PL P K Cl Na Ca
3.71 4.24 83.2% 80.4% 63.3% 73.5% 74.5% 3.71 4.31 112.4% 91.9% 92.7% 101.4% 104.8% 5.71 6.49 91.7% 90.4% 89.3% 89.2% 89.6% 5.71 6.69 100.3% 80.8% 73.1% 96.1% 90.6% 7.71 8.92 71.9% 81.0% 76.4% 60.9% 65.5% 7.71 8.95 88.3% 86.4% 82.0% 84.8% 83.9%
Average: 91.3% 85.2% 79.5% 84.3% 84.8%

65
Table 4.11: Average retention percentage of notable elements at the three limestone set
points, not accounting for conveyor losses
% Limestone/Wet
PL P K Cl Na Ca
3.71 97.8% 86.1% 78.0% 87.4% 89.7% 5.71 96.0% 85.6% 81.2% 92.6% 90.1% 7.71 80.1% 83.7% 79.2% 72.8% 74.7%
To compare the effect of factoring in the conveyor losses, Table 4.12 shows the absolute
percent difference between total ash content put into the gasifier and total ash content
recovered in the char, with and without the conveyor losses factored in. It also shows the
percentage of the total input ash content that the conveyer losses account for in each run.
Table 4.12: % of total input ash content accounted for by conveyer losses and absolute %
difference between total input ash and output ash with and without conveyor losses
factored in. *designates runs where conveyer losses were collected and weighed, losses
for all others are the average of the two
% Limestone/Wet PL
% Limestone/Dry PL
% of input ash
Abs. % Diff. betweent total ash in and total ash out
With losses factored in
Without losses factored in
3.71 4.24 9.4% 12.6% 20.8% 3.71* 4.31* 8.1% 7.7% 1.0% 5.71 6.49 9.2% 0.2% 9.4% 5.71 6.69 9.5% 0.4% 9.1%
7.71* 8.92* 12.2% 25.4% 33.4% 7.71 8.95 9.2% 7.8% 16.3%
Average: 9.6% 9.0% 15.0%
It can be seen that including the conveyer losses gains an average 6.0% improvement in
ash percent difference for all runs. Also, the losses account for an average 9.6% of the
input ash. Because of this, all results presented henceforth will have the conveyor losses
factored in.

66
The retention percentage of notable elements, losses factored in, is presented in
Table 4.13. Compared to Table 4.10, phosphorus is 6.3% closer and calcium is 7.4%
closer on average to 100% retention. In the literature (Section 2.3) it was found that P and
Ca did not volatilize at gasification or combustion temperatures and thus are expected to
be accounted for fully in the gasifier char. Ca particularly is expected to be fully retained
in the ash and was used in the literature as a foundation for normalizing data. The average
retention percentage at each limestone set point can be seen in Table 4.14.
Table 4.13: Retention percentage of notable elements, conveyor losses factored in
% Limestone/Wet
PL
% Limestone/Dry
PL P K Cl Na Ca
3.71 4.24 93.7% 89.4% 71.0% 82.2% 81.0% 3.71 4.31 124.4% 100.5% 102.5% 111.7% 112.4% 5.71 6.49 102.9% 100.1% 100.0% 99.5% 97.3% 5.71 6.69 112.5% 89.7% 81.9% 107.3% 98.8% 7.71 8.92 82.0% 91.2% 87.0% 69.0% 72.6% 7.71 8.95 98.9% 95.7% 91.7% 94.5% 91.3%
Average: 102.4% 94.4% 89.0% 94.0% 92.2%
Table 4.14: Average retention percentage of notable elements, conveyor losses factored
in
% Limestone/Wet
PL P K Cl Na Ca
3.71 109.0% 95.0% 86.8% 97.0% 96.7% 5.71 107.7% 94.9% 91.0% 103.4% 98.1% 7.71 90.5% 93.4% 89.3% 81.7% 81.9%
The data from Tables 4.13-14 is presented graphically in Figures 4.15-17, plotted as
percent retention vs. limestone percent (on a wet litter basis). The data points for the two
runs at each limestone set point are displayed as diamonds, and the average for those
points is shown as an asterisk with a curve fit.

67
Figure 4.15: Chlorine Retention vs. Limestone Percentage
Figure 4.16: Alkali Retention vs. Limestone Percentage
0.0%10.0%20.0%30.0%40.0%50.0%60.0%70.0%80.0%90.0%
100.0%110.0%120.0%
3.50% 4.50% 5.50% 6.50% 7.50% 8.50%
Per
cen
t R
eten
tio
n
Percent Limestone/Wet PL
Cl Retention vs. Limestone Percentage
Average
Data Points
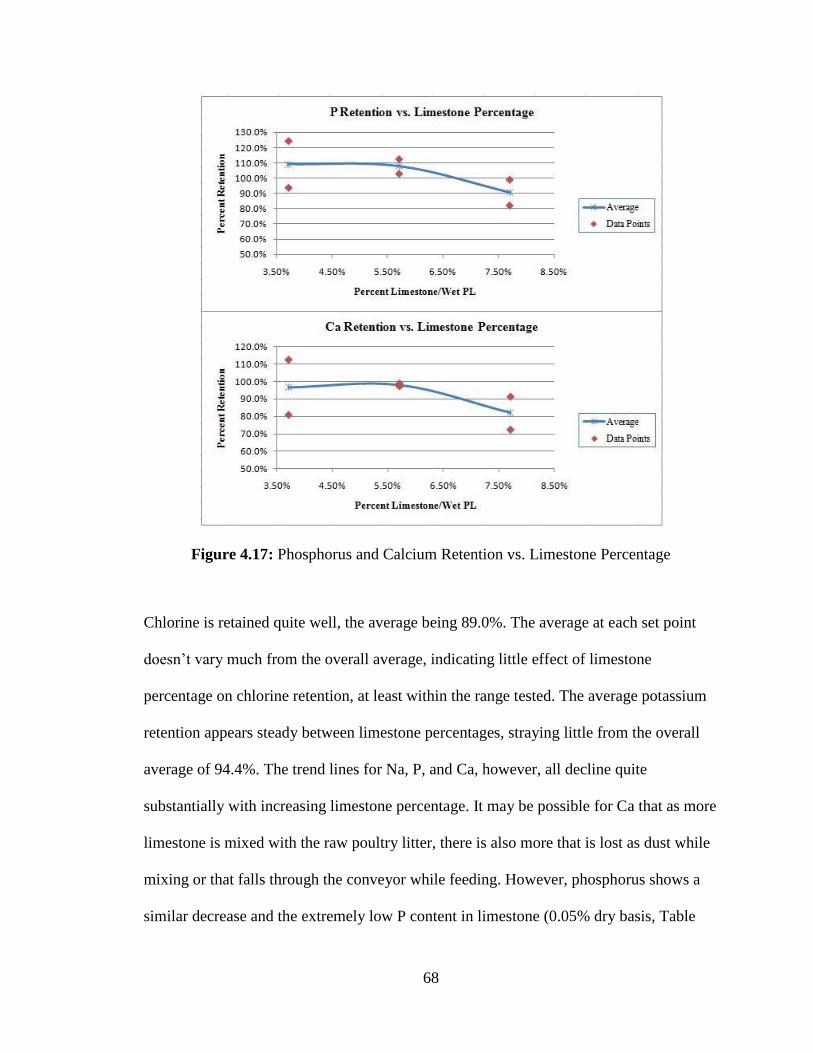
68
Figure 4.17: Phosphorus and Calcium Retention vs. Limestone Percentage
Chlorine is retained quite well, the average being 89.0%. The average at each set point
doesn‟t vary much from the overall average, indicating little effect of limestone
percentage on chlorine retention, at least within the range tested. The average potassium
retention appears steady between limestone percentages, straying little from the overall
average of 94.4%. The trend lines for Na, P, and Ca, however, all decline quite
substantially with increasing limestone percentage. It may be possible for Ca that as more
limestone is mixed with the raw poultry litter, there is also more that is lost as dust while
mixing or that falls through the conveyor while feeding. However, phosphorus shows a
similar decrease and the extremely low P content in limestone (0.05% dry basis, Table

69
4.4.) prevents that theory for accounting for the losses of both of these elements that were
expected to be fully retained. Analyzing the numbers from Tables 4.13 and 4.12 it can be
seen that the experiment contributing most to the low average of Na, P, and Ca at 7.71%
limestone also has the largest percent difference between total ash in and out: 25.4% even
after including the conveyor losses. Additionally, it can be observed from Table 4.13 that
the calcium retention percentage for each experiment is very indicative of the percent
retention of the other elements for that run. For example, in an experiment when Ca is
lower than the average, all other parameters are lower than average as well. The same
trend can be observed for the experiment with a Ca balance of greater than 100%. With
these observations in mind, and borrowing the technique discussed from the literature,
each experiment was normalized to the expected value of 100% Ca (22). Table 4.15
shows the retention percentage for all experiments when the results for each experiment
were normalized to Ca. The average retention percentage at each % Limestone/Wet Litter
set point can be seen in Table 4.16.
Table 4.15: Retention percentage of notable elements, normalized to Ca
% Limestone/Wet
PL
% Limestone/Dry
PL P K Cl Na Ca
3.71 4.24 115.7% 110.4% 87.7% 101.5% 100.0% 3.71 4.31 110.7% 89.5% 91.2% 99.4% 100.0% 5.71 6.49 105.7% 102.9% 102.7% 102.3% 100.0% 5.71 6.69 113.8% 90.7% 82.9% 108.6% 100.0% 7.71 8.92 113.0% 125.7% 119.9% 95.2% 100.0%
7.71 8.95 108.3% 104.7% 100.4% 103.4% 100.0%
Average: 111.2% 104.0% 97.5% 101.7% 100.0%

70
Table 4.16: Average retention percentage of notable elements, normalized to Ca
% Limestone/Wet
PL P K Cl Na Ca
3.71 113.2% 100.0% 89.5% 100.5% 100.0% 5.71 109.8% 96.8% 92.8% 105.4% 100.0% 7.71 110.7% 115.2% 110.1% 99.3% 100.0%
The data from Tables 4.15-16 is presented graphically in Figures 4.18-19, plotted as
percent retention vs. limestone percent (on a wet litter basis). The data points for the two
runs at each limestone set point are displayed as diamonds, and the average for those
points is shown as an asterisk with a curve fit.
Figure 4.18: Chlorine Retention vs. Limestone Percentage, Normalized to Calcium
0.0%10.0%20.0%30.0%40.0%50.0%60.0%70.0%80.0%90.0%
100.0%110.0%120.0%
3.50% 4.50% 5.50% 6.50% 7.50% 8.50%
Per
cen
t R
eten
tio
n
Percent Limestone/Wet PL
Cl Retention vs. Limestone Percentage, Normalized to Ca
Average
Data Points

71
Figure 4.19: Potassium, Sodium, and Phosphorus Retention vs. Limestone Percentage

72
Normalizing to calcium tightened up most of the data points. The span between the two
data points at each limestone percentage improved on average from 16.8% to 11.0% for
every element excluding Ca. The phosphorus trend line is now flattened out and the
average retention at the 7.71% limestone set point is in line with the averages at 3.71%
and 5.71%, which both changed very little. However, now all data points for P as well as
several for Na, K, and Cl are above 100%. The trend lines for both Cl and K appear to
indicate an increase in retention with an increase in limestone addition, which was the
hypothesized result (an increase in Cl capture by the limestone limiting K reaction and
volatilization with Cl), however the peak for both is at least 110%.
Overall, it is difficult to say whether the trend lines actually represent a trend, due
to limited number of data points and the substantial scatter of the points. However, on
average, nearly all of the contaminates appear to be captured. The lowest average
retention percentage over all runs, regardless of losses included or normalization, was Cl
and at worst the average retention percentage was 78.0% (for 3.71% limestone, not
including conveyor losses). Including the known conveyor losses, an average 89.0% Cl
was captured over all runs and at least 94.4% on average was captured of P, K, and Na.
When normalized to calcium, an average 97.5% Cl was captured and at least 100% on
average was captured of P, K, and Na.
4.2.2 Contaminant Distribution
In one of the experiments at each of the three limestone percentages, the char
collected from each section of the gasifier was weighed and analyzed separately, instead
of combining and mixing it. Doing this allowed insight into the distribution of elements

73
throughout the gasifier. Figure 3.5 shows the average temperature of the syngas as it
proceeds from the grate through the heat exchanger and finally out of the filter box. This
temperature profile is significant when compared with the contaminant profiles. Figures
4.20-22 show the mass percent of K₂O, Na₂O, P₂O₅, SO₃, and Cl in the ash of the char
samples at the three limestone/wet poultry litter percentages.
Figure 4.20: Mass percent of oxides in char ash throughout the gasifier, at 3.71%
limestone/wet litter
Figure 4.21: Mass percent of oxides in char ash throughout the gasifier, at 5.71%
limestone/wet litter
0.00
2.00
4.00
6.00
8.00
10.00
12.00
14.00
16.00
PL Ash Rest of
Gasifier
Below
Grate
HEX Filter
Oxid
e M
ass
Per
cen
t (%
)
Gasifier Location
3.71% Limestone
K2O
Na2O
P2O5
SO3
Cl
0.00
2.00
4.00
6.00
8.00
10.00
12.00
14.00
16.00
PL Ash Rest of
Gasifier
Below
Grate
HEX Filter
Oxid
e M
ass
Per
cen
t (%
)
Gasifier Location
5.71% Limestone
K2O
Na2O
P2O5
SO3
Cl

74
Figure 4.22: Mass percent of oxides in char ash throughout the gasifier, at 7.71%
limestone/wet litter
While the limestone percentage doesn‟t appear to have an effect on the contaminant
profile, it is obvious from the three figures that there is a trend in element concentrations.
Na₂O and P₂O₅ decrease slightly and seem to mirror each other as you progress through
the gasifier. K₂O concentration decreases slightly and then spikes at the Filter location.
SO₃ and Cl both increase significantly at the heat exchanger (HEX) and Filter. While
sulfur is not one of the main contaminants of interest, the concentration trend was
noteworthy and validated presentation. The trend observed for both Cl and S, and to a
lesser extent K, is an increase in concentration in the cooler parts of the gasifier. The
syngas in the heat exchanger cools from ~610˚C down to ~110˚C and in the Filter down
to ~60˚C. At these temperatures some of the volatilized elements appear to be re-
condensing and getting sequestered in the char. A second, even more telling graph can be
seen in Figures 4.23-25, which shows the percentage of total mass collected of each
major element at four locations in the gasifier system: Inside the Gasifier, Below the
Grate, in the Heat Exchanger, and in the Filter Box.
0.00
2.00
4.00
6.00
8.00
10.00
12.00
14.00
16.00
PL Ash Rest of
Gasifier
Below
Grate
HEX Filter
Oxid
e M
ass
Per
cen
t (%
)
Gasifier Location
7.71% Limestone
K2O
Na2O
P2O5
SO3
Cl

75
Figure 4.23: Percentage of total mass collected of each element at different locations in
the gasifier, at 3.71% limestone/wet litter
Figure 4.24: Percentage of total mass collected of each element at different locations in
the gasifier, at 5.71% limestone/wet litter
0.0%
10.0%
20.0%
30.0%
40.0%
50.0%
60.0%
70.0%
80.0%
90.0%
Inside Gasifier Below Grate HEX Filter
Per
cen
t o
f T
ota
l C
oll
ecte
d (
%)
Gasifier Location
3.71% Limestone
K
Na
P
Ca
Si
S
Cl
0.0%
10.0%
20.0%
30.0%
40.0%
50.0%
60.0%
70.0%
80.0%
90.0%
Inside Gasifier Below Grate HEX Filter
Per
cen
t o
f T
ota
l C
oll
ecte
d (
%)
Gasifier Location
5.71% Limestone
K
Na
P
Ca
Si
S
Cl

76
Figure 4.25: Percentage of total mass collected of each element at different locations in
the gasifier, at 7.71% limestone/wet litter
Once again, limestone percentage doesn‟t appear to have an effect on the distribution,
however the distribution is very consistent for each element between the three
experiments. Almost all the elements follow a similar pattern: about 70% or more is
recovered Inside the Gasifier, between 18% and 23% is recovered Below the Grate, and
between 1% and 8% is recovered in the Heat Exchanger and Filter Box. The outliers are
chlorine and sulfur, who both appear to volatilize and migrate more readily than the other
elements, leaving the gasifier but re-condensing and getting captured in the cooler Heat
exchanger and Filter Box sections of the gasifier system. On average, 69.1% of the
chlorine was captured past the gasifier grate, and 52.6% was captured in the Heat
Exchanger and Filter Box. The average retention of 30.9% of the Cl inside the gasifier
agrees well with results of Bjorkman, et al. in Figure 2.1, showing the retention of ~37%
when pyrolyzing switchgrass at 900 ˚C. From Figures 4.20-25, the conclusion can be
0.0%
10.0%
20.0%
30.0%
40.0%
50.0%
60.0%
70.0%
80.0%
90.0%
Inside Gasifier Below Grate HEX Filter
Per
cen
t o
f T
ota
l C
oll
ecte
d (
%)
Gasifier Location
7.71% Limestone
K
Na
P
Ca
Si
S
Cl

77
drawn that cooling and filtering the syngas is necessary for the maximum capture and
retention of chlorine and sulfur in the char. While potassium follows the same trend as
the other elements in Figures 4.23-25, the consistent increase in concentration at the
Filter Box location in Figures 4.20-22 suggest that cooling the syngas to between 60-
100˚C aids in the retention of this element as well, which according to the literature is
most likely in the form of KCl. The ratios of Cl to K in the Filter location and HEX
location allow this as a possibility, but can neither explicitly confirm nor deny it.
4.2.3 Conclusions, Recommendations, and Sources of Error
Through experimentation, it was shown that downdraft gasification is effective as
a means of sequestering contaminants harmful to the cement manufacturing process
while extracting the usable chemical energy from poultry litter in the form of syngas.
Conservatively, 89% of the chlorine can be retained in the char, as well as 94% of the
potassium and sodium, along with 100% of the phosphorus. It does, however, appear to
be necessary to cool and filter the syngas in the range of 60-110˚C to obtain maximum
removal of the contaminants, particularly Cl and K, from the syngas stream. Although
sulfur is not a contaminant of high interest when compared to the coal and coke used in
the cement kiln, results show that cooling and filtering the syngas limits its throughput as
well. Variation of limestone percentage did not appear to have a large effect on the
capture rates, at least within the range tested, although the low set point of 3.71%
limestone to wet poultry litter (4.24-4.31% dry) seemed to approach the minimum
limestone percentage necessary to avoid clinkering. As a result, a limestone percentage in
the range of the middle set point (5.71% limestone to wet poultry litter, 6.5-6.7% dry)

78
emerged as the preferred amount, limiting the use of an extra additive while providing a
factor of safety against clinkering issues.
It is yet to be determined, however, the effectiveness of the techniques used in the
experiments towards gasifying poultry litter of higher ash or chlorine contents. The raw
litter used successfully in the experiments had an ash content of about 20% on a dry
basis. As seen in the literature as well as the litter pellets used for earlier tests, ash content
can be as high as 33% on a dry basis, with an average in the literature of 25.2%. With this
in mind, the recommended ratio of 6.5-6.7% limestone to dry litter found in the
experiments would be about 33-34% limestone to poultry litter ash. Additional
considerations to explore are: methods of eliminating the high pressure drop across the
gasifier due the poultry litter fines; further experimentation with poultry litter pellets,
perhaps with limestone pre-mixed in; use of different gasifier types; and measurement of
the concentration of contaminants in the syngas itself to round out the mass balance and
verify retention in the char.
There were many potential sources of error encountered in the experiments. Due
to the large scale of experiments and small size of the biomass and char samples
analyzed, much of the accuracy depended on the mixing and sampling involved. While
mixing or sampling fine char such as that collected from the heat exchanger or filter box
(seen in Figures 4.13-14) probably resulted in an accurate representative sample, char
such as that marked „Rest of Gasifier‟ was very non-homogeneous (as seen in Figure
4.11) and a given sample could vary highly in its accuracy of representation. While the
ash analyses didn‟t vary greatly between experiments, the LOI varied by as much as 20%
in one case between similar samples. An example of a problem encountered when mixing

79
is the presence of white, 1.5” (3.8 cm) deposits found inside the gasifier, circled in Figure
4.26).
Figure 4.26: Ash mound found when gasifier is opened at seam above the grate, white
deposits circled
Three to four of these deposits were found in every experiment and an attempt was made
to crush them before mixing and retrieving a sample. One deposit was collected and sent
for analysis, showing it had only a 2.22% LOI and was comprised of 57.91% CaO and
40.34% MgO on an ash basis. If these deposits weren‟t crumbled and fully mixed in on
every run, Ca recovery in the char would be lower than it should be. Another source of
error was losses in the form of dust and fines. As reported, fines from the feedstock fell
below the conveyer in the onboard feed system, yet they were only collected and
quantified for two of the experiments. Dust was observed to be created and carried away
with the wind during the mixing of limestone, poultry litter, and woodchips before each
experiment as well as during the experiments when being fed into the gasifier. The
feedstock with the finest particles was the limestone, and if this accounted for most of the
dust loss there would also be a preferential loss of Ca before entry into the gasifier. This
may account for the lower than expected Ca retention in some of the runs, as well as the

80
retention rates greater than 100% when normalized to Ca. Overall, these factors most
likely account for the scatter observed in the data points when calculating mass balances.

81
Chapter 5
Conclusions
Downdraft gasification has been explored as a means to extract chemical energy
from poultry litter while limiting the throughput of potentially deleterious components
with regards to use in firing a cement kiln. Experiments with temperature depression via
flue gas recirculation, feedstock dilution using woodchips, and experiments employing
limestone as an additive to prevent fusion and aid in chlorine retention in the ash have
been carried out. Flue gas recirculation allowed the reduction of the gasifier secondary
air oxygen concentration by 40-45%, yielding an approximately 100˚C depression in
average temperature. Results have shown that the clinkering is temperature independent,
at least within the controllable temperature range. Limestone also had only a slight effect
on the fusion when used to coat the pellets. However, limestone addition did display
some promise in regards to chlorine capture, as ash analyses showed chlorine
concentrations of more than four times greater in the limestone infused ash as compared
to raw poultry litter. Experiments were conducted to explore the effectiveness of mixing
limestone with raw poultry litter, the object being to coat more surface area and have a
more even mixture. These resulted in the most consistent experiments with no ash
clinkering.
82
Once consistent gasification of raw poultry litter was achieved through a combination
of woodchip dilution (60% woodchips:40% poultry litter) and addition of limestone at
5% of the wet poultry litter mass (~6.5% Limestone/Dry Poultry Litter), experiments
were performed to determine the capture rates of the contaminants pertinent to cement
kilns. Limestone percentage was varied to explore its effect on chlorine retention at set
points of 3.71, 5.71, and 7.71% Limestone to Wet Poultry Litter, the middle quantity
slightly inflated from the previously used 5% to account for lower moisture of the litter
used in these experiments. It was found that limestone percentage, at least within the
tested range, had little effect on neither the retention of contaminants nor distribution of
contaminants through the gasifier system. On average, 89% of the chlorine was retained
in the gasifier char, as was 94% of both the potassium and sodium, and 100% of the
phosphorus. When data was normalized to 100% calcium retention (expected from the
literature), an average 100% of the Na, K, and P were shown to be retained, as well as
97.5% of the Cl. The contaminant profile, developed from analyses of char samples from
different sections of the gasifier system, showed that 69.1% of the chlorine retained was
captured past the gasifier grate and 52.6% was captured in the significantly cooler Filter
Box and Heat Exchanger sections of the gasifier system. Additionally, peaks in
concentration of sulfur and potassium were observed in these same sections. From these
results, it appears necessary to cool and filter the syngas in the range of 60-110˚C to
obtain maximum removal of Cl, as well as K and S, from the syngas stream.

83
References
1. Poultry - Production and Value 2009 Summary. USDA. [Online] April 2010. [Cited:
January 3, 2011.] http://usda.mannlib.cornell.edu/usda/current/PoulProdVa/PoulProdVa-
04-29-2010.pdf.
2. Broiler Litter Storage. aces.edu. [Online] January 1996. [Cited: January 3, 2011.]
http://www.aces.edu/pubs/docs/A/ANR-0839/.
3. Kelleher, B., et al. Advances in Poultry Litter Disposal Technology - A Review.
Bioresource Technology. Vol. 83, pp. 27-36. 2002.
4. Adams, Z. Comparison of Broiler Litter, Broiler Litter Ash with Reagent Grade
Materials as Sources of Plant Nutrients. Auburn University Master's Thesis. 2005.
5. Bock, B. R. Poultry Litter to Energy: Technical and Economic Feasability.
brbock.com. [Online] 2004. [Cited: August 5, 2010.]
http://www.brbock.com/RefFiles/PoultryLitter_Energy.doc.
6. Kaantee, U., et al. Cement manufacturing using alternative fuels and the advantages of
process modelling. Fuel Processing Technology. Vol. 85, pp. 293-301. 2004.
7. Folta, A. Alternative Fuels and Their Effects on Portland Cement. Auburn University
Master's Thesis. 2010.
8. Mokrzycki, E. and Uliasz-Bochenczyk, A. Alternative fuels for the cement industry.
Applied Energy. Vol. 74, pp. 95-100. 2003.

84
9. Beenackers, A. and van Swaaij, W. Gasification of Biomass, A State of the Art
Review. Thermochemical Processing of Biomass. A. Bridgwater. Butterworths, 1984.
10. Reed, T. B. Executive Summary. Biomass Gasification Principles and Technology.
New Jersey : Noyes Data Corporation, 1981.
11. Buekens, A. and Schoeters, J. Mathematical Modelling in Gasification.
Thermochemical Processing of Biomass. A. Bridgwater. Butterworths, 1984.
12. Gasification. Community Power Corporation. [Online] [Cited: January 6, 2011.]
http://www.gocpc.com/gasification.html.
13. Priyadarsan, S., et al. Fixed-bed Gasification of Feedlot Manure and Poultry Litter
Biomass. Transactions of the ASAE. Vol. 47, pp. 1689-1696. 2004.
14. Giltrap, D., McKibbin, R. and Barnes, G. A Steady State Model of Gas-Char
Reactions in a Downdraft Biomass Gasifier. Solar Energy. Vol. 74, pp. 85-91. 2003.
15. Wang, Y. and Kinoshita, C. Kinetic Model of Biomass Gasification. Solar Energy.
Vol. 51, pp.19-25. 1993.
16. Reardon, J., Browne, K. and Beard, K. Demonstration of a Small Modular BioPower
System Using Poultry Litter. Littleton, CO : Community Power Corporation, 2001.
17. Li, S., et al. Effect of Co-Combustion of Chicken Litter and Coal on Emissions in a
Laboratory-Scale Fluidized Bed Combustor. Fuel Processing Technology. Vol. 89, pp. 7-
12. 2008.
18. Gasification Feasibility Study for the Roberta Cement Plant. Tulsa : Primenergy,
L.L.C., 2008.

85
19. Schaffer, M. Final Report: Advanced Slagging Gasifier for Biomass Wastes. Epa.gov.
[Online] 2006. [Cited: November, 12 2009.] http://cfpub.epa.gov/ncer_abstracts/
index.cfm/fuseaction/display.abstractDetail/abstract/7968/report/F
20. Codling, E. Laboratory Characterization of Phosphorus in Poultry Litter and Poulrty
Litter Ash. Salt Lake City, UT : ASA-CSSA-SSSA International Annual Meetings, 2005.
21. Price, C. Nutritionist, Sanderson Farms. Phone Interview. December 17, 2010.
22. Misra, M., Ragland, K. and Baker, A. Wood Ash Composition as a Function of
Furnace Temperature. Biomass and Bioenergy. Vol. 4, No. 2, pp. 103-116. 1993.
23. Bhatty, J. and Gajda, J. Use of Alternative Materials in Cement Manufacturing.
Skokie, Illinois : Portland Cement Association, 2004.
24. Bjorkman, E. and Stromberg, B. Release of Chlorine from Biomass at Pyrolysis and
Gasification Conditions. Energy & Fuels. Vol. 11, pp. 1026-1032. 1997.
25. Jenkins, B.M., et al. Combustion Properties of Biomass. Fuel Processing
Technology.Vol. 54, pp. 17-46. 1998.
26. Dayton, D., French, R. and Milne, T. Direct Observation of Alkali Vapor Release
during Biomass Gasification. Energy & Fuels. Vol. 10, pp. 284-292. 1996.
27. Coda, B., et al. Behavior of Chlorine and Enrichment of Risky Elements in Bubbling
Fluidized Bed Combustion of Biomass and Waste Assisted by Additives. Energy &
Fuels. Vol. 15, pp. 680-690. 2001.
28. Salo, K. and Mojtahedi, W. Fate of Alkali and Trace Metals in Biomass Gasification.
Biomass and Bioenergy. Vol. 15, No. 3, pp. 263-267. 1998.
29. Turns, S. An Introduction to Combustion 2nd ed. McGraw-Hill, 2000.
30. Glassman, I. Combustion. Academic Press, 2008.

86
31. Beckwith, T. and Marangoni, R. Mechanical Measurements 4th
ed. Addison-Wesley
Publishing Company, Inc, 1990.

87
Appendices

88
Appendix A
Contaminant Mass Balance Spreadsheets
Table A.1: Ash contents of the input feedstocks
Ash Content (% wt), dry basis
Charcoal Poultry Litter Woodchips Lime
5.64 19.63 0.28 56.31
Table A.2: Analyses of feedstocks used in mass balances and oxide to element % mass
conversion factor. Limestone total 100% b/c CaO and MgO are calculated from
carbonate percentages (seen in Table 4.4)
Oxide to
Element
Conversion
Input Ash analyses [% mass, ash basis] Limestone
[% mass,
dry basis] Oxide Poultry Litter Woodchips Charcoal
0.467 SiO2 25.96 13.99 6.51 1.60
0.529 Al2O3 2.87 2.99 0.43 0.51
0.699 Fe2O3 1.47 6.55 0.97 0.59
0.715 CaO 28.29 35.50 78.06 43.41
0.603 MgO 4.65 11.95 2.15 7.18
0.742 Na2O 3.33 1.78 0.90 0.01
0.830 K2O 11.31 12.50 5.16 0.17
0.599 TiO2 0.07 0.00 0.00 0.05
0.436 P2O5 15.83 5.81 1.07 0.05
BaO 0.00 0.47 0.43 0.01
MnO2 0.23 3.73 2.04 0.06
0.401 SO3 3.52 4.39 1.91 0.16
SrO 0.03 0.16 0.29 0.07
Cl 3.13 0.22 0.07 0.00
TOTAL 100.71 100.04 100.00 53.87
Cl (Dry Basis) 0.502 0.003 0.022 0.000

89
Table A.3: Spreadsheet for 4.24% limestone/dry litter from 5/24/2010
** Denotes average value used for conveyor fall-through losses
Ch
arco
alW
arm
up
ch
ips
Po
ult
ry L
itte
rM
ix/A
fte
r P
L C
hip
s
tin
13.5
13.7
13.7
13.5
we
t12
0.8
145.
113
4.8
131.
2
dry
114.
712
8.7
119.
911
5.2
mo
istu
re %
5.68
12.4
812
.30
13.5
9
we
t
we
t -
(So
rte
d +
Fall
th
rou
gh)
dry
The
ore
tica
l Ash
PK
Cl
Na
Ca
Ch
arco
al43
.10
43.1
040
.65
2.29
0.01
10.
098
0.00
90.
0153
1.27
91C
har
coal
War
m u
p C
hip
s30
.30
30.3
026
.52
0.07
0.00
20.
008
0.00
10.
0010
0.01
88W
arm
up
Ch
ips
PL
7060
.99
53.4
910
.50
0.72
50.
986
0.26
90.
2594
2.12
32P
L
Ch
ips
130
123.
6410
6.83
0.30
0.00
80.
031
0.00
30.
0039
0.07
59C
hip
s
lim
e2.
602.
272.
271.
280.
000
0.00
30.
000
0.00
020.
7029
lim
e
Aft
er
PL
Ch
ips
200
188.
0916
2.52
0.46
0.01
20.
047
0.00
50.
0060
0.11
54A
fte
r P
L C
hip
s
tota
l47
6.00
448.
3939
2.28
14.9
00.
758
1.17
30.
286
0.28
64.
315
tota
l
Lim
e/L
itte
r p
erc
en
tage
3.71
%3.
71%
4.24
%0.
032
0.18
70.
018
0.02
62.
192
tota
l (n
on
PL)
95.7
5%84
.02%
93.7
6%90
.76%
49.2
0%ra
tio
fro
m P
L/to
tal
Sort
ed
/Fal
l-th
rou
gh[l
bs]
Sort
ed
Fall
-th
rou
gh
Sort
ed
PL+
Lim
e1.
10M
ix C
hip
s3.
203.
16
Sort
ed
Mix
Ch
ips
3.20
PL
1.06
7.95
**Fa
ll-th
rou
gh
Ch
ips/
PL/
Lim
e11
.40
Lim
e0.
040.
30
Sort
ed
200
lbs
7.05
tota
l4.
3011
.40
**Fa
ll-th
rou
gh
200
lbs
4.86
Aft
er
PL
Ch
ips
7.05
4.86
Re
cove
red
Dry
Act
ual
Ash
PK
Cl
Na
Ca
SiS
Wo
od
chip
s ch
ar5.
905.
900.
150.
0037
0.01
530.
0003
0.00
190.
0374
0.00
960.
0026
Wo
od
chip
s ch
ar
PL
Ash
1.10
1.10
1.08
0.06
940.
0803
0.00
090.
0211
0.30
070.
1087
0.01
31P
L as
h
Re
st o
f G
asif
ier
18.5
018
.46
8.46
0.46
960.
6753
0.05
820.
1558
2.13
351.
0418
0.06
64R
est
of
Gas
ifie
r
Be
low
Gra
te4.
654.
642.
180.
1131
0.17
340.
0294
0.04
050.
6402
0.22
960.
0158
Be
low
Gra
te
HEX
0.95
0.94
0.54
0.02
550.
0420
0.05
300.
0065
0.19
220.
0121
0.01
19H
EX
Filt
er
1.40
1.37
0.61
0.02
820.
0627
0.06
160.
0091
0.19
000.
0109
0.02
39Fi
lte
r
tota
l32
.50
32.4
013
.03
0.70
961.
0490
0.20
340.
2349
3.49
401.
4128
0.13
37to
tal
93.7
%89
.4%
71.0
%82
.2%
81.0
%R
atio
OU
T/IN
Ash
Pe
rce
nt
dif
f:12
.55%
19.0
3%%
Dif
fere
nce
115.
7%11
0.4%
87.7
%10
1.5%
100%
No
rm. t
o C
a
0.46
70.
529
0.69
90.
715
0.60
30.
742
0.83
00.
599
0.43
60.
401
Mo
ist
(% A
s R
ec)
LOI (
% D
ry B
asis
)Si
O2
(%)
Al2
O3
(%)
Fe2O
3 (%
)C
aO (
%)
MgO
(%
)N
a2O
(%
)K2O
(%
)Ti
O2
(%)P
2O5
(%)
BaO
(%
)M
nO
2 (%
)SO
3 (%
)Sr
O (
%)
Cl (
%)
PL
5/24
0.00
1.6
21.4
92.
611.
3538
.88
5.58
2.63
8.94
0.12
14.6
80.
050.
513.
020.
060.
08
Re
st o
f G
asif
ier
5/24
0.20
54.1
726
.34
3.26
1.44
35.2
85.
592.
489.
610.
0812
.72
0.06
0.58
1.96
0.06
0.69
Be
low
Gra
te 5
/24
0.32
53.0
522
.57
2.56
1.42
41.1
64.
542.
519.
600.
0711
.91
0.09
0.62
1.81
0.08
1.35
HEX
5/2
41.
3941
.88
4.75
1.62
1.35
49.3
96.
781.
629.
290.
0010
.72
0.20
1.12
5.47
0.13
9.74
Filt
er
5/24
2.47
55.0
13.
801.
291.
7643
.28
5.97
1.99
12.3
00.
0010
.53
0.20
1.25
9.72
0.14
10.0
2
Wo
od
chip
Ch
ar97
.50
Gasifier
Ele
me
nts
IN [
lbs]
Ele
me
nts
OU
T [l
bs]
Mo
istu
re C
on
ten
t (w
et
bas
is)
PL MIX
Ou
tpu
t A
sh A
nal
yse
s
Oxi
de
to
Ele
me
nt
Mu
ltip
lie
r
Ou
tpu
t [l
bs]
Inp
ut
[lb
s], 2
.6 lb
s Li
me
sto
ne

90
Table A.4: Spreadsheet for 6.49% limestone/dry litter from 5/17/2010
** Denotes average value used for conveyor fall-through losses
Ch
arco
alW
arm
up
ch
ips
Po
ult
ry L
itte
rM
ix/A
fte
r P
L C
hip
s
tin
13.7
13.7
13.5
13.5
we
t10
7.0
127.
514
0.4
135.
6
dry
100.
611
1.2
125.
311
8.7
mo
istu
re %
6.86
14.3
211
.90
13.8
4
we
t
we
t -
(So
rte
d +
Fall
th
rou
gh)
dry
The
ore
tica
l Ash
PK
Cl
Na
Ca
Ch
arco
al47
.55
47.5
544
.29
2.50
0.01
20.
107
0.01
00.
0167
1.39
36C
har
coal
War
m u
p C
hip
s46
.85
46.8
540
.14
0.11
0.00
30.
012
0.00
10.
0015
0.02
85W
arm
up
Ch
ips
PL
7061
.26
53.9
710
.59
0.73
20.
995
0.27
10.
2617
2.14
22P
L
Ch
ips
130
123.
8410
6.70
0.30
0.00
80.
031
0.00
30.
0039
0.07
58C
hip
s
lim
e4.
003.
503.
501.
970.
001
0.00
50.
000
0.00
031.
0860
lim
e
Aft
er
PL
Ch
ips
200
187.
5916
1.63
0.45
0.01
10.
047
0.00
50.
0060
0.11
48A
fte
r P
L C
hip
s
tota
l49
8.40
470.
5941
0.22
15.9
30.
766
1.19
60.
290
0.29
04.
841
tota
l
Lim
e/L
itte
r p
erc
en
tage
5.71
%5.
71%
6.49
%0.
034
0.20
20.
019
0.02
82.
699
tota
l (n
on
PL)
95.5
2%83
.15%
93.4
3%90
.23%
44.2
5%ra
tio
fro
m P
L/to
tal
Sort
ed
/Fal
l-th
rou
gh[l
bs]
Sort
ed
Fall
-th
rou
gh
Sort
ed
PL+
Lim
e1.
00M
ix C
hip
s3.
003.
16
Sort
ed
Mix
Ch
ips
3.00
PL
0.95
7.80
**Fa
ll-th
rou
gh
Ch
ips/
PL/
Lim
e11
.40
Lim
e0.
050.
45
Sort
ed
200
lbs
7.55
tota
l4.
0011
.40
**Fa
ll-th
rou
gh
200
lbs
4.86
Aft
er
PL
Ch
ips
7.55
4.86
Re
cove
red
Dry
Act
ual
Ash
PK
Cl
Na
Ca
SiS
Wo
od
chip
s ch
ar3.
453.
450.
090.
0022
0.00
900.
0002
0.00
110.
0221
0.00
570.
0015
Wo
od
chip
s ch
ar
PL
Ash
1.00
1.00
1.00
0.05
110.
0719
0.00
170.
0178
0.24
940.
1340
0.00
99P
L as
h
Re
st o
f G
asif
ier
19.5
019
.45
10.3
50.
5247
0.78
270.
0889
0.19
082.
9060
1.11
730.
0703
Re
st o
f G
asif
ier
Be
low
Gra
te6.
106.
102.
930.
1480
0.21
170.
0520
0.05
840.
9829
0.23
350.
0251
Be
low
Gra
te
HEX
1.40
1.38
0.87
0.03
630.
0594
0.08
170.
0110
0.32
650.
0171
0.01
91H
EX
Filt
er
1.60
1.54
0.66
0.02
600.
0632
0.06
540.
0095
0.22
360.
0121
0.02
05Fi
lte
r
tota
l33
.05
32.9
215
.90
0.78
821.
1978
0.28
990.
2887
4.71
061.
5198
0.14
65to
tal
102.
9%10
0.1%
100.
0%99
.5%
97.3
%R
atio
OU
T/IN
Ash
Pe
rce
nt
dif
f:0.
15%
2.69
%%
Dif
fere
nce
105.
7%10
2.9%
102.
7%10
2.3%
100%
No
rm. t
o C
a
0.46
70.
529
0.69
90.
715
0.60
30.
742
0.83
00.
599
0.43
60.
401
Mo
ist
(% A
s R
ec)
LOI (
% D
ry B
asis
)Si
O2
(%)
Al2
O3
(%)
Fe2O
3 (%
)C
aO (
%)
MgO
(%
)N
a2O
(%
)K
2O (
%)
TiO
2 (%
)P
2O5
(%)
BaO
(%
)M
nO
2 (%
)SO
3 (%
)Sr
O (
%)
Cl (
%)
PL
Ash
5/1
70.
000.
0628
.69
3.87
1.48
34.9
24.
962.
408.
670.
1011
.71
0.07
0.45
2.48
0.06
0.17
Re
st o
f G
asif
ier
5/17
0.25
46.7
723
.09
3.39
1.74
39.2
76.
022.
489.
110.
0711
.61
0.09
0.70
1.70
0.07
0.86
Be
low
Gas
ifie
r 5/
170.
0751
.98
17.0
72.
141.
5746
.98
4.80
2.69
8.71
0.05
11.5
80.
130.
662.
140.
101.
78
HEX
5/1
71.
2436
.92
4.20
1.46
1.61
52.3
86.
631.
708.
200.
009.
520.
231.
205.
470.
159.
37
Filt
er
5/17
3.93
56.8
33.
911.
192.
8647
.15
5.23
1.93
11.4
70.
008.
990.
291.
437.
720.
179.
86
Wo
od
chip
Ch
ar97
.48
Ele
me
nts
IN [
lbs]
Ele
me
nts
OU
T [l
bs]
Mo
istu
re C
on
ten
t (w
et
bas
is)
PL MIX
Oxi
de
to
Ele
me
nt
Mu
ltip
lie
r
Ou
tpu
t A
sh A
nal
yse
s
Ou
tpu
t [l
bs]
Gasifier
Inp
ut
[lb
s], 4
lbs
Lim
est
on
e
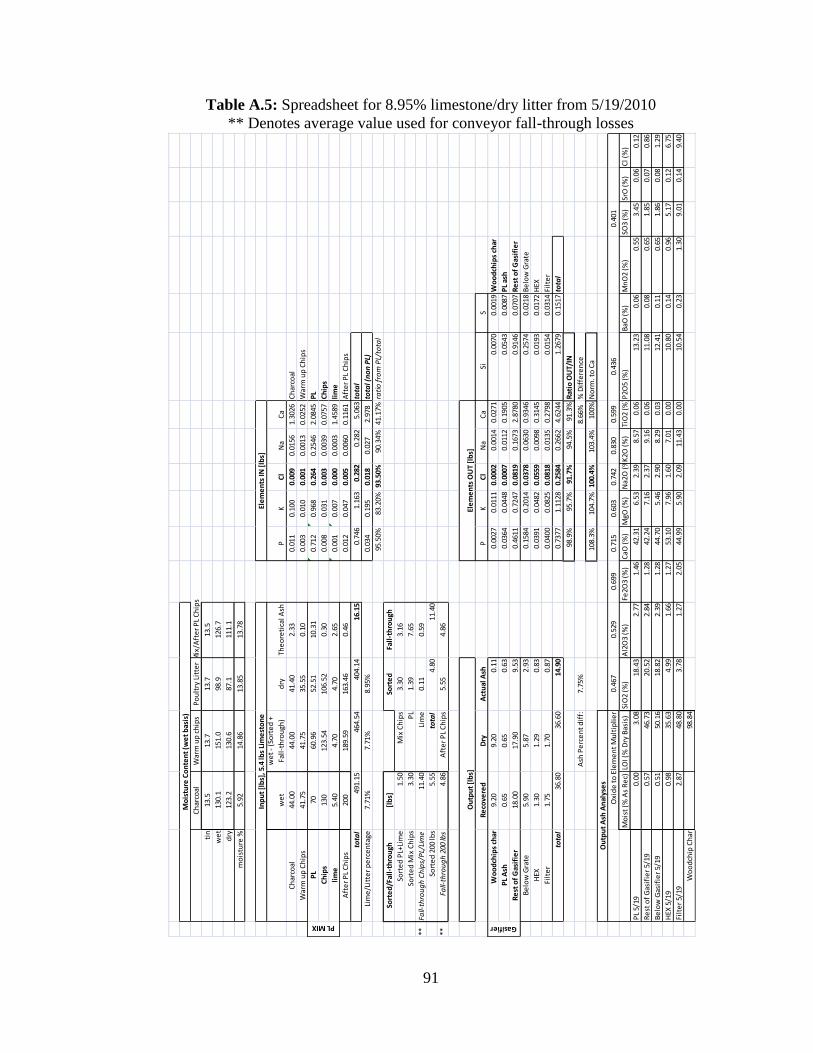
91
Table A.5: Spreadsheet for 8.95% limestone/dry litter from 5/19/2010
** Denotes average value used for conveyor fall-through losses
Ch
arco
alW
arm
up
ch
ips
Po
ult
ry L
itte
rM
ix/A
fte
r P
L C
hip
s
tin
13.5
13.7
13.7
13.5
we
t13
0.1
151.
098
.912
6.7
dry
123.
213
0.6
87.1
111.
1
mo
istu
re %
5.92
14.8
613
.85
13.7
8
we
t
we
t -
(So
rte
d +
Fall
-th
rou
gh)
dry
The
ore
tica
l Ash
PK
Cl
Na
Ca
Ch
arco
al44
.00
44.0
041
.40
2.33
0.01
10.
100
0.00
90.
0156
1.30
26C
har
coal
War
m u
p C
hip
s41
.75
41.7
535
.55
0.10
0.00
30.
010
0.00
10.
0013
0.02
52W
arm
up
Ch
ips
PL
7060
.96
52.5
110
.31
0.71
20.
968
0.26
40.
2546
2.08
45P
L
Ch
ips
130
123.
5410
6.52
0.30
0.00
80.
031
0.00
30.
0039
0.07
57C
hip
s
lim
e5.
404.
704.
702.
650.
001
0.00
70.
000
0.00
031.
4589
lim
e
Aft
er
PL
Ch
ips
200
189.
5916
3.46
0.46
0.01
20.
047
0.00
50.
0060
0.11
61A
fte
r P
L C
hip
s
tota
l49
1.15
464.
5440
4.14
16.1
50.
746
1.16
30.
282
0.28
25.
063
tota
l
Lim
e/L
itte
r p
erc
en
tage
7.71
%7.
71%
8.95
%0.
034
0.19
50.
018
0.02
72.
978
tota
l (n
on
PL)
95.5
0%83
.20%
93.5
0%90
.34%
41.1
7%ra
tio
fro
m P
L/to
tal
Sort
ed
/Fal
l-th
rou
gh[l
bs]
Sort
ed
Fall
-th
rou
gh
Sort
ed
PL+
Lim
e1.
50M
ix C
hip
s3.
303.
16
Sort
ed
Mix
Ch
ips
3.30
PL
1.39
7.65
**Fa
ll-th
rou
gh
Ch
ips/
PL/
Lim
e11
.40
Lim
e0.
110.
59
Sort
ed
200
lbs
5.55
tota
l4.
8011
.40
**Fa
ll-th
rou
gh
200
lbs
4.86
Aft
er
PL
Ch
ips
5.55
4.86
Re
cove
red
Dry
Act
ual
Ash
PK
Cl
Na
Ca
SiS
Wo
od
chip
s ch
ar9.
209.
200.
110.
0027
0.01
110.
0002
0.00
140.
0271
0.00
700.
0019
Wo
od
chip
s ch
ar
PL
Ash
0.65
0.65
0.63
0.03
640.
0448
0.00
070.
0112
0.19
050.
0543
0.00
87P
L as
h
Re
st o
f G
asif
ier
18.0
017
.90
9.53
0.46
110.
7247
0.08
190.
1673
2.87
800.
9146
0.07
07R
est
of
Gas
ifie
r
Be
low
Gra
te5.
905.
872.
930.
1584
0.20
140.
0378
0.06
300.
9346
0.25
740.
0218
Be
low
Gra
te
HEX
1.30
1.29
0.83
0.03
910.
0482
0.05
590.
0098
0.31
450.
0193
0.01
72H
EX
Filt
er
1.75
1.70
0.87
0.04
000.
0825
0.08
180.
0135
0.27
980.
0154
0.03
14Fi
lte
r
tota
l36
.80
36.6
014
.90
0.73
771.
1128
0.25
840.
2662
4.62
441.
2679
0.15
17to
tal
98.9
%95
.7%
91.7
%94
.5%
91.3
%R
atio
OU
T/IN
Ash
Pe
rce
nt
dif
f:7.
75%
8.66
%%
Dif
fere
nce
108.
3%10
4.7%
100.
4%10
3.4%
100%
No
rm. t
o C
a
0.46
70.
529
0.69
90.
715
0.60
30.
742
0.83
00.
599
0.43
60.
401
Mo
ist
(% A
s R
ec)
LOI (
% D
ry B
asis
)Si
O2
(%)
Al2
O3
(%)
Fe2O
3 (%
)C
aO (
%)
MgO
(%
)N
a2O
(%
)K2O
(%
)Ti
O2
(%)P
2O5
(%)
BaO
(%
)M
nO
2 (%
)SO
3 (%
)Sr
O (
%)
Cl (
%)
PL
5/19
0.00
3.08
18.4
32.
771.
4642
.31
6.53
2.39
8.57
0.06
13.2
30.
060.
553.
450.
060.
12
Re
st o
f G
asif
ier
5/19
0.57
46.7
320
.52
2.84
1.28
42.2
47.
162.
379.
160.
0611
.08
0.08
0.65
1.85
0.07
0.86
Be
low
Gas
ifie
r 5/
190.
5150
.16
18.8
22.
391.
2844
.70
5.46
2.90
8.29
0.03
12.4
10.
110.
651.
860.
081.
29
HEX
5/1
90.
9835
.63
4.99
1.66
1.27
53.1
07.
961.
607.
010.
0010
.80
0.14
0.96
5.17
0.12
6.75
Filt
er
5/19
2.87
48.8
03.
781.
272.
0544
.99
5.90
2.09
11.4
30.
0010
.54
0.23
1.30
9.01
0.14
9.40
Wo
od
chip
Ch
ar98
.84
Gasifier
Mo
istu
re C
on
ten
t (w
et
bas
is)
PL MIX
Inp
ut
[lb
s], 5
.4 lb
s Li
me
sto
ne
Ele
me
nts
IN [
lbs]
Ou
tpu
t A
sh A
nal
yse
s
Oxi
de
to
Ele
me
nt
Mu
ltip
lie
r
Ele
me
nts
OU
T [l
bs]
Ou
tpu
t [l
bs]

92
Table A.6: Spreadsheet for 4.31% limestone/dry litter from 6/3/2010
Ch
arco
alW
arm
up
ch
ips
Po
ult
ry L
itte
rM
ix/A
fte
r P
L C
hip
s
tin
13.5
13.7
13.5
13.7
we
t18
2.8
145.
316
3.2
165.
9
dry
174.
113
3.1
142.
414
4.3
mo
istu
re %
5.14
9.27
13.8
914
.19
we
t
we
t -
(So
rte
d +
Fall
th
rou
gh)
dry
The
ore
tica
l Ash
PK
Cl
Na
Ca
Ch
arco
al45
.55
45.5
543
.21
2.44
0.01
10.
104
0.01
00.
0163
1.35
96C
har
coal
War
m u
p C
hip
s61
.90
61.9
056
.16
0.16
0.00
40.
016
0.00
20.
0021
0.03
99W
arm
up
Ch
ips
PL
7060
.62
52.2
010
.25
0.70
80.
962
0.26
20.
2531
2.07
19P
L
Mix
Ch
ips
130
123.
7310
6.17
0.30
0.00
80.
031
0.00
30.
0039
0.07
54C
hip
s
Lim
e2.
602.
252.
251.
270.
000
0.00
30.
000
0.00
020.
6986
lim
e
Aft
er
PL
Ch
ips
200
186.
0015
9.60
0.45
0.01
10.
046
0.00
50.
0059
0.11
34A
fte
r P
L C
hip
s
tota
l51
0.05
480.
0541
9.59
14.8
50.
743
1.16
30.
281
0.28
14.
359
tota
l
Lim
e/L
itte
r p
erc
en
tage
3.71
%3.
71%
4.31
%0.
035
0.20
10.
019
0.02
82.
287
tota
l (n
on
PL)
95.3
3%82
.70%
93.1
7%89
.94%
47.5
3%ra
tio
fro
m P
L/to
tal
Sort
ed
/Fal
l-th
rou
gh[l
bs]
Sort
ed
Fall
-th
rou
gh
Sort
ed
PL+
Lim
e2.
70M
ix C
hip
s3.
253.
02
Sort
ed
Mix
Ch
ips
3.25
PL
2.60
6.78
Fall-
thro
ug
h C
hip
s/P
L/Li
me
10.0
5Li
me
0.10
0.25
Sort
ed
200
lbs
9.35
tota
l5.
9510
.05
Fall-
thro
ug
h 2
00 lb
s4.
65A
fte
r P
L C
hip
s9.
354.
65
Re
cove
red
Dry
Act
ual
Ash
PK
Cl
Na
Ca
Wo
od
chip
s ch
ar7.
357.
350.
740.
0186
0.07
630.
0016
0.00
970.
1865
Wo
od
chip
s ch
ar
Gas
ifie
r18
.55
17.8
811
.81
0.72
430.
9185
0.07
060.
2454
3.50
36G
asif
ier
Aft
er
Gra
te6.
806.
683.
450.
1809
0.17
450.
2160
0.05
941.
2071
Aft
er
Gra
te
tota
l32
.70
16.0
00.
9238
1.16
930.
2882
0.31
444.
8972
tota
l
124.
41%
100.
52%
102.
47%
111.
72%
112.
35%
Rat
io O
UT/
IN
Ash
Pe
rce
nt
dif
f:-7
.74%
-12.
35%
% D
iffe
ren
ce
110.
7%89
.5%
91.2
%99
.4%
100%
No
rm. t
o C
a
0.46
70.
529
0.69
90.
715
0.60
30.
742
0.83
00.
599
0.43
60.
401
Mo
ist
(% A
s R
ec)
LOI (
% D
ry B
asis
)Si
O2
(%)
Al2
O3
(%)
Fe2O
3 (%
)C
aO (
%)
MgO
(%
)N
a2O
(%
)K
2O (
%)
TiO
2 (%
)P
2O5
(%)
BaO
(%
)M
nO
2 (%
)SO
3 (%
)Sr
O (
%)
Cl (
%)
Gas
ifie
r 6/
33.
5933
.94
19.4
02.
441.
2141
.49
5.79
2.80
9.36
0.04
14.0
50.
030.
442.
390.
110.
60
Aft
er
Gra
te 6
/31.
7448
.33
12.7
11.
681.
2848
.92
5.27
2.32
6.09
0.02
12.0
00.
060.
554.
090.
166.
26
Mo
istu
re C
on
ten
t (w
et
bas
is)
PL MIX
Ou
tpu
t [l
bs]
Inp
ut
[lb
s], 2
.6 lb
s Li
me
sto
ne
Ele
me
nts
IN [
lbs]
Ele
me
nts
OU
T [l
bs]
Ou
tpu
t A
sh A
nal
yse
s
Oxi
de
to
Ele
me
nt
Mu
ltip
lie
r
Gasifier

93
Table A.7: Spreadsheet for 6.69% limestone/dry litter from 5/26/2010
** Denotes average value used for conveyor fall-through losses
Ch
arco
alW
arm
up
ch
ips
Po
ult
ry L
itte
rM
ix/A
fte
r P
L C
hip
s
tin
13.7
13.7
13.5
13.5
we
t11
5.1
121.
314
6.5
157.
0
dry
110.
111
6.5
127.
113
6.9
mo
istu
re %
4.93
4.46
14.5
914
.01
we
t
we
t -
(So
rte
d +
Fall
th
rou
gh)
dry
The
ore
tica
l Ash
PK
Cl
Na
Ca
Ch
arco
al36
.25
36.2
534
.46
1.94
0.00
90.
083
0.00
80.
0130
1.08
44C
har
coal
War
m u
p C
hip
s39
.00
39.0
037
.26
0.10
0.00
30.
011
0.00
10.
0014
0.02
65W
arm
up
Ch
ips
PL
7061
.35
52.4
010
.29
0.71
10.
966
0.26
30.
2541
2.08
01P
L
Mix
Ch
ips
130
124.
6410
7.18
0.30
0.00
80.
031
0.00
30.
0040
0.07
61C
hip
s
lim
e4.
003.
513.
511.
970.
001
0.00
50.
000
0.00
031.
0877
lim
e
Aft
er
PL
Ch
ips
200
186.
9916
0.80
0.45
0.01
10.
047
0.00
50.
0059
0.11
42A
fte
r P
L C
hip
s
tota
l47
9.25
451.
7439
5.61
15.0
60.
742
1.14
30.
280
0.27
94.
469
tota
l
Lim
e/L
itte
r p
erc
en
tage
5.71
%5.
71%
6.69
%0.
031
0.17
70.
017
0.02
52.
389
tota
l (n
on
PL)
95.7
6%84
.52%
94.0
1%91
.20%
46.5
4%ra
tio
fro
m P
L/to
tal
Sort
ed
/Fal
l-th
rou
gh[l
bs]
Sort
ed
Fall
-th
rou
gh
Sort
ed
PL+
Lim
e0.
90M
ixe
d C
hip
s2.
203.
16
Sort
ed
mix
Ch
ips
2.20
PL
0.85
7.80
**Fa
ll-th
rou
gh
Ch
ips/
PL/
Lim
e11
.40
Lim
e0.
050.
45
Sort
ed
200
lbs
8.15
tota
l3.
1011
.40
**Fa
ll-th
rou
gh
200
lbs
4.86
Aft
er
PL
Ch
ips
8.15
4.86
Re
cove
red
Dry
Act
ual
Ash
PK
Cl
Na
Ca
Wo
od
chip
s ch
ar6.
756.
750.
360.
0092
0.03
760.
0008
0.00
480.
0920
Wo
od
chip
s ch
ar
Gas
ifie
r19
.25
19.2
112
.09
0.67
130.
8964
0.06
760.
2515
3.40
76G
asif
ier
Aft
er
Gra
te5.
555.
482.
670.
1546
0.09
060.
1609
0.04
270.
9180
Aft
er
Gra
te
tota
l31
.55
15.1
20.
8352
1.02
460.
2293
0.29
904.
4175
tota
l
112.
53%
89.6
6%81
.94%
107.
31%
98.8
5%R
atio
OU
T/IN
Ash
Pe
rce
nt
dif
f:-0
.41%
1.15
%%
Dif
fere
nce
113.
8%90
.7%
82.9
%10
8.6%
100%
No
rm. t
o C
a
0.46
70.
529
0.69
90.
715
0.60
30.
742
0.83
00.
599
0.43
60.
401
Mo
ist
(% A
s R
ec)
LOI (
% D
ry B
asis
)SiO
2 (%
)A
l2O
3 (%
)Fe
2O3
(%)
CaO
(%
)M
gO (
%)N
a2O
(%
)K
2O (
%)
TiO
2 (%
)P
2O5
(%)
BaO
(%
)M
nO
2 (%
)SO
3 (%
)Sr
O (
%)
Cl (
%)
Gas
ifie
r 5/
260.
2237
.08
21.7
43.
131.
5839
.45
6.36
2.81
8.93
0.09
12.7
30.
090.
631.
980.
060.
56
Aft
er
Gra
te 5
/26
1.26
51.2
112
.05
1.97
1.61
48.0
46.
072.
154.
080.
0613
.25
0.14
0.88
4.96
0.10
6.02
Wo
od
chip
Ch
ar94
.63
Ou
tpu
t A
sh A
nal
yse
s
Oxi
de
to
Ele
me
nt
Mu
ltip
lie
r
Ele
me
nts
OU
T [l
bs]
Gasifier
Inp
ut
[lb
s], 4
lbs
Lim
est
on
e
Ou
tpu
t [l
bs]
Ele
me
nts
IN [
lbs]
Mo
istu
re C
on
ten
t (w
et
bas
is)
PL MIX

94
Table A.8: Spreadsheet for 8.92% limestone/dry litter from 6/1/2010
Ch
arco
alW
arm
up
ch
ips
Po
ult
ry L
itte
rM
ix/A
fte
r P
L C
hip
s
tin
13.5
13.7
13.7
13.5
we
t13
2.5
144.
211
6.4
144.
2
dry
125.
113
1.3
102.
512
9.6
mo
istu
re %
6.22
9.89
13.5
311
.17
we
t
we
t -
(So
rte
d +
Fall
th
rou
gh)
dry
The
ore
tica
l Ash
PK
Cl
Na
Ca
Ch
arco
al37
.10
37.1
034
.79
1.96
0.00
90.
084
0.00
80.
0131
1.09
48C
har
coal
War
m u
p C
hip
s35
.10
35.1
031
.63
0.09
0.00
20.
009
0.00
10.
0012
0.02
25W
arm
up
Ch
ips
PL
7059
.85
51.7
510
.16
0.70
20.
954
0.26
00.
2509
2.05
41P
L
Mix
Ch
ips
130
123.
2910
9.51
0.31
0.00
80.
032
0.00
30.
0040
0.07
78C
hip
s
Lim
e5.
404.
624.
622.
600.
001
0.00
70.
000
0.00
031.
4324
lim
e
Aft
er
PL
Ch
ips
200
186.
5016
5.67
0.46
0.01
20.
048
0.00
50.
0061
0.11
77A
fte
r P
L C
hip
s
tota
l47
7.60
446.
4539
7.97
15.5
80.
734
1.13
30.
277
0.27
64.
799
tota
l
Lim
e/L
itte
r p
erc
en
tage
7.71
%7.
71%
8.92
%0.
032
0.18
00.
017
0.02
52.
745
tota
l (n
on
PL)
95.6
5%84
.14%
93.8
9%91
.01%
42.8
0%ra
tio
fro
m P
L/to
tal
Sort
ed
/Fal
l-th
rou
gh[l
bs]
Sort
ed
Fall
-th
rou
gh
Sort
ed
PL+
Lim
e1.
50M
ix C
hip
s3.
403.
32
Sort
ed
Mix
Ch
ips
3.40
PL
1.39
8.76
Fall-
thro
ug
h C
hip
s/P
L/Li
me
12.7
5Li
me
0.11
0.68
Sort
ed
200
lbs
8.40
tota
l4.
9012
.75
Fall-
thro
ug
h 2
00 lb
s5.
10A
fte
r P
L C
hip
s8.
405.
10
Re
cove
red
Dry
Act
ual
Ash
PK
Cl
Na
Ca
Wo
od
chip
s ch
ar7.
457.
450.
460.
0116
0.04
750.
0010
0.00
600.
1162
Wo
od
chip
s ch
ar
Gas
ifie
r18
.15
18.0
98.
220.
4398
0.73
830.
0755
0.13
492.
4171
Gas
ifie
r
Aft
er
Gra
te6.
256.
192.
950.
1504
0.24
820.
1642
0.04
940.
9486
Aft
er
Gra
te
tota
l31
.85
11.6
30.
6017
1.03
410.
2407
0.19
033.
4820
tota
l
82.0
1%91
.23%
87.0
1%69
.04%
72.5
5%R
atio
OU
T/IN
Pe
rce
nt
dif
f:25
.36%
27.4
5%%
Dif
fere
nce
113.
0%12
5.7%
119.
9%95
.2%
100%
No
rm. t
o C
a
0.46
70.
529
0.69
90.
715
0.60
30.
742
0.83
00.
599
0.43
60.
401
Mo
ist
(% A
s R
ec)
LOI (
% D
ry B
asis
)Si
O2
(%)
Al2
O3
(%)
Fe2O
3 (%
)C
aO (
%)
MgO
(%
)N
a2O
(%
)K2O
(%
)Ti
O2
(%)
P2O
5 (%
)B
aO (
%)
Mn
O2
(%)
SO3
(%)
SrO
(%
)C
l (%
)
Gas
ifie
r 6/
10.
3554
.56
17.6
43.
431.
5741
.15
6.75
2.21
10.8
20.
0812
.26
0.11
0.69
2.52
0.08
0.92
Aft
er
Gra
te 6
/10.
9352
.32
12.5
62.
111.
5844
.96
5.82
2.25
10.1
30.
0211
.67
0.11
0.78
3.61
0.10
5.56
Wo
od
chip
Ch
ar93
.85
Ou
tpu
t A
sh A
nal
yse
s
Oxi
de
to
Ele
me
nt
Mu
ltip
lie
r
Ele
me
nts
OU
T [l
bs]
Gasifier
Mo
istu
re C
on
ten
t (w
et
bas
is)
PL MIX
Ou
tpu
t [l
bs]
Inp
ut
[lb
s], 5
.4 lb
s Li
me
sto
ne
Ele
me
nts
IN [
lbs]

95
Appendix B
Sample Calculations
To calculate the input mass of K from poultry litter in the 6.49% limestone
experiment in Table A.4:
Similarly, the amount of K from each biomass input can be determined. The mass of K
from each source can then simply be summed to get total K put in the gasifier.
To calculate the mass of K recovered from the char Below the Grate:

96
Similarly, the amount of K from each location can be determined. The mass of K from
each location can then simply be summed to get total K recovered.
To find the amount of poultry litter in the mixture of fines collected from below
the conveyor in Table A.4:

97
Appendix C
Uncertainty Analysis
Uncertainty associated with measured quantities is presented in this appendix,
however the largest sources of uncertainty in the experiments are unquantifiable and
derive from mixing and sampling of char and biomass as well as unknown losses. The
uncertainty of various measuring devices is shown in Table C.1.
Table C.1: Uncertainty of instruments used
Device Units Uncertainty
Thermocouples ˚C ±2.2˚C
CAI Nova Analyzer % Volume
CO: ±0.6%
CO₂: ±0.6%
CH₄: ±0.3%
O₂: ±0.5%
HiTech K1550
Analyzer % Volume H₂: ±2%
Ohaus CD-11 Digital
Scale lbs ±0.05 lbs

98
The uncertainty estimates from the ash, moisture, and elemental analyses are shown in
Table C.2.
Table C.2: Uncertainty of biomass and char analyses, units are % mass. Oxide and Cl are
on an Ash basis
Parameter Uncertainty
Moisture, as received ±0.1%
Ash, dry basis ±0.1%
Na2O y = 0.0024x + 0.0205
MgO y = 0.0035x + 0.0291
Al2O3 y = 0.0026x + 0.0849
SiO2 y = 0.0028x + 0.1343
P2O5 y = 0.0158x + 0.0056
SO3 y = 0.0145x + 0.0821
K2O y = 0.0101x + 0.0104
CaO y = 0.0056x + 0.0759
TiO2 y = 0.0155x + 0.0364
MnO2 y = 0.01x + 0.0046
Fe2O3 y = 0.0104x + 0.0234
SrO y = 0.0556x + 0.0015
BaO y = 0.0087x + 0.004
Cl y = 0.028x + 0.02
Because uncertainty propagation through to the calculated retention percentage is
dependent on the particular elemental oxide and its concentration, a general equation will
be formulated and example result calculated. The general form of the propagated
uncertainty equation, as denoted by Beckwith, 1990 for a function is (31):
(C.1)
For the actual weight of feedstock i put into the gasifier ( ), the measure weight
( ) minus the weight of the sorted feedstock ( ) and conveyor loss weight
( ) is:

99
(C.2)
(C.3)
(C.4)
Using the uncertainty of the electronic scale (±0.05 lbs) for each measured weight:
(C.5)
The total mass calculated for each element E, from each feedstock i put into the
gasifier is then:
**Note:
**Note: Oxide to Element Conversion factor
is from eq. (3.4),
and is a constant
Uncertainty of is:
(C.7)

100
(C.8)
(C.9)
It becomes apparent at this point, the dependence of uncertainty on the specific element
and feedstock of interest. The equations for were given in Table C.2. The
uncertainty of Moisture % and % Ash can be found in the same table, and was found
in eq. (C.5).
(C.10)
From here, values will be used from the K in poultry litter data of the 6.43% limestone
experiment in Table A.4. This will represent a general value of uncertainty.
From Table A.4: =61.26 lbs, = (100-11.90) = 88.1%,
=0.995 lbs
From Table A.1: = 19.63%
From Table A.2: = 11.31%
From Table C.2: = 0.0101( + 0.0104 = ±0.125
(C.11)

101
Repeating equation (C.10) for the rest of the sources of K:
Using a similar approach as (C.2)-(C.4), the uncertainty for total K input (found to be
1.196 lbs) is:
(C.12)
Similarly, the uncertainty for the total K recovered in the char is:
(C.13)
Therefore, uncertainty of the ratio
, presented as “retention percent K” is:
(C.14)

102
Uncertainties for other retention percentages can be found similarly.

103
Appendix D
Additional Figures
Figure D.1: Dry syngas composition vs. Time for a standard woodchip run, fluctuations
in composition are typical, with an average HHV ~5400 kJ/m³

104
Figure D.2: Dry syngas composition vs. time during flue gas recirculation experiment
(Section 4.1.2)

105
Figure D.3: Dry syngas composition vs. time during raw litter, 5% limestone, and 60:40
(woodchip:litter) experiment (Section 4.1.4)

106
Figure D.4: Dry syngas composition vs. time during 8.95% Limestone/Dry Litter
experiment. Very typical of all experiments in contaminant retention study (Section 4.2)