experimental study of pressure and main gas ingestion
TRANSCRIPT

Experimental Study of Pressure and Main Gas Ingestion Distributions in a Model
Rotor-Stator Disk Cavity
by
Jayanth kumar Thiagarajan
A Thesis Presented in Partial Fulfillment
of the Requirements for the Degree
Master of Science
Approved February 2013 by the
Graduate Supervisory Committee:
Ramendra P. Roy, Chair
Taewoo Lee
Marc Mignolet
ARIZONA STATE UNIVERSITY
May 2013
i
ABSTRACT
Ingestion of high temperature mainstream gas into the rotor-stator cavities
of a gas turbine is one of the major problems faced by the turbine designers. The
ingested gas heats up rotor disks and induces higher thermal stresses on them,
giving rise to durability concern. Ingestion is usually reduced by installing seals
on the rotor and stator rims and by purging the disk cavity by secondary air bled
from the compressor discharge. The geometry of the rim seals and the secondary
air flow rate, together, influence the amount of gas that gets ingested into the
cavities. Since the amount of secondary air bled off has a negative effect on the
gas turbine thermal efficiency, one goal is to use the least possible amount of
secondary air. This requires a good understanding of the flow and ingestion fields
within a disk cavity.
In the present study, the mainstream gas ingestion phenomenon has been
experimentally studied in a model single-stage axial flow gas turbine. The turbine
stage featured vanes and blades, and rim seals on both the rotor and stator.
Additionally, the disk cavity contained a labyrinth seal radially inboard which
effectively divided the cavity into a rim cavity and an inner cavity.
Time-average static pressure measurements were obtained at various
radial positions within the disk cavity, and in the mainstream gas path at three
axial locations at the outer shroud spread circumferentially over two vane pitches.
The time-average static pressure in the main gas path exhibited a periodic

ii
asymmetry following the vane pitch whose amplitude diminished with increasing
distance from the vane trailing edge. The static pressure distribution increased
with the secondary air flow rate within the inner cavity but was found to be
almost independent of it in the rim cavity.
Tracer gas (CO2) concentration measurements were conducted to
determine the sealing effectiveness of the rim seals against main gas ingestion.
For the rim cavity, the sealing effectiveness increased with the secondary air flow
rate. Within the inner cavity however, this trend reversed –this may have been due
to the presence of rotating low-pressure flow structures inboard of the labyrinth
seal.

iii
ACKNOWLEDGMENTS
I sincerely thank Professor Ramendra P. Roy for his constant guidance and
encouragement. I thank Professor Taewoo Lee and Professor Marc Mignolet for
agreeing to be on my committee. I also would like to thank my colleague Parag S.
Pathak for his contribution to this work through his selfless involvement and
helpful discussions.
Many thanks to past members of the Heat transfer Lab, in particular,
Jagdish Balasubramanian and Nihal Junnarkar for their invaluable source of help
and guidance. Special thanks to the personnel of the Engineering Technical
Services, Dennis Golabiewski and Martin Johnson for their help in putting
together various assemblies and design insights.
Thanks are due to my parents and friends for their support and help.

iv
TABLE OF CONTENTS
Page
LIST OF TABLES ............................................................................................ viii
LIST OF FIGURES ............................................................................................ ix
NOMENCLATURE ........................................................................................... xi
CHAPTER
1 INTRODUCTION .......................................................................1
1.1 Background .............................................................................1
1.2 Literature Survey ....................................................................4
1.3 Overview of the Present Work ................................................9
2 RESEARCH FACILITY AND EXPERIMENTS ......................10
2.1 Experimental Facility ............................................................10
2.1.1 The Turbine Stag ........................................................13
2.2 Time-Average Static Gage Pressure Measurement ..............17
2.2.1 System Components ...................................................17
2.2.2 Experimental Procedure .............................................19
2.3 Mainstream Gas Ingestion Measurement..............................21
2.3.1 System Components ...................................................21
2.3.2 Experimental Procedure .............................................23
3 RESULTS AND DISCUSSION .................................................25
3.1 Experimental Conditions ......................................................25
3.2 Time-Average Static Pressure Distribution ..........................26
v
CHAPTER Page
3.3 Mainstream Gas Ingestion Distribution ................................34
3.3.1 Measurements on the Stator Surface ..........................35
3.3.2 Axial Traverse Measurements in the Disk Cavity ......35
3.4 Relating the Measured Ingestion Distribution to the
Disk Cavity Velocity Field ..................................................38
4 CONCLUSION ...........................................................................41
4.1 Concluding Remarks .............................................................41
4.2 Recommendations for Future Work......................................42
REFERENCES ...................................................................................................44
APPENDIX
A MEASUREMENT UNCERTAINTY .........................................48

vi
LIST OF TABLES
TABLE PAGE
3.1 Experimental Conditions …………………………………….... 25
3.2 Measured boundary conditions………………………………… 26

vii
LIST OF FIGURES
FIGURE PAGE
1.1 Schematic diagram - gas turbine internal secondary air system
(Courtesy: The Jet Engine, 1986) .................................................... 4
2.1 Axial Flow Turbine experimental facility. ....................................... 11
2.2 Schematic of ASU Turbine rig. ....................................................... 11
2.3 Schematic diagram of the single-stage rim-seal arrangement (C:
Gas concentration tap, P: time-average static pressure tap, T:
thermocouple); all dimensions are in mm. ....................................... 15
2.4 The blade and vane arrangement. .................................................... 16
2.5 Pressure measurement system......................................................... 17
2.6 Schematic of static pressure tap on stator disk ................................ 19
2.7 Arrangement for mainstream gas ingestion measurement for the
single-stage turbine configuration .................................................... 22
3.1 Circumferential distributions of time-average static gage pressure
at the outer shroud, vane platform and stator near its rim – Revax=
1.12×10⁵, Reφ=6.14×10
5, cw = 1540. ............................................... 27

viii
FIGURE PAGE
3.2 Effect of cw on the circumferential distributions of time-average
static pressure at the outer shroud, vane platform and stator near
its rim- Revax= 1.12×10⁵, Reφ=6.14×10
5 (experimental set I). ......... 29
3.3 Effect of cw on the circumferential distributions of time-average
static pressure at the outer shroud, vane platform and stator near
its rim- Revax= 9.27×10⁴, Reφ=4.85×10
5(experimental set II). ........ 29
3.4 Effect of cw on the radial distributions of time-average static
pressure in the disk cavity at the stator surface- Revax= 1.12×10⁵,
Reφ=6.14×10⁵(experimental set I). .................................................. 30
3.5 Effect of cw on the radial distributions of time-average static
pressure in the disk cavity at the stator surface- Revax= 9.27×10⁴,
Reφ=4.85×10⁵(experimental set II). ................................................. 30
3.6 Circumferential distributions of time-average static pressure at
the outer shroud, vane platform and stator surface near its rim –
Revax= 1.12×10⁵, Reφ=6.14×10
5, cw = 770. ...................................... 32
3.7 Circumferential distributions of time-average static pressure at
the outer shroud, vane platform and stator surface near its rim –
Revax= 1.12×10⁵,Reφ=6.14×10
5, cw = 1540. ..................................... 32
ix
FIGURE PAGE
3.8 Circumferential distributions of time-average static pressure at
the outer shroud, vane platform and stator surface near its rim –
Revax= 1.12×10⁵,Reφ=6.14×10
5, cw = 3080. ..................................... 33
3.9 Circumferential distributions of time-average static pressure at
the outer shroud, vane platform and stator surface near its rim –
Revax= 1.12×10⁵,Reφ=6.14×10
5, cw = 4621. ..................................... 33
3.10 Circumferential distributions of time-average static pressure at
the outer shroud, vane platform and stator surface near its rim –
Revax= 1.12×10⁵,Reφ=6.14×10
5, cw = 770. ....................................... 34
3.11 Effect of cw on the radial distributions of sealing effectiveness in
the disk cavity at the stator disk- Revax=1.12×10⁵,Reφ=6.14×10
5. ... 36
3.12 Effect of cw on the radial distributions of sealing effectiveness in
the disk cavity at the stator disk- Revax=9.27×10⁴,Reφ=4.85×10
5. ... 36
3.13 Effect of cw on the radial distributions of sealing effectiveness
within the rim-cavity- Revax= 1.12×10⁵,Reφ=6.14×10
5. .................. 37
3.14 Effect of cw on the radial distributions of sealing effectiveness
within the rim-cavity- Revax= 9.27×10⁴, Reφ=4.85×10
5. ................. 37

x
FIGURE PAGE
3.15 Fluid radial velocity from instantaneous velocity vector maps at
four circumferential sector in the cavity; 4 mm from the rotor
surface - Revax= 1.12×10⁵, Reφ=6.14×10
5, cw =1540. ...................... 39
3.16 Fluid radial velocity from instantaneous velocity vector maps at
four circumferential sector in the cavity; 4 mm from the rotor
surface - Revax= 1.12×10⁵, Reφ=6.14×10
5, cw =3080. ...................... 39
3.17 Fluid radial velocity from instantaneous velocity vector maps at
four circumferential sector in the cavity; 4 mm from the rotor
surface - Revax= 1.12×10⁵, Reφ=6.14×10
5, cw =4621. ...................... 40

xi
NOMENCLATURE
b outer radius of disk cavity
C tracer (CO2) gas concentration
Cvax vane axial chord length
cw non-dimensional mass flow rate of purge air, = 𝑚 𝑝𝑢𝑟𝑔𝑒
𝜇𝑏
cw,fd non-dimensional free disk pumping flow rate, = 0.219𝑅𝑒𝛷0.8
m purge mass flow rate of purge air (kg/s)
p instantaneous static gage pressure
𝑝 time-average static gage pressure
pamb ambient pressure
Revax main air flow Reynolds number, = ρ VaxCvax / μ
ReΦ disk rotational Reynolds number, = ρ b2/ μ
s axial gap between rotor and stator disks
Vax mixed-mean axial velocity of main air in annulus
angle, to axial direction downstream, of the main air velocity
relative to the blade – at just downstream of vane trailing edge (o)
η local sealing effectiveness
μ dynamic viscosity (kg/m/s)

xii
ρ density of air (kg/m3)
rotor disk speed
Φ azimuthal coordinate

1
CHAPTER 1
INTRODUCTION
1.1 Background
Gas turbines are rotary engines that use air as the working fluid. These
engines are widely used in aerospace, marine, oil & gas, and power industries for
their high power-to-weight ratio and ease of maintenance.
These air-breathing engines usually employ the open Brayton cycle to
extract power/thrust. In gas turbine engine, the ambient air is first adiabatically
compressed in a multi-stage compressor to increase its pressure. This is then
followed by an approximately isobaric combustion within a combustion chamber
which increases the compressed air temperature. This high pressure, high
temperature gas is then adiabatically expanded through a multi-stage turbine. The
power required to run the compressor is extracted from the turbine. The excess
energy of the gases is then used to provide either thrust or shaft power depending
on the nature of application.
An important aim of the gas turbine designer is to increase its efficiency;
this has both economic and environmental impacts. The efficiency of a gas
turbine increases as the gas temperature at turbine entry, the turbine entry
temperature (TET) is increased. Over the years the TET has increased from about
1000K to 1800K. So this temperature can be much higher than the melting
temperature of turbine metal components. High TETs have been rendered
possible by the advances made in materials, cooling, and sealing technologies.
2
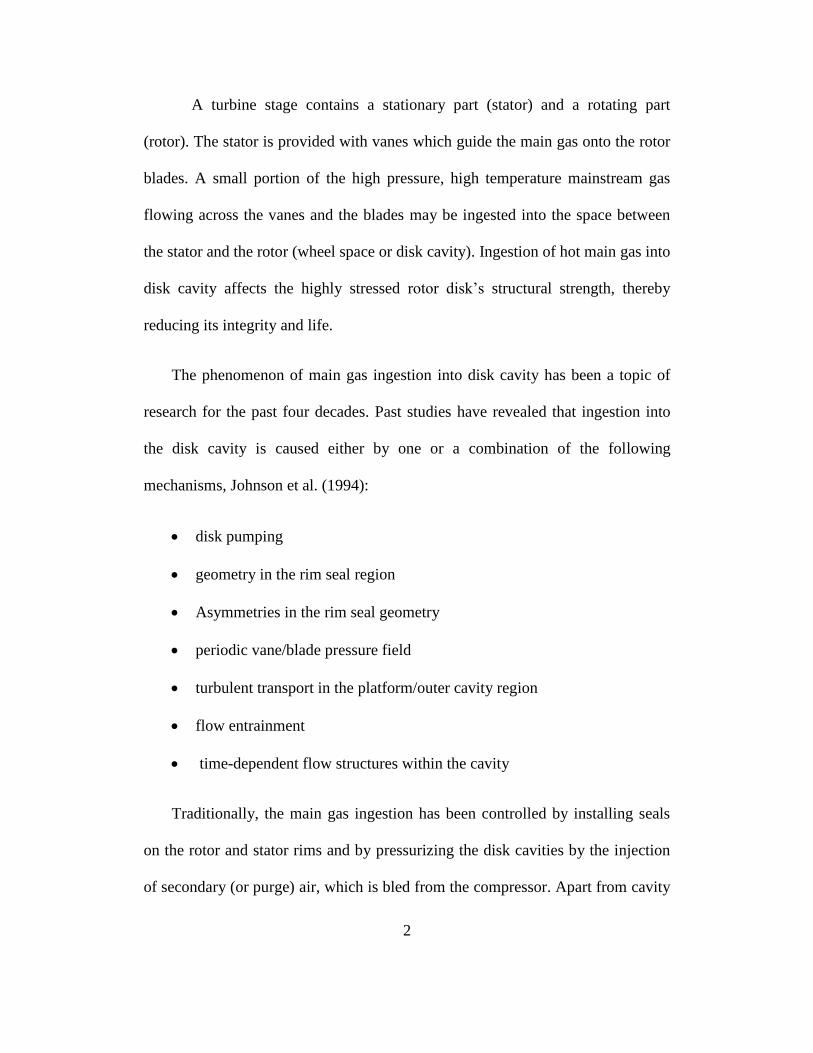
A turbine stage contains a stationary part (stator) and a rotating part
(rotor). The stator is provided with vanes which guide the main gas onto the rotor
blades. A small portion of the high pressure, high temperature mainstream gas
flowing across the vanes and the blades may be ingested into the space between
the stator and the rotor (wheel space or disk cavity). Ingestion of hot main gas into
disk cavity affects the highly stressed rotor disk‟s structural strength, thereby
reducing its integrity and life.
The phenomenon of main gas ingestion into disk cavity has been a topic of
research for the past four decades. Past studies have revealed that ingestion into
the disk cavity is caused either by one or a combination of the following
mechanisms, Johnson et al. (1994):
disk pumping
geometry in the rim seal region
Asymmetries in the rim seal geometry
periodic vane/blade pressure field
turbulent transport in the platform/outer cavity region
flow entrainment
time-dependent flow structures within the cavity
Traditionally, the main gas ingestion has been controlled by installing seals
on the rotor and stator rims and by pressurizing the disk cavities by the injection
of secondary (or purge) air, which is bled from the compressor. Apart from cavity
3
sealing, the secondary air is also used for cooling of airfoil and cavity internals,
bearing chamber sealing etc. As the secondary air does not get expanded in the
turbine, there results a loss of efficiency. Nevertheless, this is a necessary loss as
the presence of secondary air enables the engine to have higher TET. Figure 1.1
schematically depicts a typical gas turbine secondary air system.
The amount of main gas ingested into a disk cavity is influenced by the
geometry of the rim seals and by the amount of secondary air provided to the
cavity. Since the amount of secondary air used results in an efficiency loss, the
gas turbine designer aims to minimize the secondary air amount.
The study of main gas ingestion and the sealing of turbine disk cavities by the
means of rim seals and secondary air is the main topic of this thesis.
In this study, experiments were performed in a model single stage axial flow
gas turbine. The turbine stage featured vanes, blades, rim seal on both rotor and
stator and a labyrinth seal radially inboard of the cavity. Static pressure
measurements in the cavity and in the main gas path and tracer gas concentration
measurements in the cavity were carried out. The experimental results from this
work are to be used to validate the predication of CFD simulations. Furthermore,
the results will be used to develop an empirical correlation for main gas ingestion
that can be incorporated in an internal secondary air system network model.

4
Fig 1.1 Schematic diagram - gas turbine internal secondary air system
(Courtesy: The Jet Engine, 1986)
1.2 Literature Survey
A large number of theoretical, computational and experimental studies
have been performed to understand the main gas ingestion problem and the
accompanying complex flow pattern in gas turbine rotor-stator cavities. Some of
these that are relevant to the current work are briefly discussed below.
Abe et al. (1979) constructed a rig which featured vanes inboard of a
mainstream annulus with no downstream blades. 27 vanes were positioned
upstream of the rim seal clearance, they turned the main air flow by 50 degrees.
5
Several rim seal geometries were investigated including axial clearance and hook
seals. The authors identified ingress as predominantly governed by the following:
the ratio of the velocities of the sealing air and the flow in the annulus, the rim-
seal clearance, and the rim seal geometry.
Phadke and Owen (1983) investigated a simple rotor-stator system with
peripheral seal variation. One axial-gap and four radial-gap seal configurations
were tested using a pressure criterion as the key ingestion indicator. A pressure
inversion effect occurred for radial overlap seals where the cavity pressure
increased with increasing rotational speed. This effect was attributed to the flow
entrained near the rotor impinging on the stator face and forming a high-pressure
region. It was also found that the radial overlapping seals required less sealing
flow to prevent ingestion than that required for an axial-clearance seal. Thus the
pressure inversion effect was seen to be beneficial.
Further tests were conducted by Phadke and Owen (1988a) with a rotor-
stator rig in a quiescent environment (no external flow). Flow visualization,
measurement of pressure and tracer gas concentration techniques was employed
for different seal geometries to understand mainstream gas ingestion associated
flow field. For all configurations, the sealing flow entered axially, impinged on
the rotor and then flowed outward as a radial wall jet. The radial clearance seal
was found to have the highest sealing effectiveness among the various rim seal
geometries that were considered. For each of the rim seals, a theoretical
correlation was proposed for the Cw,min value. Cw,min was found to depend on the
6
rim seal geometry as well as the rotational Reynolds number. Phadke and Owen
extended their research to include the effect of the mainstream annulus air flow
rate on ingestion (1988 b, c). It was found that ingestion occurred because of the
circumferential asymmetry of the mainstream gas static pressure rather than the
mainstream gas flow rate itself. It was shown that increasing the circumferential
pressure asymmetry in the annulus flow at the rim seal increased the minimum
sealing flow required and that for certain conditions, Cw.min was independent of
the rotational Reynolds number. This work has also been discussed in a
comprehensive book on rotating disk flows by Owen and Rogers (1989).
Chew (1991) aimed to develop a theoretical model for ingestion, using
available experimental data. The model worked by linking the boundary layer
flow inside the wheel space to the rim seal, which was treated as an orifice. As the
boundary-layer flow in a rotating-disk system depends on the turbulent flow
parameter λT, Chew used this parameter in his model. It was hoped that the
integral momentum equation solution for the flow between two discs would
provide a basis from which to develop more elaborate models. His prediction
agreed reasonably well with Phadke and Owen measurements of Cw.min. The
author also deduced that in the absence of purge air flow, the amount of main gas
ingestion was of the order 20 percent of Cwmin (for that particular seal).
Hamabe and Ishida (1992) studied ingestion caused by non-axisymmetric
external flow. They suggested that whilst many previous researches had assessed
the minimum sealant flow rate required to prevent ingestion, few had estimated

7
the ingestion flow rate itself, or considered the shape of the external flow pressure
profile. A rotor-stator rig featuring vanes in the external annulus was used to
generate non-axisymmetric flow. Concentration taps were used to produce sealing
effectiveness plots, similar to previous works. 24 static pressure taps were used to
measure the external flow pressure non-axisymmetry. It was found that the
sealing effectiveness largely depended on the shape of the circumferential
pressure distribution in the mainstream gas path.
Green and Turner (1994) were the first to perform experiments with a
fully equipped rotor-stator system featuring guide vanes and rotor blades. Using a
simple axial clearance seal configuration they compared four different external
flow cases. It was shown that the no-external flow condition produced the least
ingestion and the setup with only the vanes present (i.e. no blades) produced the
most ingestion. The full stage case (i.e. vanes as well as blades) showed a
reduction in the ingested flow. It was suggested that the rotor blades rendered the
mainstream gas flow more axisymmetric and thus reduce ingestion.
Johnson et al. (1994) identified the physical mechanisms inherent in the
ingestion process such as disk pumping, circumferential pressure asymmetry in
the main gas path, periodic pressure fluctuation due to vane/blade interaction, and
turbulent transport in the fluid. It was concluded that these mechanisms, among
others, needed to be well understood before designing advanced industrial gas
turbines.

8
Roy et al. (1999, 2000, 2005, 2007, 2011) carried out experiments in a
model single-stage axial turbine stage with blades, vanes, and rim seals on the
stator and rotor. Unsteady, as well as time-averaged, static pressure measurements
were made at various locations in the disk cavity and main gas path. A tracer gas
(CO2) technique was employed to measure ingestion at several radial locations in
the cavity. Particle image velocimetry was employed to map the flow within the
disk cavity. These measurements helped better understand the nature of the main
gas path and disk cavity flows.
Gentilhomme et al. (2002) reported experimental measurements in a
single-stage axial turbine, steady and unsteady CFD simulations of the same, and
an elementary model of ingestion. Distribution of time-average pressure and
ingestion were measured. The results suggested that the vane trailing edge wake
was a stronger driver for pressure asymmetry (which is the dominant ingestion
driving mechanism) than the blade for the particular rim seal geometry.
Cao et al. (2003) reported a combined experimental and computational
(CFD) study of the interaction between the mainstream gas flow and the sealing
air flow. The experiments were performed in a two-stage axial turbine rig
featuring a simple axial gap between the rotor and stator disks, without any rim
seals. The first stage of the turbine is used to provide representative flow
conditions into the second stage. The second stage has 50 fixed vanes and 67
rotating blades. A three-dimensional unsteady simulation of the flow (without the
vanes and blades) was carried out. An unsteady flow structure in the outer region

9
of the disk cavity was predicted. Alternate regions of ingress and egress, which
rotated at 90-97% of rotor speed, were found near the cavity rim.
Bohn et al. (2006) compared an axial and a radial seal configuration using
a 1.5-stage axial turbine with blades and vanes. A comprehensive analysis of 115
pressure/concentration points was taken inside the rig using a Scanivalve setup. A
strong effect of rim seal configuration was found on the sealing efficiency. The
radial seal was shown to outperform the axial seal- i.e. less sealing flow was
required to purge the wheel space.
Recently, Johnson et al. (2008) proposed a two-orifice model of ingestion
incorporated two discharge coefficients: one for ingestion (Cd,i) and another for
egress (Cd,e). Also considered was the addition of a radial momentum term to
account for swirl effects in the seal mixing region. This work showed improved
seal characterization compared to the earlier one-discharge coefficient models.
Experimental ingestion results from Arizona State University (ASU) were well
predicted by the two-orifice model with values of Cd,e = 0.27 and Cd,i = 0.20. The
new model appears to better characterize rim seals of a wider range of
configurations.
1.3 Overview of the present work
In this work, experiments were carried out in a model single-stage axial-
flow air turbine with blades, vanes, rim seals on both the stator and rotor, and a
labyrinth seal radially inboard in the disk cavity. Though simpler than an actual

10
gas turbine stage, the model stage retained the key features which influence the
phenomenon of main gas ingestion.
The organization of this thesis is as follows: Chapter 2 contains a
description of the experimental facility, the techniques and procedures for
measuring the time-average static pressure in the main gas path and the disk
cavity and ingestion in the disk cavity. Chapter 3 contains the experimental results
and their discussion. Finally, Chapter 4 summarizes the conclusions and suggests
some recommendations for future research.

11
CHAPTER 2
RESEARCH FACILITY AND EXPERIMENTS
2.1 The Experimental Facility
Figures 2.1 and 2.2 show the experimental facility that was used for the
present work. The facility is an open air-flow system, where lab ambient air is
drawn into the system and is discharged to the atmosphere.
Main air flow
The turbine mainstream air is supplied by a centrifugal blower (Hauck,
22.4 kW, TBA-20-30) can provide an air flow-rate of up to 1.42 m3/s (≅ 3000
cfm) and is controlled by a variable-frequency motor drive (Cutlet Hammer, AF
95).The blower inlet is connected to a 292 mm (11.5”) i.d. plexiglass circular duct
via a diffuser with a divergence angle of 5 degrees. The blower discharges air to
the atmosphere through a 2.235 m (7‟4”) long, 311 mm (12.25”) diameter vertical
pipe connected to an exhaust duct.
Measurement of mainstream air flow rate
The main air flow rate is measure by a pitot tube rake. The rake is
equipped with five pitot-static tubes equally spaced along a manifold and is
installed in the 292 mm (11.5”) i.d. plexiglass exit duct at approximately 950mm
(37.4”) upstream of the main blower inlet. The pitot tube rake is connected to a
digital manometer (Validyne, PS309, range: 0-2” water gauge) which provides an
analog output (0-2V) of the air flow dynamic pressure. The output is routed to a

12
Fig 2.1 Axial Flow Turbine experimental facility.
Fig 2.2 Schematic of ASU Turbine rig.
Turbine stage
Main blower
Secondary air
delivery tube
NDIR gas analyzer

13
data acquisition system (Analogic, DATA 6500) where the mean and RMS values
of the dynamic pressure are calculated and displayed.
Secondary (or purge) air flow
The secondary air is supplied by a smaller centrifugal blower (2.24kW,
Hauck, TBA-16-3) also controlled by a variable-frequency motor drive (Emerson,
Prism). The maximum flow rate that can be provided by the blower is 0.12 m3/s
(≅ 250 cfm). The blower discharges air into a 50.8 mm (2.0”) nominal diameter
insulated galvanized iron pipe to a turbine flow meter. The air then flows through
a check valve to a 1.780 m long, 38.1 mm i.d plexiglass pipe to the centre (hub) of
the disk cavity. To straighten the air flow, a honeycomb section (12.7 mm (0.5”)
long, 3.2 mm (0.126”) hexagonal cell size) has been installed in the plexiglass
pipe 1.60 m (63.0”) upstream of the cavity inlet.
Measurement of secondary (purge) air flow rate
The turbine flowmeter mentioned earlier (EG&G Flow Technology, FT-
32) measures the secondary air volumetric flow rate. The flow meter indicator
provides an analog output signal that is routed to a digital multimeter (Model 45,
Fluke). Based on a known calibration, this voltage is then converted to air
volumetric flow rate.
Test section
The rotor-stator turbine stage section is located on the suction side of the
main air blower. This allows optical access to the test section in both axial and

14
radial directions. The rotor is driven by a motor in addition to the rotation
imparted by the main air flow.
Rotor drive
The rotor disk was mounted on a 50.8 mm (2.0”) mild-steel shaft. The shaft is
belt-driven by a 2.24 kW (3HP, 1750 rpm max, GE) motor whose speed is
controlled via a 3.73kW adjustable-frequency drive (5 HP, Eaton-Cutler
Hammer). The speed ratio of the rotor disk to the motor wheel is 3.27:1; this
allows a maximum rotor speed of 5720 rpm. The rotor speed is measured by a
digital photoelectric tachometer (Biddle Instruments; accuracy ±1 rpm). The AFD
helps maintain the speed of the rotor constant. The AFD is also equipped with a
dynamic braking resistor (Power-Ohm Resistors, P13549-405, rated at 2.8 kW at
a total resistance of 65.0Ω) which enables a quick shut-down of the motor.
2.1.1 The Turbine Stage
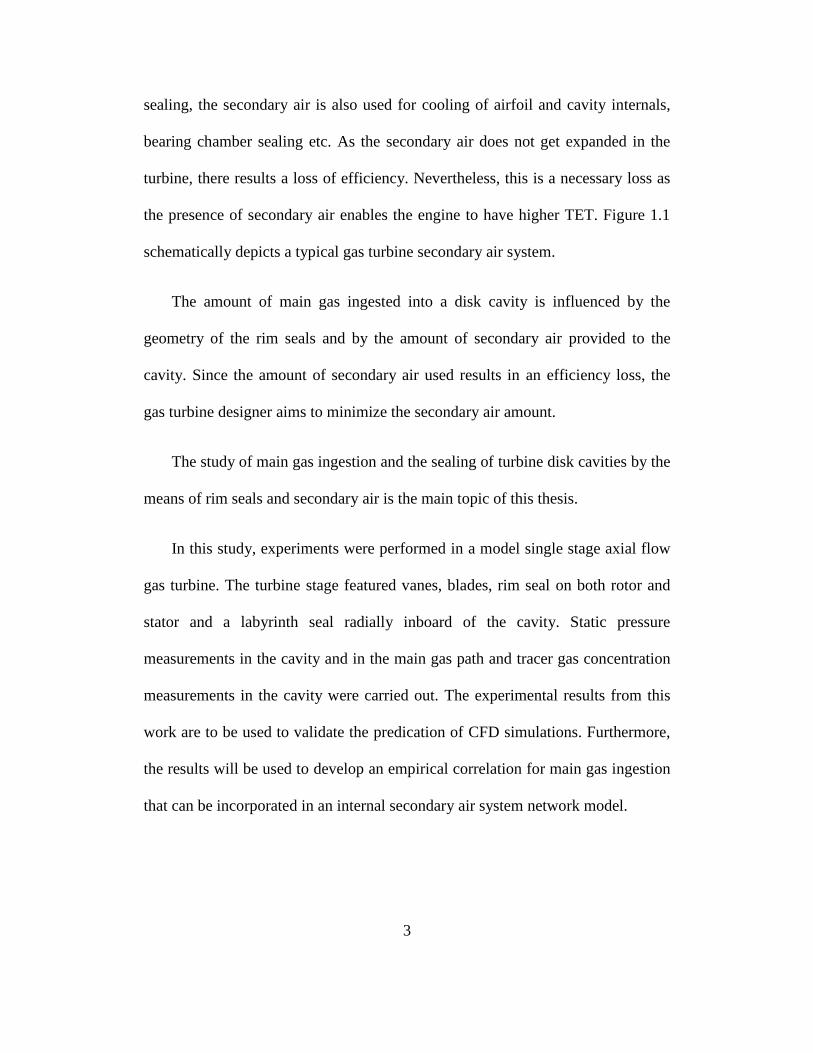
Figure 2.3 shows the schematic of the turbine stage which was used in the
present study. A 120.7 mm (4.75”) long honeycomb section (Polypropylene,
0.315” cell size, black, Plascore, PP30-5) has been provided in the annular main
air passage 152.4 mm (6.0”) upstream of the vanes to straighten the incoming
flow.
The plexiglass stator is 19.1 mm (0.75”) thick and has a diameter of 391.4
mm (15.4”). There are 22 partial-height, full length vanes which turn the
incoming air by 68.6⁰, thereby imparting a realistic swirl to the air flow. The
aluminum rotor disk is of the same diameter as the stator with 28 partial-length

15
and partial-height blades. The blade tip clearance (with the steel outer shroud) is
1.5 mm (0.059”). The blade and vane heights are such that given the main blower
capacity, sufficiently high main air stream-wise velocity can be obtained so as to
result in an acceptable velocity triangle upstream of the blade row at prescribed
rotor speeds. The axial gap between the rotor and the stator (identified as disk
cavity) is maintained constant at 16.5 mm (0.65”). The purge gas is injected into
the inner cavity at the stator hub by a 1780 mm (70.1”) long, 38.1 mm (1.5”) i.d.
plexiglass tube.
Rims seals are provided on the rotor and stator disks. The rim seals have
an axial overlap of 2.6 mm (0.102”) and a radial gap of the same magnitude. The
disk cavity also features a labyrinth seal radially inboard that has a radial
clearance of 0.51 mm + 0.01 mm. This effectively divides the disk cavity into an
„Inner Cavity‟ and a „Rim Cavity‟, (figure 2.3).
The mid-span shapes of the vanes and blades are also shown in figure
2.4(a). Figure 2.4 (b) shows the velocity triangle diagram for the mainstream gas
at the vane exit and the blade exit. β2 is the angle, with respect to the axial
direction, of the mainstream gas velocity (W2) relative to the blade. A positive
value of β2 ensures that the rotor operates as a turbine. Appropriate combination
of rotor speed and main gas flow rate ensures an adequately a large positive value
of β2.
16
R=
19
5.7
(v
ane/
bla
de
hu
b r
adiu
s, R
h)
R=
21
8.6
b=
19
1.2
R=
18
6.6
Blade
(28)
Vane
(22) Main air flow
P P C, T, P
*P
C, *P (r= 173)
C, P (r= 148)
C, P (r= 104)
C, P (r= 81)
C, P (r= 45)
Purge air flow
s =
16.5
P
C, P
C, *P (r= 187)
r =
19
.1
R=
22
7.8
Ω
R=
13
8.0
R=
18
4.7
4.5
2.6
6
P
24
T
C, P (r= 162)
9
R=
12
6.0
7.7
2.6
3.9
C, P (r= 123)
Rs=
13
1.8 10
12
11.4
11.4
4
Labyrinth seal
clearance = 0.51mm + 0.01 mm
19.1
5.4
5.1
5.1
4
31.8
Steel Shroud
20
rim
cavity
inner
cavity
r
x* Circumferentially 17 locations over one vane pitch; * Circumferentially 6 locations over one vane pitch
Fig 2.3 Schematic diagram of the single-stage rim-seal arrangement (C: Gas
concentration tap, P: time-average static pressure tap, T: thermocouple);
all dimensions are in mm.

17
51.7 16.5 48.3
46.5 59.2
Main flow
Vane (22) Blade (28)
31.8
(a) static pressure taps on outer shroud
(b) Main air velocity triangle
Fig 2.4 The blade and vane arrangement.
1 4 1 All dimensions in mm
Static pressure taps

18
2.2 Time-Average Static Pressure Measurement
2.2.1 System Components
A differential pressure transducer (DPT), a Scanivalve and a signal carrier
demodulator were used to measure the time-mean static pressure distributions.
The measurements were made at the stator disk and in the main gas path at the
vane platform and at the outer shroud. Figure 2.5 displays the components which
are described briefly in the following section.
Scanivalve- 48 channel switch wafer
-drive system
-odd-even encoder/decoder
Turbine stage
Binary encoder/decoder
Drive system
controller
Data acquisition
system
Pressure signal
carrier
demodulator
Pressure
transducer
Fig 2.5 Pressure measurement system
19
Scanivalve
The Scanivalve is a pressure sampling scanner for measuring multiple
pressures. It enables a pressure transducer and the associated zeroing circuit to do
the work of 48 transducers and 48 zeroing circuits albeit sequentially. The unit
employed in the current work has three main subcomponents: samplivalve, binary
encoder/decoder and drive system controller.
A solenoid-controlled stepper drive rotates the 48-channel fluid switch
wafer such that, at any particular time, only one inlet port is connected to the
outlet port. A position encoder/decoder transmits the angular position of the
Scanivalve to a display system from which information regarding particular
channel connected to the outlet could be read off.
Pressure Transducer
A variable reluctance-type pressure transducer (DP-45, Validyne) with a
range of 0-2 psi was used. The transducer contains two ports, one of which is
connected to the Scanivalve outlet and the other is open to ambient air. Thus, the
transducer measures gage pressure. The transducer contains a sensing diaphragm
which produces an output voltage corresponding to the applied pressure
differential.
Carrier Demodulator
The pressure signal carrier Demodulator (Validyne CD 12) features a high
pass filter and suppression mode. It converts the pressure transducer outlet into a
DC voltage signal. This signal can be routed to a data acquisition system. It has a

20
high input sensitivity range (0.9 to 75 mV/V); this allows tracking of even small
fluctuations in the input signal. There is also a digital display which gives the
pressure in terms of voltage (0-10V).
Data Acquisition System
The analog signal from the pressure signal carrier demodulator is routed to
the data acquisition system via a BNC cable. The data acquisition system used in
the present work is a Universal Waveform Analyzer (Analogic, DATA 6500). It
was programmed to provide the time-mean and RMS of the static pressure signal
over sequences of 30720 data points with sampling period of 500μs (2 kHz
sampling frequency).
Fig 2.6 Schematic of static pressure tap on stator disk

21
2.2.2 Experimental Procedure
As mentioned earlier a total of 48 pressure channels are available in the
Scanivalve system. Figure 2.6 shows a schematic of a pressure tap used in the
experiments. It is ensured that no machining burrs are present near the pressure
tap as they could affect flow condition. Static pressure measurements have been
conducted at the following locations:
a) For the static pressure distribution in the main gas path, 33 pressure taps,
distributed over two vane pitches are provided on the outer shroud at 1mm, 5 mm
and 15.5 mm downstream of the vane trailing edge;
b) For the radial distribution of static pressure at the stator surface, eight pressure
taps at r=45mm, 81mm, 104mm, 123mm, 148mm, 162mm, 173mm, 187mm are
provided along a radial line;
c) At the stator surface, 17 pressure taps at r = 187 mm and 6 pressure taps at r =
173 mm are provided circumferentially over one vane pitch for measuring the
circumferential distribution of pressure;
d) For the static pressure distribution on the vane platform, 17 pressure taps are
provided circumferentially over one vane pitch at 1mm downstream of vane
trailing edge.
The main air inlet gage pressure is measured using a pressure tap at the
outer shroud 20 mm upstream of the vane leading edge plane. The secondary air

22
inlet gage pressure is measured at a tap located 70 mm upstream of the disk cavity
entrance.
The time-average of the measured pressure is defined as
p =1
T p t dt
T
0
≈1
N p
i
N
i=1
(2.1)
The data acquisition system was set to acquire 30720 points (N) at 2 kHz
sampling frequency (500 μs sampling interval) to ensure that the fluctuations in
the pressure readings are averaged out. The uncertainty in the time-average static
gage pressure measurements was estimated to be ± 4%.
2.3 Mainstream Gas Ingestion Measurement
For these measurements, the purge air is seeded by a tracer gas (CO2)
before it is introduced into the disk cavity. The penetration of mainstream gas into
the cavity is determined by measuring the CO2 gas concentration in the cavity gas.
Note that any ingestion of main gas (air) into the cavity reduces the concentration
of CO2 in the cavity gas. The cavity gas is sampled at multiple radial locations and
the CO2 concentration is measured using a gas analyzer (see Section 2.3.1). One
can then calculate the efficacy of the rim seal and the purge air in sealing the
cavity in the form of a „sealing effectiveness‟.
2.3.1 System components
NDIR gas analyser
An NDIR gas analyzer (Siemens- Ultramat 23) is used to measure CO2
concentration. Its main components are: an infrared source, a sample chamber or
light tube, and a wavelength sample chamber. The gas concentration is measured

23
electro-optically by its absorption of a specific wavelength in the infrared (IR).
The IR light is directed through the sample chamber towards the detector. In
parallel, there is a second chamber with a reference gas (typically nitrogen). The
detector has an optical filter in front that eliminates all light except the
wavelength that the molecules of the selected gas can absorb. At the back of the
device, two inlets one for the sample gas, the other for the zero gas (N2), and one
gas outlet are provided. The permissible ranges for the sample gas pressure, flow,
and temperature are, respectively, 0.5 to 1.5 bar absolute, 1.1 to 2 l/min, and 0 to
50° C. When switched on, the analyzer carries out a calibration (AUTOCAL)
with the zero-gas (N2). It calibrates the zero and sensitivity of the IR channel. The
AUTOCAL can be manually triggered during operation by pressing the CAL key
in the keypad.
R=
19
5.7
R=
21
8.6
b=
19
1.2
48.331.8
blade (28) vane (22) Mainstream
flow
T, C, P
C (r=173)
C (r=148)
C (r=104)
C (r=81)
C (r=45)
Purge air flow
s =
16.5
C,P
C (r=187)
T
435
R=
19
.1
21
R=
22
7.8
7.7
11.4
Filter
Flowmeter
Tracer gas
(CO2)
Pressure
regulator
P
Electric
heatersJ-
Thermocouple
1760
P
NDIR
Gas Analyzer
CO2 sparge
tube
Zero gas
(N2)
Needle valve
Toggle valve
T-
Thermocouple
C (r=162)
C (r=179)
11.4
C (r=123)
12
Rs=
13
1.8
12.7
5.4
6
Fig 2.7 Arrangement for mainstream gas ingestion measurement for the single-
stage turbine configuration.

24
Gas Cylinders and Tube Connections
The set-up and tube connections are shown in figure 2.7. Ultra high purity
(99.9% N2) compressed nitrogen gas was used as the zero-gas for AUTOCAL.
The purge gas was seeded with CO2 approximately 1.7m upstream of the disk
cavity entrance using a sparger tube (stainless steel, 6.3 mm o.d; 4.5 mm i.d)
containing 15 holes (each of 1 mm diameter). The volumetric concentration of the
CO2 was maintained at a fixed value (1 l/min) by controlling the CO2 flow rate at
the point of seeding, using a pressure regulator (on the gas cylinder) and a needle
valve. To regulate the gas as it flows from the cylinder, an electric gas heater
between the gas cylinder and the regulator, and a band heater at the back of the
regulator is used. The heaters also help maintain the temperature of the tracer gas
(measured upstream of the valve using a J-thermocouple) close to the desired
temperature.
Each gas sampling tap was connected to a toggle valve by a vinyl tube
(3/16” ID; 5/16” OD). The toggle valves were connected to a manifold with a
single outlet. A needle valve and a filter were connected to the manifold outlet; a
vinyl tube delivered the sample gas from the outlet to the gas analyzer.
2.3.2 Experimental Procedure
To measure ingestion in the cavity, the purge airflow is seeded with
carbon dioxide (tracer) gas. The CO2 volumetric concentration was measured just
upstream of the entrance to the inner cavity and carefully maintained at 4.00
(+0.11) percent. The pressure taps at the eight radial locations on the stator disk

25
(figure 2.3) also serve as taps for measuring CO2 concentration in the disk cavity.
Stainless steel sampling tubes (1 mm i.d., 1.6 mm o.d.) are installed at radius r=
179 mm, 148mm, 104mm and were traversed axially, one at a time to measure the
CO2 concentration distribution in the disk cavity. The CO2 concentration in the
mainstream air is measured throughout the experiment to serve as a reference.
The uncertainty in the measured CO2 volumetric concentration is + 0.11 percent
CO2 concentration. Due to the nature of the measurements, the measured
ingestion is a time-averaged value over many rotor revolutions, but is local with
respect to the circumferential vane position and the radial location in the cavity.

26
CHAPTER 3
RESULTS AND DISCUSSION
3.1 Experimental Conditions
The non-dimensional parameters in the experiments are: main air flow
Reynolds number (Revax), rotational Reynolds number (Reφ), and mass flow rate
of purge air (cw). These are given in Table 3.1. Time-averaged static pressure
measurements were carried out in the main gas path to ensure steady and
circumferentially periodic main air flow.
Table 3.1 Experimental Conditions
Exp. Set
No.
Main air flow
rate
(cfm / Revax
)
Rotor Speed
(rpm / Re)
Purge air
flow rate
(cfm / cw)
β2
(o
)
Sec. flow rate/ Main
flow rate
(%)
Free Disk pumping
flow rate
(cfm / cw,fd
)
I 2300 /
1.12×10⁵
2400 /
6.14×10⁵
5 / 770
48.3
0.2174
57.3 / 9354
10 / 1540 0.4348
20 / 3080 0.8696
30 / 4621 1.3043
40 / 6161 1.7391
II 1900 /
9.27×10⁴
1900 /
4.85×10⁵
5 / 770
49.7
0.2632
47.4 / 7745
10 / 1540 0.5263
20 / 3080 1.0526
30 / 4621 1.5789
40 / 6161 2.1053
The rotor speeds and main air flow rates were chosen such that β2 was
large and positive, which ensured that the rotor operated in the turbine mode. The
purge gas flow rates were chosen with reference to the free-disk pumping flow
rate, this being the pumping flow rate due to the flat rotor disk rotating freely in a
quiescent environment. Time-averaged static pressure and ingestion

27
measurements at the stator surface were performed for all of the experimental
conditions at eight radial locations at r=45mm, 81mm, 104mm, 123mm, 148mm,
162mm, 173mm and 187mm. Time-averaged ingestion measurements in the disk
(rim, inner) cavity at radial locations (r= 179 mm, 148mm, 104mm) were
performed with a traversing probe for experiment set I and set II for all purge air
flow rates except cw=4621 and cw=6161 .
Table 3.2 lists the values of the measured boundary conditions for the
experiments. The static pressure of mainstream air at vane inlet and of purge air at
inner cavity inlet changed slightly as the main air and purge air flow rates were
changed.
Table 3.2 Measured boundary conditions
Static Pressure Value
Average lab ambient pressure 101.3 kPa (absolute)
Average lab ambient temperature 23° C
Average pressure of mainstream air at vane inlet 99.8 kPa (absolute)
Average static pressure of purge air at disk cavity
entrance 97.7 kPa (absolute)
3.2 Time-Average Static Pressure Distribution
Distribution of time-average static pressure in the main gas path were
obtained over two vane pitches at three axial positions on the outer shroud and at
one axial location on the stator rim seal (or platform). Also, the static pressure in
the disk cavity at the stator surface was obtained at eight radial positions.
In figure 3.1, the circumferential distribution of pressure at the main gas
path outer shroud and stator rim seal (platform) is shown for the experimental

28
condition Revax = 1.12×10⁵, Reφ = 6.14×10
5, cw = 1540. The circumferential
pressure variation produced by the vanes, and the decay of its strength axially
downstream can be observed. The peak-to-peak amplitude is maximum at the
outer shroud axial position immediately downstream from the vane trailing edge
plane.
The pressure at the vane platform, 1mm downstream of the vane trailing
edge plane, is considerably lower than the pressure at the outer shroud at the same
axial position. On the other hand there is no discernible circumferential pressure
variation at the stator disk even near its rim (r/Rh = 0.956) indicating that the
pressure asymmetry in the mainstream flow is dissipated across the rim seals.
Fig 3.1 Circumferential distributions of time-average static gage pressure at the
outer shroud, vane platform and stator near its rim – Revax= 1.12×10⁵,
Reφ= 6.14×10⁵, cw = 1540.

29
The influence of purge air flow rate on the circumferential distribution of
time- average static pressure is shown in figures 3.2 and 3.3 for experimental sets
I and II, respectively. Although the effect of purge air flow rate (cw) increase on
the pressure distribution is not significant, the pressure level reduces slightly as
the purge air flow rate increases. This could be due to the entry of lower pressure
purge air from rim cavity into the main gas path, which in turn reduces the
pressure difference between the main gas path and the rim cavity thereby reducing
the potential for main air ingestion. It can also be observed that the pressure level
in the main gas path is lower for set I in comparison to set II (by about 1.1 to 1.2
kPa). This may be due to the higher suction induced by the main blower (to
deliver higher main air flow rate), this inducing lower pressure in the main gas
path.
Figures 3.4 and 3.5 show the radial distributions of time-average static
pressure at the stator surface in the disk cavity for set I and II conditions. As cw
increases, the pressure level in the „inner cavity‟ rises due to the flow restriction
posed by the labyrinth seal. This flow restriction results in a significant pressure
drop across the seal to such an extent that the pressure distribution in the „rim
cavity‟ for different cw‟s becomes essentially equal as shown in Figures 3.4 and
3.5. This phenomenon may be undesirable, because the primary intent of
increasing cw is to pressurize the rim cavity to minimize main gas ingestion. This
pressurization of the rim cavity is not achieved in this configuration. Also to be

30
noted is that even though the static pressure within the rim cavity is similar for
different cw‟s, its value is somewhat spread out near the rotor rim seal.
The pressure distribution in the main gas path in conjunction with that in
the rim cavity may help identify locations of ingress and egress. It may be
suggested that the pressure at the downstream edge of the vane platform (stator
rim seal) influences ingestion.
Fig 3.2 Effect of cw on the circumferential distributions of time-average static
pressure at the outer shroud, vane platform and stator near its rim-
Revax= 1.12×10⁵, Reφ= 6.14×10
5 (experimental set I).

31
Fig 3.3 Effect of cw on the circumferential distributions of time-average static
pressure at the outer shroud, vane platform and stator near its rim-
Revax= 9.27×10⁴, Reφ= 4.85×10
5 (experimental set II).
Fig 3.4 Effect of cw on the radial distributions of time-average static pressure in
the disk cavity at the stator surface- Revax= 1.12×10⁵, Reφ= 6.14×10
5
(experimental set I).

32
Fig 3.5 Effect of cw on the radial distributions of time-average static pressure in
the disk cavity at the stator surface- Revax= 9.27×10⁴, Reφ= 4.85×10
5
(experimental set II).
For this purpose the static pressure at the downstream edge of the vane platform
(which is 7.7mm downstream of the vane trailing edge plane) was estimated from
the pressure measurements. It must be kept in mind however, that the pressure in
both the main gas path and the rim cavity is unsteady and that it is the
instantaneous pressure field, which contains an unsteady blade-periodic
component which is key to ingestion.
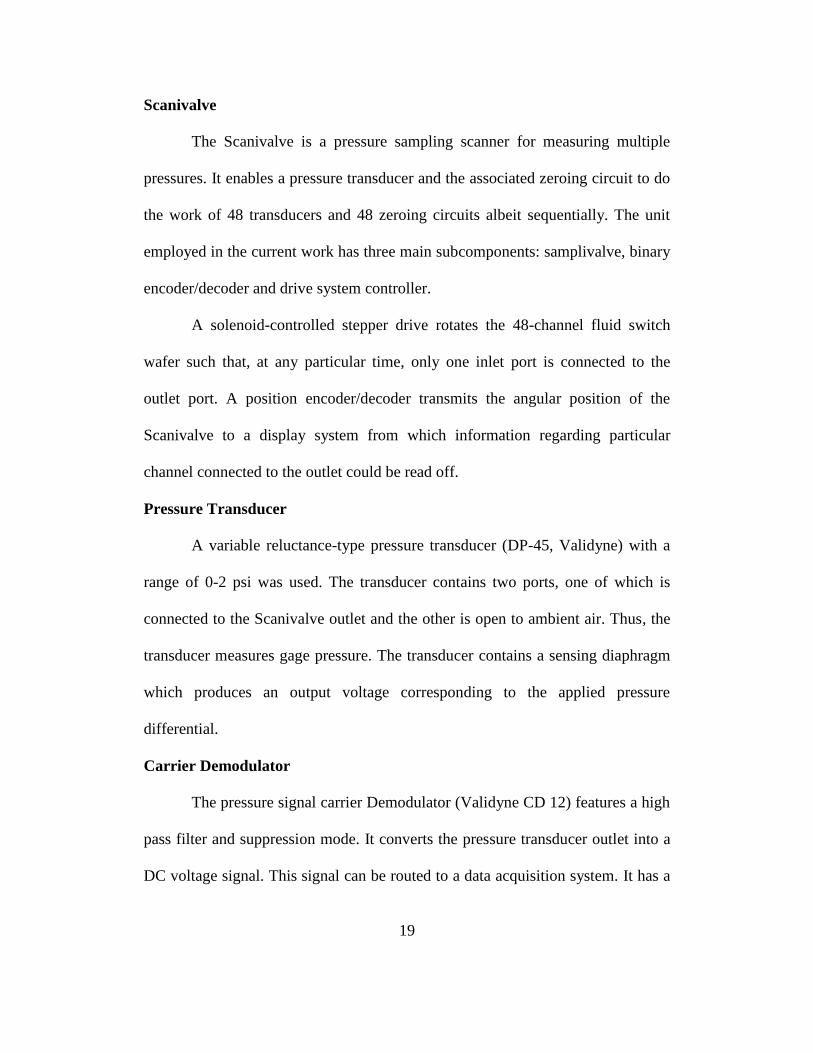
Figures 3.6 through 3.10 show the estimated circumferential pressure variation at
the downstream edge of the vane platform for experimental set I. As mentioned
earlier, the difference in the pressure between the main stream gas path and the
disk cavity near its rim governs ingestion. In the figures, the estimated pressure at
the vane-platform edge is compared to the measured pressure at r=187mm of the

33
stator surface. The „red‟ and „blue‟ areas depict the possible circumferential
locations of „ingestion‟ and „egress‟ respectively in the 2 vane pitch sector, at
least on the basis of time-averaged pressures. It should be noted that the
circumferential extent of the „ingestion‟ region decreases as cw increases. The
inference is that as cw increases there is less ingestion of main gas into the rim
cavity.
Fig 3.6 Circumferential distributions of time-average static pressure at the outer
shroud, vane platform and stator surface near its rim – Revax= 1.12×10⁵,
Reφ= 6.14×10⁵, cw = 770.
34
Fig 3.7 Circumferential distributions of time-average static pressure at the outer
shroud, vane platform and stator surface near its rim – Revax= 1.12×10⁵,
Reφ= 6.14×10⁵, cw = 1540.
Fig 3.8 Circumferential distributions of time-average static pressure at the outer
shroud, vane platform and stator surface near its rim – Revax= 1.12×10⁵,
Reφ= 6.14×10⁵, cw = 3080.

35
Fig 3.9 Circumferential distributions of time-average static pressure at the outer
shroud, vane platform and stator surface near its rim – Revax= 1.12×10⁵,
Reφ= 6.14×10⁵, cw = 4621.
Fig 3.10 Circumferential distributions of time-average static pressure at the outer
shroud, vane platform and stator surface near its rim – Revax= 1.12×10⁵,
Reφ= 6.14×10⁵, cw = 6161.

36
3.3 Mainstream gas ingestion
All ingestion distributions are presented in terms of sealing effectiveness.
Sealing effectiveness represents the combined effects of the rim seals and the
purge air flow in countering ingestion. It is defined as
η r =C r −Cmain
Cpurge − Cmain (1)
In the above expression, C represents the mass concentration of the tracer
gas CO2 in the cavity fluid. The value of ranges from 0 (no sealing) to 1.0
(perfect sealing).
3.3.1 Measurements on the Stator Surface
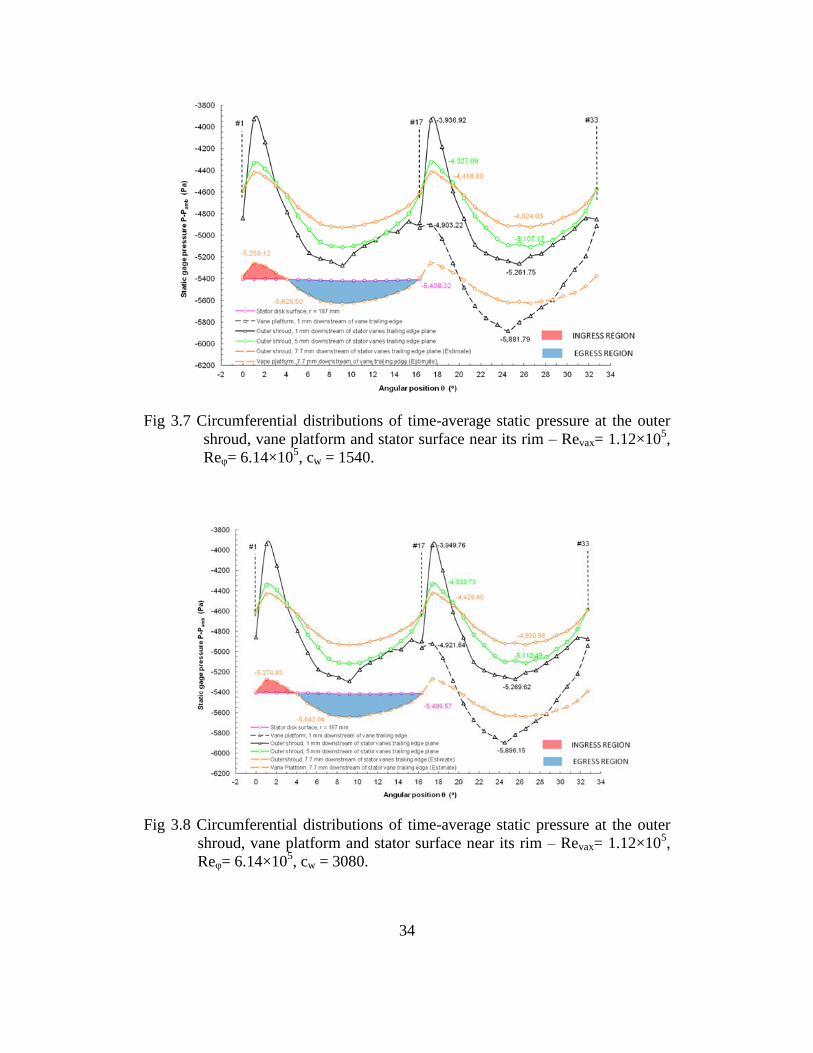
Figures 3.11 and 3.12 show, respectively, the radial distributions of
sealing effectiveness for experimental sets I and II. It can be seen that increasing
the rotor speed and the main gas flow rate (set I) at a particular cw decreases the
sealing effectiveness. This can be explained as the combined effect of higher disk
pumping at higher rotor speed and the higher pressure differential at main gas
flow rate between the main gas path and the rim cavity. Both of these effects
influence main gas ingestion. It can be remarked that for both set I and II
conditions, as the cw increases the sealing effectiveness increases concomitantly in
the rim cavity region. The sealing effectiveness of the inner cavity decreases
however for increasing purge air flow rates; this is consistent for set I and II
conditions. It is remarked that this trend was repeatable experimentally. An
explanation for the decrease in sealing effectiveness in the inner cavity could be

37
the possible presence of unsteady low-pressure structures -similar to those found
by Cao et al. (2003) and Jakoby et al. (2004) in the rim-cavity- in the inner cavity.
This may cause ingestion of rim cavity gas into the inner cavity. Further
explanation is provided in section 3.4.
3.3.2 Axial Traverse Measurement in the Disk Cavity
Ingestion measurements were carried out within the disk cavity at three
axial positions (x/s =0.09091, 0.39394, 0.69697, 1; s=16.5 mm) at three specific
radial locations (r =179 mm, 148 mm, 104 mm) for three purge gas flow rates (cw
= 770, 1540, 3080). Measurements at the other radial locations and purge gas flow
rates were not performed as the ingestion measurements within the cavity were
quite time consuming.
From figure 3.13, experiment set I condition, it can be observed that for cw =770
and 1540 the main stream gas ingestion is maximum at the stator disk and
minimum near the rotor in the rim cavity. This is caused by the strong radial
outflow of purge gas near the rotor disk, this impeding the ingested main gas from
reaching the rotor disk. For cw = 3080 the sealing effectiveness seems to be
constant throughout the rim cavity because of good mixing of the ingested gas
with purge air. Similar trends are found for experiment set II conditions as shown
in figure 3.14.
38
Fig 3.11 Effect of cw on the radial distributions of sealing effectiveness in the disk
cavity at the stator disk- Revax= 1.12×10⁵, Reφ= 6.14×10
5.
Fig 3.12 Effect of cw on the radial distributions of sealing effectiveness in the disk
cavity at the stator disk- Revax= 9.27×10⁴, Reφ =4.85×10
5.

39
Fig 3.13 Effect of cw on the radial distributions of sealing effectiveness within the
rim-cavity- Revax= 1.12×10⁵, Reφ= 6.14×10
5.
Fig 3.14 Effect of cw on the radial distributions of sealing effectiveness within the
rim-cavity- Revax= 9.27×10⁴, Reφ= 4.85×10
5.

40
3.4 Relating the measured ingestion distributions to the velocity field.
The velocity field in the disk cavity was mapped using Particle Image
Velocimetry (PIV) to help understand the flow in the presence of substantial as
well as minimal main gas ingestion. The PIV technique used and the flow field
results obtained for the current rotor-stator geometry are reported in Pathak
(2013).
Figures 3.15 through 3.17 contain the radial velocities obtained from the
instantaneous velocity vector maps in the cavity, 4 mm from the rotor surface for
Revax= 1.12×10⁵, Reφ=6.14×10
5, and cw =1540, 3080, 4621. It can be observed
from these plots that near the stator inner seal the radial velocity tends to be
negative, its magnitude increasing with cw. Comparing these figures with the
sealing effectiveness plots one may suggest that as the purge air flow rate is
increased some amount of rim cavity gas mixture is getting transported into the
inner cavity, which results in a decreased sealing effectiveness in the inner
cavity.or higher sealing air flow rate. As stated earlier, this result was
experimentally repeatable. As suggested, this transport of the rim cavity gas
mixture into the inner cavity might be due to the possible unsteady pressure
structures in the inner cavity.

41
Fig 3.15 Fluid radial velocity from instantaneous velocity vector maps at four
circumferential sector in the cavity; 4 mm from the rotor surface –
Revax= 1.12×10⁵, Reφ= 6.14×10
5, cw = 1540.
Fig 3.16 Fluid radial velocity from instantaneous velocity vector maps at four
circumferential sector in the cavity; 4 mm from the rotor surface -
Revax= 1.12×10⁵, Reφ= 6.14×10
5, cw = 3080.

42
Fig 3.17 Fluid radial velocity from instantaneous velocity vector maps at four
circumferential sector in the cavity; 4 mm from the rotor surface -
Revax= 1.12×10⁵, Reφ= 6.14×10
5, cw = 4621.

43
CHAPTER 4
CONCLUDING REMARKS AND RECOMMENDATIONS FOR FUTURE
WORK
4.1 Concluding remarks
An experimental study of the time-average static pressure and the main
gas ingestion distributions in a model single-stage axial flow gas turbine has been
reported. The turbine stage featured vanes, blades, and rim seal on both the rotor
and stator. Additionally, the disk cavity contained a labyrinth seal radially in-
board which effectively divided the cavity into a rim cavity and an inner cavity.
A time-average static pressure distribution that was circumferentially-
periodic following the vane pitch was found in the main gas path. The peak-to-
peak amplitude of this asymmetry increased as the square of the main gas flow
rate. The amplitude was the highest at the main gas path outer shroud at the vane
trailing edge plane. It decayed rapidly downstream toward the rotor blades; it also
decreased radially inward toward the cavity rim seal. Both the purge air exiting
from the disk cavity through the rim seal clearance and the rotor blades affected
the pressure decay. In the rim cavity, no circumferential pressure variation was
found even at the outermost radial location of measurement, implying that the
asymmetry dissipated across the rim seals.
Main gas ingestion sealing effectiveness distribution was measured both at
the stator disk surface and across the disk cavity. The sealing effectiveness was
found to decrease as the circumferential pressure asymmetry in the main gas path

44
increased with increase in the main gas flow rate. In the rim cavity, the sealing
effectiveness depended strongly on the purge air flow rate, increasing as the flow
rate increased. However, the sealing effectiveness in the inner cavity was found to
decrease somewhat as the purge air flow rate increased. This may have been due
to unsteady low-pressure structures that could have existed in the outermost
region of the inner cavity. Disk pumping by the rotor disk is also known to
influence ingestion, a higher rotor speed tending to increase ingestion (i.e.
decrease sealing effectiveness).
The sealing effectiveness near the rotor disk was generally found to be
higher than near the stator, meaning that ingestion was higher in the vicinity of
the stator.
4.2 Recommendations for future work
Rim seal geometry is one of the factors that influence the rim cavity
pressure distribution and thus influences the main gas ingestion. It would be
useful to study the influences of rim seal geometry parameters such as radial
clearance and axial overlap on main gas ingestion. Different rim cavity aspect
ratios, which can be obtained by changing the radial location of the labyrinth seal,
should also be studied.
In the current disk cavity configuration, the labyrinth seal separates the
inner cavity from the rim cavity. Recent experiments in our laboratory indicate
that the clearance provided in the seal is a sensitive parameter, both for the cavity

45
pressure distribution and the cavity sealing effectiveness distribution. Additional
experiments will be needed to properly understand this issue.
In addition to the time-averaged pressure measurement, unsteady
instantaneous pressure measurements also need to be carried out. As has been
reported in various published works, it is the instantaneous differential between
the main gas path and rim cavity pressures that drives ingestion. The
measurements reported in this thesis are time-averaged pressure (averaged over
many rotor revolutions). Measurement of the instantaneous pressure at the stator
rim seal (vane platform) tip, outer shroud and within the rim cavity would allow
us to better understand the mechanism of main gas ingestion.
At the time of writing this thesis three-dimensional unsteady CFD is being
carried out. Its results are expected to augment the experimental results reported.

46
REFERENCES
Abe, T., Kikuchi, J., and Takeuchi, H., 1979, "An Investigation of Turbine Disk
and Cooling," 13th
CIMAC Congress, Vienna.
Bohn, D. E., Decker, A., and Ohlendorf, N., 2006, “Influence of Radial and Axial
Rim Seal Geometry on Hot Gas Ingestion into the Upstream Cavity of a 1.5 Stage
Turbine", ASME Paper No. GT2006-90453.
Cao, C., Chew, J.W., Millington, P.R., and Hogg, S.I., 2003, “Interaction of Rim
Seal and Annulus Flows in an Axial Flow Turbine,” ASME Paper GT-2003-
38368.
Chew, J. W. (1991). "A Theoretical Study of Ingress for Shrouded Rotating Disk
Systems With Radial Outflow." ASME J. Turbomach. 113(1): pp. 91-97.
Gentilhomme, O., Hills, N.J., Chew, J.W., and Turner, A.B., 2002, “Measurement
and Analysis of Ingestion through a Turbine Rim Seal,” ASME Paper GT-2002-
30481.
Green, T. and Turner, A. B., 1994, “Ingestion into the Upstream Wheelspace of
an Axial Turbine Stage,” ASME Journal of Turbomachinery, Vol. 116, pp. 327-
332.
Hamabe, K., and Ishida, K., 1992, “Rim Seal Experiments and Analysis of a
Rotor-Stator System with Nonaxisymmetric Main flow,” ASME Paper 92-GT-
160.
Jakoby, R., Zierer, T., Klas, L., and Larsson, J., deVito, L., Bohn, E. D., Funcke, J
and Decker, A., 2004, "Numerical simulation of the Unsteady Flow Field in an
Axial Gas Turbine Rim Seal Configuration," ASME Paper GT2004-53829.
Johnson, B.V., Mack, G.J., Paolillo, R.E., and Daniels, W.A., 1994, "Turbine Rim
Seal Gas Path Flow Ingestion Mechanisms," AIAA Paper 94-2703.
Johnson, B. V., Wang, C. Z. and Roy, R. P. (2008). A Rim Seal Orifice Model
with 2 Cd s and Effects of Swirl in Seals. ASME Paper GT2008-50650
Owen, J.M. and Rogers, R.H., 1989, Flow and Heat Transfer in Rotating-Disc
Systems. Vol. I: Rotor-Stator Systems, Research Studies Press, Taunton, United
Kingdom.

47
Pathak, P.S., 2013, “Experimental Study of Flow Field in a Model Rotor-Stator
Disk Cavity Using Particle Image Velocimetry”, M.S., Thesis, Arizona State
University.
Phadke, U. P. and Owen, J. M. (1983). "An Invesigation Of Ingress For An Air-
Cooled Shrouded Rotating-Disk System With Radial-Clearance Seals." Journal of
Engineering for Power-Transactions of the ASME 105(1): pp. 178-183.
Phadke, U. P. and Owen, J. M., 1988, “Aerodynamic Aspects of the Sealing of
Gas-Turbine Rotor-Stator Systems, Part 3: The Effect of Nonaxisymmetric
External Flow on Seal Performance,” International Journal of Heat and Fluid
Flow, Vol. 9(2), pp. 113-117.
Rolls-Royce, 1986, The Jet Engine, Key Publishing Limited, Stamford, United
Kingdom.
Roy, R.P., Devasenathipathy, S., Xu, G., and Zhao, Y., 1999, “A Study of the
Flow Field in a Model Rotor-Stator Disk Cavity”, ASME Paper 99-GT-246.
Roy, R.P., Xu, G., and Feng, J., 2000, “Study of Main-Stream Gas Ingestion in a
Rotor-Stator Disk Cavity”, AIAA Paper 2000-3372.
Roy, R.P., Feng, J., Narzary, D., and Paolollo, R.E., 2005, “Experiment on Gas
Ingestion Through Axial-Flow Turbine Rim Seals”, ASME Journal of
Engineering for Gas Turbines and Power, Vol. 127. 127, pp.573-582.
Roy, R.P., Zhou, D.W., Ganesan, S., Wang, C-Z., Paolollo, R.E., and Johnson,
B.V., 2007, “The Flow Field and Main Gas Ingestion in a Rotor-Stator Cavity”,
ASME Paper GT2007-27671.
Zhou, D.W., Roy, R.P., Wang, C.Z., and Glahn, G.A., 2011, “Main gas Ingestion
in a Turbine Stage for Three rim Cavity Configurations”, ASME Journal of
Turbomachinary, Vol. 133, pp. 031023-1- 031023-12.

48
APPENDIX A
MEASUREMENT UNCERTAINTY

49
MEASUREMENT UNCERTAINTY
Every measurement is subject to some uncertainty. A measurement result
is only complete if it is accompanied by a statement of the uncertainty in the
measurement. Measurement uncertainties can arise from the measuring
instrument, from the variable being measured, from the environment, from the
measurer, as well as from other sources.
Each measurement error will combine in some manner with other errors to
increase the uncertainty of the measurement. Each individual error is referred to
as an element of error. Consider a measurement of x which is subjected to, say, K
elements of error, ej, where j=1, 2… K. A realistic estimate of the uncertainty in
the measurement, ux, due to these elemental errors can be computed using the
root-sum-squares method (RSS).
ux = ± e12 + e2
2 + ⋯ + eK2 (A. 1)
ux = ± ej2
𝐾
𝑗=1
(A. 2)
Uncertainty in time-average static gage pressure measurement
As mentioned in Chapter-2, the time-average static pressure is measured
using a variable reluctance transducer (DP-45), which is routed to the data
acquisition system (DATA6500- Analogic) via a pressure signal carrier
demodulator (CD-12).
50
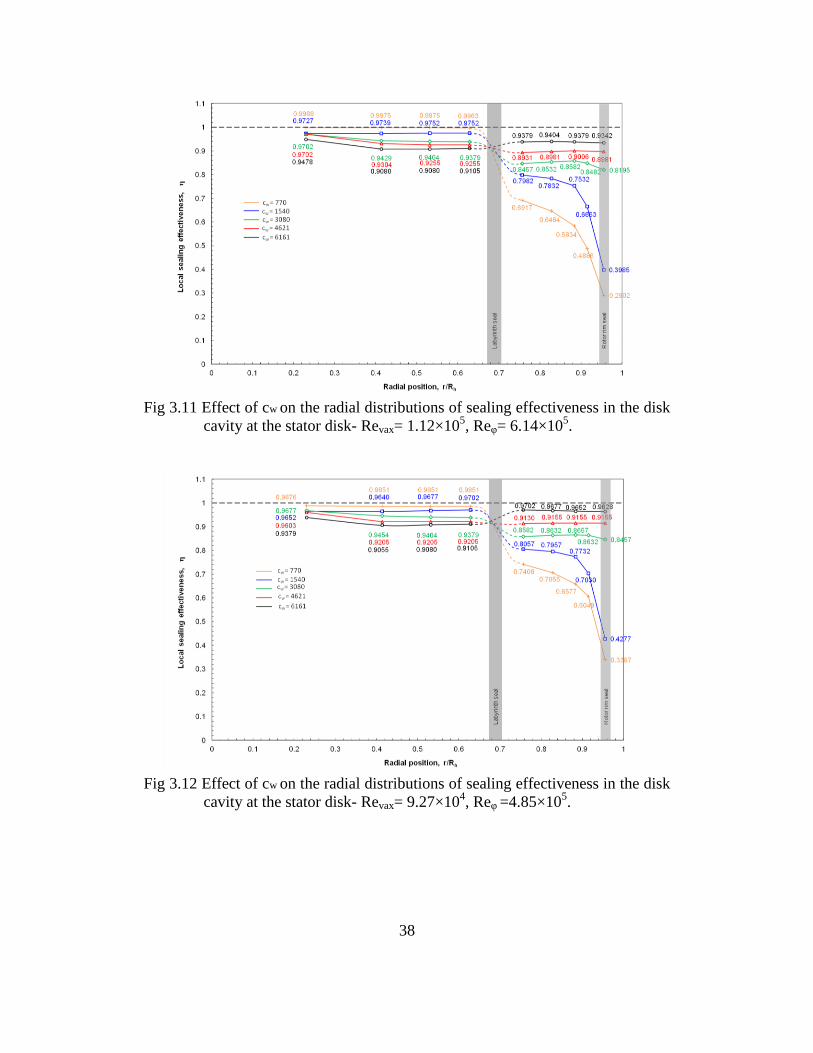
The uncertainty in the measured pressure arises due to the accuracy of the
combined system of variable reluctance transducer (DP-45) & pressure signal
carrier demodulator (CD-12) and uncertainty in the data acquisition system as
shown below in figure A.1.
Fig A.1 Sources of uncertainty in the measured pressure
Following is the pressure transducer calibration equation
y = k × E (A. 3)
y is the measured pressure (psi)
E is the measured voltage (volts)
k is the calibration constant (psi/V)
Therefore the overall uncertainty in the measured pressure (uy) can be written as
uy = f uE , uk A. 4
uE=uncertainty in the measured voltage (volts)
uk=uncertainty in the calibration constant (psi/V)
uy = ± θk × uk 2 + θE × uE 2 (A. 5)
DATA 6500Data acquisition
system
DP 45transducer
CD 12Carrier demodulator
uk
uE

51
θk = ∂y
∂k= E (A. 6a)
θE = ∂y
∂E= k (A. 6b)
uy = ± uk × E 2 + uE × k 2 (A. 7)
Estimating the uncertainty in calibration constant (uk)
The uncertainty in k can be estimated in two different ways. The first
approach makes use of the accuracy value of the pressure transducer (DP-45)
quoted in the technical manual. The second approach directly uses the calibration
data provided for DP45 by Validyne.
uk based on DP45’s quoted accuracy
The quoted accuracy of the pressure transducer (DP-45, Validyne) is
±0.25% of the FS which is 2 psi (corresponds to 10V in CD-12). Hence the
uncertainty @ 2 psi measurement is ± 0.005 psi. The average value of the
calibration constant, kavg is 0.2 psi/volt.
So, k'=2.005 psi/ 10 volts = 0.2005 psi/volt
& k"=1.995 psi/10 volts = 0.1995 psi/volt
Therefore the uncertainty in the calibration constant estimated using the quoted
accuracy of DP45 is uk = ±0.0005 psi/volt .
uk based on DP45 calibration data provided by Validyne
From the calibration data provided by Validyne, the value of k was
calculated to be k = 0.200022 ± 0.000675 psi/V (mean ± stdev). So the
uncertainty in the calibration constant can be taken as uk = ±0.000675 psi/volt

52
Based on the above two estimates it was decided to use the larger value for
the uncertainty in the calibration constant uk = ±0.000675 psi/volt for
calculating the overall uncertainty.
Estimating the uncertainty in the measured voltage (uE)
The uncertainty of the voltage measured by the data acquisition system (Analogic
DATA6500) depends on the quoted accuracy (ua)E and the resolution (ur)E of
DATA6500.
uE = ± ua E2
+ ur E2
(A. 8)
Quoted accuracy = (0.05% of measured Voltage + 0.05% of input range)
Resolution = 0.6 mV. Hence (ur)E = ±0.3 mV
Sample uncertainty calculation for a measured pressure:
A static gage pressure of -5157.96 Pa was measured on the outer-shroud for the
experimental condition Revax = 1.12×10⁵, Reφ = 6.14×10
5, cw = 1540. Table A.1
shows the calculation of uncertainty for this measured pressure.
Table A.1 Calculation of uncertainty in a „sample‟ measured pressure value
Symbol Description Values Units Formula
k Calibration constant 0.200022 psi/V ----
uk Uncertainty in k 0.000675 psi/V ----
MP Measured P -5157.96 Pa ----
MP Measured P -0.7481 psi ----
Mv Measured Voltage -3.74008 V MP/k
E Absolute Voltage 3.74008 V Abs(Mv)
(0.05% of E + 0.05% of 5 V);
±5V was the input range
(ur)E Resolution of DATA6500 0.0003 V (Quoted resolution)/2
uE Uncertainty in measured voltage 0.004377 V Equation A.8
uy Total uncertainty of measured P ±0.002672 psi Equation A.7
%uy % uncertainty in measured Pressure ±0.357181 %
(ua)E Accuracy of DATA6500 0.00437 V

53
The maximum uncertainty from all the measured pressure values was
found to be ± 0.364%. Thus a conservative estimate of ± 0.4% is used as the
maximum uncertainty in the measured static gage pressure.
Fig A.2 Error bar representation of circumferential distribution of time-average
static-gage pressure in the main gas path – Revax= 1.12×10⁵, Reφ=
6.14×10⁵, cw = 1540.
Figure A.2 shows the ±0.4% uncertainty in the measured value of the
circumferential distribution of pressure in the main gas path on the outer shroud
over one vane pitch for the experimental condition Revax = 1.12×10⁵, Reφ =
6.14×10⁵, cw = 1540.
-5400
-5200
-5000
-4800
-4600
-4400
-4200
-4000
-3800
-2 0 2 4 6 8 10 12 14 16 18
Sta
tic
ga
ge
pre
ss
ure
P-P
am
b, (
Pa
)
Angular position q, (o)
Outer shroud, 1 mm downstream of stator vanes trailing edge plane over 1-vane pitch
#1#17
54
Uncertainty in concentration measurements
The NDIR gas analyzer (Siemens- Ultramat 23) is calibrated using pure
nitrogen and a calibration gas. During the AUTOCAL process, the chamber is
purged with nitrogen gas for zero point calibration, and also serves as the initial
value for calculating the full-scale value. The calibration point is also checked
every 3 months using a calibration gas (4% CO2 and 96% N2 balance, flow rate:
1.2-1.8 l/min).
For the gas concentration measurement experiments, the CO2
concentration in the gas sample was measured by the Siemens Ultramat 23. The
various elements of errors are:
The quoted accuracy of the gas analyzer is ±2% FS (which is 5% CO2
volumetric concentration). Thus, the uncertainty in the measured CO2
volumetric concentration due to the accuracy of the instrument is ±0.10 %
CO2 concentration.
The repeatability error was found to be ±0.5%. Since the maximum
concentration measured in the experiment is 4% CO2 volumetric
concentration, the uncertainty in the measured concentration due to the
repeatability error is ±0.02 % CO2 concentration.
The precision of measurements made with a digital instrument is based
predominantly on the reading uncertainty. The uncertainty in reading a
digital scale is ±1/2 of the last resolvable digit. The uncertainty in the

55
measured CO2 volumetric concentration due to the precision error is
±0.005 % CO2 concentration.
From equation A.1
ux = ± 0.10 2 + 0.02 2 + 0.005 2
ux = ± 0.010425
ux = ± 0.1021
Therefore the overall uncertainty in the CO2 volumetric concentration at a
measured 4% value is 4.00 (± 0.102) %.
The CO2 mass concentration is calculated as shown below
mCO 2 ≈ vCO 2
0.6584 + 0.3416 vCO 2 (A. 9)
Where
mCO 2= Mass concentration of CO2 gas
vCO 2= Volumetric concentration of CO2 gas
The CO2 mass concentration for 4% CO2 volumetric concentration is calculated
using equation A.9.
mCO 2 ≈ 0.04
0.6584 + 0.3416 × 0.04
mCO 2 ≈5.9518%
Calculating the uncertainty in mass concentration of CO2 gas:
mCO 2 ≈ 0.04 ± 0.00102
0.6584 + 0.3416 × (0.04 ± 0.00102)
mCO 2 ≈5.9518 ± 0.1487 %

56
Therefore the overall uncertainty in the CO2 mass concentration (at a measured
4% volumetric concentration; equivalently 5.95% mass concentration) is ±0.15%
mass concentration.