experimental study of polyethylene and sulfur dust
TRANSCRIPT

EXPERIMENTAL STUDY OF POLYETHYLENE AND SULFUR
DUST EXPLOSION CHARACTERISTICS
A Thesis
by
MOHAMMAD ZEESHAN KAZMI
Submitted to the Office of Graduate and Professional Studies of
Texas A&M University
in partial fulfillment of the requirements for the degree of
MASTER OF SCIENCE
Chair of Committee, Luc Nicolas Véchot
Co-Chair of Committee, M. Sam Mannan
Committee Members, Hazem Nounou
Head of Department, Muhammad Nazmul Karim
May 2018
Major Subject: Safety Engineering
Copyright 2018 Mohammad Zeeshan Kazmi

ii
ABSTRACT
Polyethylene and sulfur are widely used substances in today’s industries, and
therefore, the assessment and control of dust explosion risks associated with their
production, storage, and usage are of paramount importance to ensure the safety
standards in these industries. Since the petrochemical industry in Qatar is growing vastly
to accommodate the Qatar National Vision for 2030, process industries in Qatar face
challenges to control the hazards and risks of an explosion of both polyethylene and
sulfur dusts which are generated in the polyolefin production process and in the
desulfurization units of the gas processing plants, respectively.
Prevention of polyethylene and sulfur dust explosions and the mitigation of their
consequences require a deep understanding of the explosive properties of these dusts.
This knowledge can be used to reduce the frequency of dust explosions and to minimize
the severity of explosions, therefore controlling the risks associated with polyethylene
and sulfur dust explosions. Very few data exist in literature regarding dust explosibility
properties for high density polyethylene (HDPE) dust and sulfur dust explosions. This
experimental work focused on the determination of one of these explosive properties,
called the minimum explosion concentration (MEC), for both polyethylene and sulfur
dust in the context of the Qatar industry.
To achieve the objectives of this research, the work was divided into three key
phases:

iii
• Phase I: Analysis of physical characteristics of both polyethylene and sulfur
dust found in local industries.
• Phase II: Experimental determination of MEC values for these dusts using a
modified Hartmann tube and a 20-liter sphere.
• Phase III: Determine correlational relationship between dust particle size and
MEC of both polyethylene and sulfur dust.
Results of this work gave insights regarding the explosibility of dust samples
used in local plants at Qatar. This research generates some new MEC data for both
HDPE and sulfur dust using a modified Hartmann tube. It was shown for both sulfur and
polyethylene dust, that at smaller particle sizes (<100 μm), the particle size does not
have a strong influence on MEC values. For larger particle sizes, MEC will clearly
increase with particle size.

iv
ACKNOWLEDGEMENTS
The first person I would like to acknowledge without whom this document would
be a messy draft is Dr. Luc Véchot. He has not only helped me academically and
provided guidance in my research work, but has been a constant motivator, mentor,
advisor, and support at all times. I am also indebted to Dr. Sam Mannan who has helped
me shape my career path and given me the chance to be part of this esteemed graduate
program. I would also like to acknowledge my committee member, Dr. Hazem Nounou,
for his support and time.
I would like to appreciate the support of all members of the Mary Kay O’Connor
Process Safety Center extension in Qatar, especially Dr. Tomasz Olewski, Jack Altwal,
Atif Ashraf, and Dr. Walid Khalfaoui, all of whom were a vital support to me in
accomplishing my research objectives. I would like to thank everyone in Q-Chem,
especially Mr. Venkata, and Wahyu Hidayat from Qatargas.
I wish to dedicate this thesis first to my parents. I pray that this achievement and
the further opportunities which arise from it repay a small part of their sacrifice to make
me who I am. I wish to also thank my spouse, Humaira Tasnim, for her immense
patience, support, and unconditional love, which she has given me throughout my
academic career and life, without which I would not be able to complete this research.
Lastly, all the opportunities I received in my life were a gift from Allah, and all praise
belongs to Him in opening up doors for me beyond my wildest imaginations.

v
CONTRIBUTORS AND FUNDING SOURCES
Contributors
Part 1, faculty committee recognition
This work was supervised by a thesis committee consisting of Professor Luc
Véchot and Professor Sam Mannan of the Department of Chemical Engineering and
Professor Hazem Nounou of the Department of Electrical Engineering.
Part 2, student/collaborator contributions
The data analyzed in Section 5.2.3 and Section 5.4 was provided by research
carried out by Dr Walid Khalfaoui, Atif Ashraf, and Jack Altwal at the Qatar consortium
of the Mary Kay O’ Connor Process Safety Center.
All other work conducted for the thesis was completed by the student
independently, under the supervision of Professor Luc Véchot of the Department of
Chemical Engineering.
Funding Sources
This work was made possible in part by the funding provided by the Qatar
consortium of the Mary Kay O’ Connor Process Safety Center. Its contents are solely the
responsibility of the authors and do not necessarily represent the official views of the
individual companies sponsoring the center.

vi
NOMENCLATURE
ASTM American Society for Testing and Materials
CSB U.S. Chemical Safety and Hazard Investigation Board
dP/dt Rate of Pressure Rise
[dP/dt]m Maximum Rate of Pressure Rise
HDPE High Density Polyethylene
HSE Health and Safety Executive
KSt Dust Deflagration Index
LDPE Low Density Polyethylene
LFL Lower Flammability Limit
LLDPE Linear Low Density Polyethylene
LOC Limiting Oxygen Concentration
MDPE Medium Density Polyethylene
MEC Minimum Explosible Concentration
MIE Minimum Ignition Energy
MIT Minimum Ignition Temperature
MKOPSC Mary Kay O’Connor Process Safety Center
MSDS Material Safety Data Sheet
NFPA National Fire Protection Association
Pm Maximum Pressure
Pmax Maximum Explosion Overpressure

vii
PP Polypropylene
QAPCO Qatar Petrochemical Company
Q-Chem Qatar Chemical Company
UFL Upper Flammability Limit
µm Micrometer
°C Celsius

viii
TABLE OF CONTENTS
Page
ABSTRACT .......................................................................................................................ii
ACKNOWLEDGEMENTS .............................................................................................. iv
CONTRIBUTORS AND FUNDING SOURCES .............................................................. v
NOMENCLATURE .......................................................................................................... vi
TABLE OF CONTENTS ............................................................................................... viii
LIST OF FIGURES ........................................................................................................... xi
LIST OF TABLES .......................................................................................................... xiv
1 INTRODUCTION ......................................................................................................... 1
1.1 Dust explosion incident statistics ................................................................. 1 1.2 Polyethylene & sulfur production and dust explosion issues ....................... 5
1.2.1 Polyethylene production and dust explosion issues .............................. 5 1.2.2 Sulfur production and dust explosion issues ......................................... 6
1.3 Motivation for the project ............................................................................ 7
2 FUNDAMENTALS OF DUST EXPLOSIONS ............................................................ 8
2.1 Definition of a dust ....................................................................................... 8 2.2 Dust explosion pentagon and dust explosion mechanism ............................ 9
2.3 Primary and secondary explosions ............................................................. 13
2.4 Prevention and protection strategies .......................................................... 14 2.5 Dust explosibility characteristics ............................................................... 16
2.5.1 Qualitative assessment of dust explosibility in a modified
Hartmann tube ..................................................................................... 16 2.5.2 Quantitative assessment of dust explosion characteristics .................. 18
2.5.3 Experimental assessment of dust explosion properties ....................... 21
3 LITERATURE REVIEW OF POLYETHYLENE AND SULFUR DUST
PROPERTIES .................................................................................................................. 27
3.1 Polyethylene dust explosion properties ...................................................... 27 3.1.1 Minimum Explosible Concentration (MEC) of polyethylene dust ..... 27 3.1.2 Maximum pressure (Pm) and rate of pressure rise (dP/dt)m of
polyethylene dust ................................................................................ 31

ix
3.1.3 Maximum Explosion Overpressure (Pmax) and Dust Deflagration
Index (KSt) of polyethylene dust ......................................................... 36
3.1.4 Minimum Ignition Energy (MIE) of polyethylene dust ...................... 42 3.1.5 Minimum Ignition Temperature (MIT) of polyethylene dust ............. 44
3.2 Sulfur dust explosion properties ................................................................. 48 3.2.1 Minimum Explosible Concentration (MEC) of sulfur dust ................ 49 3.2.2 Maximum pressure (Pm) and rate of pressure rise (dP/dt)m of sulfur
dust ...................................................................................................... 50 3.2.3 Maximum Explosion Overpressure (Pmax) and Dust Deflagration
Index (KSt) of sulfur dust .................................................................... 51 3.2.4 Minimum Ignition Energy (MIE) of sulfur dust ................................. 52
3.2.5 Minimum Ignition Temperature (MIT) of sulfur dust ........................ 52 3.2.6 Limiting Oxygen Concentration (LOC) of sulfur dust ....................... 55
3.3 Summary of the literature review ............................................................... 55
3.3.1 Polyethylene dust explosion properties .............................................. 55 3.3.2 Sulfur dust explosion properties ......................................................... 57
4 RESEARCH OBJECTIVES AND METHODOLOGY .............................................. 59
4.1 Research objectives .................................................................................... 59 4.2 Methodology .............................................................................................. 60
4.2.1 Phase I: Analysis and physical characterization of the polyethylene
and sulfur dusts found in the local industries of Qatar ....................... 60
4.2.2 Phase II: Experimental determination of the MEC for both
polyethylene and sulfur dust collected on-site .................................... 66
4.2.3 Phase III: Study of the effect of particle size distribution on the
MEC values of polyethylene and sulfur dust ...................................... 76
5 EXPERIMENTAL RESULTS AND DISCUSSION .................................................. 80
5.1 Experimental results for sulfur dust ........................................................... 80 5.1.1 Phase I: Analysis and physical characterization of sulfur dusts
found on-site ....................................................................................... 80 5.1.2 Phase II: Experimental determination of the minimum explosible
concentration (MEC) for sulfur dust collected on-site........................ 91
5.1.3 Phase III: Effect of particle size distribution on the MEC values of
sulfur dust ............................................................................................ 97
5.2 Experimental results for polyethylene dust .............................................. 102 5.2.1 Phase I: Analysis and physical characterization of polyethylene
dusts found in the local industries of Qatar ...................................... 102 5.2.2 Phase II: Experimental determination of the minimum explosible
concentration (MEC) for polyethylene dust collected on-site .......... 110
5.2.3 Phase III: Effect of particle size distribution on the MEC values of
polyethylene dust .............................................................................. 117

x
5.3 Discussion on manual sieving vs. mechanical sieving ............................. 120 5.3.1 Experimental results with manually sieved samples of polyethylene
dust .................................................................................................... 122 5.3.2 Experimental results with manually sieved samples of sulfur dust .. 123
5.4 Comparison of results using a modified Hartmann tube vs 20-liter
sphere for a sample of sulfur dust ............................................................ 124
6 CONCLUSIONS ....................................................................................................... 127
6.1 Sulfur dust ................................................................................................ 127 6.2 Polyethylene dust ..................................................................................... 128 6.3 Future research ......................................................................................... 129
REFERENCES ............................................................................................................... 130
APPENDIX .................................................................................................................... 135

xi
LIST OF FIGURES
Page
Figure 1. Distribution of dust explosions by material – United Kingdom (1979-1988) .... 2
Figure 2. Dust explosions in the United States, 1980-2005 ............................................... 4
Figure 3. Fatalities from dust explosions in United States, 1980-2005 ............................. 5
Figure 4. Dust explosion pentagon ..................................................................................... 9
Figure 5. Mapping the dust explosion process in sequence ............................................. 11
Figure 6. Explosion mechanism of dust particles ............................................................ 12
Figure 7. Detailed modified Hartmann tube illustration .................................................. 18
Figure 8. Dust explosion pentagon in relation to dust explosion properties .................... 19
Figure 9. Illustration of 20-liter dust explosion sphere .................................................... 22
Figure 10. Mike-3 apparatus ............................................................................................ 25
Figure 11. Godbert-Greenwald furnace schematic........................................................... 26
Figure 12. Lean flammability limit for polyethylene powder as a function of particle
size .................................................................................................................... 29
Figure 13. Variation of MEC with particle size for polyethylene dust. ........................... 30
Figure 14. Effect of turbulence on Pm for different dusts ................................................. 33
Figure 15. Pm data for polyethylene dusts compared with those of methane gas ............ 35
Figure 16. Effect of atmosphere humidity on Pm and (dP/dt)m for polyethylene dust ...... 36
Figure 17. Effect of dust particle size on Pmax for polyethylene dust ............................... 39
Figure 18. Effect of particle size on KSt of a polyethylene dust sample: , average
diameter 20 µm; , average diameter 56 µm; , average diameter 98 µm;
, average diameter 116 µm. ........................................................................... 40
Figure 19. Effect of particle size on KSt of polyethylene and silicon ....................... 40
Figure 20. Effect of particle size on MIE of polyethylene dust. ...................................... 43

xii
Figure 21. Autoignition data from the 1.2-liter furnace plotted as temperature versus
concentration: , ignitions; , non-ignitions (particle size 37 µm) .................. 44
Figure 22. Variation of MIT with dust concentration for polyethylene (particle size
between 106-125 µm) ....................................................................................... 45
Figure 23. Particle size dependence for the MIT for polyethylene .................................. 47
Figure 24. Influence of dust concentration on Pm and (dP/dt)m ....................................... 50
Figure 25. Effect of dust concentration on ignition temperature of sulfur dust ............... 53
Figure 26. Influence of water content on ignition energy and ignition temperature of
sulfur dust ......................................................................................................... 54
Figure 27. Beckman Coulter LS 13 320 particle analyzer ............................................... 62
Figure 28. Typical particle size range analysis results ..................................................... 63
Figure 29. SEM pictures of a polyethylene dust sample .................................................. 64
Figure 30. FEI Quanta 400 Scanning Electron Microscope (SEM) ................................. 65
Figure 31. Rigaku ZSX Primus II WDXRF X-ray fluorescence spectrometer ................ 65
Figure 32. TAMUQ’s modified Hartmann tube ............................................................... 67
Figure 33. Schematic of a modified Hartmann tube ........................................................ 68
Figure 34. Schematic of pierced lid positions and its qualitative assumptions
(modified Hartmann tube) ................................................................................ 68
Figure 35. Picture of the modified Hartmann tube during an MEC measurements ......... 69
Figure 36. Pictorial representation of TAMUQ 20-liter dust explosion sphere ............... 74
Figure 37. Schematic of 20-liter dust explosion sphere ................................................... 75
Figure 38. Pestle and mortar for dust grinding ................................................................. 77
Figure 39. TAMUQ mechanical siever (RoTap RX-29 Sieve-Shaker) ........................... 79
Figure 40. Graphical illustration of process for granulated sulfur samples ..................... 81
Figure 41. Graphical illustration of process for prilled sulfur samples ............................ 83
Figure 42. Particle size characterization of sulfur dust collected on site ......................... 86

xiii
Figure 43. Explosibility results for on-site sulfur dust samples ....................................... 93
Figure 44. Pictures of the fire / explosion of sulfur dust (collected on-site) in the
modified Hartmann tube ................................................................................... 96
Figure 45. Graphical summary of explosibility results of sieved sulfur samples ............ 99
Figure 46. Particle size characterization of polyethylene dust collected on-site............ 106
Figure 47. Explosibility results for on-site polyethylene dust samples .......................... 111
Figure 48. Pictures of the fire / explosion of polyethylene and additives dust
(collected on-site) in the modified Hartmann tube ......................................... 114
Figure 49. Graphical summary of explosibility results of sieved polyethylene
samples ........................................................................................................... 119
Figure 50. MEC measurement for QG_Sulfur_WC using a 20-liter sphere .................. 126

xiv
LIST OF TABLES
Page
Table 1. Dust explosions in West Germany, 1965-1980: Fatalities and injuries in a
sample of 357 explosions .................................................................................... 3
Table 2. Dust explosions in the United States, 1900-1956: Fatalities, injuries, and
material losses in a sample of 1123 explosions .................................................. 3
Table 3. Polyethylene production capacity in Qatar .......................................................... 6
Table 4. Means of preventing and mitigating dust explosions ......................................... 16
Table 5. Dust explosion classification based on KSt value ............................................... 20
Table 6. Minimum Explosible Concentration (MEC) of polyethylene dust .................... 28
Table 7. 20-liter sphere experiment with polyethylene Pm and (dP/dt)m .......................... 32
Table 8. Pmax and KSt of polyethylene dust ...................................................................... 37
Table 9. Minimum Ignition Energy (MIE) of polyethylene dust ..................................... 42
Table 10. Minimum Ignition Temperature (MIT) of polyethylene dust .......................... 46
Table 11. Dust explosion properties of sulfur dust .......................................................... 48
Table 12. Limiting Oxygen Concentration (LOC) of sulfur dust. ................................... 55
Table 13. Summary of effect of critical parameters on polyethylene dust explosion
properties .......................................................................................................... 57
Table 14. Origin and identification of sulfur samples ...................................................... 82
Table 15. Origin of prilled sulfur samples ....................................................................... 84
Table 16. Summary of particle sizes for granulated sulfur samples ................................ 84
Table 17. Chemical composition of sulfur dust samples ................................................. 90
Table 18. Summary of explosibility results for on-site sulfur dust samples .................... 92
Table 19. Summary of explosibility results of sieved sulfur samples .............................. 98
Table 20. Location and identification of the dust samples from the polyethylene
plant .................................................................................................................103

xv
Table 21. Summary of particle sizes for polyethylene and additive samples ................ 105
Table 22. Summary of explosibility results for on-site polyethylene dust and additive
samples ........................................................................................................... 110
Table 23. Summary of explosiblity results for sieved polyethylene samples ................ 118
Table 24. Explosibility results of manually sieved polyethylene dusts ......................... 123
Table 25. Determination of MEC in 20-liter sphere (ASTM E1515) ............................ 125

1
1 INTRODUCTION
Dust explosion is one of the most common and widespread hazards faced by the
process industry where explosible powders (e.g., organic or metal dust) are handled,
stored, processed, or produced1. A dust explosion involves a rapid combustion of dust
particles suspended in air with the generation of a pressure wave2. This phenomena can
be very energetic and damaging as the generated pressure can cause severe injuries and
fatalities, and destroy buildings3. The injuries and fatalities usually occur in two ways.
The initial damage is caused in proximity to the explosion, where people exposed to the
explosion are burned by the intense heat of the dust cloud. The secondary damage
caused to both people and property is by flying objects, falling structures, and debris,
which can lead to many injuries and fatalities3.
1.1 Dust explosion incident statistics
The lack of fundamental understanding and improper hazard assessment of
primary and secondary dust explosions are frequently the cause of serious incidents in
the chemical process industry. Very few statistics of dust explosion incidents are
available in the open literature. However, from those that can be found, the severity and
catastrophic consequences of these explosions are clearly reflected.
As an example, in the United Kingdom, 485 explosions and 715 fires involving
flammable dust were reported between 1965 and 1980. These incidents caused 26
fatalities and 639 injuries4. Between the period of 1979 - 1988, 303 dust explosions took

2
place in the United Kingdom as shown in Figure 1, out of which 92 incidents resulted in
injuries5. More recently in 2011, information provided by HazardEx reported that nearly
2000 dust explosions occurred in Europe annually, out of which 50 were reported to be
from the United Kingdom alone6.
Figure 1. Distribution of dust explosions by material – United Kingdom (1979-1988)
Reprinted from 5.
In West Germany from 1965 to 1980, 357 explosions were recorded, which
resulted in 103 fatalities and 492 injuries as shown in Table 1. The National Fire
9
28
12
8
28
3
9
25
9
12
12
27
15
16
41
0
1
18
16
14
Other
Metals
Pharmaceutical/Organic
Pulerised Fuel
Paper/Wood
Dyes/Pigments
Plastics/Resins
Food Products
Animal Feed
Grain/Cereals
NUMBER OF EVENTS INVOLVING DUST
DU
ST T
YPE
HSE (1979-88) - TYPE OF DUST INVOLVED IN EVENTS (BASED ON 303 EVENTS)
1979-84 1985-88

3
Protection Association (NFPA) published a very detailed report concerning dust
explosion in the United States from 1900 to 1956, and counted the number of explosions
to be totaling 1,123. These explosions resulted in 676 fatalities, 1,770 injuries, and 100
million dollars in material losses as shown in Table 27.
Table 1. Dust explosions in West Germany, 1965-1980: Fatalities and injuries in a
sample of 357 explosions
Reprinted from 7.
TYPES OF DUST EXPLOSIONS FATALITIES INJURIES No. (%) No. (%) Per explosion No. (%) Per explosion
Wood and bark 113 31.6 12 11.7 0.11 124 25 1.10
Food and feed 88 24.7 38 36.8 0.43 127 26 1.44
Metals 47 13.2 18 17.5 0.38 91 18.5 1.94
Plastics 46 12.9 18 17.5 0.39 98 20 2.13
Coal and peat 33 9.2 7 6.8 0.21 39 8 1.18
Paper 7 2.0 0 0.0 0.0 0 0 0.0
Others 23 6.4 10 9.7 0.43 13 2.5 0.56
All 357 100.0 103 100.0 492 100.0
Table 2. Dust explosions in the United States, 1900-1956: Fatalities, injuries, and
material losses in a sample of 1123 explosions
Reprinted from 7.
TYPES OF DUST EXPLOSIONS FATALITIES INJURIES MATERIAL LOSSES
No. (%) No. (%) Per
explosion No. (%)
Per explosion
Million $
Per explosion
Wood and bark 162 14.5 38 5.6 0.23 160 9.0 0.99 11.4 0.070
Food and feed 577 51.4 409 60.5 0.71 1061 60.0 1.84 75.8 0.131
Metals 80 7.1 108 16.0 1.35 198 11.2 2.48 3.2 0.040
Plastics 61 5.4 44 6.5 0.72 121 6.8 1.98 3.7 0.061
Coal (not mines)
63 5.6 30 4.4 0.48 37 2.1 0.59 1.6 0.025
Paper 9 0.8 0 0.0 0.0 0 0.0 0.0 0.5 0.056
Others 171 15.2 47 7.0 0.27 193 10.9 1.13 4.3 0.025
All 1123 100.0 676 100.0 1170 100.0 100.5

4
According to the CSB report in 2006, 281 dust fires and explosions occurred in
the United States between 1980 and 2005, causing 119 deaths and 718 injuries as shown
in Figure 33. An interesting point to note from Table 1, Table 2, and Figure 2 is that food
and wood dust explosion are the most common type of incidents across all countries and
that plastics also constitute a good percentage of the dust explosion incidents. This is of
particular interest to this research as one of the dusts this research is going to focus on is
polyethylene dust, which is also responsible for dust explosions in the plastics industry.
Figure 2. Dust explosions in the United States, 1980-2005
Reprinted from 3.
Food23%
Wood24%Metal
20%
Plastic14%
Coal8%
Inorganic4%
Other7%
DISTRIBUTION OF COMBUSTIBLE DUSTS BY MATERIAL
Food
Wood
Metal
Plastic
Coal
Inorganic
Other

5
Figure 3. Fatalities from dust explosions in United States, 1980-2005
Reprinted from 3.
1.2 Polyethylene & sulfur production and dust explosion issues
In the State of Qatar, the process industry faces many challenges to control the
risks of explosion of mainly two types of explosible dust material in their facilities:
polyethylene dusts from polyolefins production processes and sulfur dusts from
desulfurization units in gas processing plants.
1.2.1 Polyethylene production and dust explosion issues
The petrochemical industry in Qatar is growing vastly to accommodate the Qatar
National Vision for 2030. Three major companies manufacture polyethylene in Qatar
(Qatar Petrochemical Company (QAPCO), Qatar Chemical Company (Q-Chem), and
Qatofin). Table 3 shows a summary of the polyethylene production capacities of these

6
companies. The polyethylene pellets production process involves the generation of
polyethylene dusts in various stages of the process units. Fine polyethylene dust
dispersed in air in sufficient concentration and in the presence of an ignition source, may
pose a potential dust explosion hazard.
Table 3. Polyethylene production capacity in Qatar
COMPANY PRODUCTION CAPACITY
Qatar Petrochemical Company (QAPCO)8
700 KTA of Low Density Polyethylene (LDPE):
• 2 LDPE plants with a global capacity of 400 KTA
• New LDPE 3 plant 300 KTA
Qatofin (Joint venture between QAPCO, Total, and Qatar Petroleum)9
World class petrochemical plant capable of producing 450 KTA of Linear Low Density Polyethylene (LLDPE) in development
Qatar Chemical Company (Q-Chem)10
453 KTA high-density and medium-density polyethylene (HDPE & MDPE) plant:
• New Q-Chem II HDPE plant project to expand Q-Chem
1.2.2 Sulfur production and dust explosion issues
The world production of sulfur in 2011 amounted to 69 million tons, with 15
countries contributing more than 1 million tons each11. It is also projected that the sulfur
production in the Middle East will grow by 12.6 million tons from 2009 to 201912.
Similarly, the sulfur production in Qatar has expanded significantly from 400,000 tons in
2005 to 3.5 million tons in 2015. This high output is driven by the petroleum and natural
gas industry in Qatar which produces more than 1 million barrel of crude and gas
condensate per day13. The main sulfur producing companies are QAPCO, Q-Chem, and

7
Qatargas. As with polyethylene dust, the production of elemental sulfur produced at
various locations of the plant can be involved in a dust explosion.
1.3 Motivation for the project
The prevention of polyethylene and sulfur dust explosions and the mitigation of
its consequences require a deep understanding of the explosive properties of such dusts.
This knowledge can be used to reduce the frequency of dust explosions and to minimize
the severity of the explosion, and therefore control the risks associated with polyethylene
and sulfur dust explosions. This thesis answers to a request from the Qatar industry
through the industry consortium of the Mary Kay O’Connor Process Safety Center
(MKOPSC) to improve the current knowledge of the explosion properties of
polyethylene and sulfur dust. The aim of this research is to perform an experimental and
theoretical study on polyethylene and sulfur dust explosions in the context of the Qatar
industry. The research aimed to fulfill three major objectives.
• The first objective was to conduct the physical characterizations for polyethylene
and sulfur dusts found in the local industries of Qatar.
• The second objective focuses on the determination of the minimum explosion
concentration (MEC) for polyethylene and sulfur dust in the particular context of
the Qatar industry.
• The third objective of the research was to find the effect of particle size
distribution of polyethylene and sulfur dust on the MEC.

8
2 FUNDAMENTALS OF DUST EXPLOSIONS
This section introduces the phenomena involved in a dust explosion along with
the dust explosion characteristics to be determined for the control of the risks associated
with dust explosion in a process plant.
2.1 Definition of a dust
There is currently no agreed standard definition of dust worldwide. The
difference in classification is in regards to the particle size at which the dust exhibits
explosibility and flame propagation properties once the required conditions for a dust
explosion are met. The definition of a explosible dust, according to the National Fire
Protection Association (NFPA 654, 2000), corresponds to “any finely divided solid
material which is 420 microns or smaller in diameter (material passing a US No. 40
Standard Sieve) and that it presents a fire or explosion hazard when dispersed and
ignited in air”14. The British Standards Institute in London in 1958 defined materials
with particle size less than 1000 microns as powders, and particles with diameter size
less than 76 microns as dust1. The former US Bureau of Mines developed the following
classification for dusts based on particle size14:
i. Dust related to coalmines - particles smaller than 850 microns.
ii. Dust related to surface industriesa - particles smaller than 425 microns.
a Surface industries – Industries which are above ground level

9
2.2 Dust explosion pentagon and dust explosion mechanism
In order for a dust explosion to occur, five conditions must be met as described in
the Dust Explosion Pentagon shown in Figure 4.
Figure 4. Dust explosion pentagon
i. Esplosible Dust: The dust must be explosible and present in a finely divided
form in the right concentrations.
ii. Oxidant: An oxidant must be present to enable combustion (e.g., oxygen in the
air).
iii. Ignition: An ignition source of sufficient energy must be present. Ignition of a
dust cloud can occur in two ways.
iv. Dispersion: The dust particles must be suspended in air and mixed with the
oxidant for a dust explosion to occur15. Suspended dust burns more rapidly,
which is what gives rise to an explosion rather than just a fire. The mixing of the

10
dust with the oxidant also illustrates the key difference between dust explosion
and gas explosion, where the dust is a solid fuel rather than a gaseous fuel. In a
gas explosion, there is a thorough mixing of both fuel and oxidant. This is
because the smallest entities of fuel in air are separated only by molecular
distances, and thus, the gravitational effects in such an explosion are negligible.
On the other hand, in a dust/air mixture, the dust particles, due to their larger
weight, are strongly influenced by gravity. This has a direct effect on the
formation of a dust/oxidant suspension which is a key condition for any dust
explosion16,17.
v. Confinement: The confinement of the dust cloud is a prerequisite to have a rapid
increase in pressure for the explosion to take place18. The confinement of the dust
cloud allows an overpressure to develop, which in turn enables a fast-burning
dust flame, which then transitions into a dust explosion16. This confinement
usually occurs in closed spaces, such as, in equipment or buildings, but it could
also be caused by self-confinement if the reaction is fast enough. It is also
entirely “possible to have a destructive explosion even in open air if the reaction
is so fast that the pressure builds up in the dust cloud faster than it can be
released at the edge of the cloud”19.
The dust explosion mechanism can be explained by the sequence of events as
follows. First, the dust is dispersed in an oxidant rich environment (e.g., air). This
dispersed dust finds an ignition source which transfers energy to the particles (through

11
conduction and radiation). The heat transferred vaporizes the material, forming a layer of
combustible vapor at the surface of the dust particle that enters a combustion reaction
with the oxidant in the air. The initiated flame propagates to other dust particles and
leads to a rapid combustion throughout the dust cloud following the same mechanism.
Due to the confined space, this flame propagation keeps on accelerating which gives a
rise to a pressure wave. A pictorial representation of this process is shown in Figure 6 20.
The flame propagation rate of the explosion is dependent on many factors related to the
nature of the dust, dust particle size, and the nature of combustion of the by-products
formed1.
The dust explosion pentagon can also be utilized in mapping out the dust
explosion process in time. This is obtained by unwrapping the pentagon in the clockwise
direction as shown in Figure 5. This figure shows the different process mechanisms,
which are arranged based on their time-related position during the evolution of the
explosion. Additional mechanisms which affect explosion severity, such as, flame
propagation and acceleration have also been added to the flowchart18.
Figure 5. Mapping the dust explosion process in sequence
Reprinted from 18.

12
Figure 6. Explosion mechanism of dust particles
Reprinted from 20.
It is also essential to understand that dust explosions and gas explosions
significantly differ from each other. It is very likely that in similar conditions, it would
be quite easy to produce a gas cloud, but not so easy to produce a dust cloud. One of the
reasons is that the propagation of flames in dust/air mixtures is not just limited to the
flammable dust concentration range of the clouds, which is the opposite of what happens
in gas flame propagation. This is because the deposits of dust actually offer a discrete
and different possibility of flame propagation. Other differences are captured in the fact
that initial forces in the dust cloud can produce fuel concentration gradients, and that

13
thermal radiation could be an important contributing factor in the heat transfer of the
flame to the unburnt cloud1.
There is still much more research which needs to be conducted to understand
flame propagation in dust clouds. Some of the key factors to consider are flame
distortion and the turbulence propagated by the explosion itself. Some of the differences
between premixed gases and dust clouds were captured by Rzal and Vessiere in their
experiments of a laminar maize starch/air flame using different obstacles, such as, a disk,
an annulus, and a sphere. While observing the flame propagation with an annulus, it was
observed that there was a flame-quenching phenomenon present, which could be
explained by centrifugal separation of dust particles and air. As such, this finding was
very significant in proving that burning rate of dust clouds does not respond to
turbulence in the same way as the burning rate of a premixed gas does21.
2.3 Primary and secondary explosions
A dust explosion can either be classified as a primary explosion or a secondary
one. A primary dust explosion usually occurs in closed and confined equipment or room
where a dust disperses, ignites, and explodes within the equipment3. One of the key
differences between a dust explosion and gas explosion is that gas explosions very rarely
occur inside vessels due to a lack of air to support the explosion. However, primary dust
explosions generally occur in the process equipment as the condition of confinement is
met inside such vessels. Thus, a dust explosion which is severe enough can cause the

14
vessel to rupture if it has insufficient pressure release devices, or if its design pressure is
too low to withstand the overpressure generated by the dust explosion1.
A secondary explosion occurs when dust accumulated on floors or ceilings or
other surfaces is disturbed, lofted, and ignited by a primary explosion. Generally, the
melted dust particles in the primary explosion provides the sparks needed for secondary
explosions. These secondary explosions accelerate the combustion of the dust as the
pressure increases22. The pressure wave from the secondary explosions then cause the
accumulated dust in other areas to become suspended in air, which in turn leads to
multiple secondary dust explosions. Thus, a weak primary explosion can cause very
powerful secondary dust explosions, based on the amount of dust prevalent around in the
factory and equipment. Another point to note is that the initiating event for a secondary
dust explosion might not be a dust explosion at all. The incidents outlined in the CSB
report, such as, the CTA Acoustics, West Pharmaceutical Services, and Ford River
Rouge, are all examples of secondary dust explosions initiated by events that were not
dust explosions3.
2.4 Prevention and protection strategies
The control and prevention of dust explosion hazards make use of two elements.
These are the dust explosion pentagon, and the Basis of Safety approach. The explosion
pentagon shown in Figure 4, offer guidance in identifying the factors that cause dust
explosions. For example, the explosion pentagon gives several approaches of explosion
prevention to the industry. Some examples of these approaches are, “removal of fuel by

15
good housekeeping and removal of electrostatic ignition sources by grounding and
bonding”16. Similarly, the dust explosion pentagon helps in visualizing the explosion
requirements, which leads to identification of measures for explosion mitigation, such
as, isolation venting or isolation containment16.
A Basis of Safety approach is a safeguarding philosophy, which involves specific
devices, equipment, and procedures, whose purpose is to greatly weaken or eliminate
one of the pentagon sides to such an extent that a dust explosion cannot occur. The
approach also takes into account that if the explosion does occur, then employees and
facilities are protected from dangerous and adverse effects of the explosion. Generally,
the three methods used to prevent dust explosions are either eliminating the ignition
sources, or controlling the oxidant required for the explosion to occur, or controlling the
fuel required for the dust explosion15.
Once the prevention strategies fail in stopping the dust explosion, the protection
strategies are used as a fallback measure, so that the explosion does not cause substantial
damage to life and property. Some of the most common forms of protection strategies
are explosion containment, explosion suppression, explosion isolation, and explosion
venting. Eckhoff in Table 4 presents some of the prevention and mitigation techniques,
which are used, in combating the possibility of a dust explosion. It clearly separates
prevention and mitigation as two separate measures to combat a dust explosion hazard7.

16
Table 4. Means of preventing and mitigating dust explosions
Reprinted from 7. PREVENTION MITIGATION
Preventing ignition sources Preventing explosible dust clouds
a. Smoldering combustion in dust, dust flames
f. Inerting by N2, CO2, and rare gases
j. Partial inerting by inert gas
b. Other types of open flames (e.g., hot work)
g. Intrinsic inerting k. Isolation (sectioning)
c. Hot surfaces h. Inerting by adding inert dust l. Venting
d. Electric sparks and arcs, electrostatic discharges
i. Dust concentration outside explosible range
m. Pressure-resistant construction
e. Heat from mechanical impact (metal sparks & hot spots)
n. Automatic suppression
o. Good housekeeping (dust removal, cleaning)
2.5 Dust explosibility characteristics
The first step in the determination of dust explosion hazards is the simple
qualitative assessment of the potential for a dust material to explode. Once this potential
is established, a more in-depth analysis of the dust explosibility properties is performed
to quantitatively evaluate factors which affect the frequency and the severity of the
consequences.
2.5.1 Qualitative assessment of dust explosibility in a modified Hartmann tube
A modified Hartmann tube is used to determine whether the dust is explosible or
not, and provide a qualitative indication of the intensity of the explosion. The equipment
is a 1.2-liter vertical tube mounted onto a dust dispersion system in which the dust is
dispersed using an air blast and ignited using an induction ignition system or a coil
ignition system. The 1.2-liter tube is made of transparent glass material which allows for

17
the visual capture of whether the dust ignited or had an explosion. Figure 7 provides a
graphical representation of the workings of the modified Hartmann tube. If there is an
explosion, then the lid at the top of the tube flips, signifying the severity of the
explosion.
The general dust explosibility classification, which has been used for years, is
divided broadly in two categories22:
• Category A – Dust which ignite and propagate a flame
• Category B – Dust which do not propagate a flame in the test apparatus
These classifications replaced an earlier scheme where dusts were divided into
Class I, II, or III. Broadly speaking, Class I corresponded to Group A of dusts, while
Class II and III corresponded to Group B23. In the United States, explosible dusts are
classified as hazardous materials under the NFPA classification. Class I is given to
gases, whereas Class II has been assigned to dusts. The dust classification has been
further subdivided into E for metal dusts, F for carbonaceous dusts, and G for flour
dusts23.

18
Figure 7. Detailed modified Hartmann tube illustration
2.5.2 Quantitative assessment of dust explosion characteristics
Quantitative assessment of dust explosion characteristics refers to the
quantification of the properties that are related to the five conditions of the dust
explosion pentagon, in that they prove to be critical factors in either preventing a dust
explosion or mitigating its consequences as shown in detail in Figure 8.

19
Figure 8. Dust explosion pentagon in relation to dust explosion properties
2.5.2.1 Minimum Explosible Concentration (MEC)
The MEC is “the minimum concentration of a combustible dust cloud that is
capable of propagating a deflagration through a well dispersed mixture of the dust and
air under the specified conditions of test”24. If the concentration of the dust dispersed in
air does not reach the MEC, then there is not enough fuel for the explosion to occur. It is
essential that the concentration of suspended dust be within the parameters of the
explosible range for an explosion to occur. This can be explained in a similar manner by
giving the example of flammability ranges, such as, Lower Flammability Limit (LFL)
and Upper Flammability Limit (UFL), which define the minimum and maximum ranges
of concentration for commonly used vapors to ignite3. This is helpful in dust prevention
mechanisms, especially in confined equipment where the risks of dust explosions are
much higher25.

20
2.5.2.2 Maximum Explosion Overpressure (Pmax)
The maximum explosion overpressure (Pmax) is the maximum pressure that the
dust explosion can develop in a given confined volume. This parameter serves as an
indication of the potential destructive pressures that could be generated during a dust
explosion of the material being tested, and it is usually used for venting, suppression,
isolation, and containment designs26.
2.5.2.3 Dust Deflagration Index (KSt)
The maximum rate of pressure increase accompanying an explosion (dP/dt)m
indicates the robustness and strength of an explosion. When testing for explosibility
characteristics in vessels of different volumes, it was found that “a plot of the logarithm
of the maximum pressure slope versus the logarithm of the vessel volume frequently
produced a straight line of slope -1/3”. This relationship was named the cubic law27,
where KSt is the dust deflagration index (Table 5):
1
3max( ) st
dPV K
dt
Equation 1
Table 5. Dust explosion classification based on KSt value
Reprinted from 3.
DUST DEFLAGRATION INDEX (KSt) CLASSIFICATION
0 no explosion
0 < KSt < 200 weak explosion (dust explosion class 1)
200 < KSt < 300 strong explosion (dust explosion class 2)
300 < KSt very strong explosion (dust explosion class 3)

21
2.5.2.4 Limiting Oxygen Concentration (LOC)
The LOC is defined as the average of the lowest oxygen concentration at which
an explosion takes place and the highest oxygen concentration in a dust/air mixture in
which an explosion just fails to take place. This property is used to inert vessels to
prevent dust explosions.
2.5.2.5 Minimum Ignition Energy (MIE)
The MIE is the minimum amount of energy required to ignite a explosible dust
cloud. This is used for the control of ignition sources in areas prone to dust explosions.
2.5.2.6 Minimum Ignition Temperature (MIT)
The MIT is specified as the lowest temperature at which the dust cloud is ignited.
This is used for the control of ignition by contact with a hot surface in areas prone to
dust explosions (e.g., hot surface on equipment).
2.5.3 Experimental assessment of dust explosion properties
The above explosion properties are generally measured using three equipment:
• 20-liter sphere for MEC, Pmax, KSt, and LOC
• Mike-3 apparatus for MIE
• Godbert-Greenwald furnace for MIT

22
2.5.3.1 20-liter sphere (MEC, Pmax, KSt, and LOC)
The 20-liter dust explosion sphere is used to measure the Pmax, KSt, and LOC of a
dust explosion (Figure 9). It is an enclosed chamber made of stainless steel that measures
the overpressure and the rate of pressure rise for an explosion. This rate of pressure rise
is directly tied to calculating the dust deflagration index value of the dust explosion.
These data are measured by the pressure transducers present in the inner chamber of the
sphere. This data is then collected and stored using a high-speed computer-based data
acquisition system.
Figure 9. Illustration of 20-liter dust explosion sphere

23
2.5.3.1.1 Measuring Minimum Explosible Concentration (MEC)
The methodology to measure the MEC using a 20-liter sphere is provided by the
ASTM E1515 standard. The standard recommends to start testing a dust sample from a
dust concentration of 100 g/m3, and if a deflagration occurs, then the dust concentration
is reduced till no deflagration occurs. If a deflagration does not occur at 100 g/m3, then
the concentration is increased until a deflagration occurs. This process is repeated till the
lowest concentration at which the dust explodes is found. This lowest concentration at
which the dust explodes is the MEC value for that particle size value and range24.
2.5.3.1.2 Measuring Pmax and KSt
Both the Pmax and maximum rate of pressure rise are also measured using
pressure transducers in the 20-liter sphere. The ASTM E1226 standard gives the steps
required to measure both the Pmax and KSt values. It is recommended to start testing a
dust sample from a dust concentration of 250 g/m3. The pressure time curves give
“maximum pressure” and the rate of pressure rise for that specific dust concentration.
Tests are performed with increasing dust concentration by 250 g/m3 to plot the variation
of the “maximum pressure” and the rate of pressure rise as a function of dust
concentration. Pmax and (dP/dt)m represent the maximum values of these curves. Once
the maximum values for Pmax and (dP/dt)m have been found, two further tests are
conducted at that same dust concentration and at least one test is conducted at each side
of the optimal dust concentration to ensure repeatability of results. The (dP/dt)m and Pmax
values are normally obtained in the 500 to 1250 g/m3 range. In many cases, the correct

24
Pmax and (dP/dt)m values are not found at the same concentrations. The (dP/dt)m values
are then used to calculate the KSt values for that dust sample28.
2.5.3.1.3 Measuring Limiting Oxygen Concentration (LOC)
The concentration of oxygen inside the 20-liter sphere can be controlled to
measure the LOC as outlined in the ASTM E2931 standards29. It recommends to start the
tests from a dust concentration of 500 g/m3. The oxygen concentration in the sphere and
the dust concentration are varied to find the following:
• L: The lowest oxidant concentration at which flame propagation is possible for at
least one dust concentration.
• H: The highest oxidant concentration at which flame propagation is not possible
for the same dust concentration.
The LOC for that dust sample is then defined as:
𝐿𝑂𝐶 =𝐿 + 𝐻
2 Equation 2
2.5.3.2 Mike-3 apparatus (MIE)
The Mike-3 apparatus (Figure 10) is very similar to the modified Hartmann tube
in that the dispersion and ignition occur in 1.2-liter transparent glass tube (see paragraph
2.5.1). The main difference is that the voltage provided to the electrodes can be varied,
which is then used to vary the amount of energy being supplied by the electrodes for the
ignition to occur30. The MIE is given by the minimum energy of the electrode that was
required to ignite a explosible dust cloud.

25
Figure 10. Mike-3 apparatus
Reprinted from 31.
2.5.3.3 Godbert-Greenwald furnace (MIT)
A Godbert-Greenwald furnace is generally used to measure the minimum
ignition temperature of a dust 23. It can also be used in explosiblity testing of Class B
dusts 22. The common components of a Godbert-Greenwald furnace are a dust chamber
to store the dust, a pressure vessel, a heater to heat the oven, and a thermocouple to
measure the temperature of the oven. Figure 11 provides a detailed diagram and
schematic of a Godbert-Greenwald furnace32. The dust is injected into the vertical tube
in the furnace which is held at a constant temperature. When the dust passes through the
furnace, if a flame is observed at the end of the furnace, the dust is classified to be
explosible. The temperature is varied to measure the lowest temperature at which the

26
dust would explode. A 20-liter sphere can also be modified by adding thermocouples to
find out the MIT of an explosible dust23.
Figure 11. Godbert-Greenwald furnace schematic
Reprinted from 32.

27
3 LITERATURE REVIEW OF POLYETHYLENE AND SULFUR DUST
PROPERTIES
This section summarizes the intensive literature search to gather published
explosive properties of polyethylene and sulfur dust. The influence of the dust
concentration, dust particle size, and humidity of the properties will be discussed.
3.1 Polyethylene dust explosion properties
3.1.1 Minimum Explosible Concentration (MEC) of polyethylene dust
Table 6 presents a summary of all MEC values for polyethylene we found in the
literature. The MEC generally ranges from 10 to 500 g/m3 for particle average diameters
ranging from approx. 27 to 200 µm. The gathered data have been obtained from different
types of equipment and with samples of different particle size. Some of these values are
for low density polyethylene dust (LDPE). No MEC data was found for high density
polyethylene (HDPE) dust. In many cases, the type of polyethylene used for the
experiment is simply not mentioned.
Hertzberg et al. (1982) performed experiments using an 8-liter sphere with
polyethylene dust particle size from approx. 27 to 200 µm and found MEC values
ranging from approx. 50 to 475 g/m3 (Figure 12). They did not observe a significant
variation of the MEC (around 60 g/m3) for dust particle sizes of 15 to 90 µm. Above this
range, the MEC values increased until a dust particle size of 200 µm, beyond which the
dust sample did not explode regardless of the dust concentration. The authors conclude

28
that for polyethylene (as for coal dusts), there is a lower characteristic diameter below
which the explosive behavior of dust particle is independent of the particle size, and the
combustion reaction of these dust particles exhibit explosible qualities of an equivalent
premixed gas. They also stated that as the dust particle is increased above a higher
characteristic diameter the dust would not explode regardless of the dust concentration33.
Table 6. Minimum Explosible Concentration (MEC) of polyethylene dust
MEC PARTICLE SIZE POLYETHYLENE
TYPE EQUIPMENT SOURCE
≈50 g/m3 ≈27 μm (***) NA 8-liter chamber 33
≈50 g/m3 ≈31 μm (***) NA 8-liter chamber 33
≈65 g/m3 ≈55 μm (***) NA 8-liter chamber 33
≈60 g/m3 ≈90 μm (***) NA 8-liter chamber 33
≈225 g/m3 ≈130 μm (***) NA 8-liter chamber 33
≈475 g/m3 ≈200 μm (***) NA 8-liter chamber 33
35 g/m3 37 µm (**) NA 20-liter sphere 34
45 g/m3 106 - 125 μmb LDPE Modified Hartmann Tube
35
50 g/m3 125 - 150 μm LDPE Modified Hartmann Tube
35
60 g/m3 150 - 180 μm LDPE Modified Hartmann Tube
35
15 g/m3 62 µm (median) LDPE 20-liter sphere 36
60 g/m3 136 μm (d50) (**) NA Modified Hartmann Tube
37
10 g/m3 49 µm (**) NA 20-liter sphere 38
20 g/m3 28 µm (**) NA 20-liter sphere 38
40 g/m3 103 µm (**) NA 20-liter sphere 38
500 g/m3 171 µm (**) NA 20-liter sphere 38 (**) volume median diameter (***) surface area weighted mean diameter
b The authors chose to represent the particle size interval by its upper limit (for example, 106-125 μm is
represented by 125 μm).

29
Figure 12. Lean flammability limit for polyethylene powder as a function of particle
size
Reprinted from 33.
Mittal and Guha (1996) studied the relationship between polyethylene dust
particle size and MEC using a modified Hartmann tube. This is the only paper which
uses a modified Hartmann tube to measure the effect of dust particle size on MEC for
polyethylene. It is important to note that the ASTM E1515 standard recommends to
either use a 20-liter or 1 m3 vessel to conduct experiments regarding MEC. The authors
indicated that the purpose of the experimental work was to only obtain a preliminary
range of information on the MEC. For particle size of 125 µm, 150 µm, and 180 µm
(note that this is the highest particle size for a given sample, not the surface area mean
diameter as used by Hertzberg), they found MEC values of 45 g/m3, 50 g/m3, and 60
g/m3 35 (Figure 13). These MEC values differ very significantly from Hertzberg’s results
(by a factor 5 for 125 µm up to a factor 10 for 150 µm). While this difference may be

30
related to the use of different equipment, Mittal et al. (1996) did not characterize the dust
particle size in a way that allows comparison with values obtained by Hertzberg et al.
(1982).
Figure 13. Variation of MEC with particle size for polyethylene dust.
Reprinted from 35.
Amyotte et al. (2012) conducted experiments with polyethylene dust particle size
in a 20-liter sphere ranging from 28 to 916 µm (volume median diameters). The authors
observed that the dust particle sizes above 171 µm did not explode even for dust
concentrations of 2750 g/m3. The authors concluded that dust particle may be so large
that, even at high dust concentrations, the dust sample will not explode as the particle
size is too large to be dispersed in air. It was shown that MEC does increase significantly
with increasing particle size, but this behavior is not seen for dust particle size at around

31
under 100 µm 38. While Amyotte and Hertzberg use different definitions for particle size
(volume median diameters and surface area mean diameter, respectively) and the
equipment used is different (20-liter and 8-liter spheres, respectively), the MEC values
seem comparable on the range of particle size.
Hertzberg et al. (1982) and Amyotte et al. (2012) come to the same conclusion in
regards to effect of particle size on MEC of polyethylene dust. Their results show that
MEC does increase with particle size, but this behavior can only be seen above a critical
diameter of about 100 µm. Both the papers then show that the MEC of the polyethylene
dust sample would keep increasing until a second critical diameter is reached, beyond
which the dust would not explode. Amyotte et al. (2012) found this critical diameter to
be about 171 µm (volume median diameter), whereas Hertzberg et al. (1982) found this
critical diameter to be approx. 200 µm (surface area weighted mean diameter). The
results of these two papers are not comparable to the values obtained by Mittal et al.
(1996), since the authors do not test for MEC below 125 µm. Due to the difference in
particle size characterizations, the exact values are not comparable and thus conclusions
and comparisons between these two papers are limited in scope.
3.1.2 Maximum pressure (Pm) and rate of pressure rise (dP/dt)m of polyethylene dust
Several authors studied the phenomena of dust explosion when performed in a
confined volume (e.g., 20-liter sphere) to observe the effect of the dust concentration and
humidity on the following parameters:

32
• Maximum pressure (Pm): this corresponds to the maximum pressure generated in
the confined volume as a result of the explosion.
• Maximum rate of pressure rise (dP/dt)m: this is a function of the severity of the
explosion.
3.1.2.1 Effect of dust concentration on Pm and (dP/dt)m
Lunn et al. (1986) carried out experiments to measure the Pm of polyethylene
(unknown type) dust using a 20-liter sphere. The experiments were conducted using a
starting concentration of a specific dust sample from 250 g/m3 and the dust concentration
was gradually increased up to 2000 g/m3. The author observed that Pm and (dP/dt)m
would increase with the dust concentration for concentration values below 500 g/m3. For
concentration values below 500 g/m3, Pm and (dP/dt)m would decrease with the dust
concentration39.
Table 7. 20-liter sphere experiment with polyethylene Pm and (dP/dt)m
Reprinted from 39. Concentration (g/m3) Pm (bar) (dP/dt)m (bar/s)
250 6.75 410
500 7.21 508
750 6.21 434
1000 5.76 441
2000 4.38 266

33
This conclusion was confirmed by Kaufmann et al. (1992) in their experiments
with polyethylene dust using a 0.95 m3 sphere (Figure 14)c. However, the absolute
values are different to the values obtained by Lunn et al. (1986) using a 20-liter sphere.
It is difficult to explain these differences, due to the equipment being different and also
because Kauffman et al. (1992) did not mention the particle size of the sample tested.
Figure 14. Effect of turbulence on Pm for different dusts
Reprinted from 40.
Lunn et al. (1986) and Kauffman et al. (1992) did not conduct tests with dust
concentration below 250 g/m3. This was done by Cashdollar (2000) for dust
concentrations at approximately 25 g/m3 to 4000 g/m3 in a 20-liter sphere (Figure 15). He
c The authors refer to Pm using the annotation Pmax. Note that this Pmax differs from the definition of Pmax as
used by the ASTM and used in this thesis.

34
observed the same explosion behavior. The results showed that Pm increases sharply for
concentration between 25 g/m3 and 200 g/m3. Cashdollar also showed that polyethylene
dust even explodes at concentration as high as 4000 g/m3 (Figure 15). The author
explains that at such high concentrations, there is a high amount of uncertainty in how
well and effectively the dust is being dispersed. Cashdollar also theorizes that the
decrease in the Pm and (dP/dt)m at such higher concentrations might be the result of both
the probable decrease in turbulence and an increased heat sink because of the very large
dust concentrations19.
The conclusion in regards to the effect of dust concentration on Pm for the three
authors above observed that the Pm and (dP/dt)m rise with increasing dust concentration
up to a certain dust concentration (500 g/m3 for Lunn et al., ≈750 g/m3 for Kaufmann et
al., and ≈500 g/m3 for Cashdollar), and above this dust concentration, both the Pm and
(dP/dt)m values decrease when the dust concentration increases. The values obtained by
Cashdollar are different compared to both Lunn et al. and Hertzberg et al., and again, all
these results are not comparable due to lack of information by both Kauffman et al.
(1992) and Cashdollar (2000) regarding the dust particle size.

35
Figure 15. Pm data for polyethylene dusts compared with those of methane gas
Reprinted from 19.
3.1.2.2 Effect of water content on Pm and (dP/dt)m
Traore et al. (2009) measured Pm and (dP/dt)m of polyethylene dust in a 20-liter
sphere while varying the amount of water which was injected into the 20-liter sphere. As
shown in Figure 16, the conclusion of the experiments was that both maximum pressure
(Pm) and rate of pressure rise ([dP/dt]m) decrease when the humidity increases37.
Eckhoff (2003) provides an explanation of the effect of moisture content on the
dust explosible properties. One is that, it reduces the ignition sensitivity of the dust,
meaning that it will be harder to ignite the dust. Secondly, it also reduces the explosion
violence of the explosion as the water acts as an inhibitor in the oxidation reaction and
the water can act as a heat sink7.

36
Figure 16. Effect of atmosphere humidity on Pm and (dP/dt)m for polyethylene dust
Reprinted from 37.
3.1.3 Maximum Explosion Overpressure (Pmax) and Dust Deflagration Index (KSt) of
polyethylene dust
The maximum value of Pm = f (dust concentration) curve correspond to Pmax, and
equally the maximum value of (dP/dt)m = f (dust concentration) curve is used to calculate
the KSt of a dust material (refer to 2.5.3.1).
Table 8 gather all the Pmax and KSt of polyethylene dust found in the literature.
The table shows that, for polyethylene, Pmax ranged between 5.9 and 8.8 bar.
A very wide range of KSt values was found for polyethylene (from 5 to 200 bar-
m/s. This puts polyethylene in the ST1 dust explosion classification (weak explosion).
Note: as stated earlier, even a weak primary explosion can give rise to much
stronger secondary explosion as in the case of the accident at West Pharmaceuticals.

37
Table 8. Pmax and KSt of polyethylene dust
Pmax KSt PARTICLE SIZE POLYETHYLENE TYPE
EQUIPMENT SOURCE
≈(0 - 8.5 bar)
≈(0 - 200 bar-m/s)
≈[0 - 350 μm] NA 1 m3 vessel 41
7.21 bar 138 bar-m/s
<10 µm – weight % - 1.7
>10<20 µm – weight%-70.7
>20<36 µm – weight%-70.7
NA 20-liter sphere 39
8.8 bar 193 bar-m/s
NA NA 20-liter sphere 42
NA ≈20 bar-m/s
116 µmd NA 26-liter sphere 43
NA ≈45 bar-m/s
98 µm NA 26-liter sphere 43
NA ≈80 bar-
m/s ≈70 µm NA 26-liter sphere 43
NA ≈80 bar-
m/s ≈60 µm NA 26-liter sphere 43
NA ≈80 bar-m/s
56 µm NA 26-liter sphere 43
NA ≈80 bar-m/s
≈45 µm NA 26-liter sphere 43
NA ≈120 bar-m/s
20 µm NA 26-liter sphere 43
NA ≈150 bar-m/s
≈10 µm NA 26-liter sphere 43
≈7 bar NA NA NA 1.22 m diameter sphere
40
6.6 bar 71 bar-m/s
< 500 µm
d90<250 µm
HDPE 20-liter sphere 44
≈6.9 bar ≈55 bar-m/s
NA NA 20-liter sphere 19
d The authors chose to represent the particle size as the average of the sieve sizes between which each dust
sample was held.

38
Table 8. continued.
Pmax KSt PARTICLE SIZE POLYETHYLENE TYPE
EQUIPMENT SOURCE
8.5 bar 131 bar-m/s
62 μm (median) LDPE 20-liter sphere 36
NA ≈5 - 130 bar-m/s
≈5 - 900 µm NA 20-liter sphere 45
6.9 bar 137 bar-m/s
28 µm (**) NA 20-liter sphere 38
6.7 bar 104 bar-m/s
49 µm (**) NA 20-liter sphere 38
6.9 bar 78 bar-m/s
103 µm (**) NA 20-liter sphere 38
5.8 bar 15 bar-m/s
171 µm (**) NA 20-liter sphere 38
(**) volume median diameter
Bartknecht (1981) measured values of Pmax and KSt for polyethylene in a 1 m3
sphere for samples of particle size approximately between 25 and 350 µm. He observed
that both Pmax and KSt decrease as the particle size increases41 (Figure 17).

39
Figure 17. Effect of dust particle size on Pmax for polyethylene dust
Reprinted from 41.
Britton et al. (1989) conducted tests to measure the effect of particle size (from
20 to 116 µm – see below for the meaning of this diameter) on the KSt of polyethylene
dust using a 26-liter sphere (no values of Pmax are reported). They observed that the
higher the particle size, the lower the KSt (Figure 18 and Figure 19). The maximum
values of KSt for polyethylene sample tested remained under 200 bar-m/s 43.

40
Figure 18. Effect of particle size on KSt of a polyethylene dust sample: , average
diameter 20 µme; , average diameter 56 µm; , average diameter 98 µm; , average
diameter 116 µm.
Reprinted from 43.
Figure 19. Effect of particle size on KSt of polyethylene and silicon
Reprinted from 43.
e The authors chose to represent the particle size as the average of the sieve sizes between which each dust
sample was held.

41
In a research report from 2003, HSE (UK) gives a Pmax value of 8.5 bar and KSt
of 131 bar-m/s for a particle size of 62 µm (median), and this value is comparable to the
results by Bartknecht36. Both Bartknecht (1981) and HSE only characterize the dust
particle size using median value without mentioning if it is related to volume, mass or
surface area of the dust particle.
Amyotte et al. (2012) measure Pmax and KSt for polyethylene dust particle size
from 28 to 916 µm (volume median diameters) (Table 8) according to the ASTM E1226
standard. They did not have any explosion for dust particle sizes above 276 µm,
therefore no Pmax and no KSt. They observed that KSt value increased from 15 to 137 bar-
m/s as the dust particle size became smaller for the samples that exploded. For particle
diameter between 28 to 103 µm, Pmax value was not sensitive to the particle size (Pmax =
6.9 bar). For diameters of 171 µm, the Pmax decreased to 5.8 bar. These values are
different compared to the ones obtained by Bartknecht (1981) (Pmax of approx. 3 bar for
dust particle size of 276 µm; no explosion was observed by Amyotte et al. (2012) with
this particle size). Here, again we can observe differences in the way to report the
median diameter of the samples. Amyotte et al. (2012) characterizes the dust particles by
volume median diameter and no details of whether Bartknecht used the volume, mass, or
surface area to characterize the dust particle size could be obtained. It should also be
noted that while Amyotte et al. (2012) uses a 20-liter sphere for their experiments,
Bartknecht has used a 1 m3 vessel for his experiments38.
All the authors cited come to the same conclusion that with increasing dust
particle size, the KSt decreases, and therefore the severity of the explosion also decreases.

42
In general, it was observed that Pmax tends to decrease above a particle size of approx.
100 µm. It is difficult to compare the results from different authors due to their differing
methods of characterizing the dust particle size.
Another difference to note is the fact that Amyotte et al. (2012) use a 10 kJ
chemical ignitor as an ignitor source in the 20-liter sphere, Britton et al. (1989) use “two
centrally-placed, electric match-head igniters with a calorimetric energy of about 140 J
each”43 as an ignitor source in the 26-liter sphere, which represents a much higher
ignition energy that may influence the results.
3.1.4 Minimum Ignition Energy (MIE) of polyethylene dust
There is in fact very few data related to the MIE of polyethylene dust in the
literature. The ranges of MIE found in the literature were from 10 mJ to 1 J. The extreme
variance in these values can be attributed to the differing dust particle sizes used by the
experiments to find the MIE.
Table 9. Minimum Ignition Energy (MIE) of polyethylene dust
MIE PARTICLE SIZE Polyethylene
type EQUIPMENT SOURCE
10 mJ 25 μm (*) NA Mike-3 7
1000 mJ 250 μm (*) NA Mike-3 7
500 mJ 136 µm (d50) NA Modified Hartmann Tube
37
10 - 30 mJ 28 µm (**) NA Mike-3 38
10 - 30 mJ 49 µm (**) NA Mike-3 38
10 - 30 mJ 103 µm (**) NA Mike-3 38 (*) mass median diameter (**) volume median diameter

43
Bartknecht (1987) showed that MIE tends to increase linearly with the particle
size (for 25 μm and 250 μm, MIE was found to be 10 mJ and 1000 mJ approximately,
Figure 20).
The MIE for polyethyelene dust measured by Traore et al. (2009) using a
modified Hartmann tube was 500 mJ for a dust particle size of 136 µm.
Amyotte et al. (2012) showed that the MIE of polyethylene dust seems to be
insensitive to the particle size for particle diameter of less than 103 µm (MEC between
10 to 30 mJ) but increases for particle diameter higher than 171 µm 38.
The combined information from the authors above seem to indicate that the
higher the particle size, the higher the MIE.
Figure 20. Effect of particle size on MIE of polyethylene dust.
Reprinted from 7.

44
3.1.5 Minimum Ignition Temperature (MIT) of polyethylene dust
Hertzberg (1991) showed, using a 1.2-liter furnace, that for dust concentration
below 100 g/m3 (particle size of 37 µm mean diameter), the ignition temperature
decreases sharply as the dust concentration increases46. Above this concentration, the
ignition temperature seems to be constant. The MIT found is around 400°C (Figure
21)46.
Mittal et al. (1996) made the same experimental observation with a Godbert-
Greenwald furnace (Figure 22)35 for a sample of particle size between 106-125 µm (no
information of the distribution is given)35. However, he got a MIT slightly higher than
Hertzberg (1991) (440°C).
Figure 21. Autoignition data from the 1.2-liter furnace plotted as temperature versus
concentration: , ignitions; , non-ignitions (particle size 37 µm)
Reprinted from 46.

45
Figure 22. Variation of MIT with dust concentration for polyethylene (particle size
between 106-125 µm)
Reprinted from 35.
Table 10 summarizes the MIT data found in the literature. The MIT values found
by Hartmann (1948) are mentioned in a paper by Mittal et al. (1997). It was reported that
for experiments with increasing particle size from 116 to 328 µm, the MIT values
increased from approx. 549 to 629°C. No other information about characterization of
dust particle size or equipment used to conduct these tests were obtained.
Hertzberg (1991) showed, using a 1.2-liter furnace, that for particle size below 60
µm, the MIT of polyethylene is constant (400°C), and below 60 µm, MIT increases with
the particle size (Figure 23).

46
Table 10. Minimum Ignition Temperature (MIT) of polyethylene dust MIT PARTICLE SIZE Polyethylene
type EQUIPMENT SOURCE
549°C 116 µm NA Godbert-Greenwald furnace 47
549°C 165 µm NA Godbert-Greenwald furnace 47
579°C 196 µm NA Godbert-Greenwald furnace 47
569°C 231 µm NA Godbert-Greenwald furnace 47
599°C 275 µm NA Godbert-Greenwald furnace 47
629°C 328 µm NA Godbert-Greenwald furnace 47
≈400°C ≈27 μm (*) NA 1.2-liter furnace 46
≈400°C ≈55 μm (*) NA 1.2-liter furnace 46
≈425°C ≈125 μm (*) NA 1.2-liter furnace 46
≈450°C ≈310 μm (*) NA 1.2-liter furnace 46
≈450°C ≈450 μm (*) NA 1.2-liter furnace 46
440°C 106-125 μmf LDPE Godbert-Greenwald furnace 35
440°C 125-150 μm LDPE Godbert-Greenwald furnace 35
440°C 150-180 μm LDPE Godbert-Greenwald furnace 35
460°C 180-212 μm LDPE Godbert-Greenwald furnace 35
470°C 212-250 μm LDPE Godbert-Greenwald furnace 35
480°C 250-300 μm LDPE Godbert-Greenwald furnace 35
500°C 300-355 μm LDPE Godbert-Greenwald furnace 35
480°C 136 µm (d50) NA Godbert-Greenwald furnace, Modified Hartmann tube
37
370°C 28 µm (**) NA BAM Oven 38
400°C 49 µm (**) NA BAM Oven 38
410°C 103 µm (**) NA BAM Oven 38
375°C ≈ 75 µm (*) NA NA 48 (*) mass median diameter (**) volume median diameter
f The authors chose to represent the particle size interval by its upper limit (for example 106-125 μm is
represented by 125 μm).

47
Figure 23. Particle size dependence for the MIT for polyethylene
Reprinted from 46.
Mittal et al. (1996) conducted a number of experiments using a Godbert-
Greenwald furnace by varying the polyethylene dust particle size from 125 to 325 µm
and the MIT value found for the lowest dust particle size was 440°C. As the particle size
kept increasing, the MIT value kept increasing up to a value of 560°C.
Amyotte et al. (2012) used a BAM oven to measure the MIT for particle size
range from 28 to 916 µm, and it was found that the dust particle sizes above 171 µm did
not even ignite. The smaller particles below 171 µm did ignite and the MIT values kept
decreasing from 410˚C to 370˚C.
While all three papers come to the same conclusion regarding effect of dust
particle size on MIT, it is difficult to compare their absolute values because of the
difference of equipment used and particle characterization method.

48
3.2 Sulfur dust explosion properties
The literature has very few data for sulfur dust explosion properties and the effect
of particle size, dust concentration, and polydispersity on them. Table 11 gives an
overview of the sulfur dust explosion properties found in the literature.
Table 11. Dust explosion properties of sulfur dust MEC (g/m3)
Pmax
(bar) KSt
(bar-m/s) MIE (mJ)
MIT (°C)
PARTICLE SIZE EQUIPMENT SOURCE
≈ 25 NA NA NA 280 NA 1.2-liter ceramic furnace
46
100 5 28 NA NA 35 µm (median)
20-liter sphere
49
NA NA NA NA 260 50 mm BAM oven 7
NA NA NA 1.8 - 2.3 NA NA modified Mike-3
50
NA 6.8 151 NA NA 20 µm (*) 1 m3 vessel 41
NA 7 113 NA NA 20 µm Tube-shaped burner
51
NA NA NA 4.5 - 5.9 NA NA Modified Hartmann Tube
30
NA NA NA 1 - 3 NA NA Mike-3 apparatus
30
2.5 5.3 214 1 210 25.7 µm (d50) NA 52
NA NA NA 6 270
110 µm (d50) Godbert-Greenwald furnace (MIT), Modified Hartmann Tube (MIE)
53
NA NA NA NA 240 38 µm (*) BAM oven 48
NA NA NA NA 260 38 µm (*) Godbert-Greenwald furnace, 6.8-liter furnace
48
NA NA NA NA 290 38 µm (*) 1.2-liter furnace
48

49
Table 11. continued.
MEC (g/m3)
Pmax
(bar) KSt
(bar-m/s) MIE (mJ)
MIT (°C)
PARTICLE SIZE EQUIPMENT SOURCE
NA NA NA NA 250 NA Ultrasonic waves
54
30 6.8 251.3 0.38 210 <75 μm (mean = 35 μm)
20-liter sphere
20
NA 6.3 204.3 3.4 230 75 µm (mean) 20-liter sphere
20
NA 5.9 168.7 <1.3104 400 285 µm (mean)
20-liter sphere
20
100 - 150
5.6 107.6 <1.3104 490 1400 - 1680 μm (mean = 1540 μm)
20-liter sphere
20
(*) mass median diameter (**) volume median diameter
3.2.1 Minimum Explosible Concentration (MEC) of sulfur dust
The range of MEC for sulfur dust was found to be between 2.5 to 150 g/m3,
which is a very wide range. Just four authors give five values of MEC for sulfur dust
throughout the literature. Hertzberg (1991) gives a value of around 25 g/m3, without
mentioning the particle size of the dust sample tested. Cashdollar (1994) lists the MEC
of sulfur dust to be approx. 100 g/m3, for a median particle size of 35 µm. Áñez et al.
(2012) on the other hand gives an extremely low value of MEC (2.5 g/m3) for a median
particle size of 25.7 µm. Yanqiu et al. (2014) is the only paper which gives two different
MEC values for different particle sizes of sulfur dust, which are 30 g/m3 for a mean
particle diameter of 35 µm, and an MEC between 100-150 g/m3 for a mean particle
diameter of 1540 µm. With the limited amount of data and the different ways used by

50
the authors to characterize the dust particle size, no clear conclusion can be made in
regards to the effect of particle size on MEC for sulfur dust.
3.2.2 Maximum pressure (Pm) and rate of pressure rise (dP/dt)m of sulfur dust
The relationship between the dust concentration of sulfur and its Pm and (dP/dt)m
values were shown by experimental results using a 20-liter sphere by Yanqiu et al.
(2014). Similar to the correlation found with polyethylene dust, this paper concludes that
for sulfur dust, both the Pm and (dP/dt)m increase with increasing dust concentration till a
certain concentration where it reaches a critical value (800 g/m3 for Pm, 1200 g/m3 for
(dP/dt)m ). Above this dust concentration, the Pm and (dP/dt)m decrease with increasing
concentration (Figure 24)20.
Figure 24. Influence of dust concentration on Pm and (dP/dt)m
Reprinted from 20.

51
3.2.3 Maximum Explosion Overpressure (Pmax) and Dust Deflagration Index (KSt) of
sulfur dust
The literature gave a range of Pmax values from 3 to 7 bar and the values of KSt
for sulfur ranged from 28 bar-m/s to 251.3 bar-m/s. Cashdollar (1994) just gives a single
value of Pmax and KSt of 5 bar and 28 bar-m/s respectively for a median particle size of
35 µm. Similarly, both NFPA (2007) and Silvestrini (2008) give similar Pmax values of
6.8 and 7 bar respectively for a particle size of 20 µm. The KSt mentioned are quite
different (151 bar-m/s and 113 bar-m/s respectively). Áñez et al. (2012) also just
provides an individual value of Pmax (5.3 bar) and KSt (214) for a median particle size of
25.7 µm. They do not provide information on the equipment used to measure these
values. These values are different compared to both values reported by NFPA (2007)
and Silvestrini et al. (2008) and differences in characterization of particle size and use of
different equipment might explain the difference in these values.
Yanqiu et al. (2014) is the only paper that measures the effect of sulfur dust
particle size on the Pmax and KSt values, by varying the dust particle size from 35 to 1540
µm, and whereas the Pmax values kept decreasing from 6.8 bar to 5.6 bar with increasing
particle size, the KSt kept decreasing from 251.3 to 107.6 bar-m/s with increasing
particle size20. The KSt values obtained by Yanqiu et al. (2014) place sulfur in the St2
category of dust explosions, which translates to a strong explosion. OSHA, on the other
hand, in a research paper classifies sulfur in the St1 category of dust explosions, without
giving any specific KSt data for sulfur dust linked to particle size. The general

52
characteristic of St1 explosion is that it is a weak explosion and its KSt varies from 0 to
200 bar-m/s 20.
3.2.4 Minimum Ignition Energy (MIE) of sulfur dust
The range of MIE found in the literature for sulfur dust was between 0.38 mJ to
13 J. This is quite a varied range, and most of this variance comes from a single paper20,
and these results needs to be scrutinized and recreated in order to test the veracity of the
data and the conclusions of the paper.
Randeberg et al. (2006) state the MIE of sulfur dust using a Mike-3 to be
between 1.8 - 2.3 mJ. Similarly, Janes et al. (2008) give an MIE of 1-3 mJ using a Mike-
3 and a MIE of 4.5 - 5.9 mJ using a modified Hartmann tube. None of these authors
provide any other information in regards to dust particle size to draw any meaningful
conclusions on the effect of dust particle size on MIE.
Whereas Áñez et al. (2012) provides a single MIE value of 1 mJ for a median
particle size of 25.7 µm, Dufaud et al. gives an MIE value of 6 mJ for a median particle
size of 110 µm. Yanqiu et al. (2014) is the only paper who varied the dust particle size
from 35 to 1540 µm, and found that with increasing particle size, the MIE value
increased from 0.38 mJ to more than 13 J20.
3.2.5 Minimum Ignition Temperature (MIT) of sulfur dust
The relationship between the dust concentration and the ignition temperature of
sulfur dust was shown by Hertzberg (1991) with experimental results. The equipment he

53
used was a 1.2-liter ceramic furnace which works very similar to a Godbert-Greenwald
furnace. As the dust concentration increases when dust concentration is below 25 g/m3,
the ignition temperature decreases significantly. The ignition temperature mostly
remains constant as dust concentration is increased above 25 g/m3 (Figure 25)46, and
MIT value is approx. 320°C.
Figure 25. Effect of dust concentration on ignition temperature of sulfur dust
Reprinted from 46.
Many authors give singular values of MIT for a specific dust particle size. Some
of them are: Eckoff (2003) reporting an MIT value of 260°C for 50 mm dust particle size
using a BAM oven; Áñez et al. reporting a value of 210°C for a median particle size of
25.7 µm; and Dufuad et al. (2012) reporting a value of 270°C for a median particle size
of 110 µm using a Godbert-Greenwald furnace. The ASTM E2109 standard gives
different values of MIT for different equipment used, such as, BAM oven, 1.2-liter

54
furnace and a Godbert-Greenwald furnace for a particle size of 38 µm (mass median
diameter).
As with other sulfur dust explosion properties, Yanqiu et al. (2014) is the only
paper which measures the effect of dust particle size on MIT, and as the dust particle
size was increased from 35 to 1540 µm (mean value), the MIT increased from 210°C to
490°C20.
Yanqiu et al. also measured the effect of water content on both the ignition
energy and ignition temperature for sulfur dust. They showed that with higher water
content, both the ignition temperature and ignition energy keep rising, thus reducing the
probability of a dust explosion occurring in the first place (Figure 26)20.
Figure 26. Influence of water content on ignition energy and ignition temperature of
sulfur dust
Reprinted from 20.

55
3.2.6 Limiting Oxygen Concentration (LOC) of sulfur dust
The range of limiting oxygen concentration (LOC) from the literature was found
to be between 5% and 9%. Áñez et al. (2013) in their paper, report the LOC for sulfur to
be about 5%. The sulfur dust used in their tests had a moisture of 0.1% and the d0.1, d0.5,
and d0.9 particle sizes were 6.1, 25.7, and 94.5 µm respectively20. On the other hand,
Yanqiu et al. reported the LOC to be about 9% for sulfur dust particle of size below 75
µm 20. These LOC values are not comparable to each other because both Yanqiu et al.
(2014) and Áñez et al. (2013) does not specify what particle size characterization they
have used.
Table 12. Limiting Oxygen Concentration (LOC) of sulfur dust.
Reprinted from 20. LOC PARTICLE SIZE EQUIPMENT SOURCE
9% < 75 µm hot plate 20
5% 25.7 µm 20
3.3 Summary of the literature review
3.3.1 Polyethylene dust explosion properties
The literature gives a reasonable amount of data in regards to the effect of dust
particle size on the dust explosion properties of polyethylene (MEC, MIE, MIT, Pmax and
KSt) (

56
Table 13). The issues associated with these data are the following:
• Most of the time the type of polyethylene dust used for the experiments is not
mentioned. When the type of polyethylene is mentioned, most of the time the
experiments were done with low density polyethylene (LDPE). Only one value
of Pmax and KSt are available for HDPE. It is important to note that Qatar
produces only LDPE but also HDPE, LLDPE, and MDPE. Therefore,
applicability of the data found in the literature to polyethylene other than LDPE
can be questioned.
• Most of the times, these papers do not mention the specific details of this particle
size range. This would include no to little data on the d25, d50, d90, mean,
median, or mode of the dust particle size sample. The particle size is linked to
usually either the volume of the dust particle, the mass of the dust particle, or the
surface area of the dust particle. Many studies fail to mention which of these has
been used to characterize the dust particle size. Therefore, the comparison
between data is difficult.
• Dust explosions are measured using different equipment (e.g., 8-liter chamber,
20-liter sphere, and the 26-liter sphere), with different ignition methods and dust
dispersion methods, which may generate difference in the measured values.
There is no study on the effect of humidity on MEC, MIE, and MIT for
polyethylene dust. Only one author showed the variation of water content on Pmax and
KSt (

57
Table 13).
Table 13. Summary of effect of critical parameters on polyethylene dust explosion
properties MEC MIE MIT Pmax KSt
Increase in Particle Size Increases(#) Increases Increases(#) Decreases (##)
Decreases
Increase in Water Content
No data found
No data found
No data found
Decreases Decreases
(#)Increases only after a certain particle size (##)Decreases only after a certain particle size
3.3.2 Sulfur dust explosion properties
There is clear lack of data on Sulfur Dust Explosion Properties in the literature.
Only four authors give five values of MEC for sulfur dust throughout the literature. With
the limited amount of data and the different ways used by the authors to characterize the
dust particle size, no clear conclusion can be made in regards to the effect of particle size
on MEC for sulfur dust.
There is some data for the MIT, MIE, Pmax, and KSt, but the literature has little
data in correlating the effect of these dust properties to the dust particle size.
Here again, for the available data, the following limitations are found:
• Different equipment are used to measure the explosion properties, which may
generate difference in the measured values.

58
• It is difficult to compare the data due to the lack of or differences in particle size
characterization.
No study of other important explosion characteristics, such as, MEC, Pmax, and
KSt, for sulfur dust hazards have been conducted which include humidity considerations.
Only one author studied the influence of humidity on MIE and MIT.

59
4 RESEARCH OBJECTIVES AND METHODOLOGY
4.1 Research objectives
The objective of the thesis is to perform the experimental study of the minimum
explosion concentration (MEC) of polyethylene and sulfur dust. The project aims to
characterize the MEC for typical samples collected on-site at polyethylene and sulfur
production facilities in Qatar, and study the influence of the particle size distribution of
the polyethylene and sulfur dust on the MEC. In order to reach the above objectives, the
research is structured as follows:
• Phase I: Sampling and physical characterization of the polyethylene and sulfur
dusts found in the local industries of Qatar.
• Phase II: Experimental determination of the MEC for both polyethylene and
sulfur dust collected on-site.
• Phase III: Study of the effect of particle size distribution on the MEC values of
polyethylene and sulfur dust.
The generated experimental data focuses on filling the current gap in such data in
the published literature and directly supports the Qatar industry in the improvement of
the safety of polyethylene and sulfur production facilities. These data also provide a
solid indication of the potential of dust generated by sulfur and polyethylene processes at
different locations to create explosive atmospheres and the associated MEC for better
risk control. Another unique and important outcome of this thesis is the characterization
of the effect of particle size distribution on the MEC. The methodology to achieve these

60
objectives is described in detail in the sections below, which discuss the three phases of
the project.
4.2 Methodology
4.2.1 Phase I: Analysis and physical characterization of the polyethylene and sulfur
dusts found in the local industries of Qatar
Since this research was conducted to address the needs of the local industry in
Qatar, it was central to understand the physical characteristics of the polyethylene and
sulfur dusts found in the process facilities.
4.2.1.1 Sample Collection
In regards to polyethylene dust, samples were given to the research team by Q-
Chem. Some of these samples were directly taken from the process areas when the
company was undergoing a turnaround, and some of the samples were taken directly
from the final product storage of the facility. Even if the samples were not collected by
our research team directly, we visited the plant to better understand the polyethylene
production process areas and interact with the process engineers.
The sulfur sample collection was different in that it was collected on-site from
two different companies (Q-Chem and Qatargas). The research team visited both the
plants and met the process engineers to gain an understanding of their process through
technical documents. The samples of sulfur dust were taken directly by the research

61
team at locations prone to dust accumulation (following the indication of the process
engineers).
4.2.1.2 Characterization of dust samples
The physical characterization of dust samples involved the measurement of
particle size distribution, particle shape, chemical composition, and moisture content of
the dust sample using a variety of different equipment.
4.2.1.2.1 Particle size distribution
The size of the dust particle was analyzed by using a laser diffraction analyzer
(Beckman Coulter LS 13 320). This equipment can measure particle size measurement
ranges from 0.017 µm to 2000 µm. It uses Mie theories of light scattering to determine
the volume of a particle; the particle size is assumed to be the diameter of a sphere of
same volume as the particle (Figure 27). The results of the analysis are displayed
graphically as a volume fraction percent (or surface area percent or number percent).
A typical particle size analysis using this equipment is shown in Figure 28. Most
of the particle size distribution tend to typically exhibit a bell shape curve.
The distribution is described using the diameters “dx” (d10, d25, d50, d75, d90)
which indicates that x% (in volume) of the sample has a diameter less than “dx”. As an
example, on Figure 28, d75 is 79.71 µm which means that 75% of the sample (volume)
has a diameter of less than 79.71 µm. By definition, d50 corresponds to the median of the
distribution.

62
The mode is the most frequently occurring diameter of the distribution (peak of
the distribution).
The mean of the distribution is the arithmetic average of the particle diameter.
The distribution is characterized using both the variance (averaged of squared
differences from the mean) and standard deviation (square root of the variance).
The relative distribution span can also be assessed to represent the distribution:
𝑅𝑒𝑙𝑎𝑡𝑖𝑣𝑒 𝑑𝑖𝑠𝑡𝑟𝑖𝑏𝑢𝑡𝑖𝑜𝑛 𝑠𝑝𝑎𝑛 =d90 − d10
d50 Equation 3
Figure 27. Beckman Coulter LS 13 320 particle analyzer

63
Figure 28. Typical particle size range analysis results
4.2.1.2.2 Particle shape
The particle shape of the dust particle (Figure 29) was analyzed by a scanning
electron microscope (SEM) FEI Quanta 400. This SEM uses energy dispersive
spectrometry, wavelength dispersive x-ray spectroscopy, and electron backscatter
diffraction to capture pictures of particle at even sizes of 10 µm.

64
Figure 29. SEM pictures of a polyethylene dust sample
4.2.1.2.3 Sample chemical composition
The chemical composition of the sulfur dust samples is analyzed using x-ray
fluorescence spectroscope coupled with a wavelength-dispersive x-ray spectroscopy
(XRF-WDS). The analyzer provides a quantitative determination of all the major and
minor elements in the sample (Figure 31). The chemical analysis was not performed for
the polyethylene samples.

65
Figure 30. FEI Quanta 400 Scanning Electron Microscope (SEM)
Figure 31. Rigaku ZSX Primus II WDXRF X-ray fluorescence spectrometer

66
4.2.1.2.4 Sample humidity
An attempt was done to assess the moisture content in the sulfur sample. The
idea was to put the dust samples in oven at around 75°C and measure the weight change
of the sample with time using a precision balance (1 mg precision).
4.2.2 Phase II: Experimental determination of the MEC for both polyethylene and
sulfur dust collected on-site
Most of the MEC experiments were conducted using the modified Hartmann
tube, for which a brief description was given in section 2.5.1. While the modified
Hartmann tube is not the standard equipment to measure MEC, it was used as a
screening tool to obtain a first estimation of the MEC. As mentioned in section 2.5.3.1,
MEC is measured in a 20-liter sphere. At the time of the thesis, one of my tasks was to
progress the installation of the 20-liter sphere in the laboratory. The sphere was
successfully installed only toward the end of my research.
4.2.2.1 Experiments with the modified Hartmann tube
4.2.2.1.1 Description of the Equipment
A brief description of the modified Hartmann tube was given in section 2.5.1.
Figure 32 shows the equipment at TAMUQ. It is composed of a 1.2-liter vertical
plexiglass tube mounted onto a dust dispersion system (the dispersion cup). The tube is
equipped with two electrodes between which a permanent spark (10 J) is generated

67
(approx. 10 cm above the dispersion cup). The dispersion cup is connected to a
compressed air hose.
During the experiment, a given quantity of dust is dispersed by a single blast of
air through the dispersion cup and the vertical tube, creating a dust cloud that is ignited
or not by the permanent spark (Figure 33). The severity of the explosion is qualitatively
recorded by a hinged cover on the top of the tube. The overpressure generated by the
explosion may be sufficient to lift the pierced lid (with a 3 cm diameter hole) at the top
of the tube. Two possible positions of the cover are recorded: Level 1 (lid lifted by a
maximum angle of 45°), and Level 2 (lid lifted by an angle of > 45°), each giving a
qualitative indication of the severity of the explosion (Figure 34).
Figure 32. TAMUQ’s modified Hartmann tube
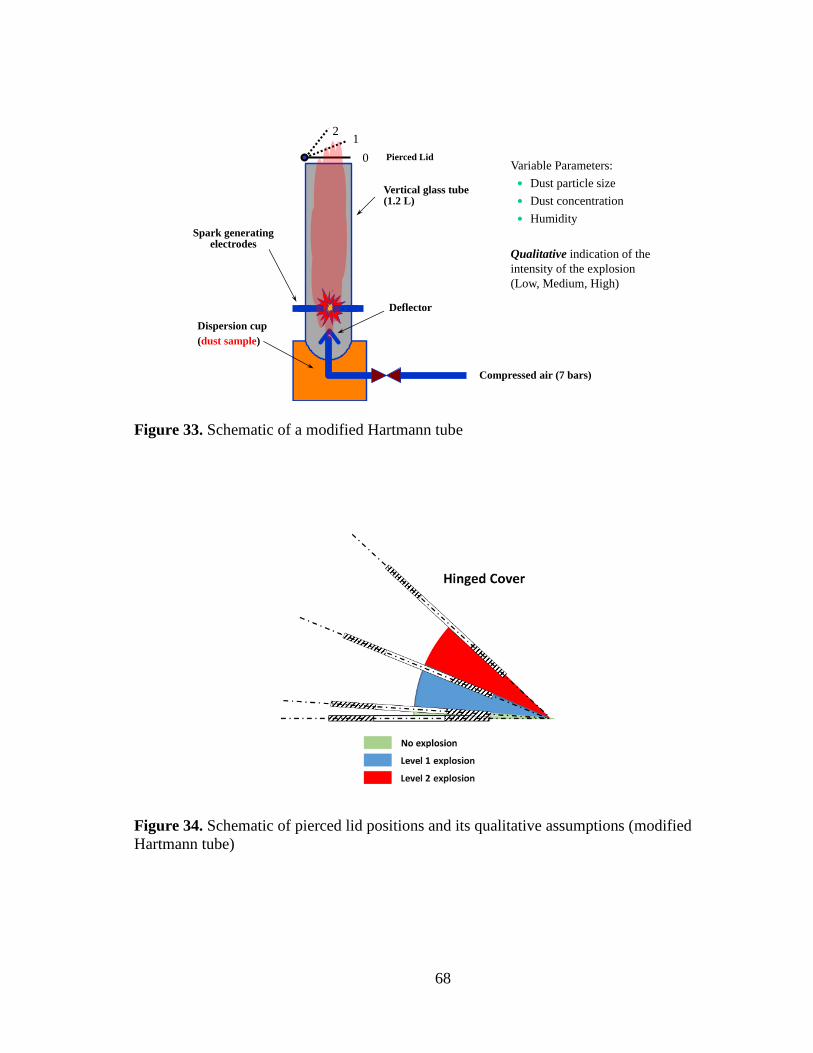
68
Figure 33. Schematic of a modified Hartmann tube
Figure 34. Schematic of pierced lid positions and its qualitative assumptions (modified
Hartmann tube)
Spark generating electrodes
Vertical glass tube (1.2 L)
Dispersion cup
(dust sample)
Deflector
Compressed air (7 bars)
Pierced Lid
12
0 Variable Parameters:
Dust particle size
Dust concentration
Humidity
Qualitative indication of the
intensity of the explosion
(Low, Medium, High)

69
Figure 35. Picture of the modified Hartmann tube during an MEC measurements
4.2.2.1.2 Safety
Before conducting any experiments with the modified Hartmann tube, a
comprehensive project hazard analysis of the experimental work to be performed was
done with polyethylene and sulfur. I received proper training on the equipment from Dr.
Luc Vechot (Responsible for the Lab), and I had to demonstrate that I understood the
safe operation of the equipment.

70
4.2.2.1.3 Experimental procedure for MEC testing
The tests were carried out by varying the dust concentration of a given sample
(collected on-site or of a specific dust particle size range) and observing the potential
ignition and explosion of the sample.
The dust concentration was calculated as follows:
𝐷𝑢𝑠𝑡 𝐶𝑜𝑛𝑐𝑒𝑛𝑡𝑟𝑎𝑡𝑖𝑜𝑛 =Sample mass
Volume of the tube Equation 4
A petri dish was used to prepare the sample. The mass of the petri dish was taken
without the sample, with the sample, and without the sample after transfer to the
dispersion cup. These measures were taken to have an accurate estimate of the sample
mass transferred to the dispersion cup.
For a given sample, the initial dust concentration was 100 g/m3. The
concentration was increased by increments of 100 g/m3 (or less) until the ignition of the
dust and its potential explosion occurred. The tests would be done up to 1000 g/m3 and
then stopped if nothing was observed. On an average, up to 10 tests with the modified
Hartmann tube needed to be performed to find the MEC of a single sample.
Each test was videotaped.
Every three or four tests, the plexiglass tube needed to be cleaned of any residual
dust. When testing with polyethylene, a tissue was enough to clean the tube.
Experimenting with sulfur was much more difficult and extremely time-consuming as
melted sulfur stuck to the inner walls of the tube.

71
4.2.2.1.4 Interpretation of the results
The outcomes of the test were as follows:
• The dust would not ignite (no propagating fire observed).
• The dust would ignite and propagate a fire but without the generation of a
pressure enough to lift the pierced lid. The dust concentration at which this
happened was chosen to be the MEC value for that dust sample. The assumption
was that this MEC would correspond to a lower flammability limit, leading to an
overpressure in a confined environment (e.g., in a 20-liter sphere).
• The dust would explode and generate an overpressure that lifts the lid of the
Hartmann tube to the Level 1 position. This could initially be classified as a weak
explosion55.
• The dust would explode and generate an overpressure that lifts the lid of the
Hartmann tube to the Level 2 position. This could initially be classified as a
strong explosion55.
4.2.2.1.5 Quantification of uncertainties of MEC values
The data generated in these experiments, as with all data measured in any
experiment, had some range of uncertainties in its final MEC values. These errors can be
attributed to four sources:
• The first uncertainty is related to weighing the sample using the balance. The
balance had a precision of +/- 1 mg, and as such, all samples weighed would also
be affected this error. This error would have no significant effect on the results

72
obtained by the experiments in the modified Hartmann tube. This is because even
for the smallest size samples, the lowest MEC value exhibited was at around 40
mg of dust, which would amount to a 2.5% error in the values reported. For
larger samples, with larger MEC values, the error would be even lower in the
decimal digits.
• The second source of error is related to the transfer of all the dust from the petri
dish to the modified Hartmann tube. Some of the dust might have fallen to the
sides or blown away while transferring the dust. While any dust stuck to the petri
dish was accounted for in the final mass calculations, the dust blown or fallen to
the sides have not been taken into account. While it is difficult to quantify this
uncertainty, we did not observe dust being ejected from the tube following the
experiment, and even if that was the case, we could not fully and reliably
measure this.
• The third source of uncertainty has the largest impact on the final MEC results.
The MEC values of the samples were measured by either increasing or
decreasing the concentration of the dust, until a fire was observed. The difference
between the concentration at which the dust is ignited and propagates a fire and
the lower concentration of dust at which the dust does not ignite represents the
recordable uncertainty in the final MEC values listed.
• The final source of uncertainty is related to the difficulty of the experimentalist to
recognize a propagating fire in the tube. Two typical observations can be made
when the dust is ignited:

73
o The dust ignites and shows a slow and limited propagation throughout the
dust cloud in the tube. We refer to this observation as Beginning of Fire
(BF).
o The dust ignites and shows a clear and fast propagation throughout the
dust cloud in the tube. We refer to this observation as Propagating Fire
(PF).
The difference between the concentrations at which BF and PF happens also
represents the recordable uncertainty in the final MEC values listed.
4.2.2.2 Experiments with the 20-liter dust explosion sphere
The 20-liter dust explosion sphere is the standard equipment used to measure the
MEC, Pmax, KSt, and LOC.
4.2.2.2.1 Description of the Equipment
The 20-liter sphere apparatus at TAMUQ (manufactured by Khuner,
Switzerland) consists of a closed steel combustion chamber. The test chamber is a
hollow sphere made of stainless steel, with a volume of 20 L and designed for a
continuous operating pressure (design pressure) of 30 bar. A water jacket serves to
remove the heat generated by the deflagration as to maintain thermostatically controlled
test temperatures. For testing, the dust is dispersed into the sphere from a pressurized
storage chamber (V = 0.6 L) via an outlet valve and a rebound nozzle. The outlet valve is

74
pneumatically opened and closed by means of an auxiliary piston; the valves for the
compressed air are activated electrically.
Prior to dispersing the dust, the 20-liter sphere is partially evacuated (using a
vacuum pump) to 0.4 bar absolute. This evacuation of the 20-liter sphere by 0.6 bar,
together with the air contained in the dust storage chamber (+20 bar; 0.6 L), results in
the desired starting pressure (1 bar) for the test.
When dispersed, the dust cloud is then ignited using two pyrotechnic igniters
located in the center of the sphere with a total energy of 10 kJ (2×5 kJ). Piezoelectric
pressure sensors are used to measure the pressure increases in the chamber during the
experiment.
Figure 36. Pictorial representation of TAMUQ 20-liter dust explosion sphere

75
Figure 37. Schematic of 20-liter dust explosion sphere
4.2.2.2.2 Safety
A comprehensive project hazard analysis of the experimental work with the
sphere was performed. The entire research group participated to a What-If Analysis to
identify the hazards and assess the risks associated with the use of the sphere.
4.2.2.2.3 Experimental procedure for MEC testing
The ASTM E1515 standard was followed in conducting tests in the 20-liter
sphere. The ASTM E1515 standard recommends to start testing a dust sample from a
dust concentration of 100 g/m3, and if a deflagration occurs, then the dust concentration
is reduced till no deflagration occurs. If a deflagration does not occur at 100 g/m3, then
the concentration is increased until a deflagration occurs. This process is repeated till the

76
lowest concentration at which the dust explodes is found. This lowest concentration at
which the dust explodes is the MEC value for that particle size value and range.
4.2.3 Phase III: Study of the effect of particle size distribution on the MEC values of
polyethylene and sulfur dust
The third phase of the thesis involved the study of the effect of particle size
distribution of polyethylene and sulfur dust samples on the value of the MEC. This
required the production of samples of given particle size range from the on-site collected
samples by sieving these on-site samples using calibrated sieves.
4.2.3.1 Preparation of the sample
In general, for one dust sample, about 1000 to 1500 mg amount of dust was
needed to conduct the tests over the full range of dust concentrations in the modified
Hartmann tube. In order to achieve this mass of dust, the larger particle sizes were
grinded to a smaller particle size using a pestle and mortar (Figure 38). This is an
extremely time-consuming process, and in order to achieve the desired mass for the finer
particle size range, the original sample would have to be grinded for multiple hourly
sessions over a period of days.

77
Figure 38. Pestle and mortar for dust grinding
4.2.3.2 Sieving methodologies
Two sieving methodologies were used in order to conduct experiments in Phase
III, which were manual sieving and mechanical sieving. A sample for which we had a
reasonable amount of quantity of dust was chosen to be sieved. The objective of the
sieving process was to create relatively narrow particle size distribution.
4.2.3.2.1 Manual Sieving
The grinded dust was transferred onto a stack of three sieves. The sieves were
stacked in order of decreasing particle size (e.g., 350 µm sieve, 250 µm sieve, 200 µm
sieve). The top sieve would be taped up using a plastic or plumbers tape so that no dust
flies or spills over while carrying out the sieving. The three sieves were shaken manually
inside a fumehood, where a dust collector was placed beneath the bottom sieve to collect

78
the finer dust particle size. The sieves would then be shaken up to around 2 hours each
day over multiple days to get two samples with two different particle size ranges (e.g.,
250-350 µm, and 200-250 µm). Once about 1500 gm of each dust sample was collected,
the process was repeated to get dust samples of different particle size ranges.
4.2.3.2.2 Mechanical sieving
The equipment used for sieving was the RoTap mechanical sieve shaker which
oscillates horizontally at 287 oscillations per minute (Figure 39). Four sieves were
stacked in order of decreasing particle size. The grinded dust was placed on top of the
sieve and the sieves were vertically tapped at 150 taps per minute. The sieves used were
the standard ASTM E-11 sieves which ranged from 20 to 425 µm. After about an hour
of sieving, the mass of each sieve containing the dust sample was weighted and the
sieving resumed. This process continued till there was no change in the mass of dust
samples in the sieves. The average sieving time of about 300 grams of dusts was about 3
hours. The whole process was repeated till about 1500 gm of dust was collected for each
particle size range.

79
Figure 39. TAMUQ mechanical siever (RoTap RX-29 Sieve-Shaker)
4.2.3.3 Experimental determination of the MEC of the sieved sample
The sieved samples were then tested in the modified Hartmann tube with the
same methodology as described in Section 4.2.2. This work also provided an opportunity
to compare the manual or mechanical sieving process in the performance of the tests
conducted with the modified Hartmann Tube.

80
5 EXPERIMENTAL RESULTS AND DISCUSSION
5.1 Experimental results for sulfur dust
5.1.1 Phase I: Analysis and physical characterization of sulfur dusts found on-site
5.1.1.1 Collection of Samples
The sulfur samples were collected from two different plants in Qatar with two
different types of final sulfur product processes:
5.1.1.1.1 Granulated sulfur production process
Sulfur granules are produced in a granulation drum using a water spray
technology. Liquid sulfur (at high temperature) is fed to the granulator and submitted to
a water spray to form spherical granules of solid sulfur which fall on a rotating belt.
These sulfur granules are scrapped off the rotating belt onto a dust discharge belt
conveyor that transfers them onto a vibrating screen where the fine and coarse sulfur
particles are separated. The granules from the vibrating screen equipment then are
transferred to a silo (storage) via successive conveyor belts. The granules are moving
from one conveyor belt to the other by gravity. This transfer occurs in an enclosed space
represented by the dotted lines on Figure 40.
The experimental tests were conducted on five out of seven on-site samples of
sulfur taken from the plant which produced granulated sulfur. Table 14 also details from
which areas of the plant these dust samples were taken from. Most of the tests performed
in this thesis were done with these sulfur samples.

81
Figure 40. Graphical illustration of process for granulated sulfur samples

82
Table 14. Origin and identification of sulfur samples ORIGIN DESCRIPTION DUST SAMPLE ID
Granulator Sulfur dust from the granulator QG_Sulfur_G
Scrappers Sulfur dust spillage from Scrappers QG_Sulfur_Scrp
Vibrating screen Sulfur dust from the vibrating screen QG_Sulfur_VS
Conveyor belt Sulfur dust Spillage from conveyor belt QG_Sulfur_CB
Wall on chute Sulfur dust in the wall on chute QG_Sulfur_WC
Conveyor to structure
Sulfur dust on conveyor to structure QG_Sulfur_C-S
Storage Sulfur granules final product from storage QG_Sulfur_FP
5.1.1.1.2 Prilled sulfur production process
Hot liquid sulfur is fed into an accumulator where droplets of liquid are
generated. These droplets fall by gravity onto a water-cooled conveyor belt where they
solidify, thus forming sulfur pellets. These pellets are scrapped off the belt and dropped
into buckets of a bucket conveyor system. The sulfur pellets are conveyed to the top of
the sulfur storage silo where they fall onto a pile of sulfur.
Table 15 also details from which areas of the plant all of these dust samples were
taken from. These on-site samples were not used by this research to measure their MEC
values. Therefore, no dust particle size characterization was done for all of these
samples. These dust samples were used for subsequent tests by the research team at the
center.

83
Figure 41. Graphical illustration of process for prilled sulfur samples

84
Table 15. Origin of prilled sulfur samples ORIGIN DESCRIPTION DUST SAMPLE ID
Storage Silo Sample was taken from the storage silo QChem_Sulfur_S
Buckets Sample was taken from buckets which contain the scrapped prilled sulfur dust
QChem_Sulfur_B
Conveyor line On the floor (sulfur dust spillage) around the conveyor line
QChem_Sulfur_C
Scrapping Area Scrapping area at the end of the water-cooled belt
QCHEM_Sulfur_Scrp
5.1.1.2 Particle size distributions
Table 16. Summary of particle sizes for granulated sulfur samples PARTICLE SIZE DISTRIBUTION
Particle size range (μm)
D10 (μm)
D25 (μm)
D50 (μm)
D90 (μm)
Relative span (μm)
MEAN (μm)
MODE (μm)
Particle Shape
QG_Sulfur_FP - 2522 3556 4641 6285 0.81 5828 5580 -
QG_Sulfur_G - 904.9 1127 1420 2326 1 2169 1512 -
QG_Sulfur_C-S 1-800 13.47 22.58 40.62 125.6 2.76 67.46 45.75 Irregular
QG_Sulfur_WC 1-200 15.53 27.30 49.08 114.7 2.02 57.89 66.44 Irregular
QG_Sulfur_CB 4-<2000 444.4 762.4 1156 1834 1.20 1144 1739 Spherical
QG_Sulfur_Scrp 4-<2000 376.3 810.2 1263 1848 1.16 1187 1909 Irregular
QG_Sulfur_VS 8-<2000 74.11 107.9 189.7 910 4.40 336.4 127.6 Irregular
The sample of QG_Sulfur_FP contained final products of sulfur granules (4.6
mm in size) from the storage silos and as such did not contain much dust particle (Table
16).

85
Three other samples taken from the plant (QG_Sulfur_Scrp, QG_Sulfur_CB, and
QG_Sulfur_G) contained mostly sulfur granules with a mean particle size of more than
1000 μm, and very few dust particle sizes below 420 μm, above which the NFPA does
not consider the particles to be dust sizes (Figure 42).

86
Sample QG_Sulfur_Scrp QG_Sulfur_CB
Photo
SEM Picture
Particle size
distribution
Figure 42. Particle size characterization of sulfur dust collected on site

87
Sample QG_Sulfur_VS QG_Sulfur_WC
Photo
SEM Picture
Particle size
distribution
Figure 42. continued.

88
Sample QG_Sulfur_C-S
Photo
SEM Picture
Particle size
distribution
Figure 42. continued.

89
The sample collected from the vibrating screen (QG_Sulfur_VS), had a very
wide range of 4 to 2000 μm, but its d50 was quite low at 189 μm. The distribution shows
two peaks, which may indicate potential contamination. It is expected to find both a
wide particle size range and a low d50 for this sample, as this dust has been taken from
the vibrating screen equipment, and the primarily role of this equipment is to separate
the fine and coarse particles.
The samples of QG_Sulfur_C-S and QG_Sulfur_WC had very fine particle sizes
with d50 of 40 μm and 49 μm respectively. The striking detail in comparing the particle
sizes of these samples is that both these samples have very similar mean, mode, d10,
d25, d50, d75, d90, and relative span, but their range of particle sizes are very different.
When looking at the particle size distribution in Error! Reference source not found.,
QG_Sulfur_WC has two peaks. The second peak on the right seems to indicate that
QG_Sulfur_WC was contaminated with a small quantity of sample having a mode
diameter around 500 μm. This may affect the values of mean, mode, d10, d25, d50, d75,
and d90 for this sample.
If we look more carefully at the particle size distribution in Error! Reference
source not found., it seems that QG_Sulfur_C-S has finer particles than
QG_Sulfur_WC. This being said QG_Sulfur_C-S and QG_Sulfur_WC really look alike.
QG_Sulfur_C-S has a range of up to 800 μm, whereas QG_Sulfur_WC had a range of
just up to 200 μm. This would indicate that up to 90% of the particles in these samples
are of similar size, but in the QG_Sulfur_C-S sample, the rest 10% of particles are of a
very large size. As such, it would be interesting to compare the explosibility result of

90
these samples and see if these large particles had any effect on the explosibility and
MEC results.
5.1.1.3 Chemical composition analysis
Table 17 gives the chemical composition of all the sulfur samples collected on-
site. The prilled and granulated sulfur samples both have similar chemical composition
and the same crystallographic properties (XRD).
Table 17. Chemical composition of sulfur dust samples S C O Na Cl Mg Al Si P K Ca Fe
Qchem_Prilled Sulfur_FP
90.1 7.98 1.67
0.0578 0.0189 0.0529 0.0527
0.0483 0.0097
QG_Sulfur_FP 98.9
0.909 0.0226 0.0762 0.019 0.0104 0.0141
0.0171
QG_Sulfur_G 90.1 2.09 5.03 0.87 1.56 0.183 0.0792 0.0209
0.0304 0.0356
QG_Sulfur_C-S 89.1 3.8 5.75 0.175 0.234 0.146 0.12 0.275 0.0045 0.0207 0.329 0.0307
QG_Sulfur_WC 84.3 11.1 4.23 0.0719 0.0828 0.0461 0.0371 0.0762 0.0041 0.0574 0.0754 0.0101
QG_Sulfur_CB 95.3 2.67 1.79
0.035 0.0175 0.0272 0.0543
0.0076 0.0518
QG_Sulfur_Scrp 91.8 1.98 5.47
0.0303 0.0902 0.0654 0.252
0.0093 0.263
QG_Sulfur_VS 37.8 60.1 1.81 0.0327 0.337 0.0293 0.0405 0.0538 0.0038 0.0031 0.0433 0.0049
All the samples contain more than 84% of sulfur, except the sulfur collected at
the vibrating screen which only has 38% of sulfur. Carbon is the major contaminant for

91
all the samples except for the sample collected at the storage facilities. A reason for
carbon being the major contaminant could be that the carbon from the conveyor belts
gets mixed with the sulfur dusts being transported throughout the unit. The purest
sample in the subset is that of QG_Sulfur_FP, which contains more than 99% sulfur,
which is expected as this is the final product found in the storage silos.
5.1.1.4 Humidity
The samples were also tested for the moisture content before conducting
experiments in the Hartmann tube. The sulfur dust was placed in a petri dish and left in a
heating oven for around 7 days at 50°C. The weight of the samples was chosen to be
around 500 mg to minimize the error in measurement of the potential water lost. There
was no weight change in the sulfur sample after heating, and thus it was concluded that
there was minimal moisture in the samples as there was no discernible difference in the
weights before and after heating the sample.
5.1.2 Phase II: Experimental determination of the minimum explosible concentration
(MEC) for sulfur dust collected on-site
Three of the five samples collected from the plant (granulated sulfur) recorded a
fire or an explosion in the modified Hartmann tube.
Table 18 and Figure 43 both give a detailed overview of these results. The table
and the figure indicate the volumetric mean, median, and mode for each sample (please

92
refer to Table 16 for the complete particle size distribution). For each of the samples, we
recorded the concentration for each of the following:
• A fire is propagated; this concentration was taken as the MEC.
• An explosion Level 1 and Level 2 occurs; this information gives a qualitative
indication of the severity of the explosion.
Table 18. Summary of explosibility results for on-site sulfur dust samples
SAMPLE Mean particle size diameter (μm)
Median particle size diameter (μm)
Mode particle size diameter (μm)
Propagating Fire observed / MEC (g/m3)
LEVEL 1 explosion (g/m3)
LEVEL 2 explosion (g/m3)
QG_Sulfur_Scrp 1187 1263 1909 No Fire No Fire No Fire
QG_Sulfur_CB 1144 1156 1739 No Fire No Fire No Fire
QG_Sulfur_VS 336.4 189.7 127.6 94.16 (-14)g
No Explosion
No Explosion
QG_Sulfur_WC 57.89 49.08 66.44 75 (-25)
87.5 (-11)
170 (-24)
QG_Sulfur_C-S 67.46 40.62 45.75 54.16 (-16)
89.16 (-34)
112.5 (-14)
g The numbers in the brackets indicate the possible error in measuring these values using the modified
Hartmann tube.

93
Figure 43. Explosibility results for on-site sulfur dust samples
The sulfur samples taken from the scrapper and the conveyor belt
(QG_Sulfur_Scrp and QG_Sulfur_CB) did not ignite in the modified Hartmann tube.
The d10 for these sample were 376 μm and 444 μm respectively, making these samples
one of the larger sulfur dust samples. In fact, NFPA stops classifying particles as dust at
more than 420 μm, and as such, NFPA would not consider these samples as dusts. These
results show the dust generated at the scrapper and the conveyor belt (with large particle
size) are not likely to be involved in an explosion.
The sample for the vibrating screen (QG_Sulfur_VS) ignited and propagated a
fire at 94.6 g/m3 but did not generate an overpressure in the tube even at very high
1
QG_Sulfur_Scrp
QG_Sulfur_CB
QG_Sulfur_VB
literature review the MEC of sulfur (2.5 to 150 g/m3)
QG_Sulfur_WC
QG_Sulfur_C-S
0
20
40
60
80
100
12
0
14
0
160
18
0
[mgL-1]
No Fire Fire Level 1 Level 2
-14
-25
-16
-11
-34
-24
-14

94
concentrations (up to 1000 g/m3). The median for this sample is 189.7 μm but the
distribution shows two peaks, which may indicate potential contamination. This sulfur
sample though was heavily contaminated with carbon (60% of the content – see Table
17) and as such it is very difficult to draw any conclusions or compare any of this data to
the one present in the literature. Carbon dust itself is a explosible dust which has
generally quite a low MEC. There is no data present in the literature which measure
MEC for a mixture of carbon and sulfur dust. This result shows that dust collected at the
vibrating screen can be involved in a dust explosion, but we cannot say that this is
entirely due to sulfur since the sample is contaminated with carbon.
The samples from the wall on chute (QG_Sulfur_WC, 85% sulfur) contained
very fine particles (median diameter of 49.08 μm). It ignited at values at around 75 g/m3.
Taking into account the uncertainty, we found an MEC between 50 g/m3 and 75 g/m3.
For this sample, we observed a Level 1 explosion for quite a wide range of
concentrations (from 87.5 to 170 g/m3).
The samples from the conveyor to structure (QG_Sulfur_C-S, 89% sulfur)
contained very fine particles (median diameter of 40.62 μm). It ignited at values at
around 54 g/m3. Taking into account the uncertainty, we found an MEC between 38
g/m3 and 54 g/m3. For this sample, the transition from Level 1 to Level 2 explosions
occurred over a narrow range of dust concentrations (from 89.16 to 112.5 g/m3), unlike
QG_Sulfur_WC. The potential contamination of QG_Sulfur_C-S as explained in section
0 may explain the differences of MEC values and explosions behavior for levels 1 and 2

95
with QG_Sulfur_WC. QG_Sulfur_C-S also has finer particles than QG_Sulfur_WC,
which may lower the MEC.
The results above clearly show that the dusts generated at the wall on chute and
conveyor to structure are very prone to dust explosion, and we can qualitatively say that
the explosion may be more severe than dust generated at the vibrating screen. It is vital
to remember that the dust in the wall on chute is present in an enclosed space which
would certainly affect the severity of the dust explosion at this location.
There is no literature data on MEC in the range of particle size of
QG_Sulfur_WC and QG_Sulfur_C-S (40 μm < median diameter < 50 μm), so our results
give a first indication of the MEC for fine sulfur dust (38 g/m3 < MEC < 75 g/m3).
However, these results do not represent pure sulfur.
Figure 44 shows pictures of the fire / explosion of sulfur dust in the modified
Hartmann tube for QG_Sulfur_VS, QG_Sulfur_WC, and QG_Sulfur_C-S.

96
QG_Sulfur_VS QG_Sulfur_WC QG_Sulfur_C-S
Figure 44. Pictures of the fire / explosion of sulfur dust (collected on-site) in the modified Hartmann tube

97
5.1.3 Phase III: Effect of particle size distribution on the MEC values of sulfur dust
The sulfur sample that was chosen to be mechanically sieved was the granulated
sulfur sample, which was the final pure sulfur product received in granular form
(QG_Sulfur_FP). This dust sample was grounded painstakingly for days and then
mechanically sieved into 6 particle size ranges. These were 0-53 µm, 63-70 µm, 90-106
µm, 125-150 µm, 150-180 µm, and 355-425 µm.
These sieved dust samples could not be analyzed in the particle size analyzer as
not enough amount of dust could be sieved to both conduct experiments and measure the
samples through the particle size analyzer.
Therefore, we decided to present the results as a range of dust particle size on the
basis of the sieves used for the sieving or the arithmetic mean assuming a perfect bell
shape distribution.
Generally, for the results obtained using the six sieved samples, there is not much
data in the literature to compare our results to. Only one of these samples did not either
exhibit a fire or an explosion in the modified Hartmann tube.
Table 19 gives a summary of all the explosibility results of the six sieved
samples and Figure 45 provides a graphical representation of this data.
For the on-site samples, we observed very clear propagation of fires, so the
conclusion on MEC was somehow easy to obtain. For the sieved sample, this decision
on whether we have an MEC or not was not that clear. Indeed, because of the narrow
range of particle size, there were 2 typical observations when the dust ignited:

98
• The dust ignites and shows a slow and limited propagation throughout the dust
cloud in the tube. We refer to this observation as Beginning of Fire (BF).
• The dust ignites and shows a clear and fast propagation throughout the dust cloud
in the tube. We refer to this observation as Propagating Fire (PF).
Therefore, we concluded that the MEC would be somewhere between the
concentrations for BF and PF.
Table 19. Summary of explosibility results of sieved sulfur samples
SAMPLE PSD RANGE (μm)
MEC
(g/m3)
LEVEL 1 explosion (g/m3)
LEVEL 2 explosion (g/m3)
Comparable MEC from literature (g/m3)
QP_Sulfur_FP 0-53 37 47 109
30 (Yanqiu et al., 2014) 100 (Cashdollar et al, 2007) 2.5 (Áñez et al, 2017)
QP_Sulfur_FP 63-75 48 201 NA
QP_Sulfur_FP 90-106 57 822 No Explosion
QP_Sulfur_FP 125-150 175 NA NA
QP_Sulfur_FP 150-180 578 No Explosion No Explosion
QP_Sulfur_FP 355-425 No Fire
No Explosion No Explosion 150 (Yanqiu et al., 2014)

99
Figure 45. Graphical summary of explosibility results of sieved sulfur samples
5.1.3.1 Sample of 0-53 µm
The smallest sieved sample of 0-53 µm ignited and propagated a fire at 37.34
g/m3, gave a Level 1 explosion at 37.34 g/m3, and a Level 2 explosion at 108.9 g/m3.
The MEC is therefore relatively low (37.34 g/m3). There was also a transition from a
propagating fire to Level 1 explosion occurring over a small rage of concentration. This
experimental result agrees with Yanqiu et al. (2014), who found an MEC value of 30
g/m3 for a dust particle mean size of 35 µm 20 using a 20-liter sphere.
Cashdollar et al. found an MEC value of 100 g/m3 for a particle size range of 10
to 50 µm 56 using a 20-liter sphere, and Áñez et al. found an MEC value of 2.5 g/m3 for a
particle size (d50) of 25.7 µm 52 (equipment not mentioned), which are very different
from our results.
0
100
200
300
400
500
600
700
0 50 100 150 200
MEC
(g/
m3 )
Particle Diameter (μm)
Explosivity Results of Sieved Sulfur Samples
BF in comparison with MEC PF in comparison with MEC

100
In regards to the value found by Áñez et al., such a low value of MEC has not
been found anywhere for any other dust. OSHA also states that for most dusts, the lower
explosive limit is usually 15 g/m3 52. Thus, this data needs to be scrutinized for accuracy
and applicability in regards to sulfur dust.
5.1.3.2 Sample of 63-70 µm
The sieved sample of 63-70 µm ignited a fire (BF) at 47.98 g/m3, propagated a
fire (PF) at 140.00 g/m3, gave a Level 1 explosion at 200 g/m3, but no Level 2 explosion
was recorded. The uncertainty on MEC is high for this sample.
5.1.3.3 Sample of 90-106 µm
The sieved sample of 90-106 µm ignited a fire (BF) at 56.95 g/m3, propagated a
fire (PF) at 84.43 g/m3, gave a Level 1 explosion at 821.67 g/m3, but no Level 2
explosion was recorded. Here, while the uncertainty of MEC is less than the previous
sample, we can observe that the MEC is quite low but the severity of the explosion
seems to be decreasing at this particle size range.
5.1.3.4 Sample of 125-150 µm
The sieved sample of 125-150 µm ignited a fire (BF) at 175.00 g/m3, propagated
a fire (PF) at 265 g/m3, but no significant overpressure for a Level 1 explosion was
recorded even at concentration up to 1000 g/m3. At this particle size, the MEC clearly
increases and the severity of potential explosion decreases.

101
5.1.3.5 Sample of 150-180 µm
The sieved sample of 150-180 µm ignited a fire without clear propagation (only
BF) at 578.33 g/m3, but no significant overpressure for a Level 1 explosion was recorded
even at concentration up to 1000 g/m3.
For all the samples with dust particle size ranging from 63 to 180 µm, there was
no data in the literature for this particle size to compare the MEC results to.
5.1.3.6 Sample of 355-425 µm
For the largest particle size sample of 355-425 µm, it was found that sulfur dust
is not ignitable in Hartmann tube at this particle size range. This experimental result
disagreed with the results found by Yanqiu et al., which found an MEC of 150 g/m3 for
particle size ranging from 1400 to 1680 µm 20. Even though the characterization of the
dust particle sizes is different for both our research and Yanqiu et al., the results obtained
by Yanqiu et al. have to be scrutinized as a particle stops being classified as dust after
425 µm, and even extremely explosible dusts like aluminum dust do not explode at this
range.
As is shown in Figure 45, even if significant uncertainties are generated by the
use of the Hartmann tube, the MEC of sulfur dust is dependent on the particles sizes. It
can be noticed that dust particle size has very limited influence on MEC up to a dust
particle size of around 100 µm. Above this particle size, the MEC increases with
increasing particle size, indicating a strong effect of dust particle size on MEC values.

102
Hertzberg et al. (1982) finds a similar effect of particle size on MEC at lower particle
sizes for both polyethylene and coal dust33. Figure 45 is the major finding of this thesis.
5.2 Experimental results for polyethylene dust
5.2.1 Phase I: Analysis and physical characterization of polyethylene dusts found in
the local industries of Qatar
5.2.1.1 Collection of Samples
Five samples of dust were collected by the representative of the company from
the polyethylene process areas in the plant and provided to us directly (Table 20):
• Two of these were pure polyethylene samples (Qchem_PE_Rx Fluff and
Qchem_PE_TR571 Fluff) of different grades taken from the storage facility.
• The other three samples were taken from the process units:
o The feeder unit (QChem_PE_Fdr);
o The blender unit (QChem_PE_Bldr);
o The charging station unit (Qchem_PE_CS).
The company also provided a sample of additive (Qchem_SN1010FF) which is
used in the process by the company to provide the final polyethylene product with given
mechanical properties.
The last sample collected was a mixture of three components
(Qchem_PE_Mixture):
• TR571 Fluff polyethylene final product;
• Songnox6280 additive;

103
• Songnox1010 additive.
Table 20. Location and identification of the dust samples from the polyethylene plant ORIGIN SAMPLE DESCRIPTION DUST SAMPLE ID
Storage Polyethylene Rx Fluff polyethylene final product
QChem_PE_Rx Fluff
Storage Polyethylene TR571 Fluff polyethylene final product
QChem_PE_TR571 Fluff
Feeder Polyethylene Polyethylene dust from feeder QChem_PE_Fdr
Blender Polyethylene Polyethylene dust from blender
QChem_PE_Bldr
Charging station
Polyethylene Polyethylene dust from charging station
QChem_PE_CS
NA Additive Additive used in making final polyethylene pellets
QChem_SN1010FF
NA Mixture of polyethylene and additive
Mixture of TR571 polyethylene and Songnox6280, Songnox1010 additives
QChem_PE_Mixture
5.2.1.2 Characterization of Samples
A comprehensive summary of the particle size of these samples in given in Table
21. Most of the polyethylene dust samples exhibited a wide range of dust particle size,
reaching up to more than 2000 μm. The two largest samples in this subset were those of
the final products of QChem_PE_RxFluff and QChem_PE_TR571Fluff. These samples
had a very broad particle size range of 10 to 2000 μm. Their d50 was 692 μm and 825
μm respectively, and these particle sizes lie outside the particle size of 420 μm at which
the NFPA defines particles as dusts. While QChem_PE_RxFluff had a spherical shape,
QChem_PE_TR571Fluff had an irregular shape. Irregular shapes present a greater

104
hazard for dust explosions than spherical shapes, because in the case of irregular shapes
there is a higher surface area for the combustion reaction to take place.
The polyethylene dust sample from the feeder (QChem_PE_Fdr) had a very broad
particle size range, but still contained a good percentage of some very fine particles.
While the d10 was very fine at 26 μm, the d50 was 461 μm, which is still above the
NFPA standard of 425 μm. When looking at the particle size distribution in Error!
Reference source not found., QChem_PE_Fdr has two peaks. The second peak on the
left seems to indicate that QChem_PE_Fdr was contaminated with a small quantity of
sample having a mode diameter around 30 μm. This may affect the values of mean,
mode, d10, d25, d50, d75, and d90 for this sample.
The two polyethylene samples from the charging station and the blender
(QChem_PE_CS and QChem_PE_Bldr) had very fine particle sizes and this can be seen
by their d50 of 11 μm and 164 μm respectively.
The additive sample (QChem_SN1010FF) contained particle sizes which were larger
than 678 μm (median value), but also had some very fine particles of about 50 μm (d10)
which indicated a very wide range of dust particle sizes. The sample which contained a
mixture of two additives and polyethylene (QChem_PE_Mixture) had very fine particle
size ranges with a d50 of just 49 μm. It can be noted in Error! Reference source not
found. that this sample has three different peaks, confirming the mixture of one
polyethylene dust and two additives.

105
Table 21. Summary of particle sizes for polyethylene and additive samples PARTICLE SIZE DISTRIBUTION
Sample Particle Size Range (μm)
D10 (μm)
D50 (μm)
D90 (μm)
Relative span
MEAN (μm)
MODE (μm)
Particle Shape
QChem_PE_RxFluff Polyethylene
10-<2000
229.4
692.3
1336
1.59 743.0
751.1 Spherical
QChem_PE_TR571Fluff
Polyethylene
10-<2000
149.4
825.3
1671
1.84 870.1
1443 Irregular
QChem_PE_Fdr Polyethylene
6-1500
26.26
461.3
869.9
1.82 448.9
567.7 Spherical
QChem_PE_Bldr Polyethylene
4-<2000
52.33
164.7
844.6
4.81 314.8
153.8 Spherical
QChem_PE_CS Polyethylene
1-200 3.172
11.46
36.15
2.87 17.83
11.29 Irregular
QChem_SN1010FF Additive 1-<2000
50.84
678.7
1575
2.24 748.9
1197 -
QChem_PE_Mixture
Mixture of polyethylene and additive
1-<2000
9.522
49.67
399.4
7.84 130.1
34.58 Irregular
The samples received were tested for moisture content using methodology
similar to sulfur dust, and the polyethylene dust was found to have negligible amount of
moisture, and hence were assumed dry.

106
QChem_PE_Rx Fluff QChem_PE_TR571 Fluff
Figure 46. Particle size characterization of polyethylene dust collected on-site

107
QChem_PE_Fdr QChem_PE_Bldr
Figure 46. continued.

108
QChem_PE_CS QChem_SN1010FF (Additive)
Figure 46. continued.

109
QChem_PE_Mixture (Mixture of polyethylene & additives)
Figure 46. continued

110
5.2.2 Phase II: Experimental determination of the minimum explosible concentration
(MEC) for polyethylene dust collected on-site
5.2.2.1 MEC of on-site samples
Table 22 and Figure 47 gives a summary of all the results of the explosibility
tests for all on-site polyethylene samples and additives tested with the modified
Hartmann tube. All the polyethylene samples either recorded a fire or explosion in the
Hartmann tube.
Table 22. Summary of explosibility results for on-site polyethylene dust and additive
samples SAMPLE Sample type PSD
MEAN
(μm)
PSD MOD
E (μm)
MEC FIRE
(g/m3
)
LEVEL 1 explosio
n (g/m3)
LEVEL 2 explosio
n (g/m3)
Comparable MEC from literature
(g/m3)
QChem_PE_Rx Fluff Polyethylene
743.0 751.1 325 (-31)h
No Explosion
No Explosion
-
QChem_PE_TR571 Fluff
Polyethylene
870.1 1443 184.1 (-70)
545.8 (-128)
- -
Qchem_PE_Fdr Polyethylene
448.9 567.7 60.83 (-24)
69.16 (-8)
81.66 (-6)
-
Qchem_PE_Bldr Polyethylene
314.8 153.8 46.66 (-23)
141.66 (-16)
- 60(Mittal et al.,1996)
65(Hertzber
g et al, 1982)
QChem_PE_CS Polyethylene
17.83 11.46 33.33 E-5
- 41.66 (-7)
50(Hertzberg et al, 1982)
QChem_SN1010FF Additive 748.9 1197 No Fire
No Fire No Fire -
QChem_PE_Mixture
Mixture of polyethylen
e and additive
130.1 34.58 - 78.3 (-50)
145.0 (-46)
-
h The numbers in the brackets indicate the possible error in measuring these values using the modified
Hartmann tube.

111
Figure 47. Explosibility results for on-site polyethylene dust samples
For one of the final products (QChem_PE_Rx Fluff), it was recorded that while
this sample ignited and propagated a fire at 325 g/m3, there were no Level 1 or Level 2
explosions. On the other hand, the other final product (QChem_PE_TR571Fluff)
propagated fire at 184.1 g/m3, and the sample had a Level 1 explosion at the
concentration of 545.8 g/m3. The dust concentration at which this sample exhibited fire
was very wide. There is no literature data for these samples which have a particle size
median value of 692 µm and 825 µm respectively. It can be seen in Error! Reference
source not found. that the QChem_PE_TR571 Fluff sample has a higher concentration
of finer particle sizes compared to QChem_PE_Rx Fluff. This might explain why the
QChem_PE_TR571 had a Level 1 explosion, whereas the QChem_PE_Rx Fluff did not.

112
These explosibility results generate a very interesting conclusion. Both of these
samples have a mean and d50, where the particle size is bigger than the NFPA standard
particle definition of 420 µm, but their d10 is 229 µm and 149 µm respectively. Thus, it
might be that the explosive behavior of these samples is being driven by the lower sized
dust particles in the sample. Thus, in an industrial setting people might classify this dust
sample to be not explosible based on the mean and d50, but a sample with such a large
particle distribution could still pose a dust explosion hazard based on the presence of the
finer particles in the dust sample.
When the dust sample from the feeder (QChem_PE_Fdr) was tested, it was
shown that while this sample propagated a fire at 60.83 g/m3, the sample had a Level 1
explosion at the concentration of 69.16 g/m3, and had a Level 2 explosion at 81.66 g/m3.
All of these dust concentration values are very close to each other, and as such, it is
extremely difficult to differentiate at what concentration the sample propagated a fire
and at what concentration the Level 1 explosion occurred. There is no literature data for
this particle size median value of 461 µm, but the dust exploding at such low
concentrations for a comparatively medium sized dust particle size range does not agree
with the other results captured using the sieved samples of polyethylene. If the particle
size graph is seen in Error! Reference source not found., it can be seen that there are
two peaks in regards to the particle size. It might be that the contamination of the dust
samples at the peak of 30 µm is responsible for giving such extremely sensitive MEC
values. The results above clearly show that the dusts generated at the feeder are very

113
prone to dust explosion and we can qualitatively say that the explosion may be very
severe.
For the sample taken from the blender (QChem_PE_Bldr), the tests showed that
while this sample propagated a fire at 46.66 g/m3, the sample had a Level 1 explosion at
the concentration of 141.66 g/m3. In the literature, we find MEC values close to this dust
particle size. Mittal et al. give an MEC value of 60 g/m3 for a dust particle size range of
150 - 180 µm 35. Hertzberg et al. also give an MEC value of 65 g/m3 for a dust particle
size range of 35 - 150 µm 33. Even though the MEC values are comparable, the dust
particle size range is not comparable as Hertzberg et al. (1982), Mittal et al. (1996), and
this research, all use different ways to characterize the particle size. Once again, the
results above clearly show that the dusts generated at the blender are prone to dust
explosion and we can qualitatively say that the explosion may be less severe than dust
generated at the feeder (Figure 48).

114
QChem_PE_Rx Fluff
QChem_PE_TR571 Fluff
QChem_PE_Fdr
QChem_PE_Bldr
QChem_PE_CS
QChem_PE_Mixture (mixture of
polyethylene and additive)
Figure 48. Pictures of the fire / explosion of polyethylene and additives dust (collected on-site) in the modified Hartmann tube

115
The tests with the sample from the charging station (QChem_PE_CS) confirmed
that the particles were so fine that the sample directly had a Level 2 explosion at a very
low concentration of 41.66 g/m3. The visual capture of this dust explosion shown in
Figure 48 lend doubt to whether this sample is purely polyethylene sample. The extreme
sensitivity of the MEC to the particle size and the nature of the explosion seem to
suggest that this is a polyethylene additive, rather than a pure polyethylene sample.
Hertzberg et al. gives an MEC value of 50 g/m3 for a dust particle size range
(polyethylene) of 8-60 µm (Hertzberg et al., 1982). As before, even though the dust
particle size range sample is not comparable, as Hertzberg et al. uses the surface
weighted area mean diameter to characterize the dust particle size, our research used the
mean volume diameter to characterize the dust particles. The results above clearly show
that the dusts generated at the charging station are very prone to dust explosion and we
can qualitatively say that the explosion would be extremely severe.
The additive sample of QChem_SN1010FF contained quite large dust particles.
This sample purely contained of additives used in the process of making polyethylene
and did not contain any polyethylene. This additive sample did not explode and with its
large particle size, this was an expected result. It is important to note that this sample
was given to us in its final form, and as such, this sample does not represent the particle
size characterization of the additive being used in the process. Therefore, no conclusions
can be made regarding the explosibility of this additive for a particle size range that
would contain just finer particle sizes.

116
The QChem_PE_Mixture sample contained a mixture of both pure polyethylene
and two other additives used in the plant. The dust sample had a Level 1 explosion at
78.3 g/m3 and a Level 2 explosion at 145 g/m3. This sample contains the polyethylene
dust sample (QChem_PE_TR571 Fluff) and the MEC value for that sample was found to
be 184 g/m3. The MEC value of this mixture is much lower at 78 g/m3, and this can be
explained by both the addition of additives in the sample and the presence of much finer
particle sizes in the sample. Since this is not a pure polyethylene sample, there is no data
from the literature to compare against. It can be concluded though that as the particle
size is quite small, it is expected that the dust particle would explode at lower dust
concentrations.
5.2.2.2 Conclusions
As a general conclusion, the on-site samples with the lower particle sizes
exploded at a lower MEC value than the larger particle size samples. In the literature, the
MEC of polyethylene dusts ranged from 10 to 500 g/m3. The experimental results with
the on-site samples gave the value of the MEC from 46.66 to 325 g/m3 which lies within
the range found in the literature. The key drawback regarding this data was the same as
that of on-site sample regarding sulfur dust. As the particle size range of the samples was
so wide, it was very difficult to accurately correlate the effect of particle size on MEC
values.
It is important to note that the experimental results are for HDPE dust, and these
results are being compared to results in the literature which mostly used LDPE dust.

117
While for most of the samples there was no data present in the literature to compare to,
for the select few samples where the particle size range could be compared, the MEC
data of HDPE dust could not be compared to the MEC data of the LDPE dust because of
the difference in characterization of samples.
In regards to the quantification of error for polyethylene dust, on an average, the
error for the polyethylene dust samples range between 20 to 30 g/m3.
Similar to the tests conducted with sulfur dust, the tests with polyethylene dust
provide a qualitative indication of the severity of an explosion to the industry. This data
gives a good indication of which areas of the plant face a higher risk from potential dust
explosion, and the MEC values using a modified Hartmann tube still provide a close
enough value to address the risks of these potential dust explosions.
5.2.3 Phase III: Effect of particle size distribution on the MEC values of polyethylene
dust
The sample QChem_PE_TR571 Fluff was chosen to be sieved mechanically.
This sample was chosen for two reasons; one is that it was a final product, thus the
purity of the sample could be guaranteed; and the second was that there was a huge
quantity of this sample available to grind and sieve into various cuts. The samples were
sieved into five different particle size ranges. This research was only involved in sieving
the polyethylene dust samples and the modified Hartmann tube results of these samples
have been carried out by other members at the Qatar branch of the Mary Kay O’ Connor
Process Safety Center (Dr Walid Khalfaoui, Atif Ashraf, and Jack Altwal). Their

118
approval was taken in order to compare the results of this research to the data they
measured for sieved polyethylene samples. Table 23 and Figure 49 give an overview of
these results generated for the sieved polyethylene samples.
Table 23. Summary of explosiblity results for sieved polyethylene samples PSD RANGE (μm)
PARTICLE DIAMETER (μm)
MEC FIRE (g/m3)
LEVEL 1 explosion (g/m3)
LEVEL 2 explosion (g/m3)
Comparable MEC from literature (g/m3)
0-53 53 18.04 27.36 84.52 50 (Hertzberg et al.,1982)
53-63 63 16.67 NA NA 10 (Amyotte et al,2012) 15 (HSE, 2003)
125-150 150 30.83 NA NA 50 (Mittal et al.,1996)
150-180 180 50 NA NA 60 (Mittal et al.,1996)
355-425 425 No Fire No Explosion No Explosion -

119
Figure 49. Graphical summary of explosibility results of sieved polyethylene samples
For the dust particle size with range of 0-53 μm, the MEC value was found to be
18.04 g/m3. As this is a very fine particle size range, the MEC of this dust sample is also
very low. However, Hertzberg et al. gave an MEC value of 50 g/m3 for a dust particle
size range of 8 to 60 μm 33.
The sample which contained the dust particles with range of 53-63 μm, the MEC
value was found to be 16.67 g/m3. This result seems to agree with the MEC values found
in two studies in the literature. Amyotte et al. found an MEC value of 10 g/m3 for a
median volume diameter size of 49 μm 38, whereas the health and safety executive states
an MEC value of 15 g/m3 for a median dust particle size of 62 μm 36.
In regards to the sample which had a range of 125-150 μm, the MEC was found
to be 31 g/m3, and this value is comparable to the value found by Mittal et al., where for

120
the same particle size range, they recorded an MEC value of 50 g/m3. Similarly for the
next sample of 150 to 180 μm, the MEC was found to be 50 g/m3 and for the same
range, Mittal et al. found an MEC value of 60 g/m3 35.
The largest sample of 355-425 μm did not explode and while this is expected
because of its large particle size, there is no data in the literature to compare our results.
The conclusion from the figure and table is that the MEC of polyethylene dust is
dependent on the particles size. It can be seen that at lower dust particle sizes, the effect
of particle size on MEC is not as pronounced, when comparing the very same effect at
larger dust particles sizes. This finding is in agreement to the conclusions generated by
experiments conducted by Hertzberg et al. (1982). For larger dust particle sizes, the
MEC increases with increasing particle size. Mittal et al. (1996) had measured the effect
of dust particle size on MEC using a 20-liter sphere and Hertzberg et al. (1982) had
measured the same correlation using an 8-liter chamber. Comparing Figure 12 and
Figure 13 to the graph generated in Figure 49, it can be seen that all the graphs follow
the same trend of increasing MEC values with increasing dust concentrations at larger
dust particle sizes. Thus, the applicability of a Hartmann tube can be validated, when its
results and trends agree with other data found in the literature 35,33.
5.3 Discussion on manual sieving vs. mechanical sieving
As has been discussed above, the dusts were sieved into finer particle sizes to
have a better understanding of the effect of particle size on MEC. The first sieving
method was manual and then later the method used was of mechanical sieving. It was

121
found that inconsistencies occurred in the results because of the manual sieving process.
The manual sieving would be done till there was enough mass for a sample dust particle
size range to conduct tests. For example, the grinded dust would be sieved for a few
hours between the 300 μm and 250 μm sieves. If about 1000 grams of dust was found on
the 250 μm sieve, this was then deemed enough and experiments were conducted on it,
and this dust sample was labelled to have a range of 300 to 250 μm. It is very likely
though that this dust sample would have many particle sizes which are lower than 250
μm, and through the process of manual sieving, all of them would not have sieved down
to the lower sized sieve. This would then undoubtedly affect the MEC results as the
lower particle sizes explode at lower concentrations. Even though the general results
using manually sieved samples agree with the MEC and dust particle size correlation,
the individual MEC results of each particle size range might not be accurate and thus
have not been compared to the values in the literature. When dusts were mechanically
sieved, the mass of each sieve with the dust samples was tested after every hour and only
if the mass of each sieve with the dust samples remained unchanged, then the
mechanical sieving process was marked to be complete. Even with the high oscillation
of the mechanical sieves, it would take around 3 hours to get about 300 grams of dust. It
can be speculated that to get the same amount of dust through manual sieving would take
days, which is not practical at all. Hence, this was a lesson learnt in the research that to
get accurate results, manual sieving is not the right methodology to sieve dust into finer
particle sizes.

122
5.3.1 Experimental results with manually sieved samples of polyethylene dust
The manual sieving was done for five ranges of dust particle size using calibrated
sieves. The five ranges of dust particle size were 300-425 μm, 250-300 μm, 150-250 μm,
125-150 μm, 75-125 μm, and 20-75 μm. Table 24 states the overall explosibility results
of all these different particle size ranges. From these results, it can be concluded that
there is a correlation between the particle size and the MEC for polyethylene dust, and
that for a lower particle size, a lower dust concentration is needed for the dust to be
explosible. However, some data inconsistencies were also found out using the manually
sieved samples. As an example for the dust particle size range of 150 to 125 μm, a Level
1 explosion was recorded for 105 g/m3, whereas for a smaller sample of particle size
range of 125 to 75 μm, a Level 1 explosion was recorded at 247 g/m3. This does not
agree with the general principle that a lower dust particle size will have a lower MEC.
This also does not agree with the conclusions found specifically for polyethylene dust in
regards to the effect of particle size on MEC, as found by both Mittal et al. and
Hertzberg in their papers35,33. As such, even though the overall results agree with MEC
and dust particle size correlation for polyethylene, the individual MEC results of each
particle size range might not be accurate, and thus have not been compared to the values
in the literature.

123
Table 24. Explosibility results of manually sieved polyethylene dusts
PSD Range[μm] MEC Fire
[g/m3]
Level 1 explosion
[g/m3]
Level 2 explosion
[g/m3]
300-425 NF NE NE
250-300 235 353 NE
150-250 116 412 NE
125-150 45 105 NE
75-125 138 247 682
20-75 40 40
5.3.2 Experimental results with manually sieved samples of sulfur dust
The sample chosen to be manually sieved was the pilled sulfur sample from its
storage silos. This involved the same time-consuming process of grinding the dust and
sieving them into five different particle size ranges of 500-600 μm, 425-500 μm, 355-
425 μm, 300-355 μm, and 250-300 μm. After conducting the full range of tests in the
Hartmann tube, it was found out that none of the dust samples exploded at concentration
of up to 1000 g/m3. This was a surprising result, even though there was no data in the
literature to compare our results. These results led the research team to question whether
prilled sulfur and granulated dust have different explosible properties for the same
particle size. Upon checking the finer sizes of both the prilled size and granulated sulfur
under the scanning electron microscope, it was found that the particle shape was only
different at large particle sizes, and for fine dust, both of them looked similar and had
similar crystallographic properties. The team decided to confirm the validity of the
manual sieving methodology and it was found that the same errors were prevalent in the
range of particle sizes collected as was encountered during the manual sieving of the

124
polyethylene dust. Thus, it was decided to mechanically sieve the sulfur dust sample to
find the effect of the dust particle size on the MEC for sulfur dust. The tests using the
mechanically sieved samples confirmed the data of the tests using the manually sieved
samples, but since the manual methodology had errors in it, it was decided not to report
these results. What can be concluded with a high certainty from these results though is
that for the range of 250-600 μm, the sulfur dust does not meet the minimum MEC
requirements for the dust to explode.
5.4 Comparison of results using a modified Hartmann tube vs 20-liter sphere for
a sample of sulfur dust
The 20-liter sphere is the standard equipment to measure many dust explosibility
properties including MEC, Pmax, KSt, and LOC (see section 2.5.3.1). Through the thesis
work, we used the modified Hartmann tube to evaluate the MEC of sulfur and
polyethylene samples. Sections 5.1.2, 5.1.3, and 5.2.2 presented results of MEC with
uncertainties associated with the value (Section 4.3).
At the time of the thesis, one of my tasks was to progress the installation of the
20-liter sphere in the laboratory. A major significant part of my time was dedicated to
this task. The sphere was successfully installed only toward the end of my research and I
unfortunately was not able to experiment with the 20-liter sphere myself.
One series of 4 MEC determination tests using the 20-liter sphere for one sulfur
sample, namely QG_Sulfur_WC (see Table 16, Table 17, and Error! Reference source
not found. for the description of the sample) is shown in this thesis in order to be

125
compared with our modified Hartmann tube. These 4 tests were performed by other
members of the Qatar branch of the Mary Kay O’ Connor Process Safety Center (Dr
Walid Khalfaoui, Atif Ashraf, and Jack Altwal). Their approval was taken prior to using
these data in this manuscript.
The ASTM E1515 Standard Test Method for Minimum Explosible Concentration
of Combustible Dusts was used to determine the MEC (Table 25).
Figure 50 shows the results of these tests. An MEC of 60 g/m3 was measured for
the QG_Sulfur_WC sample with the 20-liter sphere. The value of MEC for the same
sample we measured with the modified Hartmann tube was between 50 and 75 g/m3. For
this sample, the modified Hartmann tube released to provide a good indication of the
MEC.
A full study would be necessary for different types of dust to conclude the
quality of MEC determination using the modified Hartmann tube, at least as a screening
equipment before confirmation of the results in a 20-liter sphere, but the results we
obtained with sulfur is quite promising.
Table 25. Determination of MEC in 20-liter sphere (ASTM E1515)
Vacuum pressure 0.4 bar Initial pressure 1 bar Dispersion Pressure 20 bar Time Delay 60 ms Ignition Energy 2.5 kJ Explosion Criteria Pm ≥1 barg Definition of MEC Lowest concentration that satisfies Explosion
Criteria

126
Figure 50. MEC measurement for QG_Sulfur_WC using a 20-liter sphere
0
0.5
1
1.5
2
2.5
3
3.5
0 20 40 60 80 100 120 140
Pm
(b
ar)
Concentration (g/m3)
20 Litre Sphere MEC Results - QG_Sulfur_WC
MEC Criteria Experimental Results
MEC: 60 g/m3

127
6 CONCLUSIONS
The objective of the thesis was to perform the experimental study of the minimum
explosion concentration (MEC) of polyethylene and sulfur dust in the context of the
Qatar industry.
Typical dust samples collected on-site at polyethylene and sulfur production
facilities in Qatar were collected and characterized to have the associated composition,
particle size distribution and particle shape.
The MEC of these samples were then measured using a Modified Hartmann Tube.
While the Modified Hartmann Tube is not the standard piece of equipment for the
determination of MEC. It was used as a screening tool for MEC determination. The
MEC measured by the modified Hartmann tube was compared to the data obtained from
the 20-liter sphere for one sulfur sample and the values were comparable. Finally, the
influence of the particle size distribution of the polyethylene and sulfur dust samples on
the MEC was studied. It was showed that for both sulfur and polyethylene, at smaller
particle sizes (<100 μm), the particle size does not have a strong influence on the MEC
values. For larger particle size MEC will clearly increase with the particle size.
6.1 Sulfur dust
The results clearly showed that dust collected on-site at the vibrating screen can
be involved in a dust explosion, but we cannot say that this is entirely due to sulfur since
we found that this sample was contaminated with carbon. The dusts generated at the wall

128
on chute and conveyor to structure are very prone to dust explosion, and we can
qualitatively say that the explosion may be more severe than dust generated at the
vibrating screen.
Our sulfur dust sample was grounded and mechanically sieved into 6 particle size
ranges (0-53 µm, 63-70 µm, 90-106 µm, 125-150 µm, 150-180 µm, and 355-425 µm).
The MEC for these cuts were analyzed and we were able to plot the MEC as a function
of particle size, which constitutes the major finding of the thesis.
The literature provides very few data for MEC of sulfur dust and as such the data
generated by this research contribute to fill this gap.
6.2 Polyethylene dust
The results with the collected polyethylene dusts clearly show that the dusts
generated at the feeder, the blender and charging station are prone to dust explosion and
we can qualitatively compare the relative severity of these explosions.
Polyethylene sample was mechanically sieved into 6 particle size ranges (0-53
μm, 53-63 μm, 125-150 μm, 150 - 180 μm) and the MEC as a function of particle size
was determined. The 355-425 μm sample did not explode,
The literature provided quite a sufficient amount of data in regards to the MEC of
polyethylene dust. In general, these data are not comparable to each other, as most times
the complete dust characterization details are not mentioned and nor is the type of
polyethylene dust used mentioned. There is no data present in the literature for HDPE
dust except for one paper which lists just one Pmax and KSt value for this type of dust.

129
This research generates some new MEC data in regards to HDPE dust using a modified
Hartmann tube.
6.3 Future research
This research only measures the effect of particle size on MEC for polyethylene
and sulfur dust. Many other factors have an effect on the MEC values such as water
content, turbulence, ignition methods, and dispersion methods) and deserve to be
investigated thoroughly.
These can be used as a starting point to build on the data generated by this
research, especially for sulfur dust where little to no data exists. Since this research
attempts to compare the values obtained by a modified Hartmann tube and a 20-liter
sphere, other aspects such as particle breakage, uniformity of dispersion in the different
equipment could also serve as topics to be explored in future research.

130
REFERENCES
1. Abbasi T, Abbasi SA. Dust explosions-Cases, causes, consequences, and control.
J Hazard Mater. 2007;140(1-2):7-44. doi:10.1016/j.jhazmat.2006.11.007.
2. Amyotte P, Chippett S, Pegg MJ. Effects of turbulence on dust explosions. Prog
Energy Combust Sci. 1989;14(5-6):293-310.
3. U.S. Chemical Safety and Hazard Investigation Board. Combustible dust hazard
study. 2006. https://www.csb.gov/combustible-dust-hazard-investigation/.
4. Abrahamsen AR. The U.K. Approach to Dust Explosibility Assessment and Its
Relevance to Explosion Prevention and Protection.; 1986:66-79.
https://www.astm.org/digitallibrary/stp/pages/stp28166s.htm
5. Dust Explosion Statistics - HSE (1979-1988).
http://www.dustexplosion.info/statistics.htm.
6. Gale J. Dust to Dust. Hazardex.
http://www.hazardexonthenet.net/article/40288/Dust-to-Dust.aspx. Published
2011.
7. Eckhoff RK. Dust Explosion in the Process Industries. 3rd ed. USA: Gulf
Professional Publishing; 2003.
8. Qapco. http://www.qapco.com.qa/content/ldpe3.
9. Qatofin. http://www.qapco.com.qa/content/qatofin.
10. Q-Chem. http://www.qchem.com.qa/internet/Pages/overview.aspx.
11. U.S. Geological Survey. Mineral Commodity Summaries 2015.; 2015.
doi:10.3133/70140094.
12. Messick DL. World Sulphur Outlook.; 2014.
http://www.firt.org/sites/default/files/DonMessick_Sulphur_Outlook.pdf.
13. ICIS. Qatar sulphur output to hit 3.5m tonnes by 2015.
http://www.icis.com/resources/news/2007/10/29/9073895/qatar-sulphur-output-
to-hit-3-5m-tonnes-by-2015/. Published 2007.
14. Amyotte PR, Pegg MJ, Khan FI, Nifuku M, Yingxin T. Moderation of dust

131
explosions. J Loss Prev Process Ind. 2007;20(4-6):675-687.
doi:10.1016/j.jlp.2007.05.011.
15. Kaelin Sr. DE, Purgh RH. Explosile dusts, US codes and standard of safe
management practices. Process Saf Prog. 2012;31(2):139-145. doi:10.1002/prs.
16. Amyotte PR, Eckhoff RK. Dust explosion causation, prevention and mitigation:
An overview. J Chem Heal Saf. 2010;17(1):15-28.
doi:10.1016/j.jchas.2009.05.002.
17. Kletz TA, Amyotte P. Process Plants: A Handbook for Inherently Safer Design.
2nd ed. Boca Raton: CRC Press; 2010.
18. Cloney CT, Amyotte PR, Khan FI, Ripley RC. Development of an organizational
framework for studying dust explosion phenomena. J Loss Prev Process Ind.
September 2013. doi:10.1016/j.jlp.2013.09.002.
19. Cashdollar KL. Overview of dust explosibility characteristics. J Loss Prev
Process Ind. 2000;13(3-5):183-199. doi:10.1016/S0950-4230(99)00039-X.
20. Yanqiu Y, Jianchun F. Research on explosion characteristics of sulfur dust and
risk control of the explosion. Procedia Eng. 2014;84:449-459.
doi:10.1016/j.proeng.2014.10.455.
21. Rzal-Rebière F, Veyssière B. Propagation mechanisms of starch particles-air
flames. In: Proceedings of the 6th International Colloquium on Dust Explosions.
Shenyang, China; 1994:186-200.
22. Barton J. Dust Explosion Prevention and Protection: A Practical Guide. 1st ed.
USA: Gulf Professional Publishing; 2002.
23. Mannan S. Lees’ Loss Prevention in the Process Industries: Hazard
Identification, Assessment and Control. 4th ed. USA: Butterworth-Heiemann;
2012.
24. American Society for Testing and Materials. ASTM E1515-14, Standard Test
Method for Minimum Explosible Concentration of Combustible Dusts.; 2014.
25. Zalosh R, Grossel S, Kahn R, Sliva D. Dust explosion scenarios and case histories
in the CCPS guidelines for safe handling of powders and bulk solids. In: AIChE
Loss Prevention Symposium Session on Dust Explosions. ; 2005:1-16.
http://www.firexplo.com/images/Dust_Explosion_Scenario_Paper.pdf.
26. Reyes OJ, Patel SJ, Mannan MS. Quantitative structure property relationship

132
studies for predicting dust explosibility characteristics (K-st, P-max) of organic
chemical dusts. Ind Eng Chem Res. 2011;50:2373-2379.
27. Crowl DA, Louvar JF. Chemical Process Safety: Fundamentals with
Applications. 3rd ed. Westford, Massachusetts: Prentice Hall; 2011.
28. American Society for Testing and Materials. ASTM E1226-12a, Standard Test
Method for Explosibility of Dust Clouds.; 2012.
29. American Society for Testing and Materials. ASTM E2931-13, Standard Test
Method for Limiting Oxygen (Oxidant) Concentration of Combustible Dust
Clouds.; 2013.
30. Janes A, Chaineaux J, Carson D, Le Lore PA. MIKE 3 versus HARTMANN
apparatus: Comparison of measured minimum ignition energy (MIE). J Hazard
Mater. 2008;152:32-39. doi:10.1016/j.jhazmat.2007.06.066.
31. TÜV SÜD. 20l Siwek sphere / Mike 3. https://www.tuev-sued.ch/ch-
en/activity/testing-equipment/20l-siwek-sphere-mike-3.
32. Beck H, Glienke N, Mohlmann C. Combustion and Explosion Characteristics of
Dusts.; 2001. http://staubex.ifa.dguv.de/explokomp.aspx?nr=188&lang=e.
33. Hertzberg M, Cashdollar KL, Ng DL, Conti RS. Domains of flammability and
thermal ignitability for pulverized coals and other dusts: Particle size dependences
and microscopic residue analyses. 19th Symp Combust. 1982;19(1):1169-1180.
doi:http://dx.doi.org/10.1016/S0082-0784(82)80293-2.
34. Cashdollar KL, Hertzberg M, Zlochower IA. Effect of volatility on dust
flammability limits for coal, gilsonite, and polyethylene. In: 22nd Symposium on
Combustion. The Combustion Institute; 1988:1757-1763.
35. Mittal M, Guha BK. Study of ignition temperature of a polyethylene dust cloud.
Fire Mater. 1996;20(December 1995):97-105. doi:10.1002/(SICI)1099-
1018(199707/08)21:4<169::AID-FAM604>3.0.CO;2-Y.
36. HSE. Safe Handling of Combustible Dusts: Precautions against Explosions.;
2003. http://www.hse.gov.uk/pUbns/priced/hsg103.pdf.
37. Traoré M, Dufaud O, Perrin L, Chazelet S, Thomas D. Dust explosions: How
should the influence of humidity be taken into account? Process Saf Environ Prot.
2009;87:14-20. doi:10.1016/j.psep.2008.08.001.
38. Amyotte PR, Cloney CT, Khan FI, Ripley RC. Dust explosion risk moderation for

133
flocculent dusts. J Loss Prev Process Ind. 2012;25(5):862-869.
doi:10.1016/j.jlp.2012.05.007.
39. Lunn GA, Cairns F. The venting of dust explosions in a dust collector. J Hazard
Mater. 1986;12:87-107.
40. Kauffman CW, Sichel M, Wolanski P. Research on dust explosions at the
University of Michigan. Powder Technol. 1992;71(2):119-134. doi:10.1016/0032-
5910(92)80002-E.
41. NFPA 68. NFPA 68 Standard on Explosion Protection by Deflagration Venting.
USA; 2007. http://www.nfpa.org/.
42. Lunn G, Crowhurst D, Hey M. The effect of vent ducts on the reduced explosion
pressures of vented dust explosions. J Loss Prev Process Ind. 1988;1(4):182-196.
doi:10.1016/0950-4230(88)85003-4.
43. Britton LG, Chippett S. Practical aspects of dust deflagration testing. J Loss Prev
Process Ind. 1989;2(3):161-170. doi:10.1016/0950-4230(89)80021-X.
44. Holbrow P, Hawksworth SJ, Tyldesley A. Thermal radiation from vented dust
explosions. J Loss Prev Process Ind. 2000;13(6):467-476. doi:10.1016/S0950-
4230(99)00079-0.
45. Di Benedetto a., Russo P, Amyotte P, Marchand N. Modelling the effect of
particle size on dust explosions. Chem Eng Sci. 2010;65(2):772-779.
doi:10.1016/j.ces.2009.09.029.
46. Hertzberg M. Autoignition temperatures for coal particles dispersed in air. Fuel.
1991;70(10):1115-1123. doi:10.1016/0016-2361(91)90231-X.
47. Mittal M, Guha BK. Models for minimum ignition temperature of organic dust
clouds. Chem Eng Technol. 1997;20(1):53-62. doi:10.1002/ceat.270200111.
48. American Society for Testing and Materials. ASTM E1491-06(2012), Standard
Test Method for Minimum Autoignition Temperature of Dust Clouds. Vol 14.;
2012:1-10. doi:10.1520/E1491-06.Copyright.
49. Cashdollar KL. Flammability of metals and other elemental dust clouds. Process
Saf Prog. 1994;13(3):139-145. doi:10.1002/prs.680130306.
50. Randeberg E, Eckhoff RK. Initiation of dust explosions by electric spark
discharges triggered by the explosive dust cloud itself. J Loss Prev Process Ind.
2006;19:154-160. doi:10.1016/j.jlp.2005.05.003.

134
51. Silvestrini M, Genova B, Leon Trujillo FJ. Correlations for flame speed and
explosion overpressure of dust clouds inside industrial enclosures. J Loss Prev
Process Ind. 2008;21(4):374-392. doi:10.1016/j.jlp.2008.01.004.
52. Fernández Áñez N, Álvarez Pérez A, García Torrent J, Medic Pejic L, Cámara
Rascón Á. Explosion risk in coke, coal and sulphur storage. In: XIII Congreso
Internacional En Energía Y Recursos Minerales, 3-5 de Octubre 2013, Santander,
Spain. Santander, Spain; 2013.
http://oa.upm.es/26536/1/INVE_MEM_2013_147506.pdf.
53. Dufaud O, Perrin L, Bideau D, Laurent A. When solids meet solids: A glimpse
into dust mixture explosions. J Loss Prev Process Ind. 2012;25(5):853-861.
doi:10.1016/j.jlp.2012.04.011.
54. Simon LH, Wilkens V, Fedtke T, Beyer M. Ignition of dust-air atmospheres by
ultrasonic waves. J Loss Prev Process Ind. 2013;26(6):1583-1589.
doi:10.1016/j.jlp.2013.08.009.
55. TUV SUD. Certified Safety Testing Equipment. https://www.tuev-
sued.ch/uploads/images/1501068033706222181137/certified-safety-testing-
equipment.pdf. Published 2017.
56. Cashdollar KL, Zlochower I a. Explosion temperatures and pressures of metals
and other elemental dust clouds. J Loss Prev Process Ind. 2007;20:337-348.
doi:10.1016/j.jlp.2007.04.018.
57. Frank WL. Dust explosion prevention and the critical importance of
housekeeping. Process Saf Prog. 2004;23(3):175-184. doi:10.1002/prs.10033.
58. West Pharmaceuticals. http://www.csmonitor.com/2003/0203/p02s01-usgn.html.
59. Tan F, Song W, Gong H, Xu N. Research on the static electricity of petrochemical
powder pneumatic conveying and prevention of dust electrostatic explosion. J
Phys Conf Ser. 2013;418:12026. doi:10.1088/1742-6596/418/1/012026.
60. Yan X, Yu J. Dust explosion incidents in China. Process Saf Prog. 2012;31(2):1-
3. doi:10.1002/prs.
61. Keping S, Hangyu Z, Yong L. Investigation of electrostatics during sulphur
crushing operations. J Electrostat. 2001;51-52:435-439. doi:10.1016/S0304-
3886(01)00037-7.

135
APPENDIX
Incidents involving polyethylene dusts
West Pharmaceuticals - January 29, 2003
One of the most well-known incidents involving polyethylene dust explosion is
that which occurred at the West Pharmaceuticals in Kinston, North Carolina. It occurred
on January 29, 2003, killing 6 workers and injuring 36 people. According to the final
CSB report, the explosion was caused by the deflagration of fine polyethylene powder,
with less than 63 microns in diameter3. The explosion which ended up destroying the
whole facility, involved a part of the building which was used to compound rubber.
Some of the main products of the facility were rubber syringe plungers and various
pharmaceutical devices. One of the processes involved coating of the products and this
was done by running rubber strips through a tank. This tank contained a slurry of
polyethylene powder in water and this was used to cool the rubber and also act as an
anti-tack coating57. The next stage required that the fans evaporated the water from the
slurry which would only leave the powder coating on the rubber strips. As such, when
the slurry was dyed, the airborne polyethylene dust was generated14. Over time, while
the rubber dried, fine polyethylene powder started to accumulate on the suspended
ceilings above, reaching up to a thickness of 1 cm. This accumulated dust was the
primary source of fuel for the multiple secondary explosions which caused the main
damage to the facility. One of the root causes of this incident was also related to poor

136
housekeeping. While the facility had a very good housekeeping program for the visible
production areas which kept these areas extremely clean, the dust accumulated above the
suspended ceiling was kept hidden, and most employees were not even aware that dust
was accumulating in such a remote part of the plant. Furthermore, the Material Safety
Data Sheet (MSDS) for the polyethylene slurry included no dust explosion warning, as it
never occurred to the employees that the slurry after drying would give rise to fine
airborne combustible dust. Lastly, even for the select employees, who did notice the dust
accumulation above ceiling, were neither aware nor trained regarding the hazards of
combustible dust3.
The key lesson learned from this incident is that aqueous solution of a
combustible dust can dry, and thus present a combustible dust hazard. As mentioned
above, the polyethylene slurry was not considered hazardous as it was a liquid/paste.
Thus, the manufacturer had not included any dust explosion hazard warning on the
MSDS, even though the manufacturer was aware that the slurry would dry to form a
powder during normal operations3. In monetary fines, West Pharmaceutical Services was
fined $10,000 for its safety violations58.
Incidents that Occurred in China
In their paper, Tan et al. report about the different incidents which have occurred
in China involving polyethylene. In different petrochemical industries in China, 13
explosions in a powder silo of Low Density Polyethylene (LDPE) have occurred over an
11-year period. Furthermore, 14 explosions of a powder silo of polypropylene (PP) have

137
occurred over a 5-year period and 12 explosions of a powder silo of High Density
Polyethylene (HDPE) have occurred over a 3-year period59. Yan et al. collected the
instances of the number of dust explosions in China during the period of 1981 - 2011. In
this 15-year period, 9 accidents occurred involving polyethylene dust. The incidents
were collected from literature, books, reports, and the internet60.
Incidents involving sulfur dusts
While sulfur is a combustible dust, there is not much data that exists on sulfur
dust explosion incidents. Some examples have been discussed by Eckhoff in his book,
‘Dust explosion in the Process Industries’. An example of a sulfur dust incident is the
one that occurred in Germany in the year 2000 during the loading of bulk sulfur. The
ignition was probably caused by an electrostatic discharge and this explosion gave rise to
a fire which caused significant damage to the plant. Fortunately, no one was injured7.
Another incident occurred in 1973 at Dyno Industries in Norway. The incident occurred
in a batch mixer which contained sulfur and aluminum flakes being mixed. This initial
explosion in the mixer ignited a larger dust cloud which gave rise to a secondary
explosion. This secondary explosion ended up killing 5 workers and seriously injuring 2
more. Moreover, a significant part of the plant was destroyed. The cause was determined
to be an electrostatic discharge, and the preventive measure of nitrogen purging was
found to be inadequate to maintain the lower levels of oxygen for an explosion not to
occur1. In recent times, an incident discussed was the series of the sulfur dust explosions
and fires which took place over a period of years in the Shanghai Sulfur Factory in

138
China. Similar to the instance above, electrostatic discharge was found to be the most
probable ignition source. It was found that the potential voltage inside the sulfur silo was
from between 25 - 60 kV, and as such, during the transportation of sulfur in the plant,
this would act as an ignition source61.